City of Kettering – LGIF Application – Page 1 LGIF Grant Application Tab 1 - Contact Information City of Kettering 3600 Shroyer Road, Kettering Ohio 45429 (937) 296-2456 F: (937) 296 - 3242 Mary Beth Thaman Director Parks Recreation and Cultural Arts Email: [email protected]City of Kettering Population 56,163 Montgomery County Tab 2 - Collaborative Partner Dayton Metro Library 215 East Third Street, Dayton, Ohio 45402 937-496-8501 Tim Kambitsch Executive Director Email: [email protected]Dayton Metro Library Legal Service Area Population: 458,718 Montgomery County, exclusive of Oakwood, Centerville and Valley View Schools The Dayton Metro Library (DML) and the City of Kettering are planning a cooperative agreement to build, share and manage the new Library / Cultural Arts Centre, located at the corner of Wilmington Pike and Stroop Road in Kettering, Ohio. Currently, both organizations maintain facilities in the City of Kettering and recent GIS maps show that both organizations serve similar user groups. By developing a shared facility for the Wilmington-Stroop branch location and the Rosewood Arts Centre both organizations anticipate a significant potential savings to taxpayers. Both organizations have similar missions, customer bases as well as programs allowing for the opportunity to share services as well as creating a regional destination. The facility will be purpose built to house both organizations while maximizing shared services opportunities. The building will serve the entire Kettering Community and provide Library services and well as cultural arts programming through the Rosewood Arts Centre. Both organizations will share the management responsibilities with all direct costs evenly divided between both organizations.
Transcript
City of Kettering – LGIF Application – Page 1
LGIF Grant Application
Tab 1 - Contact Information City of Kettering 3600 Shroyer Road, Kettering Ohio 45429 (937) 296-2456 F: (937) 296 - 3242 Mary Beth Thaman Director Parks Recreation and Cultural Arts Email: [email protected] City of Kettering Population 56,163 Montgomery County
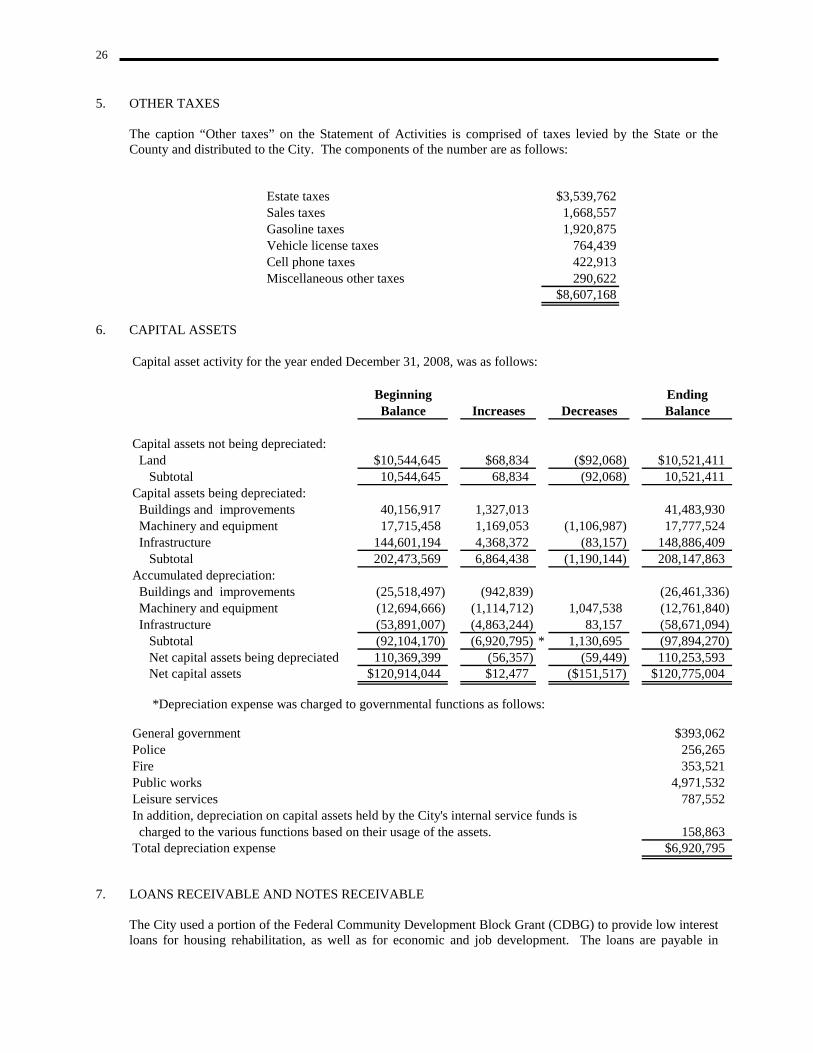
Tab 2 - Collaborative Partner
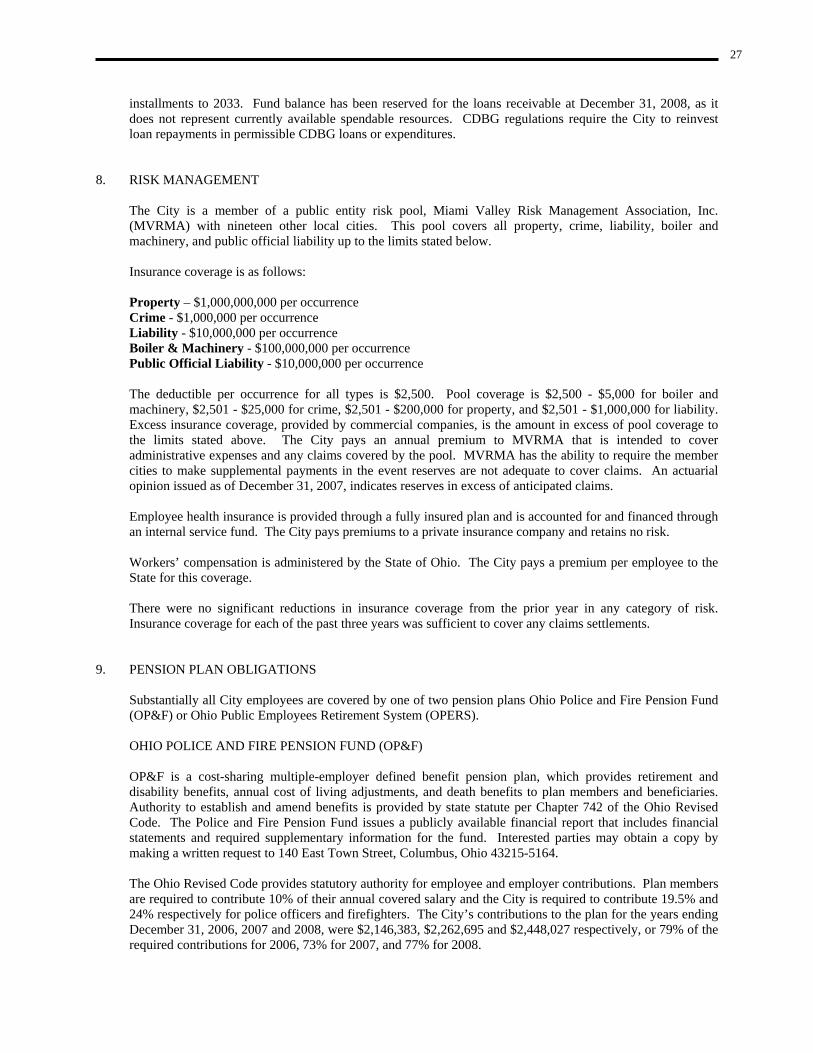
Dayton Metro Library 215 East Third Street, Dayton, Ohio 45402 937-496-8501 Tim Kambitsch Executive Director Email: [email protected] Dayton Metro Library Legal Service Area Population: 458,718 Montgomery County, exclusive of Oakwood, Centerville and Valley View Schools
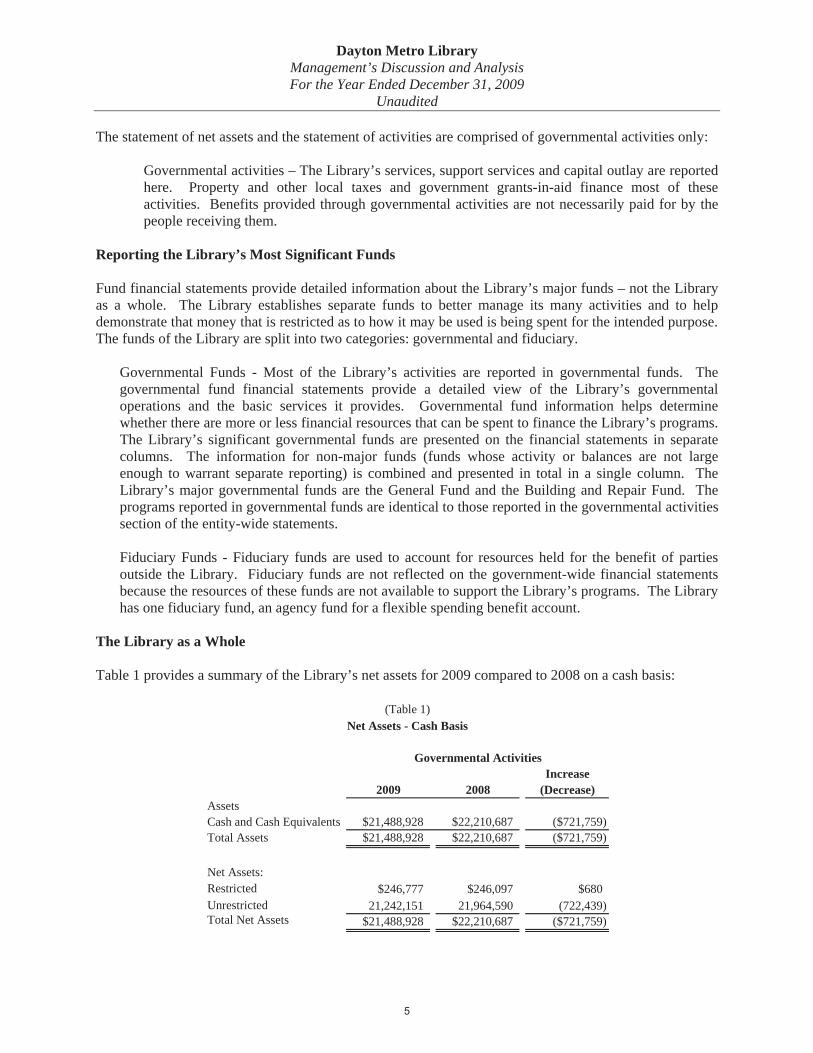
The Dayton Metro Library (DML) and the City of Kettering are planning a cooperative agreement to build, share and manage the new Library / Cultural Arts Centre, located at the corner of Wilmington Pike and Stroop Road in Kettering, Ohio. Currently, both organizations maintain facilities in the City of Kettering and recent GIS maps show that both organizations serve similar user groups. By developing a shared facility for the Wilmington-Stroop branch location and the Rosewood Arts Centre both organizations anticipate a significant potential savings to taxpayers. Both organizations have similar missions, customer bases as well as programs allowing for the opportunity to share services as well as creating a regional destination. The facility will be purpose built to house both organizations while maximizing shared services opportunities. The building will serve the entire Kettering Community and provide Library services and well as cultural arts programming through the Rosewood Arts Centre. Both organizations will share the management responsibilities with all direct costs evenly divided between both organizations.
Tab 3 - Project Information Project Description Name of Project: Books to Brushes, a Kettering Collaborative for a New Library/Cultural Arts Centre This project proposal is for a shared services feasibility study. The feasibility study will include:
● Consultant to analyze all city and library land and facilities through a fair market value analysis. This will include evaluation of library land and existing facility, as well as the Rosewood facility and land (owned by the Kettering City Schools). Determine demolition cost for both existing facilities. Land use recommendation will include one of the following: 1) Renovate and expand existing library building to accommodate library and art centre on existing library site; 2) Demolish existing library building and build new library and art center on existing library site; 3) Rebuild library and art center on another property in Kettering.
● Consultant to design and conduct a phone and/or mailed statistically valid community survey to assess and
verify consumer demand/priorities for a joint library/art center. Conduct various focus groups with special interest groups and other community organizations potentially utilizing and/or leasing program space. The survey will also account for future trends and best practices in programming for both art and library audiences. Utilize existing historical data from library and art center past survey information.
● Consultant to design and develop a library/art center facility master plan, to include all grounds landscaping
and parking needs. Master plan would include estimated cost associated with construction of this joint facility. Integration of LEED and universal design principles should be used in master plan process. Major focus will be on accommodating library/art center program needs through any and all shared space and services without impacting the integrity of both program areas. Consultant will provide various design options for performance theater size with cost associated with each option.
● Consultant to assist with developing a joint management operation plan for most effective staffing model
and operation policies/protocol. This one building will meet the needs of both entities and save tax payers money versus building two separate facilities. Through research and GIS analysis, we have identified that we are reaching similar audiences. Statistics prove that the DML is one of the busiest library systems for its size in the nation, with patrons borrowing more than twice the national average of library materials. Although the current branch facility, constructed in 1976, is essentially structurally sound, the infrastructure is insufficient to meet the changing demands and expectations of today’s library patrons. The demands for technological services are at unprecedented levels, and the building simply cannot accommodate the current needs much less the expansion needed, or the increased load on the electrical services. The current building does not have adequate computer space, meeting areas and dedicated teen spaces. These issues combined with an aging structure in need of significant upgrade due to inefficient windows doors and HVAC Systems has forced the DML to prepare for a major renovation of the Wilmington-Stroop location. Rosewood Arts Centre is located in a residential neighborhood in Kettering. In 1963, the building was constructed as an elementary school and in the early 80’s the Kettering City School District leased the property to the City of Kettering for the creation of the Rosewood Arts Centre. Since that time Rosewood has been providing exceptional arts programming and services to Kettering residents and the greater Dayton area. Rosewood provides a unique opportunity for the community to experience hands-on activities in visual and performing arts programs. It is recognized throughout Ohio as an outstanding center through excellence of management and programming and draws 13,000 patrons through its doors annually for classes, gallery exhibitions, theater performances, studio use, special events and rentals. While the Rosewood Arts Centre has provided exceptional service to the community it has done so in an antiquated building that does not meet the needs of the programs and artists that utilize the facility. The school, not designed to house an arts center, is inadequate and non-complaint with current ADA guidelines. The age of the building
City of Kettering – LGIF Application – Page 3
continues to impact utility expenses and daily maintenance. The facility is in need of significant upgrades including a new roof, new energy efficient windows, added air conditioning (building is not currently air conditioned), life safety systems including fire annunciation, fire suppression and security. It simply has become cost prohibitive to operate and maintain this facility. The Books to Brushes project calls for the creation of a joint library / cultural arts centre located on the land currently owned by the Dayton Metro Library. The new building will be purpose built and will become a safe and welcoming destination for the community. Both organizations would be able to jointly promote programming and services to complementary audiences emphasizing the library’s collection. Furthermore the facility will serve as the anchor for a multi-year corridor improvement program for the main commercial strip Wilmington Pike. The development of a library/arts center at the corner of Wilmington Pike and Stroop Road will be the kick-off of this redevelopment plan. The site is ideally located to spur this redevelopment, enhance the surrounding residential neighborhood and offer a valuable, popular and accessible community asset. The feasibility study will evaluate community need, size and scope of a dual purpose building. The potential for the building and the amount of joint use space will be determined through a community survey and focus group process: Proposed Shared Space
● Atrium - Featuring an arts gallery to showcase local artists work, school art shows, and traveling artist exhibitions. Along with the gallery would be a book display area where the library can display materials that correspond with art exhibits and programs. Also included in the atrium are a coffee shop and reception desk.
● Theater – A theater is in the plans which would be used as a destination point for library programs and presentations from throughout the Montgomery County. Civic bands, children’s theater, choirs and even local business could utilize the theater, thus providing a community service and potential alternative revenue source. The feasibility study will determine size and scope of need for the library, arts centre and community.
● Rest Rooms – For use by both organizations and visitors. ● Conference Room / Meeting Space – Conference rooms will serve both organizations. The space could
also be rented out for small meetings. ● Technology Room – The building will feature a shared digital space which will serve as an educational
lab, open use space, or structured classroom teaching subjects like technology in art, cyber science and more. This area is critical to the longevity of the facility as technology is in high demand for libraries.
● Parking Areas – By sharing a parking area between the two organizations it reduces the overall size significantly. By sharing the parking areas, it also represents a large initial development and maintenance saving opportunities.
● Mechanical / Electrical Rooms and Systems – Energy utilization will be more efficient by reducing overall footprint of infrastructure space due to economies of systems.
● Grounds and Building Services – Grounds, landscaping and custodial services will be shared and therefore eliminating overlap of services and creating savings.
● Storage Areas – Storage will be shared by not duplicating supplies, janitorial and equipment (tables, chairs, etc.) storage between the two entities.
The new building will allow each organization to expand and will significantly enhance their already exceptional programming. Rosewood would get purpose built gallery space, classrooms designed for appropriate use with regard to chemicals, lighting and program participation. Other benefits include increased computer controlled electrical systems to handle their large kilns. The Wilmington-Stroop Branch will get much needed expansion space to meet the technology demands and informal gathering spaces. Both organizations will benefit from a universally designed building with workstations and signage that welcomes people of all abilities in a warm friendly and safe environment. Ultimately the project will create a new destination location for the City of Kettering. All residents can enjoy the benefits that can be derived from exposure to arts and literature, making Kettering a great place to Live, Work and Play. This will be accomplished by providing a new facility with annual cost savings to both Kettering and local taxpayers.
City of Kettering – LGIF Application – Page 4
Type of Award The City of Kettering and the Dayton Metro Library are applying for a feasibility study grant for the Wilmington-Stroop Branch Library/Rosewood Arts Centre. Problem Statement Libraries are essential to a regions economic competitiveness and the vitality of our neighborhoods and schools. They directly impact many local community issues ranging from literacy to basic job skills. The Dayton Metro Library is one of the busiest in the nation for its size, delivering a wide range of materials and services in response to the needs of its residents. The Wilmington-Stroop branch is the second busiest branch in the Dayton Metro Library system. It recorded over 243,000 visitors in 2011 and those visitors borrowed 577,000 books, magazines, recordings and other materials. Visitors logged over 41,000 hours of sessions online from the library’s publicly accessible computer systems. If the branch were a separate library system in Ohio, it would be larger than 175 of Ohio’s 251 public library systems.
The Wilmington-Stroop Branch was built in 1976 and over the past 35 years it has served its community well. Millions of patrons have benefited from the services it provides and thousands of businesses and non-profits have turned to this branch for support and education. The branch has provided exceptional service, despite the fact that it outgrew the facility years ago. The needs of library patrons have changed and libraries have to change as well to meet these needs. Technological changes in our world are driving libraries across the nation to create more space for technology labs as well as creating more programming utilizing technology. The current infrastructure of the Wilmington-Stroop branch is not sufficient to address these needs. The facility has a critical lack of dedicated electrical and data cabling, as well as the space needed to upgrade its current inadequate technology centers. These factors combined with an aging facility and high maintenance and utility costs are putting a significant strain on the resources of the Dayton Metro Library. A facilities needs assessment completed in 2008 and revised in 2010 determined that a 50% increase in library space was needed along with more seating and additional computers.
Problem Cost Renovate existing Library space (13,623 sq ft)
● Renovate the existing facility ● Replace and update HVAC ● Replace existing windows with energy efficient windows
$1,702,000
Addition to existing Library (6,377 sq ft) ● Add quiet reading rooms ● Add small group meeting rooms ● Add larger meeting and children’s activities rooms ● Expand the number of parking spaces needed to accommodate higher use
$1,594,000
Furnishings, Fixtures and Equipment for Renovated & Expanded Building ● New book stacks and seating at tables and chairs ● New carpeting and energy efficient lighting ● Replace and expand public access computers from 15 to 40 ● Replace and expand formal and casual seating from 80 to 112 seats
$500,000
Total Renovation and addition Costs (exclusive of architectural and other fees, escalation costs and site development expenditures)
$3,796,000
Just as libraries play a critical role in maintaining a healthy community so do the cultural arts. It has been proven that a strong community arts program provides jobs, attract investments, and stimulate local economies through tourism, consumer purchases and tax revenue. Communities that offer robust arts and cultural sectors are viewed as more desirable places to live, work and visit. Additionally, Ohioans place a high priority on access to arts and cultural events in their communities, as well as access to arts education. These are viewed as essential to developing creativity and problem-solving skills that students need to join the workforce.
City of Kettering – LGIF Application – Page 5
Rosewood Arts Centre fills a niche in the Miami Valley arts community by being one of the only affordable, multi-faceted arts education and community resources available to everyone at all artistic skill levels. We do not require memberships and everyone is welcome to participate in our classes; in addition, we offer a variety of free activities and experiences. Annually, we have over 13,000 visitors and students at Rosewood Arts Centre, participating in a range of activities, including classes, theater productions, gallery events, rehearsals, and more Rosewood Arts Centre began as an elementary school in 1964. In 1985 the Kettering City School District closed the school and loaned the building to the City of Kettering to open the Rosewood Arts Centre. While the building has provided a home for the arts in Kettering for the past 27 years, it has been far from ideal. There are many issues with the current facility ranging from a poor building design to aging infrastructure to significant safety and ADA problems. The City of Kettering has known for several years that the facility must be renovated, but studies have shown that this process would be extremely costly. The fact that the City does not own the building or the land is a substantial road block. The current issues are:
Problem Cost Non-ADA Compliant
● Building is not in compliance with American with Disabilities Administration standards. To become compliant the facility would need to create better access through modifying doors and hand rails as well as remodeling all restroom facilities
$60,000
Renovation Needs ● Replace Current Roof ● Replace original single pane glass windows ● Replace all plumbing ● Replace original fixtures.
$550,000
Air-conditioning ● The facility is not currently air-conditioned
$400,000
Electrical / Mechanical / Data ● The current electrical systems are insufficient to accommodate today’s increased load. There is
not enough infrastructures to support modern day data needs.
$200,000
Boiler ● Replace existing original boiler (from 1964).
$30,000
Fire Suppression ● Install fire suppression/alarm system, building currently does not have a system.
$100,000
Total Renovation Costs $1,340,000 In conjunction with the high renovation costs the City currently spends in excess of $100,000 a year in maintenance and custodial services, as well as $52,000 in energy bills. Both of these areas are significantly impacted by the age and disrepair of the facility. The facts that the facility was not designed to be an arts centre and is not located on a main thoroughfare have driven the City’s decision to start the planning process for an entirely new building. Discussion with both organizations has led to this collaborative approach to building construction. The current cost estimates show that for each organization to construct their own facility would cost around $9 million, the majority of which would have to be funded with tax revenues. The long term impact on maintaining two separate and unique facilities would also create an unnecessary tax burden. The proposed library/cultural arts building, incorporating LEED design concepts, would save the local tax payers $2 million in initial construction costs and potentially $96,000 annually. During the first three years of operation, these renovations would save $288,000 in utility and maintenance costs and offer a valuable, popular and accessible community asset. This new facility would initiate the revitalization of the Wilmington Pike corridor.
City of Kettering – LGIF Application – Page 6
Anticipated Return on Investment Preliminary estimates show that there is a strong return on investment for Kettering. There are significant short and long term financial benefits for the construction of a combined facility. Attachment COK-A-3-Project Analysis-ROI
clearly demonstrates the anticipated savings of $96,000 a year for three-years. Probability of Project Success The Kettering Parks, Recreation and Cultural Arts Department surveys Kettering residents on a biennial basis, resulting in an in-depth understanding of their needs and expectations in the cultural arts. We surveyed 400 households in 2006, 2008 and 2010 resulting in statistically valid survey results based on the total number of households in Kettering. Kettering residents value in arts education in their community. In the 2008 survey, 89% of residents agreed or strongly agreed that the cultural arts have potential benefits. In 2006, over 47% of households were interested in visual arts courses and over 46% were interested in performing arts courses. In the 2010 survey, 8,649 households were interested in youth art, music, dance and theater programs. Kettering’s survey data revealed a much higher percentage of interest in cultural arts than national averages. For example, in 2010, 6,518 households (or 26% of Kettering households) responded with a need for adult music, art, theater, and dance programs. The need for youth and adult art programs was in the top third of program demands for cultural and recreational programs. Approximately, 47% of households were interested in adult photography, drawing, theater or dance classes. In 2010, the level of support for developing new programming or increasing current levels of programming for music and performance was 71% very or somewhat supportive. In 2008 the survey focused on facility questions in tandem with the Kettering Parks, Recreation and Cultural Arts Master Plan. When asked, “What should we do about Rosewood?”, 59% of households responded with renovating the facility or building a new one. Approximately 11,000 households responded with having a need for Rosewood Arts Centre. Only 50% had needs that were completely met by the current facility and 47% responded that their needs were not being met by the facility. The survey also demonstrated that 8,673 households have a need for a theater that is not being met by the current facility. By conducting a feasibility study we will determine what facilities are needed to better serve the creative needs of the community. In July 2011 the Dayton Metro Library conducted a survey of residents. The survey asked key questions that helped determine the effectiveness of the Kettering libraries in meeting the local community’s library needs, as well as the local climate for their services. The finding showed:
● 83% of current patrons are satisfied with the current library. ● 85% feel that quiet reading areas are important. ● 90% feel that it is important to have designated areas for children and youth. ● 84% said that an up to date branch library is critical to their child’s education. ● 73% of the general public have personally been to the library in the past year and 52% utilize its services
on a monthly basis. ● 65% of respondents felt that meeting space is important in the services offered by a library. ● 94% of focus group members responded that a good public library is important to their quality of life ● 81% felt that a library is critical to keeping pace with today's changing world.
Furthermore, a 2007 community meeting identified the following ideas and goals for the Kettering libraries:
● Make the library more inviting-pull you in to the building. ● Have a welcome to the library or welcome kiosk as you enter the building. ● Tie together music connections in events. Jazz night, country, for all ages. ● Provide more computers and catalogs to public. ● Upgrade buildings to meet technology and aesthetics demands. ● Tie drama and literature together. ● Connect characters and books. ● Work with drama classes at the high school to connect with elementary students. ● City and library could make better use of shared advertising.
City of Kettering – LGIF Application – Page 7
Plans and ability to replicate and allow inclusion of other political subdivisions The new library/cultural arts centre can be used as a model for other municipal collaboration projects. The concept of combining a library and cultural arts centre in the same building has many advantages from a financial and community perspective. The two organizations operating in close proximity creates natural synergy. Many opportunities exist for libraries and municipalities to share and construct facilities. With 251 library systems operating more than 700 branches across Ohio’s nearly 1,000 communities, many other municipal-library collaborations are possible. Part of larger consolidated effort The library/cultural arts centre project is not a part of a larger consolidated effort; however, both organizations have a long history of successful collaborative partnerships. Below is a listing of the organizations that they have partnered with:
City of Kettering The City of Kettering has partnered with a variety of local, regional and national organizations including the Kettering City School District, DC Shoes Foundation, The Dayton Foundation, the Kellogg Foundation, local Optimists clubs, youth sports organizations, various non-profit foundations and community groups.
Dayton Metro Library The Dayton Metro Library partners with hundreds of local organizations on a wide variety of programs. Major partnerships include long-term relationships spanning decades. The Library works closely with multiple organizations to draw down private, state and federal grant funding included grants from the State Library of Ohio and the federally funded Library Services and Technology Act.
Past Successes In 2005, the City of Kettering and the Kettering City School District entered into a partnership to enabling Kettering Parks, Recreation and Cultural Arts Department to build and establish the Kettering Fitness & Wellness Center and indoor track. During the construction of the James S. Trent Arena, which is owned by the Kettering City School District, an agreement was reached where the City would pay for and build its own facility connected to the Trent Arena. The Trent Arena features a quarter mile walking track that the City schedules and maintains and offers free to all Kettering residents. This partnership has been an enormous success enabling 100,000 patrons to use the fitness facility track annually. The Dayton Metro Library has successfully collaborated with other municipalities in Montgomery County to build facilities that saved taxpayers and resulted in greater service. The Library and the City of West Carrollton operate a shared facility owned by the city. In the late 1970’s an overcrowded branch library was replaced with a larger branch as a part of a new civic center. The Library and City save money through shared restrooms, parking, and a meeting room. In 2000, the two partners agreed to build upon their prior success by expanding the branch to its current 10,265 square foot facility. The City managed the construction and the Library leases the expanded library space. The success of this project led to the City of Englewood and the Library developing a similar project with the construction of the Northmont Branch in 1975. The Library has also had success in sharing its automation and technology expertise with other library jurisdictions. It has had long standing contracts for hosting the online catalog and materials management information systems for public libraries in Germantown, Bradford, Troy and Miami County. Not only are the four libraries sharing servers, software, support services costs, the Library provides professional services for the cataloging of new materials. Most importantly each of the libraries has agreed to share their collections. Patrons of any of the four libraries can reserve and borrow materials from the shared catalogs. Responding to current substantial changes in economic demand for local or regional government services. The previous paragraphs have clearly demonstrated the changing needs of library patrons and the local need for a strong community based arts center. However, there have also been well documented changes on the economic demands placed on local governments. One of the most prevalent is the reduction in local income tax and property tax. The Dayton Metro Library has seen a property tax reduction of 8.8% equal to more than $1.05 million annually.
City of Kettering – LGIF Application – Page 8
The City of Kettering has seen a reduction in revenue due to the elimination of the Estate Tax which has resulted in a loss of $3 million annually. Historically, the City of Kettering has exclusively utilized this revenue for Capital Improvement Projects. Finally, current income tax estimates show little to no growth for the next three years. These economic changes have led to these two organizations partnering on this project. Intent for performance audit Currently neither applicant has participated in a performance audit. How the project facilitates an improved business environment or promotes community attraction The new facility will create a one-stop destination for Kettering residents and the Miami Valley. The building will become the focal point and anchor of the current Wilmington Pike corridor redevelopment plan. The plan calls for the redevelopment of businesses and sidewalks along a 2-mile stretch of Wilmington Pike. The plan will widen sidewalks, upgrade lighting, increase parking, encourage pedestrian traffic and create a welcoming and open atmosphere. The new facility will quickly become a destination point for thousands of individuals throughout Montgomery County. The building will feature an attractive outdoor space that may include a sculpture garden, encouraging individuals to take a quiet respite from a hectic day. Furthermore, the new theater would increase late afternoon visitors and evening traffic as patrons attend performances and events. Finally, the facility will be an enriching environment for anyone researching projects, accessing critical job information, taking an art class or completing a school project. The increased traffic will benefit surrounding restaurants and businesses spurring the local economy. All of this will be built and maintained at a significant cost savings to the community.
Tab 4 - Financial Documentation We are applying for a $100,000 grant to conduct a shared service feasibility study along with a management plan. The City of Kettering as the primary applicant is designating $5,000 from its Capital Improvement Fund and the Dayton Metro Library is designating $5,000 from its general fund to provide matching funds for the project.
Budgeted Expenditures City of Kettering
Dayton Metro Library
Grant
Survey $20,000
Architectural Designs $50,000
Management Plan Development $10,000
Community Meetings (paid for through 10% matching funds) $5,000 $5,000
Real Estate Evaluations $10,000
Total Budget Costs $5,000 $5,000 $90,000
City of Kettering – LGIF Application – Page 9
Attachment: COK-A-4-DML-Expenses includes 2009, 2010 and 2011 general fund revenues and expenditures for the Dayton Metro Library. COK-A-4-DML-Wil-StroopExpenses includes 2009, 2010 and 2011 detailed expenditures for the Wilmington-Stroop Branch. Attachment: COK-A-4-KETT-Expense-2009, COK-A-4-KETT-Expense-2010, COK-A-4-KETT-Expense-2011 includes 2009, 2010 and 2011 detailed financial information for Rosewood Arts Centre. Attachment: COK-A-4-DML-2008, COK-A-4-DML-2009, COK-A-4-DML-2010 includes 2008, 2009 and 2010 Audited Financial Statements for the Dayton Metro Library. Attachment: COK-A-4-KETT-2008, COK-A-4-KETT-2009, COK-A-4-KETT-2010 includes 2008, 2009 and 2010 Audited Financial Statements for the City of Kettering. Attachment: COK-A-3-Project Analysis-NewProject contains the project completion analysis and COK-A-3-
Project-Analysis-ROI contains a yearly financial projected savings for the project. This projection can be extrapolated to include a three year financial projection for operational savings; however the shared staffing cost savings and estimates cannot be projected at this time as it will be decided as a part of the management plan.
DP-1 Profile of General Population and Housing Characteristics: 2010
2010 Demographic Profile Data
NOTE: For more information on confidentiality protection, nonsampling error, and definitions, see http://www.census.gov/prod/cen2010/profiletd.pdf.
GEO: Kettering city, Ohio
Subject Number PercentSEX AND AGE
Total population 56,163 100.0 Under 5 years 3,247 5.8 5 to 9 years 3,146 5.6 10 to 14 years 3,363 6.0 15 to 19 years 3,318 5.9 20 to 24 years 3,422 6.1 25 to 29 years 3,989 7.1 30 to 34 years 3,688 6.6 35 to 39 years 3,245 5.8 40 to 44 years 3,445 6.1 45 to 49 years 3,941 7.0 50 to 54 years 4,240 7.5 55 to 59 years 3,747 6.7 60 to 64 years 3,272 5.8 65 to 69 years 2,523 4.5 70 to 74 years 2,113 3.8 75 to 79 years 1,974 3.5 80 to 84 years 1,833 3.3 85 years and over 1,657 3.0 Median age (years) 40.9 ( X ) 16 years and over 45,731 81.4 18 years and over 44,393 79.0 21 years and over 42,475 75.6 62 years and over 11,967 21.3 65 years and over 10,100 18.0 Male population 26,787 47.7 Under 5 years 1,680 3.0 5 to 9 years 1,632 2.9 10 to 14 years 1,742 3.1 15 to 19 years 1,673 3.0 20 to 24 years 1,642 2.9 25 to 29 years 1,977 3.5 30 to 34 years 1,852 3.3 35 to 39 years 1,621 2.9 40 to 44 years 1,655 2.9 45 to 49 years 1,879 3.3 50 to 54 years 2,065 3.7 55 to 59 years 1,741 3.1 60 to 64 years 1,532 2.7 65 to 69 years 1,111 2.0 70 to 74 years 896 1.6 75 to 79 years 802 1.4 80 to 84 years 731 1.3 85 years and over 556 1.0
1 of 4 05/24/2011
Subject Number Percent Median age (years) 38.9 ( X ) 16 years and over 21,406 38.1 18 years and over 20,700 36.9 21 years and over 19,755 35.2 62 years and over 4,978 8.9 65 years and over 4,096 7.3 Female population 29,376 52.3 Under 5 years 1,567 2.8 5 to 9 years 1,514 2.7 10 to 14 years 1,621 2.9 15 to 19 years 1,645 2.9 20 to 24 years 1,780 3.2 25 to 29 years 2,012 3.6 30 to 34 years 1,836 3.3 35 to 39 years 1,624 2.9 40 to 44 years 1,790 3.2 45 to 49 years 2,062 3.7 50 to 54 years 2,175 3.9 55 to 59 years 2,006 3.6 60 to 64 years 1,740 3.1 65 to 69 years 1,412 2.5 70 to 74 years 1,217 2.2 75 to 79 years 1,172 2.1 80 to 84 years 1,102 2.0 85 years and over 1,101 2.0 Median age (years) 43.0 ( X ) 16 years and over 24,325 43.3 18 years and over 23,693 42.2 21 years and over 22,720 40.5 62 years and over 6,989 12.4 65 years and over 6,004 10.7RACE
Total population 56,163 100.0 One Race 54,990 97.9 White 51,982 92.6 Black or African American 1,840 3.3 American Indian and Alaska Native 106 0.2 Asian 752 1.3 Asian Indian 148 0.3 Chinese 174 0.3 Filipino 120 0.2 Japanese 55 0.1 Korean 58 0.1 Vietnamese 96 0.2 Other Asian [1] 101 0.2 Native Hawaiian and Other Pacific Islander 12 0.0 Native Hawaiian 5 0.0 Guamanian or Chamorro 2 0.0 Samoan 2 0.0 Other Pacific Islander [2] 3 0.0 Some Other Race 298 0.5 Two or More Races 1,173 2.1 White; American Indian and Alaska Native [3] 236 0.4 White; Asian [3] 269 0.5 White; Black or African American [3] 436 0.8 White; Some Other Race [3] 67 0.1 Race alone or in combination with one or more otherraces: [4] White 53,090 94.5 Black or African American 2,386 4.2 American Indian and Alaska Native 414 0.7
2 of 4 05/24/2011
Subject Number Percent Asian 1,101 2.0 Native Hawaiian and Other Pacific Islander 46 0.1 Some Other Race 394 0.7HISPANIC OR LATINO
Total population 56,163 100.0 Hispanic or Latino (of any race) 1,178 2.1 Mexican 542 1.0 Puerto Rican 151 0.3 Cuban 84 0.1 Other Hispanic or Latino [5] 401 0.7 Not Hispanic or Latino 54,985 97.9HISPANIC OR LATINO AND RACE
Total population 56,163 100.0 Hispanic or Latino 1,178 2.1 White alone 791 1.4 Black or African American alone 34 0.1 American Indian and Alaska Native alone 8 0.0 Asian alone 7 0.0 Native Hawaiian and Other Pacific Islander alone 0 0.0 Some Other Race alone 229 0.4 Two or More Races 109 0.2 Not Hispanic or Latino 54,985 97.9 White alone 51,191 91.1 Black or African American alone 1,806 3.2 American Indian and Alaska Native alone 98 0.2 Asian alone 745 1.3 Native Hawaiian and Other Pacific Islander alone 12 0.0 Some Other Race alone 69 0.1 Two or More Races 1,064 1.9RELATIONSHIP
Total population 56,163 100.0 In households 55,736 99.2 Householder 25,427 45.3 Spouse [6] 11,027 19.6 Child 14,433 25.7 Own child under 18 years 10,774 19.2 Other relatives 1,950 3.5 Under 18 years 790 1.4 65 years and over 307 0.5 Nonrelatives 2,899 5.2 Under 18 years 201 0.4 65 years and over 115 0.2 Unmarried partner 1,585 2.8 In group quarters 427 0.8 Institutionalized population 304 0.5 Male 82 0.1 Female 222 0.4 Noninstitutionalized population 123 0.2 Male 41 0.1 Female 82 0.1HOUSEHOLDS BY TYPE
Total households 25,427 100.0 Family households (families) [7] 14,979 58.9 With own children under 18 years 6,124 24.1 Husband-wife family 11,027 43.4 With own children under 18 years 3,917 15.4 Male householder, no wife present 1,081 4.3 With own children under 18 years 552 2.2 Female householder, no husband present 2,871 11.3 With own children under 18 years 1,655 6.5
3 of 4 05/24/2011
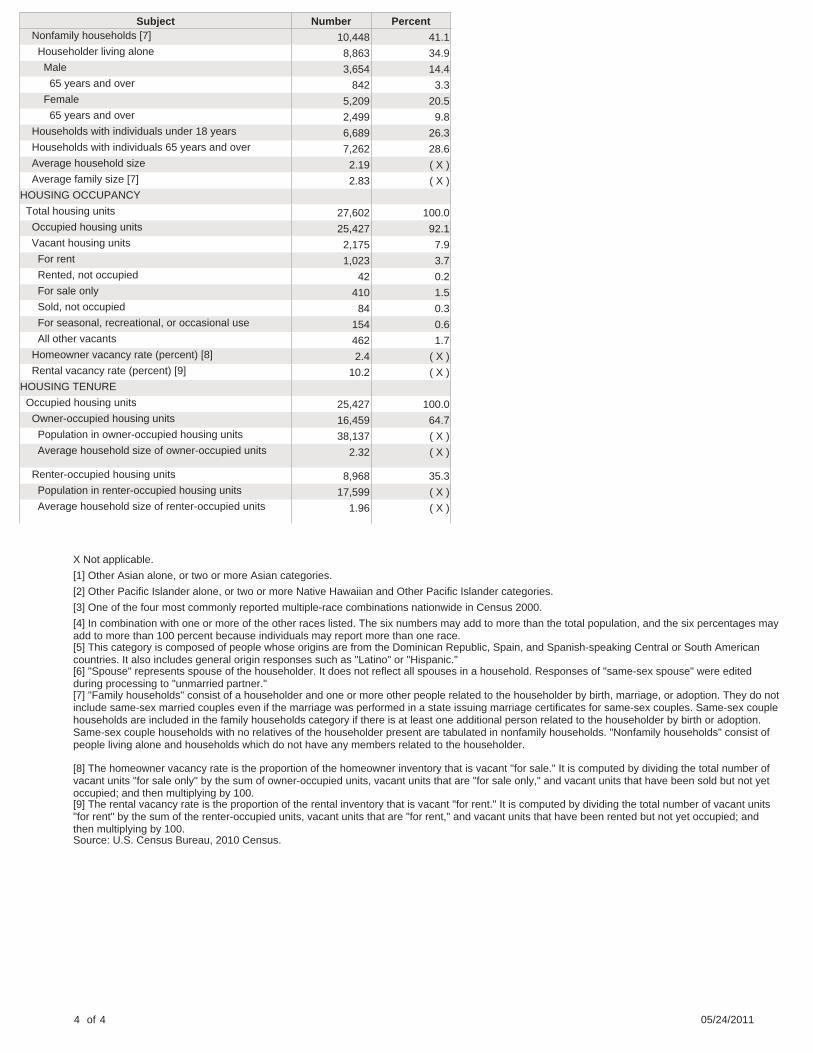
Subject Number Percent Nonfamily households [7] 10,448 41.1 Householder living alone 8,863 34.9 Male 3,654 14.4 65 years and over 842 3.3 Female 5,209 20.5 65 years and over 2,499 9.8 Households with individuals under 18 years 6,689 26.3 Households with individuals 65 years and over 7,262 28.6 Average household size 2.19 ( X ) Average family size [7] 2.83 ( X )HOUSING OCCUPANCY
Total housing units 27,602 100.0 Occupied housing units 25,427 92.1 Vacant housing units 2,175 7.9 For rent 1,023 3.7 Rented, not occupied 42 0.2 For sale only 410 1.5 Sold, not occupied 84 0.3 For seasonal, recreational, or occasional use 154 0.6 All other vacants 462 1.7 Homeowner vacancy rate (percent) [8] 2.4 ( X ) Rental vacancy rate (percent) [9] 10.2 ( X )HOUSING TENURE
Occupied housing units 25,427 100.0 Owner-occupied housing units 16,459 64.7 Population in owner-occupied housing units 38,137 ( X ) Average household size of owner-occupied units 2.32 ( X )
Renter-occupied housing units 8,968 35.3 Population in renter-occupied housing units 17,599 ( X ) Average household size of renter-occupied units 1.96 ( X )
X Not applicable.
[1] Other Asian alone, or two or more Asian categories.
[2] Other Pacific Islander alone, or two or more Native Hawaiian and Other Pacific Islander categories.
[3] One of the four most commonly reported multiple-race combinations nationwide in Census 2000.
[4] In combination with one or more of the other races listed. The six numbers may add to more than the total population, and the six percentages mayadd to more than 100 percent because individuals may report more than one race.[5] This category is composed of people whose origins are from the Dominican Republic, Spain, and Spanish-speaking Central or South Americancountries. It also includes general origin responses such as "Latino" or "Hispanic."[6] "Spouse" represents spouse of the householder. It does not reflect all spouses in a household. Responses of "same-sex spouse" were editedduring processing to "unmarried partner."[7] "Family households" consist of a householder and one or more other people related to the householder by birth, marriage, or adoption. They do notinclude same-sex married couples even if the marriage was performed in a state issuing marriage certificates for same-sex couples. Same-sex couplehouseholds are included in the family households category if there is at least one additional person related to the householder by birth or adoption.Same-sex couple households with no relatives of the householder present are tabulated in nonfamily households. "Nonfamily households" consist ofpeople living alone and households which do not have any members related to the householder.
[8] The homeowner vacancy rate is the proportion of the homeowner inventory that is vacant "for sale." It is computed by dividing the total number ofvacant units "for sale only" by the sum of owner-occupied units, vacant units that are "for sale only," and vacant units that have been sold but not yetoccupied; and then multiplying by 100.[9] The rental vacancy rate is the proportion of the rental inventory that is vacant "for rent." It is computed by dividing the total number of vacant units"for rent" by the sum of the renter-occupied units, vacant units that are "for rent," and vacant units that have been rented but not yet occupied; andthen multiplying by 100.Source: U.S. Census Bureau, 2010 Census.
4 of 4 05/24/2011
Existing Art Center Utilities Existing Library Utilities
*Cost per Sq Ft $225.00 *Cost per Sq Ft $225.00 Janitorial 200
Total Cost $5,625,000.00 Total Cost $4,500,000.00 Total (sq. ft.) 5,100
Parking Lot (225 Spaces) $300,000.00 Parking Lot (225 Spaces) $20,000.00 Total Savings to Share Project
Land Purchase $400,000.00
Cost to build Shared Space
Total New Development $6,225,000.00 Total New Development $4,600,000.00 (*$225 per sq ft) $1,147,500.00
Landscaping, Grounds $72,500.00
Site Development $100,000.00
Parking Lot $280,000.00
Total Costs Independently $10,825,000.00
$2,000,000.00
Total Costs Combined $8,825,000.00 * Cost per square foot includes all soft costs, equipment and contingency
Total Savings, Combined Construction Costs
CITY OF KETTERING, OHIO KLS
STATEMENT OF REVENUES, EXPENDITURES*
FOR THE YEAR ENDED DECEMBER 31, 2011
ROSEWOOD ARTS CENTER
REVENUES:
Charges for services $213,326
State grants 7,244
Miscellaneous 7,087
Total revenues 227,657
EXPENDITURES:
Personal services 355,323
Operating expenditures 292,550
Capital outlay 0
Public art projects 15,487
Total expenditures 663,360
DEFICIENCY OF REVENUES
OVER EXPENDITURES (435,703)
*Unaudited
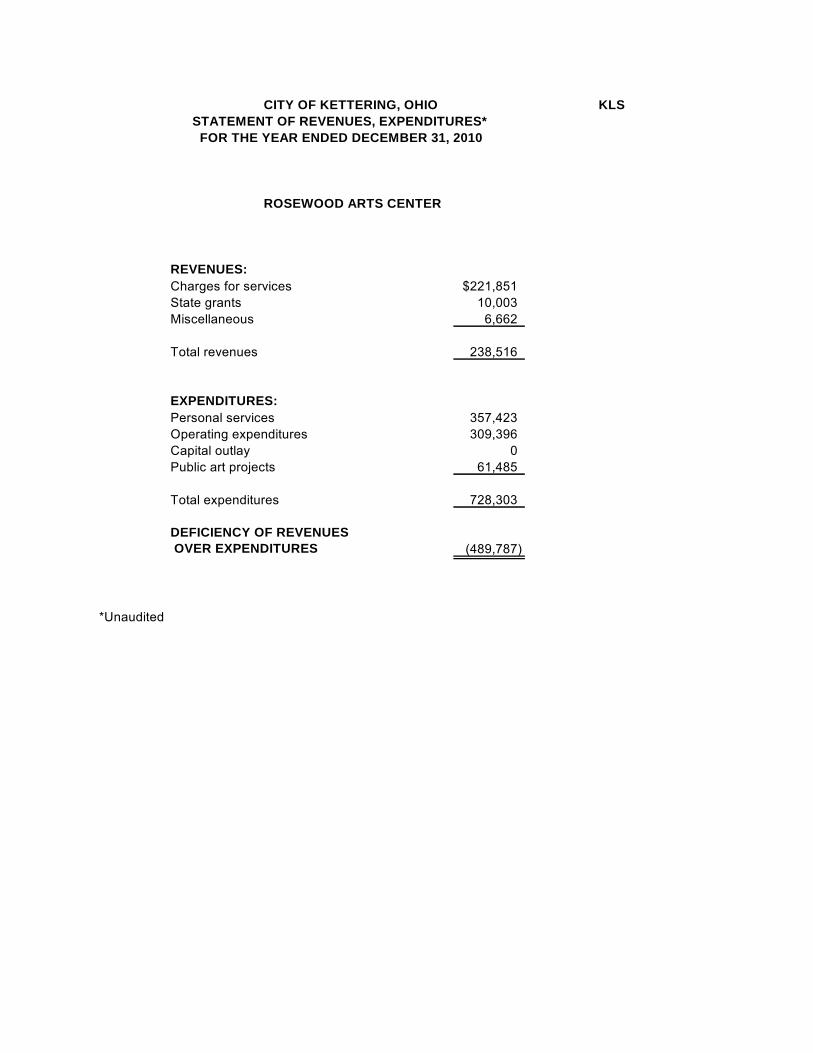
CITY OF KETTERING, OHIO KLS
STATEMENT OF REVENUES, EXPENDITURES*
FOR THE YEAR ENDED DECEMBER 31, 2010
ROSEWOOD ARTS CENTER
REVENUES:
Charges for services $221,851
State grants 10,003
Miscellaneous 6,662
Total revenues 238,516
EXPENDITURES:
Personal services 357,423
Operating expenditures 309,396
Capital outlay 0
Public art projects 61,485
Total expenditures 728,303
DEFICIENCY OF REVENUES
OVER EXPENDITURES (489,787)
*Unaudited
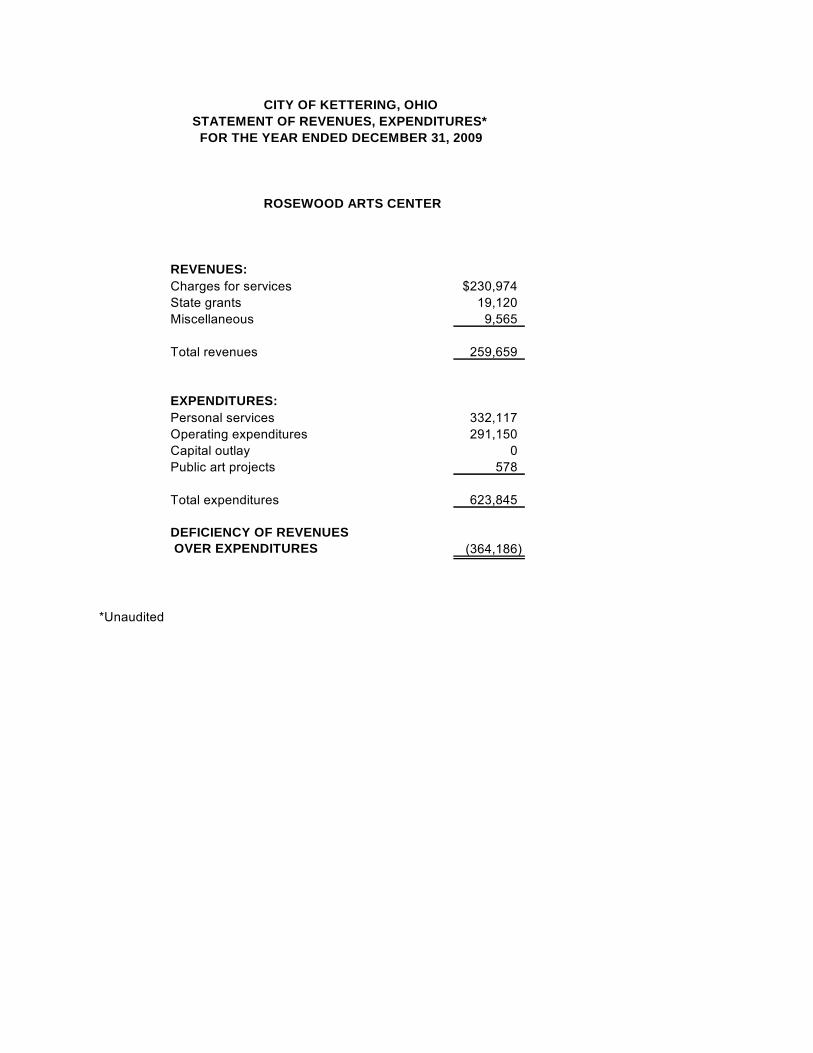
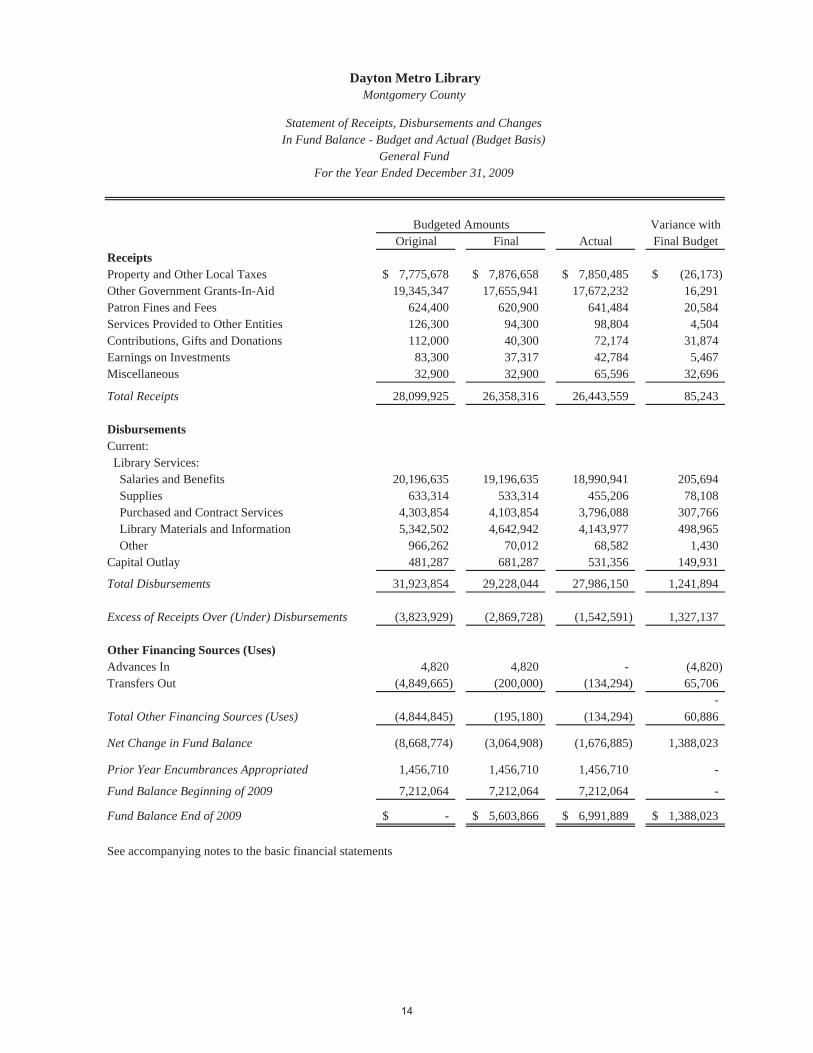
CITY OF KETTERING, OHIO
STATEMENT OF REVENUES, EXPENDITURES*
FOR THE YEAR ENDED DECEMBER 31, 2009
ROSEWOOD ARTS CENTER
REVENUES:
Charges for services $230,974
State grants 19,120
Miscellaneous 9,565
Total revenues 259,659
EXPENDITURES:
Personal services 332,117
Operating expenditures 291,150
Capital outlay 0
Public art projects 578
Total expenditures 623,845
DEFICIENCY OF REVENUES
OVER EXPENDITURES (364,186)
*Unaudited
CITY OF KETTERING, OHIO
COMPREHENSIVE ANNUAL FINANCIAL REPORT
YEAR ENDED DECEMBER 31, 2008
Prepared by:
Department of Finance Nancy H. Gregory, CPA, Director
CITY OF KETTERING, OHIO i
COMPREHENSIVE ANNUAL FINANCIAL REPORTFOR THE YEAR ENDED DECEMBER 31, 2008
TABLE OF CONTENTS
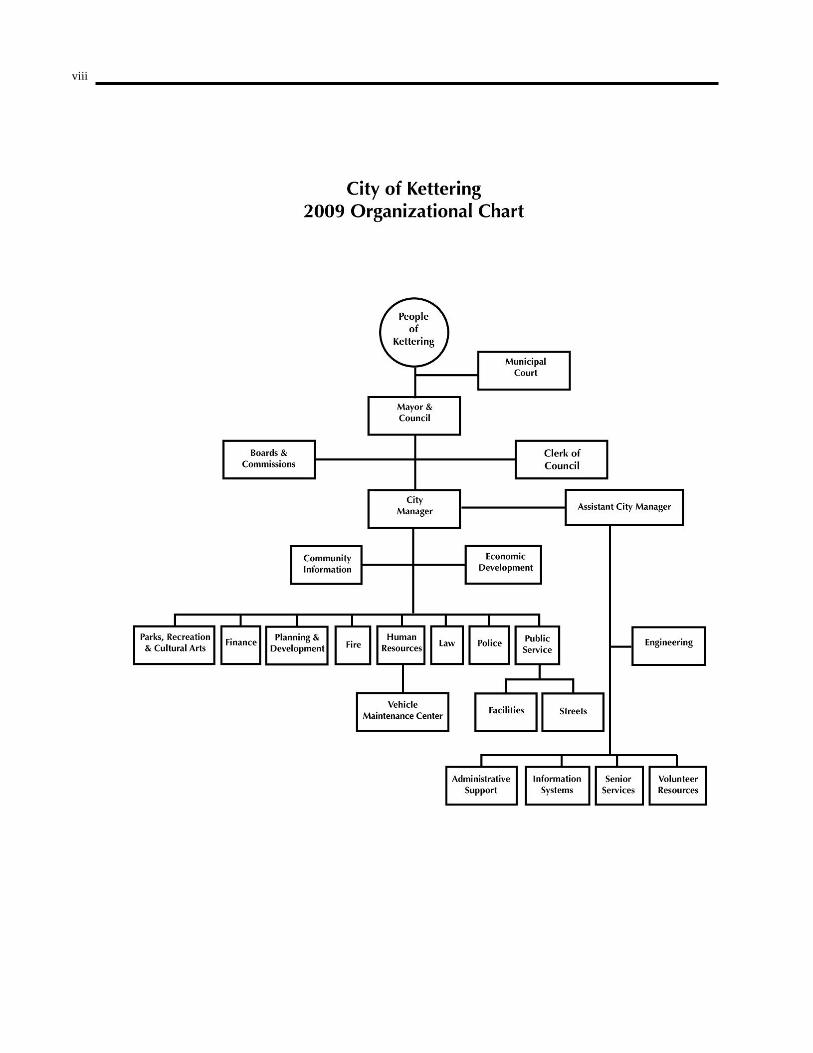
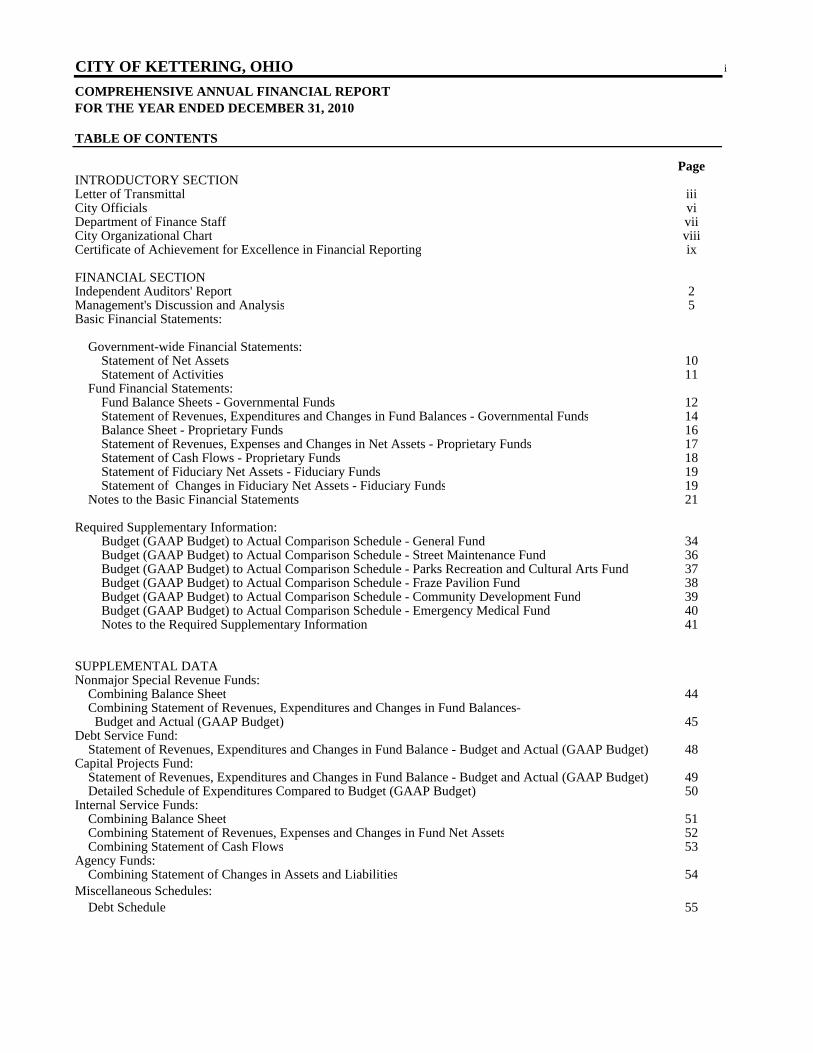
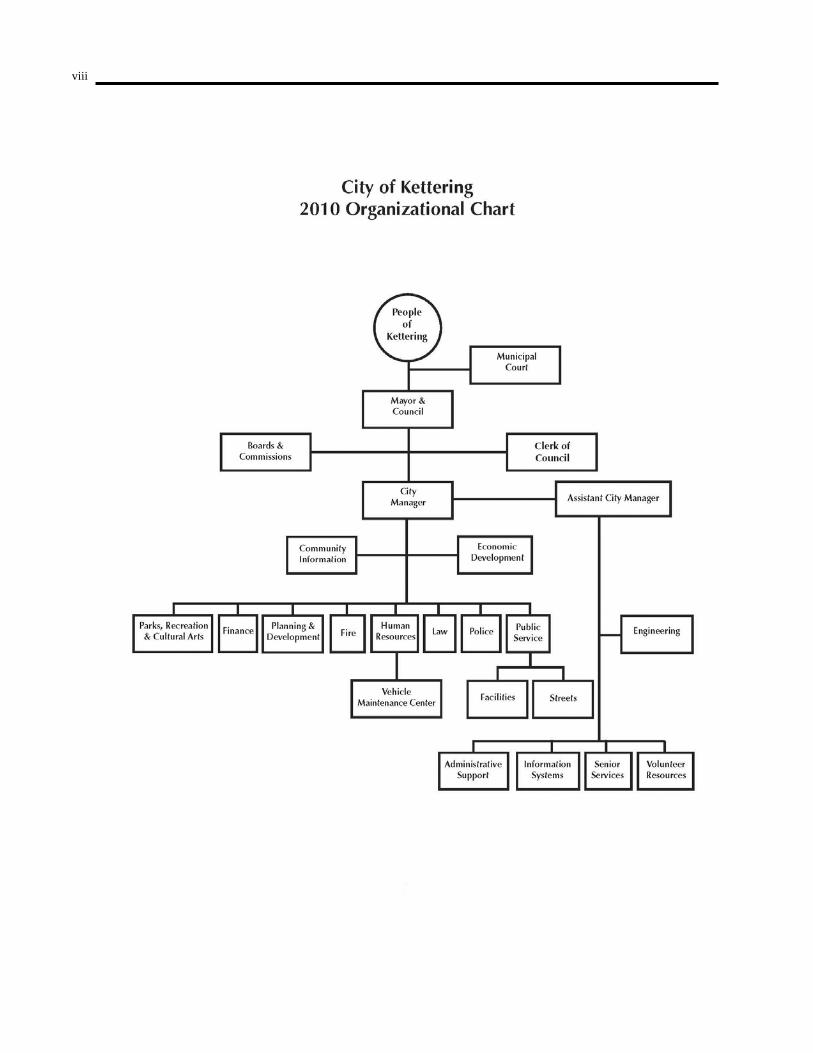
PageINTRODUCTORY SECTIONLetter of Transmittal iiiCity Officials viDepartment of Finance Staff viiCity Organizational Chart viiiCertificate of Achievement for Excellence in Financial Reporting ix
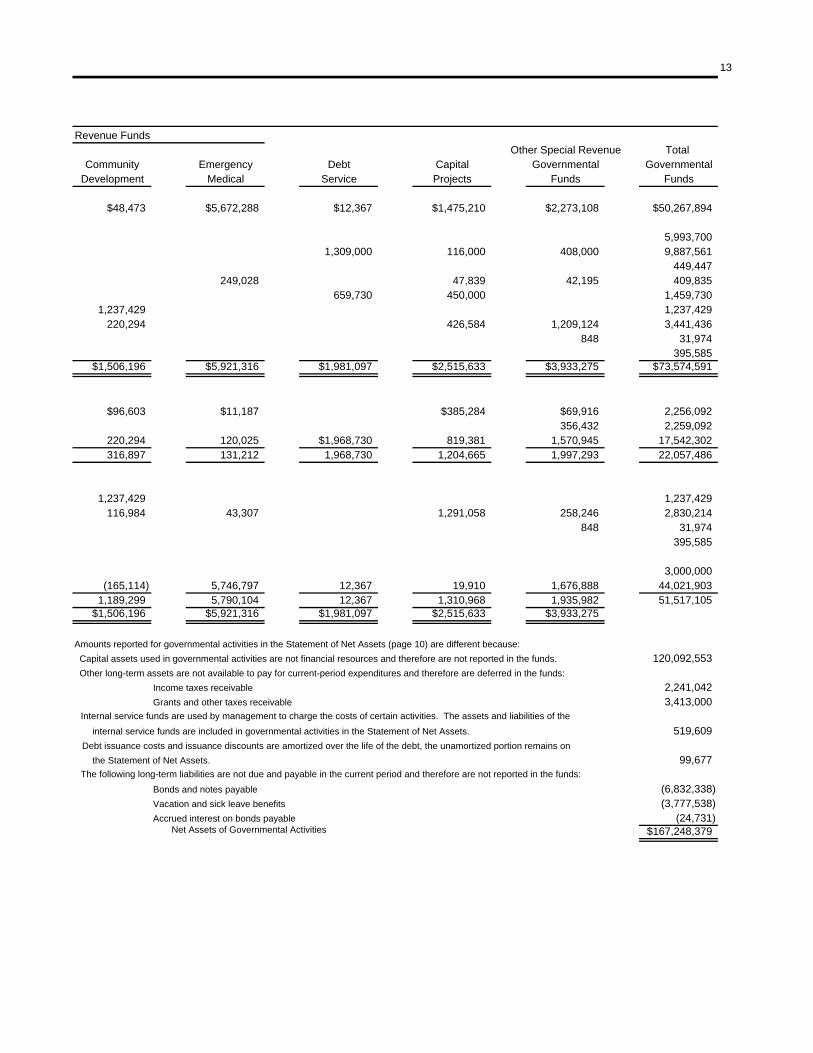
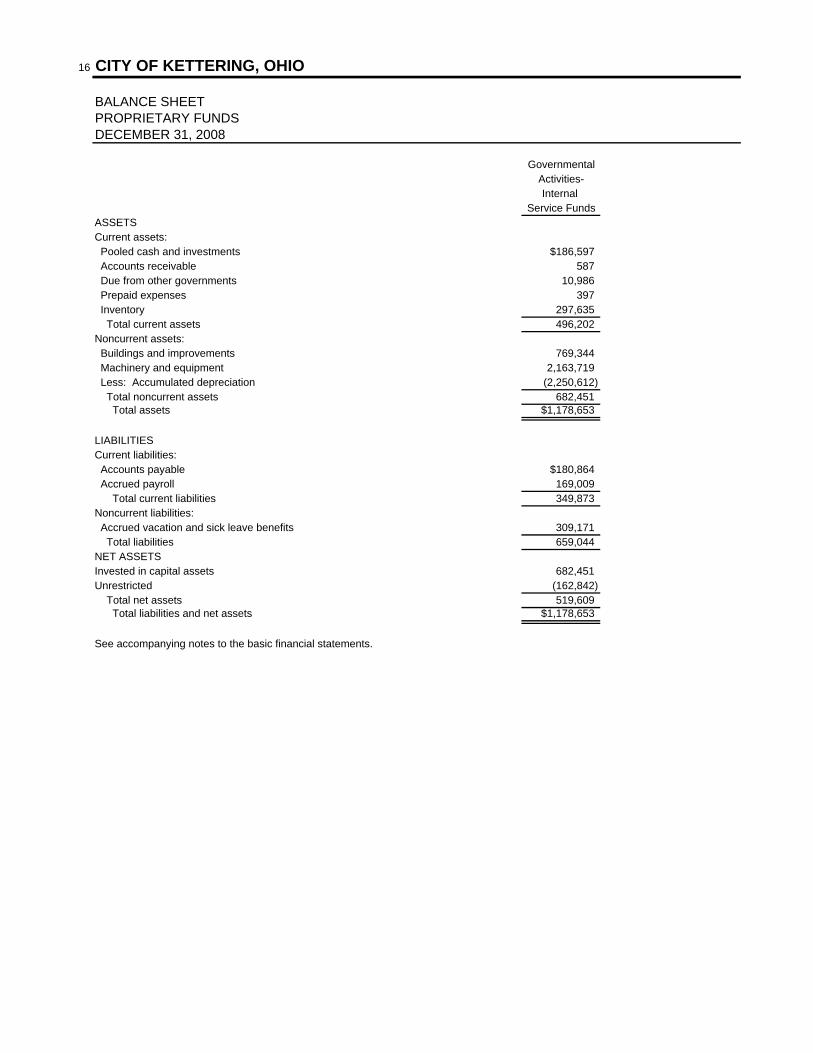
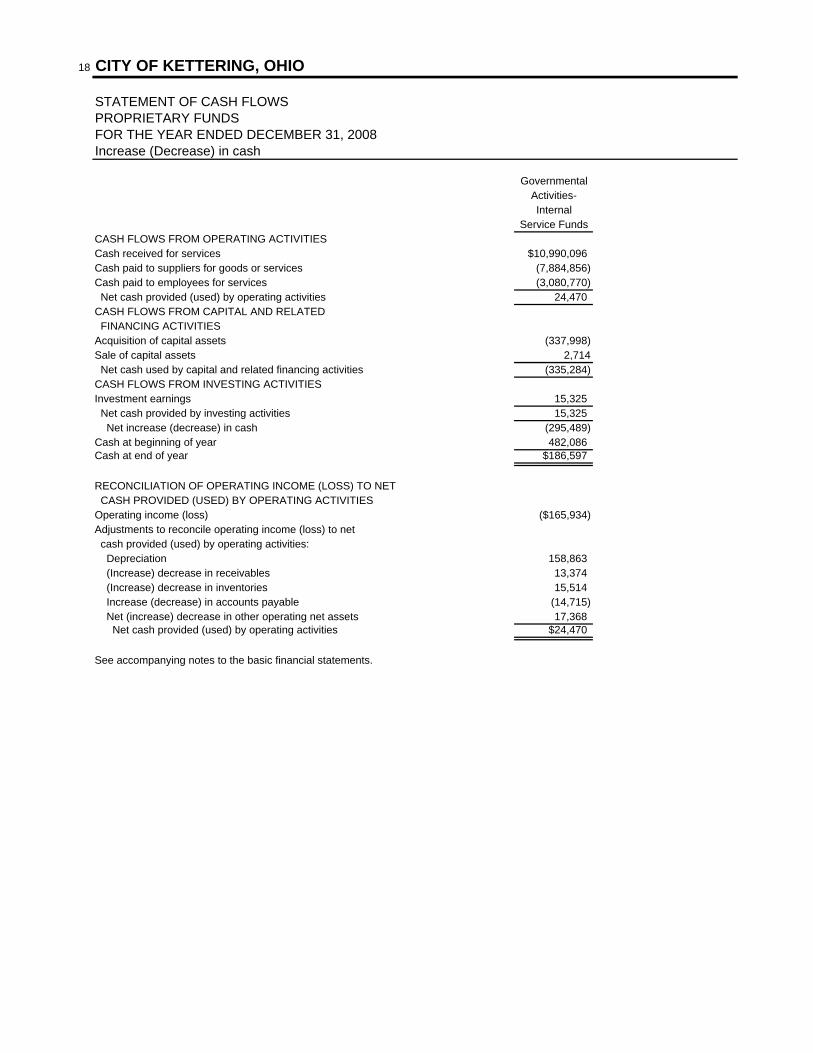
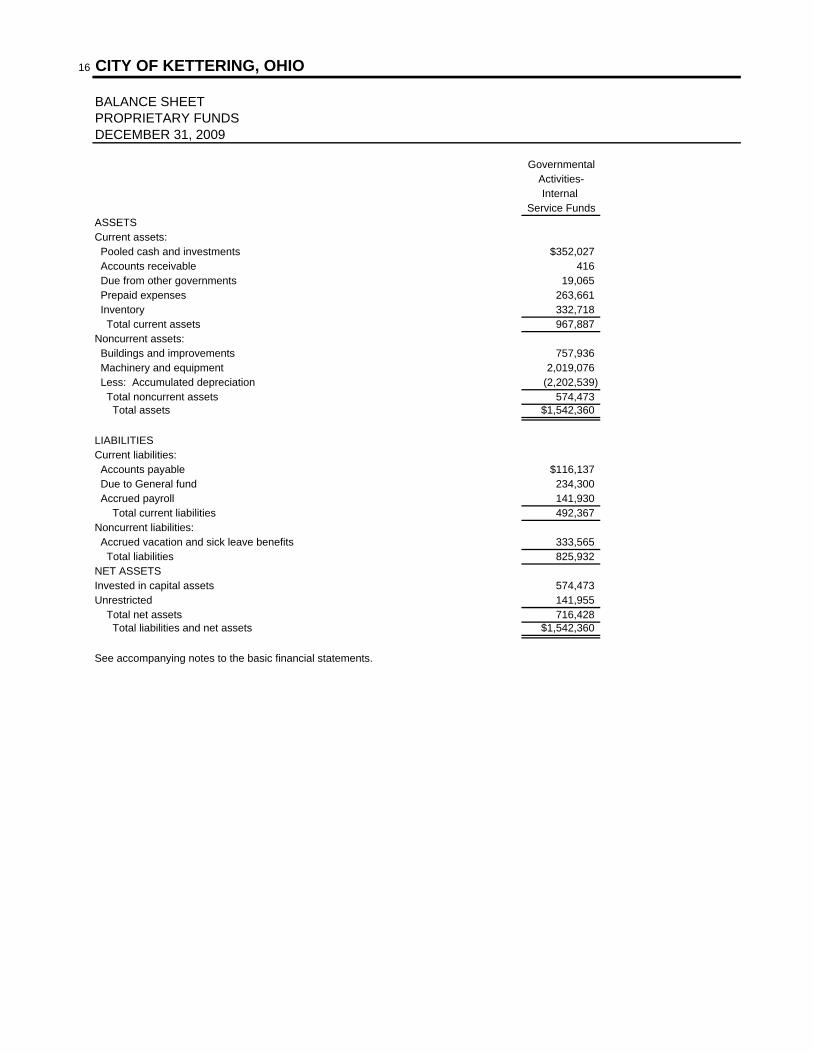
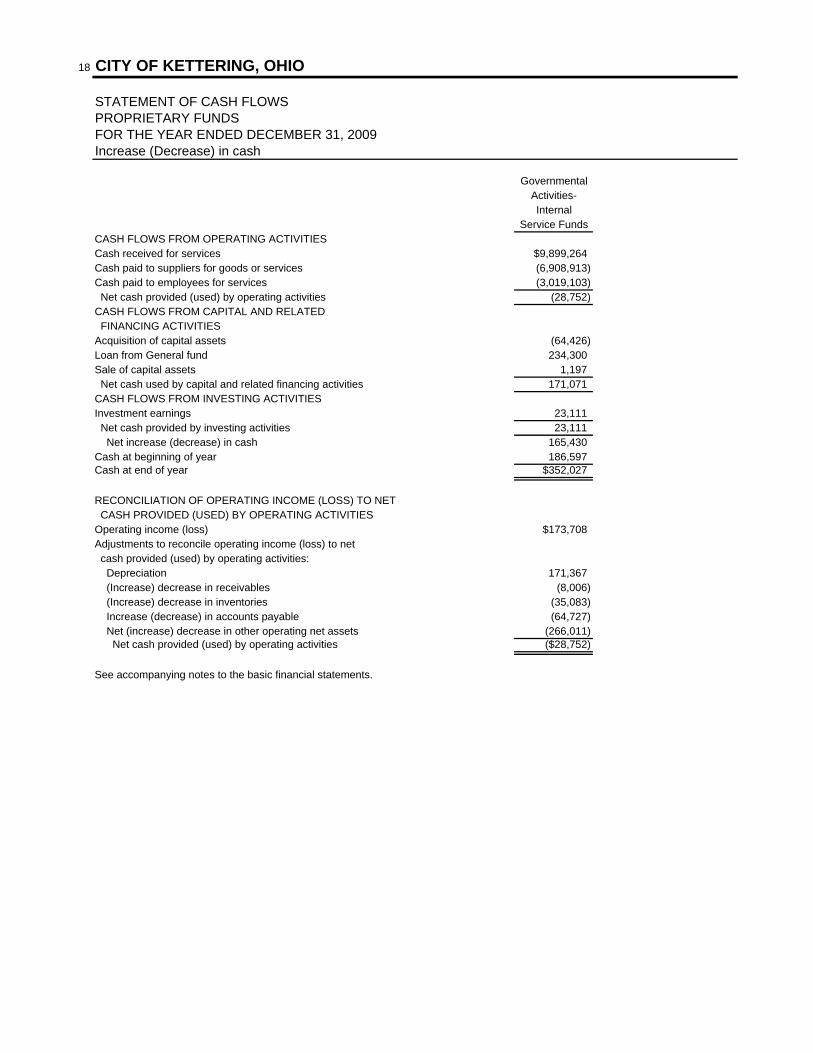
Government-wide Financial Statements: Statement of Net Assets 10 Statement of Activities 11 Fund Financial Statements: Fund Balance Sheets - Governmental Funds 12 Statement of Revenues, Expenditures and Changes in Fund Balances - Governmental Funds 14 Balance Sheet - Proprietary Funds 16 Statement of Revenues, Expenses and Changes in Net Assets - Proprietary Funds 17 Statement of Cash Flows - Proprietary Funds 18 Statement of Fiduciary Net Assets - Fiduciary Funds 19 Statement of Changes in Fiduciary Net Assets - Fiduciary Funds 19 Notes to the Basic Financial Statements 21
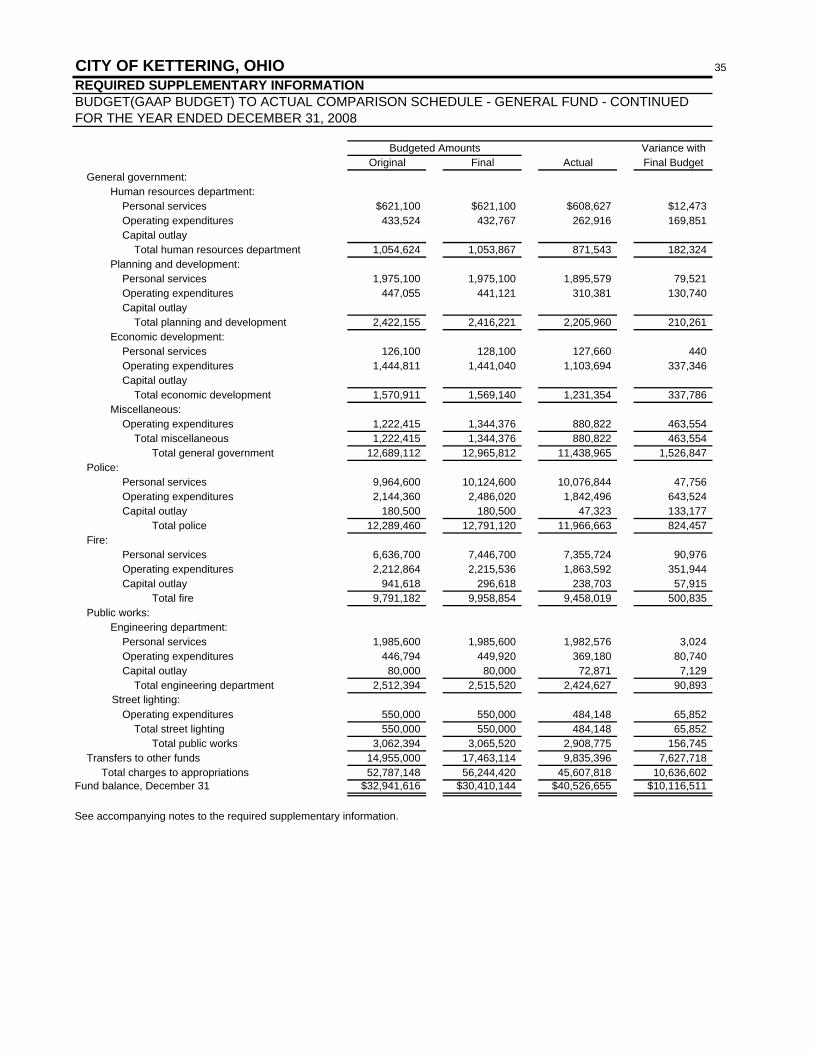
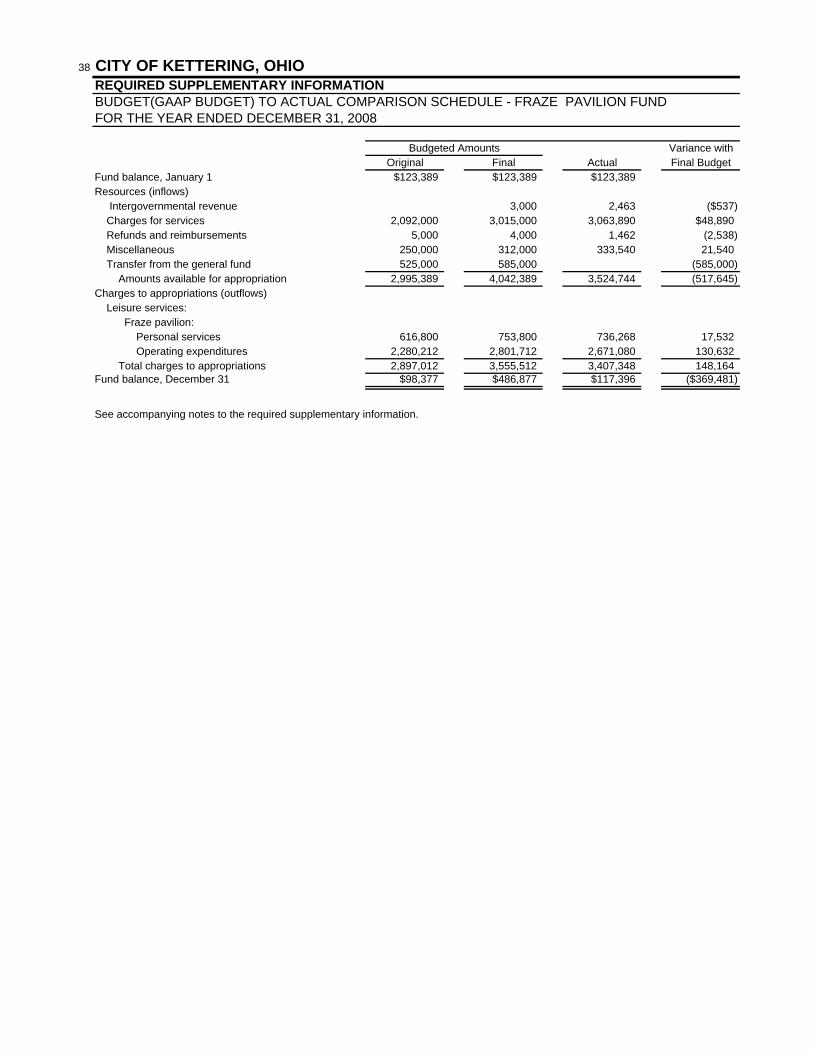
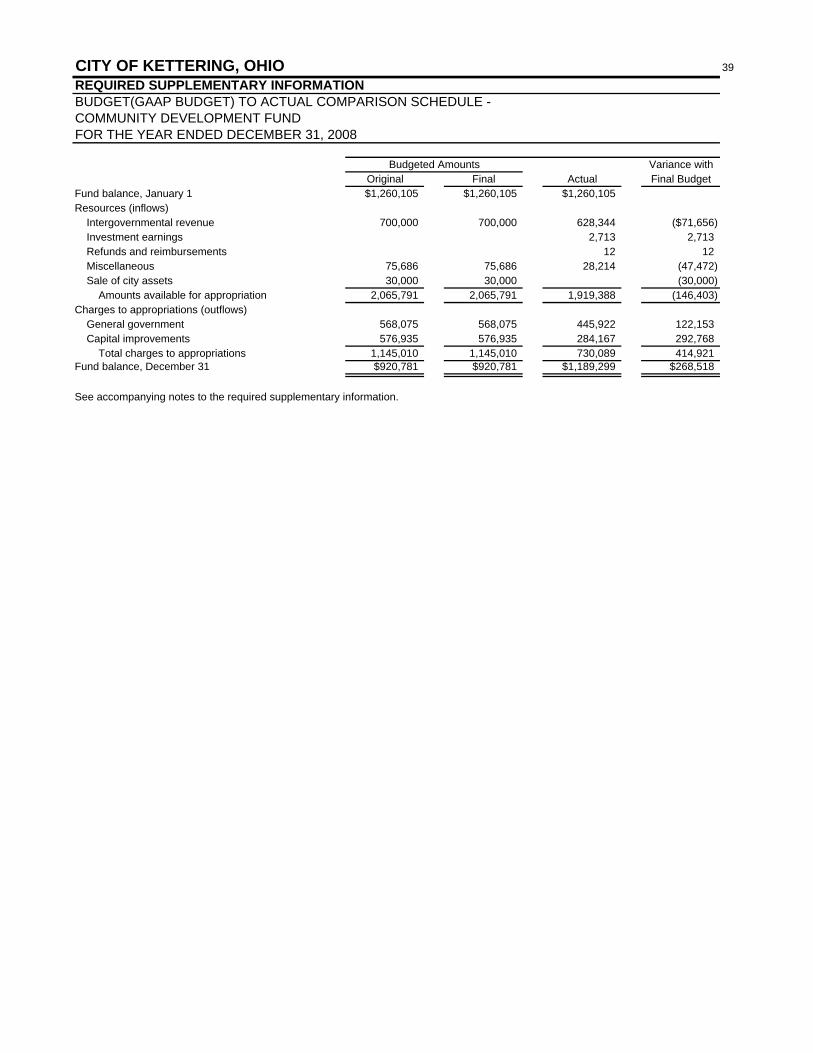
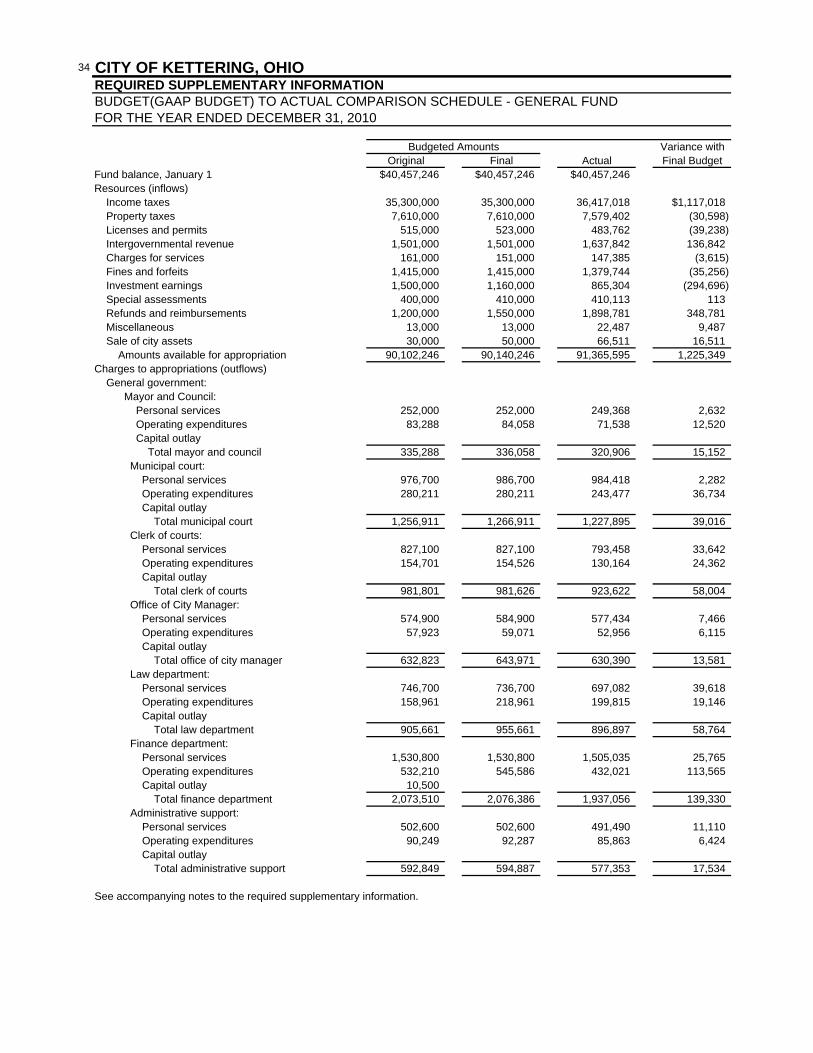
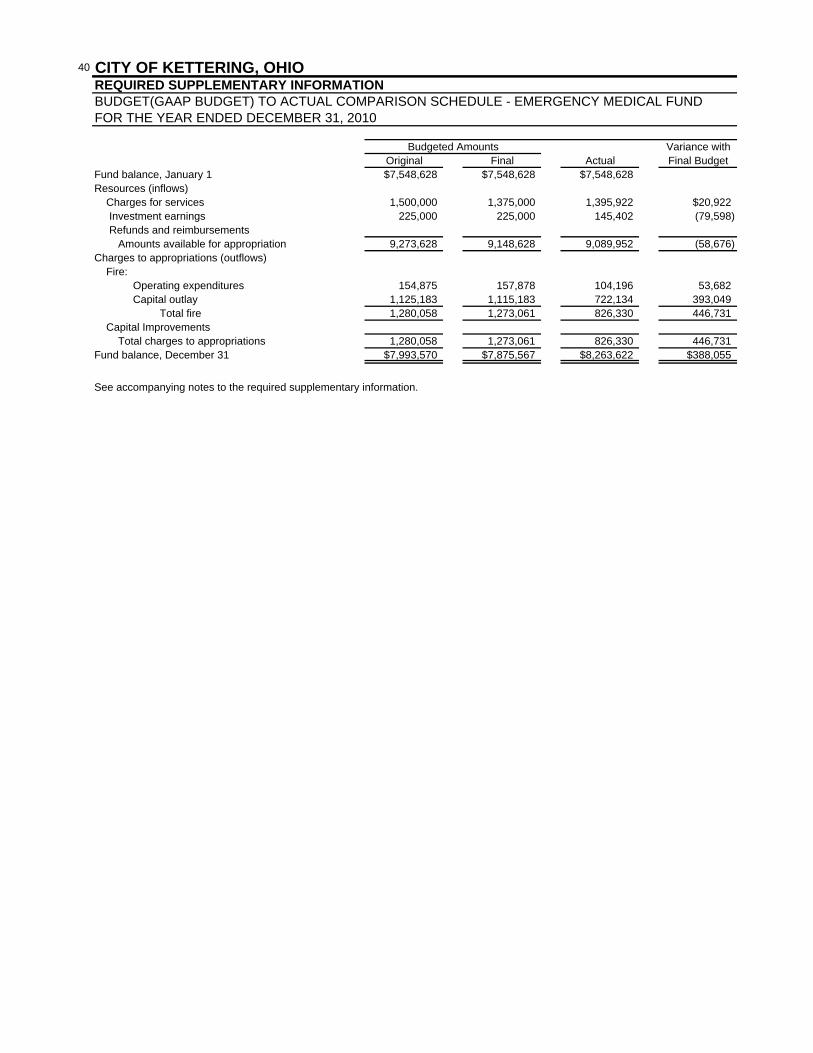
Required Supplementary Information: Budget (GAAP Budget) to Actual Comparison Schedule - General Fund 34 Budget (GAAP Budget) to Actual Comparison Schedule - Street Maintenance Fund 36 Budget (GAAP Budget) to Actual Comparison Schedule - Parks Recreation and Cultural Arts Fund 37 Budget (GAAP Budget) to Actual Comparison Schedule - Fraze Pavilion Fund 38 Budget (GAAP Budget) to Actual Comparison Schedule - Community Development Fund 39 Budget (GAAP Budget) to Actual Comparison Schedule - Emergency Medical Fund 40 Notes to the Required Supplementary Information 41
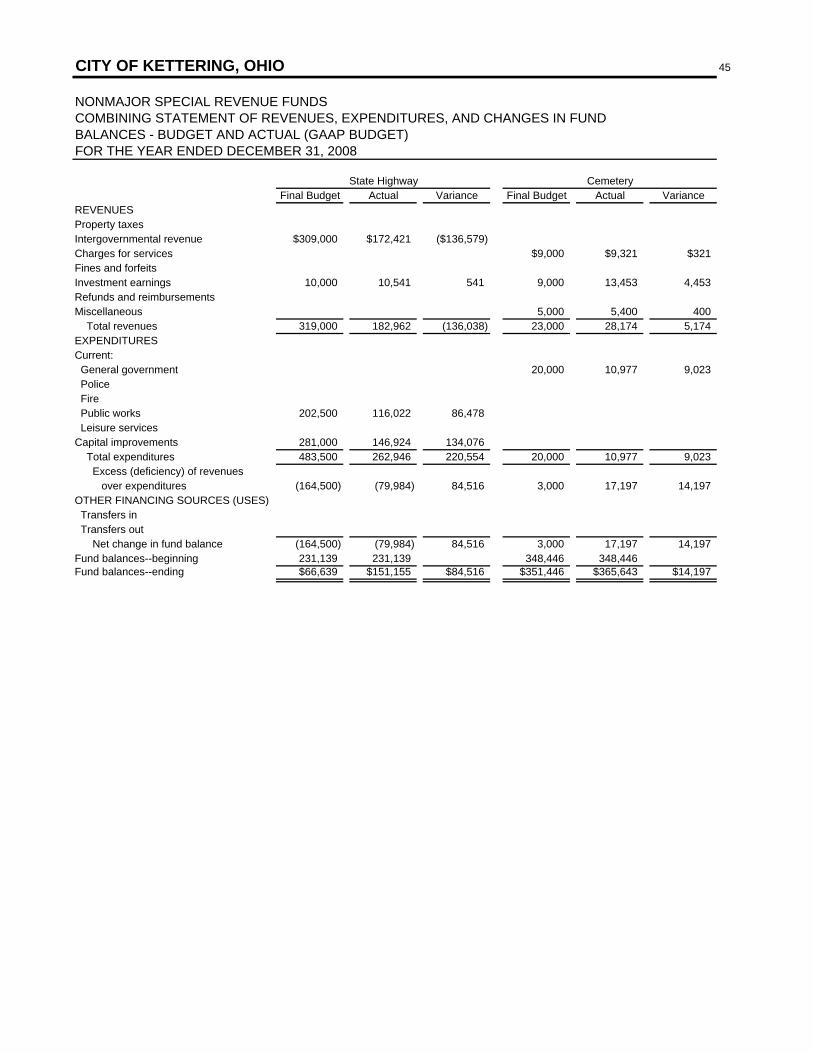
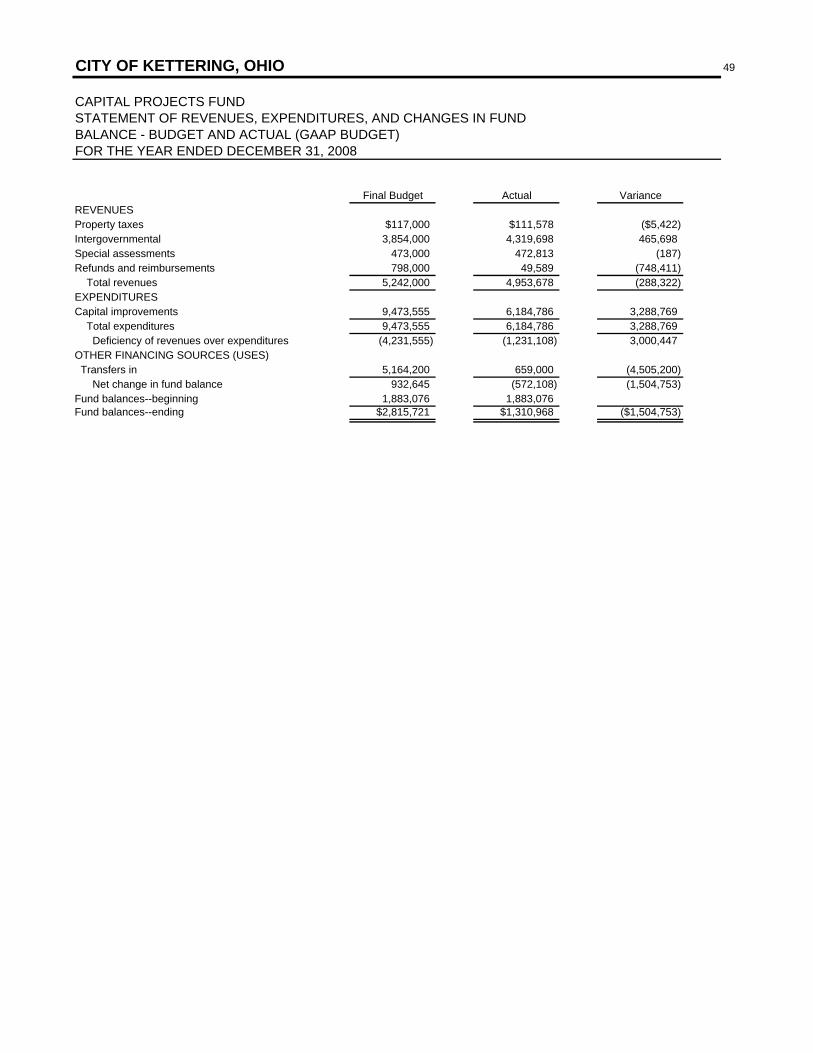
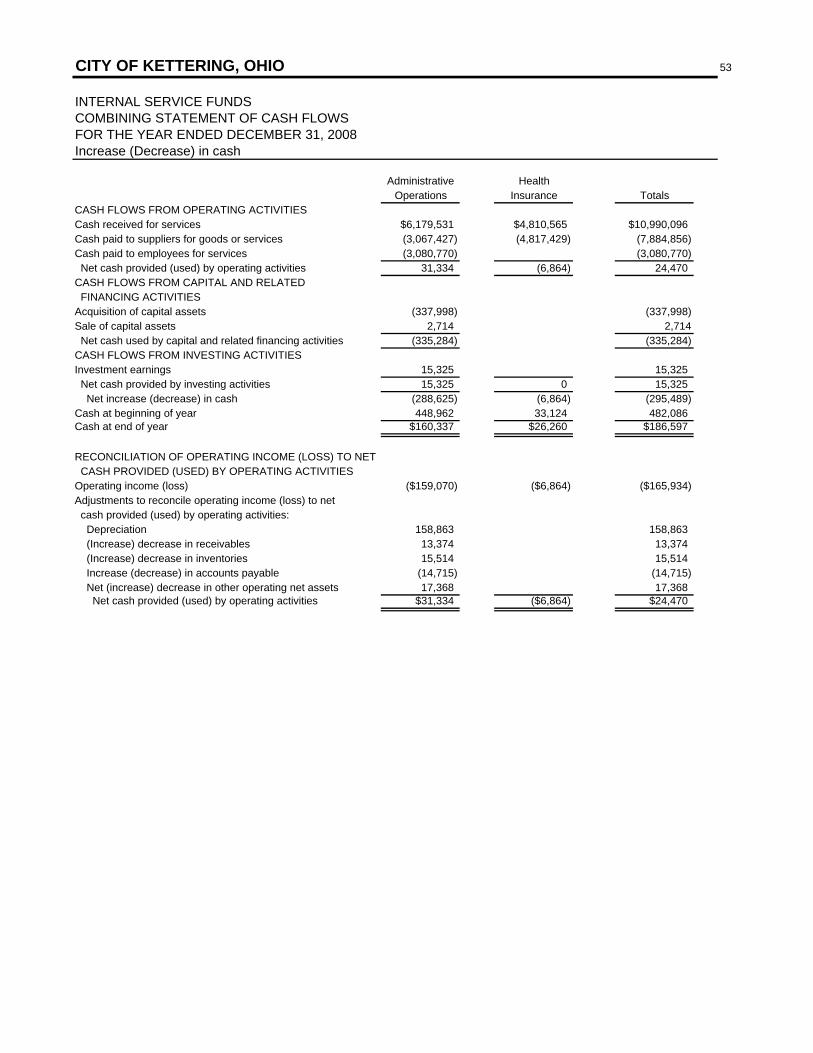
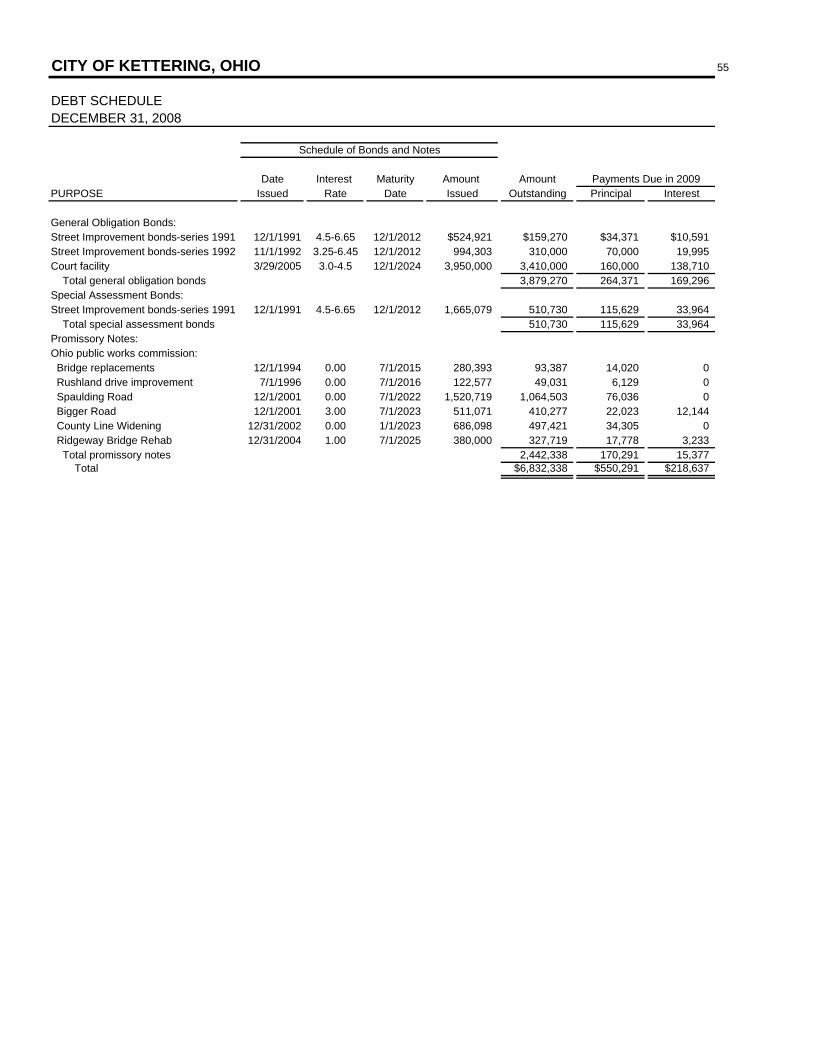
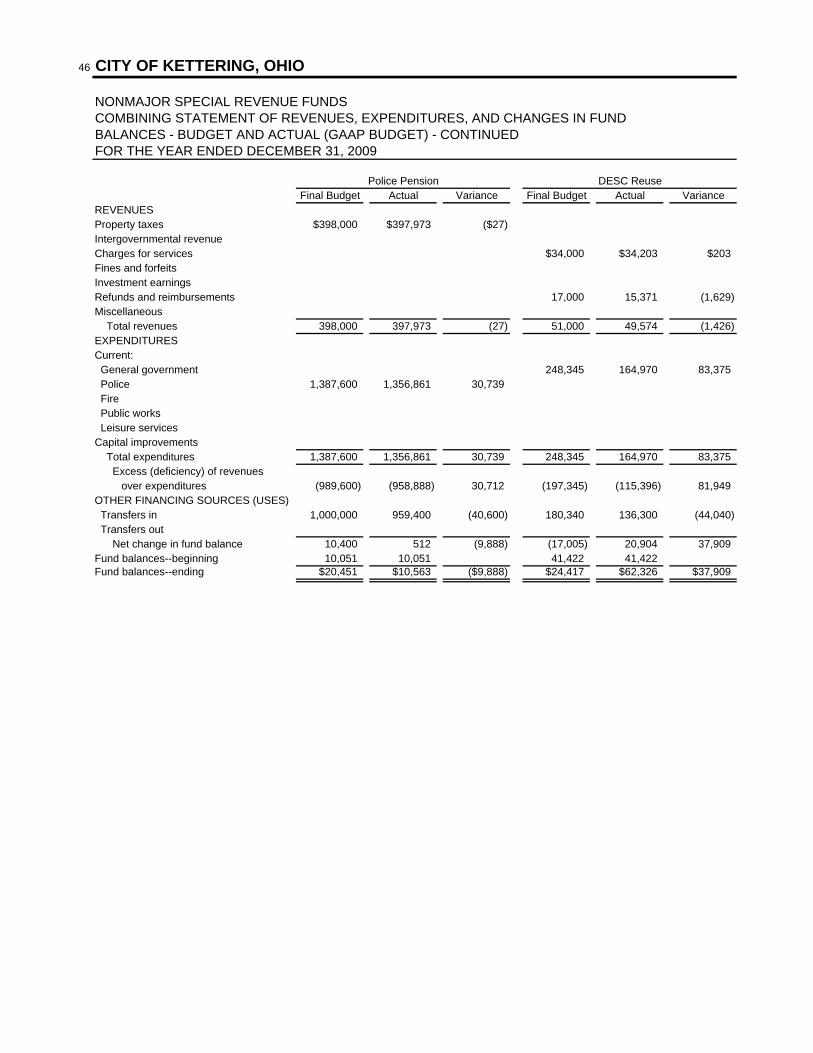
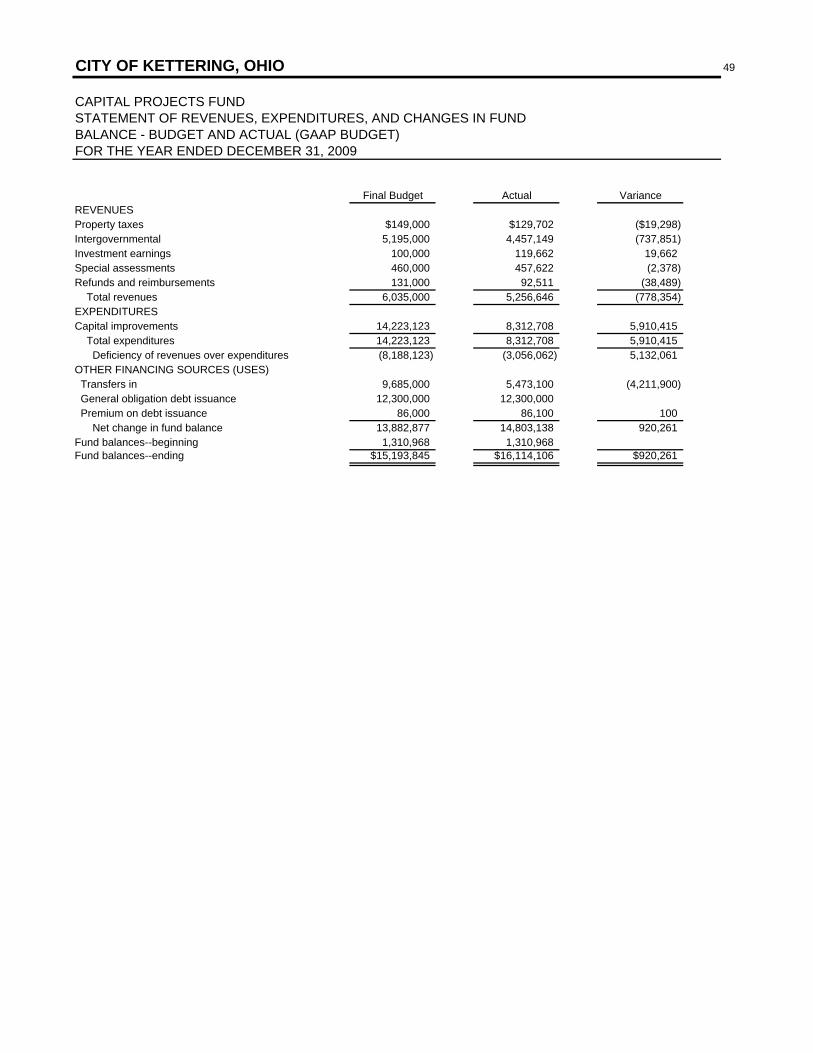
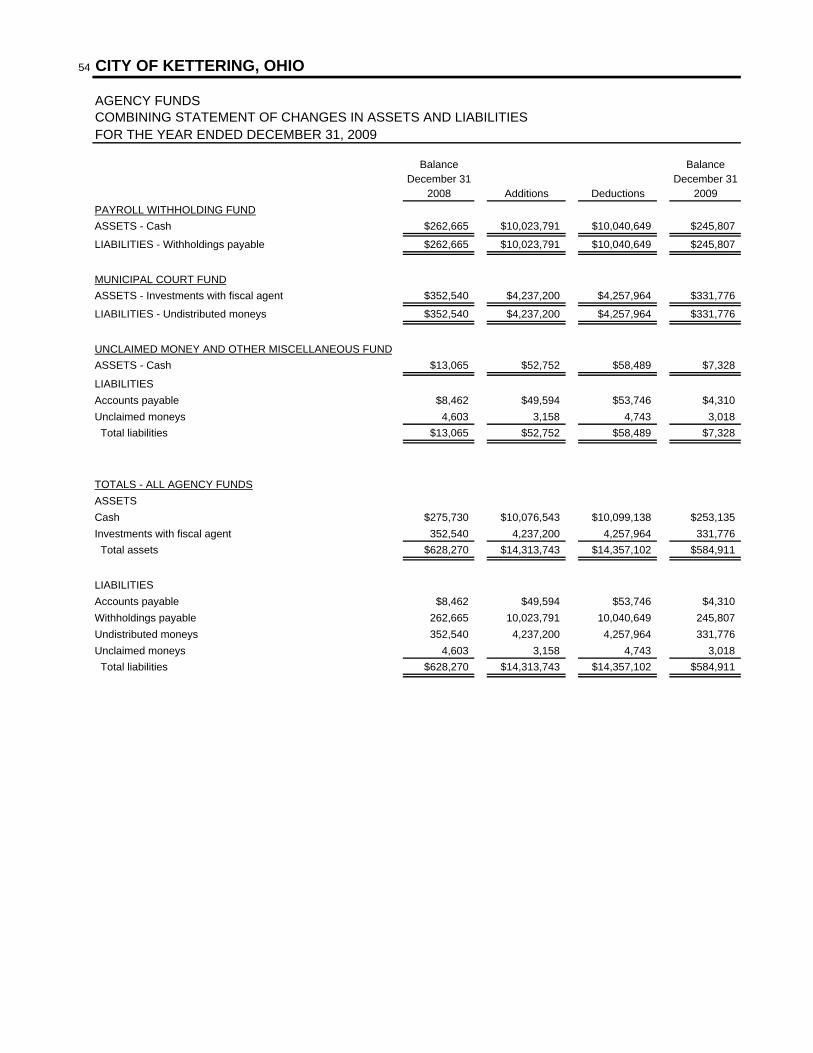
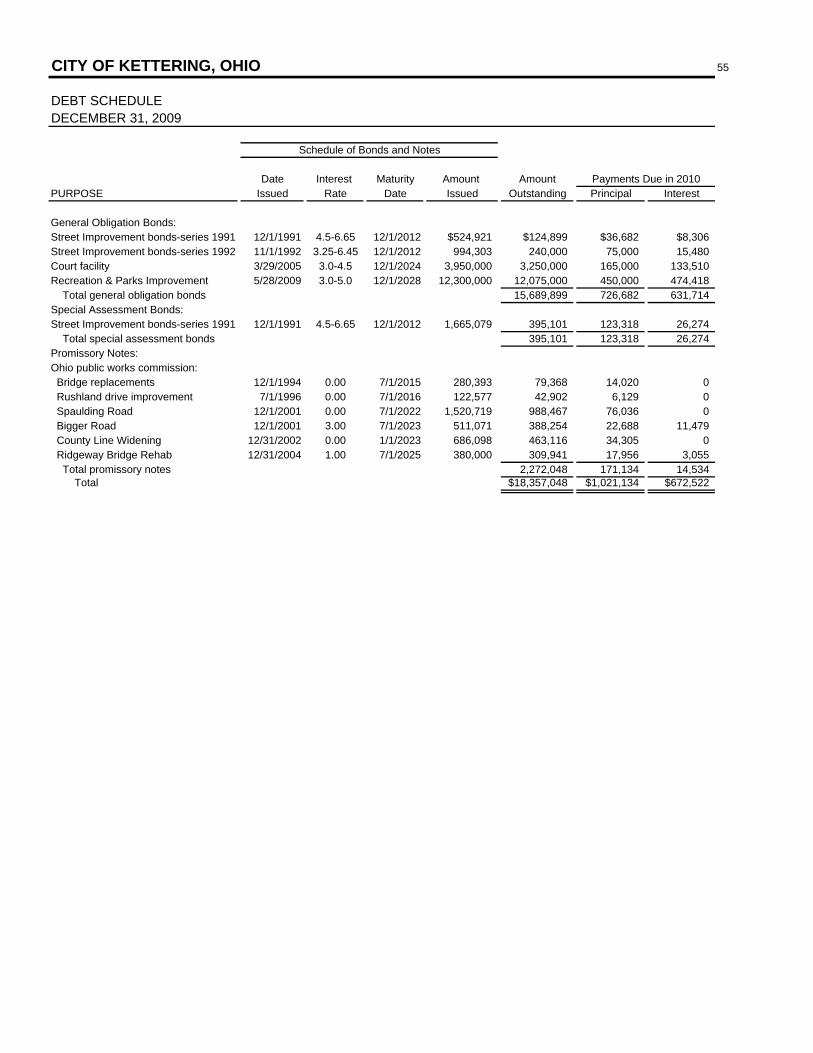
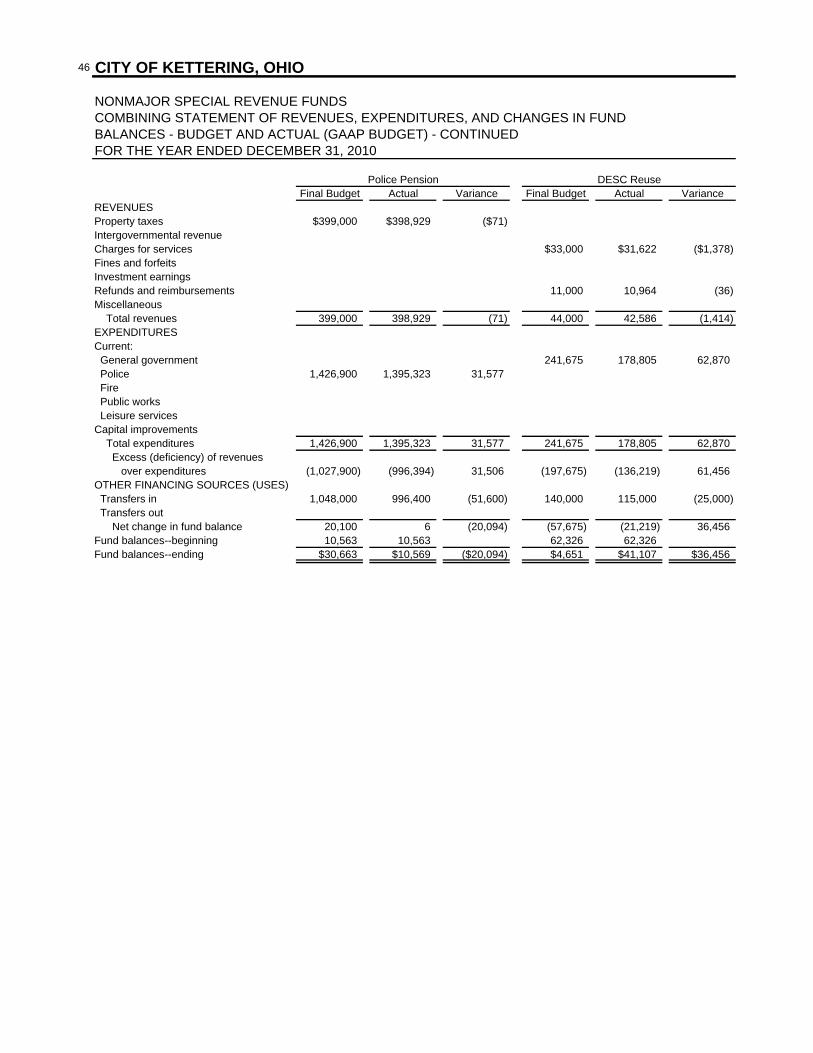
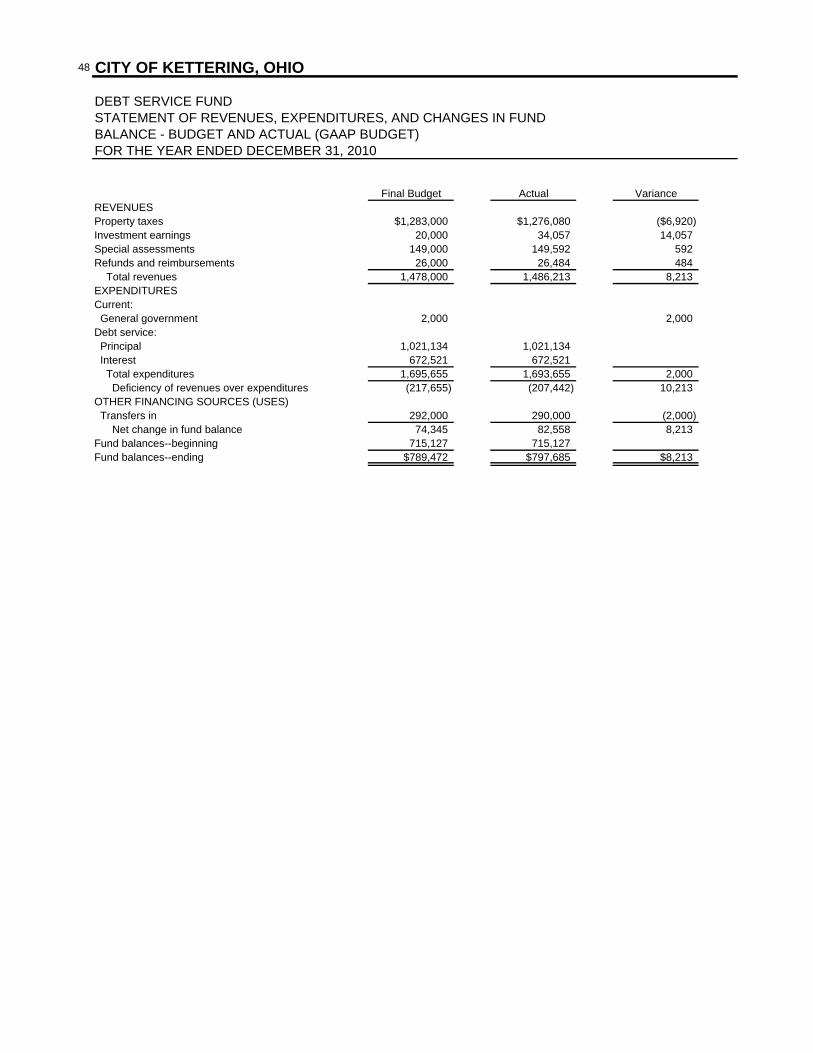
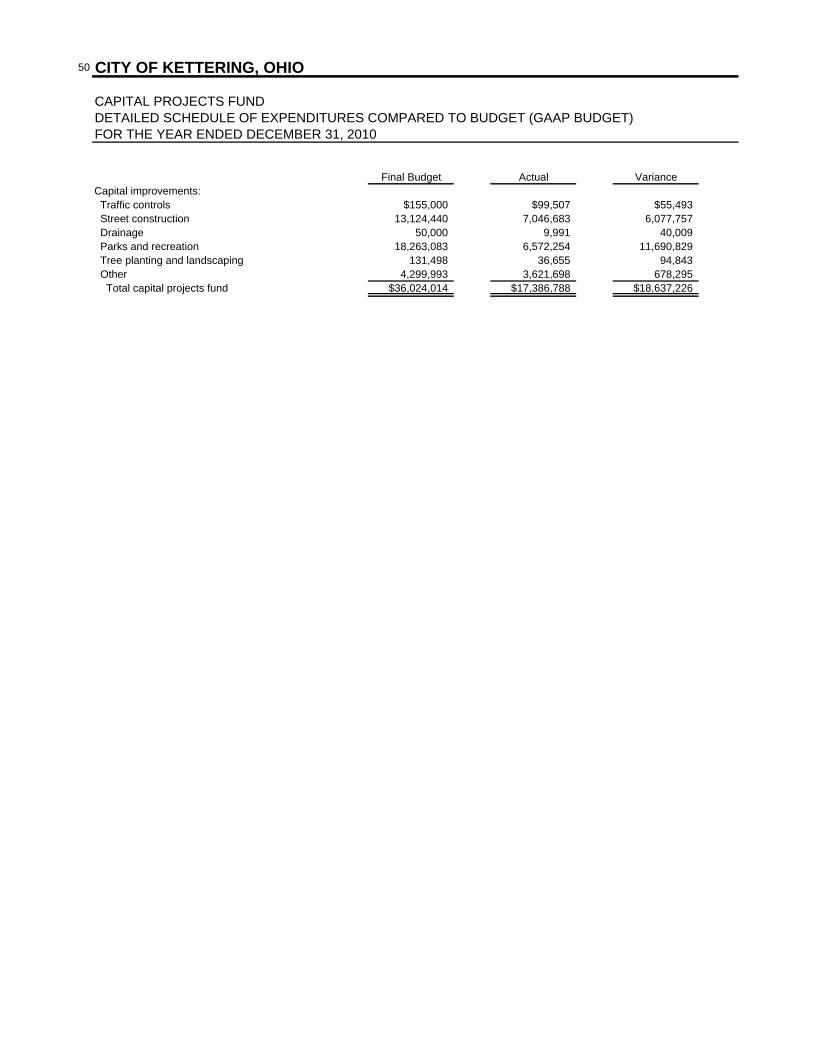
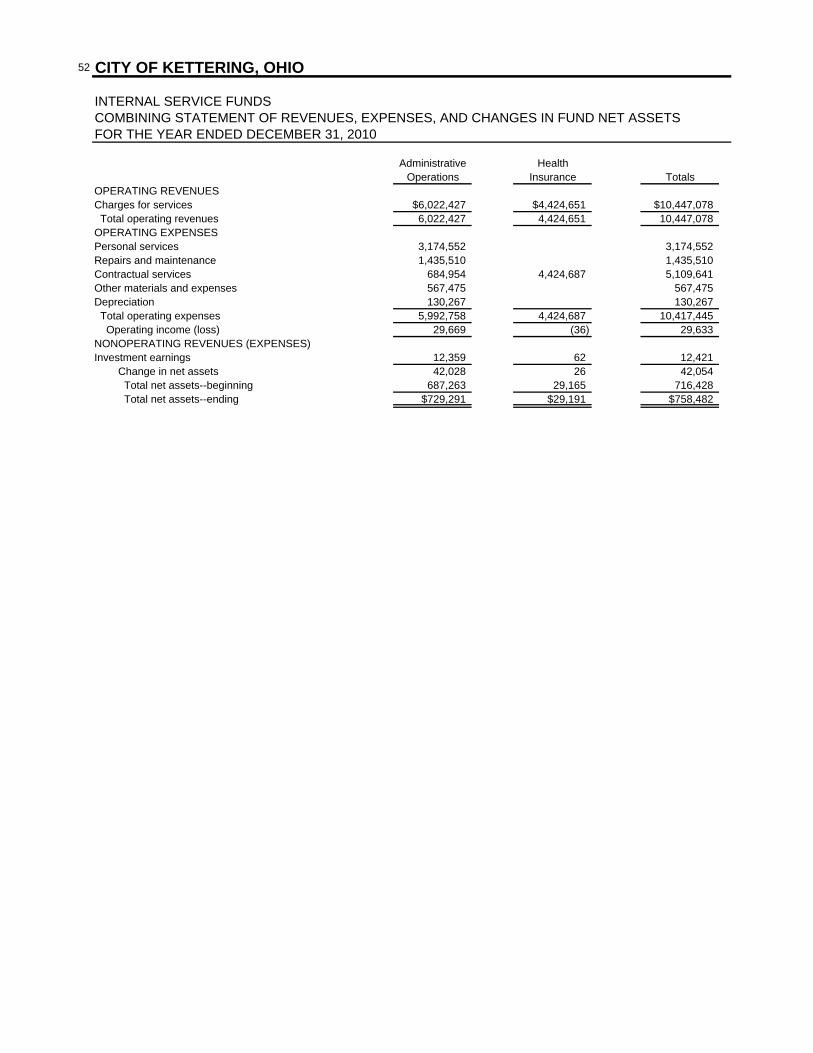
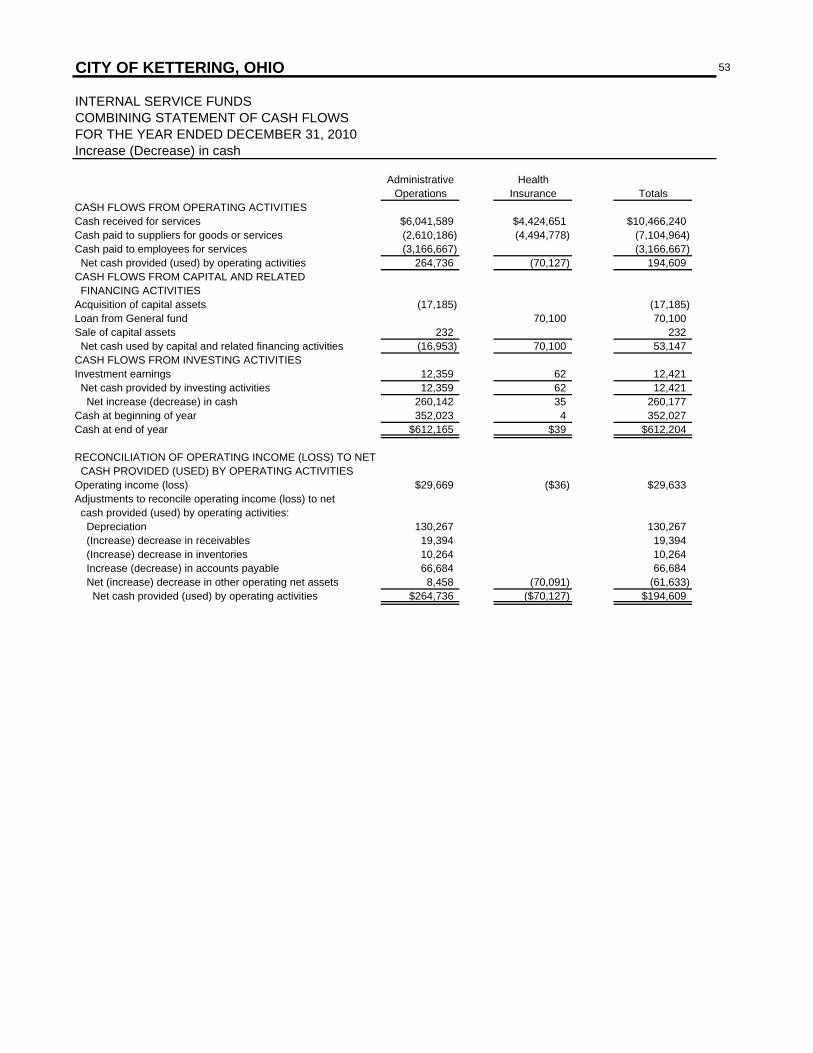
SUPPLEMENTAL DATANonmajor Special Revenue Funds: Combining Balance Sheet 44 Combining Statement of Revenues, Expenditures and Changes in Fund Balances- Budget and Actual (GAAP Budget) 45Debt Service Fund: Statement of Revenues, Expenditures and Changes in Fund Balance - Budget and Actual (GAAP Budget) 48Capital Projects Fund: Statement of Revenues, Expenditures and Changes in Fund Balance - Budget and Actual (GAAP Budget) 49 Detailed Schedule of Expenditures Compared to Budget (GAAP Budget) 50Internal Service Funds: Combining Balance Sheet 51 Combining Statement of Revenues, Expenses and Changes in Fund Net Assets 52 Combining Statement of Cash Flows 53Agency Funds: Combining Statement of Changes in Assets and Liabilities 54Miscellaneous Schedules: Debt Schedule 55
ii CITY OF KETTERING, OHIOCOMPREHENSIVE ANNUAL FINANCIAL REPORTFOR THE YEAR ENDED DECEMBER 31, 2008
TABLE OF CONTENTS - CONTINUED
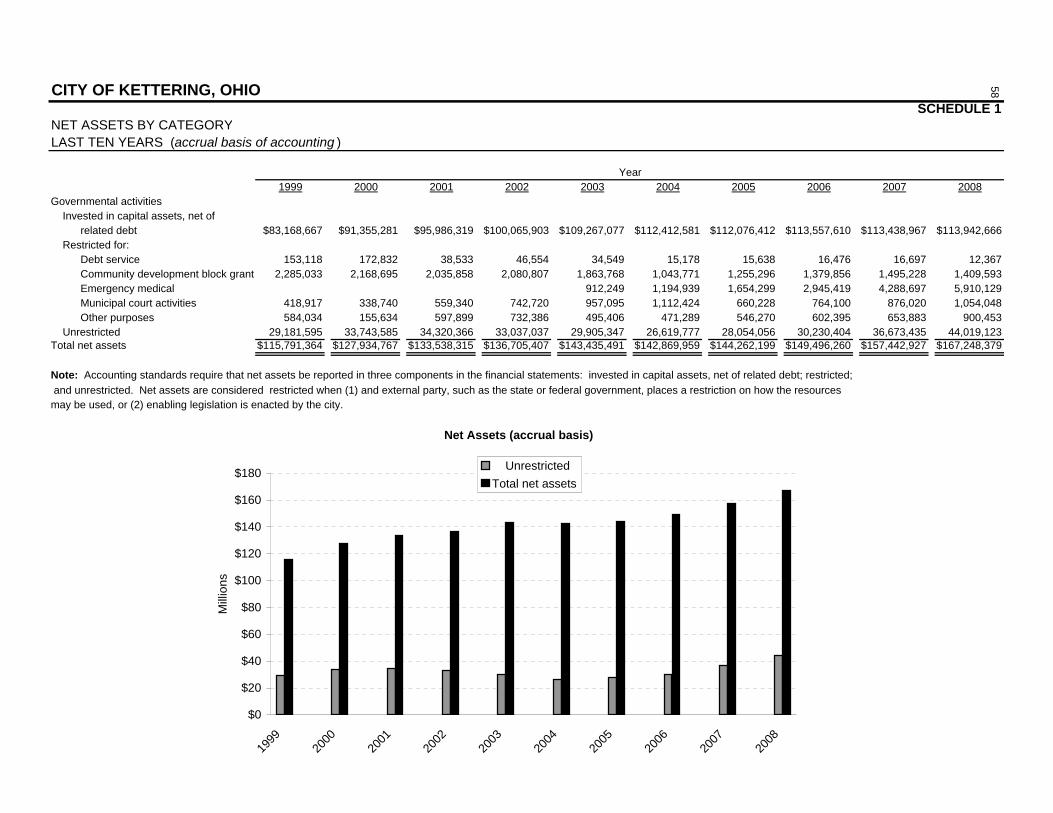
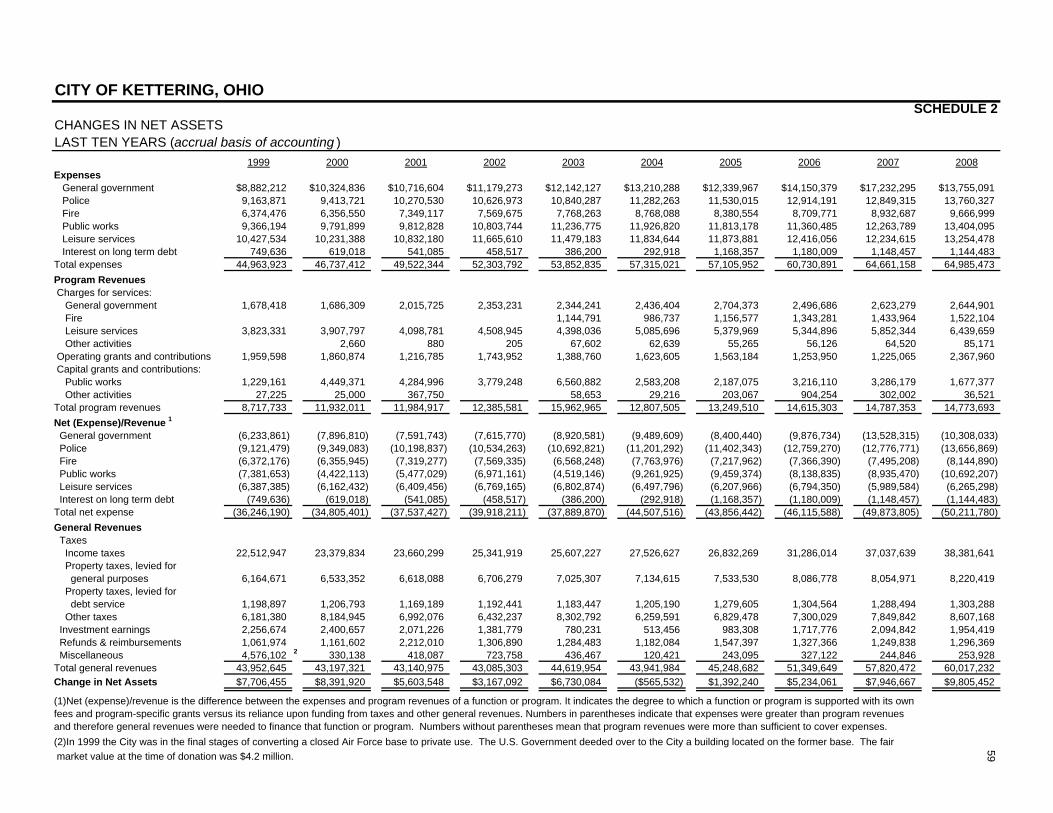
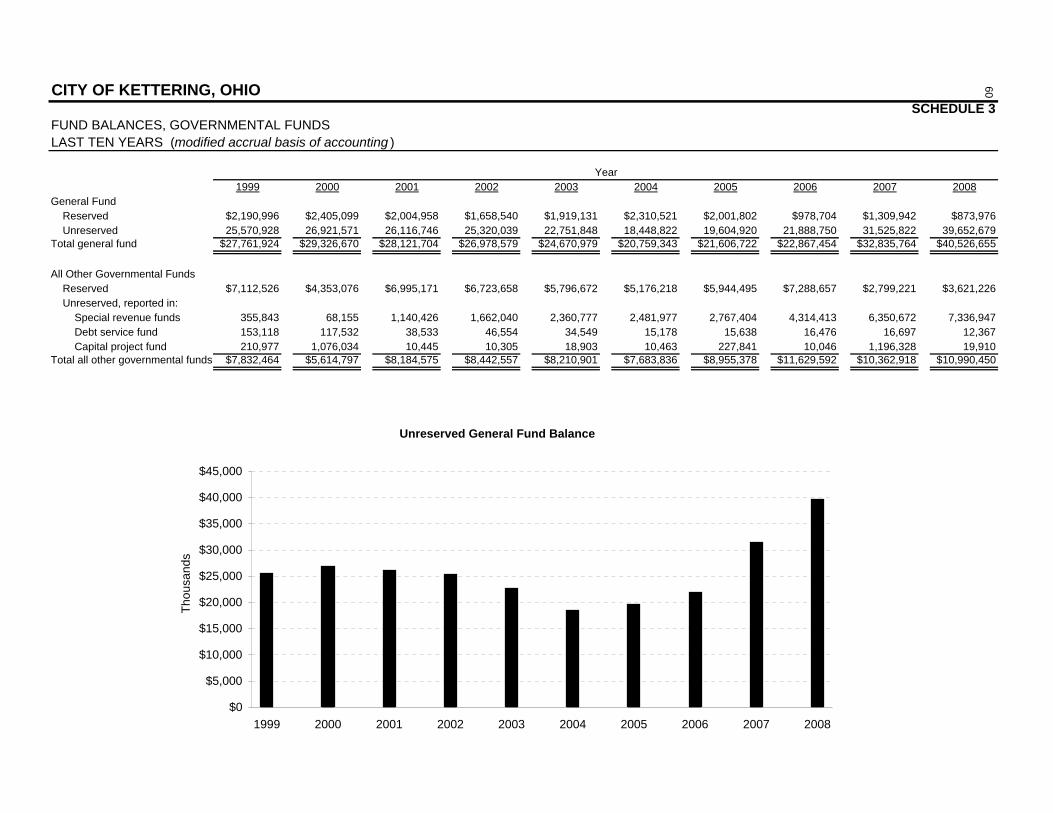
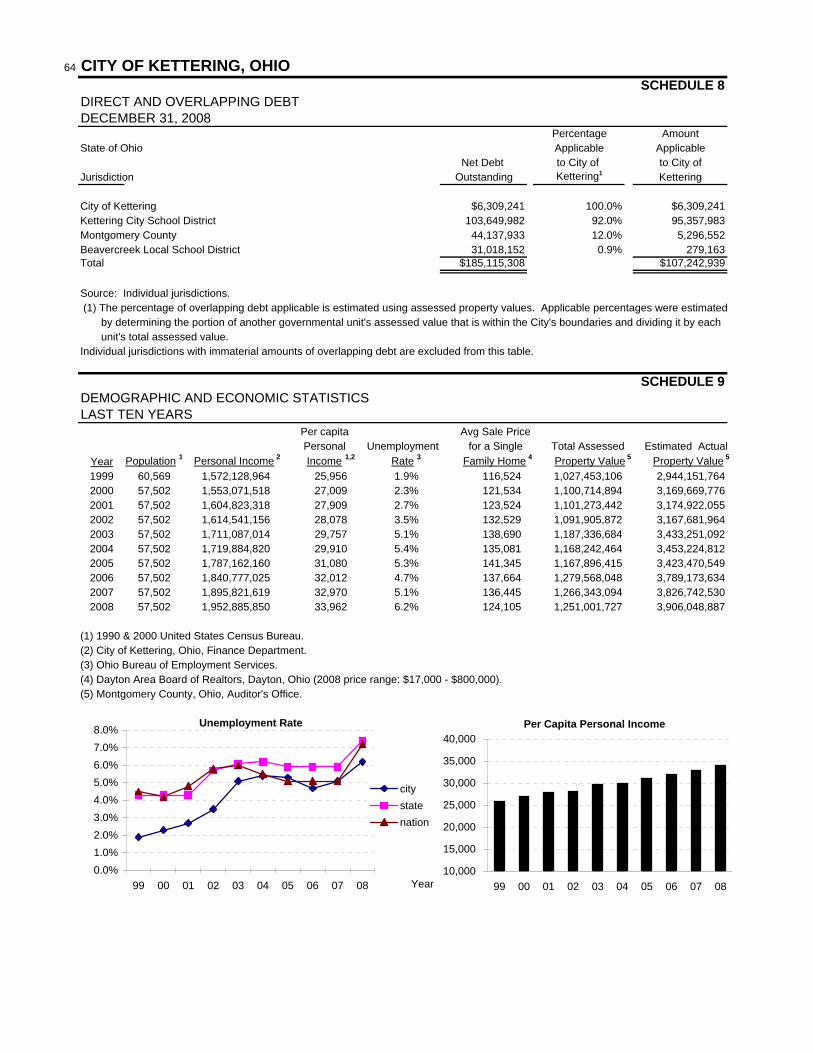
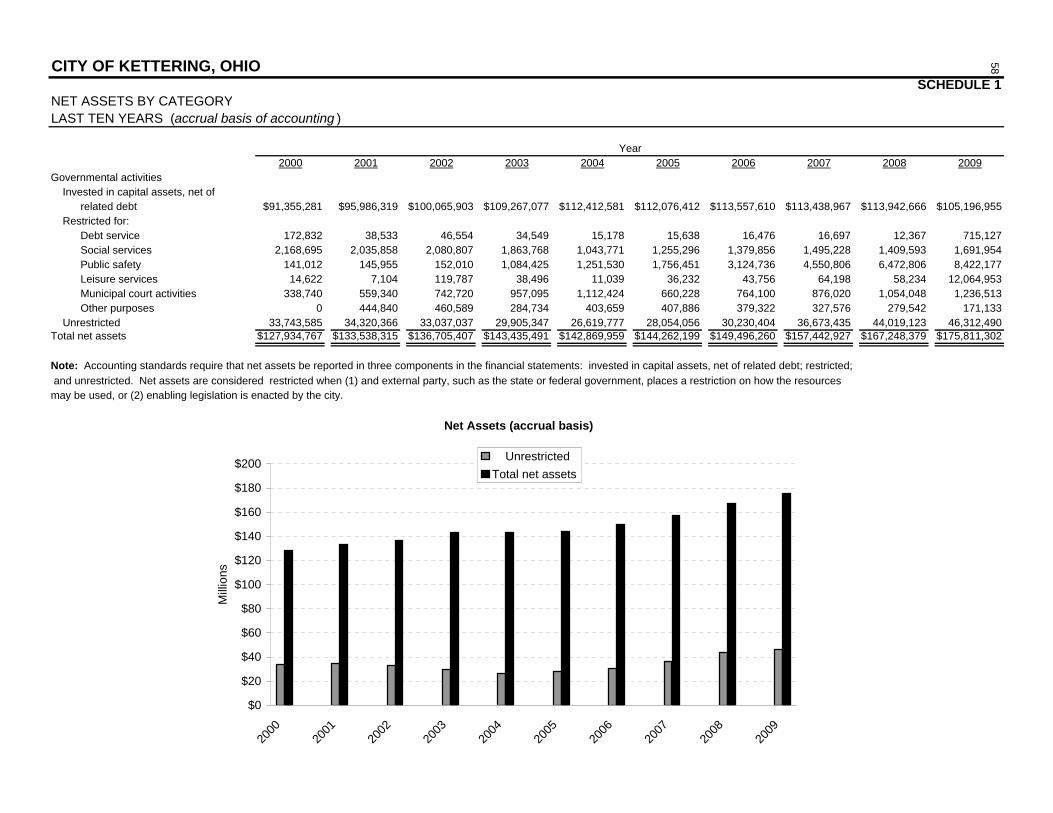
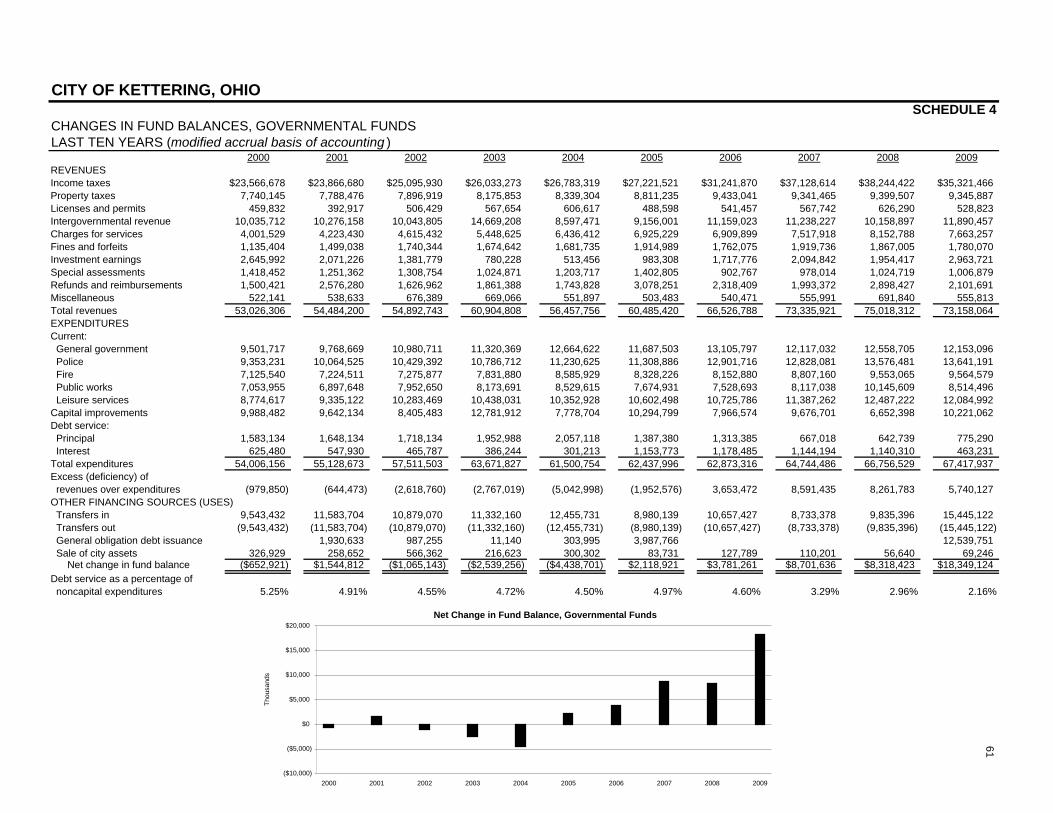
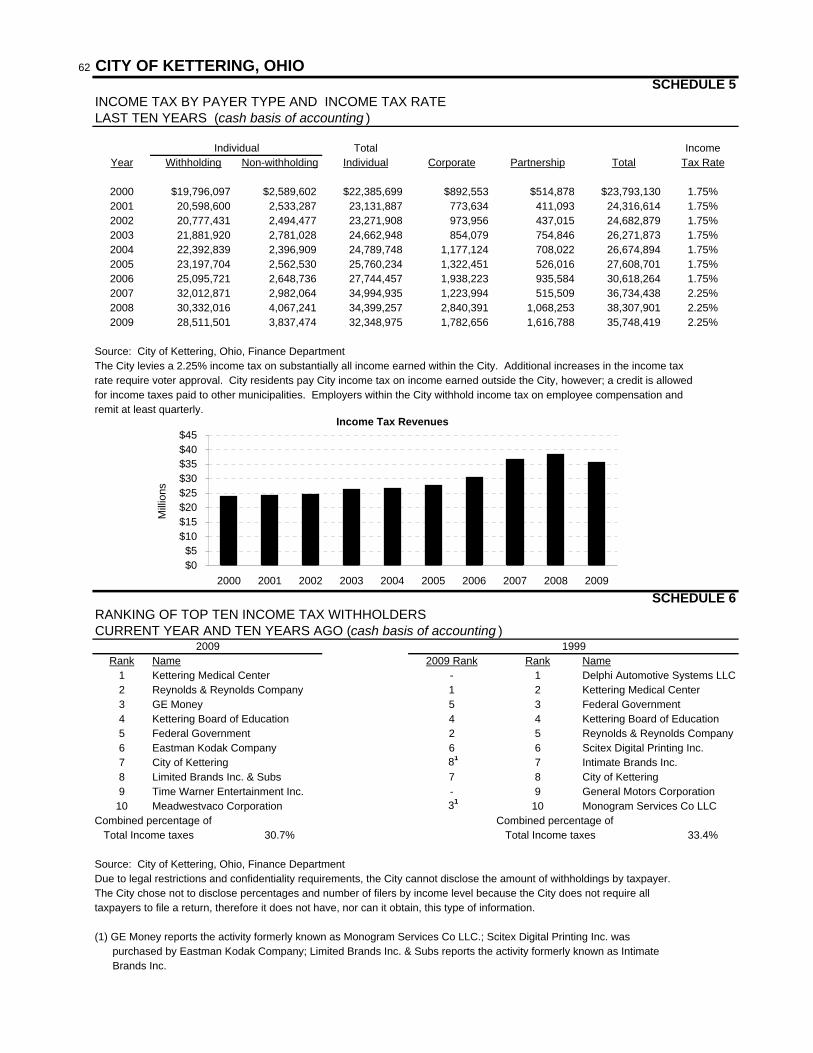
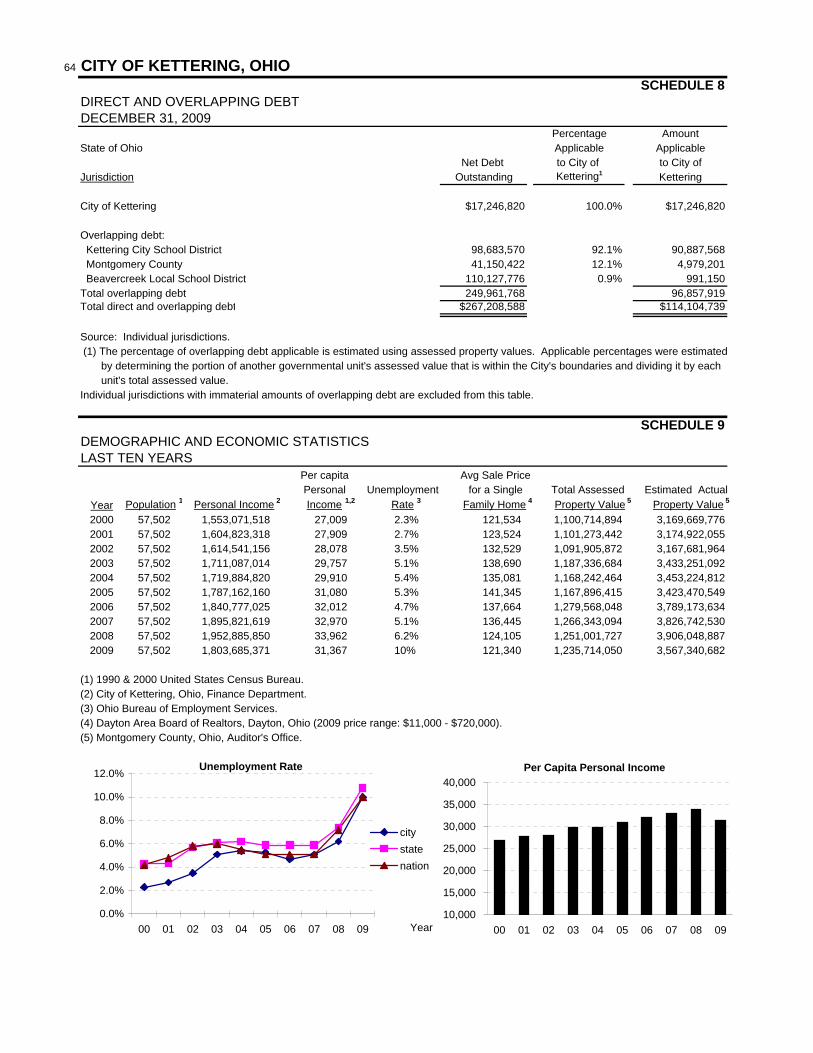
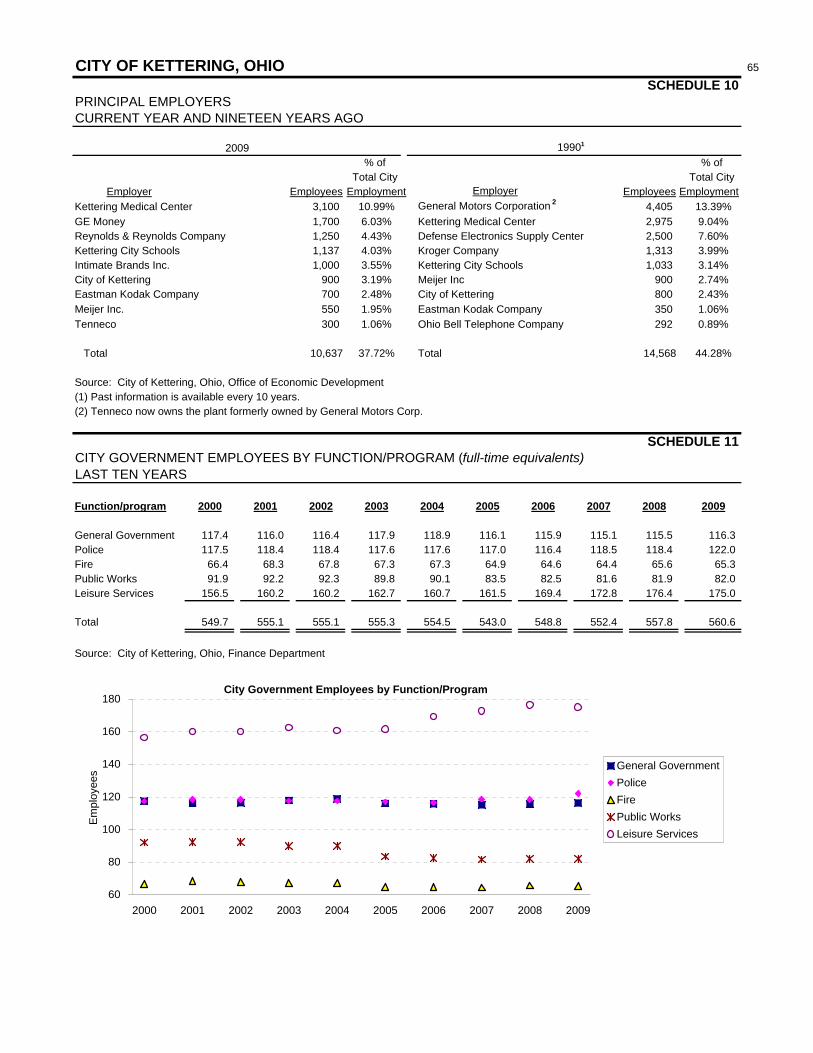
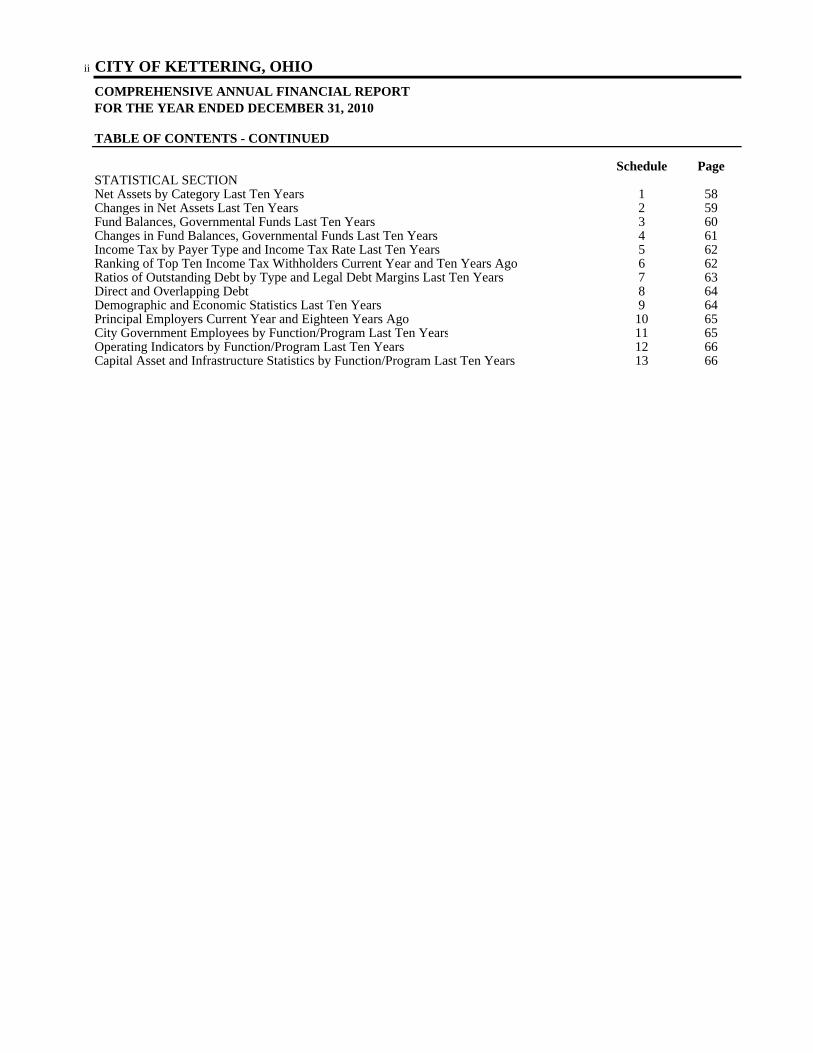
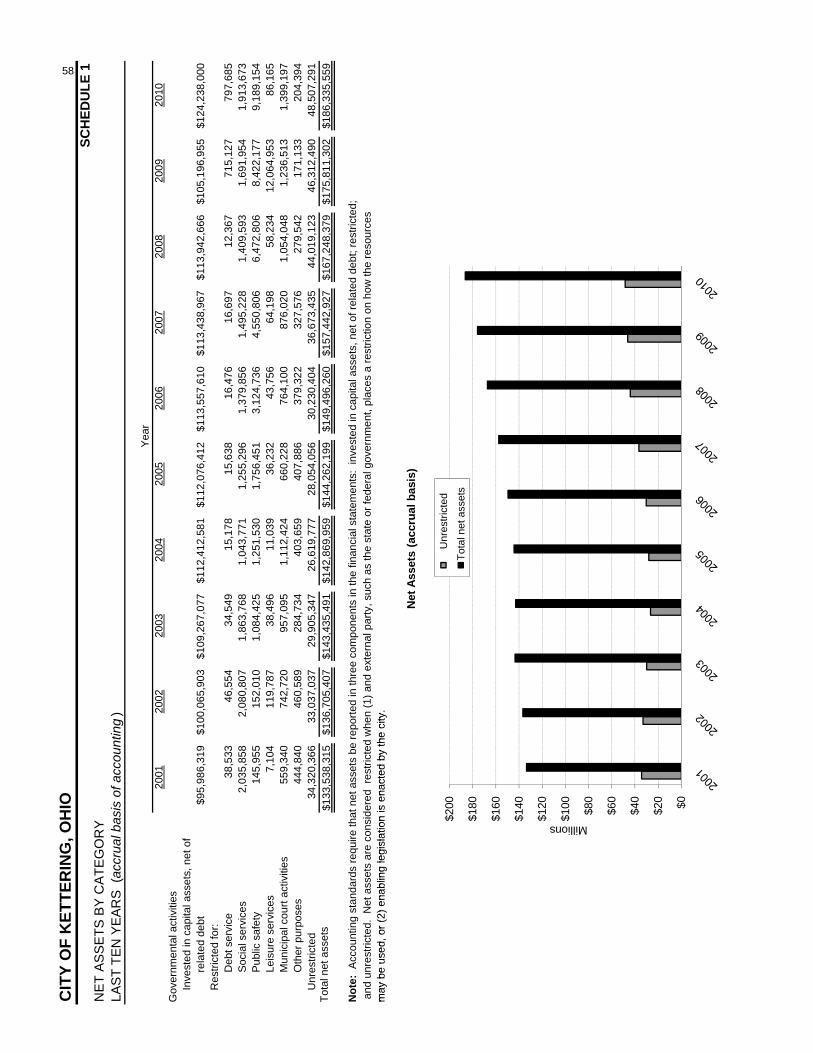
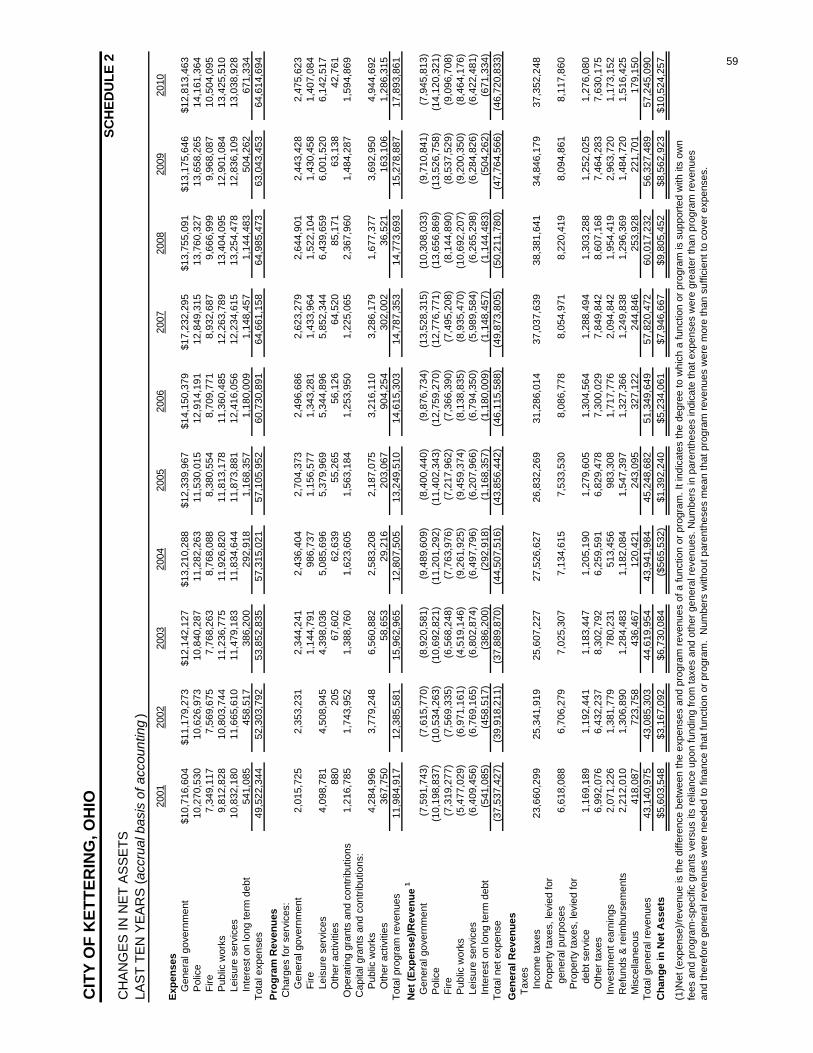
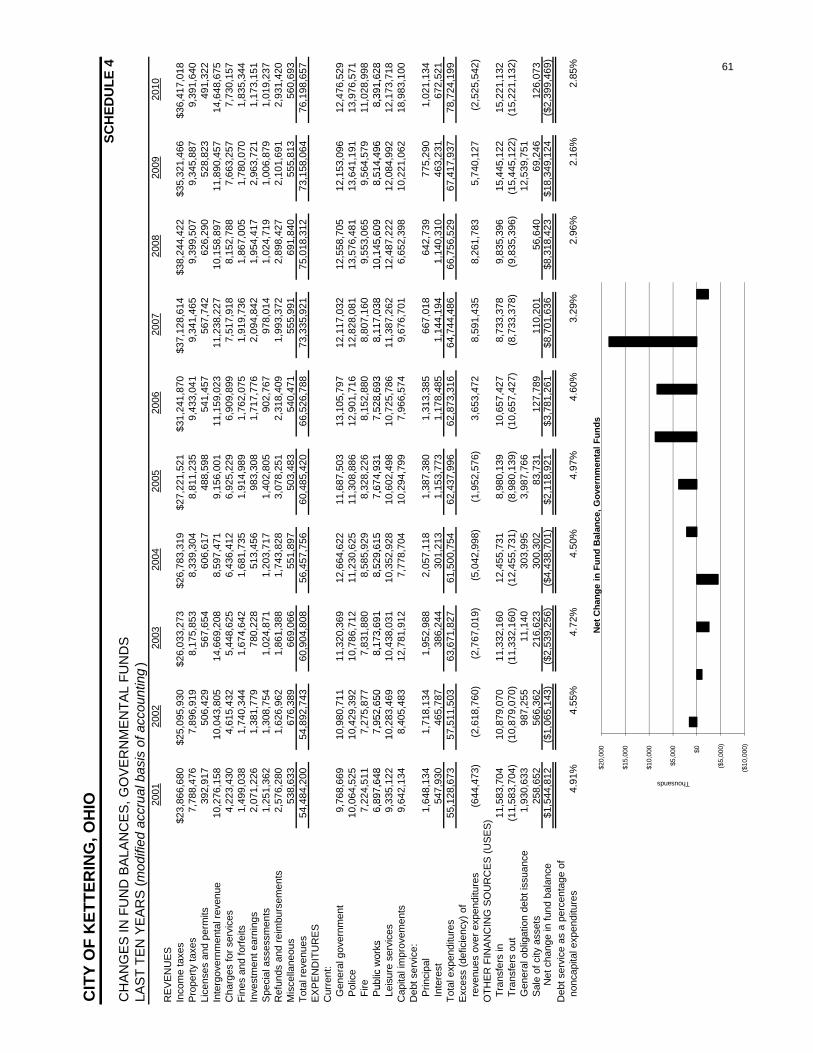
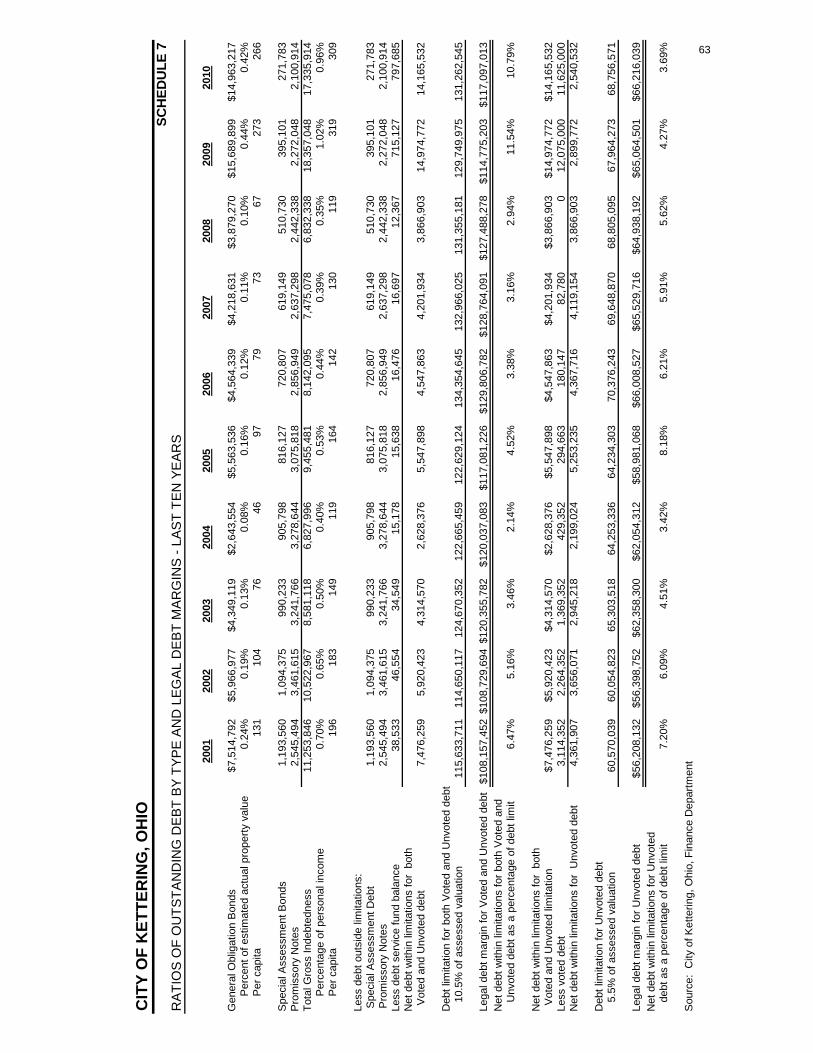
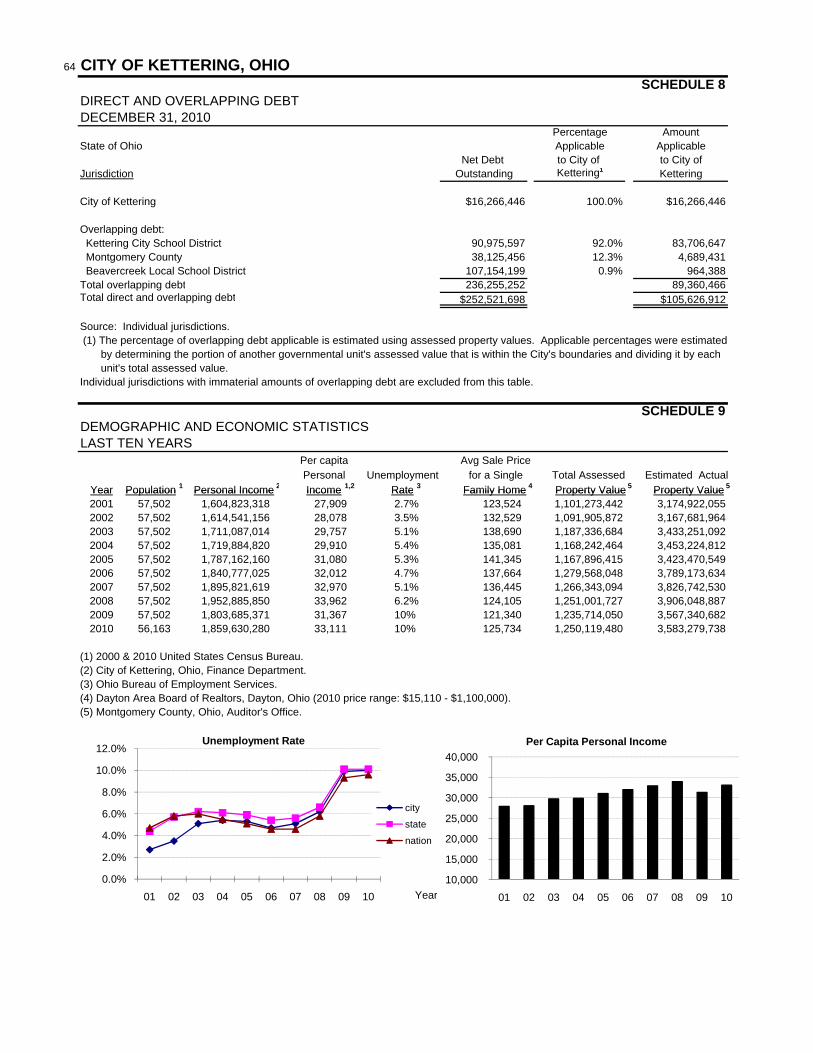
Schedule PageSTATISTICAL SECTIONNet Assets by Category Last Ten Years 1 58Changes in Net Assets Last Ten Years 2 59Fund Balances, Governmental Funds Last Ten Years 3 60Changes in Fund Balances, Governmental Funds Last Ten Years 4 61Income Tax by Payer Type and Income Tax Rate Last Ten Years 5 62Ranking of Top Ten Income Tax Withholders Current Year and Ten Years Ago 6 62Ratios of Outstanding Debt by Type and Legal Debt Margins Last Ten Years 7 63Direct and Overlapping Debt 8 64Demographic and Economic Statistics Last Ten Years 9 64Principal Employers Current Year and Eighteen Years Ago 10 65City Government Employees by Function/Program Last Ten Years 11 65Operating Indicators by Function/Program Last Ten Years 12 66Capital Asset and Infrastructure Statistics by Function/Program Last Ten Years 13 66
April 1, 2009 Honorable Mayor, Members of City Council and Citizens of Kettering, Ohio: The Comprehensive Annual Financial Report for the City of Kettering for the year ended December 31, 2008, is hereby submitted. Responsibility for the accuracy of the data and the completeness and fairness of the presentation including all disclosures, rests with the City. To the best of our knowledge and belief, the enclosed data are accurate in all material respects and are reported in a manner designed to present fairly the financial position and results of operations of the City. All disclosures necessary to enable the reader to gain an understanding of the City’s financial activities have been included. The City provides various services including police and fire protection, parks, recreation and cultural arts, street maintenance, planning, zoning and other general governmental services. The City does not maintain utility operations. In addition to general governmental activities, the City oversees the Kettering Volunteer Firefighters Pension Plan, and the activities of the Plan are included in the reporting entity. However, Montgomery County, Greene County, Beavercreek, Centerville, Kettering, Sugarcreek and West Carrollton School Districts, Miami Conservancy District, Miami Valley Regional Transit Authority, Ohio Police and Fire Pension Fund and the Ohio Public Employees Retirement System have not met the established criteria for inclusion in the reporting entity and are excluded from this report. In addition, the City is one of twenty local cities involved in a public entity risk pool, Miami Valley Risk Management Association, Inc. This separate entity does not meet the established criteria for inclusion in the reporting entity and, accordingly is not included in the City’s financial report. HISTORY AND BACKGROUND Kettering was established as a village in 1952. Three years later, it achieved City status, adopted a Home Rule Charter and approved the Council/Manager form of government. The City of Kettering was named for its most outstanding citizen, Charles F. Kettering, a well-known philanthropist and inventor.
Kettering invented the automotive self-starter, and the “Bug,” the world’s first robot plane. The City operates under a Council/Manager form of government with a Mayor and six City Council members elected on a non-partisan basis for a term of four years. Kettering is known as a leader in many areas of municipal government, including financial reporting, traffic system management, police services, parks, recreation and cultural arts programs, intergovernmental cooperation and successfully structured volunteer programs. Kettering citizens are known for their community spirit and involvement. In fact, Kettering is commonly known as the “City of Volunteers.” The quality of living in any city can be measured best by the satisfaction of the residents with the services they receive. In Kettering, people like what they find. A recent survey showed that 98% of residents are satisfied with Kettering as a place to live. In 2008, Business Week magazine named Kettering the second best city in Ohio to raise a family. ECONOMIC CONDITION AND OUTLOOK The economic environment for Kettering’s business community continued to be one of relative stability during 2008. One significant contributing factor to this stability is the diversity of the employment base in Kettering. This business base ranges from some major employers headquartered in Kettering to many midsize companies specializing in technology or professional services down to smaller family owned businesses. Kettering’s largest employers include Kettering Medical Center (KMC) and Reynolds & Reynolds. KMC employs 3,100 and broke ground in 2008 for the Schuster Heart Hospital which will be a 114,000 sq ft addition to the front of the facility. The new Heart Hospital will be a state of the art facility containing ninety private rooms. KMC anticipates completion in 2011. Reynolds & Reynolds, a fortune 1000 company based in Dayton since 1866, has transitioned nicely following the merger with Universal Computer Systems (UCS) in 2006. The company moved 400 Technical Assistance Center employees to their Kettering headquarters during
iv
2008. Employment now exceeds pre-merger levels of 1,200 with total employees of 1,500 at the Miami Valley Research Park campus. In addition, Reynolds and Reynolds is investing $20 million in the construction of a 15,000 square foot Data Center. After announcing plans in 2005 to expand the Kettering operations, G E Money completed interior renovations at their Kettering Business Park (KBP) location. The company moved an additional 536 jobs to KBP and now employs 1,700 at this location. Community Tissue Services announced at the end of 2008 plans to construct a 50,000 square foot office and tissue processing facility at the Miami Valley Research Park. It will result in a $30 million investment and starting employment of about 175 employees. Other major employers in the city include Kettering City Schools, Limited Brands Inc., a catalogue order center for Victoria’s Secret, Kodak Versamark a manufacturer of digital printers, and a number of engineering firms and computer hardware and software related businesses. Despite being practically landlocked, Kettering continued to move forward in terms of new economic development. During 2008 private development of the former Groby’s Garden Center site began. The new development, Charlotte’s Garden, had its first business ribbon cutting as First Financial Bank celebrated its opening. The development is a mix of retail and will soon include Dewey’s Pizza and Chipotle Mexican Grill. The residential portion of the redevelopment of Kettering Pointe, formerly the Van Buren Shopping Center, continued during 2008. An additional five new single-family patio homes were built at the Villas of Kettering Pointe. Phase 3 of Madison’s Grant, a Ryan Homes housing development, is now underway. Twenty-nine single-family homes were built during 2008. Madison’s Grant will include 150 new homes when the development is complete. One significant accomplishment in 2008 that will result in long term improvements to City parks and recreation facilities was the passage of the Parks and Recreation Bond Levy. Property tax revenues generated by a 1988 voted bond issue paid for the debt service on Recreation Center and outdoor water park improvements completed in 1993. That bond issue matured on December 31, 2008. After conducting public surveys, Kettering elected officials made the decision to ask the voters to consider a new bond levy on the November 2008 ballot. The voters said yes to the new $12.3 million levy with the debt service to be paid from property tax revenues beginning in 2009. In addition to the $12.3 million voted levy, the City has committed an additional $5
million of City funds for a total investment of $17.3 million. The improvements are scheduled to be complete by the end of 2011. Kettering participates in ED/GE, a revenue sharing program that occurs among a number of communities in Montgomery County. Money from the program is distributed to the communities for economic development projects after an application for funds is filed and a board of local officials for the communities reviews and approves the projects. Although Kettering did not receive any funds for 2008, the City has benefited significantly in the past and will continue to apply for future funds as eligible opportunities become available. The City’s emphasis on economic development combined with the existing variety of businesses located within Kettering are significant factors affecting the future economic strength of this community. Promoting Kettering as a good place to do business for new businesses, as well as existing businesses, will continue to be one of our highest priorities. For a more in-depth analysis of the City's current economic condition, please see the Management Discussion and Analysis (MD&A) portion of the report starting on page 5 of the Financial Section. ACCOUNTING SYSTEM AND BUDGETARY CONTROL Management of the City is responsible for establishing and maintaining an internal control structure designed to ensure that the assets of the City are protected from loss, theft or misuse and to ensure that adequate accounting data are compiled to allow for the preparation of financial statements in conformity with generally accepted accounting principles. The internal control structure is designed to provide reasonable, but not absolute, assurance that these objectives are met. The concept of reasonable assurance recognizes that the cost of controls should not exceed the benefits likely to be derived, and the evaluation of costs and benefits requires estimates and judgments by management. Budgetary Controls. The City maintains budgetary controls to ensure compliance with legal provisions embodied in the annual appropriated budget approved by City Council. Activities of the General Fund, Special Revenue Funds, the Debt Service Fund and the Capital Projects Fund are included in the annual appropriated budget. For more detailed budget
v
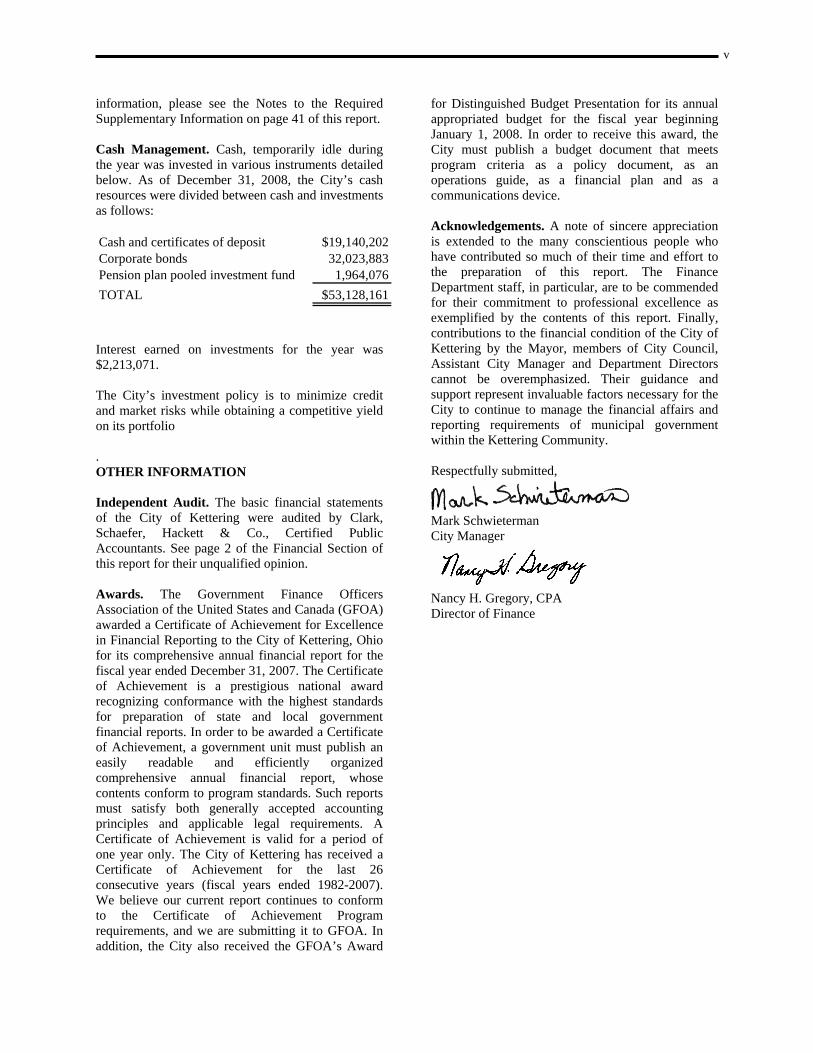
information, please see the Notes to the Required Supplementary Information on page 41 of this report. Cash Management. Cash, temporarily idle during the year was invested in various instruments detailed below. As of December 31, 2008, the City’s cash resources were divided between cash and investments as follows: Cash and certificates of deposit $19,140,202Corporate bonds 32,023,883Pension plan pooled investment fund 1,964,076TOTAL $53,128,161
Interest earned on investments for the year was $2,213,071. The City’s investment policy is to minimize credit and market risks while obtaining a competitive yield on its portfolio . OTHER INFORMATION Independent Audit. The basic financial statements of the City of Kettering were audited by Clark, Schaefer, Hackett & Co., Certified Public Accountants. See page 2 of the Financial Section of this report for their unqualified opinion. Awards. The Government Finance Officers Association of the United States and Canada (GFOA) awarded a Certificate of Achievement for Excellence in Financial Reporting to the City of Kettering, Ohio for its comprehensive annual financial report for the fiscal year ended December 31, 2007. The Certificate of Achievement is a prestigious national award recognizing conformance with the highest standards for preparation of state and local government financial reports. In order to be awarded a Certificate of Achievement, a government unit must publish an easily readable and efficiently organized comprehensive annual financial report, whose contents conform to program standards. Such reports must satisfy both generally accepted accounting principles and applicable legal requirements. A Certificate of Achievement is valid for a period of one year only. The City of Kettering has received a Certificate of Achievement for the last 26 consecutive years (fiscal years ended 1982-2007). We believe our current report continues to conform to the Certificate of Achievement Program requirements, and we are submitting it to GFOA. In addition, the City also received the GFOA’s Award
for Distinguished Budget Presentation for its annual appropriated budget for the fiscal year beginning January 1, 2008. In order to receive this award, the City must publish a budget document that meets program criteria as a policy document, as an operations guide, as a financial plan and as a communications device. Acknowledgements. A note of sincere appreciation is extended to the many conscientious people who have contributed so much of their time and effort to the preparation of this report. The Finance Department staff, in particular, are to be commended for their commitment to professional excellence as exemplified by the contents of this report. Finally, contributions to the financial condition of the City of Kettering by the Mayor, members of City Council, Assistant City Manager and Department Directors cannot be overemphasized. Their guidance and support represent invaluable factors necessary for the City to continue to manage the financial affairs and reporting requirements of municipal government within the Kettering Community. Respectfully submitted,
Mark Schwieterman City Manager
Nancy H. Gregory, CPA Director of Finance
vi
CITY OF KETTERING, OHIO
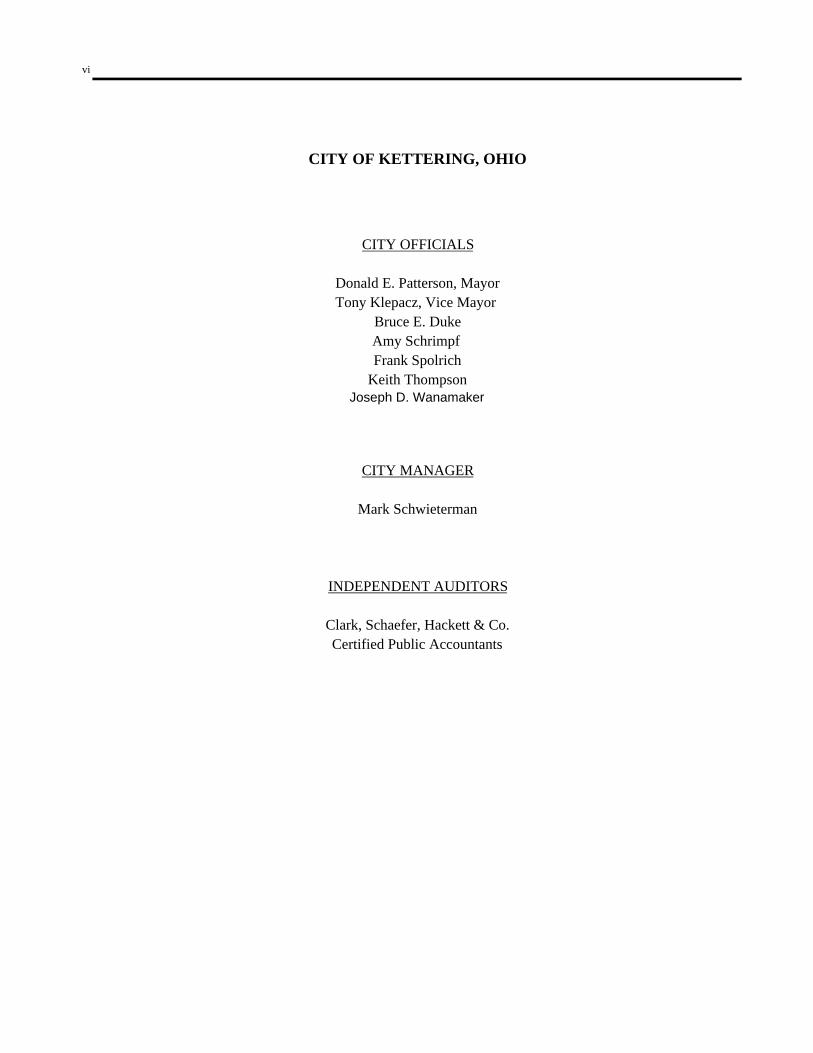
CITY OFFICIALS
Donald E. Patterson, MayorJoseph D. Wanamaker, Vice Mayor
Bruce E. Duke
Peggy B. Lehner (resigned 11/16/08)
Frank SpolrichKeith Thompson
CITY MANAGER
Mark Schwieterman
INDEPENDENT AUDITORS
Clark, Schaefer, Hackett & Co.Certified Public Accountants
Tony Klepacz
Amy Schrimpf (appointed 12/19/08)
vii
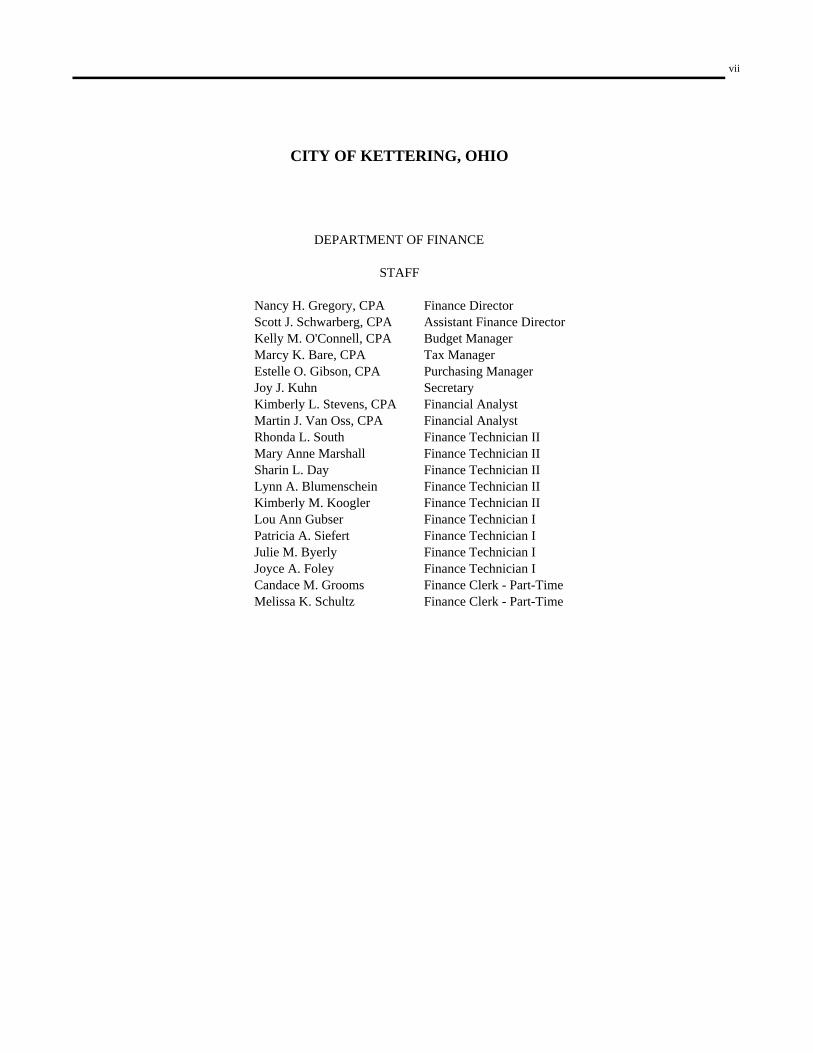
CITY OF KETTERING, OHIO
DEPARTMENT OF FINANCE
STAFF
Nancy H. Gregory, CPA Finance DirectorScott J. Schwarberg, CPA Assistant Finance DirectorKelly M. O'Connell, CPA Budget ManagerMarcy K. Bare, CPA Tax ManagerEstelle O. Gibson, CPA Purchasing ManagerJoy J. Kuhn SecretaryKimberly L. Kreitzer, CPA Financial AnalystMartin J. Van Oss, CPA Financial AnalystRhonda L. South Finance Technician IIMary Anne Marshall Finance Technician IISharin L. Day Finance Technician IILynn A. Blumenschein Finance Technician IIThomas M. Zamzow Finance Technician IIKimberly M. Koogler Finance Technician IILou Ann Gubser Finance Technician I Patricia A. Siefert Finance Technician I Julie M. Byerly Finance Technician I Joyce A. Foley Finance Technician I Candace M. Grooms Finance Clerk - Part-TimeMelissa K. Schultz Finance Clerk - Part-Time
viii
ix
FINANCIAL SECTION
2525 north limestone street, ste. 103 springfield, oh 45503
www.cshco.comp. 937.399.2000 f. 937.399.5433
cincinnati | columbus | dayton | middletown | springfield
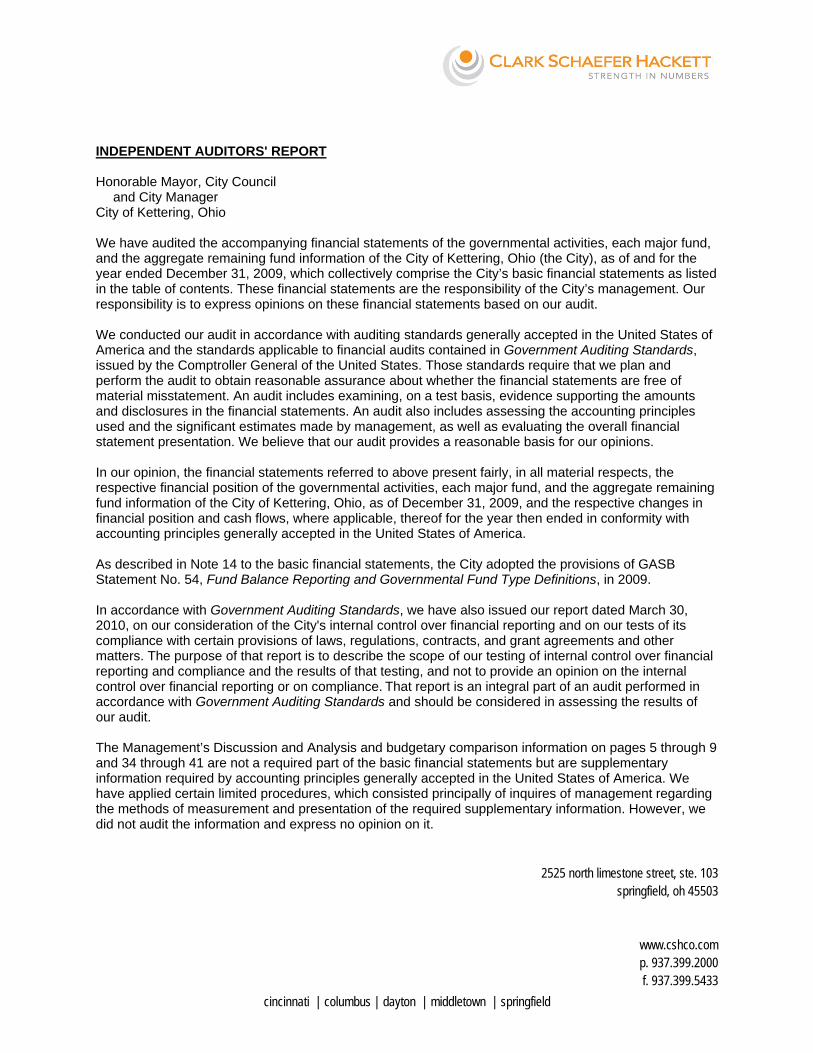
INDEPENDENT AUDITORS' REPORT
Honorable Mayor, City Council and City Manager City of Kettering, Ohio
We have audited the accompanying financial statements of the governmental activities, each major fund, and the aggregate remaining fund information of the City of Kettering, Ohio, as of and for the year ended December 31, 2008, which collectively comprise the City’s basic financial statements as listed in the table of contents. These financial statements are the responsibility of the City of Kettering’s management. Our responsibility is to express opinions on these financial statements based on our audit.
We conducted our audit in accordance with auditing standards generally accepted in the United States of America and the standards applicable to financial audits contained in Government Auditing Standards,issued by the Comptroller General of the United States. Those standards require that we plan and perform the audit to obtain reasonable assurance about whether the financial statements are free of material misstatement. An audit includes examining, on a test basis, evidence supporting the amounts and disclosures in the financial statements. An audit also includes assessing the accounting principles used and the significant estimates made by management, as well as evaluating the overall financial statement presentation. We believe that our audit provides a reasonable basis for our opinions.
In our opinion, the financial statements referred to above present fairly, in all material respects, the respective financial position of the governmental activities, each major fund, and the aggregate remaining fund information of the City of Kettering, Ohio, as of December 31, 2008, and the respective changes in financial position and cash flows, where applicable, thereof for the year then ended in conformity with accounting principles generally accepted in the United States of America.
In accordance with Government Auditing Standards, we have also issued our report dated April 1, 2009 on our consideration of the City of Kettering's internal control over financial reporting and on our tests of its compliance with certain provisions of laws, regulations, contracts, and grant agreements and other matters. The purpose of that report is to describe the scope of our testing of internal control over financial reporting and compliance and the results of that testing, and not to provide an opinion on the internal control over financial reporting or on compliance. That report is an integral part of an audit performed in accordance with Government Auditing Standards and should be considered in assessing the results of our audit.
The Management’s Discussion and Analysis and budgetary comparison information on pages 5 through 9 and 34 through 41 are not a required part of the basic financial statements but are supplementary information required by accounting principles generally accepted in the United States of America. Wehave applied certain limited procedures, which consisted principally of inquiries of management regarding the methods of measurement and presentation of the required supplementary information. However, we did not audit the information and express no opinion on it.
Our audit was conducted for the purpose of forming opinions on the financial statements that collectively comprise the City of Kettering’s basic financial statements. The introductory section, combining and individual nonmajor fund financial statements, the schedule of bonds and notes, and statistical tables are presented for purposes of additional analysis and are not a required part of the basic financial statements. The combining and individual nonmajor fund financial statements and the schedule of bonds and notes have been subjected to the auditing procedures applied in the audit of the basic financial statements and, in our opinion, are fairly stated in all material respects in relation to the basic financial statements taken as a whole. The introductory section and statistical tables have not been subjected to the auditing procedures applied in the audit of the basic financial statements and, accordingly, we express no opinion on them.
Springfield, Ohio April 1, 2009
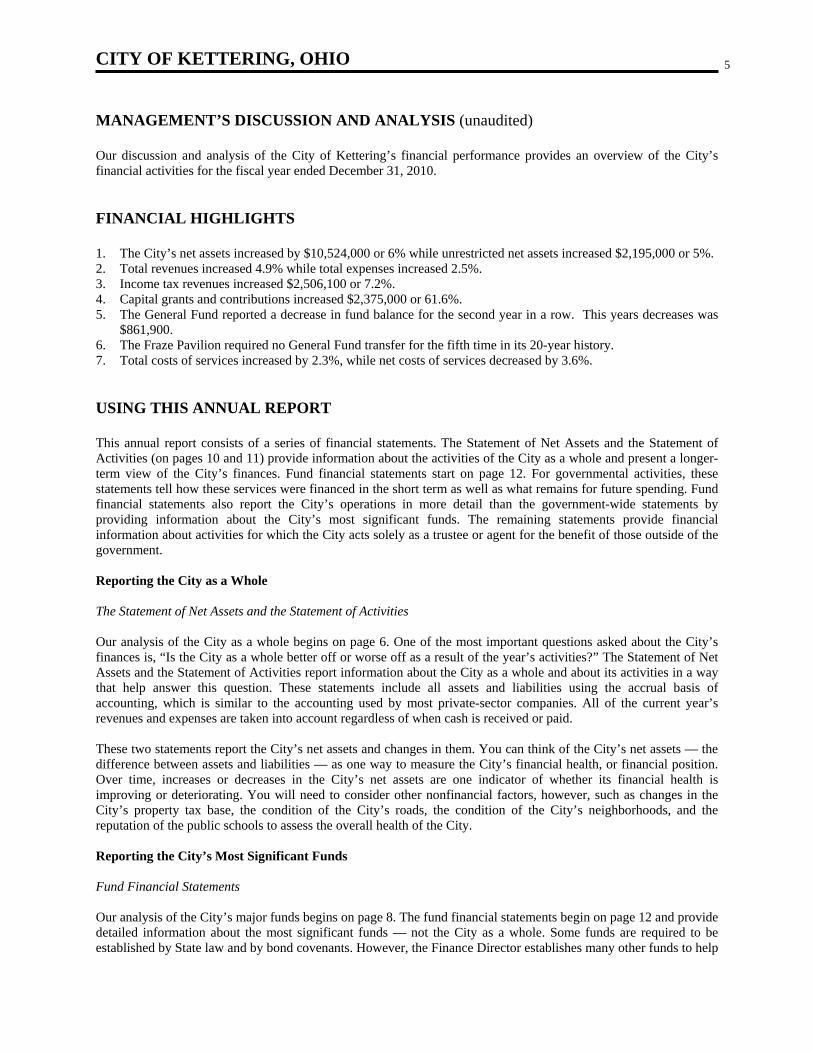
CITY OF KETTERING, OHIO 5
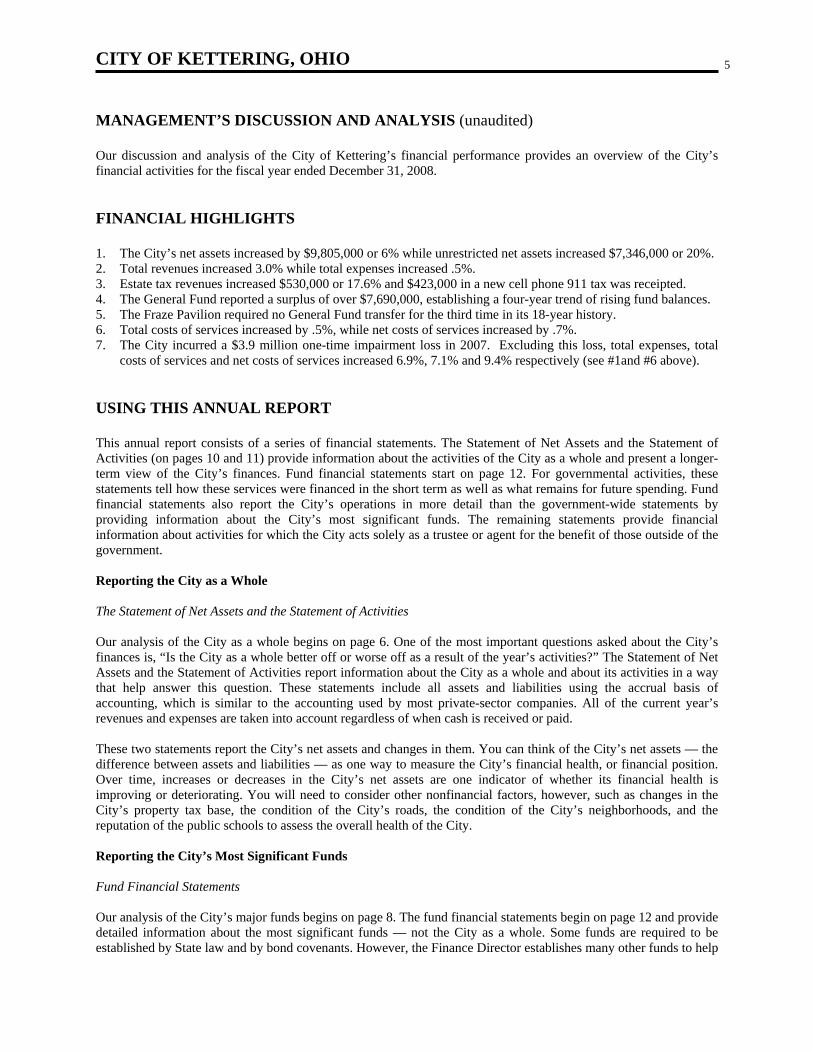
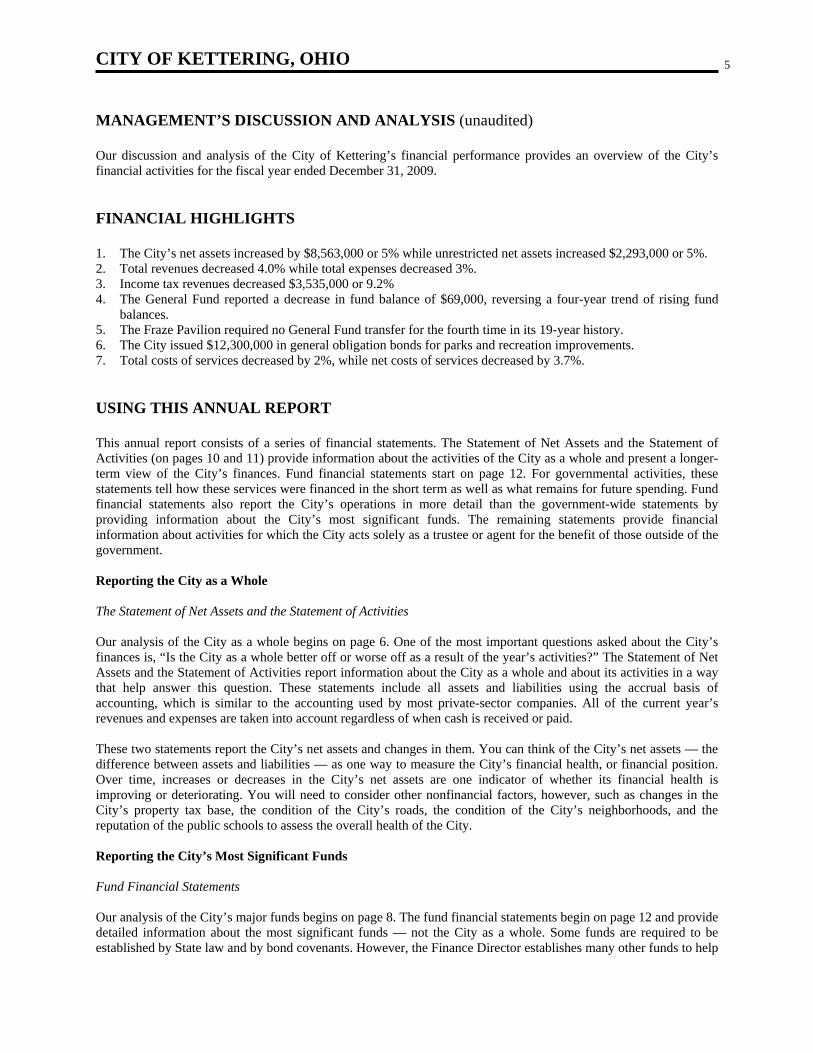
MANAGEMENT’S DISCUSSION AND ANALYSIS (unaudited) Our discussion and analysis of the City of Kettering’s financial performance provides an overview of the City’s financial activities for the fiscal year ended December 31, 2008. FINANCIAL HIGHLIGHTS 1. The City’s net assets increased by $9,805,000 or 6% while unrestricted net assets increased $7,346,000 or 20%. 2. Total revenues increased 3.0% while total expenses increased .5%. 3. Estate tax revenues increased $530,000 or 17.6% and $423,000 in a new cell phone 911 tax was receipted. 4. The General Fund reported a surplus of over $7,690,000, establishing a four-year trend of rising fund balances. 5. The Fraze Pavilion required no General Fund transfer for the third time in its 18-year history. 6. Total costs of services increased by .5%, while net costs of services increased by .7%. 7. The City incurred a $3.9 million one-time impairment loss in 2007. Excluding this loss, total expenses, total
costs of services and net costs of services increased 6.9%, 7.1% and 9.4% respectively (see #1and #6 above). USING THIS ANNUAL REPORT This annual report consists of a series of financial statements. The Statement of Net Assets and the Statement of Activities (on pages 10 and 11) provide information about the activities of the City as a whole and present a longer-term view of the City’s finances. Fund financial statements start on page 12. For governmental activities, these statements tell how these services were financed in the short term as well as what remains for future spending. Fund financial statements also report the City’s operations in more detail than the government-wide statements by providing information about the City’s most significant funds. The remaining statements provide financial information about activities for which the City acts solely as a trustee or agent for the benefit of those outside of the government. Reporting the City as a Whole The Statement of Net Assets and the Statement of Activities Our analysis of the City as a whole begins on page 6. One of the most important questions asked about the City’s finances is, “Is the City as a whole better off or worse off as a result of the year’s activities?” The Statement of Net Assets and the Statement of Activities report information about the City as a whole and about its activities in a way that help answer this question. These statements include all assets and liabilities using the accrual basis of accounting, which is similar to the accounting used by most private-sector companies. All of the current year’s revenues and expenses are taken into account regardless of when cash is received or paid. These two statements report the City’s net assets and changes in them. You can think of the City’s net assets — the difference between assets and liabilities — as one way to measure the City’s financial health, or financial position. Over time, increases or decreases in the City’s net assets are one indicator of whether its financial health is improving or deteriorating. You will need to consider other nonfinancial factors, however, such as changes in the City’s property tax base, the condition of the City’s roads, the condition of the City’s neighborhoods, and the reputation of the public schools to assess the overall health of the City. Reporting the City’s Most Significant Funds Fund Financial Statements Our analysis of the City’s major funds begins on page 8. The fund financial statements begin on page 12 and provide detailed information about the most significant funds — not the City as a whole. Some funds are required to be established by State law and by bond covenants. However, the Finance Director establishes many other funds to help
6
control and manage money for particular purposes or to show that the City is meeting legal responsibilities for using certain taxes, grants, and other money (like grants received from the U.S. Department of Housing and Urban Development). The City’s two kinds of funds — governmental and proprietary — use different accounting approaches. • Governmental funds — Most of the City’s basic services are reported in governmental funds, which focus on
how money flows into and out of those funds and the balances left at year-end that are available for spending. These funds are reported using an accounting method called modified accrual accounting, which measures cash and all other financial assets that can readily be converted to cash. The governmental fund statements provide a detailed short-term view of the City’s general government operations and the basic services it provides. Governmental fund information helps you determine whether there are more or fewer financial resources that can be spent in the near future to finance the City’s programs. The relationship (or differences) between governmental activities (reported in the Statement of Net Assets and the Statement of Activities) and governmental funds is described in a reconciliation at the bottom of the fund financial statements.
• Proprietary funds — The City uses internal service funds (a component of proprietary funds) to report activities that provide supplies and services for the City’s other programs and activities. An example of an internal service fund would be the City’s Administrative Operations Fund, which accounts for activities of the Vehicle Maintenance Center, the Print Shop, and others. Proprietary funds are reported in the same way that all activities are reported in the Statement of Net Assets and the Statement of Activities.
The City as Trustee Reporting the City’s Fiduciary Responsibilities The City is the trustee, or fiduciary, for its volunteer firefighters pension plan. It is also responsible for other assets that — because of a trust arrangement — can be used only for the trust beneficiaries. All of the City’s fiduciary activities are reported in separate Statements of Fiduciary Net Assets and Changes in Fiduciary Net Assets on page 19. We exclude these activities from the City’s other financial statements because the City cannot use these assets to finance its operations. The City is responsible for ensuring that the assets reported in these funds are used for their intended purposes. THE CITY AS A WHOLE For 2008 the City produced a 6.2% increase in total net assets. This compares with a 5.3% increase in 2007. Revenues generated were $74.8 million and expenses from all programs were $65.0 million resulting in a surplus for the year of $9,805,000. The unrestricted net assets — the part of net assets that can be used to finance day-to-day operations without constraints established by debt covenants, enabling legislation, or other legal requirements — increased $7,346,000. Explanations for the larger fluctuations between years are as follows: • Federal grant revenue was lower in 2008 primarily due to the end of construction on federally funded roadway
projects. • State grant revenue was higher this year because of state funding for roadway projects. • Other taxes increased because of an increase in estate taxes and new revenues collected from a state tax on cell
phone users to support emergency 911 expenses. • General government expenses decreased 20.2% because of a 2007 impairment loss. This one time loss came
from the demolition of a building previously used for storage. Without this loss in 2007 General government expenses would have increased 3.1%.
7
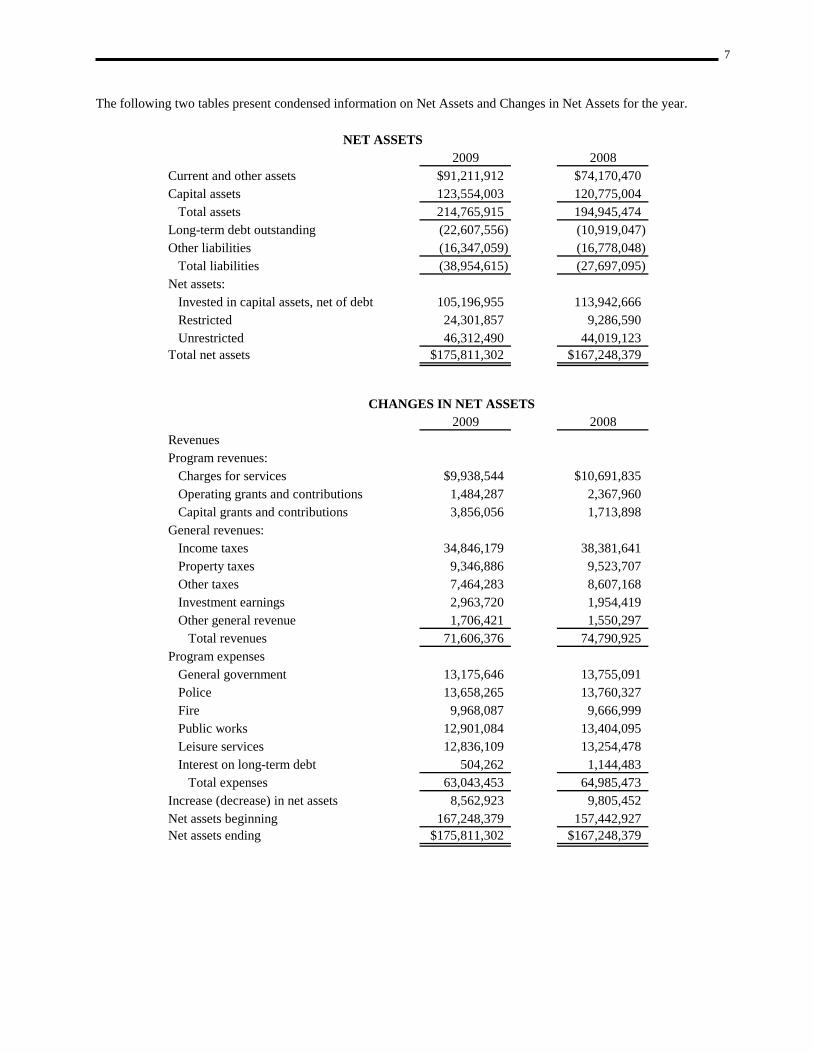
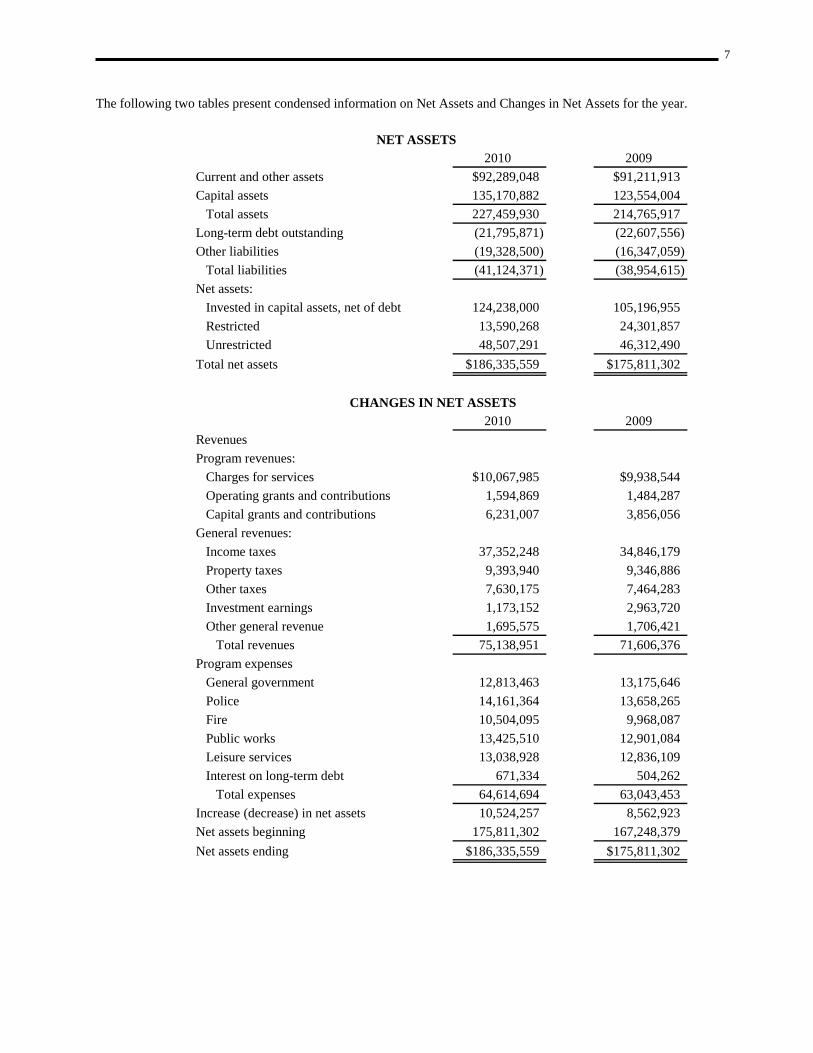
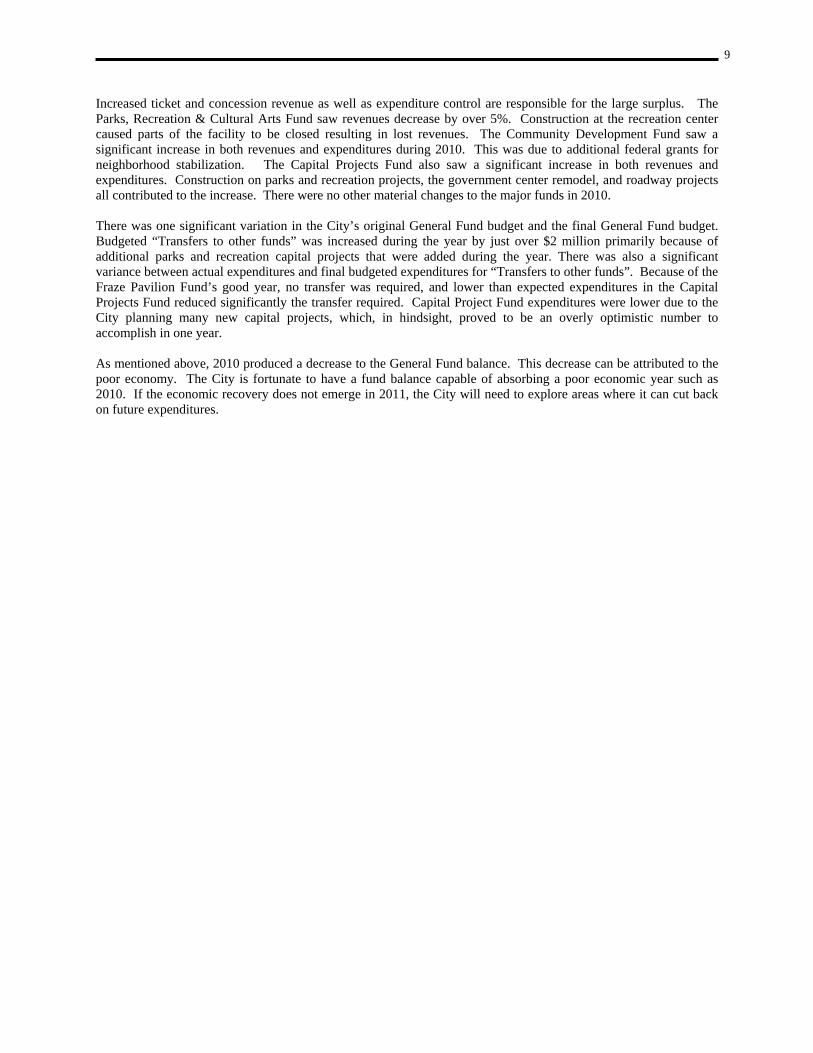
The following two tables present condensed information on Net Assets and Changes in Net Assets for the year.
NET ASSETS2008 2007
Current and other assets $74,170,470 $64,494,515Capital assets 120,775,004 120,914,044 Total assets 194,945,474 185,408,559Long-term debt outstanding (10,919,047) (11,399,399)Other liabilities (16,778,048) (16,566,233) Total liabilities (27,697,095) (27,965,632)Net assets: Invested in capital assets, net of debt 113,942,666 113,438,967 Restricted 9,286,590 7,330,525 Unrestricted 44,019,123 36,673,435Total net assets $167,248,379 $157,442,927
CHANGES IN NET ASSETS2008 2007
Revenues Program revenues: Charges for services $10,691,835 $9,974,107 Federal grants 1,820,313 2,756,749 State and local grants 773,954 621,004 Special assessments 1,024,719 978,014 Sponsorships and contributions 462,872 457,479General revenues: Income taxes 38,381,641 37,037,639 Property taxes 9,523,707 9,343,465 Other taxes 8,607,168 7,849,842 Investment earnings 1,954,419 2,094,842 Other general revenue 1,550,297 1,494,684 Total revenues 74,790,925 72,607,825Program expenses General government 13,755,091 17,232,295 Police 13,760,327 12,849,315 Fire 9,666,999 8,932,687 Public works 13,404,095 12,263,789 Leisure services 13,254,478 12,234,615 Interest on long-term debt 1,144,483 1,148,457 Total expenses 64,985,473 64,661,158Increase (decrease) in net assets 9,805,452 7,946,667Net assets beginning 157,442,927 149,496,260Net assets ending $167,248,379 $157,442,927
8
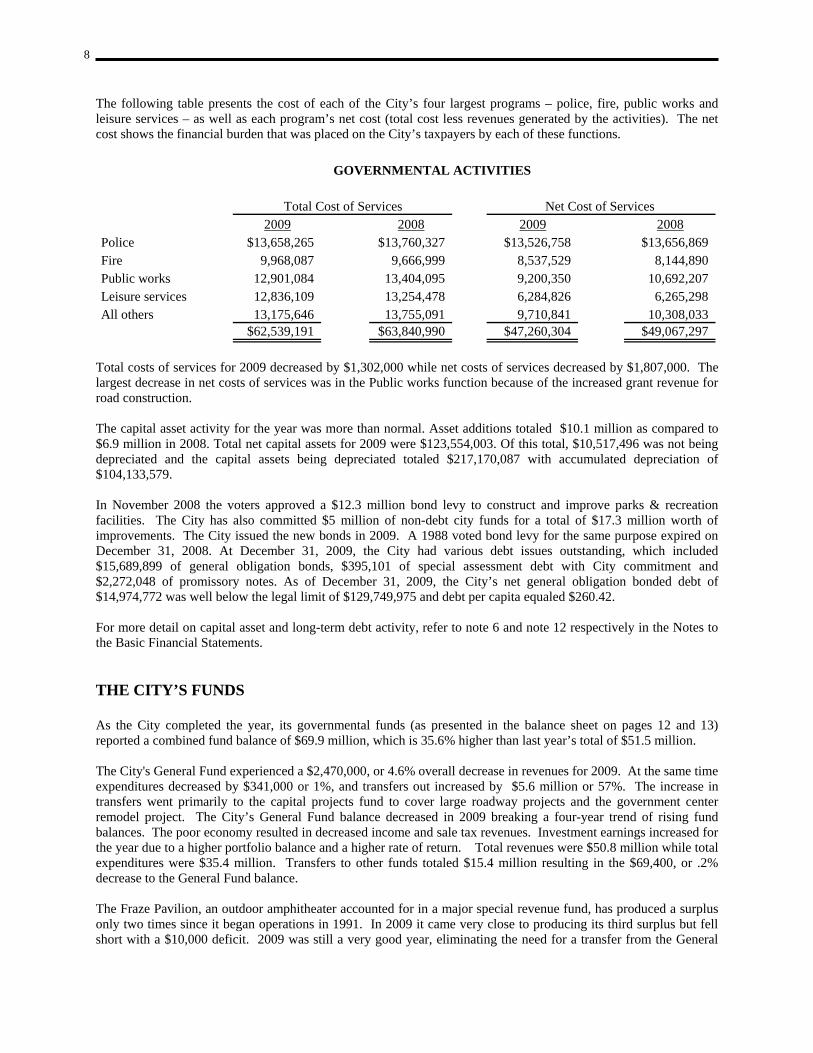
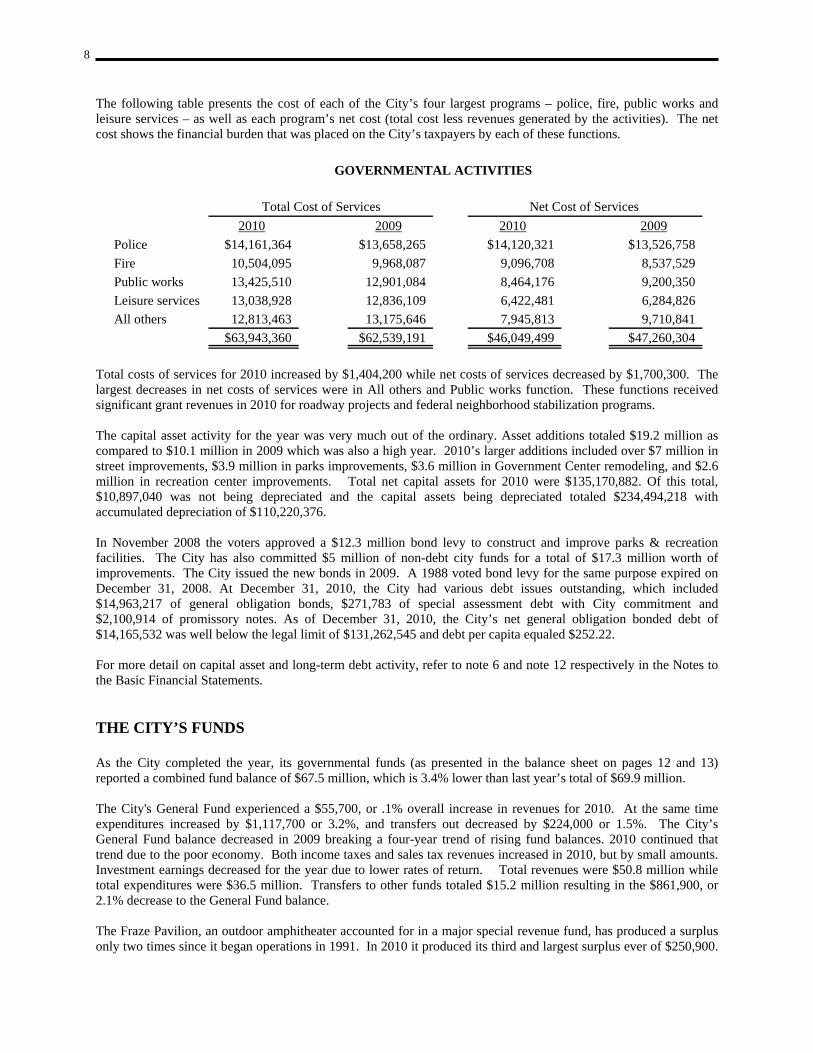
The following table presents the cost of each of the City’s four largest programs – police, fire, public works and leisure services – as well as each program’s net cost (total cost less revenues generated by the activities). The net cost shows the financial burden that was placed on the City’s taxpayers by each of these functions.
GOVERNMENTAL ACTIVITIES
Total Cost of Services Net Cost of Services 2008 2007 2008 2007
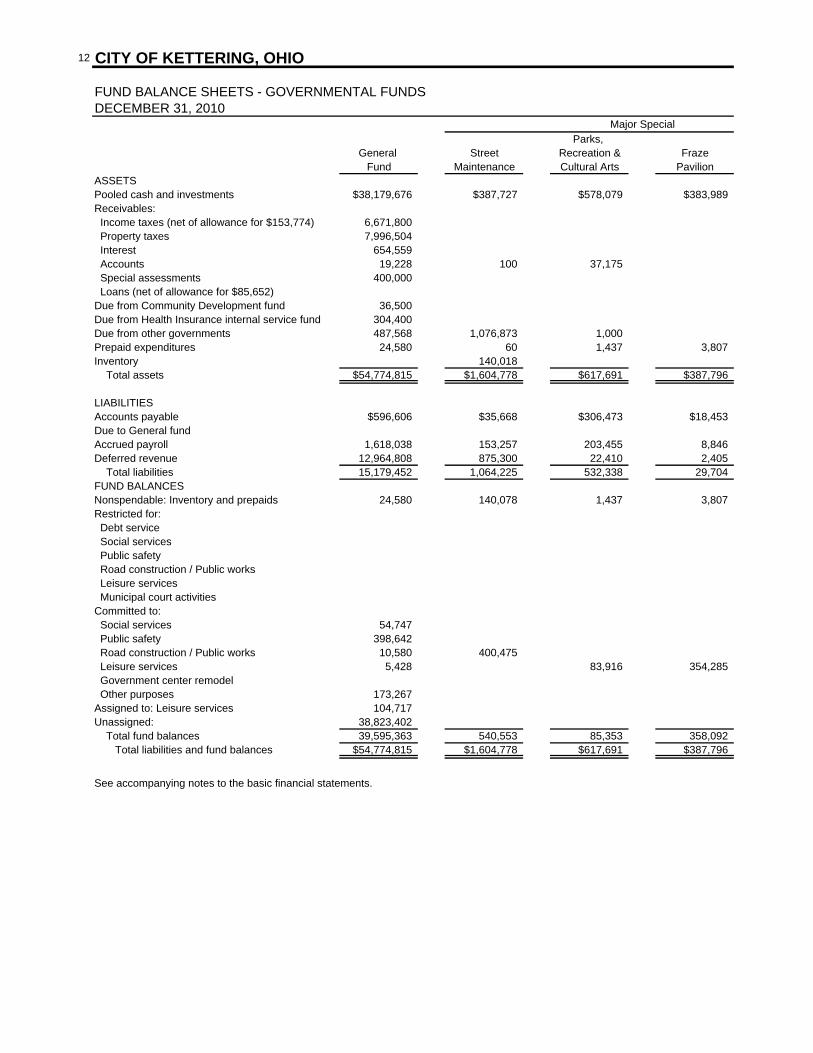
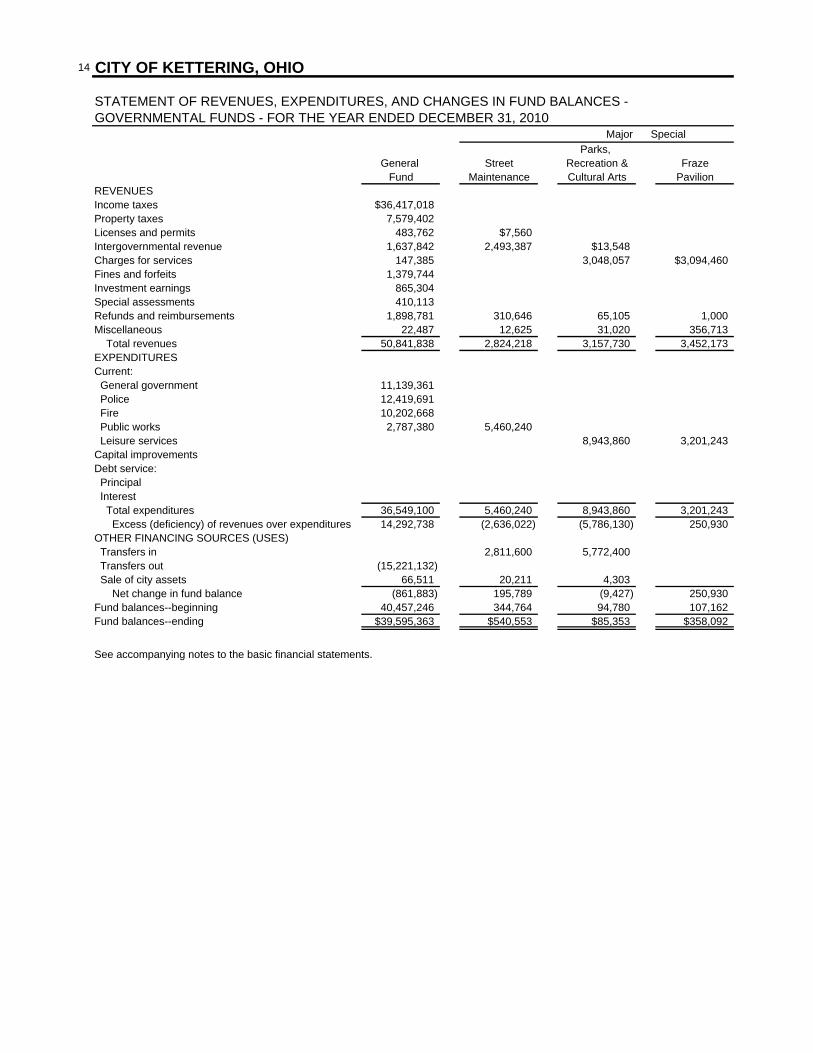
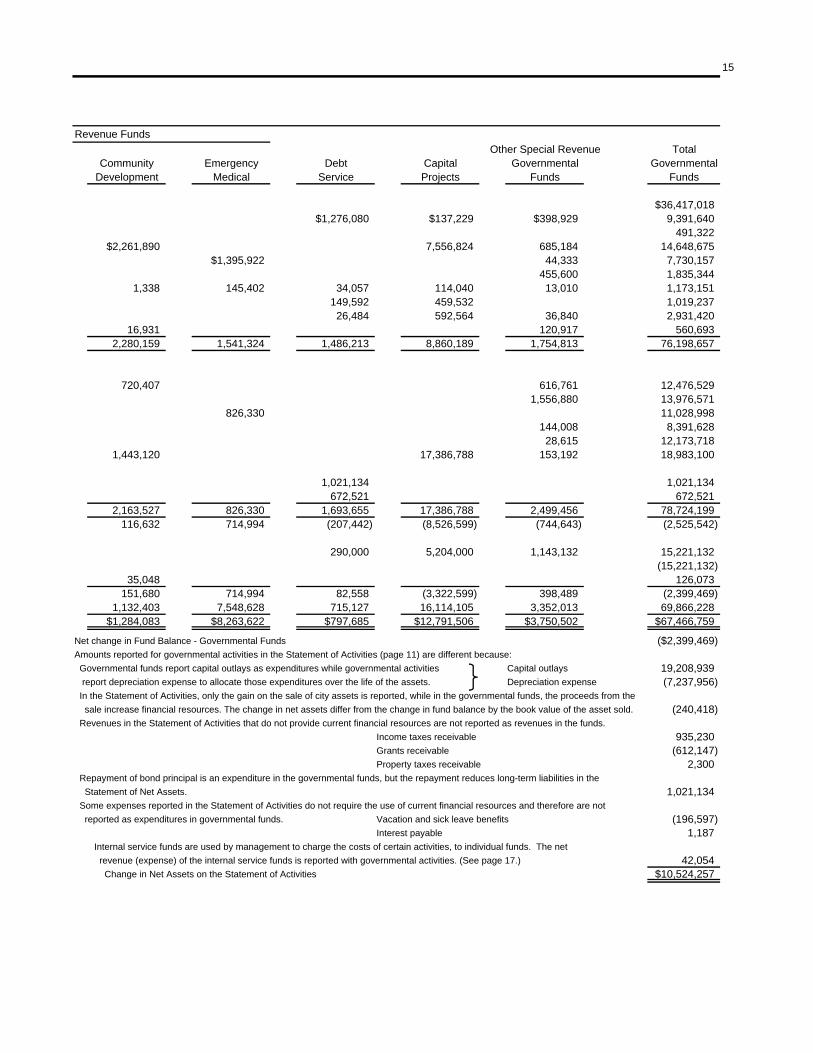
Total costs of services for 2008 increased by just over $328,000 while net costs of services increased by $342,000. However if we compare 2008 to 2007 without the impairment loss of $3.9 million, total costs of services increased by $4.2 million and net cost of services increased by $4.2 million. The capital asset activity for the year returned to normal levels compared to last years large infrastructure addition and the impairment loss. 2008 asset additions totaled $6.9 million and ended with total net capital assets of $120,775,004. Of this total, $10,521,411 was not being depreciated and the capital assets being depreciated totaled $208,147,863 with accumulated depreciation of $97,894,270. The City issued no new debt in the current year. At December 31, 2008, the City had various debt issues outstanding, which included $3,879,270 of general obligation bonds, $510,730 of special assessment debt with City commitment and $2,442,338 of promissory notes. As of December 31, 2008, the City’s net general obligation bonded debt of $3,866,903 was well below the legal limit of $131,355,181 and debt per capita equaled $67.25. In November 2008 the voters approved a $12.3 million bond levy to construct and improve parks & recreation facilities. The City has also committed $5 million of non-debt city funds for a total of $17.3 million worth of improvements. The City anticipates issuing the new bonds in the 1st half of 2009. A 1988 voted bond levy for the same purpose expired on December 31, 2008. For more detail on capital asset and long-term debt activity, refer to note 6 and note 12 respectively in the Notes to the Basic Financial Statements. THE CITY’S FUNDS As the City completed the year, its governmental funds (as presented in the balance sheet on pages 12 and 13) reported a combined fund balance of $51.5 million, which is 19.3% higher than last year’s total of $43.2 million. The City's General Fund experienced a $893,000, or 1.7% overall increase in revenues for 2008. At the same time expenditures increased by $2,064,000 or 6.1%, and transfers out increased by $1.1 million or 12.6%. The increase in transfers is due to the fact that the capital projects fund did not require a transfer in 2007 because of a large beginning fund balance necessary to cover encumbrances outstanding at the end of 2006. The City’s General Fund balance increased for the fourth time in 7 years. Income taxes increased again in 2008 but not nearly as much as they did in 2007 due to the rate increase. Although the portfolio balance was higher in 2008, investment earnings decreased due to lower interest rates. Total revenues were $53.3 million while total expenditures were $35.8 million. Transfers to other funds totaled $9.8 million resulting in the $7,691,000, or 23.4% increase to the General Fund balance.
9
The Fraze Pavilion, an outdoor amphitheater accounted for in a major special revenue fund, has produced a surplus only two times since it began operations in 1991. In 2008 it came very close to producing its third surplus but fell short with a $6,000 deficit. 2008 was still a very good year, eliminating the need for a transfer from the General fund. Increased ticket sales, increased concession sales, and increased sponsorships contributed to the results. The Emergency Medical fund saw revenues level off in its sixth year of operations after record revenue increases in the first 5 years. Charges for services revenues increased by $11,000 or .8% over last year. There were no other material changes to the major funds in 2008. There were no significant variations in the City’s original General Fund budget and the final General Fund budget. In contrast, there was a significant variance between actual expenditures and final budgeted expenditures for “Transfers to other funds”. Because of the Fraze Pavilion Fund’s excellent year, no transfer was required, and lower than expected expenditures in the Capital Projects Fund reduced significantly the transfer required. Capital Project Fund expenditures were lower due to the City planning many new capital projects, which, in hindsight, proved to be an overly optimistic number to accomplish in one year. As mentioned above, 2008 produced a significant increase to the General Fund balance. Much of this increase was due to increased income taxes because of the 2007 rate increase. Prior to 2005 the City had four straight years of General Fund Balance decline. 2005 marked the end of that decline but only after significant steps were taken by City Administration. Because of this, City Council placed on the May 2006 ballot a charter amendment that would allow it to increase the City’s income tax rate from 1.75% up to 2.25%. The Citizens of Kettering approved the amendment with a 58.7% positive vote. City Council chose to raise the rate to 2.25% effective January 1, 2007. It was the first increase since 1981.
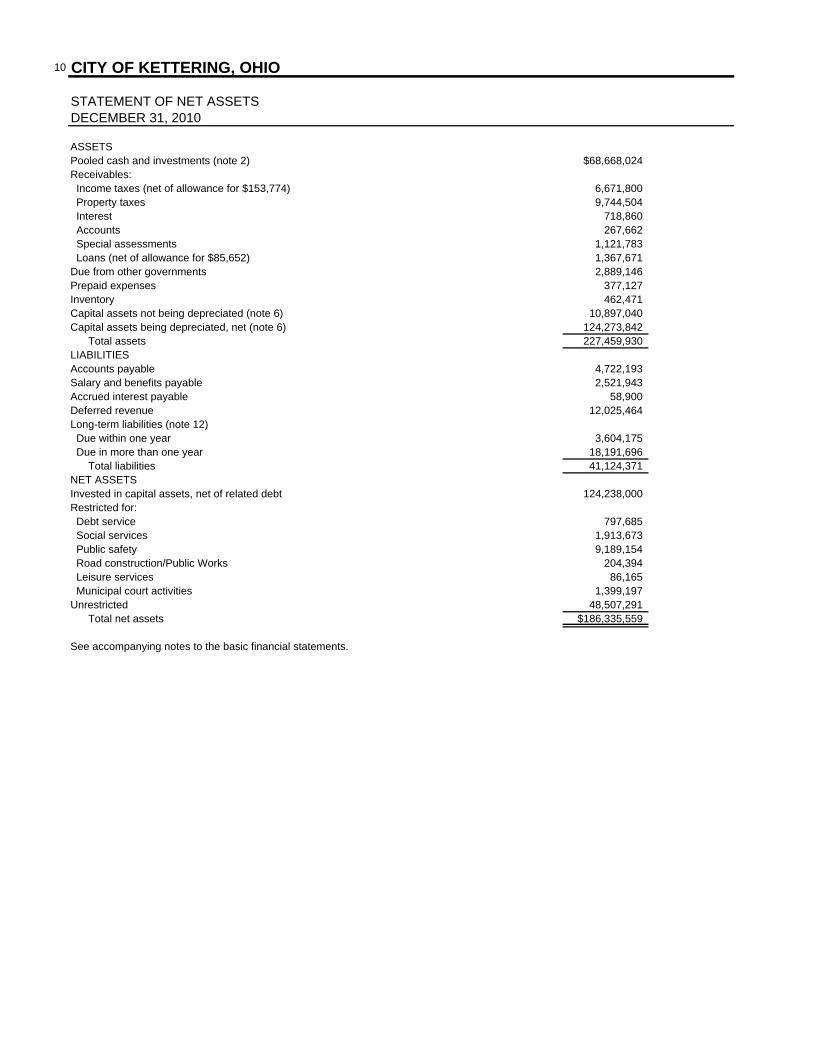
10 CITY OF KETTERING, OHIO
STATEMENT OF NET ASSETSDECEMBER 31, 2008
ASSETSPooled cash and investments (note 2) $50,454,491Receivables: Income taxes (net of allowance for $332,593) 5,993,700 Property taxes 9,887,561 Interest 449,447 Accounts 410,422 Special assessments 1,459,730 Loans (net of allowance for $56,708) 1,237,429Due from other governments 3,452,423Prepaid expenses 132,047Inventory 693,220Capital assets not being depreciated (note 6) 10,521,411Capital assets being depreciated, net (note 6) 110,253,593 Total assets 194,945,474LIABILITIESAccounts payable 2,436,958Salary and benefits payable 2,428,100Accrued interest payable 24,731Deferred revenue 11,888,259Long-term liabilities (note 12) Due within one year 2,920,582 Due in more than one year 7,998,465 Total liabilities 27,697,095NET ASSETSInvested in capital assets, net of related debt 113,942,666Restricted for: Debt service 12,367 Community development block grant 1,409,593 Emergency medical (by enabling legislation) 5,910,129 Municipal court activities 1,054,048 Other purposes 900,453Unrestricted 44,019,123 Total net assets $167,248,379
See accompanying notes to the basic financial statements.
CITY OF KETTERING, OHIO 11
STATEMENT OF ACTIVITIESFOR THE YEAR ENDED DECEMBER 31, 2008
Total Program Revenues Net (Expense)
Operating Capital Revenue andCharges for Grants and Grants and Changes in
Functions/Programs Expenses Services Contributions Contributions Net Assets General government $13,755,091 $2,644,901 $802,157 ($10,308,033) Police 13,760,327 71,131 32,327 (13,656,869) Fire 9,666,999 1,522,104 5 (8,144,890) Public works 13,404,095 14,040 1,020,471 1,677,377 (10,692,207) Leisure services 13,254,478 6,439,659 513,000 36,521 (6,265,298) Interest on long-term debt 1,144,483 (1,144,483) Total $64,985,473 $10,691,835 $2,367,960 $1,713,898 (50,211,780)
General revenues: Taxes: Income taxes 38,381,641 Property taxes, levied for general purposes 8,220,419 Property taxes, levied for debt service 1,303,288 Other taxes (note 5) 8,607,168 Investment earnings 1,954,419 Refunds and reimbursements 1,296,369 Miscellaneous 253,928 Total general revenues 60,017,232 Change in net assets 9,805,452Net assets--beginning 157,442,927Net assets--ending $167,248,379
See accompanying notes to the basic financial statements.
12 CITY OF KETTERING, OHIO
FUND BALANCE SHEETS - GOVERNMENTAL FUNDSDECEMBER 31, 2008
Major SpecialParks,
General Street Recreation & FrazeFund Maintenance Cultural Arts Pavilion
ASSETSPooled cash and investments $40,079,129 $155,847 $417,694 $133,778Receivables: Income taxes (net of allowance for $332,593) 5,993,700 Property taxes 8,054,561 Interest 449,447 Accounts 31,012 787 38,964 10 Special assessments 350,000 Loans (net of allowance for $56,708)Due from other governments 472,251 1,112,683 500Prepaid expenditures 26,478 344 2,409 1,895Inventory 395,585 Total assets $55,456,578 $1,665,246 $459,567 $135,683
LIABILITIESAccounts payable $1,538,631 $11,827 $136,063 $6,581Accrued payroll 1,463,621 182,508 246,855 9,676Deferred revenue 11,927,671 908,881 4,345 2,030 Total liabilities 14,929,923 1,103,216 387,263 18,287FUND BALANCESReserved for: Loans receivable Encumbrances 847,498 156,081 58,719 58,321 Prepaid expenditures 26,478 344 2,409 1,895 Inventory 395,585Unreserved: Designated for subsequent years' expenditures 3,000,000 Undesignated 36,652,679 10,020 11,176 57,180 Total fund balances 40,526,655 562,030 72,304 117,396 Total liabilities and fund balances $55,456,578 $1,665,246 $459,567 $135,683
See accompanying notes to the basic financial statements.
13
Revenue FundsOther Special Revenue Total
Community Emergency Debt Capital Governmental GovernmentalDevelopment Medical Service Projects Funds Funds
Amounts reported for governmental activities in the Statement of Net Assets (page 10) are different because: Capital assets used in governmental activities are not financial resources and therefore are not reported in the funds. 120,092,553 Other long-term assets are not available to pay for current-period expenditures and therefore are deferred in the funds:
Income taxes receivable 2,241,042Grants and other taxes receivable 3,413,000
Internal service funds are used by management to charge the costs of certain activities. The assets and liabilities of the internal service funds are included in governmental activities in the Statement of Net Assets. 519,609 Debt issuance costs and issuance discounts are amortized over the life of the debt, the unamortized portion remains on the Statement of Net Assets. 99,677 The following long-term liabilities are not due and payable in the current period and therefore are not reported in the funds:
Bonds and notes payable (6,832,338)Vacation and sick leave benefits (3,777,538)Accrued interest on bonds payable (24,731) Net Assets of Governmental Activities $167,248,379
14 CITY OF KETTERING, OHIO
STATEMENT OF REVENUES, EXPENDITURES, AND CHANGES IN FUND BALANCES -GOVERNMENTAL FUNDS - FOR THE YEAR ENDED DECEMBER 31, 2008
Major SpecialParks,
General Street Recreation & FrazeFund Maintenance Cultural Arts Pavilion
REVENUESIncome taxes $38,244,422Property taxes 7,586,201Licenses and permits 612,250 $14,040Intergovernmental revenue 1,836,001 2,519,230 $19,595 $2,463Charges for services 191,755 3,375,769 3,063,890Fines and forfeits 1,423,331Investment earnings 1,670,651Special assessments 402,314Refunds and reimbursements 1,276,349 1,293,265 221,498 1,462Miscellaneous 12,965 6,968 29,710 333,540 Total revenues 53,256,239 3,833,503 3,646,572 3,401,355EXPENDITURESCurrent: General government 11,438,965 Police 11,966,663 Fire 9,458,019 Public works 2,908,775 5,804,300 Leisure services 9,065,698 3,407,348Capital improvementsDebt service: Principal Interest Total expenditures 35,772,422 5,804,300 9,065,698 3,407,348 Excess (deficiency) of revenues over expenditures 17,483,817 (1,970,797) (5,419,126) (5,993)OTHER FINANCING SOURCES (USES) Transfers in 2,242,400 5,361,775 Transfers out (9,835,396) Sale of city assets 42,470 12,348 1,822 Net change in fund balance 7,690,891 283,951 (55,529) (5,993)Fund balances--beginning 32,835,764 278,079 127,833 123,389Fund balances--ending $40,526,655 $562,030 $72,304 $117,396
See accompanying notes to the basic financial statements.
15
Revenue FundsOther Special Revenue Total
Community Emergency Debt Capital Governmental GovernmentalDevelopment Medical Service Projects Funds Funds
Net change in Fund Balance - Governmental Funds $8,318,423Amounts reported for governmental activities in the Statement of Activities (page 11) are different because: Governmental funds report capital outlays as expenditures while governmental activities Capital outlays 6,613,911 report depreciation expense to allocate those expenditures over the life of the assets. Depreciation expense (6,761,932) In the Statement of Activities, only the gain on the sale of city assets is reported, while in the governmental funds, the proceeds from the sale increase financial resources. The change in net assets differ from the change in fund balance by the book value of the asset sold. (140,618) Revenues in the Statement of Activities that do not provide current financial resources are not reported as revenues in the funds.
Income taxes receivable 137,218Grants receivable 1,205,673Property taxes receivable 124,200
Repayment of bond principal is an expenditure in the governmental funds, but the repayment reduces long-term liabilities in the Statement of Net Assets. 642,739 Some expenses reported in the Statement of Activities do not require the use of current financial resources and therefore are not reported as expenditures in governmental funds. Vacation and sick leave benefits (179,380)
Interest payable (4,173) Internal service funds are used by management to charge the costs of certain activities, to individual funds. The net revenue (expense) of the internal service funds is reported with governmental activities. (See page 17.) (150,609) Change in Net Assets on the Statement of Activities $9,805,452
16 CITY OF KETTERING, OHIO
BALANCE SHEETPROPRIETARY FUNDSDECEMBER 31, 2008
GovernmentalActivities-Internal
Service FundsASSETSCurrent assets: Pooled cash and investments $186,597 Accounts receivable 587 Due from other governments 10,986 Prepaid expenses 397 Inventory 297,635 Total current assets 496,202Noncurrent assets: Buildings and improvements 769,344 Machinery and equipment 2,163,719 Less: Accumulated depreciation (2,250,612) Total noncurrent assets 682,451 Total assets $1,178,653
LIABILITIESCurrent liabilities: Accounts payable $180,864 Accrued payroll 169,009 Total current liabilities 349,873Noncurrent liabilities: Accrued vacation and sick leave benefits 309,171 Total liabilities 659,044NET ASSETSInvested in capital assets 682,451Unrestricted (162,842) Total net assets 519,609 Total liabilities and net assets $1,178,653
See accompanying notes to the basic financial statements.
CITY OF KETTERING, OHIO 17
STATEMENT OF REVENUES, EXPENSES, AND CHANGES IN NET ASSETSPROPRIETARY FUNDSFOR THE YEAR ENDED DECEMBER 31, 2008
GovernmentalActivities-Internal
Service FundsOPERATING REVENUESCharges for services $10,979,436 Total operating revenues 10,979,436OPERATING EXPENSESPersonal services 3,096,738Repairs and maintenance 1,858,404Contractual services 5,467,937Other materials and expenses 563,428Depreciation 158,863 Total operating expenses 11,145,370 Operating income (loss) (165,934)NONOPERATING REVENUES (EXPENSES)Investment earnings 15,325 Change in net assets (150,609) Total net assets--beginning 670,218 Total net assets--ending $519,609
See accompanying notes to the basic financial statements.
18 CITY OF KETTERING, OHIO
STATEMENT OF CASH FLOWSPROPRIETARY FUNDSFOR THE YEAR ENDED DECEMBER 31, 2008Increase (Decrease) in cash
GovernmentalActivities-Internal
Service FundsCASH FLOWS FROM OPERATING ACTIVITIESCash received for services $10,990,096Cash paid to suppliers for goods or services (7,884,856)Cash paid to employees for services (3,080,770) Net cash provided (used) by operating activities 24,470CASH FLOWS FROM CAPITAL AND RELATED FINANCING ACTIVITIESAcquisition of capital assets (337,998)Sale of capital assets 2,714 Net cash used by capital and related financing activities (335,284)CASH FLOWS FROM INVESTING ACTIVITIESInvestment earnings 15,325 Net cash provided by investing activities 15,325 Net increase (decrease) in cash (295,489)Cash at beginning of year 482,086Cash at end of year $186,597
RECONCILIATION OF OPERATING INCOME (LOSS) TO NET CASH PROVIDED (USED) BY OPERATING ACTIVITIESOperating income (loss) ($165,934)Adjustments to reconcile operating income (loss) to net cash provided (used) by operating activities: Depreciation 158,863 (Increase) decrease in receivables 13,374 (Increase) decrease in inventories 15,514 Increase (decrease) in accounts payable (14,715) Net (increase) decrease in other operating net assets 17,368 Net cash provided (used) by operating activities $24,470
See accompanying notes to the basic financial statements.
CITY OF KETTERING, OHIO 19
FIDUCIARY FUNDS
STATEMENT OF FIDUCIARY NET ASSETS DECEMBER 31, 2008
ASSETSPooled cash and investments $81,324 $275,730Investments with fiscal agent, at fair value: Unallocated insurance contracts $1,964,076 Other investments 352,540 Total assets 1,964,076 81,324 $628,270LIABILITIESAccounts payable $8,462Withholdings payable 262,665Undistributed moneys 352,540Unclaimed moneys 4,603 Total liabilities $628,270NET ASSETSHeld in trust for pension benefits and other purposes $1,964,076 $81,324
STATEMENT OF CHANGES IN FIDUCIARY NET ASSETS FOR THE YEAR ENDED DECEMBER 31, 2008
ADDITIONSEmployer contributions $69,847Investment earnings (loss) 240,356 $2,971 Total additions 310,203 2,971DEDUCTIONSPension payments 132,860 Total deductions 132,860Net increase (decrease) 177,343 2,971Net assets--beginning of year 1,786,733 78,353Net assets--end of year $1,964,076 $81,324
See accompanying notes to the basic financial statements.
CITY OF KETTERING, OHIO 21
NOTES TO THE BASIC FINANCIAL STATEMENTS FOR THE YEAR ENDED DECEMBER 31, 2008 1. SUMMARY OF SIGNIFICANT ACCOUNTING POLICIES
A. Reporting Entity The City of Kettering, Ohio, (the “City”) is a home rule municipal corporation under the laws of the State of Ohio and operates under its own Charter. The current Charter, which provides for a Council/Manager form of government, was adopted in 1955 and has subsequently been amended. The City provides various services including police and fire protection, parks, recreation, street maintenance, planning, zoning and other general government services. The City does not maintain any utility or other operations that would require the establishment of enterprise funds. The financial reporting entity consists of (a) the primary government, (b) organizations for which the primary government is financially accountable, and (c) governmental organizations for which the primary government is not financially accountable, but for which the nature and significance of their financial relationship with the primary government are such that exclusion would cause the reporting entity’s financial statements to be misleading or incomplete. Component units are legally separate organizations for which the elected officials of the primary government are financially accountable. In addition, component units can be governmental organizations for which the primary government is not financially accountable, but for which the nature and significance of their financial relationship with the primary government are such that exclusion would cause the reporting entity’s financial statements to be misleading or incomplete. No separate government units meet the criteria for inclusion as a component unit. B. Basis of Presentation Government-Wide Statements: The statement of net assets and the statement of activities display information about the primary government, except for its fiduciary activities. Eliminations have been made to minimize the double counting of internal activities. Governmental activities generally are financed through taxes, intergovernmental revenues and other nonexchange transactions. The City has no business-type activities. The statement of activities presents a comparison between direct expenses and program revenues for each function of the City’s governmental activities. Direct expenses are those that are specifically associated with a program or a function and, therefore, are clearly identifiable to a particular function. Program revenues include (a) charges paid by recipients of goods or services offered by the programs and (b) grants and contributions that are restricted to meeting the operational or capital requirements of a particular program. Revenues that are not classified as program revenues, including all taxes, are presented as general revenues. Fund Financial Statements: The fund financial statements provide information about the City’s funds, including fiduciary. Separate statements for each fund category – governmental, proprietary and fiduciary – are presented. The emphasis of fund financial statements is on major governmental funds, each displayed in a separate column. All remaining governmental funds are aggregated and reported as nonmajor funds. The City reports the following major governmental funds: General Fund – This fund is the general operating fund of the City. It is used to account for all financial resources except those required to be accounted for in another fund. Street Maintenance Fund – This fund accounts for the portion of gasoline tax and motor vehicle license fees restricted for maintenance of streets. Parks, Recreation & Cultural Arts Fund – This fund accounts for money received and expended for the Parks, Recreation & Cultural Arts department programs and activities.
22
Fraze Pavilion Fund – This fund accounts for moneys received and expended for the Fraze Pavilion amphitheater operations. Community Development Fund - This fund accounts for grants received from the Department of Housing and Urban Development (HUD). Grants are restricted for various purposes designated by HUD. Emergency Medical Fund – This fund accounts for revenues received for emergency medical services. The revenues can be expended for fire equipment or structures. Debt Service Fund – This fund is used to account for the accumulation of resources for, and the payment of, general, special assessment and promissory note long-term debt principal and interest. Capital Projects Fund – This fund is used to account for the financial resources to be used for the acquisition or construction of major capital facilities (other than those financed by proprietary funds). Additionally, the City reports the following fund types: Internal Service Funds – The internal service funds are used to account for the financing of goods or services provided by one department or agency to other departments or agencies of the City, or to other governments on a cost-reimbursement basis. These goods and services include computer services, vehicle maintenance, office supplies, postage, printing services, building maintenance and health insurance. The City has no unbilled service receivables at year end. Pension Trust Fund – The fund reports a trust arrangement under which assets are accumulated in order to pay retirement benefits to the City’s volunteer firefighters. Private Purpose Trust Fund – This fund reports a trust arrangement under which principal and income are used for the education of dependents of deceased police officers. Agency Funds – These funds account for assets held by the City as an agent for: 1) various local governments collected by the municipal court, 2) payroll withholdings and 3) unclaimed moneys and other miscellaneous activities. C. Basis of Accounting
Basis of accounting refers to when revenues and expenditures or expenses are recognized in the accounts and reported in the financial statements. Basis of accounting relates to the timing of the measurements made, regardless of the measurement focus applied. Government-wide, proprietary and fiduciary fund financial statements measure and report all assets (both financial and capital), liabilities, revenues, expenses, gains and losses using the economic resources measurement focus and accrual basis of accounting. Revenues are recorded when earned and expenses are recorded when a liability is incurred, regardless of the timing of related cash flows. Property taxes are recognized as revenues in the year for which they are levied. Grants and similar items are recognized as revenue as soon as all eligibility requirements imposed by the provider have been met. Agency funds do not involve the measurement of results of operations. All governmental funds are accounted for using a current financial resources measurement focus and are reported on a modified accrual basis of accounting. Revenues are recognized in the accounting period in which they become measurable and available. “Measurable” means the amount of the transaction can be determined and “available” means collectible within the current period or soon enough thereafter to be used to pay liabilities of the current period, which, for the City’s purposes, is considered to be 30 days after year end. Revenues considered susceptible to accrual are community development block grants, delinquent property taxes, income taxes, and interest on investments. Property taxes levied before year-end are not recognized as
23
revenue until the next calendar year. The fiscal period for which property taxes are levied at year-end in the State of Ohio is the succeeding calendar year. Expenditures are recognized in the accounting period in which the fund liability is incurred, if measurable, except for interest on unmatured general long-term debt, and on special assessment indebtedness collateralized by special assessment levies, which are recognized when due. Inventory and prepaid expenditures are recorded in the governmental fund types and charged as expenditures when used. A portion of the fund balance is reserved in governmental funds for the amount of inventory and prepaid expenditures. When both restricted and unrestricted resources are available for use, it is the government’s policy to use restricted resources first, then unrestricted resources as they are needed. D. Pooled Cash and Investments and Investment with Fiscal Agent
All investments are stated at fair value, which are based on quoted market prices. E. Inventory
Inventory is valued at cost (specific identification method in the internal service funds and FIFO (first-in, first-out) method in the special revenue funds.) Inventories are recorded as expenses/expenditures when used. F. Capital Assets
Capital assets include land, improvements to land, buildings, building improvements, machinery, equipment, infrastructure and all other assets that are used in operations and that have initial useful lives expending beyond a single reporting period. Infrastructure is defined as long-lived capital assets that normally are stationary in nature and normally can be preserved for a significantly greater number of years than most capital assets. Examples of infrastructure include roads, bridges and drainage systems. All capital assets are valued at historical cost, or estimated historical cost if actual historical cost is not available. Donated capital assets are valued at their estimated fair market value at the time received. When capital assets are purchased, they are capitalized and depreciated in the government-wide statements and the proprietary fund statements. The City capitalizes all assets with a cost of $5,000 or greater and a useful life of at least two years. The City has capitalized all infrastructure acquired after January 1, 1980. Capital assets are recorded as expenditures of the current period in the government fund financial statements. Depreciation is calculated using the straight-line method over the estimated useful lives of the assets. Estimated useful lives of the various classes of depreciable capital assets are as follows:
Machinery and Equipment 3-20 yearsBuildings and Improvements 15-30 yearsInfrastructure 20-40 years
G. Interfund Transactions and Transfers
During the course of normal operations, the City has numerous transactions among funds, most of which are in the form of transfers used to move unrestricted revenues collected in the general fund to finance various programs accounted for in other funds in accordance with budgetary authorizations. The accompanying financial statements generally reflect such transactions as transfers, with the exception of the internal service funds which are used to account for various supplies and services which are then charged back to the appropriate fund on an “as used” basis. The internal service funds record such charges as operating revenues; all other City funds record payments to the internal service funds as operating expenditures.
24
H. Reserves and Designations
Reserves indicate portions of fund equity not appropriable for expenditures and/or legally segregated for a specific future use. Designations indicate tentative plans for financial resource utilization in a future period. Such plans are subject to change; they may never be legally authorized or result in expenditures/expenses. I. Grants and Other Intergovernmental Revenues
All reimbursement-type grants are recorded as intergovernmental receivables and revenues or deferred revenue when the related expenditures are incurred. J. Use of Estimates
The preparation of the basic financial statements in conformity with generally accepted accounting principles requires management to make estimates and assumptions that affect the reported amounts of assets and liabilities at the date of the basic financial statements and the reported amounts of revenues and expenses during the reporting period. Actual results could differ from those estimates.
2. POOLED CASH AND INVESTMENTS
The City maintains a cash and investments pool that is available for use by all funds, except the pension trust fund. Each fund type’s portion of this pool is displayed on the Fund Balance Sheets as “Pooled cash and investments.” The deposits and investments of the pension trust fund are held separately from those of other City funds and displayed as “Unallocated insurance contracts.” Cash and cash equivalents in the internal service funds consist of cash and money market funds, which can be withdrawn without prior notice or penalty. Deposits: At year-end, the City’s bank balance was $19,684,099. Of this amount, $13,525,651 was insured, the remaining $6,158,448 was collateralized with securities held by the pledging financial institution’s trust department or agent, but not in the City’s name per Ohio Revised Code Section 135.181. This statute requires all financial institutions acting as public depositories to pledge a pool of collateral with a market value of at least 105% of the total amount of public deposits secured. The City has no deposit policy for custodial credit risk. Investments: All investments are reported at fair value, which is based on quoted market prices. The City’s investment policy authorizes investments in obligations of the U.S. Treasury, agencies, and instrumentalities, commercial paper rated, when purchased, A-1 by Standard & Poors Corporation or P-1 by Moody’s Commercial Paper Record, corporate bonds rated, when purchased, A or better by Standard & Poors Corporation or Moody’s Bond Rating, bankers acceptances issued by banks ranked nationally as being in the top 50 in asset and deposit size, repurchase and reverse repurchase agreements, money market mutual funds whose portfolio consists of authorized investments, and the state treasurer’s investment pool. The policy states that no more than 20% of the City’s investment portfolio will be placed with any particular issuer, and unless matched to a specific cash flow requirement, the City will not invest in securities maturing more than five years from the date of purchase. It has been the City’s practice to invest in securities maturing no more than two years from the date of purchase, and to hold all investments until maturity. The City has no investment policy for custodial credit risk. The City’s investments in corporate bonds, listed below, are uninsured and unregistered investments for which the securities are held by the counterparty, or by its trust department or agent, but not in the City’s name. On December 31, the City had $3,018,030 in corporate bonds issued by General Electric, $2,508,669 in corporate bonds issued by AT&T and a $2,459,858 corporate bond issued by Verizon. These amounts represent 6%, 5%, and 5% respectively of the pooled cash and investments. At year-end, $1,157,110 of the securities in the corporate bond category below are rated “BBB+”, the remaining $30,866,773 are rated “A” or better and all other investment types listed are unrated.
25
As of December 31, 2008 the City had the following investments and maturities.
FairInvestment Type Value Less than 1 1-3 3-9 9-10
Corporate Bonds $32,023,883 $15,230,380 $16,793,503Pension Plan Pooled Invest Fund 1,964,076 $1,964,076 Total $33,987,959 $15,230,380 $16,793,503 $1,964,076
Investment Maturities (in Years)
3. INCOME TAXES
The City levies a 2.25% income tax on substantially all income earned within the City. Additional increases in the income tax rate require voter approval. In 2006, the voters approved an income tax rate increase to 2.25% from 1.75% effective January 1st, 2007. City residents pay City income tax on income earned outside the City, however; a credit is allowed for income taxes paid to other municipalities. Employers within the City withhold income tax on employee compensation and remit at least quarterly. Corporations and other individual taxpayers pay estimated taxes quarterly and file an annual declaration.
4. PROPERTY TAXES
Property taxes include amounts levied against all real, public utility and tangible (used in business) property located in the City. Property taxes are levied each December 31 on the assessed value listed as of the prior December 31. Assessed values are established for real property at 35% of true value, for tangible property used in business at 6.25% of true value, and for tangible property constituting “inventory” at 6.25% of true value. Property market values are required to be updated every three years and revalued every six years. A revaluation was completed in 2008. The property tax calendar is as folows:
Levy date December 31, 2007Lien date December 31, 2007Tax bill mailed January 20, 2008First installment payment due February 15, 2008Second installment payment due July 15, 2008
The assessed values for the City at December 31, 2007 were as follows:Assessed Value
CategoryReal Estate $1,208,913,450Public Utility Real Property 13,680Tangible Personal Property 25,604,587Public Utility Personal Property 16,470,010Total $1,251,001,727
The County Treasurer collects property taxes on behalf of all taxing districts including the City of Kettering. The County periodically remits to the City its portion of taxes collected. Property taxes may be paid on either an annual or semiannual basis.
26
5. OTHER TAXES
The caption “Other taxes” on the Statement of Activities is comprised of taxes levied by the State or the County and distributed to the City. The components of the number are as follows: Estate taxes $3,539,762
Capital assets not being depreciated: Land $10,544,645 $68,834 ($92,068) $10,521,411 Subtotal 10,544,645 68,834 (92,068) 10,521,411Capital assets being depreciated: Buildings and improvements 40,156,917 1,327,013 41,483,930 Machinery and equipment 17,715,458 1,169,053 (1,106,987) 17,777,524 Infrastructure 144,601,194 4,368,372 (83,157) 148,886,409 Subtotal 202,473,569 6,864,438 (1,190,144) 208,147,863Accumulated depreciation: Buildings and improvements (25,518,497) (942,839) (26,461,336) Machinery and equipment (12,694,666) (1,114,712) 1,047,538 (12,761,840) Infrastructure (53,891,007) (4,863,244) 83,157 (58,671,094) Subtotal (92,104,170) (6,920,795) * 1,130,695 (97,894,270) Net capital assets being depreciated 110,369,399 (56,357) (59,449) 110,253,593 Net capital assets $120,914,044 $12,477 ($151,517) $120,775,004
*Depreciation expense was charged to governmental functions as follows:
General government $393,062Police 256,265Fire 353,521Public works 4,971,532Leisure services 787,552In addition, depreciation on capital assets held by the City's internal service funds is charged to the various functions based on their usage of the assets. 158,863Total depreciation expense $6,920,795
7. LOANS RECEIVABLE AND NOTES RECEIVABLE
The City used a portion of the Federal Community Development Block Grant (CDBG) to provide low interest loans for housing rehabilitation, as well as for economic and job development. The loans are payable in
27
installments to 2033. Fund balance has been reserved for the loans receivable at December 31, 2008, as it does not represent currently available spendable resources. CDBG regulations require the City to reinvest loan repayments in permissible CDBG loans or expenditures.
8. RISK MANAGEMENT
The City is a member of a public entity risk pool, Miami Valley Risk Management Association, Inc. (MVRMA) with nineteen other local cities. This pool covers all property, crime, liability, boiler and machinery, and public official liability up to the limits stated below. Insurance coverage is as follows: Property – $1,000,000,000 per occurrence Crime - $1,000,000 per occurrence Liability - $10,000,000 per occurrence Boiler & Machinery - $100,000,000 per occurrence Public Official Liability - $10,000,000 per occurrence The deductible per occurrence for all types is $2,500. Pool coverage is $2,500 - $5,000 for boiler and machinery, $2,501 - $25,000 for crime, $2,501 - $200,000 for property, and $2,501 - $1,000,000 for liability. Excess insurance coverage, provided by commercial companies, is the amount in excess of pool coverage to the limits stated above. The City pays an annual premium to MVRMA that is intended to cover administrative expenses and any claims covered by the pool. MVRMA has the ability to require the member cities to make supplemental payments in the event reserves are not adequate to cover claims. An actuarial opinion issued as of December 31, 2007, indicates reserves in excess of anticipated claims. Employee health insurance is provided through a fully insured plan and is accounted for and financed through an internal service fund. The City pays premiums to a private insurance company and retains no risk. Workers’ compensation is administered by the State of Ohio. The City pays a premium per employee to the State for this coverage. There were no significant reductions in insurance coverage from the prior year in any category of risk. Insurance coverage for each of the past three years was sufficient to cover any claims settlements.
9. PENSION PLAN OBLIGATIONS
Substantially all City employees are covered by one of two pension plans Ohio Police and Fire Pension Fund (OP&F) or Ohio Public Employees Retirement System (OPERS). OHIO POLICE AND FIRE PENSION FUND (OP&F) OP&F is a cost-sharing multiple-employer defined benefit pension plan, which provides retirement and disability benefits, annual cost of living adjustments, and death benefits to plan members and beneficiaries. Authority to establish and amend benefits is provided by state statute per Chapter 742 of the Ohio Revised Code. The Police and Fire Pension Fund issues a publicly available financial report that includes financial statements and required supplementary information for the fund. Interested parties may obtain a copy by making a written request to 140 East Town Street, Columbus, Ohio 43215-5164. The Ohio Revised Code provides statutory authority for employee and employer contributions. Plan members are required to contribute 10% of their annual covered salary and the City is required to contribute 19.5% and 24% respectively for police officers and firefighters. The City’s contributions to the plan for the years ending December 31, 2006, 2007 and 2008, were $2,146,383, $2,262,695 and $2,448,027 respectively, or 79% of the required contributions for 2006, 73% for 2007, and 77% for 2008.
28
OHIO PUBLIC EMPLOYEES RETIREMENT SYSTEM (OPERS) OPERS administers three separate pension plans. 1) The Traditional Pension Plan (TP) – a cost-sharing multiple-employer defined benefit pension plan. 2) The Member-Directed Plan (MD) – a defined contribution plan in which the member invests both member and employer contributions (employer contributions vest over five years at 20% per year). Members accumulate retirement assets equal to the value of member and (vested) employer contributions plus any investment earnings thereon. 3) The Combined Plan (CO) - a cost-sharing multiple-employer defined benefit pension plan. Employer contributions are invested by the retirement system to provide a formula retirement benefit similar in nature to the Traditional Plan benefit. Member contributions, the investment of which is self-directed by the members, accumulate retirement assets in a manner similar to the MD. OPERS provides retirement, disability, survivor and death benefits and annual cost of living adjustments to members of the TP and CO. Members of the MD do not qualify for ancillary benefits. Authority to establish and amend benefits is provided by state statute per Chapter 145 of the Ohio Revised Code. The Public Employees Retirement System issues a publicly available financial report that includes financial statements and required supplementary information for the fund. Interested parties may obtain a copy by making a written request to 277 East Town Street, Columbus, Ohio 43215-4642, or by calling (800) 222-7377. The Ohio Revised Code provides statutory authority for employee and employer contributions. For 2008, member and employer contribution rates were consistent across all three plans (TP, MD and CO). Plan members are required to contribute 10% of their annual covered salary and the City is required to contribute 14%. The City’s contributions to the plan for the years ending December 31, 2006, 2007 and 2008, were $2,438,270, $2,560,130 and $2,683,518 respectively, equal to the required contributions for the year. VOLUNTEER FIREFIGHTERS PENSION Principal Life Insurance Company administers a single-employer, defined benefit pension plan for the Volunteer Firefighters. At January 1, 2008, the plan’s membership consisted of the following:
Retirees and beneficiaries currently receiving benefits 77
Terminated employees entitled to benefits but not yet receiving them 23
Active members 86
Total 186
All regular members of the Volunteer Fire Department are eligible for the plan upon completion of 3 years of continuous service. Members may retire at age 55 and receive a monthly benefit, payable for life. The monthly retirement benefit is equal to the sum of $8.00 multiplied by the number of years of credited service not in excess of 10 years and $10.00 multiplied by the number of years of credited service in excess of 10 years. Benefits vest at 15% upon 3 years of credited service plus 5% for each additional year, up to 100%. Benefits are established by and may be amended by City Ordinance. Financial Statements of the Volunteer Firefighter Pension are prepared using the accrual basis of accounting. Employer contributions are recognized when due and the employer has made a formal commitment to provide the contributions. Benefits and refunds are recognized when due and payable in accordance with terms of the plan. The Pension plan does not issue a stand-alone financial report. Plan investments are reported at fair value. No investment, in any one organization, exceeded five percent of net assets available for benefits. The City’s funding policy is to provide for periodic employer contributions at actuarially determined rates that, expressed in dollars, are designed to accumulate sufficient assets to pay benefits when due. Costs of
29
administering the plan are paid separately by the City and not deducted from plan assets. The City is to make all contributions required to the plan. Contribution requirements are established or may be amended by City Ordinance. Active members are not required to contribute. The annual required contribution for the current year was determined as part of the January 1, 2008, actuarial valuation using the aggregate actuarial cost method. The actuarial assumptions included a 6.25% investment rate of return and that benefits will not increase after retirement. The actuarial value of assets was determined using the contract basis. Because the aggregate actuarial cost method does not identify or separately amortize unfunded actuarial liabilities, information about funded status and funding progress has been prepared using the entry age actuarial cost method for that purpose and the information presented is intended to serve as a surrogate for the funded status and funding progress of the plan. The funded status of the plan as of January 1, 2008, the most recent actuarial valuation date is as follows:
Actuarial Actuarial Actuarial Accrued Unfunded UAAL as a Valuation Value Liability (AAL) AAL Funded Covered Percentage of
Date of Assets -Entry Age (UAAL) Ratio Payroll Covered Payroll1/1/2008 $2,000,381 $2,236,175 $235,794 89.5% $427,556 55.1%
FUNDED STATUS AND FUNDING PROGRESS
SCHEDULE OF EMPLOYER CONTRIBUTIONS
Year Ended Annual Required Actual PercentDecember 31 Contribution Contribution Contributed
For the fiscal years ended December 31, 2006, 2007 and 2008, the Annual Pension cost (APC) was $70,294, $67,025 and $69,847 respectively; the percentage of APC contributed was 100% and the net pension obligation was $0. The first year the City reported the Volunteer firefighters Pension under GASB 27 was in 1996. The pension liability was $0 and was determined in accordance with GASB 27. The amount of pension liability at transition was $0. The difference between the amount of pension liability and the previously reported liability to the plan was $0.
10. OTHER POST EMPLOYMENT BENEFITS (OPEB)
In addition to the pension benefits described in Note 9, both the Ohio Public Employees Retirement System (OPERS) and the Ohio Police and Fire Pension Fund (OP&F) provide post retirement health care coverage, which meets the definition of an Other Post Employment Benefit (OPEB) as described in GASB Statement 45. For both systems, the Ohio Revised Code (ORC) permits, but does not mandate, OPEB benefits to its eligible members and beneficiaries. Authority to establish and amend benefits is provided in the ORC Chapter 145 for OPERS and Chapter 742 for OP&F.
30
OHIO POLICE AND FIRE PENSION FUND OPEB OP&F sponsors a cost-sharing multiple-employer defined post retirement healthcare plan administered by OP&F. OP&F provides healthcare benefits including coverage for medical, prescription drugs, dental, vision, Medicare Part B Premium and long term care to retirees, qualifying benefit recipients and their eligible dependents. The ORC provides the statutory authority requiring public employers to fund post retirement health care through their contributions to OP&F. A portion of each employer’s contribution is set aside for the funding of post retirement health care benefits. Participating employers are required to contribute to the pension plan at rates expressed as percentages of the payroll of active pension plan members, currently, 19.5% and 24.0% of covered payroll for police and fire employers, respectively. The ORC states that the employer contribution may not exceed 19.5% and 24.0% of covered payroll for police and fire employers respectively. Active members do not make contributions to the OPEB Plan. OP&F maintains funds for health care in two separate accounts. One for health care benefits under an IRS Code Section 115 trust and one for Medicare Part B reimbursements administrated as an Internal Revenue Code 401(h) account, both of which are within the defined benefit pension plan, under the authority granted by the ORC to the OP&F board of trustees. The board of trustees is authorized to allocate a portion of the total employer contributions made into the pension plan to the Section 155 trust and the Section 401(h) account as the employer contribution for retiree healthcare benefits. For the year ended December 31, 2008, the employer contribution allocated to the healthcare plan was 6.75% of covered payroll. The amount of employer contributions allocated to the healthcare plan each year is subject to the trustees’ primary responsibility to ensure that pension benefits are adequately funded and also is limited by the provisions of Sections 115 and 401(h). The OP&F board of trustees is authorized to establish requirements for contributions to the healthcare plan by retirees and their eligible dependents, or their surviving beneficiaries. Payment amounts vary depending on the number of covered dependents and the coverage selected. City contributions to OP&F for 2008 were $2,448,027 of which $773,772 was allocated to the healthcare plan. OP&F issues a publicly available financial report that includes financial information and required supplementary information for the Plan. That report may be obtained by writing to OP&F, 140 East Town Street, Columbus, Ohio 43215-5164. OHIO PUBLIC EMPLOYEES RETIREMENT SYSTEM OPEB OPERS administers three separate pension plans, the Traditional Pension Plan (TP), the Member–Directed Plan (MD), and the Combined Plan (CO), all of which are described in note 9. OPERS maintains a cost-sharing multiple employer defined benefit post employment healthcare plan, which provides a medical plan, prescription drug program and Medicare Part B premium reimbursement, to age and service retirees with 10 or more years of qualifying Ohio service credit of both the TP and CO. Members of the MD do not qualify for ancillary benefits, including post employment health care coverage. Health care coverage for disability recipients and qualified survivor benefit recipients is available. The ORC provides the statutory authority requiring public employers to fund post retirement health care through their contributions to OPERS. A portion of each employer’s contribution is set aside for the funding of post retirement health care benefits. Participating employers are required to contribute to the pension plan at rates expressed as percentages of the payroll of active pension plan members, currently, 14.0%. The ORC states that the employer contribution may not exceed 14.0% of covered payroll. Active members do not make contributions to the OPEB Plan. OPERS post employment healthcare plan was established and is administrated in accordance with, Internal Revenue Code 401(h). Each year, the OPERS Retirement Board determines the portion of the employer contribution rate that will be set aside for funding of post employment health care benefits. For 2008, the employer contribution allocated to the health care plan was 7.0% of covered payroll. The OPERS Retirement Board is also authorized to establish rules for the payment of a portion of the health care benefits provided by the retiree or their surviving beneficiaries. Payment amounts vary depending on the number of covered
31
dependents and the coverage selected. City contributions to OPERS for 2008 were $2,683,518 of which $1,341,759 was allocated to fund post employment benefits. The Health Care Preservation Plan adopted by the OPERS Retirement Board on September 9, 2004, was effective January 1, 2007. Member and employer contribution rates increased as of January 1, 2006, January 1, 2007 and January 1, 2008, which allowed additional funds to be allocated to the health care plan. OPERS issues a stand-alone financial report. Interested parties may obtain a copy by writing OPERS, Attention: Finance Director, 277 East Town Street, Columbus, OH 43215-4642, or by calling (800) 222-7377.
11. LEASES AND CONSTRUCTION COMMITMENTS
There are no operating leases, in which the City is a lessee, in excess of one year. Operating lease payments in 2008 were $318,328. Construction and other commitments at December 31, 2008, were approximately $1,322,000.
12. LONG-TERM LIABILITIES
Long-term liability activity for the year ended December 31, 2008, was as follows: Amounts
Beginning Ending Due WithinBalance Additions Reductions Balance One Year
General obligation bonds: Street Improvement bonds- Series 1991, 4.5%-6.65% $190,851 $31,581 $159,270 $34,371 Street Improvement bonds- Series 1992, 3.25%-6.45% 380,000 70,000 310,000 70,000 Recreation Center Refunding, 2.65%-16.9% 82,780 82,780 0 0 Court Facility, 3.0%-4.5% 3,565,000 155,000 3,410,000 160,000
Total general obligation bonds 4,218,631 339,361 3,879,270 264,371
Special assessment bonds: Streets Series 1991, 4.5%-6.65% 619,149 108,419 510,730 115,629
Total special assessment bonds 619,149 108,419 510,730 115,629
Other: Accrued vacation and sick leave benefits 3,924,321 $2,277,220 2,114,832 4,086,709 2,370,291 Ohio Public Works Commission Long-Term Promissory Notes, 0-3% 2,637,298 194,960 2,442,338 170,291
Total other 6,561,619 2,277,220 2,309,792 6,529,047 2,540,582
Total long-term liabilities $11,399,399 $2,277,220 $2,757,572 $10,919,047 $2,920,582
32
The accrued vacation and sick leave benefits liability will be liquidated by several of the City’s governmental and internal service funds. In the past, approximately 72% has been paid by the General Fund, 10% by the Street Maintenance Fund and the remainder by the other governmental and internal service funds. The City uses the “vesting method” to determine the appropriate liability. In the event of delinquencies related to special assessment bonds, the City is required to use other resources until foreclosure proceeds are received to satisfy debt service. The City does not have a sinking fund or reserve established to cover defaults by property owners because foreclosure proceeds would eliminate any outstanding liability. From time to time the City has issued Industrial Revenue Bonds to provide financial assistance to private-sector entities for the acquisition and construction of industrial and commercial facilities deemed to be in the public interest. Neither the City, the State, nor any political subdivision thereof is obligated in any manner for repayment of the bonds. Accordingly, the bonds are not reported as liabilities in the accompanying financial statements. At year-end there were two series of Industrial Revenue Bonds outstanding, with an aggregate principal amount payable of $5.1 million. The annual requirements to pay principal and interest on long-term obligations at December 31, 2008, are as follows:
Principal Interest Principal Interest Principal Interest
The Ohio Revised Code (ORC) provides that the total net debt (as defined in the ORC) of a municipal corporation, whether or not approved by the electors, shall not exceed 10.5% of the total value of all property in the municipal corporation as listed and assessed for taxation. In addition, the unvoted net debt of municipal corporations cannot exceed 5.5% of the total taxation value of property. At December 31, 2008, the City had a legal debt margin for total debt of $127,488,278 and a legal debt margin for unvoted debt of $64,938,192.
13. CONTINGENT LIABILITIES
The City is the defendant in various lawsuits and subject to various claims over which litigation has not commenced. Although the outcome of these matters is not presently determinable, in the opinion of the Law Director the resolution of these matters will not have a material adverse effect on the financial condition of the City. The City participates in several federally assisted programs that are subject to program compliance audits by the grantors or their representatives. A single financial and compliance audit of the city has been completed with no findings for recovery. The grantor agencies, at their option, may perform economy and efficiency audits, program results audits or conduct monitoring visits. Such audits and visits could lead to reimbursement to the grantor agencies. Management believes such reimbursements, if any, would be immaterial.
34 CITY OF KETTERING, OHIOREQUIRED SUPPLEMENTARY INFORMATIONBUDGET(GAAP BUDGET) TO ACTUAL COMPARISON SCHEDULE - GENERAL FUNDFOR THE YEAR ENDED DECEMBER 31, 2008
Budgeted Amounts Variance withOriginal Final Actual Final Budget
Fund balance, January 1 $32,835,764 $32,835,764 $32,835,764Resources (inflows) Income taxes 37,895,000 38,500,000 38,244,422 ($255,578) Property taxes 7,694,000 7,694,000 7,586,201 (107,799) Licenses and permits 501,000 591,000 612,250 21,250 Intergovernmental revenue 1,921,000 1,923,800 1,836,001 (87,799) Charges for services 170,000 196,000 191,755 (4,245) Fines and forfeits 1,515,000 1,515,000 1,423,331 (91,669) Investment earnings 1,664,000 1,750,000 1,670,651 (79,349) Special assessments 300,000 400,000 402,314 2,314 Refunds and reimbursements 1,200,000 1,200,000 1,276,349 76,349 Miscellaneous 13,000 13,000 12,965 (35) Sale of city assets 20,000 36,000 42,470 6,470 Amounts available for appropriation 85,728,764 86,654,564 86,134,473 (520,091)Charges to appropriations (outflows) General government: Mayor and Council: Personal services 233,700 233,700 233,557 143 Operating expenditures 89,922 90,422 66,092 24,330 Capital outlay Total mayor and council 323,622 324,122 299,649 24,473 Municipal court: Personal services 928,500 928,500 916,765 11,735 Operating expenditures 276,446 280,033 245,609 34,424 Capital outlay Total municipal court 1,204,946 1,208,533 1,162,374 46,159 Clerk of courts: Personal services 846,500 870,500 860,297 10,203 Operating expenditures 141,771 147,800 128,545 19,255 Capital outlay Total clerk of courts 988,271 1,018,300 988,842 29,458 Office of City Manager: Personal services 504,200 506,900 504,535 2,365 Operating expenditures 52,658 67,276 59,121 8,155 Capital outlay Total office of city manager 556,858 574,176 563,656 10,520 Law department: Personal services 706,500 696,500 677,184 19,316 Operating expenditures 187,808 313,508 269,356 44,152 Capital outlay Total law department 894,308 1,010,008 946,540 63,468 Finance department: Personal services 1,495,400 1,495,400 1,442,571 52,829 Operating expenditures 517,063 513,417 418,964 94,453 Capital outlay Total finance department 2,012,463 2,008,817 1,861,535 147,282 Administrative support: Personal services 364,300 364,300 357,032 7,268 Operating expenditures 69,239 73,952 69,658 4,294 Capital outlay 5,000 Total administrative support 438,539 438,252 426,690 11,562
See accompanying notes to the required supplementary information.
CITY OF KETTERING, OHIO 35
REQUIRED SUPPLEMENTARY INFORMATIONBUDGET(GAAP BUDGET) TO ACTUAL COMPARISON SCHEDULE - GENERAL FUND - CONTINUEDFOR THE YEAR ENDED DECEMBER 31, 2008
Budgeted Amounts Variance withOriginal Final Actual Final Budget
General government: Human resources department: Personal services $621,100 $621,100 $608,627 $12,473 Operating expenditures 433,524 432,767 262,916 169,851 Capital outlay Total human resources department 1,054,624 1,053,867 871,543 182,324 Planning and development: Personal services 1,975,100 1,975,100 1,895,579 79,521 Operating expenditures 447,055 441,121 310,381 130,740 Capital outlay Total planning and development 2,422,155 2,416,221 2,205,960 210,261 Economic development: Personal services 126,100 128,100 127,660 440 Operating expenditures 1,444,811 1,441,040 1,103,694 337,346 Capital outlay Total economic development 1,570,911 1,569,140 1,231,354 337,786 Miscellaneous: Operating expenditures 1,222,415 1,344,376 880,822 463,554 Total miscellaneous 1,222,415 1,344,376 880,822 463,554 Total general government 12,689,112 12,965,812 11,438,965 1,526,847 Police: Personal services 9,964,600 10,124,600 10,076,844 47,756 Operating expenditures 2,144,360 2,486,020 1,842,496 643,524 Capital outlay 180,500 180,500 47,323 133,177 Total police 12,289,460 12,791,120 11,966,663 824,457 Fire: Personal services 6,636,700 7,446,700 7,355,724 90,976 Operating expenditures 2,212,864 2,215,536 1,863,592 351,944 Capital outlay 941,618 296,618 238,703 57,915 Total fire 9,791,182 9,958,854 9,458,019 500,835 Public works: Engineering department: Personal services 1,985,600 1,985,600 1,982,576 3,024 Operating expenditures 446,794 449,920 369,180 80,740 Capital outlay 80,000 80,000 72,871 7,129 Total engineering department 2,512,394 2,515,520 2,424,627 90,893 Street lighting: Operating expenditures 550,000 550,000 484,148 65,852 Total street lighting 550,000 550,000 484,148 65,852 Total public works 3,062,394 3,065,520 2,908,775 156,745 Transfers to other funds 14,955,000 17,463,114 9,835,396 7,627,718 Total charges to appropriations 52,787,148 56,244,420 45,607,818 10,636,602Fund balance, December 31 $32,941,616 $30,410,144 $40,526,655 $10,116,511
See accompanying notes to the required supplementary information.
36 CITY OF KETTERING, OHIOREQUIRED SUPPLEMENTARY INFORMATIONBUDGET(GAAP BUDGET) TO ACTUAL COMPARISON SCHEDULE - STREET MAINTENANCE FUNDFOR THE YEAR ENDED DECEMBER 31, 2008
Budgeted Amounts Variance withOriginal Final Actual Final Budget
Fund balance, January 1 $278,079 $278,079 $278,079Resources (inflows) Licenses and permits 10,000 10,000 14,040 $4,040 Intergovernmental revenue 2,550,000 2,550,000 2,519,230 (30,770) Refunds and reimbursements 200,000 200,000 1,293,265 1,093,265 Miscellaneous 25,000 25,000 6,968 (18,032) Sale of city assets 12,348 12,348 Transfer from the general fund 2,785,000 3,670,900 2,242,400 (1,428,500) Amounts available for appropriation 5,848,079 6,733,979 6,366,330 (367,649)Charges to appropriations (outflows) Public works: Street department: Personal services 3,725,600 3,855,600 3,745,813 109,787 Operating expenditures 1,523,720 2,176,654 1,635,810 540,844 Capital outlay 492,000 590,900 422,677 168,223 Total charges to appropriations 5,741,320 6,623,154 5,804,300 818,854Fund balance, December 31 $106,759 $110,825 $562,030 $451,205
See accompanying notes to the required supplementary information.
CITY OF KETTERING, OHIO 37
REQUIRED SUPPLEMENTARY INFORMATIONBUDGET(GAAP BUDGET) TO ACTUAL COMPARISON SCHEDULE - PARKS, RECREATION AND CULTURAL ARTS FUNDFOR THE YEAR ENDED DECEMBER 31, 2008
Budgeted Amounts Variance withOriginal Final Actual Final Budget
Fund balance, January 1 $127,833 $127,833 $127,833Resources (inflows) Intergovernmental revenue 21,000 21,000 19,595 ($1,405) Charges for services 3,816,000 3,575,000 3,375,769 (199,231) Refunds and reimbursements 138,000 69,000 221,498 152,498 Miscellaneous 69,000 11,000 29,710 18,710 Sale of city assets 1,822 1,822 Transfer from the general fund 5,480,000 5,765,000 5,361,775 (403,225) Amounts available for appropriation 9,651,833 9,568,833 9,138,002 (430,831)Charges to appropriations (outflows) Leisure services: Parks, recreation and cultural arts department: Personal services 5,462,400 5,417,400 5,228,203 189,197 Operating expenditures 4,067,303 4,072,227 3,808,005 264,222 Capital outlay 102,000 66,000 29,490 36,510 Total charges to appropriations 9,631,703 9,555,627 9,065,698 489,929Fund balance, December 31 $20,130 $13,206 $72,304 $59,098
See accompanying notes to the required supplementary information.
38 CITY OF KETTERING, OHIOREQUIRED SUPPLEMENTARY INFORMATIONBUDGET(GAAP BUDGET) TO ACTUAL COMPARISON SCHEDULE - FRAZE PAVILION FUNDFOR THE YEAR ENDED DECEMBER 31, 2008
Budgeted Amounts Variance withOriginal Final Actual Final Budget
Fund balance, January 1 $123,389 $123,389 $123,389Resources (inflows) Intergovernmental revenue 3,000 2,463 ($537) Charges for services 2,092,000 3,015,000 3,063,890 $48,890 Refunds and reimbursements 5,000 4,000 1,462 (2,538) Miscellaneous 250,000 312,000 333,540 21,540 Transfer from the general fund 525,000 585,000 (585,000) Amounts available for appropriation 2,995,389 4,042,389 3,524,744 (517,645)Charges to appropriations (outflows) Leisure services: Fraze pavilion: Personal services 616,800 753,800 736,268 17,532 Operating expenditures 2,280,212 2,801,712 2,671,080 130,632 Total charges to appropriations 2,897,012 3,555,512 3,407,348 148,164Fund balance, December 31 $98,377 $486,877 $117,396 ($369,481)
See accompanying notes to the required supplementary information.
CITY OF KETTERING, OHIO 39
REQUIRED SUPPLEMENTARY INFORMATIONBUDGET(GAAP BUDGET) TO ACTUAL COMPARISON SCHEDULE -COMMUNITY DEVELOPMENT FUNDFOR THE YEAR ENDED DECEMBER 31, 2008
Budgeted Amounts Variance withOriginal Final Actual Final Budget
Fund balance, January 1 $1,260,105 $1,260,105 $1,260,105Resources (inflows) Intergovernmental revenue 700,000 700,000 628,344 ($71,656) Investment earnings 2,713 2,713 Refunds and reimbursements 12 12 Miscellaneous 75,686 75,686 28,214 (47,472) Sale of city assets 30,000 30,000 (30,000) Amounts available for appropriation 2,065,791 2,065,791 1,919,388 (146,403)Charges to appropriations (outflows) General government 568,075 568,075 445,922 122,153 Capital improvements 576,935 576,935 284,167 292,768 Total charges to appropriations 1,145,010 1,145,010 730,089 414,921Fund balance, December 31 $920,781 $920,781 $1,189,299 $268,518
See accompanying notes to the required supplementary information.
40 CITY OF KETTERING, OHIOREQUIRED SUPPLEMENTARY INFORMATIONBUDGET(GAAP BUDGET) TO ACTUAL COMPARISON SCHEDULE - EMERGENCY MEDICAL FUNDFOR THE YEAR ENDED DECEMBER 31, 2008
Budgeted Amounts Variance withOriginal Final Actual Final Budget
Fund balance, January 1 $4,214,424 $4,214,424 $4,214,424Resources (inflows) Charges for services 1,200,000 1,400,000 1,476,351 $76,351 Investment earnings 70,000 100,000 194,375 94,375 Amounts available for appropriation 5,484,424 5,714,424 5,885,150 170,726Charges to appropriations (outflows) Fire:
Operating expenditures 144,465 144,465 95,046 49,419 Capital outlay 575,000 575,000 575,000 Total fire 719,465 719,465 95,046 624,419 Capital Improvements Total charges to appropriations 719,465 719,465 95,046 624,419Fund balance, December 31 $4,764,959 $4,994,959 $5,790,104 $795,145
See accompanying notes to the required supplementary information.
CITY OF KETTERING, OHIO 41
NOTES TO THE REQUIRED SUPPLEMENTARY INFORMATION FOR THE YEAR ENDED DECEMBER 31, 2008 1. BUDGETS AND BUDGETARY ACCOUNTING
An annual budget for all governmental fund types covering the period January 1 through December 31 of the following year showing estimated revenues and expenditures is submitted to the County Auditor as Secretary of the County Budget Commission. The budget is passed by City Council, after public hearings are held, by July 15 of each year, and submitted to the County Budget Commission by July 20 of each year. The County Budget Commission certifies its actions relative to the annual budget to the City by September 1. As part of this certification, the City receives an official certificate of estimated resources which states the projected receipts by fund. On or about January 1, this certificate is amended to include any unencumbered fund balances from the preceding year. Prior to December 31, the City must revise its budget so that the total contemplated expenditures from any fund during the ensuing fiscal year will not exceed the amount stated in the certificate of estimated resources. The revised budget then serves as the basis for the annual appropriations ordinance. A temporary appropriations ordinance to control expenditures may be passed on or about January 1 of each year for the period January 1 through March 31. An annual appropriations ordinance must be passed by April 1 of each year for the period January 1 to December 31. The appropriations ordinance generally controls expenditures at the level of personal services, operating expenditures and capital outlay on a department level, except for the state highway fund, cemetery fund, police pension fund, DESC (Defense Electronics Supply Center) reuse fund, special safety grants and programs fund, community development fund, emergency medical fund and the capital projects fund which are controlled at the fund level. The City Manager has the authority to amend appropriations within the department at the levels of personal service, operating expenditures and capital outlay; amendments above this level require council approval. The ordinance may be amended or supplemented by Council during the year as required. Amendments to the appropriations ordinance made during the year were not material in relation to the original appropriations. Total expenditures in any fund do not exceed the estimated resources for that fund. Unencumbered appropriations lapse at year-end, while encumbered amounts are reappropriated in the following year’s budget. The Finance Director in conjunction with the annual budgeting process estimates revenues. However, these estimates are not included or required in the budget ordinance. The City, being a home rule municipal corporation, has adopted, through ordinance, GAAP (generally accepted accounting principles) as its budgetary basis. Encumbrance accounting, under which purchase orders, contracts, and other commitments for the expenditure of monies are recorded in order to reserve that portion of the applicable appropriation, is employed as an extension of formal budgetary control in the governmental funds. Encumbrances outstanding at year-end are reported as reservations of fund balance for subsequent year expenditures.
FINANCIAL STATEMENTS
OF
INDIVIDUAL FUNDS
44 CITY OF KETTERING, OHIO
NONMAJOR SPECIAL REVENUE FUNDSCOMBINING BALANCE SHEET DECEMBER 31, 2008
Special TotalState Police DESC Safety Grants Governmental
LIABILITIESAccounts payable $25,647 $22,527 $21,742 $69,916Accrued payroll $349,807 6,625 356,432Deferred revenue 104,788 408,000 1,058,157 1,570,945 Total liabilities 130,435 757,807 22,527 1,086,524 1,997,293FUND BALANCESReserved for: Encumbrances 22,311 235,935 258,246 Prepaid expenditures 848 848Unreserved 151,155 $365,643 10,051 19,111 1,130,928 1,676,888 Total fund balances 151,155 365,643 10,051 41,422 1,367,711 1,935,982 Total liabilities and fund balances $281,590 $365,643 $767,858 $63,949 $2,454,235 $3,933,275
CITY OF KETTERING, OHIO 45
NONMAJOR SPECIAL REVENUE FUNDSCOMBINING STATEMENT OF REVENUES, EXPENDITURES, AND CHANGES IN FUND BALANCES - BUDGET AND ACTUAL (GAAP BUDGET)FOR THE YEAR ENDED DECEMBER 31, 2008
State Highway CemeteryFinal Budget Actual Variance Final Budget Actual Variance
REVENUESProperty taxesIntergovernmental revenue $309,000 $172,421 ($136,579)Charges for services $9,000 $9,321 $321Fines and forfeitsInvestment earnings 10,000 10,541 541 9,000 13,453 4,453Refunds and reimbursementsMiscellaneous 5,000 5,400 400 Total revenues 319,000 182,962 (136,038) 23,000 28,174 5,174EXPENDITURESCurrent: General government 20,000 10,977 9,023 Police Fire Public works 202,500 116,022 86,478 Leisure servicesCapital improvements 281,000 146,924 134,076 Total expenditures 483,500 262,946 220,554 20,000 10,977 9,023 Excess (deficiency) of revenues over expenditures (164,500) (79,984) 84,516 3,000 17,197 14,197OTHER FINANCING SOURCES (USES) Transfers in Transfers out Net change in fund balance (164,500) (79,984) 84,516 3,000 17,197 14,197Fund balances--beginning 231,139 231,139 348,446 348,446Fund balances--ending $66,639 $151,155 $84,516 $351,446 $365,643 $14,197
46 CITY OF KETTERING, OHIO
NONMAJOR SPECIAL REVENUE FUNDSCOMBINING STATEMENT OF REVENUES, EXPENDITURES, AND CHANGES IN FUND BALANCES - BUDGET AND ACTUAL (GAAP BUDGET) - CONTINUEDFOR THE YEAR ENDED DECEMBER 31, 2008
Police Pension DESC ReuseFinal Budget Actual Variance Final Budget Actual Variance
REVENUESProperty taxes $408,000 $398,440 ($9,560)Intergovernmental revenue $300,000 ($300,000)Charges for services 34,000 $35,702 1,702Fines and forfeitsInvestment earningsRefunds and reimbursements 20,000 19,248 (752)Miscellaneous Total revenues 408,000 398,440 (9,560) 354,000 54,950 (299,050)EXPENDITURESCurrent: General government 293,392 196,236 97,156 Police 1,374,900 1,333,896 41,004 Fire Public works Leisure servicesCapital improvements 600,000 600,000 Total expenditures 1,374,900 1,333,896 41,004 893,392 196,236 697,156 Excess (deficiency) of revenues over expenditures (966,900) (935,456) 31,444 (539,392) (141,286) 398,106OTHER FINANCING SOURCES (USES) Transfers in 1,000,000 935,500 (64,500) 430,000 50,000 (380,000) Transfers out Net change in fund balance 33,100 44 (33,056) (109,392) (91,286) 18,106Fund balances--beginning 10,007 10,007 132,708 132,708Fund balances--ending $43,107 $10,051 ($33,056) $23,316 $41,422 $18,106
CITY OF KETTERING, OHIO 47
NONMAJOR SPECIAL REVENUE FUNDSCOMBINING STATEMENT OF REVENUES, EXPENDITURES, AND CHANGES IN FUND BALANCES - BUDGET AND ACTUAL (GAAP BUDGET) - CONTINUEDFOR THE YEAR ENDED DECEMBER 31, 2008
Special Safety Grants & Programs TotalFinal Budget Actual Variance Final Budget Actual Variance
REVENUESProperty taxes $408,000 $398,440 ($9,560)Intergovernmental revenue $2,073,277 $661,145 ($1,412,132) 2,682,277 833,566 (1,848,711)Charges for services 43,000 45,023 2,023Fines and forfeits 393,000 443,674 50,674 393,000 443,674 50,674Investment earnings 25,503 31,648 6,145 44,503 55,642 11,139Refunds and reimbursements 15,184 7,201 (7,983) 35,184 26,449 (8,735)Miscellaneous 229,000 275,043 46,043 234,000 280,443 46,443 Total revenues 2,735,964 1,418,711 (1,317,253) 3,839,964 2,083,237 (1,756,727)EXPENDITURESCurrent: General government 700,616 466,605 234,011 1,014,008 673,818 340,190 Police 515,381 275,922 239,459 1,890,281 1,609,818 280,463 Fire 3,000 3,000 3,000 3,000 Public works 1,439,093 1,316,512 122,581 1,641,593 1,432,534 209,059 Leisure services 71,349 14,176 57,173 71,349 14,176 57,173Capital improvements 486,200 36,521 449,679 1,367,200 183,445 1,183,755 Total expenditures 3,215,639 2,109,736 1,105,903 5,987,431 3,913,791 2,073,640 Excess (deficiency) of revenues over expenditures (479,675) (691,025) (211,350) (2,147,467) (1,830,554) 316,913OTHER FINANCING SOURCES (USES) Transfers in 568,014 321,721 (246,293) 1,998,014 1,307,221 (690,793) Transfers out Net change in fund balance 88,339 (369,304) (457,643) (149,453) (523,333) (373,880)Fund balances--beginning 1,737,015 1,737,015 2,459,315 2,459,315Fund balances--ending $1,825,354 $1,367,711 ($457,643) $2,309,862 $1,935,982 ($373,880)
48 CITY OF KETTERING, OHIO
DEBT SERVICE FUNDSTATEMENT OF REVENUES, EXPENDITURES, AND CHANGES IN FUND BALANCE - BUDGET AND ACTUAL (GAAP BUDGET)FOR THE YEAR ENDED DECEMBER 31, 2008
Final Budget Actual VarianceREVENUESProperty taxes $1,335,000 $1,303,288 ($31,712)Investment earnings 30,000 31,036 1,036Special assessments 149,000 149,592 592Refunds and reimbursements 30,000 29,803 (197) Total revenues 1,544,000 1,513,719 (30,281)EXPENDITURESCurrent: General government 2,500 2,500Debt service: Principal 642,740 642,740 Interest 1,140,310 1,140,309 Total expenditures 1,785,550 1,783,049 2,500 Deficiency of revenues over expenditures (241,550) (269,330) (27,780)OTHER FINANCING SOURCES (USES) Transfers in 280,000 265,000 (15,000) Net change in fund balance 38,450 (4,330) (42,780)Fund balances--beginning 16,697 16,697Fund balances--ending $55,147 $12,367 ($42,780)
CITY OF KETTERING, OHIO 49
CAPITAL PROJECTS FUNDSTATEMENT OF REVENUES, EXPENDITURES, AND CHANGES IN FUND BALANCE - BUDGET AND ACTUAL (GAAP BUDGET)FOR THE YEAR ENDED DECEMBER 31, 2008
Final Budget Actual VarianceREVENUESProperty taxes $117,000 $111,578 ($5,422)Intergovernmental 3,854,000 4,319,698 465,698Special assessments 473,000 472,813 (187)Refunds and reimbursements 798,000 49,589 (748,411) Total revenues 5,242,000 4,953,678 (288,322)EXPENDITURESCapital improvements 9,473,555 6,184,786 3,288,769 Total expenditures 9,473,555 6,184,786 3,288,769 Deficiency of revenues over expenditures (4,231,555) (1,231,108) 3,000,447OTHER FINANCING SOURCES (USES) Transfers in 5,164,200 659,000 (4,505,200) Net change in fund balance 932,645 (572,108) (1,504,753)Fund balances--beginning 1,883,076 1,883,076Fund balances--ending $2,815,721 $1,310,968 ($1,504,753)
50 CITY OF KETTERING, OHIO
CAPITAL PROJECTS FUNDDETAILED SCHEDULE OF EXPENDITURES COMPARED TO BUDGET (GAAP BUDGET)FOR THE YEAR ENDED DECEMBER 31, 2008
Final Budget Actual VarianceCapital improvements: Traffic controls $337,924 $128,335 $209,589 Street construction 5,335,137 3,683,124 1,652,013 Drainage 160,000 35,908 124,092 Parks and recreation 752,000 147,676 604,324 Tree planting and landscaping 102,148 26,763 75,385 Other 2,786,346 2,162,980 623,366 Total capital projects fund $9,473,555 $6,184,786 $3,288,769
CITY OF KETTERING, OHIO 51
INTERNAL SERVICE FUNDSCOMBINING BALANCE SHEETDECEMBER 31, 2008
Administrative HealthOperations Insurance Totals
ASSETSCurrent assets: Pooled cash and investments $160,337 $26,260 $186,597 Accounts receivable 587 587 Due from other governments 10,986 10,986 Prepaid expenses 397 397 Inventory 297,635 297,635 Total current assets 469,942 26,260 496,202Noncurrent assets: Buildings and improvements 769,344 769,344 Machinery and equipment 2,163,719 2,163,719 Less: Accumulated depreciation (2,250,612) (2,250,612) Total noncurrent assets 682,451 682,451 Total assets $1,152,393 $26,260 $1,178,653
LIABILITIESCurrent liabilities: Accounts payable $180,864 $180,864 Accrued payroll 169,009 169,009 Total current liabilities 349,873 349,873Noncurrent liabilities: Accrued vacation and sick leave benefits 309,171 309,171 Total liabilities 659,044 659,044NET ASSETSInvested in capital assets 682,451 682,451Unrestricted (189,102) $26,260 (162,842) Total net assets 493,349 26,260 519,609 Total liabilities and net assets $1,152,393 $26,260 $1,178,653
52 CITY OF KETTERING, OHIO
INTERNAL SERVICE FUNDSCOMBINING STATEMENT OF REVENUES, EXPENSES, AND CHANGES IN FUND NET ASSETSFOR THE YEAR ENDED DECEMBER 31, 2008
Administrative HealthOperations Insurance Totals
OPERATING REVENUESCharges for services $6,168,871 $4,810,565 $10,979,436 Total operating revenues 6,168,871 4,810,565 10,979,436OPERATING EXPENSESPersonal services 3,096,738 3,096,738Repairs and maintenance 1,858,404 1,858,404Contractual services 650,508 4,817,429 5,467,937Other materials and expenses 563,428 563,428Depreciation 158,863 158,863 Total operating expenses 6,327,941 4,817,429 11,145,370 Operating income (loss) (159,070) (6,864) (165,934)NONOPERATING REVENUES (EXPENSES)Investment earnings 15,325 15,325 Change in net assets (143,745) (6,864) (150,609) Total net assets--beginning 637,094 33,124 670,218 Total net assets--ending $493,349 $26,260 $519,609
CITY OF KETTERING, OHIO 53
INTERNAL SERVICE FUNDS COMBINING STATEMENT OF CASH FLOWSFOR THE YEAR ENDED DECEMBER 31, 2008Increase (Decrease) in cash
Administrative HealthOperations Insurance Totals
CASH FLOWS FROM OPERATING ACTIVITIESCash received for services $6,179,531 $4,810,565 $10,990,096Cash paid to suppliers for goods or services (3,067,427) (4,817,429) (7,884,856)Cash paid to employees for services (3,080,770) (3,080,770) Net cash provided (used) by operating activities 31,334 (6,864) 24,470CASH FLOWS FROM CAPITAL AND RELATED FINANCING ACTIVITIESAcquisition of capital assets (337,998) (337,998)Sale of capital assets 2,714 2,714 Net cash used by capital and related financing activities (335,284) (335,284)CASH FLOWS FROM INVESTING ACTIVITIESInvestment earnings 15,325 15,325 Net cash provided by investing activities 15,325 0 15,325 Net increase (decrease) in cash (288,625) (6,864) (295,489)Cash at beginning of year 448,962 33,124 482,086Cash at end of year $160,337 $26,260 $186,597
RECONCILIATION OF OPERATING INCOME (LOSS) TO NET CASH PROVIDED (USED) BY OPERATING ACTIVITIESOperating income (loss) ($159,070) ($6,864) ($165,934)Adjustments to reconcile operating income (loss) to net cash provided (used) by operating activities: Depreciation 158,863 158,863 (Increase) decrease in receivables 13,374 13,374 (Increase) decrease in inventories 15,514 15,514 Increase (decrease) in accounts payable (14,715) (14,715) Net (increase) decrease in other operating net assets 17,368 17,368 Net cash provided (used) by operating activities $31,334 ($6,864) $24,470
54 CITY OF KETTERING, OHIO
AGENCY FUNDSCOMBINING STATEMENT OF CHANGES IN ASSETS AND LIABILITIESFOR THE YEAR ENDED DECEMBER 31, 2008
This part of the City of Kettering’s comprehensive annual financial report presents detailed information as a context for understanding what the information in the financial statements, note disclosures, and required supplementary information says about the City’s overall financial health. Category Schedule #s Financial Trends 1, 2, 3 & 4 These schedules contain trend information to help the reader understand how the City’s financial performance and well-being have changed over time. Revenue Capacity 5 & 6 These schedules contain information to help the reader assess the City’s most significant local revenue source, the income tax. Debt Capacity 7 & 8 These schedules present information to help the reader assess the affordability of the City’s current levels of outstanding debt and the City’s ability to issue additional debt in the future. Economic and Demographic Information 9 & 10 These schedules offer economic and demographic indicators to help the reader understand the environment within which the City’s financial activities take place. Operating Information 11, 12 & 13 These schedules contain service and infrastructure data to help the reader
understand how the information in the City’s financial report relates to the services the City provides.
Sources: Unless otherwise noted, the information in these schedules is derived from the comprehensive annual financial reports for the relevant year.
CITY OF KETTERING, OHIO 58
SCHEDULE 1NET ASSETS BY CATEGORYLAST TEN YEARS (accrual basis of accounting )
1999 2000 2001 2002 2003 2004 2005 2006 2007 2008Governmental activities Invested in capital assets, net of related debt $83,168,667 $91,355,281 $95,986,319 $100,065,903 $109,267,077 $112,412,581 $112,076,412 $113,557,610 $113,438,967 $113,942,666 Restricted for: Debt service 153,118 172,832 38,533 46,554 34,549 15,178 15,638 16,476 16,697 12,367 Community development block grant 2,285,033 2,168,695 2,035,858 2,080,807 1,863,768 1,043,771 1,255,296 1,379,856 1,495,228 1,409,593 Emergency medical 912,249 1,194,939 1,654,299 2,945,419 4,288,697 5,910,129 Municipal court activities 418,917 338,740 559,340 742,720 957,095 1,112,424 660,228 764,100 876,020 1,054,048 Other purposes 584,034 155,634 597,899 732,386 495,406 471,289 546,270 602,395 653,883 900,453 Unrestricted 29,181,595 33,743,585 34,320,366 33,037,037 29,905,347 26,619,777 28,054,056 30,230,404 36,673,435 44,019,123Total net assets $115,791,364 $127,934,767 $133,538,315 $136,705,407 $143,435,491 $142,869,959 $144,262,199 $149,496,260 $157,442,927 $167,248,379
Note: Accounting standards require that net assets be reported in three components in the financial statements: invested in capital assets, net of related debt; restricted; and unrestricted. Net assets are considered restricted when (1) and external party, such as the state or federal government, places a restriction on how the resourcesmay be used, or (2) enabling legislation is enacted by the city.
Year
Net Assets (accrual basis)
$0
$20
$40
$60
$80
$100
$120
$140
$160
$180
1999
2000
2001
2002
2003
2004
2005
2006
2007
2008
Mill
ions
UnrestrictedTotal net assets
CITY OF KETTERING, OHIOSCHEDULE 2
CHANGES IN NET ASSETSLAST TEN YEARS (accrual basis of accounting )
1999 2000 2001 2002 2003 2004 2005 2006 2007 2008Expenses General government $8,882,212 $10,324,836 $10,716,604 $11,179,273 $12,142,127 $13,210,288 $12,339,967 $14,150,379 $17,232,295 $13,755,091 Police 9,163,871 9,413,721 10,270,530 10,626,973 10,840,287 11,282,263 11,530,015 12,914,191 12,849,315 13,760,327 Fire 6,374,476 6,356,550 7,349,117 7,569,675 7,768,263 8,768,088 8,380,554 8,709,771 8,932,687 9,666,999 Public works 9,366,194 9,791,899 9,812,828 10,803,744 11,236,775 11,926,820 11,813,178 11,360,485 12,263,789 13,404,095 Leisure services 10,427,534 10,231,388 10,832,180 11,665,610 11,479,183 11,834,644 11,873,881 12,416,056 12,234,615 13,254,478 Interest on long term debt 749,636 619,018 541,085 458,517 386,200 292,918 1,168,357 1,180,009 1,148,457 1,144,483Total expenses 44,963,923 46,737,412 49,522,344 52,303,792 53,852,835 57,315,021 57,105,952 60,730,891 64,661,158 64,985,473Program Revenues Charges for services: General government 1,678,418 1,686,309 2,015,725 2,353,231 2,344,241 2,436,404 2,704,373 2,496,686 2,623,279 2,644,901 Fire 1,144,791 986,737 1,156,577 1,343,281 1,433,964 1,522,104 Leisure services 3,823,331 3,907,797 4,098,781 4,508,945 4,398,036 5,085,696 5,379,969 5,344,896 5,852,344 6,439,659 Other activities 2,660 880 205 67,602 62,639 55,265 56,126 64,520 85,171 Operating grants and contributions 1,959,598 1,860,874 1,216,785 1,743,952 1,388,760 1,623,605 1,563,184 1,253,950 1,225,065 2,367,960 Capital grants and contributions: Public works 1,229,161 4,449,371 4,284,996 3,779,248 6,560,882 2,583,208 2,187,075 3,216,110 3,286,179 1,677,377 Other activities 27,225 25,000 367,750 58,653 29,216 203,067 904,254 302,002 36,521Total program revenues 8,717,733 11,932,011 11,984,917 12,385,581 15,962,965 12,807,505 13,249,510 14,615,303 14,787,353 14,773,693Net (Expense)/Revenue 1
(1)Net (expense)/revenue is the difference between the expenses and program revenues of a function or program. It indicates the degree to which a function or program is supported with its ownfees and program-specific grants versus its reliance upon funding from taxes and other general revenues. Numbers in parentheses indicate that expenses were greater than program revenuesand therefore general revenues were needed to finance that function or program. Numbers without parentheses mean that program revenues were more than sufficient to cover expenses.(2)In 1999 the City was in the final stages of converting a closed Air Force base to private use. The U.S. Government deeded over to the City a building located on the former base. The fair market value at the time of donation was $4.2 million.
59
CITY OF KETTERING, OHIO 60
SCHEDULE 3FUND BALANCES, GOVERNMENTAL FUNDSLAST TEN YEARS (modified accrual basis of accounting )
Source: City of Kettering, Ohio, Finance DepartmentThe City levies a 2.25% income tax on substantially all income earned within the City. Additional increases in the income taxrate require voter approval. City residents pay City income tax on income earned outside the City, however; a credit is allowedfor income taxes paid to other municipalities. Employers within the City withhold income tax on employee compensation andremit at least quarterly.
SCHEDULE 6RANKING OF TOP TEN INCOME TAX WITHHOLDERS CURRENT YEAR AND TEN YEARS AGO (cash basis of accounting )
Rank Name 2008 Rank Rank Name1 Kettering Medical Center 41 1 General Motors Corporation2 GE Money 1 2 Kettering Medical Center3 Reynolds & Reynolds Company 6 3 Federal Government4 Delphi Automotive Systems Services LLC 5 4 Kettering Board of Education5 Kettering Board of Education 21 5 Banc One Management Corp.6 Federal Government 71 6 Scitex Digital Printing Inc.7 Eastman Kodak Company 8 7 City of Kettering8 City of Kettering - 8 Valeo Electrical Systems Inc.9 Limited Brands Inc. & Subs - 9 Reed Elsevier Inc.
10 Time Warner Entertainment Inc. - 10 Meijer Inc.Combined percentage of Combined percentage of Total Income taxes 31.5% Total Income taxes 35.4%
Source: City of Kettering, Ohio, Finance DepartmentDue to legal restrictions and confidentiality requirements, the City cannot disclose the amount of withholdings by taxpayer. The City chose not to disclose percentages and number of filers by income level because the City does not require all taxpayers to file a return, therefore it does not have, nor can it obtain, this type of information.
(1) Delphi Automotive Systems Services LLC is a spinoff of General Motors Corporation; GE Money reports the activity formerly known as Banc One Management Corp.; Scitex Digital Printing Inc. was purchased by Eastman Kodak Company.
1998
Individual
2008
Income Tax Revenues
$0$5
$10$15$20$25$30$35$40$45
1999 2000 2001 2002 2003 2004 2005 2006 2007 2008
Mill
ions
CITY OF KETTERING, OHIOSCHEDULE 7
RATIOS OF OUTSTANDING DEBT BY TYPE AND LEGAL DEBT MARGINS - LAST TEN YEARS
1999 2000 2001 2002 2003 2004 2005 2006 2007 2008
General Obligation Bonds $10,418,777 $8,997,168 $7,514,792 $5,966,977 $4,349,119 $2,643,554 $5,563,536 $4,564,339 $4,218,631 $3,879,270 Percent of estimated actual property value 0.35% 0.28% 0.24% 0.19% 0.13% 0.08% 0.16% 0.12% 0.11% 0.10% Per capita 172 156 131 104 76 46 97 79 73 67
Less debt outside limitations: Special Assessment Debt 1,378,574 1,288,184 1,193,560 1,094,375 990,233 905,798 816,127 720,807 619,149 510,730 Promissory Notes 757,129 685,994 2,545,494 3,461,615 3,241,766 3,278,644 3,075,818 2,856,949 2,637,298 2,442,338Less debt service fund balance 153,118 117,532 38,533 46,554 34,549 15,178 15,638 16,476 16,697 12,367Net debt within limitations for both Voted and Unvoted debt 10,265,659 8,879,636 7,476,259 5,920,423 4,314,570 2,628,376 5,547,898 4,547,863 4,201,934 3,866,903
Debt limitation for both Voted and Unvoted debt 10.5% of assessed valuation 107,882,576 115,575,064 115,633,711 114,650,117 124,670,352 122,665,459 122,629,124 134,354,645 132,966,025 131,355,181
Legal debt margin for Voted and Unvoted debt $97,616,917 $106,695,428 $108,157,452 $108,729,694 $120,355,782 $120,037,083 $117,081,226 $129,806,782 $128,764,091 $127,488,278Net debt within limitations for both Voted and Unvoted debt as a percentage of debt limit 9.52% 7.68% 6.47% 5.16% 3.46% 2.14% 4.52% 3.38% 3.16% 2.94%
Net debt within limitations for both Voted and Unvoted limitation $10,265,659 $8,879,636 $7,476,259 $5,920,423 $4,314,570 $2,628,376 $5,547,898 $4,547,863 $4,201,934 $3,866,903Less voted debt 4,699,352 3,924,352 3,114,352 2,264,352 1,369,352 429,352 294,663 180,147 82,780 0Net debt within limitations for Unvoted debt 5,566,307 4,955,284 4,361,907 3,656,071 2,945,218 2,199,024 5,253,235 4,367,716 4,119,154 3,866,903
Debt limitation for Unvoted debt 5.5% of assessed valuation 56,509,921 60,539,319 60,570,039 60,054,823 65,303,518 64,253,336 64,234,303 70,376,243 69,648,870 68,805,095
Legal debt margin for Unvoted debt $50,943,614 $55,584,035 $56,208,132 $56,398,752 $62,358,300 $62,054,312 $58,981,068 $66,008,527 $65,529,716 $64,938,192Net debt within limitations for Unvoted debt as a percentage of debt limit 9.85% 8.19% 7.20% 6.09% 4.51% 3.42% 8.18% 6.21% 5.91% 5.62%
Source: City of Kettering, Ohio, Finance Department
63
64 CITY OF KETTERING, OHIOSCHEDULE 8
DIRECT AND OVERLAPPING DEBTDECEMBER 31, 2008
Percentage AmountState of Ohio Applicable Applicable
Net Debt to City of to City ofJurisdiction Outstanding Kettering1 Kettering
City of Kettering $6,309,241 100.0% $6,309,241Kettering City School District 103,649,982 92.0% 95,357,983Montgomery County 44,137,933 12.0% 5,296,552Beavercreek Local School District 31,018,152 0.9% 279,163Total $185,115,308 $107,242,939
Source: Individual jurisdictions. (1) The percentage of overlapping debt applicable is estimated using assessed property values. Applicable percentages were estimated by determining the portion of another governmental unit's assessed value that is within the City's boundaries and dividing it by each unit's total assessed value. Individual jurisdictions with immaterial amounts of overlapping debt are excluded from this table.
SCHEDULE 9DEMOGRAPHIC AND ECONOMIC STATISTICSLAST TEN YEARS
Per capita Avg Sale Price Personal Unemployment for a Single Total Assessed Estimated Actual
Year Population 1 Personal Income 2 Income 1,2 Rate 3 Family Home 4 Property Value 5 Property Value 5
(1) 1990 & 2000 United States Census Bureau.(2) City of Kettering, Ohio, Finance Department.(3) Ohio Bureau of Employment Services.(4) Dayton Area Board of Realtors, Dayton, Ohio (2008 price range: $17,000 - $800,000).(5) Montgomery County, Ohio, Auditor's Office.
Unemployment Rate
0.0%1.0%2.0%3.0%4.0%5.0%6.0%7.0%8.0%
99 00 01 02 03 04 05 06 07 08 Year
citystatenation
Per Capita Personal Income
10,000
15,000
20,000
25,000
30,000
35,000
40,000
99 00 01 02 03 04 05 06 07 08
CITY OF KETTERING, OHIO 65
SCHEDULE 10PRINCIPAL EMPLOYERSCURRENT YEAR AND EIGHTEEN YEARS AGO
19901
% of % of Total City Total City
Employer Employees Employment Employer Employees EmploymentKettering Medical Center 3,100 10.76% General Motors Corporation 2 4,405 13.39%GE Money 1,700 5.90% Kettering Medical Center 2,975 9.04%Reynolds & Reynolds Company 1,500 5.21% Defense Electronics Supply Center 2,500 7.60%Kettering City Schools 1,055 3.66% Kroger Company 1,313 3.99%Intimate Brands Inc. 1,000 3.47% Kettering City Schools 1,033 3.14%City of Kettering 900 3.13% Meijer Inc 900 2.74%Kodak Versamark 700 2.43% City of Kettering 800 2.43%Meijer Inc. 550 1.91% Eastman Kodak Company 2 350 1.06%Tenneco 300 1.04% Ohio Bell Telephone Company 292 0.89%
Total 10,805 37.52% Total 14,568 44.28%
Source: City of Kettering, Ohio, Office of Economic Development(1) Past information is available every 10 years.(2) Tenneco now owns the plant formerly owned by General Motors Corp.; Kodak Versamark is a division of Eastman Kodak Co.
SCHEDULE 11CITY GOVERNMENT EMPLOYEES BY FUNCTION/PROGRAM (full-time equivalents)LAST TEN YEARS
(1) City of Kettering, Human Resources Department (2) City of Kettering, Planning and Development Dept. Permits and inspections performed include Building, Electrical, Plumbing & Heating.(3) City of Kettering, Planning and Development Department. Community Development Block Grant (CDBG) loan applications processed include housing rehabilitation, purchase rehabilitation, and business loan applications.(4) City of Kettering, Finance Department. Payroll checks include electronic funds transfers processed for payroll.(5) City of Kettering, Finance Department.(6) City of Kettering, Law Department(7) City of Kettering, Municipal Court(8) City of Kettering, Police Department. Criminal arrests include arrests by detective section and patrol.(9) City of Kettering, Police Department.(10) City of Kettering, Fire Department.(11) City of Kettering, Public Service Department, Engineering Division(12) City of Kettering, Public Service Department, Street Division(13) City of Kettering, Parks, Recreation, and Cultural Arts Department
SCHEDULE 13CAPITAL ASSET AND INFRASTRUCTURE STATISTICS BY FUNCTION/PROGRAMLAST TEN YEARSFunction/program 1999 2000 2001 2002 2003 2004 2005 2006 2007 2008General Government Square footage occupied1 25,582 25,582 25,582 25,582 25,582 25,582 43,108 43,108 43,108 54,933Police Stations1 1 1 1 1 1 1 1 1 1 1 Square footage of building1 16,515 16,515 16,515 16,515 16,515 16,515 16,515 16,515 16,515 16,515Fire Stations1 7 7 7 7 7 7 7 7 7 7Public Works Miles of roads2 244 244 246 246 246 246 246 246 246 246 Miles of storm sewer/channel2 172 172 173 174 174 175 175 175 175 175Leisure Services Number of parks3 21 21 21 21 21 21 21 21 21 21 Area of parks (acres)3 408 408 408 419 419 419 419 419 419 419 Recreation complexes square ft 1 145,000 145,000 145,000 145,000 145,000 145,000 153,512 153,512 153,512 153,512
(1) City of Kettering, Facilities Department (2) City of Kettering, Public Service Department, Engineering Division(3) City of Kettering, Parks, Recreation, and Cultural Arts Department
CITY OF KETTERING, OHIO
COMPREHENSIVE ANNUAL FINANCIAL REPORT
YEAR ENDED DECEMBER 31, 2009
Prepared by:
Department of Finance Nancy H. Gregory, CPA, Director
CITY OF KETTERING, OHIO i
COMPREHENSIVE ANNUAL FINANCIAL REPORTFOR THE YEAR ENDED DECEMBER 31, 2009
TABLE OF CONTENTS
PageINTRODUCTORY SECTIONLetter of Transmittal iiiCity Officials viDepartment of Finance Staff viiCity Organizational Chart viiiCertificate of Achievement for Excellence in Financial Reporting ix
Government-wide Financial Statements: Statement of Net Assets 10 Statement of Activities 11 Fund Financial Statements: Fund Balance Sheets - Governmental Funds 12 Statement of Revenues, Expenditures and Changes in Fund Balances - Governmental Funds 14 Balance Sheet - Proprietary Funds 16 Statement of Revenues, Expenses and Changes in Net Assets - Proprietary Funds 17 Statement of Cash Flows - Proprietary Funds 18 Statement of Fiduciary Net Assets - Fiduciary Funds 19 Statement of Changes in Fiduciary Net Assets - Fiduciary Funds 19 Notes to the Basic Financial Statements 21
Required Supplementary Information: Budget (GAAP Budget) to Actual Comparison Schedule - General Fund 34 Budget (GAAP Budget) to Actual Comparison Schedule - Street Maintenance Fund 36 Budget (GAAP Budget) to Actual Comparison Schedule - Parks Recreation and Cultural Arts Fund 37 Budget (GAAP Budget) to Actual Comparison Schedule - Fraze Pavilion Fund 38 Budget (GAAP Budget) to Actual Comparison Schedule - Community Development Fund 39 Budget (GAAP Budget) to Actual Comparison Schedule - Emergency Medical Fund 40 Notes to the Required Supplementary Information 41
SUPPLEMENTAL DATANonmajor Special Revenue Funds: Combining Balance Sheet 44 Combining Statement of Revenues, Expenditures and Changes in Fund Balances- Budget and Actual (GAAP Budget) 45Debt Service Fund: Statement of Revenues, Expenditures and Changes in Fund Balance - Budget and Actual (GAAP Budget) 48Capital Projects Fund: Statement of Revenues, Expenditures and Changes in Fund Balance - Budget and Actual (GAAP Budget) 49 Detailed Schedule of Expenditures Compared to Budget (GAAP Budget) 50Internal Service Funds: Combining Balance Sheet 51 Combining Statement of Revenues, Expenses and Changes in Fund Net Assets 52 Combining Statement of Cash Flows 53Agency Funds: Combining Statement of Changes in Assets and Liabilities 54Miscellaneous Schedules: Debt Schedule 55
ii CITY OF KETTERING, OHIOCOMPREHENSIVE ANNUAL FINANCIAL REPORTFOR THE YEAR ENDED DECEMBER 31, 2009
TABLE OF CONTENTS - CONTINUED
Schedule PageSTATISTICAL SECTIONNet Assets by Category Last Ten Years 1 58Changes in Net Assets Last Ten Years 2 59Fund Balances, Governmental Funds Last Ten Years 3 60Changes in Fund Balances, Governmental Funds Last Ten Years 4 61Income Tax by Payer Type and Income Tax Rate Last Ten Years 5 62Ranking of Top Ten Income Tax Withholders Current Year and Ten Years Ago 6 62Ratios of Outstanding Debt by Type and Legal Debt Margins Last Ten Years 7 63Direct and Overlapping Debt 8 64Demographic and Economic Statistics Last Ten Years 9 64Principal Employers Current Year and Eighteen Years Ago 10 65City Government Employees by Function/Program Last Ten Years 11 65Operating Indicators by Function/Program Last Ten Years 12 66Capital Asset and Infrastructure Statistics by Function/Program Last Ten Years 13 66
March 31, 2010 Honorable Mayor, Members of City Council and Citizens of Kettering, Ohio: The Comprehensive Annual Financial Report for the City of Kettering for the year ended December 31, 2009, is hereby submitted. Responsibility for the accuracy of the data and the completeness and fairness of the presentation including all disclosures, rests with the City. To the best of our knowledge and belief, the enclosed data are accurate in all material respects and are reported in a manner designed to present fairly the financial position and results of operations of the City. All disclosures necessary to enable the reader to gain an understanding of the City’s financial activities have been included. The City provides various services including police and fire protection, parks, recreation and cultural arts, street maintenance, planning, zoning and other general governmental services. The City does not maintain utility operations. In addition to general governmental activities, the City oversees the Kettering Volunteer Firefighters Pension Plan, and the activities of the Plan are included in the reporting entity. However, Montgomery County, Greene County, Beavercreek, Centerville, Kettering, Sugarcreek and West Carrollton School Districts, Miami Conservancy District, Miami Valley Regional Transit Authority, Ohio Police and Fire Pension Fund and the Ohio Public Employees Retirement System have not met the established criteria for inclusion in the reporting entity and are excluded from this report. In addition, the City is one of twenty local cities involved in a public entity risk pool, Miami Valley Risk Management Association, Inc. This separate entity does not meet the established criteria for inclusion in the reporting entity and, accordingly is not included in the City’s financial report. HISTORY AND BACKGROUND Kettering was established as a village in 1952. Three years later, it achieved City status, adopted a Home Rule Charter and approved the Council/Manager form of government. The City of Kettering was named for its most outstanding citizen, Charles F. Kettering, a well-known philanthropist and inventor.
Kettering invented the automotive self-starter, and the “Bug,” the world’s first robot plane. The City operates under a Council/Manager form of government with a Mayor and six City Council members elected on a non-partisan basis for a term of four years. Kettering is known as a leader in many areas of municipal government, including financial reporting, traffic system management, police services, parks, recreation and cultural arts programs, intergovernmental cooperation and successfully structured volunteer programs. Kettering citizens are known for their community spirit and involvement. In fact, Kettering is commonly known as the “City of Volunteers.” The quality of living in any city can be measured best by the satisfaction of the residents with the services they receive. In Kettering, people like what they find. A recent survey showed that 98% of residents are satisfied with Kettering as a place to live. In 2008, Business Week magazine named Kettering the second best city in Ohio to raise a family. ECONOMIC CONDITION AND OUTLOOK During 2009 our local economy was hit hard by declining employment, which had a direct impact on our largest General Fund revenue, income tax. Fortunately the vote of our residents to increase the income tax rate effective January 1, 2007 increased our General Fund significantly during 2007 and 2008. As a result, the City is in a better position to weather the uncertainties of the current economy. Although the City has been negatively impacted by an overall decline in employment in the area, the overall effect was diminished due to the diversity of the employment base. Kettering’s business base ranges from some major employers headquartered in Kettering to many midsize companies specializing in technology or professional services down to smaller family owned businesses. Kettering’s largest employers include Kettering Medical Center (KMC) and Reynolds & Reynolds. KMC employs 3,100 and continued construction in 2009 of the Schuster Heart Hospital that will be a $70 million, 137,000 sq ft addition to the front of the facility. The new Heart Hospital will be a six story, state of the art facility
iv
focused on patient care with ninety private rooms. KMC anticipates completion in July 2010. Reynolds & Reynolds, a fortune 1000 company based in Dayton since 1866, has transitioned nicely following the merger with Universal Computer Systems (UCS) in 2006. The company completed a $19 million, 15,000 sq ft Data Center at the Miami Valley Research Park campus in 2009. Current employment at Reynolds & Reynolds is 1,250. G.E. Money’s interior renovations at the Kettering Business Park (KBP) location are complete, and the company continues to employ 1,700 at this site. Community Tissue Services began construction of a 90,000 sq ft office and tissue processing facility at the Miami Valley Research Park. The project will result in a $40 million investment and starting employment of about 175 employees. The anticipated completion date is February 2011. Other major employers in the city include Kettering City Schools, Limited Brands Inc., a catalogue order center for Victoria’s Secret, Eastman Kodak Company a manufacturer of digital printers, and a number of engineering firms and computer hardware and software related businesses. Kettering is about 95% developed so a primary focus of economic development in the city is on the redevelopment of underutilized sites. During 2009 private development of the former Groby’s Garden Center site continued. The new development, Charlotte’s Garden, is a mixed use of retail and office space. Charlotte’s Garden currently includes First Financial Bank, Chipotle’s Restaurant and an Armed Forces Career Center occupying 50% of a 10,000 sq ft office building. Construction of a Dewey’s Pizza is planned during 2010. The residential portion of the redevelopment of Kettering Pointe, formerly Van Buren Shopping Center, continued during 2009. The housing portion includes 35 lots of which 16 have been built or are under construction. The retail portion of the site is complete and fully leased with 10 retail sites, a post office and WesBanco Bank. Phase 3 of Madison’s Grant, a Ryan Homes housing development continued during 2009. Twenty-eight additional single-family homes were constructed during 2009. Madison’s Grant will include 154 new homes when the development is complete. A major undertaking in 2009 was the implementation of the plans for improvements to the city’s parks and recreation facilities. This program is the result of passage of the Parks and Recreation Bond Levy by Kettering voters in November 2008. The voters approved a $12.3 million levy with debt service to be paid from property tax revenues over a period of twenty years beginning in 2009. In addition to the voted portion, the city committed an additional $5
million of general funds for a total investment of $17.3 million. The planned improvements include major renovations to the Kettering Recreation Center’s indoor facilities and outdoor water park and improvements including new playground equipment in most of the city’s neighborhood parks. The long-term improvements are scheduled to be complete by the end of 2011. Kettering participates in ED/GE, a revenue sharing program that occurs among a number of communities in Montgomery County. Money from the program is distributed to the communities for economic development projects after an application for funds is filed and a board of local officials for the communities reviews and approves the projects. Although Kettering did not receive any funds for 2009, the City has benefited significantly in the past and will continue to apply for future funds as eligible opportunities become available. Unless a new agreement is reached, this Montgomery County program is scheduled to end after 2010. The City’s emphasis on economic development combined with the existing variety of businesses located within Kettering are significant factors affecting the future economic strength of this community. Promoting Kettering as a good place to do business for new businesses, as well as existing businesses, will continue to be one of our highest priorities. For a more in-depth analysis of the City's current economic condition, please see the Management Discussion and Analysis (MD&A) portion of the report starting on page 5 of the Financial Section. ACCOUNTING SYSTEM AND BUDGETARY CONTROL Management of the City is responsible for establishing and maintaining an internal control structure designed to ensure that the assets of the City are protected from loss, theft or misuse and to ensure that adequate accounting data are compiled to allow for the preparation of financial statements in conformity with generally accepted accounting principles. The internal control structure is designed to provide reasonable, but not absolute, assurance that these objectives are met. The concept of reasonable assurance recognizes that the cost of controls should not exceed the benefits likely to be derived, and the evaluation of costs and benefits requires estimates and judgments by management.
v
Budgetary Controls. The City maintains budgetary controls to ensure compliance with legal provisions embodied in the annual appropriated budget approved by City Council. Activities of the General Fund, Special Revenue Funds, the Debt Service Fund and the Capital Projects Fund are included in the annual appropriated budget. For more detailed budget information, please see the Notes to the Required Supplementary Information on page 41 of this report. OTHER INFORMATION Independent Audit. The basic financial statements of the City of Kettering were audited by Clark, Schaefer, Hackett & Co., Certified Public Accountants. See page 2 of the Financial Section of this report for their unqualified opinion. Awards. The Government Finance Officers Association of the United States and Canada (GFOA) awarded a Certificate of Achievement for Excellence in Financial Reporting to the City of Kettering, Ohio for its comprehensive annual financial report for the fiscal year ended December 31, 2008. The Certificate of Achievement is a prestigious national award recognizing conformance with the highest standards for preparation of state and local government financial reports. In order to be awarded a Certificate of Achievement, a government unit must publish an easily readable and efficiently organized comprehensive annual financial report, whose contents conform to program standards. Such reports must satisfy both generally accepted accounting principles and applicable legal requirements. A Certificate of Achievement is valid for a period of one year only. The City of Kettering has received a Certificate of Achievement for the last 27 consecutive years (fiscal years ended 1982-2008). We believe our current report continues to conform to the Certificate of Achievement Program requirements, and we are submitting it to GFOA. In addition, the City also received the GFOA’s Award for Distinguished Budget Presentation for its annual appropriated budget for the fiscal year beginning January 1, 2009. In order to receive this award, the City must publish a budget document that meets program criteria as a policy document, as an operations guide, as a financial plan and as a communications device. Acknowledgements. A note of sincere appreciation is extended to the many conscientious people who have contributed so much of their time and effort to the preparation of this report. The Finance Department staff, in particular, are to be commended
for their commitment to professional excellence as exemplified by the contents of this report. Finally, contributions to the financial condition of the City of Kettering by the Mayor, members of City Council, Assistant City Manager and Department Directors cannot be overemphasized. Their guidance and support represent invaluable factors necessary for the City to continue to manage the financial affairs and reporting requirements of municipal government within the Kettering Community. Respectfully submitted,
Mark Schwieterman City Manager
Nancy H. Gregory, CPA Director of Finance
vi
CITY OF KETTERING, OHIO
CITY OFFICIALS
Donald E. Patterson, Mayor
Frank SpolrichKeith Thompson
CITY MANAGER
Mark Schwieterman
INDEPENDENT AUDITORS
Clark, Schaefer, Hackett & Co.Certified Public Accountants
Tony Klepacz, Vice Mayor
Amy Schrimpf
Joseph D. Wanamaker
Bruce E. Duke
vii
CITY OF KETTERING, OHIO
DEPARTMENT OF FINANCE
STAFF
Nancy H. Gregory, CPA Finance DirectorScott J. Schwarberg, CPA Assistant Finance DirectorKelly M. O'Connell, CPA Budget ManagerMarcy K. Bare, CPA Tax ManagerEstelle O. Gibson, CPA Purchasing ManagerJoy J. Kuhn SecretaryKimberly L. Stevens, CPA Financial AnalystMartin J. Van Oss, CPA Financial AnalystRhonda L. South Finance Technician IIMary Anne Marshall Finance Technician IISharin L. Day Finance Technician IILynn A. Blumenschein Finance Technician IIKimberly M. Koogler Finance Technician IILou Ann Gubser Finance Technician I Patricia A. Siefert Finance Technician I Julie M. Byerly Finance Technician I Joyce A. Foley Finance Technician I Candace M. Grooms Finance Clerk - Part-TimeMelissa K. Schultz Finance Clerk - Part-Time
viii
ix
FINANCIAL SECTION
2525 north limestone street, ste. 103 springfield, oh 45503
www.cshco.com p. 937.399.2000 f. 937.399.5433
cincinnati | columbus | dayton | middletown | springfield
INDEPENDENT AUDITORS' REPORT Honorable Mayor, City Council and City Manager City of Kettering, Ohio We have audited the accompanying financial statements of the governmental activities, each major fund, and the aggregate remaining fund information of the City of Kettering, Ohio (the City), as of and for the year ended December 31, 2009, which collectively comprise the City’s basic financial statements as listed in the table of contents. These financial statements are the responsibility of the City’s management. Our responsibility is to express opinions on these financial statements based on our audit. We conducted our audit in accordance with auditing standards generally accepted in the United States of America and the standards applicable to financial audits contained in Government Auditing Standards,
issued by the Comptroller General of the United States. Those standards require that we plan and perform the audit to obtain reasonable assurance about whether the financial statements are free of material misstatement. An audit includes examining, on a test basis, evidence supporting the amounts and disclosures in the financial statements. An audit also includes assessing the accounting principles used and the significant estimates made by management, as well as evaluating the overall financial statement presentation. We believe that our audit provides a reasonable basis for our opinions. In our opinion, the financial statements referred to above present fairly, in all material respects, the respective financial position of the governmental activities, each major fund, and the aggregate remaining fund information of the City of Kettering, Ohio, as of December 31, 2009, and the respective changes in financial position and cash flows, where applicable, thereof for the year then ended in conformity with accounting principles generally accepted in the United States of America. As described in Note 14 to the basic financial statements, the City adopted the provisions of GASB Statement No. 54, Fund Balance Reporting and Governmental Fund Type Definitions, in 2009. In accordance with Government Auditing Standards, we have also issued our report dated March 30, 2010, on our consideration of the City's internal control over financial reporting and on our tests of its compliance with certain provisions of laws, regulations, contracts, and grant agreements and other matters. The purpose of that report is to describe the scope of our testing of internal control over financial reporting and compliance and the results of that testing, and not to provide an opinion on the internal control over financial reporting or on compliance.
That report is an integral part of an audit performed in accordance with Government Auditing Standards and should be considered in assessing the results of our audit. The Management’s Discussion and Analysis and budgetary comparison information on pages 5 through 9 and 34 through 41 are not a required part of the basic financial statements but are supplementary information required by accounting principles generally accepted in the United States of America. We have applied certain limited procedures, which consisted principally of inquires of management regarding the methods of measurement and presentation of the required supplementary information. However, we did not audit the information and express no opinion on it.
Our audit was conducted for the purpose of forming opinions on the financial statements that collectively comprise the City’s basic financial statements. The introductory section, combining and individual nonmajor fund financial statements, the schedule of bonds and notes, and statistical tables are presented for purposes of additional analysis and are not a required part of the basic financial statements. The combining and individual nonmajor fund financial statements and the schedule of bonds and notes have been subjected to the auditing procedures applied in the audit of the basic financial statements and, in our opinion, are fairly stated in all material respects in relation to the basic financial statements as a whole. The introductory section and statistical tables have not been subjected to the auditing procedures applied in the audit of the basic financial statements and, accordingly, we express no opinion on them.
Springfield, Ohio March 30, 2010
CITY OF KETTERING, OHIO 5
MANAGEMENT’S DISCUSSION AND ANALYSIS (unaudited) Our discussion and analysis of the City of Kettering’s financial performance provides an overview of the City’s financial activities for the fiscal year ended December 31, 2009. FINANCIAL HIGHLIGHTS 1. The City’s net assets increased by $8,563,000 or 5% while unrestricted net assets increased $2,293,000 or 5%. 2. Total revenues decreased 4.0% while total expenses decreased 3%. 3. Income tax revenues decreased $3,535,000 or 9.2% 4. The General Fund reported a decrease in fund balance of $69,000, reversing a four-year trend of rising fund
balances. 5. The Fraze Pavilion required no General Fund transfer for the fourth time in its 19-year history. 6. The City issued $12,300,000 in general obligation bonds for parks and recreation improvements. 7. Total costs of services decreased by 2%, while net costs of services decreased by 3.7%. USING THIS ANNUAL REPORT This annual report consists of a series of financial statements. The Statement of Net Assets and the Statement of Activities (on pages 10 and 11) provide information about the activities of the City as a whole and present a longer-term view of the City’s finances. Fund financial statements start on page 12. For governmental activities, these statements tell how these services were financed in the short term as well as what remains for future spending. Fund financial statements also report the City’s operations in more detail than the government-wide statements by providing information about the City’s most significant funds. The remaining statements provide financial information about activities for which the City acts solely as a trustee or agent for the benefit of those outside of the government. Reporting the City as a Whole The Statement of Net Assets and the Statement of Activities Our analysis of the City as a whole begins on page 6. One of the most important questions asked about the City’s finances is, “Is the City as a whole better off or worse off as a result of the year’s activities?” The Statement of Net Assets and the Statement of Activities report information about the City as a whole and about its activities in a way that help answer this question. These statements include all assets and liabilities using the accrual basis of accounting, which is similar to the accounting used by most private-sector companies. All of the current year’s revenues and expenses are taken into account regardless of when cash is received or paid. These two statements report the City’s net assets and changes in them. You can think of the City’s net assets — the difference between assets and liabilities — as one way to measure the City’s financial health, or financial position. Over time, increases or decreases in the City’s net assets are one indicator of whether its financial health is improving or deteriorating. You will need to consider other nonfinancial factors, however, such as changes in the City’s property tax base, the condition of the City’s roads, the condition of the City’s neighborhoods, and the reputation of the public schools to assess the overall health of the City. Reporting the City’s Most Significant Funds Fund Financial Statements Our analysis of the City’s major funds begins on page 8. The fund financial statements begin on page 12 and provide detailed information about the most significant funds — not the City as a whole. Some funds are required to be established by State law and by bond covenants. However, the Finance Director establishes many other funds to help
6
control and manage money for particular purposes or to show that the City is meeting legal responsibilities for using certain taxes, grants, and other money (like grants received from the U.S. Department of Housing and Urban Development). The City’s two kinds of funds — governmental and proprietary — use different accounting approaches. • Governmental funds — Most of the City’s basic services are reported in governmental funds, which focus on
how money flows into and out of those funds and the balances left at year-end that are available for spending. These funds are reported using an accounting method called modified accrual accounting, which measures cash and all other financial assets that can readily be converted to cash. The governmental fund statements provide a detailed short-term view of the City’s general government operations and the basic services it provides. Governmental fund information helps you determine whether there are more or fewer financial resources that can be spent in the near future to finance the City’s programs. The relationship (or differences) between governmental activities (reported in the Statement of Net Assets and the Statement of Activities) and governmental funds is described in a reconciliation at the bottom of the fund financial statements.
• Proprietary funds — The City uses internal service funds (a component of proprietary funds) to report activities that provide supplies and services for the City’s other programs and activities. An example of an internal service fund would be the City’s Administrative Operations Fund, which accounts for activities of the Vehicle Maintenance Center, the Print Shop, and others. Proprietary funds are reported in the same way that all activities are reported in the Statement of Net Assets and the Statement of Activities.
The City as Trustee Reporting the City’s Fiduciary Responsibilities The City is the trustee, or fiduciary, for its volunteer firefighters pension plan. It is also responsible for other assets that — because of a trust arrangement — can be used only for the trust beneficiaries. All of the City’s fiduciary activities are reported in separate Statements of Fiduciary Net Assets and Changes in Fiduciary Net Assets on page 19. We exclude these activities from the City’s other financial statements because the City cannot use these assets to finance its operations. The City is responsible for ensuring that the assets reported in these funds are used for their intended purposes. THE CITY AS A WHOLE For 2009 the City produced a 5.2% increase in total net assets. This compares with a 6.2% increase in 2008. Revenues generated were $71.6 million and expenses from all programs were $63.0 million resulting in a surplus for the year of $8,563,000. The unrestricted net assets — the part of net assets that can be used to finance day-to-day operations without constraints established by debt covenants, enabling legislation, or other legal requirements — increased $2,293,000. Explanations for the larger fluctuations between years are as follows: • Charges for services were lower in 2009 primarily due to reduced revenue at parks & recreation facilities and
the Fraze Pavilion. • Grant revenue was higher this year because of outside funding for roadway projects. • Income taxes decreased because of the economy in general. • Other taxes decreased because of reductions in estate taxes and sales taxes. • Investment earnings increased due to a larger portfolio and a higher rate of return. • Interest on long-term debt decreased because the old recreation bond levy expired and the new bonds were not
issued until midyear.
7
The following two tables present condensed information on Net Assets and Changes in Net Assets for the year.
NET ASSETS2009 2008
Current and other assets $91,211,912 $74,170,470Capital assets 123,554,003 120,775,004 Total assets 214,765,915 194,945,474Long-term debt outstanding (22,607,556) (10,919,047)Other liabilities (16,347,059) (16,778,048) Total liabilities (38,954,615) (27,697,095)Net assets: Invested in capital assets, net of debt 105,196,955 113,942,666 Restricted 24,301,857 9,286,590 Unrestricted 46,312,490 44,019,123Total net assets $175,811,302 $167,248,379
CHANGES IN NET ASSETS2009 2008
Revenues Program revenues: Charges for services $9,938,544 $10,691,835 Operating grants and contributions 1,484,287 2,367,960 Capital grants and contributions 3,856,056 1,713,898General revenues: Income taxes 34,846,179 38,381,641 Property taxes 9,346,886 9,523,707 Other taxes 7,464,283 8,607,168 Investment earnings 2,963,720 1,954,419 Other general revenue 1,706,421 1,550,297 Total revenues 71,606,376 74,790,925Program expenses General government 13,175,646 13,755,091 Police 13,658,265 13,760,327 Fire 9,968,087 9,666,999 Public works 12,901,084 13,404,095 Leisure services 12,836,109 13,254,478 Interest on long-term debt 504,262 1,144,483 Total expenses 63,043,453 64,985,473Increase (decrease) in net assets 8,562,923 9,805,452Net assets beginning 167,248,379 157,442,927Net assets ending $175,811,302 $167,248,379
8
The following table presents the cost of each of the City’s four largest programs – police, fire, public works and leisure services – as well as each program’s net cost (total cost less revenues generated by the activities). The net cost shows the financial burden that was placed on the City’s taxpayers by each of these functions.
Total costs of services for 2009 decreased by $1,302,000 while net costs of services decreased by $1,807,000. The largest decrease in net costs of services was in the Public works function because of the increased grant revenue for road construction. The capital asset activity for the year was more than normal. Asset additions totaled $10.1 million as compared to $6.9 million in 2008. Total net capital assets for 2009 were $123,554,003. Of this total, $10,517,496 was not being depreciated and the capital assets being depreciated totaled $217,170,087 with accumulated depreciation of $104,133,579. In November 2008 the voters approved a $12.3 million bond levy to construct and improve parks & recreation facilities. The City has also committed $5 million of non-debt city funds for a total of $17.3 million worth of improvements. The City issued the new bonds in 2009. A 1988 voted bond levy for the same purpose expired on December 31, 2008. At December 31, 2009, the City had various debt issues outstanding, which included $15,689,899 of general obligation bonds, $395,101 of special assessment debt with City commitment and $2,272,048 of promissory notes. As of December 31, 2009, the City’s net general obligation bonded debt of $14,974,772 was well below the legal limit of $129,749,975 and debt per capita equaled $260.42. For more detail on capital asset and long-term debt activity, refer to note 6 and note 12 respectively in the Notes to the Basic Financial Statements. THE CITY’S FUNDS As the City completed the year, its governmental funds (as presented in the balance sheet on pages 12 and 13) reported a combined fund balance of $69.9 million, which is 35.6% higher than last year’s total of $51.5 million. The City's General Fund experienced a $2,470,000, or 4.6% overall decrease in revenues for 2009. At the same time expenditures decreased by $341,000 or 1%, and transfers out increased by $5.6 million or 57%. The increase in transfers went primarily to the capital projects fund to cover large roadway projects and the government center remodel project. The City’s General Fund balance decreased in 2009 breaking a four-year trend of rising fund balances. The poor economy resulted in decreased income and sale tax revenues. Investment earnings increased for the year due to a higher portfolio balance and a higher rate of return. Total revenues were $50.8 million while total expenditures were $35.4 million. Transfers to other funds totaled $15.4 million resulting in the $69,400, or .2% decrease to the General Fund balance. The Fraze Pavilion, an outdoor amphitheater accounted for in a major special revenue fund, has produced a surplus only two times since it began operations in 1991. In 2009 it came very close to producing its third surplus but fell short with a $10,000 deficit. 2009 was still a very good year, eliminating the need for a transfer from the General
9
fund. Although ticket revenue, concession revenue and sponsorship revenue were all lower in 2009, the facility kept the bottom line in check by also lowering expenditures for the year. The Emergency Medical fund saw revenues increase by over 10% because of increased investment earnings. As with the General fund, this was due to a higher portfolio balance and an increased rate of return. The Capital projects fund saw a significant increase in expenditures due to several major roadway projects in 2009. There were no other material changes to the major funds in 2009. There were two significant variations in the City’s original General Fund budget and the final General Fund budget. The first was a $4.2 million reduction in estimated income tax revenues. By the end of April it became clear that income tax revenues were coming in below projected amounts. About midyear it became obvious that the economy was not going to recover quickly and the City determined it should lower income tax projections. The second variation came in budgeted “Transfers to other funds”. This was increased during the year by 3.2 million primarily because of the work being started on the Government Center remodeling project. There was also a significant variance between actual expenditures and final budgeted expenditures for “Transfers to other funds”. Because of the Fraze Pavilion Fund’s good year, no transfer was required, and lower than expected expenditures in the Capital Projects Fund reduced significantly the transfer required. Capital Project Fund expenditures were lower due to the City planning many new capital projects, which, in hindsight, proved to be an overly optimistic number to accomplish in one year. As mentioned above, 2009 produced a decrease to the General Fund balance. This decrease can be attributed to the poor economy. The City is fortunate to have a fund balance capable of absorbing a poor economic year such as 2009. If the economic recovery does not emerge in 2010, the City will need to explore areas where it can cut back on future expenditures.
10 CITY OF KETTERING, OHIO
STATEMENT OF NET ASSETSDECEMBER 31, 2009
ASSETSPooled cash and investments (note 2) $68,429,992Receivables: Income taxes (net of allowance for $488,471) 5,738,200 Property taxes 9,709,892 Interest 824,329 Accounts 371,341 Special assessments 1,394,101 Loans (net of allowance for $106,762) 1,256,650Due from other governments 2,648,739Prepaid expenses 304,536Inventory 534,132Capital assets not being depreciated (note 6) 10,517,496Capital assets being depreciated, net (note 6) 113,036,507 Total assets 214,765,915LIABILITIESAccounts payable 1,552,976Salary and benefits payable 2,442,063Accrued interest payable 62,206Deferred revenue 12,289,814Long-term liabilities (note 12) Due within one year 3,401,418 Due in more than one year 19,206,138 Total liabilities 38,954,615NET ASSETSInvested in capital assets, net of related debt 105,196,955Restricted for: Debt service 715,127 Social services 1,691,954 Public safety 8,422,177 Road construction/Public Works 171,133 Leisure services 12,064,953 Municipal court activities 1,236,513Unrestricted 46,312,490 Total net assets $175,811,302
See accompanying notes to the basic financial statements.
CITY OF KETTERING, OHIO 11
STATEMENT OF ACTIVITIESFOR THE YEAR ENDED DECEMBER 31, 2009
Total Program Revenues Net (Expense)
Operating Capital Revenue andCharges for Grants and Grants and Changes in
Functions/Programs Expenses Services Contributions Contributions Net Assets General government $13,175,646 $2,443,428 $952,417 $68,960 ($9,710,841) Police 13,658,265 55,354 76,153 (13,526,758) Fire 9,968,087 1,430,458 100 (8,537,529) Public works 12,901,084 7,784 3,692,950 (9,200,350) Leisure services 12,836,109 6,001,520 455,617 94,146 (6,284,826) Interest on long-term debt 504,262 (504,262) Total $63,043,453 $9,938,544 $1,484,287 $3,856,056 (47,764,566)
General revenues: Taxes: Income taxes 34,846,179 Property taxes, levied for general purposes 8,094,861 Property taxes, levied for debt service 1,252,025 Other taxes (note 5) 7,464,283 Investment earnings 2,963,720 Refunds and reimbursements 1,484,720 Miscellaneous 221,701 Total general revenues 56,327,489 Change in net assets 8,562,923Net assets--beginning 167,248,379Net assets--ending $175,811,302
See accompanying notes to the basic financial statements.
12 CITY OF KETTERING, OHIO
FUND BALANCE SHEETS - GOVERNMENTAL FUNDSDECEMBER 31, 2009
Major SpecialParks,
General Street Recreation & FrazeFund Maintenance Cultural Arts Pavilion
ASSETSPooled cash and investments $39,260,050 $126,211 $436,764 $117,470Receivables: Income taxes (net of allowance for $488,471) 5,738,200 Property taxes 8,002,892 Interest 670,558 Accounts 15,480 1,051 12,818 92 Special assessments 400,000 Loans (net of allowance for $106,762)Due from Community Development fund 89,000Due from Health iInsurance internal service fund 234,300Due from other governments 443,664 1,063,565Prepaid expenditures 20,601 60 862 3,542Inventory 201,414 Total assets $54,874,745 $1,392,301 $450,444 $121,104
LIABILITIESAccounts payable $820,960 $10,468 $126,560 $3,344Due to General fundAccrued payroll 1,526,823 173,069 219,144 8,938Deferred revenue 12,069,716 864,000 9,960 1,660 Total liabilities 14,417,499 1,047,537 355,664 13,942FUND BALANCESNonspendable: Inventory and prepaids 20,601 201,474 862 3,542Restricted for: Debt service Social services Public safety Road construction / Public works Leisure services Municipal court activitiesCommitted to: Social services 52,791 Public safety 461,386 Road construction / Public works 6,783 290,352 Leisure services 159,000 93,918 103,620 Government center remodel Other purposes 171,957Assigned to: Leisure services 237,019Unassigned: 39,347,709 (147,062) Total fund balances 40,457,246 344,764 94,780 107,162 Total liabilities and fund balances $54,874,745 $1,392,301 $450,444 $121,104
See accompanying notes to the basic financial statements.
13
Revenue FundsOther Special Revenue Total
Community Emergency Debt Capital Governmental GovernmentalDevelopment Medical Service Projects Funds Funds
Amounts reported for governmental activities in the Statement of Net Assets (page 10) are different because: Capital assets used in governmental activities are not financial resources and therefore are not reported in the funds. 122,979,530 Other long-term assets are not available to pay for current-period expenditures and therefore are deferred in the funds:
Income taxes receivable 1,765,757Grants and other taxes receivable 2,803,745
Internal service funds are used by management to charge the costs of certain activities. The assets and liabilities of the internal service funds are included in governmental activities in the Statement of Net Assets. 716,428 Debt issuance costs and issuance discounts/premiums are amortized over the life of the debt, the unamortized portion remains on the Statement of Net Assets. 15,810 The following long-term liabilities are not due and payable in the current period and therefore are not reported in the funds:
Bonds and notes payable (18,357,048)Vacation and sick leave benefits (3,916,943)Accrued interest on bonds payable (62,206) Net Assets of Governmental Activities $175,811,302
14 CITY OF KETTERING, OHIO
STATEMENT OF REVENUES, EXPENDITURES, AND CHANGES IN FUND BALANCES -GOVERNMENTAL FUNDS - FOR THE YEAR ENDED DECEMBER 31, 2009
Major SpecialParks,
General Street Recreation & FrazeFund Maintenance Cultural Arts Pavilion
REVENUESIncome taxes $35,321,466Property taxes 7,566,187Licenses and permits 521,039 $7,784Intergovernmental revenue 1,596,036 2,457,357 $25,010Charges for services 158,201 3,203,551 $2,797,969Fines and forfeits 1,327,184Investment earnings 2,331,681Special assessments 399,664Refunds and reimbursements 1,547,554 297,489 80,711 1,347Miscellaneous 17,086 9,433 41,504 308,608 Total revenues 50,786,098 2,772,063 3,350,776 3,107,924EXPENDITURESCurrent: General government 10,943,329 Police 12,200,160 Fire 9,471,087 Public works 2,816,825 5,578,430 Leisure services 8,932,329 3,118,158Capital improvementsDebt service: Principal Interest Total expenditures 35,431,401 5,578,430 8,932,329 3,118,158 Excess (deficiency) of revenues over expenditures 15,354,697 (2,806,367) (5,581,553) (10,234)OTHER FINANCING SOURCES (USES) Transfers in 2,567,700 5,592,200 Transfers out (15,445,122) General obligation debt issuance Premium on debt issuance Sale of city assets 21,016 21,401 11,829 Net change in fund balance (69,409) (217,266) 22,476 (10,234)Fund balances--beginning 40,526,655 562,030 72,304 117,396Fund balances--ending $40,457,246 $344,764 $94,780 $107,162
See accompanying notes to the basic financial statements.
15
Revenue FundsOther Special Revenue Total
Community Emergency Debt Capital Governmental GovernmentalDevelopment Medical Service Projects Funds Funds
Net change in Fund Balance - Governmental Funds $18,349,124Amounts reported for governmental activities in the Statement of Activities (page 11) are different because: Governmental funds report capital outlays as expenditures while governmental activities Capital outlays 10,158,059 report depreciation expense to allocate those expenditures over the life of the assets. Depreciation expense (6,976,254) In the Statement of Activities, only the gain on the sale of city assets is reported, while in the governmental funds, the proceeds from the sale increase financial resources. The change in net assets differ from the change in fund balance by the book value of the asset sold. (164,216) Revenues in the Statement of Activities that do not provide current financial resources are not reported as revenues in the funds.
Income taxes receivable (475,285)Grants receivable (581,425)Property taxes receivable 1,000
Bond proceeds provide current financial resources to governmental funds, but issuing debt increases long-term liabilities in the Statement of Net Assets. (12,300,000) Repayment of bond principal is an expenditure in the governmental funds, but the repayment reduces long-term liabilities in the Statement of Net Assets. 775,290 Governmental funds report debt issue premiums as other financing sources while governmental activities amortize the
premiums over the debt term (239,751) Some expenses reported in the Statement of Activities do not require the use of current financial resources and therefore are not reported as expenditures in governmental funds. Vacation and sick leave benefits (139,406)
Interest payable (41,032) Internal service funds are used by management to charge the costs of certain activities, to individual funds. The net revenue (expense) of the internal service funds is reported with governmental activities. (See page 17.) 196,819 Change in Net Assets on the Statement of Activities $8,562,923
16 CITY OF KETTERING, OHIO
BALANCE SHEETPROPRIETARY FUNDSDECEMBER 31, 2009
GovernmentalActivities-Internal
Service FundsASSETSCurrent assets: Pooled cash and investments $352,027 Accounts receivable 416 Due from other governments 19,065 Prepaid expenses 263,661 Inventory 332,718 Total current assets 967,887Noncurrent assets: Buildings and improvements 757,936 Machinery and equipment 2,019,076 Less: Accumulated depreciation (2,202,539) Total noncurrent assets 574,473 Total assets $1,542,360
LIABILITIESCurrent liabilities: Accounts payable $116,137 Due to General fund 234,300 Accrued payroll 141,930 Total current liabilities 492,367Noncurrent liabilities: Accrued vacation and sick leave benefits 333,565 Total liabilities 825,932NET ASSETSInvested in capital assets 574,473Unrestricted 141,955 Total net assets 716,428 Total liabilities and net assets $1,542,360
See accompanying notes to the basic financial statements.
CITY OF KETTERING, OHIO 17
STATEMENT OF REVENUES, EXPENSES, AND CHANGES IN NET ASSETSPROPRIETARY FUNDSFOR THE YEAR ENDED DECEMBER 31, 2009
GovernmentalActivities-Internal
Service FundsOPERATING REVENUESCharges for services $9,908,466 Total operating revenues 9,908,466OPERATING EXPENSESPersonal services 3,016,418Repairs and maintenance 1,476,025Contractual services 4,644,560Other materials and expenses 426,388Depreciation 171,367 Total operating expenses 9,734,758 Operating income (loss) 173,708NONOPERATING REVENUES (EXPENSES)Investment earnings 23,111 Change in net assets 196,819 Total net assets--beginning 519,609 Total net assets--ending $716,428
See accompanying notes to the basic financial statements.
18 CITY OF KETTERING, OHIO
STATEMENT OF CASH FLOWSPROPRIETARY FUNDSFOR THE YEAR ENDED DECEMBER 31, 2009Increase (Decrease) in cash
GovernmentalActivities-Internal
Service FundsCASH FLOWS FROM OPERATING ACTIVITIESCash received for services $9,899,264Cash paid to suppliers for goods or services (6,908,913)Cash paid to employees for services (3,019,103) Net cash provided (used) by operating activities (28,752)CASH FLOWS FROM CAPITAL AND RELATED FINANCING ACTIVITIESAcquisition of capital assets (64,426)Loan from General fund 234,300Sale of capital assets 1,197 Net cash used by capital and related financing activities 171,071CASH FLOWS FROM INVESTING ACTIVITIESInvestment earnings 23,111 Net cash provided by investing activities 23,111 Net increase (decrease) in cash 165,430Cash at beginning of year 186,597Cash at end of year $352,027
RECONCILIATION OF OPERATING INCOME (LOSS) TO NET CASH PROVIDED (USED) BY OPERATING ACTIVITIESOperating income (loss) $173,708Adjustments to reconcile operating income (loss) to net cash provided (used) by operating activities: Depreciation 171,367 (Increase) decrease in receivables (8,006) (Increase) decrease in inventories (35,083) Increase (decrease) in accounts payable (64,727) Net (increase) decrease in other operating net assets (266,011) Net cash provided (used) by operating activities ($28,752)
See accompanying notes to the basic financial statements.
CITY OF KETTERING, OHIO 19
FIDUCIARY FUNDS
STATEMENT OF FIDUCIARY NET ASSETS DECEMBER 31, 2009
ASSETSPooled cash and investments $85,934 $253,135Investments with fiscal agent, at fair value: Unallocated insurance contracts $1,870,230 Other investments 331,776 Total assets 1,870,230 85,934 $584,911LIABILITIESAccounts payable $4,310Withholdings payable 245,807Undistributed moneys 331,776Unclaimed moneys 3,018 Total liabilities $584,911NET ASSETSHeld in trust for pension benefits and other purposes $1,870,230 $85,934
STATEMENT OF CHANGES IN FIDUCIARY NET ASSETS FOR THE YEAR ENDED DECEMBER 31, 2009
ADDITIONSEmployer contributions $91,662Investment earnings (loss) (63,879) $4,610 Total additions 27,783 4,610DEDUCTIONSPension payments 121,629 Total deductions 121,629Net increase (decrease) (93,846) 4,610Net assets--beginning of year 1,964,076 81,324Net assets--end of year $1,870,230 $85,934
See accompanying notes to the basic financial statements.
CITY OF KETTERING, OHIO 21
NOTES TO THE BASIC FINANCIAL STATEMENTS FOR THE YEAR ENDED DECEMBER 31, 2009 1. SUMMARY OF SIGNIFICANT ACCOUNTING POLICIES
A. Reporting Entity The City of Kettering, Ohio, (the “City”) is a home rule municipal corporation under the laws of the State of Ohio and operates under its own Charter. The current Charter, which provides for a Council/Manager form of government, was adopted in 1955 and has subsequently been amended. The City provides various services including police and fire protection, parks, recreation, street maintenance, planning, zoning and other general government services. The City does not maintain any utility or other operations that would require the establishment of enterprise funds. The financial reporting entity consists of (a) the primary government, (b) organizations for which the primary government is financially accountable, and (c) governmental organizations for which the primary government is not financially accountable, but for which the nature and significance of their financial relationship with the primary government are such that exclusion would cause the reporting entity’s financial statements to be misleading or incomplete. Component units are legally separate organizations for which the elected officials of the primary government are financially accountable. In addition, component units can be governmental organizations for which the primary government is not financially accountable, but for which the nature and significance of their financial relationship with the primary government are such that exclusion would cause the reporting entity’s financial statements to be misleading or incomplete. No separate government units meet the criteria for inclusion as a component unit. B. Basis of Presentation Government-Wide Statements: The statement of net assets and the statement of activities display information about the primary government, except for its fiduciary activities. Eliminations have been made to minimize the double counting of internal activities. Governmental activities generally are financed through taxes, intergovernmental revenues and other nonexchange transactions. The City has no business-type activities. The statement of activities presents a comparison between direct expenses and program revenues for each function of the City’s governmental activities. Direct expenses are those that are specifically associated with a program or a function and, therefore, are clearly identifiable to a particular function. Program revenues include (a) charges paid by recipients of goods or services offered by the programs and (b) grants and contributions that are restricted to meeting the operational or capital requirements of a particular program. Revenues that are not classified as program revenues, including all taxes, are presented as general revenues. Fund Financial Statements: The fund financial statements provide information about the City’s funds, including fiduciary. Separate statements for each fund category – governmental, proprietary and fiduciary – are presented. The emphasis of fund financial statements is on major governmental funds, each displayed in a separate column. All remaining governmental funds are aggregated and reported as nonmajor funds. The City reports the following major governmental funds: General Fund – This fund is the general operating fund of the City. It should be used to account for and report all financial resources not accounted for and reported in another fund. Street Maintenance Fund – This fund accounts for the portion of gasoline tax and motor vehicle license fees restricted, committed, or assigned for maintenance of streets.
22
Parks, Recreation & Cultural Arts Fund – This fund accounts for money restricted, committed, or assigned for the Parks, Recreation & Cultural Arts department programs and activities. Fraze Pavilion Fund – This fund accounts for moneys restricted, committed, or assigned for the Fraze Pavilion amphitheater operations. Community Development Fund - This fund accounts for grants received from the Department of Housing and Urban Development (HUD). Grants are restricted for various purposes designated by HUD. Emergency Medical Fund – This fund accounts for revenues received for emergency medical services. The revenues are committed or assigned for expenditure on fire equipment or structures. Debt Service Fund – This fund is used to account for and report financial resources that are restricted, committed, or assigned to expenditure for principal and interest. Capital Projects Fund – This fund is used to account for and report financial resources that are restricted, committed, or assigned to expenditure for capital outlays, including the acquisition or construction of capital facilities and other capital assets (other than those financed by proprietary funds). Additionally, the City reports the following fund types: Internal Service Funds – The internal service funds are used to account for the financing of goods or services provided by one department or agency to other departments or agencies of the City, or to other governments on a cost-reimbursement basis. These goods and services include computer services, vehicle maintenance, office supplies, postage, printing services, building maintenance and health insurance. The City has no unbilled service receivables at year end. Pension Trust Fund – The fund reports a trust arrangement under which assets are accumulated in order to pay retirement benefits to the City’s volunteer firefighters. Private Purpose Trust Fund – This fund reports a trust arrangement under which principal and income are used for the education of dependents of deceased police officers. Agency Funds – These funds account for assets held by the City as an agent for: 1) various local governments collected by the municipal court, 2) payroll withholdings and 3) unclaimed moneys and other miscellaneous activities. C. Basis of Accounting
Basis of accounting refers to when revenues and expenditures or expenses are recognized in the accounts and reported in the financial statements. Basis of accounting relates to the timing of the measurements made, regardless of the measurement focus applied. Government-wide, proprietary and fiduciary fund financial statements measure and report all assets (both financial and capital), liabilities, revenues, expenses, gains and losses using the economic resources measurement focus and accrual basis of accounting. Revenues are recorded when earned and expenses are recorded when a liability is incurred, regardless of the timing of related cash flows. Property taxes are recognized as revenues in the year for which they are levied. Grants and similar items are recognized as revenue as soon as all eligibility requirements imposed by the provider have been met. Agency funds do not involve the measurement of results of operations.
23
All governmental funds are accounted for using a current financial resources measurement focus and are reported on a modified accrual basis of accounting. Revenues are recognized in the accounting period in which they become measurable and available. “Measurable” means the amount of the transaction can be determined and “available” means collectible within the current period or soon enough thereafter to be used to pay liabilities of the current period, which, for the City’s purposes, is considered to be 30 days after year end. Revenues considered susceptible to accrual are community development block grants, delinquent property taxes, income taxes, and interest on investments. Property taxes levied before year-end are not recognized as revenue until the next calendar year. The fiscal period for which property taxes are levied at year-end in the State of Ohio is the succeeding calendar year. Expenditures are recognized in the accounting period in which the fund liability is incurred, if measurable, except for interest on unmatured general long-term debt, and on special assessment indebtedness collateralized by special assessment levies, which are recognized when due. Inventory and prepaid expenditures are recorded in the governmental fund types and charged as expenditures when used. A portion of the fund balance is classified as nonspendable in governmental funds for the amount of inventory and prepaid expenditures. When both restricted and unrestricted resources are available for use, it is the government’s policy to use restricted resources first, then unrestricted resources as they are needed. When an expenditure is incurred for purposes for which amounts in any unrestricted fund balance classification could be used it is the government’s policy to use assigned resources first, committed resources second, and then unassigned amounts as they are needed. D. Pooled Cash and Investments and Investment with Fiscal Agent
All investments are stated at fair value, which are based on quoted market prices. E. Inventory
Inventory is valued at cost (specific identification method in the internal service funds and FIFO (first-in, first-out) method in the special revenue funds.) Inventories are recorded as expenses/expenditures when used. F. Capital Assets
Capital assets include land, improvements to land, buildings, building improvements, machinery, equipment, infrastructure and all other assets that are used in operations and that have initial useful lives expending beyond a single reporting period. Infrastructure is defined as long-lived capital assets that normally are stationary in nature and normally can be preserved for a significantly greater number of years than most capital assets. Examples of infrastructure include roads, bridges and drainage systems. All capital assets are valued at historical cost, or estimated historical cost if actual historical cost is not available. Donated capital assets are valued at their estimated fair market value at the time received. When capital assets are purchased, they are capitalized and depreciated in the government-wide statements and the proprietary fund statements. The City capitalizes all assets with a cost of $10,000 or greater ($5,000 or greater for federal funded assets) and a useful life of at least two years. The City has capitalized all infrastructure acquired after January 1, 1980. Capital assets are recorded as expenditures of the current period in the government fund financial statements. Depreciation is calculated using the straight-line method over the estimated useful lives of the assets. Estimated useful lives of the various classes of depreciable capital assets are as follows:
Machinery and Equipment 3-20 yearsBuildings and Improvements 15-30 yearsInfrastructure 20-40 years
24
G. Interfund Transactions and Transfers
During the course of normal operations, the City has numerous transactions among funds, most of which are in the form of transfers used to move unrestricted revenues collected in the general fund to finance various programs accounted for in other funds in accordance with budgetary authorizations. The accompanying financial statements generally reflect such transactions as transfers, with the exception of the internal service funds which are used to account for various supplies and services which are then charged back to the appropriate fund on an “as used” basis. The internal service funds record such charges as operating revenues; all other City funds record payments to the internal service funds as operating expenditures. H. Fund Balance Classifications
Fund balance is reported as restricted when constraints placed on the use of resources are either: a. externally imposed by creditors, grantors, contributors, or laws or regulations of other governments; or b. imposed by law through constitutional provisions or enabling legislation. Fund balance is reported as committed when the City Council enacts legislation requiring specific revenues to be used for a specific purpose. The City Council can modify or rescind that legislation at any time through additional legislation. Fund balance is reported as assigned when a revenue source is not previously restricted or committed but the Finance Director determines, in the Director’s professional opinion, that the assigning of the revenue is the desire or direction of City Council. This authority is given to the Finance Director through ordinance passed by City Council. I. Grants and Other Intergovernmental Revenues
All reimbursement-type grants are recorded as intergovernmental receivables and revenues or deferred revenue when the related expenditures are incurred. J. Use of Estimates
The preparation of the basic financial statements in conformity with generally accepted accounting principles requires management to make estimates and assumptions that affect the reported amounts of assets and liabilities at the date of the basic financial statements and the reported amounts of revenues and expenses during the reporting period. Actual results could differ from those estimates.
2. POOLED CASH AND INVESTMENTS
The City maintains a cash and investments pool that is available for use by all funds, except the pension trust fund. Each fund type’s portion of this pool is displayed on the Fund Balance Sheets as “Pooled cash and investments.” The deposits and investments of the pension trust fund are held separately from those of other City funds and displayed as “Unallocated insurance contracts.” Cash and cash equivalents in the internal service funds consist of cash and money market funds, which can be withdrawn without prior notice or penalty. Deposits: At year-end, the City’s bank balance was $17,822,490. Of this amount, $11,044,497 was insured, the remaining $6,777,993 was collateralized with securities held by the pledging financial institution’s trust department or agent, but not in the City’s name per Ohio Revised Code Section 135.181. This statute requires all financial institutions acting as public depositories to pledge a pool of collateral with a market value of at least 105% of the total amount of public deposits secured. The City has no deposit policy for custodial credit risk.
25
Investments: All investments are reported at fair value, which is based on quoted market prices. The City’s investment policy authorizes investments in obligations of the U.S. Treasury, agencies, and instrumentalities, commercial paper rated, when purchased, A-1 by Standard & Poors Corporation or P-1 by Moody’s Commercial Paper Record, corporate bonds rated, when purchased, A or better by Standard & Poors Corporation or Moody’s Bond Rating, bankers acceptances issued by banks ranked nationally as being in the top 50 in asset and deposit size, repurchase and reverse repurchase agreements, money market mutual funds whose portfolio consists of authorized investments, and the state treasurer’s investment pool. The policy states that no more than 20% of the City’s investment portfolio will be placed with any particular issuer, and unless matched to a specific cash flow requirement, the City will not invest in securities maturing more than five years from the date of purchase. It has been the City’s practice to invest in securities maturing no more than three years from the date of purchase, and to hold all investments until maturity. The City has no investment policy for custodial credit risk. The City’s investments in corporate bonds, listed below, are uninsured and unregistered investments for which the securities are held by the counterparty, or by its trust department or agent, but not in the City’s name. On December 31, the City had $7,886,679 in corporate bonds issued by AT&T, $7,358,165 in corporate bonds issued by General Electric, $3,723,582 in corporate bonds issued by John Deere and $3,660,176 in corporate bonds issued by Caterpillar. These amounts represent 11.4%, 10.6%, 5.4% and 5.3% respectively of the pooled cash and investments. At year-end, $250,970 of the securities in the corporate bond category below are rated “BBB-”, the remaining $52,268,161 are rated “A” or better and all other investment types listed are unrated. As of December 31, 2009 the City had the following investments and maturities.
FairInvestment Type Value Less than 1 1-3 3-9 9-10
Corporate Bonds $52,519,131 $26,659,627 $25,859,504Pension Plan Pooled Invest Fund 1,870,230 $1,870,230 Total $54,389,361 $26,659,627 $25,859,504 $1,870,230
Investment Maturities (in Years)
3. INCOME TAXES
The City levies a 2.25% income tax on substantially all income earned within the City. Additional increases in the income tax rate require voter approval. In 2006, the voters approved an income tax rate increase to 2.25% from 1.75% effective January 1st, 2007. City residents pay City income tax on income earned outside the City, however; a credit is allowed for income taxes paid to other municipalities. Employers within the City withhold income tax on employee compensation and remit at least quarterly. Corporations and other individual taxpayers pay estimated taxes quarterly and file an annual declaration.
26
4. PROPERTY TAXES
Property taxes include amounts levied against all real and public utility property located in the City. Property taxes are levied each December 31 on the assessed value listed as of the prior December 31. Assessed values are established for real property at 35% of true value. Property market values are required to be updated every three years and revalued every six years. A revaluation was completed in 2008. The property tax calendar is as folows:
Levy date December 31, 2008Lien date December 31, 2008Tax bill mailed January 20, 2009First installment payment due February 15, 2009Second installment payment due July 15, 2009
The assessed values for the City at December 31, 2008 were as follows:Assessed Value
CategoryReal Estate $1,213,090,390Public Utility Real Property 11,770Public Utility Personal Property 22,611,890Total $1,235,714,050
The County Treasurer collects property taxes on behalf of all taxing districts including the City of Kettering. The County periodically remits to the City its portion of taxes collected. Property taxes may be paid on either an annual or semiannual basis.
5. OTHER TAXES
The caption “Other taxes” on the Statement of Activities is comprised of taxes levied by the State or the County and distributed to the City. The components of the number are as follows: Estate taxes $3,004,387
Capital assets not being depreciated: Land $10,521,411 $33,693 ($37,608) $10,517,496 Subtotal 10,521,411 33,693 (37,608) 10,517,496Capital assets being depreciated: Buildings and improvements 41,483,930 725,026 (201,093) 42,007,863 Machinery and equipment 17,777,524 980,912 (805,499) 17,952,937 Infrastructure 148,886,409 8,357,159 (34,282) 157,209,286 Subtotal 208,147,863 10,063,097 (1,040,874) 217,170,086Accumulated depreciation: Buildings and improvements (26,461,336) (987,362) 98,457 (27,350,241) Machinery and equipment (12,761,840) (1,155,265) 775,573 (13,141,532) Infrastructure (58,671,094) (5,004,993) 34,281 (63,641,806) Subtotal (97,894,270) (7,147,620) * 908,311 (104,133,579) Net capital assets being depreciated 110,253,593 2,915,477 (132,563) 113,036,507 Net capital assets $120,775,004 $2,949,170 ($170,171) $123,554,003
*Depreciation expense was charged to governmental functions as follows:
General government $419,664Police 276,285Fire 363,215Public works 5,140,534Leisure services 776,555In addition, depreciation on capital assets held by the City's internal service funds is charged to the various functions based on their usage of the assets. 171,367Total depreciation expense $7,147,620
7. LOANS RECEIVABLE AND NOTES RECEIVABLE
The City used a portion of the Federal Community Development Block Grant (CDBG) to provide low interest loans for housing rehabilitation, as well as for economic and job development. The loans are payable in installments to 2034. Fund balance has been classified as nonspendable for the loans receivable at December 31, 2009. CDBG regulations require the City to reinvest loan repayments in permissible CDBG loans or expenditures.
8. RISK MANAGEMENT
The City is a member of a public entity risk pool, Miami Valley Risk Management Association, Inc. (MVRMA) with nineteen other local cities. This pool covers all property, crime, liability, boiler and machinery, and public official liability up to the limits stated below. Insurance coverage is as follows:
28
Property – $1,000,000,000 per occurrence Crime - $1,000,000 per occurrence Liability - $10,000,000 per occurrence Boiler & Machinery - $100,000,000 per occurrence Public Official Liability - $10,000,000 per occurrence The deductible per occurrence for all types is $2,500. Pool coverage is $2,500 - $5,000 for boiler and machinery, $2,501 - $25,000 for crime, $2,501 - $200,000 for property, and $2,501 - $1,000,000 for liability. Excess insurance coverage, provided by commercial companies, is the amount in excess of pool coverage to the limits stated above. The City pays an annual premium to MVRMA that is intended to cover administrative expenses and any claims covered by the pool. MVRMA has the ability to require the member cities to make supplemental payments in the event reserves are not adequate to cover claims. An actuarial opinion issued as of December 31, 2008, indicates reserves in excess of anticipated claims. Employee health insurance is provided through a fully insured plan and is accounted for and financed through an internal service fund. The City pays premiums to a private insurance company and retains no risk. Workers’ compensation is administered by the State of Ohio. The City pays a premium per employee to the State for this coverage. There were no significant reductions in insurance coverage from the prior year in any category of risk. Insurance coverage for each of the past three years was sufficient to cover any claims settlements.
9. PENSION PLAN OBLIGATIONS
Substantially all City employees are covered by one of two pension plans Ohio Police and Fire Pension Fund (OP&F) or Ohio Public Employees Retirement System (OPERS). OHIO POLICE AND FIRE PENSION FUND (OP&F) OP&F is a cost-sharing multiple-employer defined benefit pension plan, which provides retirement and disability benefits, annual cost of living adjustments, and death benefits to plan members and beneficiaries. Authority to establish and amend benefits is provided by state statute per Chapter 742 of the Ohio Revised Code. The Police and Fire Pension Fund issues a publicly available financial report that includes financial statements and required supplementary information for the fund. Interested parties may obtain a copy by making a written request to 140 East Town Street, Columbus, Ohio 43215-5164. The Ohio Revised Code provides statutory authority for employee and employer contributions. Plan members are required to contribute 10% of their annual covered salary and the City is required to contribute 19.5% and 24% respectively for police officers and firefighters. The City’s contributions to the plan for the years ending December 31, 2007, 2008 and 2009, were $2,262,695, $2,448,027 and $2,572,780 respectively, or 73% of the required contributions for 2007, 77% for 2008, and 75% for 2009. OHIO PUBLIC EMPLOYEES RETIREMENT SYSTEM (OPERS) OPERS administers three separate pension plans. 1) The Traditional Pension Plan (TP) – a cost-sharing multiple-employer defined benefit pension plan. 2) The Member-Directed Plan (MD) – a defined contribution plan in which the member invests both member and employer contributions (employer contributions vest over five years at 20% per year). Members accumulate retirement assets equal to the value of member and (vested) employer contributions plus any investment earnings thereon. 3) The Combined Plan (CO) - a cost-sharing multiple-employer defined benefit pension plan. Employer contributions are invested by the retirement system to provide a formula retirement benefit similar in nature to the Traditional Plan benefit. Member contributions, the investment of which is self-directed by the members, accumulate retirement assets in a manner similar to the MD.
29
OPERS provides retirement, disability, survivor and death benefits and annual cost of living adjustments to members of the TP and CO. Members of the MD do not qualify for ancillary benefits. Authority to establish and amend benefits is provided by state statute per Chapter 145 of the Ohio Revised Code. The Public Employees Retirement System issues a publicly available financial report that includes financial statements and required supplementary information for the fund. Interested parties may obtain a copy by making a written request to 277 East Town Street, Columbus, Ohio 43215-4642, or by calling (800) 222-7377. The Ohio Revised Code provides statutory authority for employee and employer contributions. For 2009, member and employer contribution rates were consistent across all three plans (TP, MD and CO). Plan members are required to contribute 10% of their annual covered salary and the City is required to contribute 14%. The City’s contributions to the plan for the years ending December 31, 2007, 2008 and 2009, were $2,560,130, $2,683,518 and $2,725,560 respectively, equal to the required contributions for the year. VOLUNTEER FIREFIGHTERS PENSION Principal Life Insurance Company administers a single-employer, defined benefit pension plan for the Volunteer Firefighters. At January 1, 2009, the plan’s membership consisted of the following:
Retirees and beneficiaries currently receiving benefits 80
Terminated employees entitled to benefits but not yet receiving them 32
Active members 85
Total 197
All regular members of the Volunteer Fire Department are eligible for the plan upon completion of 3 years of continuous service. Members may retire at age 55 and receive a monthly benefit, payable for life. The monthly retirement benefit is equal to the sum of $8.00 multiplied by the number of years of credited service not in excess of 10 years and $10.00 multiplied by the number of years of credited service in excess of 10 years. Benefits vest at 15% upon 3 years of credited service plus 5% for each additional year, up to 100%. Benefits are established by and may be amended by City Ordinance. Financial Statements of the Volunteer Firefighter Pension are prepared using the accrual basis of accounting. Employer contributions are recognized when due and the employer has made a formal commitment to provide the contributions. Benefits and refunds are recognized when due and payable in accordance with terms of the plan. The Pension plan does not issue a stand-alone financial report. Plan investments are reported at fair value. No investment, in any one organization, exceeded five percent of net assets available for benefits. The City’s funding policy is to provide for periodic employer contributions at actuarially determined rates that, expressed in dollars, are designed to accumulate sufficient assets to pay benefits when due. Costs of administering the plan are paid separately by the City and not deducted from plan assets. The City is to make all contributions required to the plan. Contribution requirements are established or may be amended by City Ordinance. Active members are not required to contribute. The annual required contribution for the current year was determined as part of the January 1, 2009, actuarial valuation using the aggregate actuarial cost method. The actuarial assumptions included a 6.00% investment rate of return and that benefits will not increase after retirement. The actuarial value of assets was determined using the contract basis. Because the aggregate actuarial cost method does not identify or separately amortize unfunded actuarial liabilities, information about funded status and funding progress has been prepared using the entry age actuarial cost method for that purpose and the information presented is intended to serve as a surrogate for the funded status and funding progress of the plan. The funded status of the plan as of January 1, 2009, the most recent actuarial valuation date is as follows:
30
Actuarial Actuarial Actuarial Accrued Unfunded UAAL as a Valuation Value Liability (AAL) AAL Funded Covered Percentage of
Date of Assets -Entry Age (UAAL) Ratio Payroll Covered Payroll1/1/2008 $2,000,381 $2,236,175 $235,794 89.5% $427,556 55.1%1/1/2009 2,014,762 2,368,846 354,084 85.1% 375,974 94.2%
SCHEDULE OF EMPLOYER CONTRIBUTIONS
Year Ended Annual Required Actual PercentDecember 31 Contribution Contribution Contributed
For the fiscal years ended December 31, 2007, 2008 and 2009, the Annual Pension cost (APC) was $67,025, $69,847 and $91,662 respectively; the percentage of APC contributed was 100% and the net pension obligation was $0. The first year the City reported the Volunteer firefighters Pension under GASB 27 was in 1996. The pension liability was $0 and was determined in accordance with GASB 27. The amount of pension liability at transition was $0. The difference between the amount of pension liability and the previously reported liability to the plan was $0.
10. OTHER POST EMPLOYMENT BENEFITS (OPEB)
In addition to the pension benefits described in Note 9, both the Ohio Public Employees Retirement System (OPERS) and the Ohio Police and Fire Pension Fund (OP&F) provide post retirement health care coverage, which meets the definition of an Other Post Employment Benefit (OPEB) as described in GASB Statement 45. For both systems, the Ohio Revised Code (ORC) permits, but does not mandate, OPEB benefits to its eligible members and beneficiaries. Authority to establish and amend benefits is provided in the ORC Chapter 145 for OPERS and Chapter 742 for OP&F. OHIO POLICE AND FIRE PENSION FUND OPEB OP&F sponsors a cost-sharing multiple-employer defined post retirement healthcare plan administered by OP&F. OP&F provides healthcare benefits including coverage for medical, prescription drugs, dental, vision, Medicare Part B Premium and long term care to retirees, qualifying benefit recipients and their eligible dependents. The ORC provides the statutory authority requiring public employers to fund post retirement health care through their contributions to OP&F. A portion of each employer’s contribution is set aside for the funding of post retirement health care benefits. Participating employers are required to contribute to the pension plan at rates expressed as percentages of the payroll of active pension plan members, currently, 19.5% and 24.0% of covered payroll for police and fire employers, respectively. The ORC states that the employer contribution
31
may not exceed 19.5% and 24.0% of covered payroll for police and fire employers respectively. Active members do not make contributions to the OPEB Plan. OP&F maintains funds for health care in two separate accounts. One for health care benefits under an IRS Code Section 115 trust and one for Medicare Part B reimbursements administrated as an Internal Revenue Code 401(h) account, both of which are within the defined benefit pension plan, under the authority granted by the ORC to the OP&F board of trustees. The board of trustees is authorized to allocate a portion of the total employer contributions made into the pension plan to the Section 155 trust and the Section 401(h) account as the employer contribution for retiree healthcare benefits. For the year ended December 31, 2009, the employer contribution allocated to the healthcare plan was 6.75% of covered payroll. The amount of employer contributions allocated to the healthcare plan each year is subject to the trustees’ primary responsibility to ensure that pension benefits are adequately funded and also is limited by the provisions of Sections 115 and 401(h). The OP&F board of trustees is authorized to establish requirements for contributions to the healthcare plan by retirees and their eligible dependents, or their surviving beneficiaries. Payment amounts vary depending on the number of covered dependents and the coverage selected. City contributions to OP&F for 2009 were $2,572,780 of which $810,604 was allocated to the healthcare plan. OP&F issues a publicly available financial report that includes financial information and required supplementary information for the Plan. That report may be obtained by writing to OP&F, 140 East Town Street, Columbus, Ohio 43215-5164. OHIO PUBLIC EMPLOYEES RETIREMENT SYSTEM OPEB OPERS administers three separate pension plans, the Traditional Pension Plan (TP), the Member–Directed Plan (MD), and the Combined Plan (CO), all of which are described in note 9. OPERS maintains a cost-sharing multiple employer defined benefit post employment healthcare plan, which provides a medical plan, prescription drug program and Medicare Part B premium reimbursement, to age and service retirees with 10 or more years of qualifying Ohio service credit of both the TP and CO. Members of the MD do not qualify for ancillary benefits, including post employment health care coverage. Health care coverage for disability recipients and qualified survivor benefit recipients is available. The ORC provides the statutory authority requiring public employers to fund post retirement health care through their contributions to OPERS. A portion of each employer’s contribution is set aside for the funding of post retirement health care benefits. Participating employers are required to contribute to the pension plan at rates expressed as percentages of the payroll of active pension plan members, currently, 14.0%. The ORC states that the employer contribution may not exceed 14.0% of covered payroll. Active members do not make contributions to the OPEB Plan. OPERS post employment healthcare plan was established and is administrated in accordance with, Internal Revenue Code 401(h). Each year, the OPERS Retirement Board determines the portion of the employer contribution rate that will be set aside for funding of post employment health care benefits. For 2009, the employer contribution allocated to the health care plan was 7.0% of covered payroll from January 1 through March 31st and 5.5% for the remainder of the year. The OPERS Retirement Board is also authorized to establish rules for the payment of a portion of the health care benefits provided by the retiree or their surviving beneficiaries. Payment amounts vary depending on the number of covered dependents and the coverage selected. City contributions to OPERS for 2009 were $2,725,560 of which $1,135,580 was allocated to fund post employment benefits. The Health Care Preservation Plan adopted by the OPERS Retirement Board on September 9, 2004, was effective January 1, 2007. Member and employer contribution rates increased as of January 1, 2006, January 1, 2007 and January 1, 2008, which allowed additional funds to be allocated to the health care plan. OPERS issues a stand-alone financial report. Interested parties may obtain a copy by writing OPERS, Attention: Finance Director, 277 East Town Street, Columbus, OH 43215-4642, or by calling (800) 222-7377.
32
11. LEASES AND CONSTRUCTION COMMITMENTS
There are no operating leases, in which the City is a lessee, in excess of one year. Operating lease payments in 2009 were $263,261. Significant commitments and encumbrances at December 31, 2009 included: Capital Projects Fund $1,633,000
12. LONG-TERM LIABILITIES
Long-term liability activity for the year ended December 31, 2009, was as follows: Amounts
Beginning Ending Due WithinBalance Additions Reductions Balance One Year
General obligation bonds: Street Improvement bonds- Series 1991, 4.5%-6.65% $159,270 $34,371 $124,899 $36,682 Street Improvement bonds- Series 1992, 3.25%-6.45% 310,000 70,000 240,000 75,000 Court Facility, 3.0%-4.5% 3,410,000 160,000 3,250,000 165,000 Recreation & Parks Improvements 3.0%-5.0% 0 $12,300,000 225,000 12,075,000 450,000
Total general obligation bonds 3,879,270 12,300,000 489,371 15,689,899 726,682
Special assessment bonds: Streets Series 1991, 4.5%-6.65% 510,730 115,629 395,101 123,318
Total special assessment bonds 510,730 115,629 395,101 123,318
Other: Accrued vacation and sick leave benefits 4,086,709 2,343,960 2,180,161 4,250,508 2,380,284 Ohio Public Works Commission Long-Term Promissory Notes, 0-3% 2,442,338 170,290 2,272,048 171,134
Total other 6,529,047 2,343,960 2,350,451 6,522,556 2,551,418
Total long-term liabilities $10,919,047 $14,643,960 $2,955,451 $22,607,556 $3,401,418
The accrued vacation and sick leave benefits liability will be liquidated by several of the City’s governmental and internal service funds. In the past, approximately 73% has been paid by the General Fund, 10% by the Street Maintenance Fund and the remainder by the other governmental and internal service funds. The City uses the “vesting method” to determine the appropriate liability. In the event of delinquencies related to special assessment bonds, the City is required to use other resources until foreclosure proceeds are received to satisfy debt service. The City does not have a sinking fund or reserve established to cover defaults by property owners because foreclosure proceeds would eliminate any outstanding liability.
33
From time to time the City has issued Industrial Revenue Bonds to provide financial assistance to private-sector entities for the acquisition and construction of industrial and commercial facilities deemed to be in the public interest. Neither the City, the State, nor any political subdivision thereof is obligated in any manner for repayment of the bonds. Accordingly, the bonds are not reported as liabilities in the accompanying financial statements. At year-end there were two series of Industrial Revenue Bonds outstanding, with an aggregate principal amount payable of $4.9 million. The annual requirements to pay principal and interest on long-term obligations at December 31, 2009, are as follows:
Principal Interest Principal Interest Principal Interest
The Ohio Revised Code (ORC) provides that the total net debt (as defined in the ORC) of a municipal corporation, whether or not approved by the electors, shall not exceed 10.5% of the total value of all property in the municipal corporation as listed and assessed for taxation. In addition, the unvoted net debt of municipal corporations cannot exceed 5.5% of the total taxation value of property. At December 31, 2009, the City had a legal debt margin for total debt of $114,775,203 and a legal debt margin for unvoted debt of $65,064,501.
13. CONTINGENT LIABILITIES
The City is the defendant in various lawsuits and subject to various claims over which litigation has not commenced. Although the outcome of these matters is not presently determinable, in the opinion of the Law Director the resolution of these matters will not have a material adverse effect on the financial condition of the City. The City participates in several federally assisted programs that are subject to program compliance audits by the grantors or their representatives. A single financial and compliance audit of the city has been completed with no findings for recovery. The grantor agencies, at their option, may perform economy and efficiency audits, program results audits or conduct monitoring visits. Such audits and visits could lead to reimbursement to the grantor agencies. Management believes such reimbursements, if any, would be immaterial.
14. GASB 54
In 2009 the City adopted GASB Statement No. 54 “Fund Balance Reporting and Governmental Fund Type Definitions”.
34 CITY OF KETTERING, OHIOREQUIRED SUPPLEMENTARY INFORMATIONBUDGET(GAAP BUDGET) TO ACTUAL COMPARISON SCHEDULE - GENERAL FUNDFOR THE YEAR ENDED DECEMBER 31, 2009
Budgeted Amounts Variance withOriginal Final Actual Final Budget
Fund balance, January 1 $40,526,655 $40,526,655 $40,526,655Resources (inflows) Income taxes 39,200,000 35,000,000 35,321,466 $321,466 Property taxes 8,131,000 7,610,000 7,566,187 (43,813) Licenses and permits 531,000 490,000 521,039 31,039 Intergovernmental revenue 1,921,000 1,611,000 1,596,036 (14,964) Charges for services 176,000 167,000 158,201 (8,799) Fines and forfeits 1,515,000 1,365,000 1,327,184 (37,816) Investment earnings 1,664,000 1,664,000 2,331,681 667,681 Special assessments 350,000 400,000 399,664 (336) Refunds and reimbursements 1,200,000 1,400,000 1,547,554 147,554 Miscellaneous 13,000 13,000 17,086 4,086 Sale of city assets 30,000 30,000 21,016 (8,984) Amounts available for appropriation 95,257,655 90,276,655 91,333,769 1,057,114Charges to appropriations (outflows) General government: Mayor and Council: Personal services 242,200 242,600 242,574 26 Operating expenditures 91,896 92,680 61,807 30,873 Capital outlay Total mayor and council 334,096 335,280 304,381 30,899 Municipal court: Personal services 935,400 935,400 927,888 7,512 Operating expenditures 280,625 274,486 242,868 31,618 Capital outlay Total municipal court 1,216,025 1,209,886 1,170,756 39,130 Clerk of courts: Personal services 846,800 811,800 800,211 11,589 Operating expenditures 148,143 148,143 130,444 17,699 Capital outlay Total clerk of courts 994,943 959,943 930,655 29,288 Office of City Manager: Personal services 542,700 542,700 541,027 1,673 Operating expenditures 64,833 61,675 49,945 11,730 Capital outlay Total office of city manager 607,533 604,375 590,972 13,403 Law department: Personal services 718,800 718,800 691,795 27,005 Operating expenditures 163,152 200,606 186,111 14,495 Capital outlay Total law department 881,952 919,406 877,906 41,500 Finance department: Personal services 1,470,500 1,462,700 1,451,066 11,634 Operating expenditures 534,450 528,096 408,262 119,834 Capital outlay 15,500 10,500 10,500 Total finance department 2,020,450 2,001,296 1,859,328 141,968 Administrative support: Personal services 481,200 481,200 462,614 18,586 Operating expenditures 90,878 93,558 85,540 8,018 Capital outlay 6,000 Total administrative support 578,078 574,758 548,154 26,604
See accompanying notes to the required supplementary information.
CITY OF KETTERING, OHIO 35
REQUIRED SUPPLEMENTARY INFORMATIONBUDGET(GAAP BUDGET) TO ACTUAL COMPARISON SCHEDULE - GENERAL FUND - CONTINUEDFOR THE YEAR ENDED DECEMBER 31, 2009
Budgeted Amounts Variance withOriginal Final Actual Final Budget
General government: Human resources department: Personal services $627,100 $627,100 $603,716 $23,384 Operating expenditures 395,325 384,015 238,571 145,444 Capital outlay Total human resources department 1,022,425 1,011,115 842,287 168,828 Planning and development: Personal services 1,938,400 1,963,400 1,940,270 23,130 Operating expenditures 428,658 452,266 285,601 166,665 Capital outlay Total planning and development 2,367,058 2,415,666 2,225,871 189,795 Economic development: Personal services 132,400 132,400 131,647 753 Operating expenditures 783,651 780,111 657,041 123,070 Capital outlay Total economic development 916,051 912,511 788,688 123,823 Miscellaneous: Operating expenditures 1,256,751 1,308,131 804,331 503,800 Total miscellaneous 1,256,751 1,308,131 804,331 503,800 Total general government 12,195,362 12,252,367 10,943,329 1,309,038 Police: Personal services 10,014,900 10,246,900 10,245,595 1,305 Operating expenditures 2,316,358 2,076,344 1,710,358 365,986 Capital outlay 279,483 310,483 244,207 66,276 Total police 12,610,741 12,633,727 12,200,160 433,567 Fire: Personal services 6,995,600 7,728,600 7,727,068 1,532 Operating expenditures 2,110,432 2,310,098 1,744,019 566,079 Capital outlay 548,600 Total fire 9,654,632 10,038,698 9,471,087 567,611 Public works: Engineering department: Personal services 2,005,300 2,014,000 1,955,025 58,975 Operating expenditures 454,544 429,444 325,741 103,703 Capital outlay 72,310 46,310 42,450 3,860 Total engineering department 2,532,154 2,489,754 2,323,216 166,538 Street lighting: Operating expenditures 545,000 545,000 493,609 51,391 Total street lighting 545,000 545,000 493,609 51,391 Total public works 3,077,154 3,034,754 2,816,825 217,929 Transfers to other funds 17,851,100 21,046,380 15,445,122 5,601,258 Total charges to appropriations 55,388,989 59,005,926 50,876,523 8,129,403Fund balance, December 31 $39,868,666 $31,270,729 $40,457,246 $9,186,517
See accompanying notes to the required supplementary information.
36 CITY OF KETTERING, OHIOREQUIRED SUPPLEMENTARY INFORMATIONBUDGET(GAAP BUDGET) TO ACTUAL COMPARISON SCHEDULE - STREET MAINTENANCE FUNDFOR THE YEAR ENDED DECEMBER 31, 2009
Budgeted Amounts Variance withOriginal Final Actual Final Budget
Fund balance, January 1 $562,030 $562,030 $562,030Resources (inflows) Licenses and permits 10,000 10,000 7,784 ($2,216) Intergovernmental revenue 2,550,000 2,520,000 2,457,357 (62,643) Refunds and reimbursements 200,000 250,000 297,489 47,489 Miscellaneous 15,000 15,000 9,433 (5,567) Sale of city assets 10,000 10,000 21,401 11,401 Transfer from the general fund 2,775,000 2,945,950 2,567,700 (378,250) Amounts available for appropriation 6,122,030 6,312,980 5,923,194 (389,786)Charges to appropriations (outflows) Public works: Street department: Personal services 3,743,100 3,743,100 3,587,994 155,106 Operating expenditures 1,499,787 1,904,609 1,449,977 454,632 Capital outlay 464,525 564,525 540,459 24,066 Total charges to appropriations 5,707,412 6,212,234 5,578,430 633,804Fund balance, December 31 $414,618 $100,746 $344,764 $244,018
See accompanying notes to the required supplementary information.
CITY OF KETTERING, OHIO 37
REQUIRED SUPPLEMENTARY INFORMATIONBUDGET(GAAP BUDGET) TO ACTUAL COMPARISON SCHEDULE - PARKS, RECREATION AND CULTURAL ARTS FUNDFOR THE YEAR ENDED DECEMBER 31, 2009
Budgeted Amounts Variance withOriginal Final Actual Final Budget
Fund balance, January 1 $72,304 $72,304 $72,304Resources (inflows) Intergovernmental revenue 25,000 24,000 25,010 $1,010 Charges for services 3,828,000 3,248,000 3,203,551 (44,449) Refunds and reimbursements 133,000 123,000 80,711 (42,289) Miscellaneous 18,000 14,000 41,504 27,504 Sale of city assets 11,829 11,829 Transfer from the general fund 5,590,000 5,846,160 5,592,200 (253,960) Amounts available for appropriation 9,666,304 9,327,464 9,027,109 (300,355)Charges to appropriations (outflows) Leisure services: Parks, recreation and cultural arts department: Personal services 5,454,600 5,333,901 5,212,210 121,691 Operating expenditures 4,042,959 3,883,691 3,653,340 230,351 Capital outlay 151,400 68,000 66,779 1,221 Total charges to appropriations 9,648,959 9,285,592 8,932,329 353,263Fund balance, December 31 $17,345 $41,872 $94,780 $52,908
See accompanying notes to the required supplementary information.
38 CITY OF KETTERING, OHIOREQUIRED SUPPLEMENTARY INFORMATIONBUDGET(GAAP BUDGET) TO ACTUAL COMPARISON SCHEDULE - FRAZE PAVILION FUNDFOR THE YEAR ENDED DECEMBER 31, 2009
Budgeted Amounts Variance withOriginal Final Actual Final Budget
Fund balance, January 1 $117,396 $117,396 $117,396Resources (inflows) Charges for services 2,535,000 2,785,000 2,797,969 $12,969 Refunds and reimbursements 5,000 1,000 1,347 347 Miscellaneous 250,000 306,000 308,608 2,608 Transfer from the general fund 525,000 529,590 (529,590) Amounts available for appropriation 3,432,396 3,738,986 3,225,320 (513,666)Charges to appropriations (outflows) Leisure services: Fraze pavilion: Personal services 730,100 730,100 632,375 97,725 Operating expenditures 2,643,221 2,646,551 2,485,783 160,768 Total charges to appropriations 3,373,321 3,376,651 3,118,158 258,493Fund balance, December 31 $59,075 $362,335 $107,162 ($255,173)
See accompanying notes to the required supplementary information.
CITY OF KETTERING, OHIO 39
REQUIRED SUPPLEMENTARY INFORMATIONBUDGET(GAAP BUDGET) TO ACTUAL COMPARISON SCHEDULE -COMMUNITY DEVELOPMENT FUNDFOR THE YEAR ENDED DECEMBER 31, 2009
Budgeted Amounts Variance withOriginal Final Actual Final Budget
Fund balance, January 1 $1,189,299 $1,189,299 $1,189,299Resources (inflows) Intergovernmental revenue 700,000 2,162,413 783,920 ($1,378,493) Investment earnings 3,189 3,189 Miscellaneous 27,900 27,900 21,169 (6,731) Sale of city assets 15,000 15,000 Amounts available for appropriation 1,917,199 3,379,612 2,012,577 (1,367,035)Charges to appropriations (outflows) General government 593,820 1,178,863 628,457 550,406 Capital improvements 619,935 1,532,074 251,717 1,280,357 Total charges to appropriations 1,213,755 2,710,937 880,174 1,830,763Fund balance, December 31 $703,444 $668,675 $1,132,403 $463,728
See accompanying notes to the required supplementary information.
40 CITY OF KETTERING, OHIOREQUIRED SUPPLEMENTARY INFORMATIONBUDGET(GAAP BUDGET) TO ACTUAL COMPARISON SCHEDULE - EMERGENCY MEDICAL FUNDFOR THE YEAR ENDED DECEMBER 31, 2009
Budgeted Amounts Variance withOriginal Final Actual Final Budget
Fund balance, January 1 $5,790,104 $5,790,104 $5,790,104Resources (inflows) Charges for services 1,400,000 1,475,000 1,464,064 ($10,936) Investment earnings 80,000 240,000 360,116 120,116 Refunds and reimbursements 27,836 27,836 Amounts available for appropriation 7,270,104 7,505,104 7,642,120 137,016Charges to appropriations (outflows) Fire:
Operating expenditures 143,306 138,367 93,492 44,875 Capital outlay 575,000 675,000 675,000 Total fire 718,306 813,367 93,492 719,875 Capital Improvements Total charges to appropriations 718,306 813,367 93,492 719,875Fund balance, December 31 $6,551,798 $6,691,737 $7,548,628 $856,891
See accompanying notes to the required supplementary information.
CITY OF KETTERING, OHIO 41
NOTES TO THE REQUIRED SUPPLEMENTARY INFORMATION FOR THE YEAR ENDED DECEMBER 31, 2009 1. BUDGETS AND BUDGETARY ACCOUNTING
An annual budget for all governmental fund types covering the period January 1 through December 31 of the following year showing estimated revenues and expenditures is submitted to the County Auditor as Secretary of the County Budget Commission. The budget is passed by City Council, after public hearings are held, by July 15 of each year, and submitted to the County Budget Commission by July 20 of each year. The County Budget Commission certifies its actions relative to the annual budget to the City by September 1. As part of this certification, the City receives an official certificate of estimated resources which states the projected receipts by fund. On or about January 1, this certificate is amended to include any unencumbered fund balances from the preceding year. Prior to December 31, the City must revise its budget so that the total contemplated expenditures from any fund during the ensuing fiscal year will not exceed the amount stated in the certificate of estimated resources. The revised budget then serves as the basis for the annual appropriations ordinance. A temporary appropriations ordinance to control expenditures may be passed on or about January 1 of each year for the period January 1 through March 31. An annual appropriations ordinance must be passed by April 1 of each year for the period January 1 to December 31. The appropriations ordinance generally controls expenditures at the level of personal services, operating expenditures and capital outlay on a department level, except for the state highway fund, cemetery fund, police pension fund, DESC (Defense Electronics Supply Center) reuse fund, special safety grants and programs fund, community development fund, emergency medical fund and the capital projects fund which are controlled at the fund level. The City Manager has the authority to amend appropriations within the department at the levels of personal service, operating expenditures and capital outlay; amendments above this level require council approval. The ordinance may be amended or supplemented by Council during the year as required. Amendments to the appropriations ordinance made during the year were not material in relation to the original appropriations. Total expenditures in any fund do not exceed the estimated resources for that fund. Unencumbered appropriations lapse at year-end, while encumbered amounts are reappropriated in the following year’s budget. The Finance Director in conjunction with the annual budgeting process estimates revenues. However, these estimates are not included or required in the budget ordinance. The City, being a home rule municipal corporation, has adopted, through ordinance, GAAP (generally accepted accounting principles) as its budgetary basis. Encumbrance accounting, under which purchase orders, contracts, and other commitments for the expenditure of monies are recorded in order to reserve that portion of the applicable appropriation, is employed as an extension of formal budgetary control in the governmental funds. Encumbrances outstanding at year-end are reported as restricted, committed or assigned fund balance for subsequent year expenditures.
FINANCIAL STATEMENTS
OF
INDIVIDUAL FUNDS
44 CITY OF KETTERING, OHIO
NONMAJOR SPECIAL REVENUE FUNDSCOMBINING BALANCE SHEET DECEMBER 31, 2009
Special TotalState Police DESC Safety Grants Governmental
Highway Cemetery Pension Reuse & Programs FundsASSETSPooled cash and investments $90 $386,641 $376,641 $73,812 $2,875,511 $3,712,695Receivables: Property taxes 399,000 399,000 Accounts 45,915 45,915Due from other governments 171,378 17 48,475 219,870Prepaid expenditures Total assets $171,468 $386,641 $775,658 $73,812 $2,969,901 $4,377,480
LIABILITIESAccounts payable $335 $11,486 $32,787 $44,608Accrued payroll $366,095 6,064 372,159Deferred revenue 157,655 399,000 52,045 608,700 Total liabilities 157,990 765,095 11,486 90,896 1,025,467FUND BALANCESNonspendable: Prepaids Restricted for: Public safety 10,563 776,567 787,130 Road construction / Public works 13,478 13,478 Municipal court activities 1,236,513 1,236,513Committed to: Social services 7,385 7,385 Public safety 11,724 11,724 Leisure services 386,641 846,816 1,233,457 Other purposes 62,326 62,326 Total fund balances 13,478 386,641 10,563 62,326 2,879,005 3,352,013 Total liabilities and fund balances $171,468 $386,641 $775,658 $73,812 $2,969,901 $4,377,480
CITY OF KETTERING, OHIO 45
NONMAJOR SPECIAL REVENUE FUNDSCOMBINING STATEMENT OF REVENUES, EXPENDITURES, AND CHANGES IN FUND BALANCES - BUDGET AND ACTUAL (GAAP BUDGET)FOR THE YEAR ENDED DECEMBER 31, 2009
State Highway CemeteryFinal Budget Actual Variance Final Budget Actual Variance
REVENUESProperty taxesIntergovernmental revenue $1,108,000 $1,009,685 ($98,315)Charges for services $9,000 $5,269 ($3,731)Fines and forfeitsInvestment earnings 4,634 4,634 12,000 20,825 8,825Refunds and reimbursementsMiscellaneous 4,000 3,910 (90) Total revenues 1,108,000 1,014,319 (93,681) 25,000 30,004 5,004EXPENDITURESCurrent: General government 20,000 9,006 10,994 Police Fire Public works 137,500 110,184 27,316 Leisure servicesCapital improvements 1,315,000 1,250,712 64,288 Total expenditures 1,452,500 1,360,896 91,604 20,000 9,006 10,994 Excess (deficiency) of revenues over expenditures (344,500) (346,577) (2,077) 5,000 20,998 15,998OTHER FINANCING SOURCES (USES) Transfers in 308,000 208,900 (99,100) Transfers out Net change in fund balance (36,500) (137,677) (101,177) 5,000 20,998 15,998Fund balances--beginning 151,155 151,155 365,643 365,643Fund balances--ending $114,655 $13,478 ($101,177) $370,643 $386,641 $15,998
46 CITY OF KETTERING, OHIO
NONMAJOR SPECIAL REVENUE FUNDSCOMBINING STATEMENT OF REVENUES, EXPENDITURES, AND CHANGES IN FUND BALANCES - BUDGET AND ACTUAL (GAAP BUDGET) - CONTINUEDFOR THE YEAR ENDED DECEMBER 31, 2009
Police Pension DESC ReuseFinal Budget Actual Variance Final Budget Actual Variance
REVENUESProperty taxes $398,000 $397,973 ($27)Intergovernmental revenueCharges for services $34,000 $34,203 $203Fines and forfeitsInvestment earningsRefunds and reimbursements 17,000 15,371 (1,629)Miscellaneous Total revenues 398,000 397,973 (27) 51,000 49,574 (1,426)EXPENDITURESCurrent: General government 248,345 164,970 83,375 Police 1,387,600 1,356,861 30,739 Fire Public works Leisure servicesCapital improvements Total expenditures 1,387,600 1,356,861 30,739 248,345 164,970 83,375 Excess (deficiency) of revenues over expenditures (989,600) (958,888) 30,712 (197,345) (115,396) 81,949OTHER FINANCING SOURCES (USES) Transfers in 1,000,000 959,400 (40,600) 180,340 136,300 (44,040) Transfers out Net change in fund balance 10,400 512 (9,888) (17,005) 20,904 37,909Fund balances--beginning 10,051 10,051 41,422 41,422Fund balances--ending $20,451 $10,563 ($9,888) $24,417 $62,326 $37,909
CITY OF KETTERING, OHIO 47
NONMAJOR SPECIAL REVENUE FUNDSCOMBINING STATEMENT OF REVENUES, EXPENDITURES, AND CHANGES IN FUND BALANCES - BUDGET AND ACTUAL (GAAP BUDGET) - CONTINUEDFOR THE YEAR ENDED DECEMBER 31, 2009
Special Safety Grants & Programs TotalFinal Budget Actual Variance Final Budget Actual Variance
REVENUESProperty taxes $398,000 $397,973 ($27)Intergovernmental revenue $1,743,490 $1,561,300 ($182,190) 2,851,490 2,570,985 (280,505)Charges for services 43,000 39,472 (3,528)Fines and forfeits 396,000 452,886 56,886 396,000 452,886 56,886Investment earnings 32,138 67,209 35,071 44,138 92,668 48,530Refunds and reimbursements 10,265 10,265 17,000 25,636 8,636Miscellaneous 120,000 154,103 34,103 124,000 158,013 34,013 Total revenues 2,291,628 2,245,763 (45,865) 3,873,628 3,737,633 (135,995)EXPENDITURESCurrent: General government 683,786 407,334 276,452 952,131 581,310 370,821 Police 482,844 84,170 398,674 1,870,444 1,441,031 429,413 Fire 3,000 3,000 3,000 3,000 Public works 9,686 9,057 629 147,186 119,241 27,945 Leisure services 105,348 34,505 70,843 105,348 34,505 70,843Capital improvements 473,679 405,925 67,754 1,788,679 1,656,637 132,042 Total expenditures 1,758,343 940,991 817,352 4,866,788 3,832,724 1,034,064 Excess (deficiency) of revenues over expenditures 533,285 1,304,772 771,487 (993,160) (95,091) 898,069OTHER FINANCING SOURCES (USES) Transfers in 241,340 206,522 (34,818) 1,729,680 1,511,122 (218,558) Transfers out Net change in fund balance 774,625 1,511,294 736,669 736,520 1,416,031 679,511Fund balances--beginning 1,367,711 1,367,711 1,935,982 1,935,982Fund balances--ending $2,142,336 $2,879,005 $736,669 $2,672,502 $3,352,013 $679,511
48 CITY OF KETTERING, OHIO
DEBT SERVICE FUNDSTATEMENT OF REVENUES, EXPENDITURES, AND CHANGES IN FUND BALANCE - BUDGET AND ACTUAL (GAAP BUDGET)FOR THE YEAR ENDED DECEMBER 31, 2009
Final Budget Actual VarianceREVENUESProperty taxes $1,252,000 $1,252,025 $25Investment earnings 52,000 56,405 4,405Special assessments 149,000 149,593 593Refunds and reimbursements 30,000 28,607 (1,393) Total revenues 1,483,000 1,486,630 3,630EXPENDITURESCurrent: General government 2,000 2,000Debt service: Principal 955,290 775,290 180,000 Interest 798,637 463,231 335,406 Total expenditures 1,755,927 1,238,521 517,406 Deficiency of revenues over expenditures (272,927) 248,109 521,036OTHER FINANCING SOURCES (USES) Transfers in 310,000 301,000 (9,000) Premium on debt issuance 153,000 153,651 651 Net change in fund balance 190,073 702,760 512,687Fund balances--beginning 12,367 12,367Fund balances--ending $202,440 $715,127 $512,687
CITY OF KETTERING, OHIO 49
CAPITAL PROJECTS FUNDSTATEMENT OF REVENUES, EXPENDITURES, AND CHANGES IN FUND BALANCE - BUDGET AND ACTUAL (GAAP BUDGET)FOR THE YEAR ENDED DECEMBER 31, 2009
Final Budget Actual VarianceREVENUESProperty taxes $149,000 $129,702 ($19,298)Intergovernmental 5,195,000 4,457,149 (737,851)Investment earnings 100,000 119,662 19,662Special assessments 460,000 457,622 (2,378)Refunds and reimbursements 131,000 92,511 (38,489) Total revenues 6,035,000 5,256,646 (778,354)EXPENDITURESCapital improvements 14,223,123 8,312,708 5,910,415 Total expenditures 14,223,123 8,312,708 5,910,415 Deficiency of revenues over expenditures (8,188,123) (3,056,062) 5,132,061OTHER FINANCING SOURCES (USES) Transfers in 9,685,000 5,473,100 (4,211,900) General obligation debt issuance 12,300,000 12,300,000 Premium on debt issuance 86,000 86,100 100 Net change in fund balance 13,882,877 14,803,138 920,261Fund balances--beginning 1,310,968 1,310,968Fund balances--ending $15,193,845 $16,114,106 $920,261
50 CITY OF KETTERING, OHIO
CAPITAL PROJECTS FUNDDETAILED SCHEDULE OF EXPENDITURES COMPARED TO BUDGET (GAAP BUDGET)FOR THE YEAR ENDED DECEMBER 31, 2009
Final Budget Actual VarianceCapital improvements: Traffic controls $366,864 $274,418 $92,446 Street construction 7,431,412 5,508,213 1,923,199 Drainage 150,735 62,518 88,217 Parks and recreation 1,706,639 1,206,801 499,838 Tree planting and landscaping 130,000 67,976 62,024 Other 4,437,473 1,192,782 3,244,691 Total capital projects fund $14,223,123 $8,312,708 $5,910,415
CITY OF KETTERING, OHIO 51
INTERNAL SERVICE FUNDSCOMBINING BALANCE SHEETDECEMBER 31, 2009
Administrative HealthOperations Insurance Totals
ASSETSCurrent assets: Pooled cash and investments $352,023 $4 $352,027 Accounts receivable 416 416 Due from other governments 19,065 19,065 Prepaid expenses 200 263,461 263,661 Inventory 332,718 332,718 Total current assets 704,422 263,465 967,887Noncurrent assets: Buildings and improvements 757,936 757,936 Machinery and equipment 2,019,076 2,019,076 Less: Accumulated depreciation (2,202,539) (2,202,539) Total noncurrent assets 574,473 574,473 Total assets $1,278,895 $263,465 $1,542,360
LIABILITIESCurrent liabilities: Accounts payable $116,137 $116,137 Due to General fund $234,300 234,300 Accrued payroll 141,930 141,930 Total current liabilities 258,067 234,300 492,367Noncurrent liabilities: Accrued vacation and sick leave benefits 333,565 333,565 Total liabilities 591,632 234,300 825,932NET ASSETSInvested in capital assets 574,473 574,473Unrestricted 112,790 29,165 141,955 Total net assets 687,263 29,165 716,428 Total liabilities and net assets $1,278,895 $263,465 $1,542,360
52 CITY OF KETTERING, OHIO
INTERNAL SERVICE FUNDSCOMBINING STATEMENT OF REVENUES, EXPENSES, AND CHANGES IN FUND NET ASSETSFOR THE YEAR ENDED DECEMBER 31, 2009
Administrative HealthOperations Insurance Totals
OPERATING REVENUESCharges for services $5,886,154 $4,022,312 $9,908,466 Total operating revenues 5,886,154 4,022,312 9,908,466OPERATING EXPENSESPersonal services 3,016,418 3,016,418Repairs and maintenance 1,476,025 1,476,025Contractual services 625,153 4,019,407 4,644,560Other materials and expenses 426,388 426,388Depreciation 171,367 171,367 Total operating expenses 5,715,351 4,019,407 9,734,758 Operating income (loss) 170,803 2,905 173,708NONOPERATING REVENUES (EXPENSES)Investment earnings 23,111 23,111 Change in net assets 193,914 2,905 196,819 Total net assets--beginning 493,349 26,260 519,609 Total net assets--ending $687,263 $29,165 $716,428
CITY OF KETTERING, OHIO 53
INTERNAL SERVICE FUNDS COMBINING STATEMENT OF CASH FLOWSFOR THE YEAR ENDED DECEMBER 31, 2009Increase (Decrease) in cash
Administrative HealthOperations Insurance Totals
CASH FLOWS FROM OPERATING ACTIVITIESCash received for services $5,876,952 $4,022,312 $9,899,264Cash paid to suppliers for goods or services (2,626,045) (4,282,868) (6,908,913)Cash paid to employees for services (3,019,103) (3,019,103) Net cash provided (used) by operating activities 231,804 (260,556) (28,752)CASH FLOWS FROM CAPITAL AND RELATED FINANCING ACTIVITIESAcquisition of capital assets (64,426) (64,426)Loan from General fund 234,300 234,300Sale of capital assets 1,197 1,197 Net cash used by capital and related financing activities (63,229) 234,300 171,071CASH FLOWS FROM INVESTING ACTIVITIESInvestment earnings 23,111 23,111 Net cash provided by investing activities 23,111 0 23,111 Net increase (decrease) in cash 191,686 (26,256) 165,430Cash at beginning of year 160,337 26,260 186,597Cash at end of year $352,023 $4 $352,027
RECONCILIATION OF OPERATING INCOME (LOSS) TO NET CASH PROVIDED (USED) BY OPERATING ACTIVITIESOperating income (loss) $170,803 $2,905 $173,708Adjustments to reconcile operating income (loss) to net cash provided (used) by operating activities: Depreciation 171,367 171,367 (Increase) decrease in receivables (8,006) (8,006) (Increase) decrease in inventories (35,083) (35,083) Increase (decrease) in accounts payable (64,727) (64,727) Net (increase) decrease in other operating net assets (2,550) (263,461) (266,011) Net cash provided (used) by operating activities $231,804 ($260,556) ($28,752)
54 CITY OF KETTERING, OHIO
AGENCY FUNDSCOMBINING STATEMENT OF CHANGES IN ASSETS AND LIABILITIESFOR THE YEAR ENDED DECEMBER 31, 2009
This part of the City of Kettering’s comprehensive annual financial report presents detailed information as a context for understanding what the information in the financial statements, note disclosures, and required supplementary information says about the City’s overall financial health. Category Schedule #s Financial Trends 1, 2, 3 & 4 These schedules contain trend information to help the reader understand how the City’s financial performance and well-being have changed over time. Revenue Capacity 5 & 6 These schedules contain information to help the reader assess the City’s most significant local revenue source, the income tax. Debt Capacity 7 & 8 These schedules present information to help the reader assess the affordability of the City’s current levels of outstanding debt and the City’s ability to issue additional debt in the future. Economic and Demographic Information 9 & 10 These schedules offer economic and demographic indicators to help the reader understand the environment within which the City’s financial activities take place. Operating Information 11, 12 & 13 These schedules contain service and infrastructure data to help the reader
understand how the information in the City’s financial report relates to the services the City provides.
Sources: Unless otherwise noted, the information in these schedules is derived from the comprehensive annual financial reports for the relevant year.
CITY OF KETTERING, OHIO 58
SCHEDULE 1NET ASSETS BY CATEGORYLAST TEN YEARS (accrual basis of accounting )
Note: Accounting standards require that net assets be reported in three components in the financial statements: invested in capital assets, net of related debt; restricted; and unrestricted. Net assets are considered restricted when (1) and external party, such as the state or federal government, places a restriction on how the resourcesmay be used, or (2) enabling legislation is enacted by the city.
Year
Net Assets (accrual basis)
$0
$20
$40
$60
$80
$100
$120
$140
$160
$180
$200
2000
2001
2002
2003
2004
2005
2006
2007
2008
2009
Mill
ions
UnrestrictedTotal net assets
CITY OF KETTERING, OHIOSCHEDULE 2
CHANGES IN NET ASSETSLAST TEN YEARS (accrual basis of accounting )
2000 2001 2002 2003 2004 2005 2006 2007 2008 2009Expenses General government $10,324,836 $10,716,604 $11,179,273 $12,142,127 $13,210,288 $12,339,967 $14,150,379 $17,232,295 $13,755,091 $13,175,646 Police 9,413,721 10,270,530 10,626,973 10,840,287 11,282,263 11,530,015 12,914,191 12,849,315 13,760,327 13,658,265 Fire 6,356,550 7,349,117 7,569,675 7,768,263 8,768,088 8,380,554 8,709,771 8,932,687 9,666,999 9,968,087 Public works 9,791,899 9,812,828 10,803,744 11,236,775 11,926,820 11,813,178 11,360,485 12,263,789 13,404,095 12,901,084 Leisure services 10,231,388 10,832,180 11,665,610 11,479,183 11,834,644 11,873,881 12,416,056 12,234,615 13,254,478 12,836,109 Interest on long term debt 619,018 541,085 458,517 386,200 292,918 1,168,357 1,180,009 1,148,457 1,144,483 504,262Total expenses 46,737,412 49,522,344 52,303,792 53,852,835 57,315,021 57,105,952 60,730,891 64,661,158 64,985,473 63,043,453Program Revenues Charges for services: General government 1,686,309 2,015,725 2,353,231 2,344,241 2,436,404 2,704,373 2,496,686 2,623,279 2,644,901 2,443,428 Fire 1,144,791 986,737 1,156,577 1,343,281 1,433,964 1,522,104 1,430,458 Leisure services 3,907,797 4,098,781 4,508,945 4,398,036 5,085,696 5,379,969 5,344,896 5,852,344 6,439,659 6,001,520 Other activities 2,660 880 205 67,602 62,639 55,265 56,126 64,520 85,171 63,138 Operating grants and contributions 1,860,874 1,216,785 1,743,952 1,388,760 1,623,605 1,563,184 1,253,950 1,225,065 2,367,960 1,484,287 Capital grants and contributions: Public works 4,449,371 4,284,996 3,779,248 6,560,882 2,583,208 2,187,075 3,216,110 3,286,179 1,677,377 3,692,950 Other activities 25,000 367,750 58,653 29,216 203,067 904,254 302,002 36,521 163,106Total program revenues 11,932,011 11,984,917 12,385,581 15,962,965 12,807,505 13,249,510 14,615,303 14,787,353 14,773,693 15,278,887Net (Expense)/Revenue 1
(1)Net (expense)/revenue is the difference between the expenses and program revenues of a function or program. It indicates the degree to which a function or program is supported with its ownfees and program-specific grants versus its reliance upon funding from taxes and other general revenues. Numbers in parentheses indicate that expenses were greater than program revenuesand therefore general revenues were needed to finance that function or program. Numbers without parentheses mean that program revenues were more than sufficient to cover expenses.
59
CITY OF KETTERING, OHIO 60
SCHEDULE 3FUND BALANCES, GOVERNMENTAL FUNDSLAST TEN YEARS (modified accrual basis of accounting )
Source: City of Kettering, Ohio, Finance DepartmentThe City levies a 2.25% income tax on substantially all income earned within the City. Additional increases in the income taxrate require voter approval. City residents pay City income tax on income earned outside the City, however; a credit is allowedfor income taxes paid to other municipalities. Employers within the City withhold income tax on employee compensation andremit at least quarterly.
SCHEDULE 6RANKING OF TOP TEN INCOME TAX WITHHOLDERS CURRENT YEAR AND TEN YEARS AGO (cash basis of accounting )
Rank Name 2009 Rank Rank Name1 Kettering Medical Center - 1 Delphi Automotive Systems LLC2 Reynolds & Reynolds Company 1 2 Kettering Medical Center3 GE Money 5 3 Federal Government4 Kettering Board of Education 4 4 Kettering Board of Education5 Federal Government 2 5 Reynolds & Reynolds Company6 Eastman Kodak Company 6 6 Scitex Digital Printing Inc.7 City of Kettering 81 7 Intimate Brands Inc.8 Limited Brands Inc. & Subs 7 8 City of Kettering9 Time Warner Entertainment Inc. - 9 General Motors Corporation
10 Meadwestvaco Corporation 31 10 Monogram Services Co LLCCombined percentage of Combined percentage of Total Income taxes 30.7% Total Income taxes 33.4%
Source: City of Kettering, Ohio, Finance DepartmentDue to legal restrictions and confidentiality requirements, the City cannot disclose the amount of withholdings by taxpayer. The City chose not to disclose percentages and number of filers by income level because the City does not require all taxpayers to file a return, therefore it does not have, nor can it obtain, this type of information.
(1) GE Money reports the activity formerly known as Monogram Services Co LLC.; Scitex Digital Printing Inc. was purchased by Eastman Kodak Company; Limited Brands Inc. & Subs reports the activity formerly known as Intimate Brands Inc.
1999
Individual
2009
Income Tax Revenues
$0$5
$10$15$20$25$30$35$40$45
2000 2001 2002 2003 2004 2005 2006 2007 2008 2009
Mill
ions
CITY OF KETTERING, OHIOSCHEDULE 7
RATIOS OF OUTSTANDING DEBT BY TYPE AND LEGAL DEBT MARGINS - LAST TEN YEARS
2000 2001 2002 2003 2004 2005 2006 2007 2008 2009
General Obligation Bonds $8,997,168 $7,514,792 $5,966,977 $4,349,119 $2,643,554 $5,563,536 $4,564,339 $4,218,631 $3,879,270 $15,689,899 Percent of estimated actual property value 0.28% 0.24% 0.19% 0.13% 0.08% 0.16% 0.12% 0.11% 0.10% 0.44% Per capita 156 131 104 76 46 97 79 73 67 273
Less debt outside limitations: Special Assessment Debt 1,288,184 1,193,560 1,094,375 990,233 905,798 816,127 720,807 619,149 510,730 395,101 Promissory Notes 685,994 2,545,494 3,461,615 3,241,766 3,278,644 3,075,818 2,856,949 2,637,298 2,442,338 2,272,048Less debt service fund balance 117,532 38,533 46,554 34,549 15,178 15,638 16,476 16,697 12,367 715,127Net debt within limitations for both Voted and Unvoted debt 8,879,636 7,476,259 5,920,423 4,314,570 2,628,376 5,547,898 4,547,863 4,201,934 3,866,903 14,974,772
Debt limitation for both Voted and Unvoted debt 10.5% of assessed valuation 115,575,064 115,633,711 114,650,117 124,670,352 122,665,459 122,629,124 134,354,645 132,966,025 131,355,181 129,749,975
Legal debt margin for Voted and Unvoted debt $106,695,428 $108,157,452 $108,729,694 $120,355,782 $120,037,083 $117,081,226 $129,806,782 $128,764,091 $127,488,278 $114,775,203Net debt within limitations for both Voted and Unvoted debt as a percentage of debt limit 7.68% 6.47% 5.16% 3.46% 2.14% 4.52% 3.38% 3.16% 2.94% 11.54%
Net debt within limitations for both Voted and Unvoted limitation $8,879,636 $7,476,259 $5,920,423 $4,314,570 $2,628,376 $5,547,898 $4,547,863 $4,201,934 $3,866,903 $14,974,772Less voted debt 3,924,352 3,114,352 2,264,352 1,369,352 429,352 294,663 180,147 82,780 0 12,075,000Net debt within limitations for Unvoted debt 4,955,284 4,361,907 3,656,071 2,945,218 2,199,024 5,253,235 4,367,716 4,119,154 3,866,903 2,899,772
Debt limitation for Unvoted debt 5.5% of assessed valuation 60,539,319 60,570,039 60,054,823 65,303,518 64,253,336 64,234,303 70,376,243 69,648,870 68,805,095 67,964,273
Legal debt margin for Unvoted debt $55,584,035 $56,208,132 $56,398,752 $62,358,300 $62,054,312 $58,981,068 $66,008,527 $65,529,716 $64,938,192 $65,064,501Net debt within limitations for Unvoted debt as a percentage of debt limit 8.19% 7.20% 6.09% 4.51% 3.42% 8.18% 6.21% 5.91% 5.62% 4.27%
Source: City of Kettering, Ohio, Finance Department
63
64 CITY OF KETTERING, OHIOSCHEDULE 8
DIRECT AND OVERLAPPING DEBTDECEMBER 31, 2009
Percentage AmountState of Ohio Applicable Applicable
Net Debt to City of to City ofJurisdiction Outstanding Kettering1 Kettering
City of Kettering $17,246,820 100.0% $17,246,820
Overlapping debt: Kettering City School District 98,683,570 92.1% 90,887,568 Montgomery County 41,150,422 12.1% 4,979,201 Beavercreek Local School District 110,127,776 0.9% 991,150Total overlapping debt 249,961,768 96,857,919Total direct and overlapping debt $267,208,588 $114,104,739
Source: Individual jurisdictions. (1) The percentage of overlapping debt applicable is estimated using assessed property values. Applicable percentages were estimated by determining the portion of another governmental unit's assessed value that is within the City's boundaries and dividing it by each unit's total assessed value. Individual jurisdictions with immaterial amounts of overlapping debt are excluded from this table.
SCHEDULE 9DEMOGRAPHIC AND ECONOMIC STATISTICSLAST TEN YEARS
Per capita Avg Sale Price Personal Unemployment for a Single Total Assessed Estimated Actual
Year Population 1 Personal Income 2 Income 1,2 Rate 3 Family Home 4 Property Value 5 Property Value 5
(1) 1990 & 2000 United States Census Bureau.(2) City of Kettering, Ohio, Finance Department.(3) Ohio Bureau of Employment Services.(4) Dayton Area Board of Realtors, Dayton, Ohio (2009 price range: $11,000 - $720,000).(5) Montgomery County, Ohio, Auditor's Office.
Unemployment Rate
0.0%
2.0%
4.0%
6.0%
8.0%
10.0%
12.0%
00 01 02 03 04 05 06 07 08 09 Year
citystatenation
Per Capita Personal Income
10,000
15,000
20,000
25,000
30,000
35,000
40,000
00 01 02 03 04 05 06 07 08 09
CITY OF KETTERING, OHIO 65
SCHEDULE 10PRINCIPAL EMPLOYERSCURRENT YEAR AND NINETEEN YEARS AGO
19901
% of % of Total City Total City
Employer Employees Employment Employer Employees EmploymentKettering Medical Center 3,100 10.99% General Motors Corporation 2 4,405 13.39%GE Money 1,700 6.03% Kettering Medical Center 2,975 9.04%Reynolds & Reynolds Company 1,250 4.43% Defense Electronics Supply Center 2,500 7.60%Kettering City Schools 1,137 4.03% Kroger Company 1,313 3.99%Intimate Brands Inc. 1,000 3.55% Kettering City Schools 1,033 3.14%City of Kettering 900 3.19% Meijer Inc 900 2.74%Eastman Kodak Company 700 2.48% City of Kettering 800 2.43%Meijer Inc. 550 1.95% Eastman Kodak Company 350 1.06%Tenneco 300 1.06% Ohio Bell Telephone Company 292 0.89%
Total 10,637 37.72% Total 14,568 44.28%
Source: City of Kettering, Ohio, Office of Economic Development(1) Past information is available every 10 years.(2) Tenneco now owns the plant formerly owned by General Motors Corp.
SCHEDULE 11CITY GOVERNMENT EMPLOYEES BY FUNCTION/PROGRAM (full-time equivalents)LAST TEN YEARS
(1) City of Kettering, Human Resources Department (2) City of Kettering, Planning and Development Dept. Permits and inspections performed include Building, Electrical, Plumbing & Heating.(3) City of Kettering, Planning and Development Department. Community Development Block Grant (CDBG) loan applications processed include housing rehabilitation, purchase rehabilitation, and business loan applications.(4) City of Kettering, Finance Department. Payroll checks include electronic funds transfers processed for payroll.(5) City of Kettering, Finance Department.(6) City of Kettering, Law Department(7) City of Kettering, Municipal Court(8) City of Kettering, Police Department. Criminal arrests include arrests by detective section and patrol.(9) City of Kettering, Police Department.(10) City of Kettering, Fire Department.(11) City of Kettering, Public Service Department, Engineering Division(12) City of Kettering, Public Service Department, Street Division(13) City of Kettering, Parks, Recreation, and Cultural Arts Department
SCHEDULE 13CAPITAL ASSET AND INFRASTRUCTURE STATISTICS BY FUNCTION/PROGRAMLAST TEN YEARSFunction/program 2000 2001 2002 2003 2004 2005 2006 2007 2008 2009General Government Square footage occupied1 25,582 25,582 25,582 25,582 25,582 43,108 43,108 43,108 54,933 54,933Police Stations1 1 1 1 1 1 1 1 1 1 1 Square footage of building1 16,515 16,515 16,515 16,515 16,515 16,515 16,515 16,515 16,515 16,515Fire Stations1 7 7 7 7 7 7 7 7 7 7Public Works Miles of roads2 244 246 246 246 246 246 246 246 246 246 Miles of storm sewer/channel2 172 173 174 174 175 175 175 175 175 175Leisure Services Number of parks3 21 21 21 21 21 21 21 21 21 21 Area of parks (acres)3 408 408 419 419 419 419 419 419 419 419 Recreation complexes square ft 1 145,000 145,000 145,000 145,000 145,000 153,512 153,512 153,512 153,512 153,512
(1) City of Kettering, Facilities Department (2) City of Kettering, Public Service Department, Engineering Division(3) City of Kettering, Parks, Recreation, and Cultural Arts Department
CITY OF KETTERING, OHIO
COMPREHENSIVE ANNUAL FINANCIAL REPORT
YEAR ENDED DECEMBER 31, 2010
Prepared by:
Department of Finance Nancy H. Gregory, CPA, Director
CITY OF KETTERING, OHIO i
COMPREHENSIVE ANNUAL FINANCIAL REPORTFOR THE YEAR ENDED DECEMBER 31, 2010
TABLE OF CONTENTS
PageINTRODUCTORY SECTIONLetter of Transmittal iiiCity Officials viDepartment of Finance Staff viiCity Organizational Chart viiiCertificate of Achievement for Excellence in Financial Reporting ix
Government-wide Financial Statements: Statement of Net Assets 10 Statement of Activities 11 Fund Financial Statements: Fund Balance Sheets - Governmental Funds 12 Statement of Revenues, Expenditures and Changes in Fund Balances - Governmental Funds 14 Balance Sheet - Proprietary Funds 16 Statement of Revenues, Expenses and Changes in Net Assets - Proprietary Funds 17 Statement of Cash Flows - Proprietary Funds 18 Statement of Fiduciary Net Assets - Fiduciary Funds 19 Statement of Changes in Fiduciary Net Assets - Fiduciary Funds 19g y y Notes to the Basic Financial Statements 21
Required Supplementary Information: Budget (GAAP Budget) to Actual Comparison Schedule - General Fund 34 Budget (GAAP Budget) to Actual Comparison Schedule - Street Maintenance Fund 36 Budget (GAAP Budget) to Actual Comparison Schedule - Parks Recreation and Cultural Arts Fund 37 Budget (GAAP Budget) to Actual Comparison Schedule - Fraze Pavilion Fund 38 Budget (GAAP Budget) to Actual Comparison Schedule - Community Development Fund 39 Budget (GAAP Budget) to Actual Comparison Schedule - Emergency Medical Fund 40 Notes to the Required Supplementary Information 41
SUPPLEMENTAL DATANonmajor Special Revenue Funds: Combining Balance Sheet 44 Combining Statement of Revenues, Expenditures and Changes in Fund Balances- Budget and Actual (GAAP Budget) 45Debt Service Fund: Statement of Revenues, Expenditures and Changes in Fund Balance - Budget and Actual (GAAP Budget) 48Capital Projects Fund: Statement of Revenues, Expenditures and Changes in Fund Balance - Budget and Actual (GAAP Budget) 49 Detailed Schedule of Expenditures Compared to Budget (GAAP Budget) 50Internal Service Funds: Combining Balance Sheet 51 Combining Statement of Revenues, Expenses and Changes in Fund Net Assets 52 Combining Statement of Cash Flows 53Agency Funds: Combining Statement of Changes in Assets and Liabilities 54Miscellaneous Schedules: Debt Schedule 55
ii CITY OF KETTERING, OHIOCOMPREHENSIVE ANNUAL FINANCIAL REPORTFOR THE YEAR ENDED DECEMBER 31, 2010
TABLE OF CONTENTS - CONTINUED
Schedule PageSTATISTICAL SECTIONNet Assets by Category Last Ten Years 1 58Changes in Net Assets Last Ten Years 2 59Fund Balances, Governmental Funds Last Ten Years 3 60Changes in Fund Balances, Governmental Funds Last Ten Years 4 61Income Tax by Payer Type and Income Tax Rate Last Ten Years 5 62Ranking of Top Ten Income Tax Withholders Current Year and Ten Years Ago 6 62Ratios of Outstanding Debt by Type and Legal Debt Margins Last Ten Years 7 63Direct and Overlapping Debt 8 64Demographic and Economic Statistics Last Ten Years 9 64Principal Employers Current Year and Eighteen Years Ago 10 65City Government Employees by Function/Program Last Ten Years 11 65Operating Indicators by Function/Program Last Ten Years 12 66Capital Asset and Infrastructure Statistics by Function/Program Last Ten Years 13 66
March 31, 2011 Honorable Mayor, Members of City Council and Citizens of Kettering, Ohio: The Comprehensive Annual Financial Report for the City of Kettering for the year ended December 31, 2010, is hereby submitted. Responsibility for the accuracy of the data and the completeness and fairness of the presentation including all disclosures, rests with the City. To the best of our knowledge and belief, the enclosed data are accurate in all material respects and are reported in a manner designed to present fairly the financial position and results of operations of the City. All disclosures necessary to enable the reader to gain an understanding of the City’s financial activities have been included. The City provides various services including police and fire protection, parks, recreation and cultural arts, street maintenance, planning, zoning and other general governmental services. The City does not maintain utility operations. In addition to general governmental activities, the City oversees the Kettering Volunteer Firefighters Pension Plan, and the activities of the Plan are included in the reporting entity. However, Montgomery County, Greene County, Beavercreek, Centerville, Kettering, Sugarcreek and West Carrollton School Districts, Miami Conservancy District, Miami Valley Regional Transit Authority, Ohio Police and Fire Pension Fund and the Ohio Public Employees Retirement System have not met the established criteria for inclusion in the reporting entity and are excluded from this report. In addition, the City is one of twenty local cities involved in a public entity risk pool, Miami Valley Risk Management Association, Inc. This separate entity does not meet the established criteria for inclusion in the reporting entity and, accordingly is not included in the City’s financial report. HISTORY AND BACKGROUND Kettering was established as a village in 1952. Three years later, it achieved City status, adopted a Home Rule Charter and approved the Council/Manager form of government. The City of Kettering was named for its most outstanding citizen, Charles F. Kettering, a well-known philanthropist and inventor.
Kettering invented the automotive self-starter, and the “Bug,” the world’s first robot plane. The City operates under a Council/Manager form of government with a Mayor and six City Council members elected on a non-partisan basis for a term of four years. Kettering is known as a leader in many areas of municipal government, including financial reporting, traffic system management, police services, parks, recreation and cultural arts programs, intergovernmental cooperation and successfully structured volunteer programs. Kettering citizens are known for their community spirit and involvement. In fact, Kettering is commonly known as the “City of Volunteers.” The quality of living in any city can be measured best by the satisfaction of the residents with the services they receive. In Kettering, people like what they find. A recent survey showed that 98% of residents are satisfied with Kettering as a place to live. In 2008, Business Week magazine named Kettering the second best city in Ohio to raise a family. ECONOMIC CONDITION AND OUTLOOK After experiencing a decline in income tax revenues resulting from the recession during 2009, a slight rebound during 2010 was welcome news. Our local economy has been hit hard by declining employment, which has a direct impact on our largest General Fund revenue, income tax. Fortunately the vote of our residents to increase the income tax rate effective January 1, 2007 increased our General Fund significantly during 2007 and 2008. That vote along with a return to somewhat greater stability during 2010 puts the City in a better position to weather the uncertainties of the current economy. Although the City has been negatively impacted by a decline in employment in the area, the overall effect was diminished due to the diversity of the employment base. Kettering’s business base ranges from some major employers headquartered in Kettering to many midsize companies specializing in technology or professional services down to smaller family owned businesses. Kettering’s largest employers include Kettering Medical Center (KMC), G.E. Money, and Reynolds & Reynolds. KMC
iv
employs 3,300 and completed construction in 2010 of the Schuster Heart Hospital, a $77 million, 114,000 sq ft addition to the front of the facility. The new Heart Hospital is a six story, state of the art facility focused on patient care with ninety private rooms. Reynolds & Reynolds, a fortune 1000 company based in Dayton since 1866, has transitioned nicely following the merger with Universal Computer Systems (UCS) in 2006. After completion of its $19 million, 15,000 sq ft Data Center at the Miami Valley Research Park campus in 2009, the company continues to employ 1,300. G.E. Money’s interior renovations at the Kettering Business Park (KBP) location are complete, and the company employs 1,400 at this site. Other major employers in the city include Kettering City Schools, Limited Brands Inc., a catalogue order center for Victoria’s Secret, Eastman Kodak a manufacturer of digital printers, and a number of engineering firms and computer hardware and software related businesses. In the area of new employment, the construction by Community Tissue Services of a 90,000 sq ft office and tissue processing facility at the Miami Valley Research Park is expected to be complete in May 2011. The project will result in a $40 million investment and starting employment of about 175 employees. Also, an international law firm, WilmerHale, performed a 2010 search among 31 eastern U.S. cities to find a location for their professional services division. The company has more than 2,000 employees in the United States, Europe, and Asia. WilmerHale selected a site at Kettering’s Miami Valley Research Park. 200 new jobs will be created at the Kettering site with more than 90% to be filled from the local workforce. Kettering is about 95% developed so a primary focus of economic development in the city is on the redevelopment of underutilized sites. The residential portion of the redevelopment of Kettering Pointe, formerly Van Buren Shopping Center, continued during 2010. The housing portion includes 35 lots of which 17 have been built or are under construction. The retail portion of the site is complete and fully leased with 10 retail sites, a post office and WesBanco Bank. Phase 3 of Madison’s Grant, a Ryan Homes housing development continued during 2010. Twenty-two single family homes were constructed during 2010. Madison’s Grant will include 154 new homes when the development is complete. A major undertaking that began in 2009 and continued in 2010 was the implementation of the plans for improvements to the city’s parks and
recreation facilities. This program is the result of passage of the Parks and Recreation Bond Levy by Kettering voters in November 2008. The voters approved a $12.3 million levy with debt service to be paid from property tax revenues over a period of twenty years beginning in 2009. In addition to the voted portion, the city committed an additional $5 million of general funds for a total investment of $17.3 million. The planned improvements include major renovations to the Kettering Recreation Center’s indoor facilities and outdoor water park and improvements including new playground equipment in all of the city’s neighborhood parks. The long-term improvements are scheduled to be complete by the end of 2011. Kettering participates in ED/GE, a revenue sharing program that includes about thirty communities in Montgomery County. Money from the program is distributed to the communities for economic development projects after an application for funds is filed and a board of local officials for the communities reviews and approves the projects. In 2010 Kettering received $600,000 in funding for two upcoming projects. The City has benefited significantly in the past from this program and will continue to apply for future funds as eligible opportunities become available. The ED/GE program was to expire after 2010, but a new agreement has extended the program for an additional nine years. The City’s emphasis on economic development combined with the existing variety of businesses located within Kettering are significant factors affecting the future economic strength of this community. Promoting Kettering as a good place to do business for new businesses, as well as existing businesses, will continue to be one of our highest priorities. For a more in-depth analysis of the City's current economic condition, please see the Management Discussion and Analysis (MD&A) portion of the report starting on page 5 of the Financial Section. ACCOUNTING SYSTEM AND BUDGETARY CONTROL Management of the City is responsible for establishing and maintaining an internal control structure designed to ensure that the assets of the City are protected from loss, theft or misuse and to ensure that adequate accounting data are compiled to allow for the preparation of financial statements in
v
conformity with generally accepted accounting principles. The internal control structure is designed to provide reasonable, but not absolute, assurance that these objectives are met. The concept of reasonable assurance recognizes that the cost of controls should not exceed the benefits likely to be derived, and the evaluation of costs and benefits requires estimates and judgments by management. Budgetary Controls. The City maintains budgetary controls to ensure compliance with legal provisions embodied in the annual appropriated budget approved by City Council. Activities of the General Fund, Special Revenue Funds, the Debt Service Fund and the Capital Projects Fund are included in the annual appropriated budget. For more detailed budget information, please see the Notes to the Required Supplementary Information on page 41 of this report. OTHER INFORMATION Independent Audit. The basic financial statements of the City of Kettering were audited by Clark, Schaefer, Hackett & Co., Certified Public Accountants. See page 2 of the Financial Section of this report for their unqualified opinion. Awards. The Government Finance Officers Association of the United States and Canada (GFOA) awarded a Certificate of Achievement for Excellence in Financial Reporting to the City of Kettering, Ohio for its comprehensive annual financial report for the fiscal year ended December 31, 2008. The Certificate of Achievement is a prestigious national award recognizing conformance with the highest standards for preparation of state and local government financial reports. In order to be awarded a Certificate of Achievement, a government unit must publish an easily readable and efficiently organized comprehensive annual financial report, whose contents conform to program standards. Such reports must satisfy both generally accepted accounting principles and applicable legal requirements. A Certificate of Achievement is valid for a period of one year only. The City of Kettering has received a Certificate of Achievement for the last 27 consecutive years (fiscal years ended 1982-2008). We believe our current report continues to conform to the Certificate of Achievement Program requirements, and we are submitting it to GFOA. In addition, the City also received the GFOA’s Award for Distinguished Budget Presentation for its annual appropriated budget for the fiscal year beginning January 1, 2009. In order to receive this award, the City must publish a budget document that meets
program criteria as a policy document, as an operations guide, as a financial plan and as a communications device. Acknowledgements. A note of sincere appreciation is extended to the many conscientious people who have contributed so much of their time and effort to the preparation of this report. The Finance Department staff, in particular, are to be commended for their commitment to professional excellence as exemplified by the contents of this report. Finally, contributions to the financial condition of the City of Kettering by the Mayor, members of City Council, Assistant City Manager and Department Directors cannot be overemphasized. Their guidance and support represent invaluable factors necessary for the City to continue to manage the financial affairs and reporting requirements of municipal government within the Kettering Community. Respectfully submitted,
Mark Schwieterman City Manager
Nancy H. Gregory, CPA Director of Finance
vi
CITY OF KETTERING, OHIO
CITY OFFICIALS
Donald E. Patterson, Mayor
Keith Thompson
CITY MANAGER
Mark Schwieterman
INDEPENDENT AUDITORS
Clark, Schaefer, Hackett & Co.Certified Public Accountants
Tony Klepacz, Vice Mayor
Amy Schrimpf
Ashley Webb
Bruce E. Duke
Joseph D. Wanamaker
vii
CITY OF KETTERING, OHIO
DEPARTMENT OF FINANCE
STAFF
Nancy H. Gregory, CPA Finance DirectorScott J. Schwarberg, CPA Assistant Finance DirectorKelly M. O'Connell, CPA Budget ManagerMarcy K. Bare, CPA Tax ManagerEstelle O. Gibson, CPA Purchasing ManagerJoy J. Kuhn SecretaryKimberly L. Stevens, CPA Financial AnalystMartin J. Van Oss, CPA Financial AnalystRhonda L. South Finance Technician IIMary Anne Marshall Finance Technician IISharin L. Day Finance Technician IILynn A. Blumenschein Finance Technician IIKimberly M. Koogler Finance Technician IILou Ann Gubser Finance Technician I Patricia A. Siefert Finance Technician I Julie M. Byerly Finance Technician I Joyce A. Foley Finance Technician I Candace M. Grooms Finance Clerk - Part-TimeMelissa K. Schultz Finance Clerk - Part-Time
viii
ix
FINANCIAL SECTION
2525 north limestone street, ste. 103 springfield, oh 45503
www.cshco.comp. 937.399.2000 f. 937.399.5433
cincinnati | columbus | dayton | middletown | springfield
INDEPENDENT AUDITORS' REPORT
Honorable Mayor, City Council and City Manager City of Kettering, Ohio
We have audited the accompanying financial statements of the governmental activities, each major fund, and the aggregate remaining fund information of the City of Kettering, Ohio (the City), as of and for the year ended December 31, 2010, which collectively comprise the City’s basic financial statements as listed in the table of contents. These financial statements are the responsibility of the City’s management. Our responsibility is to express opinions on these financial statements based on our audit.
We conducted our audit in accordance with auditing standards generally accepted in the United States of America and the standards applicable to financial audits contained in Government Auditing Standards,issued by the Comptroller General of the United States. Those standards require that we plan and perform the audit to obtain reasonable assurance about whether the financial statements are free of material misstatement. An audit includes examining, on a test basis, evidence supporting the amounts and disclosures in the financial statements. An audit also includes assessing the accounting principles used and the significant estimates made by management, as well as evaluating the overall financial statement presentation. We believe that our audit provides a reasonable basis for our opinions.
In our opinion, the financial statements referred to above present fairly, in all material respects, the respective financial position of the governmental activities, each major fund, and the aggregate remaining fund information of the City of Kettering, Ohio, as of December 31, 2010, and the respective changes in financial position and cash flows, where applicable, thereof for the year then ended in conformity with accounting principles generally accepted in the United States of America.
In accordance with Government Auditing Standards, we have also issued our report dated March 31, 2011, on our consideration of the City’s internal control over financial reporting and on our tests of its compliance with certain provisions of laws, regulations, contracts, and grant agreements and other matters. The purpose of that report is to describe the scope of our testing of internal control over financial reporting and compliance and the results of that testing, and not to provide an opinion on internal control over financial reporting or on compliance. That report is an integral part of an audit performed in accordance with Government Auditing Standards and should be considered in assessing the results of our audit.
The Management’s Discussion and Analysis and budgetary comparison information on pages 5 through 9 and 34 through 41 are not a required part of the basic financial statements but are supplementary information required by accounting principles generally accepted in the United States of America. We have applied certain limited procedures, which consisted principally of inquires of management regarding the methods of measurement and presentation of the required supplementary information. However, we did not audit the information and express no opinion on it.
Our audit was conducted for the purpose of forming opinions on the financial statements that collectively comprise the City’s basic financial statements. The introductory section, combining and individual nonmajor fund financial statements, the schedule of bonds and notes, and statistical tables are presented for purposes of additional analysis and are not a required part of the basic financial statements. The combining and individual nonmajor fund financial statements and the schedule of bonds and notes have been subjected to the auditing procedures applied in the audit of the financial statements and, in our opinion, are fairly stated in all material respects in relation to the basic financial statements taken as a whole. The introductory section and statistical tables have not been subjected to the auditing procedures applied in the audit of the basic financial statements and, accordingly, we express no opinion on them.
Springfield, Ohio March 31, 2011
CITY OF KETTERING, OHIO 5
MANAGEMENT’S DISCUSSION AND ANALYSIS (unaudited) Our discussion and analysis of the City of Kettering’s financial performance provides an overview of the City’s financial activities for the fiscal year ended December 31, 2010. FINANCIAL HIGHLIGHTS 1. The City’s net assets increased by $10,524,000 or 6% while unrestricted net assets increased $2,195,000 or 5%. 2. Total revenues increased 4.9% while total expenses increased 2.5%. 3. Income tax revenues increased $2,506,100 or 7.2%. 4. Capital grants and contributions increased $2,375,000 or 61.6%. 5. The General Fund reported a decrease in fund balance for the second year in a row. This years decreases was
$861,900. 6. The Fraze Pavilion required no General Fund transfer for the fifth time in its 20-year history. 7. Total costs of services increased by 2.3%, while net costs of services decreased by 3.6%. USING THIS ANNUAL REPORT This annual report consists of a series of financial statements. The Statement of Net Assets and the Statement of Activities (on pages 10 and 11) provide information about the activities of the City as a whole and present a longer-term view of the City’s finances. Fund financial statements start on page 12. For governmental activities, these statements tell how these services were financed in the short term as well as what remains for future spending. Fund financial statements also report the City’s operations in more detail than the government-wide statements by providing information about the City’s most significant funds. The remaining statements provide financial information about activities for which the City acts solely as a trustee or agent for the benefit of those outside of the government. Reporting the City as a Whole The Statement of Net Assets and the Statement of Activities Our analysis of the City as a whole begins on page 6. One of the most important questions asked about the City’s finances is, “Is the City as a whole better off or worse off as a result of the year’s activities?” The Statement of Net Assets and the Statement of Activities report information about the City as a whole and about its activities in a way that help answer this question. These statements include all assets and liabilities using the accrual basis of accounting, which is similar to the accounting used by most private-sector companies. All of the current year’s revenues and expenses are taken into account regardless of when cash is received or paid. These two statements report the City’s net assets and changes in them. You can think of the City’s net assets — the difference between assets and liabilities — as one way to measure the City’s financial health, or financial position. Over time, increases or decreases in the City’s net assets are one indicator of whether its financial health is improving or deteriorating. You will need to consider other nonfinancial factors, however, such as changes in the City’s property tax base, the condition of the City’s roads, the condition of the City’s neighborhoods, and the reputation of the public schools to assess the overall health of the City. Reporting the City’s Most Significant Funds Fund Financial Statements Our analysis of the City’s major funds begins on page 8. The fund financial statements begin on page 12 and provide detailed information about the most significant funds — not the City as a whole. Some funds are required to be established by State law and by bond covenants. However, the Finance Director establishes many other funds to help
6
control and manage money for particular purposes or to show that the City is meeting legal responsibilities for using certain taxes, grants, and other money (like grants received from the U.S. Department of Housing and Urban Development). The City’s two kinds of funds — governmental and proprietary — use different accounting approaches. Governmental funds — Most of the City’s basic services are reported in governmental funds, which focus on
how money flows into and out of those funds and the balances left at year-end that are available for spending. These funds are reported using an accounting method called modified accrual accounting, which measures cash and all other financial assets that can readily be converted to cash. The governmental fund statements provide a detailed short-term view of the City’s general government operations and the basic services it provides. Governmental fund information helps you determine whether there are more or fewer financial resources that can be spent in the near future to finance the City’s programs. The relationship (or differences) between governmental activities (reported in the Statement of Net Assets and the Statement of Activities) and governmental funds is described in a reconciliation at the bottom of the fund financial statements.
Proprietary funds — The City uses internal service funds (a component of proprietary funds) to report activities that provide supplies and services for the City’s other programs and activities. An example of an internal service fund would be the City’s Administrative Operations Fund, which accounts for activities of the Vehicle Maintenance Center, the Print Shop, and others. Proprietary funds are reported in the same way that all activities are reported in the Statement of Net Assets and the Statement of Activities.
The City as Trustee Reporting the City’s Fiduciary Responsibilities The City is the trustee, or fiduciary, for its volunteer firefighters pension plan. It is also responsible for other assets that — because of a trust arrangement — can be used only for the trust beneficiaries. All of the City’s fiduciary activities are reported in separate Statements of Fiduciary Net Assets and Changes in Fiduciary Net Assets on page 19. We exclude these activities from the City’s other financial statements because the City cannot use these assets to finance its operations. The City is responsible for ensuring that the assets reported in these funds are used for their intended purposes. THE CITY AS A WHOLE For 2010 the City produced a 6% increase in total net assets. This compares with a 5.2% increase in 2009. Revenues generated were $75.1 million and expenses from all programs were $64.6 million resulting in a surplus for the year of $10,524,300. The unrestricted net assets — the part of net assets that can be used to finance day-to-day operations without constraints established by debt covenants, enabling legislation, or other legal requirements — increased $2,194,800. Explanations for the larger fluctuations between years are as follows: Grant revenue was much higher this year because of outside funding for several roadway projects and increased
federal dollars for neighborhood stabilization. Income taxes increased because of corporate estimated tax payments. Investment earnings decreased due to lower interest rates. Interest on long-term debt increased due to the first full year of the recreation bonds issued midyear 2009.
7
The following two tables present condensed information on Net Assets and Changes in Net Assets for the year.
NET ASSETS2010 2009
Current and other assets $92,289,048 $91,211,913Capital assets 135,170,882 123,554,004 Total assets 227,459,930 214,765,917Long-term debt outstanding (21,795,871) (22,607,556)Other liabilities (19,328,500) (16,347,059) Total liabilities (41,124,371) (38,954,615)Net assets: Invested in capital assets, net of debt 124,238,000 105,196,955 Restricted 13,590,268 24,301,857 Unrestricted 48,507,291 46,312,490Total net assets $186,335,559 $175,811,302
CHANGES IN NET ASSETS2010 2009
Revenues Program revenues: Charges for services $10,067,985 $9,938,544 Operating grants and contributions 1,594,869 1,484,287 Capital grants and contributions 6,231,007 3,856,056General revenues: Income taxes 37,352,248 34,846,179 Property taxes 9,393,940 9,346,886 Other taxes 7,630,175 7,464,283 Investment earnings 1,173,152 2,963,720 Other general revenue 1,695,575 1,706,421 Total revenues 75,138,951 71,606,376Program expenses General government 12,813,463 13,175,646 Police 14,161,364 13,658,265 Fire 10,504,095 9,968,087 Public works 13,425,510 12,901,084 Leisure services 13,038,928 12,836,109 Interest on long-term debt 671,334 504,262 Total expenses 64,614,694 63,043,453Increase (decrease) in net assets 10,524,257 8,562,923Net assets beginning 175,811,302 167,248,379Net assets ending $186,335,559 $175,811,302
8
The following table presents the cost of each of the City’s four largest programs – police, fire, public works and leisure services – as well as each program’s net cost (total cost less revenues generated by the activities). The net cost shows the financial burden that was placed on the City’s taxpayers by each of these functions.
Total costs of services for 2010 increased by $1,404,200 while net costs of services decreased by $1,700,300. The largest decreases in net costs of services were in All others and Public works function. These functions received significant grant revenues in 2010 for roadway projects and federal neighborhood stabilization programs. The capital asset activity for the year was very much out of the ordinary. Asset additions totaled $19.2 million as compared to $10.1 million in 2009 which was also a high year. 2010’s larger additions included over $7 million in street improvements, $3.9 million in parks improvements, $3.6 million in Government Center remodeling, and $2.6 million in recreation center improvements. Total net capital assets for 2010 were $135,170,882. Of this total, $10,897,040 was not being depreciated and the capital assets being depreciated totaled $234,494,218 with accumulated depreciation of $110,220,376. In November 2008 the voters approved a $12.3 million bond levy to construct and improve parks & recreation facilities. The City has also committed $5 million of non-debt city funds for a total of $17.3 million worth of improvements. The City issued the new bonds in 2009. A 1988 voted bond levy for the same purpose expired on December 31, 2008. At December 31, 2010, the City had various debt issues outstanding, which included $14,963,217 of general obligation bonds, $271,783 of special assessment debt with City commitment and $2,100,914 of promissory notes. As of December 31, 2010, the City’s net general obligation bonded debt of $14,165,532 was well below the legal limit of $131,262,545 and debt per capita equaled $252.22. For more detail on capital asset and long-term debt activity, refer to note 6 and note 12 respectively in the Notes to the Basic Financial Statements. THE CITY’S FUNDS As the City completed the year, its governmental funds (as presented in the balance sheet on pages 12 and 13) reported a combined fund balance of $67.5 million, which is 3.4% lower than last year’s total of $69.9 million. The City's General Fund experienced a $55,700, or .1% overall increase in revenues for 2010. At the same time expenditures increased by $1,117,700 or 3.2%, and transfers out decreased by $224,000 or 1.5%. The City’s General Fund balance decreased in 2009 breaking a four-year trend of rising fund balances. 2010 continued that trend due to the poor economy. Both income taxes and sales tax revenues increased in 2010, but by small amounts. Investment earnings decreased for the year due to lower rates of return. Total revenues were $50.8 million while total expenditures were $36.5 million. Transfers to other funds totaled $15.2 million resulting in the $861,900, or 2.1% decrease to the General Fund balance. The Fraze Pavilion, an outdoor amphitheater accounted for in a major special revenue fund, has produced a surplus only two times since it began operations in 1991. In 2010 it produced its third and largest surplus ever of $250,900.
9
Increased ticket and concession revenue as well as expenditure control are responsible for the large surplus. The Parks, Recreation & Cultural Arts Fund saw revenues decrease by over 5%. Construction at the recreation center caused parts of the facility to be closed resulting in lost revenues. The Community Development Fund saw a significant increase in both revenues and expenditures during 2010. This was due to additional federal grants for neighborhood stabilization. The Capital Projects Fund also saw a significant increase in both revenues and expenditures. Construction on parks and recreation projects, the government center remodel, and roadway projects all contributed to the increase. There were no other material changes to the major funds in 2010. There was one significant variation in the City’s original General Fund budget and the final General Fund budget. Budgeted “Transfers to other funds” was increased during the year by just over $2 million primarily because of additional parks and recreation capital projects that were added during the year. There was also a significant variance between actual expenditures and final budgeted expenditures for “Transfers to other funds”. Because of the Fraze Pavilion Fund’s good year, no transfer was required, and lower than expected expenditures in the Capital Projects Fund reduced significantly the transfer required. Capital Project Fund expenditures were lower due to the City planning many new capital projects, which, in hindsight, proved to be an overly optimistic number to accomplish in one year. As mentioned above, 2010 produced a decrease to the General Fund balance. This decrease can be attributed to the poor economy. The City is fortunate to have a fund balance capable of absorbing a poor economic year such as 2010. If the economic recovery does not emerge in 2011, the City will need to explore areas where it can cut back on future expenditures.
10 CITY OF KETTERING, OHIO
STATEMENT OF NET ASSETSDECEMBER 31, 2010
ASSETSPooled cash and investments (note 2) $68,668,024Receivables: Income taxes (net of allowance for $153,774) 6,671,800 Property taxes 9,744,504 Interest 718,860 Accounts 267,662 Special assessments 1,121,783 Loans (net of allowance for $85,652) 1,367,671Due from other governments 2,889,146Prepaid expenses 377,127Inventory 462,471Capital assets not being depreciated (note 6) 10,897,040Capital assets being depreciated, net (note 6) 124,273,842 Total assets 227,459,930LIABILITIESAccounts payable 4,722,193Salary and benefits payable 2,521,943Accrued interest payable 58,900Deferred revenue 12,025,464Long-term liabilities (note 12) Due within one year 3,604,175 Due in more than one year 18,191,696 Total liabilities 41,124,371NET ASSETSInvested in capital assets, net of related debt 124,238,000Restricted for: Debt service 797,685 Social services 1,913,673 Public safety 9,189,154 Road construction/Public Works 204,394 Leisure services 86,165 Municipal court activities 1,399,197Unrestricted 48,507,291 Total net assets $186,335,559
See accompanying notes to the basic financial statements.
CITY OF KETTERING, OHIO 11
STATEMENT OF ACTIVITIESFOR THE YEAR ENDED DECEMBER 31, 2010
Total Program Revenues Net (Expense)
Operating Capital Revenue andCharges for Grants and Grants and Changes in
Functions/Programs Expenses Services Contributions Contributions Net Assets General government $12,813,463 $2,475,623 $1,188,029 $1,203,998 ($7,945,813) Police 14,161,364 35,201 5,842 (14,120,321) Fire 10,504,095 1,407,084 303 (9,096,708) Public works 13,425,510 7,560 9,082 4,944,692 (8,464,176) Leisure services 13,038,928 6,142,517 391,613 82,317 (6,422,481) Interest on long-term debt 671,334 (671,334) Total $64,614,694 $10,067,985 $1,594,869 $6,231,007 (46,720,833)
General revenues: Taxes: Income taxes 37,352,248 Property taxes, levied for general purposes 8,117,860 Property taxes, levied for debt service 1,276,080 Other taxes (note 5) 7,630,175 Investment earnings 1,173,152 Refunds and reimbursements 1,516,425 Miscellaneous 179,150 Total general revenues 57,245,090 Change in net assets 10,524,257Net assets--beginning 175,811,302Net assets--ending $186,335,559
See accompanying notes to the basic financial statements.
12 CITY OF KETTERING, OHIO
FUND BALANCE SHEETS - GOVERNMENTAL FUNDSDECEMBER 31, 2010
Major SpecialParks,
General Street Recreation & FrazeFund Maintenance Cultural Arts Pavilion
ASSETSPooled cash and investments $38,179,676 $387,727 $578,079 $383,989Receivables: Income taxes (net of allowance for $153,774) 6,671,800 Property taxes 7,996,504 Interest 654,559 Accounts 19,228 100 37,175 Special assessments 400,000 Loans (net of allowance for $85,652)Due from Community Development fund 36,500Due from Health Insurance internal service fund 304,400Due from other governments 487,568 1,076,873 1,000Prepaid expenditures 24,580 60 1,437 3,807Inventory 140,018 Total assets $54,774,815 $1,604,778 $617,691 $387,796
LIABILITIESAccounts payable $596,606 $35,668 $306,473 $18,453Due to General fundAccrued payroll 1,618,038 153,257 203,455 8,846Deferred revenue 12,964,808 875,300 22,410 2,405 Total liabilities 15,179,452 1,064,225 532,338 29,704FUND BALANCESNonspendable: Inventory and prepaids 24,580 140,078 1,437 3,807Restricted for: Debt service Social services Public safety Road construction / Public works Leisure services Municipal court activitiesCommitted to: Social services 54,747 Public safety 398,642 Road construction / Public works 10,580 400,475 Leisure services 5,428 83,916 354,285 Government center remodel Other purposes 173,267Assigned to: Leisure services 104,717Unassigned: 38,823,402 Total fund balances 39,595,363 540,553 85,353 358,092 Total liabilities and fund balances $54,774,815 $1,604,778 $617,691 $387,796
See accompanying notes to the basic financial statements.
13
Revenue FundsOther Special Revenue Total
Community Emergency Debt Capital Governmental GovernmentalDevelopment Medical Service Projects Funds Funds
Amounts reported for governmental activities in the Statement of Net Assets (page 10) are different because: Capital assets used in governmental activities are not financial resources and therefore are not reported in the funds. 134,710,096 Other long-term assets are not available to pay for current-period expenditures and therefore are deferred in the funds:
Income taxes receivable 2,700,987Grants and other taxes receivable 2,193,898
Internal service funds are used by management to charge the costs of certain activities. The assets and liabilities of the internal service funds are included in governmental activities in the Statement of Net Assets. 758,482 Debt issuance costs and issuance discounts/premiums are amortized over the life of the debt, the unamortized portion remains on the Statement of Net Assets. 13,692 The following long-term liabilities are not due and payable in the current period and therefore are not reported in the funds:
Bonds and notes payable (17,335,914)Vacation and sick leave benefits (4,113,541)Accrued interest on bonds payable (58,900) Net Assets of Governmental Activities $186,335,559
14 CITY OF KETTERING, OHIO
STATEMENT OF REVENUES, EXPENDITURES, AND CHANGES IN FUND BALANCES -GOVERNMENTAL FUNDS - FOR THE YEAR ENDED DECEMBER 31, 2010
Major SpecialParks,
General Street Recreation & FrazeFund Maintenance Cultural Arts Pavilion
REVENUESIncome taxes $36,417,018Property taxes 7,579,402Licenses and permits 483,762 $7,560Intergovernmental revenue 1,637,842 2,493,387 $13,548Charges for services 147,385 3,048,057 $3,094,460Fines and forfeits 1,379,744Investment earnings 865,304Special assessments 410,113Refunds and reimbursements 1,898,781 310,646 65,105 1,000Miscellaneous 22,487 12,625 31,020 356,713 Total revenues 50,841,838 2,824,218 3,157,730 3,452,173EXPENDITURESCurrent: General government 11,139,361 Police 12,419,691 Fire 10,202,668 Public works 2,787,380 5,460,240 Leisure services 8,943,860 3,201,243Capital improvementsDebt service: Principal
I t t Interest Total expenditures 36,549,100 5,460,240 8,943,860 3,201,243 Excess (deficiency) of revenues over expenditures 14,292,738 (2,636,022) (5,786,130) 250,930OTHER FINANCING SOURCES (USES) Transfers in 2,811,600 5,772,400 Transfers out (15,221,132) Sale of city assets 66,511 20,211 4,303 Net change in fund balance (861,883) 195,789 (9,427) 250,930Fund balances--beginning 40,457,246 344,764 94,780 107,162Fund balances--ending $39,595,363 $540,553 $85,353 $358,092
See accompanying notes to the basic financial statements.
15
Revenue FundsOther Special Revenue Total
Community Emergency Debt Capital Governmental GovernmentalDevelopment Medical Service Projects Funds Funds
Net change in Fund Balance - Governmental Funds ($2,399,469)Amounts reported for governmental activities in the Statement of Activities (page 11) are different because: Governmental funds report capital outlays as expenditures while governmental activities Capital outlays 19,208,939 report depreciation expense to allocate those expenditures over the life of the assets. Depreciation expense (7,237,956) In the Statement of Activities, only the gain on the sale of city assets is reported, while in the governmental funds, the proceeds from the sale increase financial resources. The change in net assets differ from the change in fund balance by the book value of the asset sold. (240,418) Revenues in the Statement of Activities that do not provide current financial resources are not reported as revenues in the funds.
Income taxes receivable 935,230Grants receivable (612,147)Property taxes receivable 2,300
Repayment of bond principal is an expenditure in the governmental funds, but the repayment reduces long-term liabilities in the Statement of Net Assets. 1,021,134 Some expenses reported in the Statement of Activities do not require the use of current financial resources and therefore are not reported as expenditures in governmental funds. Vacation and sick leave benefits (196,597)
Interest payable 1,187 Internal service funds are used by management to charge the costs of certain activities, to individual funds. The net revenue (expense) of the internal service funds is reported with governmental activities. (See page 17.) 42,054 Change in Net Assets on the Statement of Activities $10,524,257
16 CITY OF KETTERING, OHIO
BALANCE SHEETPROPRIETARY FUNDSDECEMBER 31, 2010
GovernmentalActivities-Internal
Service FundsASSETSCurrent assets: Pooled cash and investments $612,204 Accounts receivable 88 Prepaid expenses 333,552 Inventory 322,453 Total current assets 1,268,297Noncurrent assets: Buildings and improvements 757,936 Machinery and equipment 1,981,674 Less: Accumulated depreciation (2,278,824) Total noncurrent assets 460,786 Total assets $1,729,083
LIABILITIESCurrent liabilities: Accounts payable $182,821 Due to General fund 304,400 Accrued payroll 136,964 Total current liabilities 624,185Noncurrent liabilities: Accrued vacation and sick leave benefits 346,416 Total liabilities 970,601NET ASSETSInvested in capital assets 460,785Unrestricted 297,697 Total net assets 758,482 Total liabilities and net assets $1,729,083
See accompanying notes to the basic financial statements.
CITY OF KETTERING, OHIO 17
STATEMENT OF REVENUES, EXPENSES, AND CHANGES IN NET ASSETSPROPRIETARY FUNDSFOR THE YEAR ENDED DECEMBER 31, 2010
GovernmentalActivities-Internal
Service FundsOPERATING REVENUESCharges for services $10,447,078 Total operating revenues 10,447,078OPERATING EXPENSESPersonal services 3,174,552Repairs and maintenance 1,435,510Contractual services 5,109,641Other materials and expenses 567,475Depreciation 130,267 Total operating expenses 10,417,445 Operating income (loss) 29,633NONOPERATING REVENUES (EXPENSES)Investment earnings 12,421 Change in net assets 42,054 Total net assets--beginning 716,428 Total net assets--ending $758,482
See accompanying notes to the basic financial statements.
18 CITY OF KETTERING, OHIO
STATEMENT OF CASH FLOWSPROPRIETARY FUNDSFOR THE YEAR ENDED DECEMBER 31, 2010Increase (Decrease) in cash
GovernmentalActivities-Internal
Service FundsCASH FLOWS FROM OPERATING ACTIVITIESCash received for services $10,466,240Cash paid to suppliers for goods or services (7,104,964)Cash paid to employees for services (3,166,667) Net cash provided (used) by operating activities 194,609CASH FLOWS FROM CAPITAL AND RELATED FINANCING ACTIVITIESAcquisition of capital assets (17,185)Loan from General fund 70,100Sale of capital assets 232 Net cash used by capital and related financing activities 53,147CASH FLOWS FROM INVESTING ACTIVITIESInvestment earnings 12,421 Net cash provided by investing activities 12,421 Net increase (decrease) in cash 260,177Cash at beginning of year 352,027Cash at end of year $612,204
RECONCILIATION OF OPERATING INCOME (LOSS) TO NET CASH PROVIDED (USED) BY OPERATING ACTIVITIESOperating income (loss) $29,633Adjustments to reconcile operating income (loss) to net cash provided (used) by operating activities: Depreciation 130,267 (Increase) decrease in receivables 19,394 (Increase) decrease in inventories 10,264 Increase (decrease) in accounts payable 66,684 Net (increase) decrease in other operating net assets (61,633) Net cash provided (used) by operating activities $194,609
See accompanying notes to the basic financial statements.
CITY OF KETTERING, OHIO 19
FIDUCIARY FUNDS
STATEMENT OF FIDUCIARY NET ASSETS DECEMBER 31, 2010
ASSETSPooled cash and investments $87,507 $265,114Investments with fiscal agent, at fair value: Unallocated insurance contracts $2,006,718 Other investments 278,977 Total assets 2,006,718 87,507 $544,091LIABILITIESAccounts payable $2,347Withholdings payable 257,861Undistributed moneys 278,977Unclaimed moneys 4,906 Total liabilities $544,091NET ASSETSHeld in trust for pension benefits and other purposes $2,006,718 $87,507
STATEMENT OF CHANGES IN FIDUCIARY NET ASSETS FOR THE YEAR ENDED DECEMBER 31, 2010
ADDITIONSEmployer contributions $59,726Investment earnings (loss) 191,652 $1,573 Total additions 251,378 1,573DEDUCTIONSPension payments 114,890 Total deductions 114,890Net increase (decrease) 136,488 1,573Net assets--beginning of year 1,870,230 85,934Net assets--end of year $2,006,718 $87,507
See accompanying notes to the basic financial statements.
CITY OF KETTERING, OHIO 21
NOTES TO THE BASIC FINANCIAL STATEMENTS FOR THE YEAR ENDED DECEMBER 31, 2010 1. SUMMARY OF SIGNIFICANT ACCOUNTING POLICIES
A. Reporting Entity The City of Kettering, Ohio, (the “City”) is a home rule municipal corporation under the laws of the State of Ohio and operates under its own Charter. The current Charter, which provides for a Council/Manager form of government, was adopted in 1955 and has subsequently been amended. The City provides various services including police and fire protection, parks, recreation, street maintenance, planning, zoning and other general government services. The City does not maintain any utility or other operations that would require the establishment of enterprise funds. The financial reporting entity consists of (a) the primary government, (b) organizations for which the primary government is financially accountable, and (c) governmental organizations for which the primary government is not financially accountable, but for which the nature and significance of their financial relationship with the primary government are such that exclusion would cause the reporting entity’s financial statements to be misleading or incomplete. Component units are legally separate organizations for which the elected officials of the primary government are financially accountable. In addition, component units can be governmental organizations for which the primary government is not financially accountable, but for which the nature and significance of their financial relationship with the primary government are such that exclusion would cause the reporting entity’s financial statements to be misleading or incomplete. No separate government units meet the criteria for inclusion as a component unit. B. Basis of Presentation Government-Wide Statements: The statement of net assets and the statement of activities display information about the primary government, except for its fiduciary activities. Eliminations have been made to minimize the double counting of internal activities. Governmental activities generally are financed through taxes, intergovernmental revenues and other nonexchange transactions. The City has no business-type activities. The statement of activities presents a comparison between direct expenses and program revenues for each function of the City’s governmental activities. Direct expenses are those that are specifically associated with a program or a function and, therefore, are clearly identifiable to a particular function. Program revenues include (a) charges paid by recipients of goods or services offered by the programs and (b) grants and contributions that are restricted to meeting the operational or capital requirements of a particular program. Revenues that are not classified as program revenues, including all taxes, are presented as general revenues. Fund Financial Statements: The fund financial statements provide information about the City’s funds, including fiduciary. Separate statements for each fund category – governmental, proprietary and fiduciary – are presented. The emphasis of fund financial statements is on major governmental funds, each displayed in a separate column. All remaining governmental funds are aggregated and reported as nonmajor funds. The City reports the following major governmental funds: General Fund – This fund is the general operating fund of the City. It should be used to account for and report all financial resources not accounted for and reported in another fund. Street Maintenance Fund – This fund accounts for the portion of gasoline tax and motor vehicle license fees restricted, committed, or assigned for maintenance of streets.
22
Parks, Recreation & Cultural Arts Fund – This fund accounts for money restricted, committed, or assigned for the Parks, Recreation & Cultural Arts department programs and activities. Fraze Pavilion Fund – This fund accounts for moneys restricted, committed, or assigned for the Fraze Pavilion amphitheater operations. Community Development Fund - This fund accounts for grants received from the Department of Housing and Urban Development (HUD). Grants are restricted for various purposes designated by HUD. Emergency Medical Fund – This fund accounts for revenues received for emergency medical services. The revenues are committed or assigned for expenditure on fire equipment or structures. Debt Service Fund – This fund is used to account for and report financial resources that are restricted, committed, or assigned to expenditure for principal and interest. Capital Projects Fund – This fund is used to account for and report financial resources that are restricted, committed, or assigned to expenditure for capital outlays, including the acquisition or construction of capital facilities and other capital assets (other than those financed by proprietary funds). Additionally, the City reports the following fund types: Internal Service Funds – The internal service funds are used to account for the financing of goods or services provided by one department or agency to other departments or agencies of the City, or to other governments on a cost-reimbursement basis. These goods and services include computer services, vehicle maintenance, office supplies, postage, printing services, building maintenance and health insurance. The City has no unbilled service receivables at year end. Pension Trust Fund – The fund reports a trust arrangement under which assets are accumulated in order to pay retirement benefits to the City’s volunteer firefighters. Private Purpose Trust Fund – This fund reports a trust arrangement under which principal and income are used for the education of dependents of deceased police officers. Agency Funds – These funds account for assets held by the City as an agent for: 1) various local governments collected by the municipal court, 2) payroll withholdings and 3) unclaimed moneys and other miscellaneous activities. C. Basis of Accounting
Basis of accounting refers to when revenues and expenditures or expenses are recognized in the accounts and reported in the financial statements. Basis of accounting relates to the timing of the measurements made, regardless of the measurement focus applied. Government-wide, proprietary and fiduciary fund financial statements measure and report all assets (both financial and capital), liabilities, revenues, expenses, gains and losses using the economic resources measurement focus and accrual basis of accounting. Revenues are recorded when earned and expenses are recorded when a liability is incurred, regardless of the timing of related cash flows. Property taxes are recognized as revenues in the year for which they are levied. Grants and similar items are recognized as revenue as soon as all eligibility requirements imposed by the provider have been met. Agency funds do not involve the measurement of results of operations.
23
All governmental funds are accounted for using a current financial resources measurement focus and are reported on a modified accrual basis of accounting. Revenues are recognized in the accounting period in which they become measurable and available. “Measurable” means the amount of the transaction can be determined and “available” means collectible within the current period or soon enough thereafter to be used to pay liabilities of the current period, which, for the City’s purposes, is considered to be 30 days after year end. Revenues considered susceptible to accrual are community development block grants, delinquent property taxes, income taxes, and interest on investments. Property taxes levied before year-end are not recognized as revenue until the next calendar year. The fiscal period for which property taxes are levied at year-end in the State of Ohio is the succeeding calendar year. Expenditures are recognized in the accounting period in which the fund liability is incurred, if measurable, except for interest on unmatured general long-term debt, and on special assessment indebtedness collateralized by special assessment levies, which are recognized when due. Inventory and prepaid expenditures are recorded in the governmental fund types and charged as expenditures when used. A portion of the fund balance is classified as nonspendable in governmental funds for the amount of inventory and prepaid expenditures. When both restricted and unrestricted resources are available for use, it is the government’s policy to use restricted resources first, then unrestricted resources as they are needed. When an expenditure is incurred for purposes for which amounts in any unrestricted fund balance classification could be used it is the government’s policy to use assigned resources first, committed resources second, and then unassigned amounts as they are needed. D. Pooled Cash and Investments and Investment with Fiscal Agent
All investments are stated at fair value, which are based on quoted market prices. E. Inventory
Inventory is valued at cost (specific identification method in the internal service funds and FIFO (first-in, first-out) method in the special revenue funds.) Inventories are recorded as expenses/expenditures when used. F. Capital Assets
Capital assets include land, improvements to land, buildings, building improvements, machinery, equipment, infrastructure and all other assets that are used in operations and that have initial useful lives expending beyond a single reporting period. Infrastructure is defined as long-lived capital assets that normally are stationary in nature and normally can be preserved for a significantly greater number of years than most capital assets. Examples of infrastructure include roads, bridges and drainage systems. All capital assets are valued at historical cost, or estimated historical cost if actual historical cost is not available. Donated capital assets are valued at their estimated fair market value at the time received. When capital assets are purchased, they are capitalized and depreciated in the government-wide statements and the proprietary fund statements. The City capitalizes all assets with a cost of $10,000 or greater ($5,000 or greater for federal funded assets) and a useful life of at least two years. The City has capitalized all infrastructure acquired after January 1, 1980. Capital assets are recorded as expenditures of the current period in the government fund financial statements. Depreciation is calculated using the straight-line method over the estimated useful lives of the assets. Estimated useful lives of the various classes of depreciable capital assets are as follows:
Machinery and Equipment 3-20 yearsBuildings and Improvements 15-30 yearsInfrastructure 20-40 years
24
G. Interfund Transactions and Transfers
During the course of normal operations, the City has numerous transactions among funds, most of which are in the form of transfers used to move unrestricted revenues collected in the general fund to finance various programs accounted for in other funds in accordance with budgetary authorizations. The accompanying financial statements generally reflect such transactions as transfers, with the exception of the internal service funds which are used to account for various supplies and services which are then charged back to the appropriate fund on an “as used” basis. The internal service funds record such charges as operating revenues; all other City funds record payments to the internal service funds as operating expenditures. H. Fund Balance Classifications
Fund balance is reported as restricted when constraints placed on the use of resources are either: a. externally imposed by creditors, grantors, contributors, or laws or regulations of other governments; or b. imposed by law through constitutional provisions or enabling legislation. Fund balance is reported as committed when the City Council enacts legislation requiring specific revenues to be used for a specific purpose. The City Council can modify or rescind that legislation at any time through additional legislation. Fund balance is reported as assigned when a revenue source is not previously restricted or committed but the Finance Director determines, in the Director’s professional opinion, that the assigning of the revenue is the desire or direction of City Council. This authority is given to the Finance Director through ordinance passed by City Council. I. Grants and Other Intergovernmental Revenues
All reimbursement-type grants are recorded as intergovernmental receivables and revenues or deferred revenue when the related expenditures are incurred. J. Use of Estimates
The preparation of the basic financial statements in conformity with generally accepted accounting principles requires management to make estimates and assumptions that affect the reported amounts of assets and liabilities at the date of the basic financial statements and the reported amounts of revenues and expenses during the reporting period. Actual results could differ from those estimates.
2. POOLED CASH AND INVESTMENTS
The City maintains a cash and investments pool that is available for use by all funds, except the pension trust fund. Each fund type’s portion of this pool is displayed on the Fund Balance Sheets as “Pooled cash and investments.” The deposits and investments of the pension trust fund are held separately from those of other City funds and displayed as “Unallocated insurance contracts.” Cash and cash equivalents in the internal service funds consist of cash and money market funds, which can be withdrawn without prior notice or penalty. Deposits: At year-end, the City’s bank balance was $15,451,429. Of this amount, $4,566,796 was insured, the remaining $10,194,054 was collateralized with securities held by the pledging financial institution’s trust department or agent, but not in the City’s name per Ohio Revised Code Section 135.181; the remaining $690,579 was uninsured, uncollateralized with a broker agent. This statute requires all financial institutions acting as public depositories to pledge a pool of collateral with a market value of at least 105% of the total amount of public deposits secured. The City has no deposit policy for custodial credit risk.
25
Investments: All investments are reported at fair value, which is based on quoted market prices. The City’s investment policy authorizes investments in obligations of the U.S. Treasury, agencies, and instrumentalities, commercial paper rated, when purchased, A-1 by Standard & Poors Corporation or P-1 by Moody’s Commercial Paper Record, corporate bonds rated, when purchased, A or better by Standard & Poors Corporation or Moody’s Bond Rating, bankers acceptances issued by banks ranked nationally as being in the top 50 in asset and deposit size, repurchase and reverse repurchase agreements, money market mutual funds whose portfolio consists of authorized investments, and the state treasurer’s investment pool. The policy states that no more than 20% of the City’s investment portfolio will be placed with any particular issuer, and unless matched to a specific cash flow requirement, the City will not invest in securities maturing more than five years from the date of purchase. It has been the City’s practice to invest in securities maturing no more than three years from the date of purchase, and to hold all investments until maturity. The City has no investment policy for custodial credit risk. The City’s investments in corporate bonds, listed below, are uninsured and unregistered investments for which the securities are held by the counterparty, or by its trust department or agent, but not in the City’s name. On December 31, the City had $7,041,772 in corporate bonds issued by Met Life, $6,985,646 in corporate bonds issued by General Electric, $5,810,558 in corporate bonds issued by AT&T, $4,178,444 in corporate bonds issued by John Deere and $3,647,003 in corporate bonds issued by Caterpillar. These amounts represent 10.1%, 10.0%, 8.3%, 6.0% and 5.2% respectively of the pooled cash and investments. At year-end, $2,238,286 of the securities in the corporate bond category below are rated “Baa1”, the remaining $52,156,890 are rated “A” or better and all other investment types listed are unrated. As of December 31, 2010 the City had the following investments and maturities.
FairInvestment Type Value Less than 1 1-3 3-9 9-10
Corporate Bonds $54,395,176 $32,017,374 $22,377,802Pension Plan Pooled Invest Fund 2,006,718 $2,006,718 Total $56,401,894 $32,017,374 $22,377,802 $2,006,718
Investment Maturities (in Years)
3. INCOME TAXES
The City levies a 2.25% income tax on substantially all income earned within the City. Additional increases in the income tax rate require voter approval. In 2006, the voters approved an income tax rate increase to 2.25% from 1.75% effective January 1st, 2007. City residents pay City income tax on income earned outside the City, however; a credit is allowed for income taxes paid to other municipalities. Employers within the City withhold income tax on employee compensation and remit at least quarterly. Corporations and other individual taxpayers pay estimated taxes quarterly and file an annual declaration.
26
4. PROPERTY TAXES
Property taxes include amounts levied against all real and public utility property located in the City. Property taxes are levied each December 31 on the assessed value listed as of the prior December 31. Assessed values are established for real property at 35% of true value. Property market values are required to be updated every three years and revalued every six years. A revaluation was completed in 2008. The property tax calendar is as folows:
Levy date December 31, 2009Lien date December 31, 2009Tax bill mailed January 20, 2010First installment payment due February 15, 2010Second installment payment due July 15, 2010
The assessed values for the City at December 31, 2009 were as follows:Assessed Value
CategoryReal Estate $1,232,193,520Public Utility Real Property 13,110Public Utility Personal Property 17,912,850Total $1,250,119,480
The County Treasurer collects property taxes on behalf of all taxing districts including the City of Kettering. The County periodically remits to the City its portion of taxes collected. Property taxes may be paid on either an annual or semiannual basis.
5. OTHER TAXES
The caption “Other taxes” on the Statement of Activities is comprised of taxes levied by the State or the County and distributed to the City. The components of the number are as follows: Estate taxes $3,038,598
Capital assets not being depreciated: Land $10,517,496 $373,466 ($158,047) $10,732,915 Right of Way 164,125 164,125 Subtotal 10,517,496 537,591 (158,047) 10,897,040Capital assets being depreciated: Buildings and improvements 42,007,863 6,281,439 (99,510) 48,189,792 Machinery and equipment 17,952,937 1,179,674 (1,114,027) 18,018,584 Infrastructure 157,209,286 11,228,790 (152,234) 168,285,842 Subtotal 217,170,086 18,689,903 (1,365,771) 234,494,218Accumulated depreciation: Buildings and improvements (27,350,241) (991,018) 99,061 (28,242,198) Machinery and equipment (13,141,532) (1,105,879) 1,030,131 (13,217,280) Infrastructure (63,641,806) (5,271,326) 152,234 (68,760,898) Subtotal (104,133,579) (7,368,223) * 1,281,426 (110,220,376) Net capital assets being depreciated 113,036,507 11,321,680 (84,345) 124,273,842 Net capital assets $123,554,003 $11,859,271 ($242,392) $135,170,882
*Depreciation expense was charged to governmental functions as follows:
General government $433,887Police 266,681Fire 348,168Public works 5,412,438Leisure services 776,782In addition, depreciation on capital assets held by the City's internal service funds is charged to the various functions based on their usage of the assets. 130,267Total depreciation expense $7,368,223
7. LOANS RECEIVABLE AND NOTES RECEIVABLE
The City used a portion of the Federal Community Development Block Grant (CDBG) to provide low interest loans for housing rehabilitation, as well as for economic and job development. The loans are payable in installments to 2035. Fund balance has been classified as nonspendable for the loans receivable at December 31, 2010. CDBG regulations require the City to reinvest loan repayments in permissible CDBG loans or expenditures.
8. RISK MANAGEMENT
The City is a member of a public entity risk pool, Miami Valley Risk Management Association, Inc. (MVRMA) with nineteen other local cities. This pool covers all property, crime, liability, boiler and machinery, and public official liability up to the limits stated below.
28
Insurance coverage is as follows: Property – $1,000,000,000 per occurrence Crime - $1,000,000 per occurrence Liability - $10,000,000 per occurrence Boiler & Machinery - $100,000,000 per occurrence Public Official Liability - $10,000,000 per occurrence The deductible per occurrence for all types is $2,500. Pool coverage is $2,500 - $5,000 for boiler and machinery, $2,501 - $25,000 for crime, $2,501 - $250,000 for property, and $2,501 - $500,000 for liability. Excess insurance coverage, provided by commercial companies, is the amount in excess of pool coverage to the limits stated above. The City pays an annual premium to MVRMA that is intended to cover administrative expenses and any claims covered by the pool. MVRMA has the ability to require the member cities to make supplemental payments in the event reserves are not adequate to cover claims. An actuarial opinion issued as of December 31, 2009, indicates reserves in excess of anticipated claims. Employee health insurance is provided through a fully insured plan and is accounted for and financed through an internal service fund. The City pays premiums to a private insurance company and retains no risk. Workers’ compensation is administered by the State of Ohio. The City pays a premium per employee to the State for this coverage. There were no significant reductions in insurance coverage from the prior year in any category of risk. Insurance coverage for each of the past three years was sufficient to cover any claims settlements.
9. PENSION PLAN OBLIGATIONS
Substantially all City employees are covered by one of two pension plans Ohio Police and Fire Pension Fund (OP&F) or Ohio Public Employees Retirement System (OPERS). OHIO POLICE AND FIRE PENSION FUND (OP&F) OP&F is a cost-sharing multiple-employer defined benefit pension plan, which provides retirement and disability benefits, annual cost of living adjustments, and death benefits to plan members and beneficiaries. Authority to establish and amend benefits is provided by state statute per Chapter 742 of the Ohio Revised Code. The Police and Fire Pension Fund issues a publicly available financial report that includes financial statements and required supplementary information for the fund. Interested parties may obtain a copy by making a written request to 140 East Town Street, Columbus, Ohio 43215-5164. The Ohio Revised Code provides statutory authority for employee and employer contributions. Plan members are required to contribute 10% of their annual covered salary and the City is required to contribute 19.5% and 24% respectively for police officers and firefighters. The City’s contributions to the plan for the years ending December 31, 2008, 2009 and 2010, were $2,448,027, $2,572,780 and $2,618,896 respectively, or 77% of the required contributions for 2008, 75% for 2009, and 55% for 2010. OHIO PUBLIC EMPLOYEES RETIREMENT SYSTEM (OPERS) OPERS administers three separate pension plans. 1) The Traditional Pension Plan (TP) – a cost-sharing multiple-employer defined benefit pension plan. 2) The Member-Directed Plan (MD) – a defined contribution plan in which the member invests both member and employer contributions (employer contributions vest over five years at 20% per year). Members accumulate retirement assets equal to the value of member and (vested) employer contributions plus any investment earnings thereon. 3) The Combined Plan (CO) - a cost-sharing multiple-employer defined benefit pension plan. Employer contributions are invested by the retirement system to provide a formula retirement benefit similar in nature to the Traditional Plan benefit. Member
29
contributions, the investment of which is self-directed by the members, accumulate retirement assets in a manner similar to the MD. OPERS provides retirement, disability, survivor and death benefits and annual cost of living adjustments to members of the TP and CO. Members of the MD do not qualify for ancillary benefits. Authority to establish and amend benefits is provided by state statute per Chapter 145 of the Ohio Revised Code. The Public Employees Retirement System issues a stand-alone financial report. Interested parties may obtain a copy by writing to OPERS, 277 East Town Street, Columbus, Ohio 43215-4642, or by calling (800) 222-7377. The Ohio Revised Code provides statutory authority for employee and employer contributions. For 2009, member and employer contribution rates were consistent across all three plans (TP, MD and CO). Plan members are required to contribute 10% of their annual covered salary and the City is required to contribute 14%. The City’s contributions to the plan for the years ending December 31, 2008, 2009 and 2010, were $2,683,518, $2,752,560 and $2,758,135 respectively, equal to the required contributions for the year. VOLUNTEER FIREFIGHTERS PENSION Principal Life Insurance Company administers a single-employer, defined benefit pension plan for the Volunteer Firefighters. At January 1, 2010, the plan’s membership consisted of the following:
Retirees and beneficiaries currently receiving benefits 80
Terminated employees entitled to benefits but not yet receiving them 41
Active members 46
Total 167
On August 1st, 2010 the City implemented a soft freeze so that no new members could join the pension plan after that date. On October 1st, 2010 the City implemented a hard freeze so that no additional benefits could be earned by existing members after that date. All regular members before August 1st, 2010 of the Volunteer Fire Department are eligible for the plan upon completion of 3 years of continuous service before October 1, 2010. Members may retire at age 55 and receive a monthly benefit, payable for life. The monthly retirement benefit is equal to the sum of $8.00 multiplied by the number of years of credited service before October 1, 2010 not in excess of 10 years and $10.00 multiplied by the number of years of credited service before October 1, 2010 in excess of 10 years. Benefits vest at 15% upon 3 years of credited service before October 1, 2010 plus 5% for each additional year before October 1, 2010, up to 100%. Benefits are established by and may be amended by City Ordinance. Financial Statements of the Volunteer Firefighter Pension are prepared using the accrual basis of accounting. Employer contributions are recognized when due and the employer has made a formal commitment to provide the contributions. Benefits and refunds are recognized when due and payable in accordance with terms of the plan. The Pension plan does not issue a stand-alone financial report. Plan investments are reported at fair value. No investment, in any one organization, exceeded five percent of net assets available for benefits. The City’s funding policy is to provide for periodic employer contributions at actuarially determined rates that, expressed in dollars, are designed to accumulate sufficient assets to pay benefits when due. Costs of administering the plan are paid separately by the City and not deducted from plan assets. The City is to make all contributions required to the plan. Contribution requirements are established or may be amended by City Ordinance. Active members are not required to contribute. The annual required contribution for the current year was determined as part of the January 1, 2010, actuarial valuation using the aggregate actuarial cost method. The actuarial assumptions included a 6.00% investment rate of return and that benefits will not increase after retirement. The actuarial value of assets was determined using the contract basis. Because the aggregate actuarial cost method does not identify or separately amortize
30
unfunded actuarial liabilities, information about funded status and funding progress has been prepared using the entry age actuarial cost method for that purpose and the information presented is intended to serve as a surrogate for the funded status and funding progress of the plan. The funded status of the plan as of January 1, 2010, the most recent actuarial valuation date is as follows:
Actuarial Actuarial Actuarial Accrued Unfunded UAAL as a Valuation Value Liability (AAL) AAL Funded Covered Percentage of
Date of Assets -Entry Age (UAAL) Ratio Payroll Covered Payroll1/1/2008 $2,000,381 $2,236,175 $235,794 89.5% $427,556 55.1%1/1/2009 2,014,762 2,368,846 354,084 85.1% 375,974 94.2%1/1/2010 2,064,070 2,305,101 241,031 89.5% 459,200 52.5%
FUNDED STATUS AND FUNDING PROGRESS
Year Ended Annual Required Actual PercentDecember 31 Contribution Contribution Contributed
For the fiscal years ended December 31, 2008, 2009 and 2010, the Annual Pension cost (APC) was $69,847, $91,662 and $59,726 respectively; the percentage of APC contributed was 100% and the net pension obligation was $0. The first year the City reported the Volunteer firefighters Pension under GASB 27 was in 1996. The pension liability was $0 and was determined in accordance with GASB 27. The amount of pension liability at transition was $0. The difference between the amount of pension liability and the previously reported liability to the plan was $0.
10. OTHER POST EMPLOYMENT BENEFITS (OPEB)
In addition to the pension benefits described in Note 9, both the Ohio Public Employees Retirement System (OPERS) and the Ohio Police and Fire Pension Fund (OP&F) provide post retirement health care coverage, which meets the definition of an Other Post Employment Benefit (OPEB) as described in GASB Statement 45. For both systems, the Ohio Revised Code (ORC) permits, but does not mandate, OPEB benefits to its eligible members and beneficiaries. Authority to establish and amend benefits is provided in the ORC Chapter 145 for OPERS and Chapter 742 for OP&F. OHIO POLICE AND FIRE PENSION FUND OPEB OP&F sponsors a cost-sharing multiple-employer defined post retirement healthcare plan administered by OP&F. OP&F provides healthcare benefits including coverage for medical, prescription drugs, dental, vision, Medicare Part B Premium and long term care to retirees, qualifying benefit recipients and their eligible dependents. The ORC provides the statutory authority requiring public employers to fund post retirement health care through their contributions to OP&F. A portion of each employer’s contribution is set aside for the funding of post retirement health care benefits. Participating employers are required to contribute to the pension plan at rates expressed as percentages of the payroll of active pension plan members, currently, 19.5% and 24.0% of
31
covered payroll for police and fire employers, respectively. The ORC states that the employer contribution may not exceed 19.5% and 24.0% of covered payroll for police and fire employers respectively. Active members do not make contributions to the OPEB Plan. OP&F maintains funds for health care in two separate accounts. One for health care benefits under an IRS Code Section 115 trust and one for Medicare Part B reimbursements administrated as an Internal Revenue Code 401(h) account, both of which are within the defined benefit pension plan, under the authority granted by the ORC to the OP&F board of trustees. The board of trustees is authorized to allocate a portion of the total employer contributions made into the pension plan to the Section 155 trust and the Section 401(h) account as the employer contribution for retiree healthcare benefits. For the year ended December 31, 2010, the employer contribution allocated to the healthcare plan was 6.75% of covered payroll. The amount of employer contributions allocated to the healthcare plan each year is subject to the trustees’ primary responsibility to ensure that pension benefits are adequately funded and also is limited by the provisions of Sections 115 and 401(h). The OP&F board of trustees is authorized to establish requirements for contributions to the healthcare plan by retirees and their eligible dependents, or their surviving beneficiaries. Payment amounts vary depending on the number of covered dependents and the coverage selected. City contributions to OP&F allocated to the healthcare plan for 2010, 2009 and 2008 were $825,850, $810,604 and $773,772 respectively. OP&F issues a publicly available financial report that includes financial information and required supplementary information for the Plan. That report may be obtained by writing to OP&F, 140 East Town Street, Columbus, Ohio 43215-5164. OHIO PUBLIC EMPLOYEES RETIREMENT SYSTEM OPEB OPERS administers three separate pension plans, the Traditional Pension Plan (TP), the Member–Directed Plan (MD), and the Combined Plan (CO), all of which are described in note 9. OPERS maintains a cost-sharing multiple employer defined benefit post employment healthcare plan, which provides a medical plan, prescription drug program and Medicare Part B premium reimbursement, to age and service retirees with 10 or more years of qualifying Ohio service credit of both the TP and CO. Members of the MD do not qualify for ancillary benefits, including post employment health care coverage. Health care coverage for disability recipients and qualified survivor benefit recipients is available. The ORC provides the statutory authority requiring public employers to fund post retirement health care through their contributions to OPERS. A portion of each employer’s contribution is set aside for the funding of post retirement health care benefits. Participating employers are required to contribute to the pension plan at rates expressed as percentages of the payroll of active pension plan members, currently, 14.0%. The ORC states that the employer contribution may not exceed 14.0% of covered payroll. Active members do not make contributions to the OPEB Plan. OPERS post employment healthcare plan was established and is administrated in accordance with, Internal Revenue Code 401(h). Each year, the OPERS Retirement Board determines the portion of the employer contribution rate that will be set aside for funding of post employment health care benefits. For 2010, the employer contribution allocated to the health care plan was 5.5% of covered payroll from January 1 through February 28th and 5.0% for the remainder of the year. The OPERS Retirement Board is also authorized to establish rules for the payment of a portion of the health care benefits provided by the retiree or their surviving beneficiaries. Payment amounts vary depending on the number of covered dependents and the coverage selected. City contributions to OPERS allocated to fund post employment benefits for 2010, 2009 and 2008 were $1,007,103, $1,135,580 and $1,341,759 respectively. The Health Care Preservation Plan adopted by the OPERS Retirement Board on September 9, 2004, was effective January 1, 2007. Member and employer contribution rates increased January 1 of each year from 2006 to 2008, which allowed additional funds to be allocated to the health care plan. OPERS issues a stand-alone financial report. Interested parties may obtain a copy by writing OPERS, Attention: Finance Director, 277 East Town Street, Columbus, OH 43215-4642, or by calling (800) 222-7377.
32
11. LEASES AND CONSTRUCTION COMMITMENTS
There are no operating leases, in which the City is a lessee, in excess of one year. Operating lease payments in 2010 were $229,234. Significant commitments and encumbrances at December 31, 2010 included: Capital Projects Fund $8,008,000
12. LONG-TERM LIABILITIES
Long-term liability activity for the year ended December 31, 2010, was as follows: Amounts
Beginning Ending Due WithinBalance Additions Reductions Balance One Year
General obligation bonds: Street Improvement bonds- Series 1991, 4.5%-6.65% $124,899 $36,682 $88,217 $43,481 Street Improvement bonds- Series 1992, 3.25%-6.45% 240,000 75,000 165,000 80,000 Court Facility, 3.0%-4.5% 3,250,000 165,000 3,085,000 170,000 Recreation & Parks Improvements 3.0%-5.0% 12,075,000 450,000 11,625,000 465,000
Total general obligation bonds 15,689,899 726,682 14,963,217 758,481
Special assessment bonds: Streets Series 1991, 4.5%-6.65% 395,101 123,318 271,783 131,519
Total special assessment bonds 395,101 123,318 271,783 131,519
Other: Accrued vacation and sick leave benefits 4,250,508 $2,414,534 2,205,085 4,459,957 2,542,175 Ohio Public Works Commission Long-Term Promissory Notes, 0-3% 2,272,048 171,134 2,100,914 172,000
Total other 6,522,556 2,414,534 2,376,219 6,560,871 2,714,175
Total long-term liabilities $22,607,556 $2,414,534 $3,226,219 $21,795,871 $3,604,175
The accrued vacation and sick leave benefits liability will be liquidated by several of the City’s governmental and internal service funds. In the past, approximately 75% has been paid by the General Fund, 10% by the Street Maintenance Fund and the remainder by the other governmental and internal service funds. The City uses the “vesting method” to determine the appropriate liability. In the event of delinquencies related to special assessment bonds, the City is required to use other resources until foreclosure proceeds are received to satisfy debt service. The City does not have a sinking fund or reserve established to cover defaults by property owners because foreclosure proceeds would eliminate any outstanding liability. From time to time the City has issued Industrial Revenue Bonds to provide financial assistance to private-sector entities for the acquisition and construction of industrial and commercial facilities deemed to be in the
33
public interest. Neither the City, the State, nor any political subdivision thereof is obligated in any manner for repayment of the bonds. Accordingly, the bonds are not reported as liabilities in the accompanying financial statements. At year-end there were two series of Industrial Revenue Bonds outstanding, with an aggregate principal amount payable of $4.8 million. The annual requirements to pay principal and interest on long-term obligations at December 31, 2010, are as follows:
Principal Interest Principal Interest Principal Interest
The Ohio Revised Code (ORC) provides that the total net debt (as defined in the ORC) of a municipal corporation, whether or not approved by the electors, shall not exceed 10.5% of the total value of all property in the municipal corporation as listed and assessed for taxation. In addition, the unvoted net debt of municipal corporations cannot exceed 5.5% of the total taxation value of property. At December 31, 2010, the City had a legal debt margin for total debt of $117,097,013 and a legal debt margin for unvoted debt of $66,216,039.
13. CONTINGENT LIABILITIES
The City is the defendant in various lawsuits and subject to various claims over which litigation has not commenced. Although the outcome of these matters is not presently determinable, in the opinion of the Law Director the resolution of these matters will not have a material adverse effect on the financial condition of the City. The City participates in several federally assisted programs that are subject to program compliance audits by the grantors or their representatives. A single financial and compliance audit of the city has been completed with no findings for recovery. The grantor agencies, at their option, may perform economy and efficiency audits, program results audits or conduct monitoring visits. Such audits and visits could lead to reimbursement to the grantor agencies. Management believes such reimbursements, if any, would be immaterial.
14. GASB 51
In 2010 the City adopted GASB Statement No. 51 “Accounting and Financial Reporting for Intangible Assets”. Any intangible assets acquired by the City prior to January 1, 2010 are considered to have indefinite useful lives and are not retroactively reported.
34 CITY OF KETTERING, OHIOREQUIRED SUPPLEMENTARY INFORMATIONBUDGET(GAAP BUDGET) TO ACTUAL COMPARISON SCHEDULE - GENERAL FUNDFOR THE YEAR ENDED DECEMBER 31, 2010
Budgeted Amounts Variance withOriginal Final Actual Final Budget
Fund balance, January 1 $40,457,246 $40,457,246 $40,457,246Resources (inflows) Income taxes 35,300,000 35,300,000 36,417,018 $1,117,018 Property taxes 7,610,000 7,610,000 7,579,402 (30,598) Licenses and permits 515,000 523,000 483,762 (39,238) Intergovernmental revenue 1,501,000 1,501,000 1,637,842 136,842 Charges for services 161,000 151,000 147,385 (3,615) Fines and forfeits 1,415,000 1,415,000 1,379,744 (35,256) Investment earnings 1,500,000 1,160,000 865,304 (294,696) Special assessments 400,000 410,000 410,113 113 Refunds and reimbursements 1,200,000 1,550,000 1,898,781 348,781 Miscellaneous 13,000 13,000 22,487 9,487 Sale of city assets 30,000 50,000 66,511 16,511 Amounts available for appropriation 90,102,246 90,140,246 91,365,595 1,225,349Charges to appropriations (outflows) General government: Mayor and Council: Personal services 252,000 252,000 249,368 2,632 Operating expenditures 83,288 84,058 71,538 12,520 Capital outlay Total mayor and council 335,288 336,058 320,906 15,152 Municipal court: Personal services 976,700 986,700 984,418 2,282 Operating expenditures 280,211 280,211 243,477 36,734 Capital outlay Total municipal court 1,256,911 1,266,911 1,227,895 39,016 Clerk of courts: Personal services 827,100 827,100 793,458 33,642 Operating expenditures 154,701 154,526 130,164 24,362 Capital outlay Total clerk of courts 981,801 981,626 923,622 58,004 Office of City Manager: Personal services 574,900 584,900 577,434 7,466 Operating expenditures 57,923 59,071 52,956 6,115 Capital outlay Total office of city manager 632,823 643,971 630,390 13,581 Law department: Personal services 746,700 736,700 697,082 39,618 Operating expenditures 158,961 218,961 199,815 19,146 Capital outlay Total law department 905,661 955,661 896,897 58,764 Finance department: Personal services 1,530,800 1,530,800 1,505,035 25,765 Operating expenditures 532,210 545,586 432,021 113,565 Capital outlay 10,500 Total finance department 2,073,510 2,076,386 1,937,056 139,330 Administrative support: Personal services 502,600 502,600 491,490 11,110 Operating expenditures 90,249 92,287 85,863 6,424 Capital outlay Total administrative support 592,849 594,887 577,353 17,534
See accompanying notes to the required supplementary information.
CITY OF KETTERING, OHIO 35
REQUIRED SUPPLEMENTARY INFORMATIONBUDGET(GAAP BUDGET) TO ACTUAL COMPARISON SCHEDULE - GENERAL FUND - CONTINUEDFOR THE YEAR ENDED DECEMBER 31, 2010
Budgeted Amounts Variance withOriginal Final Actual Final Budget
General government: Human resources department: Personal services $640,500 $640,500 $627,826 $12,674 Operating expenditures 351,584 351,584 214,648 136,936 Capital outlay Total human resources department 992,084 992,084 842,474 149,610 Planning and development: Personal services 1,973,800 2,070,000 1,997,267 72,733 Operating expenditures 438,203 441,644 260,934 180,710 Capital outlay Total planning and development 2,412,003 2,511,644 2,258,201 253,443 Economic development: Personal services 137,400 139,100 139,094 6 Operating expenditures 591,976 590,276 399,760 190,516 Capital outlay Total economic development 729,376 729,376 538,854 190,522 Miscellaneous: Operating expenditures 1,276,803 1,277,803 985,713 292,090 Total miscellaneous 1,276,803 1,277,803 985,713 292,090 Total general government 12,189,109 12,366,407 11,139,361 1,227,046 Police: Personal services 10,541,300 10,601,300 10,550,297 51,003 Operating expenditures 2,115,268 2,115,061 1,754,357 360,704 Capital outlay 164,836 160,000 115,037 44,963 Total police 12,821,404 12,876,361 12,419,691 456,670 Fire: Personal services 7,882,600 8,083,600 8,062,324 21,276 Operating expenditures 2,344,362 2,258,512 1,933,500 325,012 Capital outlay 796,000 676,000 206,844 469,156 Total fire 11,022,962 11,018,112 10,202,668 815,444 Public works: Engineering department: Personal services 2,014,000 2,014,000 1,970,989 43,011 Operating expenditures 447,573 452,883 310,140 142,743 Capital outlay Total engineering department 2,461,573 2,466,883 2,281,129 185,754 Street lighting: Operating expenditures 540,000 540,000 506,251 33,749 Total street lighting 540,000 540,000 506,251 33,749 Total public works 3,001,573 3,006,883 2,787,380 219,503 Transfers to other funds 18,913,000 20,945,150 15,221,132 5,724,018 Total charges to appropriations 57,948,048 60,212,913 51,770,232 8,442,681Fund balance, December 31 $32,154,198 $29,927,333 $39,595,363 $9,668,030
See accompanying notes to the required supplementary information.
36 CITY OF KETTERING, OHIOREQUIRED SUPPLEMENTARY INFORMATIONBUDGET(GAAP BUDGET) TO ACTUAL COMPARISON SCHEDULE - STREET MAINTENANCE FUNDFOR THE YEAR ENDED DECEMBER 31, 2010
Budgeted Amounts Variance withOriginal Final Actual Final Budget
Fund balance, January 1 $344,764 $344,764 $344,764Resources (inflows) Licenses and permits 10,000 10,000 7,560 ($2,440) Intergovernmental revenue 2,530,000 2,540,000 2,493,387 (46,613) Refunds and reimbursements 200,000 200,000 310,646 110,646 Miscellaneous 5,000 15,000 12,625 (2,375) Sale of city assets 20,000 20,000 20,211 211 Transfer from the general fund 2,977,000 3,328,810 2,811,600 (517,210) Amounts available for appropriation 6,086,764 6,458,574 6,000,793 (457,781)Charges to appropriations (outflows) Public works: Street department: Personal services 3,873,600 3,873,600 3,671,347 202,253 Operating expenditures 1,908,415 2,253,383 1,724,812 528,571 Capital outlay 250,897 250,897 64,081 186,816 Total charges to appropriations 6,032,912 6,377,880 5,460,240 917,640Fund balance, December 31 $53,852 $80,694 $540,553 $459,859
See accompanying notes to the required supplementary information.
CITY OF KETTERING, OHIO 37
REQUIRED SUPPLEMENTARY INFORMATIONBUDGET(GAAP BUDGET) TO ACTUAL COMPARISON SCHEDULE - PARKS, RECREATION AND CULTURAL ARTS FUNDFOR THE YEAR ENDED DECEMBER 31, 2010
Budgeted Amounts Variance withOriginal Final Actual Final Budget
Fund balance, January 1 $94,780 $94,780 $94,780Resources (inflows) Intergovernmental revenue 10,000 9,800 13,548 $3,748 Charges for services 3,305,000 3,216,000 3,048,057 (167,943) Refunds and reimbursements 101,000 106,000 65,105 (40,895) Miscellaneous 23,000 17,000 31,020 14,020 Sale of city assets 4,303 4,303 Transfer from the general fund 5,850,000 6,141,508 5,772,400 (369,108) Amounts available for appropriation 9,383,780 9,585,088 9,029,213 (555,875)Charges to appropriations (outflows) Leisure services: Parks, recreation and cultural arts department: Personal services 5,326,300 5,326,300 5,125,190 201,110 Operating expenditures 3,895,068 4,091,104 3,773,318 317,786 Capital outlay 40,000 45,400 45,352 48 Total charges to appropriations 9,261,368 9,462,804 8,943,860 518,944Fund balance, December 31 $122,412 $122,284 $85,353 ($36,931)
See accompanying notes to the required supplementary information.
38 CITY OF KETTERING, OHIOREQUIRED SUPPLEMENTARY INFORMATIONBUDGET(GAAP BUDGET) TO ACTUAL COMPARISON SCHEDULE - FRAZE PAVILION FUNDFOR THE YEAR ENDED DECEMBER 31, 2010
Budgeted Amounts Variance withOriginal Final Actual Final Budget
Fund balance, January 1 $107,162 $107,162 $107,162Resources (inflows) Charges for services 2,615,000 3,055,000 3,094,460 $39,460 Refunds and reimbursements 5,000 3,000 1,000 (2,000) Miscellaneous 245,000 342,000 356,713 14,713 Transfer from the general fund 300,000 300,000 (300,000) Amounts available for appropriation 3,272,162 3,807,162 3,559,335 (247,827)Charges to appropriations (outflows) Leisure services: Fraze pavilion: Personal services 704,600 684,600 680,462 4,138 Operating expenditures 2,496,669 2,613,789 2,520,781 93,008 Total charges to appropriations 3,201,269 3,298,389 3,201,243 97,146Fund balance, December 31 $70,893 $508,773 $358,092 ($150,681)
See accompanying notes to the required supplementary information.
CITY OF KETTERING, OHIO 39
REQUIRED SUPPLEMENTARY INFORMATIONBUDGET(GAAP BUDGET) TO ACTUAL COMPARISON SCHEDULE -COMMUNITY DEVELOPMENT FUNDFOR THE YEAR ENDED DECEMBER 31, 2010
Budgeted Amounts Variance withOriginal Final Actual Final Budget
Fund balance, January 1 $1,132,403 $1,132,403 $1,132,403Resources (inflows) Intergovernmental revenue 3,878,135 3,878,635 2,261,890 ($1,616,745) Investment earnings 2,500 2,500 1,338 (1,162) Miscellaneous 27,400 27,400 16,931 (10,469) Sale of city assets 37,500 37,500 35,048 (2,452) Amounts available for appropriation 5,077,938 5,078,438 3,447,610 (1,630,828)Charges to appropriations (outflows) General government 1,323,461 1,320,812 720,407 600,405 Capital improvements 2,737,396 2,806,499 1,443,120 1,363,379 Total charges to appropriations 4,060,857 4,127,311 2,163,527 1,963,784Fund balance, December 31 $1,017,081 $951,127 $1,284,083 $332,956
See accompanying notes to the required supplementary information.
40 CITY OF KETTERING, OHIOREQUIRED SUPPLEMENTARY INFORMATIONBUDGET(GAAP BUDGET) TO ACTUAL COMPARISON SCHEDULE - EMERGENCY MEDICAL FUNDFOR THE YEAR ENDED DECEMBER 31, 2010
Budgeted Amounts Variance withOriginal Final Actual Final Budget
Fund balance, January 1 $7,548,628 $7,548,628 $7,548,628Resources (inflows) Charges for services 1,500,000 1,375,000 1,395,922 $20,922 Investment earnings 225,000 225,000 145,402 (79,598) Refunds and reimbursements Amounts available for appropriation 9,273,628 9,148,628 9,089,952 (58,676)Charges to appropriations (outflows) Fire:
Operating expenditures 154,875 157,878 104,196 53,682 Capital outlay 1,125,183 1,115,183 722,134 393,049 Total fire 1,280,058 1,273,061 826,330 446,731 Capital Improvements Total charges to appropriations 1,280,058 1,273,061 826,330 446,731Fund balance, December 31 $7,993,570 $7,875,567 $8,263,622 $388,055
See accompanying notes to the required supplementary information.
CITY OF KETTERING, OHIO 41
NOTES TO THE REQUIRED SUPPLEMENTARY INFORMATION FOR THE YEAR ENDED DECEMBER 31, 2010 1. BUDGETS AND BUDGETARY ACCOUNTING
An annual budget for all governmental fund types covering the period January 1 through December 31 of the following year showing estimated revenues and expenditures is submitted to the County Auditor as Secretary of the County Budget Commission. The budget is passed by City Council, after public hearings are held, by July 15 of each year, and submitted to the County Budget Commission by July 20 of each year. The County Budget Commission certifies its actions relative to the annual budget to the City by September 1. As part of this certification, the City receives an official certificate of estimated resources which states the projected receipts by fund. On or about January 1, this certificate is amended to include any unencumbered fund balances from the preceding year. Prior to December 31, the City must revise its budget so that the total contemplated expenditures from any fund during the ensuing fiscal year will not exceed the amount stated in the certificate of estimated resources. The revised budget then serves as the basis for the annual appropriations ordinance. A temporary appropriations ordinance to control expenditures may be passed on or about January 1 of each year for the period January 1 through March 31. An annual appropriations ordinance must be passed by April 1 of each year for the period January 1 to December 31. The appropriations ordinance generally controls expenditures at the level of personal services, operating expenditures and capital outlay on a department level, except for the state highway fund, cemetery fund, police pension fund, DESC (Defense Electronics Supply Center) reuse fund, special safety grants and programs fund, community development fund, emergency medical fund and the capital projects fund which are controlled at the fund level. The City Manager has the authority to amend appropriations within the department at the levels of personal service, operating expenditures and capital outlay; amendments above this level require council approval. The ordinance may be amended or supplemented by Council during the year as required. Amendments to the appropriations ordinance made during the year were not material in relation to the original appropriations. Total expenditures in any fund do not exceed the estimated resources for that fund. Unencumbered appropriations lapse at year-end, while encumbered amounts are reappropriated in the following year’s budget. The Finance Director in conjunction with the annual budgeting process estimates revenues. However, these estimates are not included or required in the budget ordinance. The City, being a home rule municipal corporation, has adopted, through ordinance, GAAP (generally accepted accounting principles) as its budgetary basis. Encumbrance accounting, under which purchase orders, contracts, and other commitments for the expenditure of monies are recorded in order to reserve that portion of the applicable appropriation, is employed as an extension of formal budgetary control in the governmental funds. Encumbrances outstanding at year-end are reported as restricted, committed or assigned fund balance for subsequent year expenditures.
FINANCIAL STATEMENTS
OF
INDIVIDUAL FUNDS
44 CITY OF KETTERING, OHIO
NONMAJOR SPECIAL REVENUE FUNDSCOMBINING BALANCE SHEET DECEMBER 31, 2010
Special TotalState Police DESC Safety Grants Governmental
Highway Cemetery Pension Reuse & Programs FundsASSETSPooled cash and investments $74,013 $397,575 $405,877 $55,428 $3,164,629 $4,097,522Receivables: Property taxes 401,000 401,000 Accounts 313 313Due from other governments 130,784 9 78,352 209,145Prepaid expenditures Total assets $204,797 $397,575 $806,886 $55,741 $3,242,981 $4,707,980
LIABILITIESAccounts payable $403 $800 $14,634 $8,248 $24,085Accrued payroll $395,317 6,066 401,383Deferred revenue 116,878 401,000 14,132 532,010 Total liabilities 117,281 800 796,317 14,634 28,446 957,478FUND BALANCESNonspendable: Prepaids Restricted for: Public safety 10,569 817,382 827,951 Road construction / Public works 87,516 87,516 Leisure services 7,732 7,732 Municipal court activities 1,399,197 1,399,197Committed to: Social services 7,298 7,298 Public safety 12,027 12,027 Leisure services 396,775 970,899 1,367,674 Other purposes 41,107 41,107 Total fund balances 87,516 396,775 10,569 41,107 3,214,535 3,750,502 Total liabilities and fund balances $204,797 $397,575 $806,886 $55,741 $3,242,981 $4,707,980
CITY OF KETTERING, OHIO 45
NONMAJOR SPECIAL REVENUE FUNDSCOMBINING STATEMENT OF REVENUES, EXPENDITURES, AND CHANGES IN FUND BALANCES - BUDGET AND ACTUAL (GAAP BUDGET)FOR THE YEAR ENDED DECEMBER 31, 2010
State Highway CemeteryFinal Budget Actual Variance Final Budget Actual Variance
REVENUESProperty taxesIntergovernmental revenue $316,000 $271,118 ($44,882)Charges for services $7,000 $12,711 $5,711Fines and forfeitsInvestment earnings 1,000 2,945 1,945 5,000 7,145 2,145Refunds and reimbursements 25,876 25,876Miscellaneous 3,000 1,900 (1,100) Total revenues 317,000 299,939 (17,061) 15,000 21,756 6,756EXPENDITURESCurrent: General government 20,000 11,622 8,378 Police Fire Public works 131,000 128,813 2,187 Leisure servicesCapital improvements 158,000 97,088 60,912 Total expenditures 289,000 225,901 63,099 20,000 11,622 8,378 Excess (deficiency) of revenues over expenditures 28,000 74,038 46,038 (5,000) 10,134 15,134OTHER FINANCING SOURCES (USES) Transfers in 505,000 (505,000) Transfers out Net change in fund balance 533,000 74,038 (458,962) (5,000) 10,134 15,134Fund balances--beginning 13,478 13,478 386,641 386,641Fund balances--ending $546,478 $87,516 ($458,962) $381,641 $396,775 $15,134
46 CITY OF KETTERING, OHIO
NONMAJOR SPECIAL REVENUE FUNDSCOMBINING STATEMENT OF REVENUES, EXPENDITURES, AND CHANGES IN FUND BALANCES - BUDGET AND ACTUAL (GAAP BUDGET) - CONTINUEDFOR THE YEAR ENDED DECEMBER 31, 2010
Police Pension DESC ReuseFinal Budget Actual Variance Final Budget Actual Variance
REVENUESProperty taxes $399,000 $398,929 ($71)Intergovernmental revenueCharges for services $33,000 $31,622 ($1,378)Fines and forfeitsInvestment earningsRefunds and reimbursements 11,000 10,964 (36)Miscellaneous Total revenues 399,000 398,929 (71) 44,000 42,586 (1,414)EXPENDITURESCurrent: General government 241,675 178,805 62,870 Police 1,426,900 1,395,323 31,577 Fire Public works Leisure servicesCapital improvements Total expenditures 1,426,900 1,395,323 31,577 241,675 178,805 62,870 Excess (deficiency) of revenues over expenditures (1,027,900) (996,394) 31,506 (197,675) (136,219) 61,456OTHER FINANCING SOURCES (USES) Transfers in 1,048,000 996,400 (51,600) 140,000 115,000 (25,000) Transfers out Net change in fund balance 20,100 6 (20,094) (57,675) (21,219) 36,456Fund balances--beginning 10,563 10,563 62,326 62,326Fund balances--ending $30,663 $10,569 ($20,094) $4,651 $41,107 $36,456
CITY OF KETTERING, OHIO 47
NONMAJOR SPECIAL REVENUE FUNDSCOMBINING STATEMENT OF REVENUES, EXPENDITURES, AND CHANGES IN FUND BALANCES - BUDGET AND ACTUAL (GAAP BUDGET) - CONTINUEDFOR THE YEAR ENDED DECEMBER 31, 2010
Special Safety Grants & Programs TotalFinal Budget Actual Variance Final Budget Actual Variance
REVENUESProperty taxes $399,000 $398,929 ($71)Intergovernmental revenue $482,017 $414,066 ($67,951) 798,017 685,184 (112,833)Charges for services 40,000 44,333 4,333Fines and forfeits 418,000 455,600 37,600 418,000 455,600 37,600Investment earnings 14,000 2,920 (11,080) 20,000 13,010 (6,990)Refunds and reimbursements 11,000 36,840 25,840Miscellaneous 110,000 119,017 9,017 113,000 120,917 7,917 Total revenues 1,024,017 991,603 (32,414) 1,799,017 1,754,813 (44,204)EXPENDITURESCurrent: General government 692,662 426,334 266,328 954,337 616,761 337,576 Police 400,347 161,557 238,790 1,827,247 1,556,880 270,367 Fire 3,000 3,000 3,000 3,000 Public works 22,641 15,195 7,446 153,641 144,008 9,633 Leisure services 96,303 28,615 67,688 96,303 28,615 67,688Capital improvements 96,872 56,104 40,768 254,872 153,192 101,680 Total expenditures 1,311,825 687,805 624,020 3,289,400 2,499,456 789,944 Excess (deficiency) of revenues over expenditures (287,808) 303,798 591,606 (1,490,383) (744,643) 745,740OTHER FINANCING SOURCES (USES) Transfers in 43,262 31,732 (11,530) 1,736,262 1,143,132 (593,130) Transfers out Net change in fund balance (244,546) 335,530 580,076 245,879 398,489 152,610Fund balances--beginning 2,879,005 2,879,005 3,352,013 3,352,013Fund balances--ending $2,634,459 $3,214,535 $580,076 $3,597,892 $3,750,502 $152,610
48 CITY OF KETTERING, OHIO
DEBT SERVICE FUNDSTATEMENT OF REVENUES, EXPENDITURES, AND CHANGES IN FUND BALANCE - BUDGET AND ACTUAL (GAAP BUDGET)FOR THE YEAR ENDED DECEMBER 31, 2010
Final Budget Actual VarianceREVENUESProperty taxes $1,283,000 $1,276,080 ($6,920)Investment earnings 20,000 34,057 14,057Special assessments 149,000 149,592 592Refunds and reimbursements 26,000 26,484 484 Total revenues 1,478,000 1,486,213 8,213EXPENDITURESCurrent: General government 2,000 2,000Debt service: Principal 1,021,134 1,021,134 Interest 672,521 672,521 Total expenditures 1,695,655 1,693,655 2,000 Deficiency of revenues over expenditures (217,655) (207,442) 10,213OTHER FINANCING SOURCES (USES) Transfers in 292,000 290,000 (2,000) Net change in fund balance 74,345 82,558 8,213Fund balances--beginning 715,127 715,127Fund balances--ending $789,472 $797,685 $8,213
CITY OF KETTERING, OHIO 49
CAPITAL PROJECTS FUNDSTATEMENT OF REVENUES, EXPENDITURES, AND CHANGES IN FUND BALANCE - BUDGET AND ACTUAL (GAAP BUDGET)FOR THE YEAR ENDED DECEMBER 31, 2010
Final Budget Actual VarianceREVENUESProperty taxes $128,000 $137,229 $9,229Intergovernmental 11,966,000 7,556,824 (4,409,176)Investment earnings 114,040 114,040Special assessments 459,000 459,532 532Refunds and reimbursements 700,000 592,564 (107,436) Total revenues 13,253,000 8,860,189 (4,392,811)EXPENDITURESCapital improvements 36,024,014 17,386,788 18,637,226 Total expenditures 36,024,014 17,386,788 18,637,226 Deficiency of revenues over expenditures (22,771,014) (8,526,599) 14,244,415OTHER FINANCING SOURCES (USES) Transfers in 9,146,570 5,204,000 (3,942,570) Net change in fund balance (13,624,444) (3,322,599) 10,301,845Fund balances--beginning 16,114,105 16,114,105Fund balances--ending $2,489,661 $12,791,506 $10,301,845
50 CITY OF KETTERING, OHIO
CAPITAL PROJECTS FUNDDETAILED SCHEDULE OF EXPENDITURES COMPARED TO BUDGET (GAAP BUDGET)FOR THE YEAR ENDED DECEMBER 31, 2010
Final Budget Actual VarianceCapital improvements: Traffic controls $155,000 $99,507 $55,493 Street construction 13,124,440 7,046,683 6,077,757 Drainage 50,000 9,991 40,009 Parks and recreation 18,263,083 6,572,254 11,690,829 Tree planting and landscaping 131,498 36,655 94,843 Other 4,299,993 3,621,698 678,295 Total capital projects fund $36,024,014 $17,386,788 $18,637,226
CITY OF KETTERING, OHIO 51
INTERNAL SERVICE FUNDSCOMBINING BALANCE SHEETDECEMBER 31, 2010
Administrative HealthOperations Insurance Totals
ASSETSCurrent assets: Pooled cash and investments $612,165 $39 $612,204 Accounts receivable 88 88 Prepaid expenses 333,552 333,552 Inventory 322,453 322,453 Total current assets 934,706 333,591 1,268,297Noncurrent assets: Buildings and improvements 757,936 757,936 Machinery and equipment 1,981,674 1,981,674 Less: Accumulated depreciation (2,278,824) (2,278,824) Total noncurrent assets 460,786 460,786 Total assets $1,395,492 $333,591 $1,729,083
LIABILITIESCurrent liabilities: Accounts payable $182,821 $182,821 Due to General fund $304,400 304,400 Accrued payroll 136,964 136,964 Total current liabilities 319,785 304,400 624,185Noncurrent liabilities: Accrued vacation and sick leave benefits 346,416 346,416 Total liabilities 666,201 304,400 970,601NET ASSETSInvested in capital assets 460,785 460,785Unrestricted 268,506 29,191 297,697 Total net assets 729,291 29,191 758,482 Total liabilities and net assets $1,395,492 $333,591 $1,729,083
52 CITY OF KETTERING, OHIO
INTERNAL SERVICE FUNDSCOMBINING STATEMENT OF REVENUES, EXPENSES, AND CHANGES IN FUND NET ASSETSFOR THE YEAR ENDED DECEMBER 31, 2010
Administrative HealthOperations Insurance Totals
OPERATING REVENUESCharges for services $6,022,427 $4,424,651 $10,447,078 Total operating revenues 6,022,427 4,424,651 10,447,078OPERATING EXPENSESPersonal services 3,174,552 3,174,552Repairs and maintenance 1,435,510 1,435,510Contractual services 684,954 4,424,687 5,109,641Other materials and expenses 567,475 567,475Depreciation 130,267 130,267 Total operating expenses 5,992,758 4,424,687 10,417,445 Operating income (loss) 29,669 (36) 29,633NONOPERATING REVENUES (EXPENSES)Investment earnings 12,359 62 12,421 Change in net assets 42,028 26 42,054 Total net assets--beginning 687,263 29,165 716,428 Total net assets--ending $729,291 $29,191 $758,482
CITY OF KETTERING, OHIO 53
INTERNAL SERVICE FUNDS COMBINING STATEMENT OF CASH FLOWSFOR THE YEAR ENDED DECEMBER 31, 2010Increase (Decrease) in cash
Administrative HealthOperations Insurance Totals
CASH FLOWS FROM OPERATING ACTIVITIESCash received for services $6,041,589 $4,424,651 $10,466,240Cash paid to suppliers for goods or services (2,610,186) (4,494,778) (7,104,964)Cash paid to employees for services (3,166,667) (3,166,667) Net cash provided (used) by operating activities 264,736 (70,127) 194,609CASH FLOWS FROM CAPITAL AND RELATED FINANCING ACTIVITIESAcquisition of capital assets (17,185) (17,185)Loan from General fund 70,100 70,100Sale of capital assets 232 232 Net cash used by capital and related financing activities (16,953) 70,100 53,147CASH FLOWS FROM INVESTING ACTIVITIESInvestment earnings 12,359 62 12,421 Net cash provided by investing activities 12,359 62 12,421 Net increase (decrease) in cash 260,142 35 260,177Cash at beginning of year 352,023 4 352,027Cash at end of year $612,165 $39 $612,204
RECONCILIATION OF OPERATING INCOME (LOSS) TO NET CASH PROVIDED (USED) BY OPERATING ACTIVITIESOperating income (loss) $29,669 ($36) $29,633Adjustments to reconcile operating income (loss) to net cash provided (used) by operating activities: Depreciation 130,267 130,267 (Increase) decrease in receivables 19,394 19,394 (Increase) decrease in inventories 10,264 10,264 Increase (decrease) in accounts payable 66,684 66,684 Net (increase) decrease in other operating net assets 8,458 (70,091) (61,633) Net cash provided (used) by operating activities $264,736 ($70,127) $194,609
54 CITY OF KETTERING, OHIO
AGENCY FUNDSCOMBINING STATEMENT OF CHANGES IN ASSETS AND LIABILITIESFOR THE YEAR ENDED DECEMBER 31, 2010
This part of the City of Kettering’s comprehensive annual financial report presents detailed information as a context for understanding what the information in the financial statements, note disclosures, and required supplementary information says about the City’s overall financial health. Category Schedule #s Financial Trends 1, 2, 3 & 4 These schedules contain trend information to help the reader understand how the City’s financial performance and well-being have changed over time. Revenue Capacity 5 & 6 These schedules contain information to help the reader assess the City’s most significant local revenue source, the income tax. Debt Capacity 7 & 8 These schedules present information to help the reader assess the affordability of the City’s current levels of outstanding debt and the City’s ability to issue additional debt in the future. Economic and Demographic Information 9 & 10 These schedules offer economic and demographic indicators to help the reader understand the environment within which the City’s financial activities take place. Operating Information 11, 12 & 13 These schedules contain service and infrastructure data to help the reader
understand how the information in the City’s financial report relates to the services the City provides.
Sources: Unless otherwise noted, the information in these schedules is derived from the comprehensive annual financial reports for the relevant year.
CIT
Y O
F K
ETTE
RIN
G, O
HIO
58SC
HED
ULE
1N
ET
AS
SE
TS B
Y C
ATE
GO
RY
LAS
T TE
N Y
EA
RS
(ac
crua
l bas
is o
f acc
ount
ing
)
2001
2002
2003
2004
2005
2006
2007
2008
2009
2010
Gov
ernm
enta
l act
iviti
es
Inve
sted
in c
apita
l ass
ets,
net
of
re
late
d de
bt$9
5,98
6,31
9$1
00,0
65,9
03$1
09,2
67,0
77$1
12,4
12,5
81$1
12,0
76,4
12$1
13,5
57,6
10$1
13,4
38,9
67$1
13,9
42,6
66$1
05,1
96,9
55$1
24,2
38,0
00
Res
trict
ed fo
r:
Deb
t ser
vice
38,5
3346
,554
34,5
4915
,178
15,6
3816
,476
16,6
9712
,367
715,
127
797,
685
S
ocia
l ser
vice
s2,
035,
858
2,08
0,80
71,
863,
768
1,04
3,77
11,
255,
296
1,37
9,85
61,
495,
228
1,40
9,59
31,
691,
954
1,91
3,67
3
Pub
lic s
afet
y14
5,95
515
2,01
01,
084,
425
1,25
1,53
01,
756,
451
3,12
4,73
64,
550,
806
6,47
2,80
68,
422,
177
9,18
9,15
4
Lei
sure
ser
vice
s7,
104
119,
787
38,4
9611
,039
36,2
3243
,756
64,1
9858
,234
12,0
64,9
5386
,165
M
unic
ipal
cou
rt ac
tiviti
es55
9,34
074
2,72
095
7,09
51,
112,
424
660,
228
764,
100
876,
020
1,05
4,04
81,
236,
513
1,39
9,19
7
Oth
er p
urpo
ses
444,
840
460,
589
284,
734
403,
659
407,
886
379,
322
327,
576
279,
542
171,
133
204,
394
U
nres
trict
ed34
,320
,366
33,0
37,0
3729
,905
,347
26,6
19,7
7728
,054
,056
30,2
30,4
0436
,673
,435
44,0
19,1
2346
,312
,490
48,5
07,2
91To
tal n
et a
sset
s$1
33,5
38,3
15$1
36,7
05,4
07$1
43,4
35,4
91$1
42,8
69,9
59$1
44,2
62,1
99$1
49,4
96,2
60$1
57,4
42,9
27$1
67,2
48,3
79$1
75,8
11,3
02$1
86,3
35,5
59
Not
e: A
ccou
ntin
g st
anda
rds
requ
ire th
at n
et a
sset
s be
repo
rted
in th
ree
com
pone
nts
in th
e fin
anci
al s
tate
men
ts:
inve
sted
in c
apita
l ass
ets,
net
of r
elat
ed d
ebt;
rest
ricte
d; a
nd u
nres
trict
ed.
Net
ass
ets
are
cons
ider
ed r
estri
cted
whe
n (1
) and
ext
erna
l par
ty, s
uch
as th
e st
ate
or fe
dera
l gov
ernm
ent,
plac
es a
rest
rictio
n on
how
the
reso
urce
sm
aybe
used
or(2
)ena
blin
gle
gisl
atio
nis
enac
ted
byth
eci
ty
Yea
r
may
be
used
, or (
2) e
nabl
ing
legi
slat
ion
is e
nact
ed b
y th
e ci
ty.
$0$20
$40
$60
$80
$100
$120
$140
$160
$180
$200
Millions
Net
Ass
ets
(acc
rual
bas
is)
Unr
estri
cted
Tota
l net
ass
ets
CIT
Y O
F K
ETTE
RIN
G, O
HIO
SCH
EDU
LE 2
CH
AN
GE
S IN
NE
T A
SS
ETS
LAS
T TE
N Y
EA
RS
(acc
rual
bas
is o
f acc
ount
ing
)20
0120
0220
0320
0420
0520
0620
0720
0820
0920
10Ex
pens
es
Gen
eral
gov
ernm
ent
$10,
716,
604
$11,
179,
273
$12,
142,
127
$13,
210,
288
$12,
339,
967
$14,
150,
379
$17,
232,
295
$13,
755,
091
$13,
175,
646
$12,
813,
463
P
olic
e10
,270
,530
10,6
26,9
7310
,840
,287
11,2
82,2
6311
,530
,015
12,9
14,1
9112
,849
,315
13,7
60,3
2713
,658
,265
14,1
61,3
64
Fire
7,34
9,11
77,
569,
675
7,76
8,26
38,
768,
088
8,38
0,55
48,
709,
771
8,93
2,68
79,
666,
999
9,96
8,08
710
,504
,095
P
ublic
wor
ks9,
812,
828
10,8
03,7
4411
,236
,775
11,9
26,8
2011
,813
,178
11,3
60,4
8512
,263
,789
13,4
04,0
9512
,901
,084
13,4
25,5
10
Leis
ure
serv
ices
10,8
32,1
8011
,665
,610
11,4
79,1
8311
,834
,644
11,8
73,8
8112
,416
,056
12,2
34,6
1513
,254
,478
12,8
36,1
0913
,038
,928
In
tere
st o
n lo
ng te
rm d
ebt
541,
085
458,
517
386,
200
292,
918
1,16
8,35
71,
180,
009
1,14
8,45
71,
144,
483
504,
262
671,
334
Tota
l exp
ense
s49
,522
,344
52,3
03,7
9253
,852
,835
57,3
15,0
2157
,105
,952
60,7
30,8
9164
,661
,158
64,9
85,4
7363
,043
,453
64,6
14,6
94Pr
ogra
m R
even
ues
Cha
rges
for s
ervi
ces:
G
ener
al g
over
nmen
t2,
015,
725
2,35
3,23
12,
344,
241
2,43
6,40
42,
704,
373
2,49
6,68
62,
623,
279
2,64
4,90
12,
443,
428
2,47
5,62
3
Fire
1,14
4,79
198
6,73
71,
156,
577
1,34
3,28
11,
433,
964
1,52
2,10
41,
430,
458
1,40
7,08
4
Lei
sure
ser
vice
s4,
098,
781
4,50
8,94
54,
398,
036
5,08
5,69
65,
379,
969
5,34
4,89
65,
852,
344
6,43
9,65
96,
001,
520
6,14
2,51
7
Oth
er a
ctiv
ities
880
205
67,6
0262
,639
55,2
6556
,126
64,5
2085
,171
63,1
3842
,761
Ope
ratin
g gr
ants
and
con
tribu
tions
1,21
6,78
51,
743,
952
1,38
8,76
01,
623,
605
1,56
3,18
41,
253,
950
1,22
5,06
52,
367,
960
1,48
4,28
71,
594,
869
Cap
ital g
rant
s an
d co
ntrib
utio
ns:
P
ublic
wor
ks4,
284,
996
3,77
9,24
86,
560,
882
2,58
3,20
82,
187,
075
3,21
6,11
03,
286,
179
1,67
7,37
73,
692,
950
4,94
4,69
2
Oth
er a
ctiv
ities
367,
750
58,6
5329
,216
203,
067
904,
254
302,
002
36,5
2116
3,10
61,
286,
315
Tota
l pro
gram
reve
nues
11,9
84,9
1712
,385
,581
15,9
62,9
6512
,807
,505
13,2
49,5
1014
,615
,303
14,7
87,3
5314
,773
,693
15,2
78,8
8717
,893
,861
Net
(Exp
ense
)/Rev
enue
1
Gen
eral
gov
ernm
ent
(7,5
91,7
43)
(7,6
15,7
70)
(8,9
20,5
81)
(9,4
89,6
09)
(8,4
00,4
40)
(9,8
76,7
34)
(13,
528,
315)
(10,
308,
033)
(9,7
10,8
41)
(7,9
45,8
13)
Pol
ice
(10,
198,
837)
(10,
534,
263)
(10,
692,
821)
(11,
201,
292)
(11,
402,
343)
(12,
759,
270)
(12,
776,
771)
(13,
656,
869)
(13,
526,
758)
(14,
120,
321)
Fire
(7,3
19,2
77)
(7,5
69,3
35)
(6,5
68,2
48)
(7,7
63,9
76)
(7,2
17,9
62)
(7,3
66,3
90)
(7,4
95,2
08)
(8,1
44,8
90)
(8,5
37,5
29)
(9,0
96,7
08)
Pub
lic w
orks
(5,4
77,0
29)
(6,9
71,1
61)
(4,5
19,1
46)
(9,2
61,9
25)
(9,4
59,3
74)
(8,1
38,8
35)
(8,9
35,4
70)
(10,
692,
207)
(9,2
00,3
50)
(8,4
64,1
76)
Lei
sure
ser
vice
s(6
,409
,456
)(6
,769
,165
)(6
,802
,874
)(6
,497
,796
)(6
,207
,966
)(6
,794
,350
)(5
,989
,584
)(6
,265
,298
)(6
,284
,826
)(6
,422
,481
) I
nter
est o
n lo
ng te
rm d
ebt
(541
,085
)(4
58,5
17)
(386
,200
)(2
92,9
18)
(1,1
68,3
57)
(1,1
80,0
09)
(1,1
48,4
57)
(1,1
44,4
83)
(504
,262
)(6
71,3
34)
Tota
l net
exp
ense
(37,
537,
427)
(39,
918,
211)
(37,
889,
870)
(44,
507,
516)
(43,
856,
442)
(46,
115,
588)
(49,
873,
805)
(50,
211,
780)
(47,
764,
566)
(46,
720,
833)
Gen
eral
Rev
enue
s T
axes
In
com
e ta
xes
23,6
60,2
9925
,341
,919
25,6
07,2
2727
,526
,627
26,8
32,2
6931
,286
,014
37,0
37,6
3938
,381
,641
34,8
46,1
7937
,352
,248
P
rope
rty ta
xes,
levi
ed fo
r
ge
nera
l pur
pose
s6,
618,
088
6,70
6,27
97,
025,
307
7,13
4,61
57,
533,
530
8,08
6,77
88,
054,
971
8,22
0,41
98,
094,
861
8,11
7,86
0
Pro
perty
taxe
s, le
vied
for
debt
ser
vice
1,16
9,18
91,
192,
441
1,18
3,44
71,
205,
190
1,27
9,60
51,
304,
564
1,28
8,49
41,
303,
288
1,25
2,02
51,
276,
080
O
ther
taxe
s6,
992,
076
6,43
2,23
78,
302,
792
6,25
9,59
16,
829,
478
7,30
0,02
97,
849,
842
8,60
7,16
87,
464,
283
7,63
0,17
5 I
nves
tmen
t ear
ning
s2,
071,
226
1,38
1,77
978
0,23
151
3,45
698
3,30
81,
717,
776
2,09
4,84
21,
954,
419
2,96
3,72
01,
173,
152
Ref
unds
& re
imbu
rsem
ents
2,21
2,01
01,
306,
890
1,28
4,48
31,
182,
084
1,54
7,39
71,
327,
366
1,24
9,83
81,
296,
369
1,48
4,72
01,
516,
425
Mis
cella
neou
s41
8,08
772
3,75
843
6,46
712
0,42
124
3,09
532
7,12
224
4,84
625
3,92
822
1,70
117
9,15
0To
tal g
ener
al re
venu
es43
,140
,975
43,0
85,3
0344
,619
,954
43,9
41,9
8445
,248
,682
51,3
49,6
4957
,820
,472
60,0
17,2
3256
,327
,489
57,2
45,0
90C
hang
e in
Net
Ass
ets
$5,6
03,5
48$3
,167
,092
$6,7
30,0
84($
565,
532)
$1,3
92,2
40$5
,234
,061
$7,9
46,6
67$9
,805
,452
$8,5
62,9
23$1
0,52
4,25
7
(1)N
et (e
xpen
se)/r
even
ue is
the
diffe
renc
e be
twee
n th
e ex
pens
es a
nd p
rogr
am re
venu
es o
f a fu
nctio
n or
pro
gram
. It i
ndic
ates
the
degr
ee to
whi
ch a
func
tion
or p
rogr
am is
sup
porte
d w
ith it
s ow
nfe
es a
nd p
rogr
am-s
peci
fic g
rant
s ve
rsus
its
relia
nce
upon
fund
ing
from
taxe
s an
d ot
her g
ener
al re
venu
es. N
umbe
rs in
par
enth
eses
indi
cate
that
exp
ense
s w
ere
grea
ter t
han
prog
ram
reve
nues
and
ther
efor
e ge
nera
l rev
enue
s w
ere
need
ed to
fina
nce
that
func
tion
or p
rogr
am.
Num
bers
with
out p
aren
thes
es m
ean
that
pro
gram
reve
nues
wer
e m
ore
than
suf
ficie
nt to
cov
er e
xpen
ses.
59
CIT
Y O
F K
ETTE
RIN
G, O
HIO
60
SCH
EDU
LE 3
FUN
D B
ALA
NC
ES
, GO
VE
RN
ME
NTA
L FU
ND
SLA
ST
TEN
YE
AR
S (
mod
ified
acc
rual
bas
is o
f acc
ount
ing
)
2001
2002
2003
2004
2005
2006
2007
2008
2009
120
10G
ener
al F
und
R
eser
ved
$2,0
04,9
58$1
,658
,540
$1,9
19,1
31$2
,310
,521
$2,0
01,8
02$9
78,7
04$1
,309
,942
$873
,976
U
nres
erve
d26
,116
,746
25,3
20,0
3922
,751
,848
18,4
48,8
2219
,604
,920
21,8
88,7
5031
,525
,822
39,6
52,6
79
Non
spen
dabl
e$2
0,60
1$2
4,58
0
Com
mitt
ed85
1,91
764
2,66
4
Ass
igne
d23
7,01
910
4,71
7
Una
ssig
ned
39,3
47,7
0938
,823
,402
Tota
l gen
eral
fund
$28,
121,
704
$26,
978,
579
$24,
670,
979
$20,
759,
343
$21,
606,
722
$22,
867,
454
$32,
835,
764
$40,
526,
655
$40,
457,
246
$39,
595,
363
All
Oth
er G
over
nmen
tal F
unds
R
eser
ved
$6,9
95,1
71$6
,723
,658
$5,7
96,6
72$5
,176
,218
$5,9
44,4
95$7
,288
,657
$2,7
99,2
21$3
,621
,226
U
nres
erve
d, re
porte
d in
:
S
peci
al re
venu
e fu
nds
1,14
0,42
61,
662,
040
2,36
0,77
72,
481,
977
2,76
7,40
44,
314,
413
6,35
0,67
27,
336,
947
Deb
t ser
vice
fund
38,5
3346
,554
34,5
4915
,178
15,6
3816
,476
16,6
9712
,367
Cap
ital p
roje
ct fu
nd10
,445
10,3
0518
,903
10,4
6322
7,84
110
,046
1,19
6,32
819
,910
N
onsp
enda
ble,
repo
rted
in:
Spe
cial
reve
nue
fund
s$2
0587
8$1
4532
2
Yea
r
Spe
cial
reve
nue
fund
s$2
05,8
78$1
45,3
22
Res
trict
ed, r
epor
ted
in:
Spe
cial
reve
nue
fund
s10
,998
,459
12,2
49,1
53
D
ebt s
ervi
ce fu
nd71
5,12
779
7,68
5
C
apita
l pro
ject
fund
12,0
12,9
096,
834,
838
C
omm
itted
, rep
orte
d in
:
S
peci
al re
venu
e fu
nds
1,80
2,78
22,
266,
782
Cap
ital p
roje
ct fu
nd4,
101,
197
5,95
6,66
8
Una
ssig
ned,
repo
rted
in:
Spe
cial
reve
nue
fund
s(4
27,3
69)
(379
,052
)To
tal a
ll ot
her g
over
nmen
tal f
unds
$8,1
84,5
75$8
,442
,557
$8,2
10,9
01$7
,683
,836
$8,9
55,3
78$1
1,62
9,59
2$1
0,36
2,91
8$1
0,99
0,45
0$2
9,40
8,98
3$2
7,87
1,39
6
(1) F
und
bala
nce
clas
sific
atio
ns c
hang
ed in
200
9 du
e to
the
ado
ptio
n of
GA
SB
S
tate
men
t No.
54.
$0
$5,0
00
$10,
000
$15,
000
$20,
000
$25,
000
$30,
000
$35,
000
$40,
000
$45,
000
2001
2002
2003
2004
2005
2006
2007
2008
2009
120
10
Thousands
Gen
eral
Fun
d B
alan
ce
CIT
Y O
F K
ETTE
RIN
G, O
HIO
SCH
EDU
LE 4
CH
AN
GE
S IN
FU
ND
BA
LAN
CE
S, G
OV
ER
NM
EN
TAL
FUN
DS
LAS
T TE
N Y
EA
RS
(mod
ified
acc
rual
bas
is o
f acc
ount
ing
)20
0120
0220
0320
0420
0520
0620
0720
0820
0920
10R
EV
EN
UE
SIn
com
e ta
xes
$23,
866,
680
$25,
095,
930
$26,
033,
273
$26,
783,
319
$27,
221,
521
$31,
241,
870
$37,
128,
614
$38,
244,
422
$35,
321,
466
$36,
417,
018
Pro
perty
taxe
s7,
788,
476
7,89
6,91
98,
175,
853
8,33
9,30
48,
811,
235
9,43
3,04
19,
341,
465
9,39
9,50
79,
345,
887
9,39
1,64
0Li
cens
es a
nd p
erm
its39
2,91
750
6,42
956
7,65
460
6,61
748
8,59
854
1,45
756
7,74
262
6,29
052
8,82
349
1,32
2In
terg
over
nmen
tal r
even
ue10
,276
,158
10,0
43,8
0514
,669
,208
8,59
7,47
19,
156,
001
11,1
59,0
2311
,238
,227
10,1
58,8
9711
,890
,457
14,6
48,6
75C
harg
es fo
r ser
vice
s4,
223,
430
4,61
5,43
25,
448,
625
6,43
6,41
26,
925,
229
6,90
9,89
97,
517,
918
8,15
2,78
87,
663,
257
7,73
0,15
7Fi
nes
and
forfe
its1,
499,
038
1,74
0,34
41,
674,
642
1,68
1,73
51,
914,
989
1,76
2,07
51,
919,
736
1,86
7,00
51,
780,
070
1,83
5,34
4In
vest
men
t ear
ning
s2,
071,
226
1,38
1,77
978
0,22
851
3,45
698
3,30
81,
717,
776
2,09
4,84
21,
954,
417
2,96
3,72
11,
173,
151
Spe
cial
ass
essm
ents
1,25
1,36
21,
308,
754
1,02
4,87
11,
203,
717
1,40
2,80
590
2,76
797
8,01
41,
024,
719
1,00
6,87
91,
019,
237
Ref
unds
and
reim
burs
emen
ts2,
576,
280
1,62
6,96
21,
861,
388
1,74
3,82
83,
078,
251
2,31
8,40
91,
993,
372
2,89
8,42
72,
101,
691
2,93
1,42
0M
isce
llane
ous
538,
633
676,
389
669,
066
551,
897
503,
483
540,
471
555,
991
691,
840
555,
813
560,
693
Tota
l rev
enue
s54
,484
,200
54,8
92,7
4360
,904
,808
56,4
57,7
5660
,485
,420
66,5
26,7
8873
,335
,921
75,0
18,3
1273
,158
,064
76,1
98,6
57E
XP
EN
DIT
UR
ES
Cur
rent
: G
ener
al g
over
nmen
t9,
768,
669
10,9
80,7
1111
,320
,369
12,6
64,6
2211
,687
,503
13,1
05,7
9712
,117
,032
12,5
58,7
0512
,153
,096
12,4
76,5
29 P
olic
e10
,064
,525
10,4
29,3
9210
,786
,712
11,2
30,6
2511
,308
,886
12,9
01,7
1612
,828
,081
13,5
76,4
8113
,641
,191
13,9
76,5
71 F
ire7,
224,
511
7,27
5,87
77,
831,
880
8,58
5,92
98,
328,
226
8,15
2,88
08,
807,
160
9,55
3,06
59,
564,
579
11,0
28,9
98 P
ublic
wor
ks6,
897,
648
7,95
2,65
08,
173,
691
8,52
9,61
57,
674,
931
7,52
8,69
38,
117,
038
10,1
45,6
098,
514,
496
8,39
1,62
8 P
ublic
wor
ks6,
897,
648
7,95
2,65
08,
173,
691
8,52
9,61
57,
674,
931
7,52
8,69
38,
117,
038
10,1
45,6
098,
514,
496
8,39
1,62
8 L
eisu
re s
ervi
ces
9,33
5,12
210
,283
,469
10,4
38,0
3110
,352
,928
10,6
02,4
9810
,725
,786
11,3
87,2
6212
,487
,222
12,0
84,9
9212
,173
,718
Cap
ital i
mpr
ovem
ents
9,64
2,13
48,
405,
483
12,7
81,9
127,
778,
704
10,2
94,7
997,
966,
574
9,67
6,70
16,
652,
398
10,2
21,0
6218
,983
,100
Deb
t ser
vice
: P
rinci
pal
1,64
8,13
41,
718,
134
1,95
2,98
82,
057,
118
1,38
7,38
01,
313,
385
667,
018
642,
739
775,
290
1,02
1,13
4 I
nter
est
547,
930
465,
787
386,
244
301,
213
1,15
3,77
31,
178,
485
1,14
4,19
41,
140,
310
463,
231
672,
521
Tota
l exp
endi
ture
s55
,128
,673
57,5
11,5
0363
,671
,827
61,5
00,7
5462
,437
,996
62,8
73,3
1664
,744
,486
66,7
56,5
2967
,417
,937
78,7
24,1
99E
xces
s (d
efic
ienc
y) o
f r
even
ues
over
exp
endi
ture
s(6
44,4
73)
(2,6
18,7
60)
(2,7
67,0
19)
(5,0
42,9
98)
(1,9
52,5
76)
3,65
3,47
28,
591,
435
8,26
1,78
35,
740,
127
(2,5
25,5
42)
OTH
ER
FIN
AN
CIN
G S
OU
RC
ES
(US
ES
) T
rans
fers
in11
,583
,704
10,8
79,0
7011
,332
,160
12,4
55,7
318,
980,
139
10,6
57,4
278,
733,
378
9,83
5,39
615
,445
,122
15,2
21,1
32 T
rans
fers
out
(11,
583,
704)
(10,
879,
070)
(11,
332,
160)
(12,
455,
731)
(8,9
80,1
39)
(10,
657,
427)
(8,7
33,3
78)
(9,8
35,3
96)
(15,
445,
122)
(15,
221,
132)
Gen
eral
obl
igat
ion
debt
issu
ance
1,93
0,63
398
7,25
511
,140
303,
995
3,98
7,76
612
,539
,751
Sal
e of
city
ass
ets
258,
652
566,
362
216,
623
300,
302
83,7
3112
7,78
911
0,20
156
,640
69,2
4612
6,07
3
N
et c
hang
e in
fund
bal
ance
$1,5
44,8
12($
1,06
5,14
3)($
2,53
9,25
6)($
4,43
8,70
1)$2
,118
,921
$3,7
81,2
61$8
,701
,636
$8,3
18,4
23$1
8,34
9,12
4($
2,39
9,46
9)D
ebt s
ervi
ce a
s a
perc
enta
ge o
f n
onca
pita
l exp
endi
ture
s4.
91%
4.55
%4.
72%
4.50
%4.
97%
4.60
%3.
29%
2.96
%2.
16%
2.85
% 61
($10
,000
)
($5,
000)$0
$5,0
00
$10,
000
$15,
000
$20,
000
Thousands
Net
Cha
nge
in F
und
Bal
ance
, Gov
ernm
enta
l Fun
ds
62 CITY OF KETTERING, OHIOSCHEDULE 5
INCOME TAX BY PAYER TYPE AND INCOME TAX RATELAST TEN YEARS (cash basis of accounting )
Total IncomeYear Withholding Non-withholding Individual Corporate Partnership Total Tax Rate
Source: City of Kettering, Ohio, Finance DepartmentThe City levies a 2.25% income tax on substantially all income earned within the City. Additional increases in the income taxrate require voter approval. City residents pay City income tax on income earned outside the City, however; a credit is allowedfor income taxes paid to other municipalities. Employers within the City withhold income tax on employee compensation andremit at least quarterly.
Individual
2025 30 35 40 45
lions
Income Tax Revenues
SCHEDULE 6RANKING OF TOP TEN INCOME TAX WITHHOLDERS CURRENT YEAR AND TEN YEARS AGO (cash basis of accounting )
Rank Name 2010 Rank Rank Name1 Kettering Medical Center - 1 Delphi Automotive Systems LLC2 GE Money 1 2 Kettering Medical Center3 Reynolds & Reynolds Company 4 3 Federal Government4 Federal Government 3 4 Reynolds & Reynolds Company5 Kettering Board of Education 5 5 Kettering Board of Education6 Eastman Kodak Company 21 6 Monogram Services Co LLC7 City of Kettering 61 7 Scitex Digital Printing Inc.8 Meadwestvaco Corporation 7 8 City of Kettering9 Limited Brands Inc. & Subs 91 9 Intimate Brands Inc.
10 Time Warner Entertainment Inc. - 10 Reed Elsevier Inc.Combined percentage of Combined percentage of Total Income taxes 26.2% Total Income taxes 33.8%
Source: City of Kettering, Ohio, Finance DepartmentDue to legal restrictions and confidentiality requirements, the City cannot disclose the amount of withholdings by taxpayer. The City chose not to disclose percentages and number of filers by income level because the City does not require all taxpayers to file a return, therefore it does not have, nor can it obtain, this type of information.
(1) GE Money reports the activity formerly known as Monogram Services Co LLC.; Scitex Digital Printing Inc. was purchased by Eastman Kodak Company; Limited Brands Inc. & Subs reports the activity formerly known as Intimate Brands Inc.
20002010
0 5
10 15 20
2001 2002 2003 2004 2005 2006 2007 2008 2009 2010
Mil
CIT
Y O
F K
ETTE
RIN
G, O
HIO
SCH
EDU
LE 7
RAT
IOS
OF
OU
TSTA
ND
ING
DEB
T BY
TYP
E AN
D L
EGAL
DEB
T M
ARG
INS
- LAS
T TE
N Y
EAR
S
2001
2002
2003
2004
2005
2006
2007
2008
2009
2010
Gen
eral
Obl
igat
ion
Bon
ds$7
,514
,792
$5,9
66,9
77$4
,349
,119
$2,6
43,5
54$5
,563
,536
$4,5
64,3
39$4
,218
,631
$3,8
79,2
70$1
5,68
9,89
9$1
4,96
3,21
7
Per
cent
of e
stim
ated
act
ual p
rope
rty v
alue
0.24
%0.
19%
0.13
%0.
08%
0.16
%0.
12%
0.11
%0.
10%
0.44
%0.
42%
P
er c
apita
131
104
7646
9779
7367
273
266
Spe
cial
Ass
essm
ent B
onds
1,19
3,56
01,
094,
375
990,
233
905,
798
816,
127
720,
807
619,
149
510,
730
395,
101
271,
783
Pro
mis
sory
Not
es2,
545,
494
3,46
1,61
53,
241,
766
3,27
8,64
43,
075,
818
2,85
6,94
92,
637,
298
2,44
2,33
82,
272,
048
2,10
0,91
4To
tal G
ross
Inde
bted
ness
11,2
53,8
4610
,522
,967
8,58
1,11
86,
827,
996
9,45
5,48
18,
142,
095
7,47
5,07
86,
832,
338
18,3
57,0
4817
,335
,914
P
erce
ntag
e of
per
sona
l inc
ome
0.70
%0.
65%
0.50
%0.
40%
0.53
%0.
44%
0.39
%0.
35%
1.02
%0.
96%
P
er c
apita
196
183
149
119
164
142
130
119
319
309
Less
deb
t out
side
lim
itatio
ns:
Spe
cial
Ass
essm
ent D
ebt
1,19
3,56
01,
094,
375
990,
233
905,
798
816,
127
720,
807
619,
149
510,
730
395,
101
271,
783
Pi
Nt
254
549
43
461
615
324
176
63
278
644
307
581
82
856
949
263
729
82
442
338
227
204
82
100
914
Pro
mis
sory
Not
es2,
545,
494
3,46
1,61
53,
241,
766
3,27
8,64
43,
075,
818
2,85
6,94
92,
637,
298
2,44
2,33
82,
272,
048
2,10
0,91
4Le
ss d
ebt s
ervi
ce fu
nd b
alan
ce38
,533
46,5
5434
,549
15,1
7815
,638
16,4
7616
,697
12,3
6771
5,12
779
7,68
5N
et d
ebt w
ithin
lim
itatio
ns fo
r bo
th V
oted
and
Unv
oted
deb
t7,
476,
259
5,92
0,42
34,
314,
570
2,62
8,37
65,
547,
898
4,54
7,86
34,
201,
934
3,86
6,90
314
,974
,772
14,1
65,5
32
Deb
t lim
itatio
n fo
r bot
h V
oted
and
Unv
oted
deb
t
10.5
% o
f ass
esse
d va
luat
ion
115,
633,
711
114,
650,
117
124,
670,
352
122,
665,
459
122,
629,
124
134,
354,
645
132,
966,
025
131,
355,
181
129,
749,
975
131,
262,
545
Lega
l deb
t mar
gin
for V
oted
and
Unv
oted
deb
t$1
08,1
57,4
52$1
08,7
29,6
94$1
20,3
55,7
82$1
20,0
37,0
83$1
17,0
81,2
26$1
29,8
06,7
82$1
28,7
64,0
91$1
27,4
88,2
78$1
14,7
75,2
03$1
17,0
97,0
13N
et d
ebt w
ithin
lim
itatio
ns fo
r bot
h V
oted
and
U
nvot
ed d
ebt a
s a
perc
enta
ge o
f deb
t lim
it6.
47%
5.16
%3.
46%
2.14
%4.
52%
3.38
%3.
16%
2.94
%11
.54%
10.7
9%
Net
deb
t with
in li
mita
tions
for
both
Vot
ed a
nd U
nvot
ed li
mita
tion
$7,4
76,2
59$5
,920
,423
$4,3
14,5
70$2
,628
,376
$5,5
47,8
98$4
,547
,863
$4,2
01,9
34$3
,866
,903
$14,
974,
772
$14,
165,
532
Less
vot
ed d
ebt
3,11
4,35
22,
264,
352
1,36
9,35
242
9,35
229
4,66
318
0,14
782
,780
012
,075
,000
11,6
25,0
00N
et d
ebt w
ithin
lim
itatio
ns fo
r U
nvot
ed d
ebt
4,36
1,90
73,
656,
071
2,94
5,21
82,
199,
024
5,25
3,23
54,
367,
716
4,11
9,15
43,
866,
903
2,89
9,77
22,
540,
532
Deb
t lim
itatio
n fo
r Unv
oted
deb
t
5.5%
of a
sses
sed
valu
atio
n60
,570
,039
60,0
54,8
2365
,303
,518
64,2
53,3
3664
,234
,303
70,3
76,2
4369
,648
,870
68,8
05,0
9567
,964
,273
68,7
56,5
71
Lega
l deb
t mar
gin
for U
nvot
ed d
ebt
$56,
208,
132
$56,
398,
752
$62,
358,
300
$62,
054,
312
$58,
981,
068
$66,
008,
527
$65,
529,
716
$64,
938,
192
$65,
064,
501
$66,
216,
039
Net
deb
t with
in li
mita
tions
for U
nvot
ed
debt
as
a pe
rcen
tage
of d
ebt l
imit
7.20
%6.
09%
4.51
%3.
42%
8.18
%6.
21%
5.91
%5.
62%
4.27
%3.
69%
Sou
rce:
City
of K
ette
ring,
Ohi
o, F
inan
ce D
epar
tmen
t
63
64 CITY OF KETTERING, OHIOSCHEDULE 8
DIRECT AND OVERLAPPING DEBTDECEMBER 31, 2010
Percentage AmountState of Ohio Applicable Applicable
Net Debt to City of to City ofJurisdiction Outstanding Kettering1 Kettering
City of Kettering $16,266,446 100.0% $16,266,446
Overlapping debt: Kettering City School District 90,975,597 92.0% 83,706,647 Montgomery County 38,125,456 12.3% 4,689,431 Beavercreek Local School District 107,154,199 0.9% 964,388Total overlapping debt 236,255,252 89,360,466Total direct and overlapping debt $252,521,698 $105,626,912
Source: Individual jurisdictions. (1) The percentage of overlapping debt applicable is estimated using assessed property values. Applicable percentages were estimated by determining the portion of another governmental unit's assessed value that is within the City's boundaries and dividing it by each unit's total assessed value. Individual jurisdictions with immaterial amounts of overlapping debt are excluded from this table.
SCHEDULE 9DEMOGRAPHIC AND ECONOMIC STATISTICSLAST TEN YEARS
Per capita Avg Sale Price Personal Unemployment for a Single Total Assessed Estimated Actual
Year Population 1 Personal Income 2 Income 1,2 Rate 3 Family Home 4 Property Value 5 Property Value 5Year Population Personal Income Income Rate Family Home Property Value Property Value2001 57,502 1,604,823,318 27,909 2.7% 123,524 1,101,273,442 3,174,922,0552002 57,502 1,614,541,156 28,078 3.5% 132,529 1,091,905,872 3,167,681,9642003 57,502 1,711,087,014 29,757 5.1% 138,690 1,187,336,684 3,433,251,0922004 57,502 1,719,884,820 29,910 5.4% 135,081 1,168,242,464 3,453,224,8122005 57,502 1,787,162,160 31,080 5.3% 141,345 1,167,896,415 3,423,470,5492006 57,502 1,840,777,025 32,012 4.7% 137,664 1,279,568,048 3,789,173,6342007 57,502 1,895,821,619 32,970 5.1% 136,445 1,266,343,094 3,826,742,5302008 57,502 1,952,885,850 33,962 6.2% 124,105 1,251,001,727 3,906,048,8872009 57,502 1,803,685,371 31,367 10% 121,340 1,235,714,050 3,567,340,6822010 56,163 1,859,630,280 33,111 10% 125,734 1,250,119,480 3,583,279,738
(1) 2000 & 2010 United States Census Bureau.(2) City of Kettering, Ohio, Finance Department.(3) Ohio Bureau of Employment Services.(4) Dayton Area Board of Realtors, Dayton, Ohio (2010 price range: $15,110 - $1,100,000).(5) Montgomery County, Ohio, Auditor's Office.
0.0%
2.0%
4.0%
6.0%
8.0%
10.0%
12.0%
01 02 03 04 05 06 07 08 09 10 Year
Unemployment Rate
city
state
nation
10,000
15,000
20,000
25,000
30,000
35,000
40,000
01 02 03 04 05 06 07 08 09 10
Per Capita Personal Income
CITY OF KETTERING, OHIO 65
SCHEDULE 10PRINCIPAL EMPLOYERSCURRENT YEAR AND NINE YEARS AGO
2001% of % of
Total City Total City Employer Employees Employment Employer Employees Employment
Kettering Medical Center 3,300 13.04% Kettering Medical Center 3,200 10.63%GE Money 1,400 5.53% Delphi Automotive Systems 2,800 9.30%Reynolds & Reynolds Company 1,300 5.14% Victoria's Secret Catalog1 1,200 3.99%Kettering City Schools 1,032 4.08% GE Card Services2 1,200 3.99%Limited Brands Inc. 1,000 3.95% Kettering City Schools 900 2.99%City of Kettering 900 3.56% City of Kettering 900 2.99%Eastman Kodak Company 703 2.78% Reynolds & Reynolds Company 700 2.33%Kroger 630 2.49% Scitex Digital Printing3 650 2.16%Meijer Inc. 300 1.19% Defense Finance and Accounting Services 500 1.66%
Total 10,565 41.76% Total 12,050 40.03%
Source: City of Kettering, Ohio, Office of Economic Development(1) Limited Brands Inc. owns Victoria's Secrect Catalog (3) Scitex Digital Printing was purchased by Eastman Kodak Company(2) GE Card Services is now GE Money
SCHEDULE 11CITY GOVERNMENT EMPLOYEES BY FUNCTION/PROGRAM (full-time equivalents)LAST TEN YEARS
(1) City of Kettering, Human Resources Department (2) City of Kettering, Planning and Development Dept. Permits and inspections performed include Building, Electrical, Plumbing & Heating.(2) City of Kettering, Planning and Development Dept. Permits and inspections performed include Building, Electrical, Plumbing & Heating.(3) City of Kettering, Planning and Development Department. Community Development Block Grant (CDBG) loan applications processed include housing rehabilitation, purchase rehabilitation, and business loan applications.(4) City of Kettering, Finance Department. Payroll checks include electronic funds transfers processed for payroll.(5) City of Kettering, Finance Department.(6) City of Kettering, Law Department(7) City of Kettering, Municipal Court(8) City of Kettering, Police Department. Criminal arrests include arrests by detective section and patrol.(9) City of Kettering, Police Department.(10) City of Kettering, Fire Department.(11) City of Kettering, Public Service Department, Engineering Division(12) City of Kettering, Public Service Department, Street Division(13) City of Kettering, Parks, Recreation, and Cultural Arts Department
SCHEDULE 13CAPITAL ASSET AND INFRASTRUCTURE STATISTICS BY FUNCTION/PROGRAMLAST TEN YEARSFunction/program 2001 2002 2003 2004 2005 2006 2007 2008 2009 2010General Government Square footage occupied1 25,582 25,582 25,582 25,582 43,108 43,108 43,108 54,933 54,933 54,933Police Stations1 1 1 1 1 1 1 1 1 1 1 Square footage of building1 16,515 16,515 16,515 16,515 16,515 16,515 16,515 16,515 16,515 16,515Fire Stations1 7 7 7 7 7 7 7 7 7 7Public Works Miles of roads2 246 246 246 246 246 246 246 246 246 246 Miles of storm sewer/channel2 173 174 174 175 175 175 175 175 175 175Leisure Services Number of parks3 21 21 21 21 21 21 21 21 21 21 Area of parks (acres)3 408 419 419 419 419 419 419 419 419 419 Recreation complexes square ft1 145,000 145,000 145,000 145,000 153,512 153,512 153,512 153,512 153,512 161,119
(1) City of Kettering, Facilities Department (2) City of Kettering, Public Service Department, Engineering Division(3) City of Kettering, Parks, Recreation, and Cultural Arts Department
Expenses Expenses Expenses
Description 2009 2010 2011
Salaries 503,195.08$ 494,068.55$ 504,417.42$
Benefits* 174,417.47$ 175,446.39$ 183,230.72$
Total Salary and Benfits 677,612.55$ 669,514.94$ 687,648.14$
Management’s Discussion and Analysis ........................................................................................... 3-11
Statement of Net Assets –Cash Basis ................................................................................................. 12
Statement of Activities –Cash Basis ..................................................................................................... 13
Statement of Assets and Fund Balances –Cash Basis – Governmental Funds ................................... 14
Statement of Cash Receipts, Disbursements and Changes in Fund Balances –Cash Basis – Governmental Funds ....................................................................... 15
Statement of Receipts, Disbursements and Changes in Fund Balances – Budget and Actual (Budget Basis) – General Fund ...................................................................................... 16
Statement of Fiduciary Net Assets –Cash Basis – Fiduciary Funds..................................................... 17
Notes to the Basic Financial Statements ........................................................................................ 18-28
Report on Internal Control Over Financial Reporting and on Compliance and Other Matters Based on an Audit of Financial Statements Performed in Accordance with Government Auditing Standards ..................................................................... 29-30
2525 north limestone street, ste. 103 springfield, oh 45503
www.cshco.com p. 937.399.2000 f. 937.399.5433
cincinnati | columbus | dayton | middletown | springfield
INDEPENDENT AUDITORS’ REPORT Board of Trustees Dayton Metro Library 215 East Third Street Dayton, Ohio 45402 We have audited the accompanying financial statements of the governmental activities, each major fund and the aggregate remaining fund information of Dayton Metro Library (the Library), as of and for the year ended December 31, 2008, which collectively comprise the Library’s basic financial statements as listed in the table of contents. These financial statements are the responsibility of management. Our responsibility is to express opinions on these financial statements based on our audit. We conducted our audit in accordance with auditing standards generally accepted in the United States of America and the standards applicable to financial audits contained in the Comptroller General of the United States’ Government Auditing Standards. Those standards require that we plan and perform the audit to reasonably assure whether the financial statements are free of material misstatement. An audit includes examining on a test basis, evidence supporting the amounts and disclosures in the financial statements. An audit also includes assessing the accounting principles used and significant estimates made by management, as well as evaluating the overall financial statement presentation. We believe our audit provides a reasonable basis for our opinions. As discussed in Note 2, the accompanying financial statements and notes follow the cash basis of accounting. This is a comprehensive basis of accounting other than generally accepted accounting principles. In our opinion, the financial statements referred to above present fairly, in all material respects, the respective cash basis financial position of the governmental activities, each major fund and the aggregate remaining fund information of Dayton Metro Library, as of December 31, 2008, and the respective changes in cash basis financial position and the respective budgetary comparisons for the General Fund for the year then ended in conformity with the accounting basis Note 2 describes. In accordance with Government Auditing Standards, we have also issued our report dated May 6, 2009, on our consideration of the Library’s internal control over financial reporting and our tests of its compliance with certain provisions of laws, regulations, contracts and grant agreements and other matters. That report describes the scope of our testing of internal control over financial reporting and compliance and the results of that testing, not to provide an opinion on the internal control over financial reporting on compliance. That report is an integral part of an audit performed in accordance with Government Auditing Standards and should be considered in assessing the results of our audit.
The Management’s Discussion and Analysis is not a required part of the basic financial statements but is supplementary information the Governmental Accounting Standards Board requires. We have applied certain limited procedures, which consisted principally of inquiries of management regarding the methods of measurement and presentation of the required supplementary information. However, we did not audit the information and express no opinion on it.
Springfield, Ohio May 6, 2009
- 2 -
Dayton Metro Library Management’s Discussion and Analysis For the Year Ended December 31, 2008
Unaudited
The management’s discussion and analysis of the Dayton Metro Library’s (the Library) financial performance provides an overall review of the Library’s financial activities for the year ended December 31, 2008, within the limitations of the Library’s cash basis of accounting. The intent of the management’s discussion and analysis is to examine the Library’s financial performance as a whole. Readers should also review the basic financial statements and notes to enhance their understanding of the Library’s financial performance.
Financial Highlights
Key financial highlights for 2008 are as follows:
� Net assets of governmental activities increased $1,451,267, or 7.0%. The fund most affected by the increase in cash and cash equivalents was the General Fund. Although expenditures for the year increased and receipts from governmental activities decreased, additional receipts generated from the 2004 tax levy were sufficient to maintain funds for future capital improvements. This five-year operating levy is set to expire in 2009.
� The Library’s general receipts are primarily made up of property and other local taxes ($8,303,677) and other government grants-in-aid, such as the State’s Public Library Fund (PLF) ($20,760,585). These receipts represent respectively 27.0% and 67.7% of the total cash received for governmental activities during the year. Property and other local tax receipts for 2008 were less than 2007, primarily due to the phase out of the tangible personal property tax.
� Receipts from Grants and Entitlements not restricted to Specific Programs reflect an increase of $288,860 over 2007, due primarily to a reclassification of certain miscellaneous receipts in the 2008 financial statements.
� Program specific receipts in the form of charges for services and sales, and operating grants and contributions represent $810,098 or 2.6% of total receipts. This revenue is primarily comprised of charges for maintaining public service programs.
� Due to the worldwide recession and its impact on the financial markets, interest rates rapidly decreased in the latter half of 2008 having a dramatic negative effect on investment receipts. Investment receipts dropped from $1,088,518 in 2007 to $598,174 a 45% decrease. In 2008, the Library did invest certain inactive funds in CDARS (Certificate of Deposit Account Registry Service) for public funds that produced a higher yield than savings or money market demand accounts. The average interest rate in 2008 was 2.46% as compared to 5.04% in 2007. The average investment yield was 5.25% in January 2007 and had dropped to 1.41% by December 2008.
Using This Annual Financial Report
This annual report is presented in a format consistent with the presentation requirements of Governmental Accounting Standards Board Statement No. 34, as applicable to the Library’s cash basis of accounting.
This annual report consists of a series of financial statements and notes to those statements. These statements are prepared and organized so the reader can understand the Library as a financial whole or as
- 3 -
Dayton Metro Library Management’s Discussion and Analysis For the Year Ended December 31, 2008
Unaudited
an entire operating entity. The statements provide a detailed look at the Library’s specific financial activities and conditions on a cash basis of accounting.
Financial Report Components
The statement of net assets and the statement of activities provide information about the cash activities of the Library as a whole.
Fund financial statements provide a greater level of detail. Funds are created and maintained on the financial records of the Library as a way to segregate money whose use is restricted to a particular specified purpose. These statements present financial information by fund, presenting funds with the largest balances or most activity in separate columns.
The notes to the financial statements are an integral part of the government-wide and fund financial statements and provide expanded explanation and detail regarding the information reported in the statements.
Basis of Accounting
The basis of accounting is a set of guidelines that determine when financial events are recorded. The Library has elected to present its financial statements on a cash basis of accounting. This basis of accounting is a basis of accounting other than generally accepted accounting principles. Under the Library’s cash basis of accounting, receipts and disbursements are recorded when cash is received or paid.
As a result of using the cash basis of accounting, certain assets and their related receipts (such as accounts receivable) and certain liabilities and their related expenses (such as accounts payable) are not recorded in the financial statements. Therefore, when reviewing the financial information and discussion within this report, the reader must keep in mind the limitations resulting from the use of the cash basis of accounting.
Reporting the Library as a Whole
The statement of net assets and the statement of activities reflect how the Library did financially during 2008, within the limitations of cash basis accounting. The statement of net assets presents the cash balances and investments of the governmental activities of the Library at year end. The statement of activities compares cash disbursements with program receipts for each governmental program. Program receipts include charges paid by the recipient of the program’s goods or services and grants and contributions restricted to meeting the operational or capital requirements of a particular program. General receipts are all receipts not classified as program receipts. The comparison of cash disbursements with program receipts identifies how each governmental function activity draws from the Library’s general receipts.
These statements report the Library’s cash position and the changes in cash position. Keeping in mind the limitations of the cash basis of accounting, you can think of these changes as one way to measure the Library’s financial health. Over time, increases or decreases in the Library’s cash position is one indicator of whether the Library’s financial health is improving or deteriorating. When evaluating the Library’s financial condition, you should also consider other non-financial factors as well, such as the
- 4 -
Dayton Metro Library Management’s Discussion and Analysis For the Year Ended December 31, 2008
Unaudited
Library’s property tax base, the condition of the Library’s capital assets, the extent of the Library’s debt obligations, the reliance on non-local financial resources for operations and the need for continued growth in the major local revenue sources such as property taxes.
The statement of net assets and the statement of activities are comprised of governmental activities only:
Governmental activities – The Library’s services, support services and capital outlay are reported here. Property and other local taxes and government grants-in-aid finance most of these activities. Benefits provided through governmental activities are not necessarily paid for by the people receiving them.
Reporting the Library’s Most Significant Funds
Fund financial statements provide detailed information about the Library’s major funds – not the Library as a whole. The Library establishes separate funds to better manage its many activities and to help demonstrate that money that is restricted as to how it may be used is being spent for the intended purpose. The funds of the Library are split into two categories: governmental and fiduciary.
Governmental Funds - Most of the Library’s activities are reported in governmental funds. The governmental fund financial statements provide a detailed view of the Library’s governmental operations and the basic services it provides. Governmental fund information helps determine whether there are more or less financial resources that can be spent to finance the Library’s programs. The Library’s significant governmental funds are presented on the financial statements in separate columns. The information for non-major funds (funds whose activity or balances are not large enough to warrant separate reporting) is combined and presented in total in a single column. The Library’s major governmental funds are the General Fund and the Building and Repair Fund. The programs reported in governmental funds are identical to those reported in the governmental activities section of the entity-wide statements.
Fiduciary Funds - Fiduciary funds are used to account for resources held for the benefit of parties outside the Library. Fiduciary funds are not reflected on the government-wide financial statements because the resources of these funds are not available to support the Library’s programs. The Library has one fiduciary fund, an agency fund for a flexible spending benefit account.
- 5 -
Dayton Metro Library Management’s Discussion and Analysis For the Year Ended December 31, 2008
Unaudited
The Library as a Whole
Table 1 provides a summary of the Library’s net assets for 2008 compared to 2007 on a cash basis:
Net Assets:Restricted $246,097 $239,951 $6,146Unrestricted 21,964,590 20,519,469 1,445,121Total Net Assets $22,210,687 $20,759,420 $1,451,267
Governmental Activities
Net Assets - Cash Basis(Table 1)
As mentioned previously, net assets of governmental activities increased $1,451,267 or 7.0 percent during 2008. Although expenditures increased by 4.6% and receipts decreased by 2.5%, due to the additional receipts generated from the 2004 property tax levy, the Library was able to sufficiently control expenditures. These additional resources are presently earmarked to assist in financing infrastructure improvements that the Library has determined are warranted as outlined in the Library’s Strategic and Facilities plans.
- 6 -
Dayton Metro Library Management’s Discussion and Analysis For the Year Ended December 31, 2008
Unaudited
Table 2 reflects the changes in net assets on a cash basis in 2008 and 2007 for governmental activities.
(Table 2)Changes in Net Assets
GovernmentalActivities
2008 2007Receipts:Program Receipts: Charges for Services and Sales $725,979 $650,772 Operating Grants and Contributions 84,119 66,136Total Program Receipts 810,098 716,908General Receipts: Property and Other Local Taxes 8,303,677 8,950,282 Unrestricted Gifts and Contributions 21,861 52,607 Sale of Capital Assets 208 4,484 Other Taxes Payments in Lieu of Taxes Special Assessments Grants and Entitlements Not Restricted 20,760,585 20,471,725 to Specific Programs Interest 598,174 1,088,518 Miscellaneous 149,386 143,223Total General Receipts 29,833,891 30,710,839Total Receipts 30,643,989 31,427,747
Disbursements:Library Services: Public Service and Programs 17,463,256 16,024,686 Collection Development and Processing 6,895,649 6,388,389Support Services: Facilities Operation and Maintenance 499,147 465,451 Information Services Support 881,057 804,838 Business Administration 2,546,515 2,936,278Capital Outlay 907,098 1,280,981 Sewer TrashTotal Disbursements 29,192,722 27,900,623
Increase (Decrease) in Net Assets 1,451,267 3,527,124
Net Assets, January 1 20,759,420 17,232,296Net Assets, December 31 $22,210,687 $20,759,420
Program receipts represent only 2.6 percent of total receipts and are primarily comprised of patron fees, grants, contributions and services provided to other entities.
- 7 -
Dayton Metro Library Management’s Discussion and Analysis For the Year Ended December 31, 2008
Unaudited
General receipts represent 97.4% of the Government’s total receipts, and of this amount, approximately 27.1% are property and other local taxes. Earnings on investments account for 2.0% of the general receipts. State grants and entitlements comprise 69.6% of the Library’s general receipts.
Disbursements for library services consist of expenses for public service and program and collection development and processing. Library service costs for 2008 were 83.4% of total disbursements. Disbursement for support services consist of expenses for facilities operations and maintenance, information services support, and business administration. Support service costs for 2008 represented 13.5% of total disbursements.
Capital Outlay expenditures of $907,098 represented 3.1% of expenditures and were primarily for the following:
� Library furnishings, including shelving and computer hardware and software. � The Library purchased a 2006 Chevy Express Van to replace the 1993 Aerostar Van for a cost of
$17,258. � Digital video security systems were installed at the Miami Township, Burkhardt, Westwood,
Madden Hills, Huber Heights, and Trotwood branches of the Library for a cost of $48,314. � Sixteen self-check stations were added to six branches. These stations, at a total cost of
$159,632, allow patrons to check-out their circulation items without needing an employee to wait on them. Employees will have more time to spend helping patrons to research and locate the items that they need.
Governmental Activities
If you look at the Statement of Activities on page13, you will see that the first column lists the major services provided by the Library. The next column identifies the costs of providing these services. The major program disbursements for governmental activities are for public service and programs and collection development and processing, which account for 59.8% and 23.6% of all governmental disbursements, respectively. Business administration, facilities operations, and information services support represents 13.5% of all government spending. The next two columns of the statement entitled Program Cash Receipts identify amounts paid by individuals and organizations that are directly charged for services or grants received by the Library that must be used to provide a specific service. The Net Receipt (Disbursement) column compares the program receipts to the cost of the service. This “net cost” amount represents the cost of the service which ends up being paid from money provided by local taxpayers and grants, entitlements, interest earnings and other miscellaneous receipts. These net costs are paid from the general receipts which are presented at the bottom of the Statement. A comparison between the total cost of services and the net cost of services for 2008 and 2007 is presented in Table 3.
- 8 -
Dayton Metro Library Management’s Discussion and Analysis For the Year Ended December 31, 2008
Unaudited
(Table 3)
Total Cost Net Cost Total Cost Net Costof Service of Service of Service of Service
Library Services: Public Service and Programs $17,463,256 ($16,855,778) $16,024,686 ($15,445,086) Collection Development and Processing 6,895,649 (6,792,937) 6,388,389 (6,335,618)Support Services: Facilities Operation and Maintenance 499,147 (499,147) 465,451 (465,451) Information Services Support 881,057 (781,149) 804,838 (720,301) Business Administration 2,546,515 (2,546,515) 2,936,278 (2,936,278) Capital Outlay 907,098 (907,098) 1,280,981 (1,280,981)
Total Expenses $29,192,722 ($28,382,624) $27,900,623 ($27,183,715)
Governmental Activities2008 2007
Library Service expenditures increase by $1,945,830 or 8.6% versus 2007 primarily attributable to increase expenditures in wages, benefits, and acquisition of library materials.
Library Service salaries and wages increased $373,522 or 3.6% over 2007. Benefit costs, mainly driven by an increase in health insurance premiums were $412,159 or 12.6% over 2007. Consistent with our strategic initiatives, library material expenditures increased by $325,292 or 7.4% over 2007.
In addition, we reclassified purchased services previously classified as Business Administration overhead expenditures, mainly utilities, to public service expenditures to more accurately reflect the cost of maintaining operations for the public. This reclassification represents approximately $500,000.
The dependence upon property tax receipts and unrestricted grants and entitlements is apparent as over 97.2% of governmental activities are supported through these general receipts.
The Library’s Funds
As illustrated on the Statement of Cash Receipts, Disbursements, and Changes in Fund Balance – Governmental Funds on page 15, total governmental funds had receipts of $30,643,781 and disbursements of $29,192,722. The General Fund is the chief operating fund of the Library. The fund balance of the General Fund increased $1,156,736.
As illustrated on the Statement of Assets and Fund Balances – Governmental Funds on page 14, at the end of the current fiscal year, unreserved fund balance of the General Fund was $7,212,064, while the total General Fund balance reached $8,668,774. As a measure of the General Fund’s liquidity, it may be useful to compare both unreserved fund balance and total fund balance to total fund expenditures. Unreserved fund balance represents 24.8% of total General expenditures, while total fund balance represents 29.9% of that same amount.
- 9 -
Dayton Metro Library Management’s Discussion and Analysis For the Year Ended December 31, 2008
Unaudited
General Fund Budgeting Highlights
The Library’s budget is prepared according to Ohio law and is based upon accounting for certain transactions on a basis of cash receipts, disbursements, and encumbrances. The most significant budgeted fund is the General Fund.
As illustrated on the Statement of Receipts, Disbursements and Changes in Fund Balance – Budget and Actual – General Fund on page 16, final receipts were budgeted at $30,256,354 while actual receipts were $30,300,337. The difference between final budgeted receipts and actual receipts was $43,983. Other financing sources of actual receipts included $208 for the sale of personal property.
Final disbursements were budgeted at $34,113,832 while actual disbursements were $30,498,191. The Library kept spending below budgeted amounts as demonstrated by the reported variances, but slightly above realized receipts.
In addition, the Library made $102,328 in transfers from the general fund to other governmental funds; the net result is the decrease in the General Fund balance of $299,974 for 2008.
Capital Assets
The Library does not report capital assets on its financial statements. The Library does keep track of its capital assets and infrastructure independently. The Library uses a separate software package to accomplish this task. In 2008, the inventory information was internally audited by the Finance Department and corrections, deletions, and additions were recorded.
Debt
The Library has no debt.
Current Issues
With few exceptions Ohio’s public libraries depend on the State of Ohio for the majority of their funding. Funds are generated and distributed by the Public Library Fund (PLF). The Public Library Fund, as outlined in the Ohio Revised Code, represents 2.22% of the State’s total general fund tax receipts. Due to the deteriorating economic conditions within the State of Ohio and the United States economy general fund tax receipts declined in 2008. Further erosion of the state’s tax receipts are expected to continue in to 2010 and depending on the depth of the current recession, declines in state receipts may continue well into 2011.
The Library is partially shielded from this decline in state support by the 1.25 mill operating levy approved by voters in 2004. Most libraries in the state have no operating levy support. For the Library its levy has provided more than 30% of its receipts and has enabled the library to spend nearly $65 per capita on library services. However, the five year term of the levy will expire in December 2009.
Partially due to the sharp decline in state funding in 2008 and 2009 coupled with a record level of demand for library services, our current financial forecast for 2009 predicts a deficit to be funded by reserves, but only for 2009. The Library Board of Trustees intends to seek voter approval for a replacement levy in 2009 with new funding to replace the losses in state funding and to provide additional funding to meet anticipated service demands.
- 10 -
Dayton Metro Library Management’s Discussion and Analysis For the Year Ended December 31, 2008
Unaudited
Contacting the Library’s Financial Management
This financial report is designed to provide our citizens, taxpayers, investors, and creditors with a general overview of the Library’s finances and to reflect the Library’s accountability for the money it receives, spends and invests. Questions concerning any of the information in this report or requests for additional information should be directed to Mr. Timothy Kambitsch, Executive Director/Fiscal Officer, Dayton Metro Library, 215 East Third Street, Dayton, Ohio 45402-2103. We also offer information regarding the Dayton Metro Library on our web site, www.daytonmetrolibrary.org.
- 11 -
Dayton Metro LibraryMontgomery County
Statement of Net Assets - Cash BasisDecember 31, 2008
GovernmentalActivities
AssetsEquity in Pooled Cash and Cash Equivalents 21,964,590$Restricted Assets: Cash and Cash Equivalents 246,097
Total Assets 22,210,687$
Net AssetsRestricted for: Endowment 246,097$Unrestricted 21,964,590
Total Net Assets 22,210,687$
See accompanying notes to the basic financial statements
- 12 -
Net (Disbursements)Receipts and Changes
Program Cash Receipts in Net Assets
Charges OperatingCash for Services Grants and Governmental
Disbursements and Sales Contributions Activities
Governmental Activities Library Services: Public Service and Programs 17,463,256$ 602,424$ 5,054$ (16,855,778)$ Collection Development and Processing 6,895,649 23,647 79,065 (6,792,937) Support Services: Facilities Operation and Maintenance 499,147 (499,147) Information Services Support 881,057 99,908 (781,149) Business Administration 2,546,515 (2,546,515) Capital Outlay 907,098 (907,098)
Total Governmental Activities 29,192,722 725,979 84,119 (28,382,624)
General ReceiptsProperty Taxes Levied for General Purposes 8,303,677Unrestricted Gifts and Contributions 21,861Grants and Entitlements not Restricted to Specific Programs 20,760,585Sale of Capital Assets 208Earnings on Investment 598,174Miscellaneous 149,386
Total General Receipts 29,833,891
Change in Net Assets 1,451,267
Net Assets Beginning of Year 20,759,420
Net Assets End of Year 22,210,687$
See accompanying notes to the basic financial statements
Dayton Metro Library
Statement of Activities - Cash BasisFor the Year Ended December 31, 2008
Montgomery County
- 13 -
Dayton Metro LibraryMontgomery County
Statement of Assets and Fund Balances - Cash BasisGovernmental FundsDecember 31, 2008
Other TotalBuilding & Governmental Governmental
General Repair Fund Funds Funds
AssetsEquity in Pooled Cash and Cash Equivalents 8,668,774$ 11,297,954$ 1,997,862$ 21,964,590$Restricted Assets: Cash and Cash Equivalents 246,097 246,097Total Assets 8,668,774$ 11,297,954$ 2,243,959$ 22,210,687$
Fund BalancesReserved: Reserved for Encumbrances 1,456,710$ 105,431$ 1,562,141$ Reserved for Endowment 246,097 246,097Unreserved: Undesignated (Deficit), Reported in: General Fund 7,212,064 7,212,064 Special Revenue Funds 1,719,440 1,719,440 Capital Projects Funds 11,192,523 278,422 11,470,945Total Fund Balances 8,668,774$ 11,297,954$ 2,243,959$ 22,210,687$
See accompanying notes to the basic financial statements
- 14 -
Dayton Metro LibraryMontgomery County
Statement of Cash Receipts, Disbursements and Changes in Fund Balances - Cash Basis Governmental Funds
For the Year Ended December 31, 2008
Other TotalBuilding and Governmental Governmental
General Repair Fund Funds FundsReceiptsProperty and Other Local Taxes 8,303,677$ 8,303,677$Intergovernmental 20,760,585 20,760,585Patron Fines and Fees 602,424 602,424Services Provided to Other Entities 123,555 123,555Contributions, Gifts and Donations 105,980 105,980Earnings on Investments 254,730 288,475 54,969 598,174Miscellaneous 149,386 149,386
Total Receipts 30,300,337 288,475 54,969 30,643,781
DisbursementsCurrent: Library Services: Public Service and Programs 17,463,256 17,463,256 Collection Development and Processing 6,895,649 6,895,649 Support Services: Facilities Operation and Maintenance 499,147 499,147 Information Services 881,057 881,057 Business Administration 2,546,515 2,546,515Capital Outlay 755,857 104,928 46,313 907,098
Total Disbursements 29,041,481 104,928 46,313 29,192,722
Excess of Receipts Over (Under) Disbursements 1,258,856 183,547 8,656 1,451,059
Other Financing Sources (Uses)Sale of Capital Assets 208 208Transfers In 102,328 102,328Transfers Out (102,328) (102,328)
Total Other Financing Sources (Uses) (102,120) 0 102,328 208
Net Change in Fund Balances 1,156,736 183,547 110,984 1,451,267
Fund Balances Beginning of Year 7,512,038 11,114,407 2,132,975 20,759,420
Fund Balances End of Year 8,668,774$ 11,297,954$ 2,243,959$ 22,210,687$
See accompanying notes to the basic financial statements
- 15 -
Dayton Metro LibraryMontgomery County
Statement of Receipts, Disbursements and ChangesIn Fund Balance - Budget and Actual (Budget Basis)
General FundFor the Year Ended December 31, 2008
Budgeted Amounts Variance withOriginal Final Actual Final Budget
ReceiptsProperty and Other Local Taxes 8,226,402$ 8,226,402$ 8,303,677$ 77,275$ Other Government Grants-In-Aid 20,795,358 20,754,202 20,760,585 6,383 Patron Fines and Fees 615,200 615,200 602,424 (12,776) Services Provided to Other Entities 115,300 115,300 123,555 8,255 Contributions, Gifts and Donations 151,500 151,500 105,980 (45,520) Earnings on Investments 344,050 344,050 254,730 (89,320) Miscellaneous 139,700 49,700 149,386 99,686
Total Receipts 30,387,510 30,256,354 30,300,337 43,983
DisbursementsCurrent: Library Services: Salaries and Benefits 19,857,665 19,857,665 19,035,723 821,941 Supplies 663,897 713,897 619,853 94,044 Purchased and Contract Services 4,861,659 4,861,659 4,192,211 669,448 Library Materials and Information 6,278,672 6,278,672 5,643,246 635,426 Other 982,316 107,316 60,486 46,830 Capital Outlay 2,294,625 2,294,625 946,672 1,347,952
Total Disbursements 34,938,832 34,113,832 30,498,191 3,615,641
Excess of Receipts Over (Under) Disbursements (4,551,322) (3,857,478) (197,854) 3,659,624
Other Financing Sources (Uses)Sale of Capital Assets 5,000 5,000 208 (4,792) Advance In 34,284 34,284 - (34,284) Transfers Out (3,000,000) (3,825,000) (102,328) 3,722,672
Total Other Financing Sources (Uses) (2,960,716) (3,785,716) (102,120) 3,683,596
Net Change in Fund Balance (7,512,038) (7,643,194) (299,974) 7,343,220
Prior Year Encumbrances Appropriated 1,791,797 1,791,797 1,791,797 -
Fund Balance Beginning of 2008 5,720,241 5,720,241 5,720,241 -
Fund Balance End of 2008 $0 (131,156)$ 7,212,064$ 7,343,220$
See accompanying notes to the basic financial statements
- 16 -
Dayton Metro LibraryMontgomery County
AgencyAssetsEquity in Pooled Cash and Cash Equivalents 28,807$
Total Assets 28,807$
Net Assets 28,807$
See accompanying notes to the basic financial statements
Statement of Fiduciary Net Assets - Cash BasisFiduciary Funds
December 31, 2008
- 17 -
Dayton Metro Library Notes to the Basic Financial Statements For the Year Ended December 31, 2008
Note 1 – Description of the Library and Reporting Entity
The Dayton Metro Library is organized as a county library under the laws of the State of Ohio. The Library has its own Board of Trustees consisting of seven members: four of whom are appointed by the Montgomery County Commissioners and three of whom are appointed by the Montgomery County Common Pleas Court Judges. Appointments are for seven-year terms and members serve without compensation. Under Ohio statutes, the Library is a body politic and corporate capable of suing and being sued, contracting, acquiring, holding, possessing, and disposing of real property, and of exercising such other powers and privileges conferred upon it by law. The Library also determines and operates under its own budget. Control and management of the Library is governed by sections 3375.33 to 3375.39 of the Ohio Revised Code with the administration of the day-to-day operations of the Library and financial accountability being the responsibility of the Executive Director/Fiscal Officer.
The Library is fiscally independent of Montgomery County, although Montgomery County serves in a ministerial capacity as the taxing authority for the Library. The determination to request approval of a tax levy, the role and purpose(s) of the levy, are discretionary decisions made solely by the Board of Library Trustees. Once those decisions are made, Montgomery County must put the levy on the ballot. There is no potential for the Library to provide a financial benefit to or impose a financial burden on Montgomery County.
Component units are legally separate organizations for which the Library is financially accountable. The Library is financially accountable for an organization if the Library appoints a voting majority of the organization's governing board and (1) the Library is able to significantly influence the programs or services performed or provided by the organization; or (2) the Library is legally entitled to or can otherwise access the organization's resources; the Library is legally obligated or has otherwise assumed the responsibility to finance the deficits of, or provide financial support to, the organization; or the Library is obligated for the debt of the organization. The Library is also financially accountable for any organizations for which the Library approves the budget, the issuance of debt or the levying of taxes. Component units also include legally separate, tax-exempt entities whose resources are for the direct benefit of the Library, are accessible to the Library and are significant in amount to the Library. The Library has no component units.
The Friends of the Dayton Metro Library is a not-for-profit organization with a self-appointing board. The Library is not financially accountable for the organization, nor does the Library approve the budget or the issuance of debt of the organization. The economic resources received or held by the Friends of the Library are not significant to the Library. Therefore, this organization has been excluded from the reporting entity of the Library.
The Library’s management believes these financial statements present all activities for which the Library is financially accountable.
Note 2 - Summary of Significant Accounting Policies
As discussed further in Note 2.C, the financial statements of the Dayton Metro Library have been prepared on a cash basis of accounting. This cash basis of accounting differs from accounting principles generally accepted in the United States of America (GAAP). Generally accepted accounting principles include all relevant Governmental Accounting Standards Board (GASB) pronouncements, which have been applied to the extent they are applicable to the cash basis of accounting. In the government-wide financial statements, Financial Accounting Standards Board (FASB) pronouncements and Accounting Principles Board (APB) opinions issued on or before November 30, 1989, have been applied, to the extent they are applicable to the cash basis of accounting, unless those pronouncements conflict with or contradict GASB pronouncements, in which case GASB prevails. The most significant of the Library’s accounting policies are described below.
- 18 -
Dayton Metro Library Notes to the Basic Financial Statements For the Year Ended December 31, 2008
Note 2 - Summary of Significant Accounting Policies (continued)
A. Basis of Presentation
The Library’s basic financial statements consist of government-wide statements, including a statement of net assets and a statement of activities, and fund financial statements, which provide a more detailed level of financial information.
Government-wide Financial Statements
The statement of net assets and the statement of activities display information about the Library as a whole. These statements include the financial activities of the primary government, except for fiduciary funds. Governmental activities generally are financed through taxes, intergovernmental receipts and other non-exchange transactions.
The statement of net assets presents the cash and cash equivalent balances of the governmental activities of the Library at year end. The statement of activities compares disbursements with program receipts for each of the Library's governmental activities. Disbursements are reported by function. A function is a group of related activities designed to accomplish a major service or regulatory program for which the Library is responsible. Program receipts include charges paid by the recipient of the program’s goods or services, grants and contributions restricted to meeting the operational or capital requirements of a particular program, and receipts of interest earned on grants that are required to be used to support a particular program. General receipts are all receipts not classified as program receipts, with certain limited exceptions. The comparison of direct disbursements with program receipts identifies the extent to which each governmental function is self-financing on a cash basis or draws from the Library’s general receipts.
Fund Financial Statements
During the year, the Library segregates transactions related to certain Library functions or activities in separate funds in order to aid financial management and to demonstrate legal compliance. Fund financial statements are designed to present financial information of the Library at this more detailed level. The focus of governmental fund financial statements is on major funds. Each major fund is presented in a separate column. Non-major funds are aggregated and presented in a single column. Fiduciary funds are reported by type.
B. Fund Accounting
The Library uses funds to maintain its financial records during the year. A fund is defined as a fiscal and accounting entity with a self balancing set of accounts. The Library’s funds are divided into two categories, governmental and fiduciary.
Governmental Funds
Governmental funds are financed primarily from taxes, intergovernmental receipts (e.g. grants), and other non-exchange transactions. Monies are assigned to the various governmental funds according to the purposes for which they may or must be used. The following are the Library's major governmental funds:
General Fund - The general fund accounts for all financial resources except those required to be accounted for in another fund. The general fund balance is available to the Library for any purpose provided it is expended or transferred according to the general laws of Ohio.
- 19 -
Dayton Metro Library Notes to the Basic Financial Statements For the Year Ended December 31, 2008
Note 2 – Summary of Significant Accounting Policies (continued)
Building and Repair Fund - The building and repair fund accounts for monies set aside by the Board of Library Trustees specifically for building projects, including the improvements to the Library and construction of new and future facilities.
The other governmental funds of the Library are the computer fund, special revenue fund, trust and endowment funds.
Fiduciary Funds
Fiduciary funds include pension trust funds, investment trust funds, private purpose trust funds, and agency funds. Trust funds are used to account for assets held under a trust agreement for individuals, private organizations, or other governments which are not available to support the Library’s own programs. Agency funds are purely custodial in nature and are used to hold resources for individuals, organizations or other governments. The Library’s agency fund accounts for reimbursements of eligible expenses under the health or dependent care flexible spending account.
C. Basis of Accounting
The Library’s financial statements are prepared using the cash basis of accounting. Under this basis of accounting, receipts are recorded in the Library’s financial records and reported in the financial statements when cash is received rather than when earned and disbursements are recorded when cash is paid rather than when a liability is incurred.
As a result of the use of this cash basis of accounting, certain assets and their related revenues (such as accounts receivable and revenue for billed or provided services not yet collected) and certain liabilities and their related expenses (such as accounts payable and expenses for goods or services received but not yet paid, and accrued liabilities and the related expenses) are not recorded in these financial statements. Therefore, when reviewing the financial information and discussion within this report, the reader should keep in mind the limitations resulting from the use of the cash basis of accounting.
D. Budgetary Process
All funds, (except agency funds), are legally required to be appropriated. The appropriations resolution is the Trustee’s authorization to spend resources and sets limits on cash disbursements plus encumbrances at the level of control selected by the Trustees. The legal level of control has been established at the fund and major category of the object code level for all funds. Budgetary modifications at the legal level of control may only be made by resolution of the Board of Library Trustees.
For control purposes, the Library estimates cash receipts for the year. These estimated receipts, together with the unencumbered carry-over balances from the prior year, set a limit on the amount the Trustees may appropriate. The estimated receipts may be revised during the year if projected increases or decreases in receipts are identified by the Fiscal Officer. The amounts reported as the original budgeted amounts on the budgetary statements reflect the amounts of estimated resources when the original appropriations were adopted. The amounts reported as the final budgeted amounts on the budgetary statements reflect the amounts of estimated resources at the time final appropriations were enacted by the Trustees.
- 20 -
Dayton Metro Library Notes to the Basic Financial Statements For the Year Ended December 31, 2008
Note 2 – Summary of Significant Accounting Policies (continued)
The appropriations resolution is subject to amendment throughout the year with the restriction that appropriations should not exceed estimated resources. The amounts reported as the original budgeted amounts reflect the first appropriation ordinance for that fund that covered the entire year, including amounts automatically carried forward from prior years. The amounts reported as the final budgeted amounts represent the final appropriation amounts passed by the Trustees during the year.
E. Cash and Cash Equivalents
Library records identify the purchase of specific investments by specific funds.
To improve cash management, cash received by the Library is pooled and invested. Individual fund integrity is maintained through the Library's records. Interest in the pool is presented as “Equity in Pooled Cash and Cash Equivalents.”
All investments of the cash management pool are presented on the financial statements as cash equivalents. Purchases of investments are not recorded as disbursements, and sales of investments are not recorded as receipts. Gains or losses at the time of sale are recorded as receipts or negative receipts, respectively.
During 2008, the Library invested in STAR Ohio. STAR Ohio is an investment pool managed by the State Treasurer’s Office which allows governments within the State to pool their funds for investment purposes. STAR Ohio is not registered with the SEC as an investment company, but does operate in a manner consistent with Rule2a7 of the Investment Company Act of 1940. Investments in STAR Ohio are valued at STAR Ohio’s share price, which is the price the investment could be sold for on December 31, 2008.
Investment procedures are restricted by the provisions of the Ohio Revised Code. Interest receipt credited to the General Fund, Building and Repair Fund, and Other Governmental Funds during 2008 amounted to $254,730, $288,475, and $54,969, respectively.
F. Restricted Assets
Cash, cash equivalents, and investments are reported as restricted when limitations on their use change the nature or normal understanding of their use. Such constraints are either imposed by creditors, contributors, grantors, or laws of other governments, or imposed by law through constitutional provisions or enabling legislation. The government-wide statement of net assets reports $246,097 which is restricted by contributors.
G. Capital Assets
Acquisitions of property, plant and equipment are recorded as disbursements when paid. These items are not reflected as assets in the accompanying financial statements.
H. Employer Contributions to Cost-Sharing Pension Plans
The Library recognizes the disbursement for their employer contributions to cost-sharing pension plans when they are paid. As described in Notes 8 and 10, the employer contributions include portions for pension benefits and for postretirement health care benefits.
- 21 -
Dayton Metro Library Notes to the Basic Financial Statements For the Year Ended December 31, 2008
Note 2 – Summary of Significant Accounting Policies (continued)
I. Net Assets
Net assets are reported as restricted when there are limitations imposed on their use either through enabling legislation or through external restrictions imposed by creditors, grantors, or laws or regulations of other governments.
The Library’s policy is to first apply restricted resources when an obligation is incurred for purposes for which both restricted and unrestricted net assets are available.
J. Fund Balance Reserves
The Library reserves any portion of fund balances which is not available for appropriation or which is legally segregated for a specific future use. Unreserved fund balance indicates that portion of fund balance which is available for appropriation in future periods. Fund balance reserves have been established for encumbrances and endowments.
K. Interfund Transactions
Exchange transactions between funds are reported as receipts in the seller funds and as disbursements in the purchaser funds. Subsidies from one fund to another without a requirement for repayment are reported as interfund transfers. Interfund transfers are reported as other financing sources/uses in governmental funds. Repayments from funds responsible for particular disbursements to the funds that initially paid for them are not presented in the financial statements. The Library uses interfund transfers to move unrestricted general fund revenues to finance various programs that the government must account for in other funds in accordance with budgetary authorizations.
Note 3 – Budgetary Basis of Accounting
The budgetary basis as provided by law is based upon accounting for certain transactions on the basis of cash receipts, disbursements, and encumbrances. The Statement of Receipts, Disbursements and Changes in Fund Balance – Budget and Actual – Budgetary Basis presented for the general fund is prepared on the budgetary basis to provide a meaningful comparison of actual results with the budget. The difference between the budgetary basis and the cash basis is outstanding year end encumbrances, which are treated as disbursements (budgetary basis) rather than as a reservation of fund balance (cash basis). The encumbrances outstanding at year end (budgetary basis) amounted to $1,456,710 for the general fund.
Note 4 – Deposits and Investments
Monies held by the Library are classified by State statute into three categories.
Active monies are public monies determined to be necessary to meet current demands upon the Library treasury. Active monies must be maintained either as cash in the Library treasury, in commercial accounts payable or withdrawable on demand, including negotiable order of withdrawal (NOW) accounts, or in money market deposit accounts.
Inactive deposits are public deposits that the Board has identified as not required for use within the current five year period of designation of depositories. Inactive deposits must either be evidenced by certificates of deposit maturing not later than the end of the current period of designation of depositories, or by savings or deposit accounts including, but not limited to, passbook accounts.
- 22 -
Dayton Metro Library Notes to the Basic Financial Statements For the Year Ended December 31, 2008
Note 4 – Deposits and Investments (continued)
Interim deposits are deposits of interim monies. Interim monies are those monies which are not needed for immediate use but which will be needed before the end of the current period of designation of depositories. Interim deposits must be evidenced by time certificates of deposit maturing not more than one year from the date of deposit or by savings or deposit accounts, including passbook accounts.
Interim monies held by the Library can be deposited or invested in the following securities:
1. United States Treasury bills, bonds, notes, or any other obligation or security issued by the United States Treasury, or any other obligation guaranteed as to principal and interest by the United States;
2. Bonds, notes, debentures, or any other obligation or security issued by any federal government agency or instrumentality including, but not limited to, the Federal National Mortgage Association, Federal Home Loan Bank, Federal Farm Credit Bank, Federal Home Loan Mortgage Corporation, Government National Mortgage Association, and Student Loan Marketing Association. All federal agency securities shall be direct issuances of federal government agencies or instrumentalities;
3. Written repurchase agreements in the securities listed above provided the market value of the securities subject to the repurchase agreement must exceed the principal value of the agreement by at least 2 percent and be marked to market daily, and the term of the agreement must not exceed thirty days;
4. Bonds and other obligations of the State of Ohio or Ohio local governments;
5. Time certificates of deposit or savings or deposit accounts including, but not limited to, passbook accounts;
6. No-load money market mutual funds consisting exclusively of obligations described in division (1) or (2) and repurchase agreements secured by such obligations, provided that investments in securities described in this division are made only through eligible institutions;
7. The State Treasurer’s investment pool (STAR Ohio).
8. Certificates of Deposits (CDs) properly insured through the FDIC or suitable collateralization, including the Certificate of Deposit Account Registry Services (CDARS). Effective March 4, 2006, the Ohio General Assembly created Ohio Revised Code 135.144 permitting the library to use the Certificate of Deposit Account Registry Services (CDARS). If the library purchases certificates of deposit for more than the FDIC limit (adjusted to $250,000 in 2008 through the end of 2009), with a bank participating in CDARS, the bank “redeposits” the excess amounts with other participating institutions. Each bank accepts less than the FDIC limit so all deposits have FDIC coverage
9. Commercial Paper and bankers acceptances if Ohio Revised Code training requirements have been met.
Investments in stripped principal or interest obligations, reverse repurchase agreements, and derivatives are prohibited. The issuance of taxable notes for the purpose of arbitrage, the use of leverage, and short selling are also prohibited. An investment must mature within five years from the date of purchase, unless matched to a specific obligation or debt of the Library, and must be purchased with the expectation that it will be held to maturity. Investments may only be made through specified dealers and institutions.
At year end, the Library had $3,024 in undeposited cash on hand which is included as part of “Equity in Pooled Cash and Cash Equivalents” on the financial statements.
- 23 -
Dayton Metro Library Notes to the Basic Financial Statements For the Year Ended December 31, 2008
Note 4 – Deposits and Investments (continued)
Deposits
Custodial credit risk for deposits is the risk that in the event of bank failure, the Library will not be able to recover deposits or collateral securities that are in the possession of an outside party. At year end, $8,691,260 of the Library’s bank balance of $11,260,718 was exposed to custodial credit risk because those deposits were uninsured and collateralized with securities held by the pledging financial institution’s trust department or agent, but not in the Library’s name.
The Library has no deposit policy for custodial risk beyond the requirements of State statute. Ohio law requires that deposits be either insured or be protected by eligible securities pledged to and deposited either with the Library or a qualified trustee by the financial institution as security for repayment, or by a collateral pool of eligible securities deposited with a qualified trustee and pledged to secure the repayment of all public monies deposited in the financial institution whose market value at all times shall be at least one hundred five percent of the deposits being secured.
Investments
Interest Rate Risk: Interest rate risk arises because the fair value of investment changes as interest rates change. The Library’s investment policy addresses interest rate risk by requiring that the Library’s investment portfolio be structured so that securities mature to meet cash requirements for ongoing operations and/or long-term debt payments, thereby avoiding that need to sell securities on the open market prior to maturity, and by investing operating funds primarily in short-term investments.
State statute requires that an investment mature within five years from the date of purchase, unless matched to a specific obligation or debt of the Library, and that an investment be purchased with the expectation that it will be held to maturity.
At year end the Library had investments in STAR Ohio at a fair value of $11,813,296. STAR Ohio has a maturity of less than one year and is not subject to interest rate penalty on maturity issues.
Credit Risk: STAR Ohio carries a rating of AAAm by Standard and Poor’s. The Library has no investment policy dealing with investment credit risk beyond the requirements in state statues. Ohio law requires that STAR Ohio maintain the highest rating provided by at least one nationally recognized standard rating service. The Library’s investment policy limits investments to those authorized by State statute.
Custodial Credit Risk: For an investment, custodial credit risk is the risk that, in the event of the failure of the counterparty, the Library will not be able to recover the value of its investments or collateral securities that are in the possession of an outside party. The Library has no investment policy dealing with investment custodial risk beyond the requirements in ORC 135.14(M)(2) which states, “Payment for investments shall be made only upon the delivery of securities representing such investments to the treasurer, investing authority, or qualified trustee. If the securities transferred are not represented by a certificate, payment shall be made only upon receipt of confirmation of transfer from the custodian by the treasurer, governing board, or qualified trustee.”
The Library places no limit on the amount it may invest in any one issuer; however, investments are limited to low risk securities with the expectation of earning market rate of return.
- 24 -
Dayton Metro Library Notes to the Basic Financial Statements For the Year Ended December 31, 2008
Note 5 – Public Library Fund
The primary source of revenue for Ohio public libraries is the Public Library Fund (PLF). The PLF is allocated to each county based on the county’s prior intangibles tax of PLF revenues, and its population. The County Budget Commission allocates these funds to the Library based on its needs such as for the construction of new library buildings, improvements, operation, maintenance, or other expenses. The Budget Commission cannot reduce its allocation of these funds to the Library based on any additional revenues the Library receives. During 2008, the Library received $18,688,568 or 61.0% of its total cash receipts from this funding source.
Note 6 – Property Taxes
Property taxes include amounts levied against all real property, public utility property, and tangible personal property located in the taxing district of the Library within Montgomery County. Real property tax receipts received in 2008 represent the collection of 2007 taxes. Real property taxes received in 2008 were levied after October 1, 2007 on the assessed values as of January 1, 2007, the lien date. Assessed values for real property taxes are established by State statute at 35 percent of appraised market value. Property taxes are also reduced for applicable homestead and rollback deductions. Homestead and rollback amounts are then paid by the State and are reflected in the accompanying financial statements as Other Governments Grants-in-Aid. Real property taxes are payable annually or semiannually.
Public utility property tax receipts received in 2008 represent the collection of 2007 taxes. Public utility real and tangible personal property taxes received in 2008 became a lien on December 31, 2007, were levied after October 1, 2007, and are collected with real property taxes. Public utility real property is assessed at 35 percent of true value; public utility tangible personal property is currently assessed at varying percentages of true value.
Tangible personal property tax receipts received in 2008 (other than public utility property) represent the collection of 2007 taxes. Tangible personal property tax is assessed at varying percentage of true value, by the property owners who must file a list of such property to the County by each April 30.
Montgomery County is responsible for assessing property, and for billing, collecting, and distributing all property taxes on behalf of the Library.
- 25 -
Dayton Metro Library Notes to the Basic Financial Statements For the Year Ended December 31, 2008
Note 7 - Risk Management
The Library is exposed to various risks of loss related to torts; theft of, damage to, and destruction of assets; errors and omissions; injuries to employees; and natural disasters. During 2008, the Library contracted with several companies for various types of insurance coverage as follows:
Company Type of Coverage Amount of Coverage
Chubb Insurance Group Building (blanket) $40,052,729 EDP Property 2,178,149 Contents 50,015,762
Third Party Property 53,657 Extra Expense (blanket) 3,000,000
Public Officials 5,000,000 Cincinnati Insurance Boiler & Machinery 25,000,000
Automobile 1,000,000 General Liability 1,000,000
Settled claims have not exceeded coverage in any of the last three years and there was no significant reduction in coverage from the prior year.
The Library pays the State Workers’ Compensation System a premium based on a rate per $100 of salaries. This rate is calculated based on accident history and administrative costs. The State Workers’ Compensation System administers and pays all claims.
Note 8 - Defined Benefit Pension Plan
Plan Description - The Library participates in the Ohio Public Employees Retirement System (OPERS). OPERS administers three separate pension plans. The traditional plan is a cost-sharing, multiple-employer defined benefit pension plan. The member-directed plan is a defined contribution plan in which the member invests both member and employer contributions (employer contributions vest over five years at 20 percent per year). Under the member-directed plan, members accumulate retirement assets equal to the value of the member and vested employer contributions plus any investment earnings. The combined plan is a cost-sharing, multiple-employer defined benefit pension plan that has elements of both a defined benefit and a defined contribution plan. Under the combined plan, employer contributions are invested by the retirement system to provide a formula retirement benefit similar to the traditional plan benefit. Member contributions, whose investment is self-directed by the member, accumulate retirement assets in a manner similar to the member-directed plan.
OPERS provides retirement, disability, survivor and death benefits and annual cost-of-living adjustments to members of the traditional and combined plans. Members of the member-directed plan do not qualify for ancillary benefits. Authority to establish and amend benefits is provided by Chapter 145 of the Ohio Revised Code. OPERS issues a stand-alone financial report that may be obtained by writing to OPERS, 277 East Town Street, Columbus, OH 43215-4642 or by calling (614) 222-5601 or (800) 222-7377.
Funding Policy – The Ohio Revised Code provides statutory authority for member and employer contributions. For the year ended December 31, 2008, members in state and local classifications contributed 14.0 percent of covered payroll.
- 26 -
Dayton Metro Library Notes to the Basic Financial Statements For the Year Ended December 31, 2008
Note 8 - Defined Benefit Pension Plan (continued)
The Library’s contribution rate for 2008 was 14.0 percent of covered payroll. For the period January 1, through December 31, 2008, a portion of the Library’s contribution equal to 7.0 percent of covered payroll was allocated to fund the postemployement healthcare plan. Employer contribution rates are actuarially determined. State statute sets a maximum contribution rate for the Library of 14 percent.
The Library’s required contributions for pension obligations to the traditional, combined, and member- directed plans for the years ended December 31, 2008, 2007, and 2006 were $983,298, $1,129,758, and $1,195,994 respectively. The full amount has been contributed for 2008, 2007 and 2006.
Note 9 – Employee Benefits – Deferred Compensation Plan
Employees of the Library may elect to participate in the Ohio Public Employees Deferred Compensation Plan. Under this program, employees elect to defer a portion of their pay. The deferred pay and any income earned on it are not subject to federal and state income taxation until actually received by the employee. Participation in the plan is optional. The deferred compensation is not available to employees until termination of employment, retirement, death or unforeseen emergency.
Note 10 – Post-employment Benefits
Plan Description – Ohio Public Employees Retirement System (OPERS) administers three separate pension plans: The Traditional Pension Plan – a cost-sharing, multiple-employer defined benefit pension plan; the Member-Directed Plan – a defined contribution plan; and the Combined Plan – a cost sharing, multiple-employer defined benefit pension that has elements of both a defined benefit and defined contribution plan.
OPERS maintains a cost-sharing multiple-employer defined benefit post-employment healthcare plan, which includes a medical plan, prescription drug program and Medicare Part B premium reimbursement, to qualifying members of both the Traditional Pension and the Combined Plans. Members of the Member-Directed Plan do not qualify for ancillary benefits, including post-employment healthcare coverage.
To qualify for post-employment health care coverage, age-and-service retirees under the Traditional Pension and Combined Plans must have ten years or more years of qualifying Ohio service credit. Health care coverage for disability benefit recipients and qualified survivor benefit recipients is available. The Ohio Revised code permits, but does not require, OPERS to provide health care benefits to eligible members and beneficiaries. Authority to establish and amend benefits is provided in Chapter 145 of the Ohio Revised Code. The heath care coverage provided by OPERS meets the definition of an Other Post Employment Benefit (OPEB) as described in GASB Statement 45.
Disclosures for the health care plan are provided separately in the OPERS financial report which may be obtained by writing to OPERS, 277 East Town Street, Columbus, Ohio 43215-4642 or by calling (614) 222-5601 or (800) 222-7377.
Funding Policy – The Ohio Revised Code provides the statutory authority requiring public employers to fund post retirement health care through their contributions to OPERS. A portion of each employer’s contribution to OPERS is set aside for the funding of post retirement health care benefits.
Employer contribution rates are expressed as a percentage of the covered payroll of active members. In 2008, local government employers contributed 14.0 percent of covered payroll. OPERS’ Post Employment Health Care plan was established under, and is administrated in accordance with, Internal Revenue Code 401 (h). Each year, The OPERS retirement board determines the portion of the employer contribution that will be set aside for funding post-employment healthcare benefits. For 2008, the employer contribution allocated to the health care plan was 7.0% of covered payroll.
- 27 -
Dayton Metro Library Notes to the Basic Financial Statements For the Year Ended December 31, 2008
Note 10 – Post-employment Benefits (continued)
The OPERS Retirement Board is also authorized to establish rules for the payment of a portion of the healthcare benefits by the retiree or retiree’s surviving beneficiaries. Payment amounts vary depending on the number of covered dependents and selected coverage.
The Library’s contributions allocated to fund post-employment healthcare benefits for the years ended December 31, 2008, 2007, and 2006 were $983,298, $745,464, and $579,642 respectively; 100 percent has been contributed for 2008, 2007 and 2006.
On September 9, 2004, the OPERS Retirement Board adopted a Health Care Preservation Plan (HCPP) which was effective January 1, 2007. Member and employer contribution rates increased as of January 1, 2006, January 1, 2007, and January 1, 2008, which allowed additional funds to be allocated to the health care plan.
Note 11 – Operating Leases
The Library leases buildings, vehicles and other equipment under non-cancelable leases. The Library disbursed $253,355 to pay lease costs for the year ended December 31, 2008. Future lease payments are as follows:
Year Amount 2009 $259,177 2010 256,621 2011 275,088 2012 280,802 2013 295,393 2014-2016 739,749 Total $2,106,830
Office Lease – The Library leases the space at 6160 Chambersburg Heights in Huber Heights for library operation for a total cost of $137,854 for the year. The lease expires on December 31, 2015. The Library leases space at 333 W. National Road in Englewood for library operation for at an annual cost of $27,585. The Library leases space at 2293 Arbor Blvd. in Moraine for Outreach Services for a total annual cost of $71,232. The lease expires April 30, 2016.
Parking Spaces – The Library leases twenty-seven (27) parking spaces for a total cost of $6,000 for the year. The lease expires on January 1, 2009 and, in the absence of notification from either party, automatically renews for an unlimited number of successive one-year terms.
Copier Leases – The Library leases 1 copier at an annual cost of $5,749. The lease expires on February 22, 2010. The Library leases 1 copier at an annual cost of $1,097. The lease expires on December 31, 2012. The Library leases 2 copiers at a total annual cost of $3,838. The lease expires on August 31, 2012.
Note 12 – Interfund Transfers
The general fund transferred $85,456 to the special revenue fund for additional funds needed to cover accrued and vested employee compensated absences. The general fund transferred $16,872 to the Computer fund for the purchase of a future generation of Library Information Systems.
- 28 -
2525 north limestone street, ste. 103 springfield, oh 45503
www.cshco.com p. 937.399.2000 f. 937.399.5433
cincinnati | columbus | dayton | middletown | springfield
REPORT ON INTERNAL CONTROL OVER FINANCIAL REPORTING AND ON COMPLIANCE AND OTHER MATTERS BASED ON AN AUDIT OF FINANCIAL STATEMENTS PERFORMED IN ACCORDANCE WITH GOVERNMENT AUDITING STANDARDS Board of Trustees Dayton Metro Library 215 E. Third Street Dayton, Ohio 45402 We have audited the financial statements of the governmental activities, each major fund, and the aggregate remaining fund information of Dayton Metro Library (the Library) as of and for the year ended December 31, 2008, which collectively comprise the Library’s basic financial statements and have issued our report thereon dated May 6, 2009, wherein we noted the Library reported on the cash basis of accounting. We conducted our audit in accordance with auditing standards generally accepted in the United States of America and the standards applicable to financial audits contained in Government Auditing Standards, issued by the Comptroller General of the United States. Internal Control Over Financial Reporting In planning and performing our audit, we considered the Library’s internal control over financial reporting as a basis for designing our auditing procedures for the purpose of expressing our opinions on the financial statements, but not for the purpose of expressing an opinion on the effectiveness of the Library’s internal control over financial reporting. Accordingly, we do not express an opinion on the effectiveness of the Library’s internal control over financial reporting. A control deficiency exists when the design or operation of a control does not allow management or employees, in the normal course of performing their assigned functions, to prevent or detect misstatements on a timely basis. A significant deficiency is a control deficiency, or combination of control deficiencies, that adversely affects the entity’s ability to initiate, authorize, record, process or report financial data reliably in accordance with a basis of accounting described in Note 2 such that there is more than a remote likelihood that a misstatement of the entity’s financial statements that is more than inconsequential will not be prevented or detected by the entity’s internal control. A material weakness is a significant deficiency, or combination of significant deficiencies, that results in more than a remote likelihood that a material misstatement of the financial statements will not be prevented or detected by the entity’s internal control. Our consideration of internal control over financial reporting was for the limited purpose described in the first paragraph of this section and would not necessarily identify all deficiencies in internal control that might be significant deficiencies or material weaknesses. We did not identify any deficiencies in internal control over financial reporting that we consider to be material weaknesses as defined above.
- 29 -
Compliance and Other Matters
As part of obtaining reasonable assurance about whether the Library’s financial statements are free of material misstatement, we performed tests of its compliance with certain provisions of laws, regulations, contracts, and grant agreements, noncompliance with which could have a direct and material effect on the determination of financial statement amounts. However, providing an opinion on compliance with those provisions was not an objective of our audit, and accordingly, we do not express such an opinion. The results of our testing disclosed no instances of noncompliance or other matters that are required to be reported under Government Auditing Standards.
We noted certain matters that we reported to the Library’s management in a separate letter dated May 6, 2009.
This report is intended solely for the information and use of management and the Board of Trustees and is not intended to be and should not be used by anyone other than these specified parties.
Springfield, Ohio May 6, 2009
- 30 -
DAYTON METRO LIBRARY MONTGOMERY COUNTY, OHIO
Basic Financial Statements – Cash Basis
December 31, 2009
(with Independent Auditors’ Report)
88 E. Broad St. / Fifth Floor / Columbus, OH 43215‐3506 Telephone: (614) 466‐4514 (800) 282‐0370 Fax: (614) 466‐4490
www.auditor.state.oh.us
Board of Trustees Dayton Metro Library 215 East Third Street Dayton, Ohio 45402 We have reviewed the Independent Auditors’ Report of the Dayton Metro Library, Montgomery County, prepared by Clark, Schaefer, Hackett & Co., for the audit period January 1, 2009 through December 31, 2009. Based upon this review, we have accepted these reports in lieu of the audit required by Section 117.11, Revised Code. The Auditor of State did not audit the accompanying financial statements and, accordingly, we are unable to express, and do not express an opinion on them. Our review was made in reference to the applicable sections of legislative criteria, as reflected by the Ohio Constitution, and the Revised Code, policies, procedures and guidelines of the Auditor of State, regulations and grant requirements. The Dayton Metro Library is responsible for compliance with these laws and regulations. Mary Taylor, CPA Auditor of State June 1, 2010
Management’s Discussion and Analysis ............................................................................................. 3-9
Statement of Net Assets –Cash Basis ................................................................................................. 10
Statement of Activities –Cash Basis ..................................................................................................... 11
Statement of Assets and Fund Balances –Cash Basis – Governmental Funds ................................... 12
Statement of Cash Receipts, Disbursements and Changes in Fund Balances –Cash Basis – Governmental Funds ....................................................................... 13
Statement of Receipts, Disbursements and Changes in Fund Balances – Budget and Actual (Budget Basis) – General Fund ...................................................................................... 14
Statement of Fiduciary Net Assets –Cash Basis – Fiduciary Funds..................................................... 15
Notes to the Basic Financial Statements ........................................................................................ 16-27
Report on Internal Control Over Financial Reporting and on Compliance and Other Matters Based on an Audit of Financial Statements Performed in Accordance with Government Auditing Standards ..................................................................... 28-29
2525 north limestone street, ste. 103 springfield, oh 45503
www.cshco.comp. 937.399.2000 f. 937.399.5433
cincinnati | columbus | dayton | middletown | springfield
INDEPENDENT AUDITORS’ REPORT
Board of Trustees Dayton Metro Library 215 East Third Street Dayton, Ohio 45402
We have audited the accompanying financial statements of the governmental activities, each major fund and the aggregate remaining fund information of Dayton Metro Library (the Library), as of and for the year ended December 31, 2009, which collectively comprise the Library’s basic financial statements as listed in the table of contents. These financial statements are the responsibility of management. Our responsibility is to express opinions on these financial statements based on our audit.
We conducted our audit in accordance with auditing standards generally accepted in the United States of America and the standards applicable to financial audits contained in the Comptroller General of the United States’ Government Auditing Standards. Those standards require that we plan and perform the audit to reasonably assure whether the financial statements are free of material misstatement. An audit includes examining on a test basis, evidence supporting the amounts and disclosures in the financial statements. An audit also includes assessing the accounting principles used and significant estimates made by management, as well as evaluating the overall financial statement presentation. We believe our audit provides a reasonable basis for our opinions.
As discussed in Note 2, the accompanying financial statements and notes follow the cash basis of accounting. This is a comprehensive basis of accounting other than generally accepted accounting principles.
In our opinion, the financial statements referred to above present fairly, in all material respects, the respective cash basis financial position of the governmental activities, each major fund and the aggregate remaining fund information of Dayton Metro Library, as of December 31, 2009, and the respective changes in cash basis financial position and the respective budgetary comparisons for the General Fund for the year then ended in conformity with the accounting basis Note 2 describes.
In accordance with Government Auditing Standards, we have also issued our report dated May 25, 2010, on our consideration of the Library’s internal control over financial reporting and our tests of its compliance with certain provisions of laws, regulations, contracts and grant agreements and other matters. That report describes the scope of our testing of internal control over financial reporting and compliance and the results of that testing, not to provide an opinion on the internal control over financial reporting on compliance. That report is an integral part of an audit performed in accordance with Government Auditing Standards and should be considered in assessing the results of our audit.
1
The Management’s Discussion and Analysis is not a required part of the basic financial statements but is supplementary information the Governmental Accounting Standards Board requires. We have applied certain limited procedures, which consisted principally of inquiries of management regarding the methods of measurement and presentation of the required supplementary information. However, we did not audit the information and express no opinion on it.
Springfield, Ohio May 25, 2010
2
Dayton Metro Library Management’s Discussion and Analysis For the Year Ended December 31, 2009
Unaudited
The management’s discussion and analysis of the Dayton Metro Library’s (the Library) financial performance provides an overall review of the Library’s financial activities for the year ended December 31, 2009, within the limitations of the Library’s cash basis of accounting. The intent of the management’s discussion and analysis is to examine the Library’s financial performance as a whole. Readers should also review the basic financial statements and notes to enhance their understanding of the Library’s financial performance.
Financial Highlights
Key financial highlights for 2009 are as follows:
� Net assets of governmental activities decreased $721,759, or 3.2%. The fund most affected by the decrease in cash and cash equivalents was the General Fund. Although expenditures for the year decreased $1,934,633 or 6.6% from 2008, receipts from governmental activities decreased $4,107,659 or 13.4% from 2008. The economic recession continued well into 2009 negatively affecting financial support from the State of Ohio. Support from the State of Ohio through the Public Library Fund was $3,326,909 or 17.8% less than 2008.
� The Library’s general receipts are primarily made up of property and other local taxes ($7,850,485) and other government grants-in-aid, such as the State’s Public Library Fund (PLF) ($17,672,232). These receipts represent respectively 29.6% and 66.6% of the total cash received for governmental activities during the year. Property and other local tax receipts for 2009 were less than 2008, primarily due to the phase out of the tangible personal property tax.
� At the end of the fiscal year, the unreserved fund balance in the General fund was $6,991,889. This amount represents 34.3% of total unreserved fund balance and 25.8% of 2009 General fund expenditures ($27,119,376).
� Program specific receipts in the form of charges for services and sales, and operating grants and contributions represent $769,632 or 2.9% of total receipts. This revenue is primarily comprised of charges for maintaining public service programs.
� Due to the worldwide recession and its impact on the financial markets, interest rates rapidly decreased in the latter half of 2008 and reached historically low levels in 2009 thus having a dramatic negative effect on investment receipts. Investment receipts dropped from $598,174 in 2008 to $135,555 a 77% decrease. In 2009, the Library did invest certain inactive funds in CDARS (Certificate of Deposit Account Registry Service) for public funds that produced a higher yield than savings or money market demand accounts. The average interest rate in 2009 was .26% as compared to 2.46% in 2008. The average investment yield was 4.19% in January 2008 and had dropped to 0.1% by December 2009.
Using This Annual Financial Report
This annual report is presented in a format consistent with the presentation requirements of Governmental Accounting Standards Board Statement No. 34, as applicable to the Library’s cash basis of accounting.
This annual report consists of a series of financial statements and notes to those statements. These statements are prepared and organized so the reader can understand the Library as a financial whole or as an entire operating entity. The statements provide a detailed look at the Library’s specific financial activities and conditions on a cash basis of accounting.
3
Dayton Metro Library Management’s Discussion and Analysis For the Year Ended December 31, 2009
Unaudited
Financial Report Components
The statement of net assets and the statement of activities provide information about the cash activities of the Library as a whole.
Fund financial statements provide a greater level of detail. Funds are created and maintained on the financial records of the Library as a way to segregate money whose use is restricted to a particular specified purpose. These statements present financial information by fund, presenting funds with the largest balances or most activity in separate columns.
The notes to the financial statements are an integral part of the government-wide and fund financial statements and provide expanded explanation and detail regarding the information reported in the statements.
Basis of Accounting
The basis of accounting is a set of guidelines that determine when financial events are recorded. The Library has elected to present its financial statements on a cash basis of accounting. This basis of accounting is a basis of accounting other than generally accepted accounting principles. Under the Library’s cash basis of accounting, receipts and disbursements are recorded when cash is received or paid.
As a result of using the cash basis of accounting, certain assets and their related receipts (such as accounts receivable) and certain liabilities and their related expenses (such as accounts payable) are not recorded in the financial statements. Therefore, when reviewing the financial information and discussion within this report, the reader must keep in mind the limitations resulting from the use of the cash basis of accounting.
Reporting the Library as a Whole
The statement of net assets and the statement of activities reflect how the Library did financially during 2009, within the limitations of cash basis accounting. The statement of net assets presents the cash balances and investments of the governmental activities of the Library at year end. The statement of activities compares cash disbursements with program receipts for each governmental program. Program receipts include charges paid by the recipient of the program’s goods or services and grants and contributions restricted to meeting the operational or capital requirements of a particular program. General receipts are all receipts not classified as program receipts. The comparison of cash disbursements with program receipts identifies how each governmental function activity draws from the Library’s general receipts.
These statements report the Library’s cash position and the changes in cash position. Keeping in mind the limitations of the cash basis of accounting, you can think of these changes as one way to measure the Library’s financial health. Over time, increases or decreases in the Library’s cash position is one indicator of whether the Library’s financial health is improving or deteriorating. When evaluating the Library’s financial condition, you should also consider other non-financial factors as well, such as the Library’s property tax base, the condition of the Library’s capital assets, the extent of the Library’s debt obligations, the reliance on non-local financial resources for operations and the need for continued growth in the major local revenue sources such as property taxes.
4
Dayton Metro Library Management’s Discussion and Analysis For the Year Ended December 31, 2009
Unaudited
The statement of net assets and the statement of activities are comprised of governmental activities only:
Governmental activities – The Library’s services, support services and capital outlay are reported here. Property and other local taxes and government grants-in-aid finance most of these activities. Benefits provided through governmental activities are not necessarily paid for by the people receiving them.
Reporting the Library’s Most Significant Funds
Fund financial statements provide detailed information about the Library’s major funds – not the Library as a whole. The Library establishes separate funds to better manage its many activities and to help demonstrate that money that is restricted as to how it may be used is being spent for the intended purpose. The funds of the Library are split into two categories: governmental and fiduciary.
Governmental Funds - Most of the Library’s activities are reported in governmental funds. The governmental fund financial statements provide a detailed view of the Library’s governmental operations and the basic services it provides. Governmental fund information helps determine whether there are more or less financial resources that can be spent to finance the Library’s programs. The Library’s significant governmental funds are presented on the financial statements in separate columns. The information for non-major funds (funds whose activity or balances are not large enough to warrant separate reporting) is combined and presented in total in a single column. The Library’s major governmental funds are the General Fund and the Building and Repair Fund. The programs reported in governmental funds are identical to those reported in the governmental activities section of the entity-wide statements.
Fiduciary Funds - Fiduciary funds are used to account for resources held for the benefit of parties outside the Library. Fiduciary funds are not reflected on the government-wide financial statements because the resources of these funds are not available to support the Library’s programs. The Library has one fiduciary fund, an agency fund for a flexible spending benefit account.
The Library as a Whole
Table 1 provides a summary of the Library’s net assets for 2009 compared to 2008 on a cash basis:
Net Assets:Restricted $246,777 $246,097 $680Unrestricted 21,242,151 21,964,590 (722,439)Total Net Assets $21,488,928 $22,210,687 ($721,759)
Governmental Activities
Net Assets - Cash Basis(Table 1)
5
Dayton Metro Library Management’s Discussion and Analysis For the Year Ended December 31, 2009
Unaudited
As mentioned previously, net assets of governmental activities decreased $721,759 or 3.2 percent during 2009. Expenditures decreased by 6.6% and receipts decreased by 13.4%. The Building and Repair Fund represents $11,256,493 or 55.2% of all unreserved governmental fund balance. These funds are presently earmarked to assist in financing infrastructure improvements that the Library has determined are warranted as outlined in the Library’s Strategic and Facilities plans.
Table 2 reflects the changes in net assets on a cash basis in 2009 and 2008 for governmental activities.
(Table 2)Changes in Net Assets
GovernmentalReceipts: ActivitiesProgram Receipts: 2009 2008 Charges for Services and Sales 740,288$ 725,979$ Operating Grants and Contributions 29,344 84,119Total Program Receipts 769,632 810,098General Receipts: Property and Other Local Taxes 7,850,485 8,303,677 Unrestricted Gifts and Contributions 42,830 21,861 Sale of Capital Assets - 208 Grants and Entitlements Not Restricted 17,672,232 20,760,585 to Specific Programs Interest 135,556 598,174 Miscellaneous 65,595 149,386Total General Receipts 25,766,698 29,833,891Total Receipts 26,536,330 30,643,989
Disbursements:Library Services: Public Service and Programs 16,761,226 17,463,256 Collection Development and Processing 5,730,793 6,895,649Support Services: Facilities Operation and Maintenance 493,175 499,147 Information Services Support 890,633 881,057 Business Administration 2,829,410 2,546,515Capital Outlay 552,852 907,098Total Disbursements 27,258,089 29,192,722
Increase (Decrease) in Net Assets (721,759) 1,451,267
Net Assets, January 1 22,210,687 20,759,420Net Assets, December 31 $21,488,928 $22,210,687
6
Dayton Metro Library Management’s Discussion and Analysis For the Year Ended December 31, 2009
Unaudited
General receipts represent 97.1% of the Government’s total receipts, and of this amount, approximately 29.6% are property and other local taxes. Program receipts represent only 2.9 percent of total receipts and are primarily comprised of patron fees, grants, contributions and services provided to other entities. Earnings on investments account for 0.5% of the general receipts. State grants and entitlements comprise 68.6% of the Library’s general receipts.
Disbursements for library services consist of expenses for public service and program and collection development and processing. Library service costs for 2009 were 82.5% of total disbursements. Disbursement for support services consist of expenses for facilities operations and maintenance, information services support, and business administration.
Capital Outlay expenditures of $552,852 represented 2.0% of expenditures and were primarily for the following:
� The Main Library purchased for $11,746 a table & chairs and a workstation for the Children’s area.
� The IT department upgraded software for Smartfilter and for Win Way Deluxe Resume Writing Software for $23,333 and $13,639 respectively. The IT department also upgraded the McAfee Active Virus Scan software for $6,333 and Envisionware software for $12,375, and purchased 181 HP D5800ES Computers for $109,781, 8 Cisco 2811-S Routers for $35,718, and 40 HP Business Notebooks 6730S for $26,237.
� Two major building repairs were incurred during 2009, one, the roof at the Brookville Library was replaced for $89,246, and two, the boiler at the EC Doren Library for $24,875.
� Eight self-check stations were added to these branches: New Lebanon, Huber Heights, East, Westwood, Fort McKinley, Brookville and Belmont. These stations, at a total cost of $81,008, allowing patrons to check-out their library materials without needing a staff member to wait on them. Employees will have more time to spend helping patrons to research and locate the items that they need.
Governmental Activities
If you look at the Statement of Activities on page 11, you will see that the first column lists the major services provided by the Library. The next column identifies the costs of providing these services. The major program disbursements for governmental activities are for public service and programs and collection development and processing, which account for 61.5% and 21.0% of all governmental disbursements, respectively. Business administration, facilities operations, and information services support represents 15.5% of all government spending. The next two columns of the statement entitled Program Cash Receipts identify amounts paid by individuals and organizations that are directly charged for services or grants received by the Library that must be used to provide a specific service. The Net Receipt (Disbursement) column compares the program receipts to the cost of the service. This “net cost” amount represents the cost of the service which ends up being paid from money provided by local taxpayers and grants, entitlements, interest earnings and other miscellaneous receipts. These net costs are paid from the general receipts which are presented at the bottom of the Statement. A comparison between the total cost of services and the net cost of services for 2009 and 2008 is presented in Table 3.
7
Dayton Metro Library Management’s Discussion and Analysis For the Year Ended December 31, 2009
Unaudited
(Table 3)
Total Cost Net Cost Total Cost Net Costof Service of Service of Service of Service
Library Services: Public Service and Programs $16,761,226 ($16,115,354) $17,463,256 ($16,855,778) Collection Development and Processing 5,730,793 (5,699,063) 6,895,649 (6,792,937)Support Services: Facilities Operation and Maintenance 493,175 (493,175) 499,147 (499,147) Information Services Support 890,633 (798,603) 881,057 (781,149) Business Administration 2,829,410 (2,829,410) 2,546,515 (2,546,515) Capital Outlay 552,852 (552,852) 907,098 (907,098)
Total Expenses $27,258,089 ($26,488,457) $29,192,722 ($28,382,624)
Governmental Activities2009 2008
Library Service expenditures decreased by $1,866,886 or 7.7% versus 2008 primarily attributable to decreased expenditures in Services, and acquisition of library materials.
Library Service salaries and wages decreased $137,396 or 1.1% over 2008. Benefit costs, mainly driven by an increase in health insurance premiums were $101,140 or 2.4% over 2008. Consistent with our strategic initiatives, library material expenditures decreased by $1,033,890 or 22.0% over 2008.
Capital Outlay decreased $354,246 as only critical capital expenditures were addressed in 2009.
The dependence upon property tax receipts and unrestricted grants and entitlements is apparent as over 97.1% of governmental activities are supported through these general receipts.
The Library’s Funds
As illustrated on the Statement of Cash Receipts, Disbursements, and Changes in Fund Balance – Governmental Funds on page 13, total governmental funds had receipts of $26,536,330 and disbursements of $27,258,089. The General Fund is the chief operating fund of the Library. The fund balance of the General Fund decreased $810,111.
As illustrated on the Statement of Assets and Fund Balances – Governmental Funds on page 12, at the end of the current fiscal year, unreserved fund balance of the General Fund was $6,991,888, while the total General Fund balance reached $7,858,663. As a measure of the General Fund’s liquidity, it may be useful to compare both unreserved fund balance and total fund balance to total fund expenditures. Unreserved fund balance represents 25.8% of total General expenditures, while total fund balance represents 29.0% of that same amount.
General Fund Budgeting Highlights
The Library’s budget is prepared according to Ohio law and is based upon accounting for certain transactions on a basis of cash receipts, disbursements, and encumbrances. The most significant budgeted fund is the General Fund.
8
Dayton Metro Library Management’s Discussion and Analysis For the Year Ended December 31, 2009
Unaudited
As illustrated on the Statement of Receipts, Disbursements and Changes in Fund Balance – Budget and Actual – General Fund on page 14, final receipts were budgeted at $26,358,316 while actual receipts were $26,443,559. The difference between final budgeted receipts and actual receipts was $85,243.
Final disbursements were budgeted at $29,228,044 while actual disbursements were $27,986,150. The Library kept spending below budgeted amounts as demonstrated by the reported variances, but above realized receipts. In addition, the Library made $134,294 in transfers from the general fund to other governmental funds.
Capital Assets
The Library does not report capital assets on its financial statements. The Library does keep track of its capital assets and infrastructure independently. The Library uses a separate software package to accomplish this task. In 2009, the inventory information was internally audited by the Finance Department and corrections, deletions, and additions were recorded.
Debt
The Library has no debt.
Current Issues
With few exceptions Ohio’s public libraries depend on the State of Ohio for the majority of their funding. Funds are generated and distributed by the Public Library Fund (PLF). The Public Library Fund, as outlined in the Ohio Revised Code, represents 1.97% of the State’s total general fund tax receipts. While the diversity of state revenue taxes was intended to provide future growth to the Public Library Fund, current economic conditions has actually resulted in a decrease in state tax collections, and therefore, a corresponding decrease in financial support from the State. Further erosion of the state’s tax receipts are expected to continue into 2010 and depending on the depth of the current recession, declines in state receipts may continue well into 2011.
The Library is partially shielded from this decline in state support by the 1.75 mil operating levy approved by voters in 2009. Many libraries in the state have no operating levy support. For the Library the local property tax levies have provided approximately 30% of the library’s annual receipts over the last five years.
The Senior Management along with the Board of Directors has been developing strategic plans for the library system that will sustain operations well into the future. The challenge will remain as to how we provide 21st century library services to our constituents in a shrinking revenue environment.
Contacting the Library’s Financial Management
This financial report is designed to provide our citizens, taxpayers, investors, and creditors with a general overview of the Library’s finances and to reflect the Library’s accountability for the money it receives, spends and invests. Questions concerning any of the information in this report or requests for additional information should be directed to Mr. Timothy Kambitsch, Executive Director, Dayton Metro Library, 215 East Third Street, Dayton, Ohio 45402-2103. We also offer information regarding the Dayton Metro Library on our web site, www.daytonmetrolibrary.org.
9
Dayton Metro LibraryMontgomery County
Statement of Net Assets - Cash BasisDecember 31, 2009
GovernmentalActivities
AssetsEquity in Pooled Cash and Cash Equivalents 21,242,151$Restricted Assets: Cash and Cash Equivalents 246,777
Total Assets 21,488,928$
Net AssetsRestricted for: Endowment 246,777$Unrestricted 21,242,151
Total Net Assets 21,488,928$
See accompanying notes to the basic financial statements
10
Net (Disbursements)Receipts and Changes
Program Cash Receipts in Net Assets
Charges OperatingCash for Services Grants and Governmental
Disbursements and Sales Contributions Activities
Governmental Activities Library Services: Public Service and Programs 16,761,226$ 641,484$ 4,388$ (16,115,354)$ Collection Development and Processing 5,730,793 6,774 24,956 (5,699,063) Support Services: Facilities Operation and Maintenance 493,175 - - (493,175) Information Services Support 890,633 92,030 - (798,603) Business Administration 2,829,410 - - (2,829,410) Capital Outlay 552,852 - - (552,852)
Total Governmental Activities 27,258,089 740,288 29,344 (26,488,457)
General ReceiptsProperty Taxes Levied for General Purposes 7,850,485Unrestricted Gifts and Contributions 42,830Grants and Entitlements not Restricted to Specific Programs 17,672,232Earnings on Investment 135,555Miscellaneous 65,596
Total General Receipts 25,766,698
Change in Net Assets (721,759)
Net Assets Beginning of Year 22,210,687
Net Assets End of Year 21,488,928$
See accompanying notes to the basic financial statements
Dayton Metro Library
Statement of Activities - Cash BasisFor the Year Ended December 31, 2009
Montgomery County
11
Dayton Metro LibraryMontgomery County
Statement of Assets and Fund Balances - Cash BasisGovernmental FundsDecember 31, 2009
Other TotalBuilding & Governmental Governmental
General Repair Fund Funds Funds
AssetsEquity in Pooled Cash and Cash Equivalents 7,858,663$ 11,256,492$ 2,126,996$ 21,242,151$Restricted Assets: Cash and Cash Equivalents - - 246,777 246,777Total Assets 7,858,663$ 11,256,492$ 2,373,773$ 21,488,928$
Fund BalancesReserved: Reserved for Encumbrances 866,774$ -$ -$ 866,774$ Reserved for Endowment - - 246,777 246,777Unreserved: Undesignated, Reported in: General Fund 6,991,889 - - 6,991,889 Special Revenue Funds - - 1,806,241 1,806,241 Capital Projects Funds - 11,256,492 320,755 11,577,247Total Fund Balances 7,858,663$ 11,256,492$ 2,373,773$ 21,488,928$
See accompanying notes to the basic financial statements
12
Dayton Metro LibraryMontgomery County
Statement of Cash Receipts, Disbursements and Changes in Fund Balances - Cash Basis Governmental Funds
For the Year Ended December 31, 2009
Other TotalBuilding and Governmental Governmental
General Repair Fund Funds FundsReceiptsProperty and Other Local Taxes 7,850,485$ -$ -$ 7,850,485$ Intergovernmental 17,672,232 - - 17,672,232 Patron Fines and Fees 641,484 - - 641,484 Services Provided to Other Entities 98,804 - - 98,804 Contributions, Gifts and Donations 72,174 - - 72,174 Earnings on Investments 42,784 86,451 6,320 135,555 Miscellaneous 65,596 - - 65,596
Total Receipts 26,443,559 86,451 6,320 26,536,330
DisbursementsCurrent: Library Services: Public Service and Programs 16,761,226 - - 16,761,226 Collection Development and Processing 5,730,793 - - 5,730,793 Support Services: Facilities Operation and Maintenance 493,175 - - 493,175 Information Services 890,633 - - 890,633 Business Administration 2,829,410 - - 2,829,410 Capital Outlay 414,139 127,913 10,800 552,852
Total Disbursements 27,119,376 127,913 10,800 27,258,089
Excess of Receipts Over (Under) Disbursements (675,817) (41,462) (4,480) (721,759)
Other Financing Sources (Uses)Transfers In - - 134,294 134,294 Transfers Out (134,294) - - (134,294)
Total Other Financing Sources (Uses) (134,294) - 134,294 -
Net Change in Fund Balances (810,111) (41,462) 129,814 (721,759)
Fund Balances Beginning of Year 8,668,774 11,297,954 2,243,959 22,210,687
Fund Balances End of Year 7,858,663$ 11,256,493$ 2,373,773$ 21,488,928$
See accompanying notes to the basic financial statements
13
Dayton Metro LibraryMontgomery County
Statement of Receipts, Disbursements and ChangesIn Fund Balance - Budget and Actual (Budget Basis)
General FundFor the Year Ended December 31, 2009
Budgeted Amounts Variance withOriginal Final Actual Final Budget
ReceiptsProperty and Other Local Taxes 7,775,678$ 7,876,658$ 7,850,485$ (26,173)$ Other Government Grants-In-Aid 19,345,347 17,655,941 17,672,232 16,291 Patron Fines and Fees 624,400 620,900 641,484 20,584 Services Provided to Other Entities 126,300 94,300 98,804 4,504 Contributions, Gifts and Donations 112,000 40,300 72,174 31,874 Earnings on Investments 83,300 37,317 42,784 5,467 Miscellaneous 32,900 32,900 65,596 32,696
Total Receipts 28,099,925 26,358,316 26,443,559 85,243
DisbursementsCurrent: Library Services: Salaries and Benefits 20,196,635 19,196,635 18,990,941 205,694 Supplies 633,314 533,314 455,206 78,108 Purchased and Contract Services 4,303,854 4,103,854 3,796,088 307,766 Library Materials and Information 5,342,502 4,642,942 4,143,977 498,965 Other 966,262 70,012 68,582 1,430 Capital Outlay 481,287 681,287 531,356 149,931
Total Disbursements 31,923,854 29,228,044 27,986,150 1,241,894
Excess of Receipts Over (Under) Disbursements (3,823,929) (2,869,728) (1,542,591) 1,327,137
Other Financing Sources (Uses)Advances In 4,820 4,820 - (4,820) Transfers Out (4,849,665) (200,000) (134,294) 65,706
-Total Other Financing Sources (Uses) (4,844,845) (195,180) (134,294) 60,886
Net Change in Fund Balance (8,668,774) (3,064,908) (1,676,885) 1,388,023
Prior Year Encumbrances Appropriated 1,456,710 1,456,710 1,456,710 -
Fund Balance Beginning of 2009 7,212,064 7,212,064 7,212,064 -
Fund Balance End of 2009 -$ 5,603,866$ 6,991,889$ 1,388,023$
See accompanying notes to the basic financial statements
14
Dayton Metro LibraryMontgomery County
AgencyAssetsEquity in Pooled Cash and Cash Equivalents 33,237$
Total Assets 33,237$
Net Assets 33,237$
See accompanying notes to the basic financial statements
Statement of Fiduciary Net Assets - Cash BasisFiduciary Funds
December 31, 2009
15
Dayton Metro Library Notes to the Basic Financial Statements For the Year Ended December 31, 2009
Note 1 – Description of the Library and Reporting Entity
The Dayton Metro Library is organized as a county library under the laws of the State of Ohio. The Library has its own Board of Trustees consisting of seven members: four of whom are appointed by the Montgomery County Commissioners and three of whom are appointed by the Montgomery County Common Pleas Court Judges. Appointments are for seven-year terms and members serve without compensation. Under Ohio statutes, the Library is a body politic and corporate capable of suing and being sued, contracting, acquiring, holding, possessing, and disposing of real property, and of exercising such other powers and privileges conferred upon it by law. The Library also determines and operates under its own budget. Control and management of the Library is governed by sections 3375.33 to 3375.39 of the Ohio Revised Code with the administration of the day-to-day operations of the Library and financial accountability being the responsibility of the Executive Director/Fiscal Officer.
The Library is fiscally independent of Montgomery County, although Montgomery County serves in a ministerial capacity as the taxing authority for the Library. The determination to request approval of a tax levy, the role and purpose(s) of the levy, are discretionary decisions made solely by the Board of Library Trustees. Once those decisions are made, Montgomery County must put the levy on the ballot. There is no potential for the Library to provide a financial benefit to or impose a financial burden on Montgomery County.
Component units are legally separate organizations for which the Library is financially accountable. The Library is financially accountable for an organization if the Library appoints a voting majority of the organization's governing board and (1) the Library is able to significantly influence the programs or services performed or provided by the organization; or (2) the Library is legally entitled to or can otherwise access the organization's resources; the Library is legally obligated or has otherwise assumed the responsibility to finance the deficits of, or provide financial support to, the organization; or the Library is obligated for the debt of the organization. The Library is also financially accountable for any organizations for which the Library approves the budget, the issuance of debt or the levying of taxes. Component units also include legally separate, tax-exempt entities whose resources are for the direct benefit of the Library, are accessible to the Library and are significant in amount to the Library. The Library has no component units.
The Friends of the Dayton Metro Library is a not-for-profit organization with a self-appointing board. The Library is not financially accountable for the organization, nor does the Library approve the budget or the issuance of debt of the organization. The economic resources received or held by the Friends of the Library are not significant to the Library. Therefore, this organization has been excluded from the reporting entity of the Library.
The Library’s management believes these financial statements present all activities for which the Library is financially accountable.
Note 2 - Summary of Significant Accounting Policies
As discussed further in Note 2.C, the financial statements of the Dayton Metro Library have been prepared on a cash basis of accounting. This cash basis of accounting differs from accounting principles generally accepted in the United States of America (GAAP). Generally accepted accounting principles include all relevant Governmental Accounting Standards Board (GASB) pronouncements, which have been applied to the extent they are applicable to the cash basis of accounting. In the government-wide financial statements, Financial Accounting Standards Board (FASB) pronouncements and Accounting Principles Board (APB) opinions issued on or before November 30, 1989, have been applied, to the extent they are applicable to the cash basis of accounting, unless those pronouncements conflict with or contradict GASB pronouncements, in which case GASB prevails. The most significant of the Library’s accounting policies are described below.
16
Dayton Metro Library Notes to the Basic Financial Statements For the Year Ended December 31, 2009
Note 2 - Summary of Significant Accounting Policies (continued)
A. Basis of Presentation
The Library’s basic financial statements consist of government-wide statements, including a statement of net assets and a statement of activities, and fund financial statements, which provide a more detailed level of financial information.
Government-wide Financial Statements
The statement of net assets and the statement of activities display information about the Library as a whole. These statements include the financial activities of the primary government, except for fiduciary funds. Governmental activities generally are financed through taxes, intergovernmental receipts and other non-exchange transactions.
The statement of net assets presents the cash and cash equivalent balances of the governmental activities of the Library at year end. The statement of activities compares disbursements with program receipts for each of the Library's governmental activities. Disbursements are reported by function. A function is a group of related activities designed to accomplish a major service or regulatory program for which the Library is responsible. Program receipts include charges paid by the recipient of the program’s goods or services, grants and contributions restricted to meeting the operational or capital requirements of a particular program, and receipts of interest earned on grants that are required to be used to support a particular program. General receipts are all receipts not classified as program receipts, with certain limited exceptions. The comparison of direct disbursements with program receipts identifies the extent to which each governmental function is self-financing on a cash basis or draws from the Library’s general receipts.
Fund Financial Statements
During the year, the Library segregates transactions related to certain Library functions or activities in separate funds in order to aid financial management and to demonstrate legal compliance. Fund financial statements are designed to present financial information of the Library at this more detailed level. The focus of governmental fund financial statements is on major funds. Each major fund is presented in a separate column. Non-major funds are aggregated and presented in a single column. Fiduciary funds are reported by type.
B. Fund Accounting
The Library uses funds to maintain its financial records during the year. A fund is defined as a fiscal and accounting entity with a self balancing set of accounts. The Library’s funds are divided into two categories, governmental and fiduciary.
Governmental Funds
Governmental funds are financed primarily from taxes, intergovernmental receipts (e.g. grants), and other non-exchange transactions. Monies are assigned to the various governmental funds according to the purposes for which they may or must be used. The following are the Library's major governmental funds:
General Fund - The general fund accounts for all financial resources except those required to be accounted for in another fund. The general fund balance is available to the Library for any purpose provided it is expended or transferred according to the general laws of Ohio.
17
Dayton Metro Library Notes to the Basic Financial Statements For the Year Ended December 31, 2009
Note 2 – Summary of Significant Accounting Policies (continued)
Building and Repair Fund - The building and repair fund accounts for monies set aside by the Board of Library Trustees specifically for building projects, including the improvements to the Library and construction of new and future facilities.
The other governmental funds of the Library are the computer fund, special revenue fund, trust and endowment funds.
Fiduciary Funds
Fiduciary funds include pension trust funds, investment trust funds, private purpose trust funds, and agency funds. Trust funds are used to account for assets held under a trust agreement for individuals, private organizations, or other governments which are not available to support the Library’s own programs. Agency funds are purely custodial in nature and are used to hold resources for individuals, organizations or other governments. The Library’s agency fund accounts for reimbursements of eligible expenses under the health or dependent care flexible spending account.
C. Basis of Accounting
The Library’s financial statements are prepared using the cash basis of accounting. Under this basis of accounting, receipts are recorded in the Library’s financial records and reported in the financial statements when cash is received rather than when earned and disbursements are recorded when cash is paid rather than when a liability is incurred.
As a result of the use of this cash basis of accounting, certain assets and their related revenues (such as accounts receivable and revenue for billed or provided services not yet collected) and certain liabilities and their related expenses (such as accounts payable and expenses for goods or services received but not yet paid, and accrued liabilities and the related expenses) are not recorded in these financial statements. Therefore, when reviewing the financial information and discussion within this report, the reader should keep in mind the limitations resulting from the use of the cash basis of accounting.
D. Budgetary Process
All funds, (except agency funds), are legally required to be appropriated. The appropriations resolution is the Trustee’s authorization to spend resources and sets limits on cash disbursements plus encumbrances at the level of control selected by the Trustees. The legal level of control has been established at the fund and major category of the object code level for all funds. Budgetary modifications at the legal level of control may only be made by resolution of the Board of Library Trustees.
For control purposes, the Library estimates cash receipts for the year. These estimated receipts, together with the unencumbered carry-over balances from the prior year, set a limit on the amount the Trustees may appropriate. The estimated receipts may be revised during the year if projected increases or decreases in receipts are identified by the Fiscal Officer. The amounts reported as the original budgeted amounts on the budgetary statements reflect the amounts of estimated resources when the original appropriations were adopted. The amounts reported as the final budgeted amounts on the budgetary statements reflect the amounts of estimated resources at the time final appropriations were enacted by the Trustees.
18
Dayton Metro Library Notes to the Basic Financial Statements For the Year Ended December 31, 2009
Note 2 – Summary of Significant Accounting Policies (continued)
The appropriations resolution is subject to amendment throughout the year with the restriction that appropriations should not exceed estimated resources. The amounts reported as the original budgeted amounts reflect the first appropriation ordinance for that fund that covered the entire year, including amounts automatically carried forward from prior years. The amounts reported as the final budgeted amounts represent the final appropriation amounts passed by the Trustees during the year.
E. Cash and Cash Equivalents
Library records identify the purchase of specific investments by specific funds.
To improve cash management, cash received by the Library is pooled and invested. Individual fund integrity is maintained through the Library's records. Interest in the pool is presented as “Equity in Pooled Cash and Cash Equivalents.”
All investments of the cash management pool are presented on the financial statements as cash equivalents. Purchases of investments are not recorded as disbursements, and sales of investments are not recorded as receipts. Gains or losses at the time of sale are recorded as receipts or negative receipts, respectively.
During 2009, investments were in STAR Ohio, two FDIC protected Certificates of Deposit, and in CDARS. STAR Ohio is an investment pool managed by the State Treasurer’s Office which allows governments within the State to pool their funds for investment purposes. STAR Ohio is not registered with the SEC as an investment company, but does operate in a manner consistent with Rule2a7 of the Investment Company Act of 1940. Investments in STAR Ohio are valued at STAR Ohio’s share price, which is the price the investment could be sold for on December 31, 2009. CDARS (Certificate of Deposit Account Registry Services) allows the library to purchase certificates of deposit in excess of the FDIC limit with a participating bank. The bank “redeposits” the excess amount above the FDIC limit into other participating institutions. Each bank accepts less than the FDIC limit so that all deposits have FDIC coverage and thus are fully insured.
Investment procedures are restricted by the provisions of the Ohio Revised Code. Interest receipt credited to the General Fund, Building and Repair Fund, and Other Governmental Funds during 2009 amounted to $42,784, $86,451, and $6,320, respectively.
F. Restricted Assets
Cash, cash equivalents, and investments are reported as restricted when limitations on their use change the nature or normal understanding of their use. Such constraints are either imposed by creditors, contributors, grantors, or laws of other governments, or imposed by law through constitutional provisions or enabling legislation. The government-wide statement of net assets reports $246,777 which is restricted by contributors.
G. Capital Assets
Acquisitions of property, plant and equipment are recorded as disbursements when paid. These items are not reflected as assets in the accompanying financial statements.
19
Dayton Metro Library Notes to the Basic Financial Statements For the Year Ended December 31, 2009
Note 2 – Summary of Significant Accounting Policies (continued)
H. Employer Contributions to Cost-Sharing Pension Plans
The Library recognizes the disbursement for their employer contributions to cost-sharing pension plans when they are paid. As described in Notes 8 and 10, the employer contributions include portions for pension benefits and for postretirement health care benefits.
I. Net Assets
Net assets are reported as restricted when there are limitations imposed on their use either through enabling legislation or through external restrictions imposed by creditors, grantors, or laws or regulations of other governments.
The Library’s policy is to first apply restricted resources when an obligation is incurred for purposes for which both restricted and unrestricted net assets are available.
J. Fund Balance Reserves
The Library reserves any portion of fund balances which is not available for appropriation or which is legally segregated for a specific future use. Unreserved fund balance indicates that portion of fund balance which is available for appropriation in future periods. Fund balance reserves have been established for encumbrances and endowments.
K. Interfund Transactions
Exchange transactions between funds are reported as receipts in the seller funds and as disbursements in the purchaser funds. Subsidies from one fund to another without a requirement for repayment are reported as interfund transfers. Interfund transfers are reported as other financing sources/uses in governmental funds. Repayments from funds responsible for particular disbursements to the funds that initially paid for them are not presented in the financial statements. The Library uses interfund transfers to move unrestricted general fund revenues to finance various programs that the government must account for in other funds in accordance with budgetary authorizations.
Note 3 – Budgetary Basis of Accounting
The budgetary basis as provided by law is based upon accounting for certain transactions on the basis of cash receipts, disbursements, and encumbrances. The Statement of Receipts, Disbursements and Changes in Fund Balance – Budget and Actual – Budgetary Basis presented for the general fund is prepared on the budgetary basis to provide a meaningful comparison of actual results with the budget. The difference between the budgetary basis and the cash basis is outstanding year end encumbrances, which are treated as disbursements (budgetary basis) rather than as a reservation of fund balance (cash basis). The encumbrances outstanding at year end (budgetary basis) amounted to $866,774 for the general fund.
Note 4 – Deposits and Investments
Monies held by the Library are classified by State statute into three categories.
Active monies are public monies determined to be necessary to meet current demands upon the Library treasury. Active monies must be maintained either as cash in the Library treasury, in commercial accounts payable or withdrawable on demand, including negotiable order of withdrawal (NOW) accounts, or in money
20
Dayton Metro Library Notes to the Basic Financial Statements For the Year Ended December 31, 2009
Note 4 – Deposits and Investments (continued)
market deposit accounts.
Inactive deposits are public deposits that the Board has identified as not required for use within the current five year period of designation of depositories. Inactive deposits must either be evidenced by certificates of deposit maturing not later than the end of the current period of designation of depositories, or by savings or deposit accounts including, but not limited to, passbook accounts.
Interim deposits are deposits of interim monies. Interim monies are those monies which are not needed for immediate use but which will be needed before the end of the current period of designation of depositories. Interim deposits must be evidenced by time certificates of deposit maturing not more than one year from the date of deposit or by savings or deposit accounts, including passbook accounts.
Interim monies held by the Library can be deposited or invested in the following securities:
1. United States Treasury bills, bonds, notes, or any other obligation or security issued by the United States Treasury, or any other obligation guaranteed as to principal and interest by the United States;
2. Bonds, notes, debentures, or any other obligation or security issued by any federal government agency or instrumentality including, but not limited to, the Federal National Mortgage Association, Federal Home Loan Bank, Federal Farm Credit Bank, Federal Home Loan Mortgage Corporation, Government National Mortgage Association, and Student Loan Marketing Association. All federal agency securities shall be direct issuances of federal government agencies or instrumentalities;
3. Written repurchase agreements in the securities listed above provided the market value of the securities subject to the repurchase agreement must exceed the principal value of the agreement by at least 2 percent and be marked to market daily, and the term of the agreement must not exceed thirty days;
4. Bonds and other obligations of the State of Ohio or Ohio local governments;
5. Time certificates of deposit or savings or deposit accounts including, but not limited to, passbook accounts;
6. No-load money market mutual funds consisting exclusively of obligations described in division (1) or (2) and repurchase agreements secured by such obligations, provided that investments in securities described in this division are made only through eligible institutions;
7. The State Treasurer’s investment pool (STAR Ohio).
8. Certificates of Deposits (CDs) properly insured through the FDIC or suitable collateralization, including the Certificate of Deposit Account Registry Services (CDARS). Effective March 4, 2006, the Ohio General Assembly created Ohio Revised Code 135.144 permitting the library to use the Certificate of Deposit Account Registry Services (CDARS). If the library purchases certificates of deposit for more than the FDIC limit (adjusted to $250,000 in 2008 through the end of 2013), with a bank participating in CDARS, the bank “redeposits” the excess amounts with other participating institutions. Each bank accepts less than the FDIC limit so all deposits have FDIC coverage.
21
Dayton Metro Library Notes to the Basic Financial Statements For the Year Ended December 31, 2009
Note 4 – Deposits and Investments (continued)
9. Commercial Paper and bankers acceptances if Ohio Revised Code training requirements have been met.
Investments in stripped principal or interest obligations, reverse repurchase agreements, and derivatives are prohibited. The issuance of taxable notes for the purpose of arbitrage, the use of leverage, and short selling are also prohibited. An investment must mature within five years from the date of purchase, unless matched to a specific obligation or debt of the Library, and must be purchased with the expectation that it will be held to maturity. Investments may only be made through specified dealers and institutions.
At year end, the Library had $3,024 in undeposited cash on hand which is included as part of “Equity in Pooled Cash and Cash Equivalents” on the financial statements.
Deposits
Custodial credit risk for deposits is the risk that in the event of bank failure, the Library will not be able to recover deposits or collateral securities that are in the possession of an outside party. At year end, $3,358,603 of the Library’s bank balance of $12,444,380 was exposed to custodial credit risk because those deposits were uninsured and collateralized with securities held by the pledging financial institution’s trust department or agent, but not in the Library’s name.
The Library has no deposit policy for custodial risk beyond the requirements of State statute. Ohio law requires that deposits be either insured or be protected by eligible securities pledged to and deposited either with the Library or a qualified trustee by the financial institution as security for repayment, or by a collateral pool of eligible securities deposited with a qualified trustee and pledged to secure the repayment of all public monies deposited in the financial institution whose market value at all times shall be at least one hundred five percent of the deposits being secured.
Investments
Interest Rate Risk: Interest rate risk arises because the fair value of investment changes as interest rates change. The Library’s investment policy addresses interest rate risk by requiring that the Library’s investment portfolio be structured so that securities mature to meet cash requirements for ongoing operations and/or long-term debt payments, thereby avoiding that need to sell securities on the open market prior to maturity, and by investing operating funds primarily in short-term investments.
State statute requires that an investment mature within five years from the date of purchase, unless matched to a specific obligation or debt of the Library, and that an investment be purchased with the expectation that it will be held to maturity.
At year end the Library had investment in STAR Ohio at a fair value of $9,801,215. STAR Ohio has a maturity of less than one year and is not subject to interest rate penalty on maturity issues.
Credit Risk: STAR Ohio carries a rating of AAAm by Standard and Poor’s. The Library has no investment policy dealing with investment credit risk beyond the requirements in state statues. Ohio law requires that STAR Ohio maintain the highest rating provided by at least one nationally recognized standard rating service. The Library’s investment policy limits investments to those authorized by State statute.
22
Dayton Metro Library Notes to the Basic Financial Statements For the Year Ended December 31, 2009
Note 4 – Deposits and Investments (continued)
Custodial Credit Risk: For an investment, custodial credit risk is the risk that, in the event of the failure of the counterparty, the Library will not be able to recover the value of its investments or collateral securities that are in the possession of an outside party. The Library has no investment policy dealing with investment custodial risk beyond the requirements in ORC 135.14(M)(2) which states, “Payment for investments shall be made only upon the delivery of securities representing such investments to the treasurer, investing authority, or qualified trustee. If the securities transferred are not represented by a certificate, payment shall be made only upon receipt of confirmation of transfer from the custodian by the treasurer, governing board, or qualified trustee.”
The Library places no limit on the amount it may invest in any one issuer; however, investments are limited to low risk securities with the expectation of earning market rate of return.
Note 5 – Public Library Fund
The primary source of revenue for Ohio public libraries is the Public Library Fund (PLF). The PLF is allocated to each county based on the county’s prior intangibles tax of PLF revenues, and its population. The County Budget Commission allocates these funds to the Library based on its needs such as for the construction of new library buildings, improvements, operation, maintenance, or other expenses. The Budget Commission cannot reduce its allocation of these funds to the Library based on any additional revenues the Library receives. During 2009, the Library received $15,361,658 or 58.1% of its total cash receipts from this funding source.
Note 6 – Property Taxes
Property taxes include amounts levied against all real property, public utility property, and tangible personal property located in the taxing district of the Library within Montgomery County. Real property tax receipts received in 2009 represent the collection of 2008 taxes. Real property taxes received in 2009 were levied after October 1, 2008 on the assessed values as of January 1, 2008, the lien date. Assessed values for real property taxes are established by State statute at 35 percent of appraised market value. Property taxes are also reduced for applicable homestead and rollback deductions. Homestead and rollback amounts are then paid by the State and are reflected in the accompanying financial statements as Other Governments Grants-in-Aid. Real property taxes are payable annually or semiannually.
Public utility property tax receipts received in 2009 represent the collection of 2008 taxes. Public utility real and tangible personal property taxes received in 2009 became a lien on December 31, 2008, were levied after October 1, 2008, and are collected with real property taxes. Public utility real property is assessed at 35 percent of true value; public utility tangible personal property is currently assessed at varying percentages of true value.
Montgomery County is responsible for assessing property, and for billing, collecting, and distributing all property taxes on behalf of the Library.
23
Dayton Metro Library Notes to the Basic Financial Statements For the Year Ended December 31, 2009
Note 7 - Risk Management
The Library is exposed to various risks of loss related to torts; theft of, damage to, and destruction of assets; errors and omissions; injuries to employees; and natural disasters. During 2009, the Library contracted with several companies for various types of insurance coverage as follows:
Company Type of Coverage Amount of Coverage
Chubb Insurance Group Building (blanket) $40,052,729 EDP Property 2,401,545 Contents 49,549,098
Third Party Property 53,657 Extra Expense (blanket) 3,000,000
Public Officials 5,000,000 Cincinnati Insurance Boiler & Machinery 25,000,000
Automobile 1,000,000 General Liability 1,000,000
Settled claims have not exceeded coverage in any of the last three years and there was no significant reduction in coverage from the prior year.
The Library pays the State Workers’ Compensation System a premium based on a rate per $100 of salaries. This rate is calculated based on accident history and administrative costs. The State Workers’ Compensation System administers and pays all claims.
Note 8 - Defined Benefit Pension Plan
Plan Description - The Library participates in the Ohio Public Employees Retirement System (OPERS). OPERS administers three separate pension plans. The traditional plan is a cost-sharing, multiple-employer defined benefit pension plan. The member-directed plan is a defined contribution plan in which the member invests both member and employer contributions (employer contributions vest over five years at 20 percent per year). Under the member-directed plan, members accumulate retirement assets equal to the value of the member and vested employer contributions plus any investment earnings. The combined plan is a cost-sharing, multiple-employer defined benefit pension plan that has elements of both a defined benefit and a defined contribution plan. Under the combined plan, employer contributions are invested by the retirement system to provide a formula retirement benefit similar to the traditional plan benefit. Member contributions, whose investment is self-directed by the member, accumulate retirement assets in a manner similar to the member-directed plan.
OPERS provides retirement, disability, survivor and death benefits and annual cost-of-living adjustments to members of the traditional and combined plans. Members of the member-directed plan do not qualify for ancillary benefits. Authority to establish and amend benefits is provided by Chapter 145 of the Ohio Revised Code. OPERS issues a stand-alone financial report that may be obtained by writing to OPERS, 277 East Town Street, Columbus, OH 43215-4642 or by calling (614) 222-5601 or (800) 222-7377.
Funding Policy – The Ohio Revised Code provides statutory authority for member and employer contributions. For the year ended December 31, 2009, members in state and local classifications contributed 10.0 percent of covered payroll.
24
Dayton Metro Library Notes to the Basic Financial Statements For the Year Ended December 31, 2009
Note 8 - Defined Benefit Pension Plan (continued)
The Library’s contribution rate for 2009 was 14.0 percent of covered payroll. For the period January 1, through March 31, 2009, a portion of the Library’s contribution equal to 7.0 percent of covered payroll was allocated to fund the postemployement healthcare plan. For the period April 1, 2009 through December 31, 2009, a portion of the Library’s contribution equal to 5.5 percent of covered payroll was allocated to fund the postemployment healthcare plan. Employer contribution rates are actuarially determined. State statute sets a maximum contribution rate for the Library of 14 percent.
The Library’s required contributions for pension obligations to the traditional, combined, and member- directed plans for the years ended December 31, 2009, 2008, and 2007 were $1,117,751, 983,298, and $1,129,758 respectively. The full amount has been contributed for 2009, 2008 and 2007.
Note 9 – Employee Benefits – Deferred Compensation Plan
Employees of the Library may elect to participate in the Ohio Public Employees Deferred Compensation Plan. Under this program, employees elect to defer a portion of their pay. The deferred pay and any income earned on it are not subject to federal and state income taxation until actually received by the employee. Participation in the plan is optional. The deferred compensation is not available to employees until termination of employment, retirement, death or unforeseen emergency.
Note 10 – Post-employment Benefits
Plan Description – Ohio Public Employees Retirement System (OPERS) administers three separate pension plans: The Traditional Pension Plan – a cost-sharing, multiple-employer defined benefit pension plan; the Member-Directed Plan – a defined contribution plan; and the Combined Plan – a cost sharing, multiple-employer defined benefit pension that has elements of both a defined benefit and defined contribution plan.
OPERS maintains a cost-sharing multiple-employer defined benefit post-employment healthcare plan, which includes a medical plan, prescription drug program and Medicare Part B premium reimbursement, to qualifying members of both the Traditional Pension and the Combined Plans. Members of the Member-Directed Plan do not qualify for ancillary benefits, including post-employment healthcare coverage.
To qualify for post-employment health care coverage, age-and-service retirees under the Traditional Pension and Combined Plans must have ten years or more years of qualifying Ohio service credit. Health care coverage for disability benefit recipients and qualified survivor benefit recipients is available. The Ohio Revised code permits, but does not require, OPERS to provide health care benefits to eligible members and beneficiaries. Authority to establish and amend benefits is provided in Chapter 145 of the Ohio Revised Code. The heath care coverage provided by OPERS meets the definition of an Other Post Employment Benefit (OPEB) as described in GASB Statement 45.
Disclosures for the health care plan are provided separately in the OPERS financial report which may be obtained by writing to OPERS, 277 East Town Street, Columbus, Ohio 43215-4642 or by calling (614) 222-5601 or (800) 222-7377.
Funding Policy – The Ohio Revised Code provides the statutory authority requiring public employers to fund post retirement health care through their contributions to OPERS. A portion of each employer’s contribution to OPERS is set aside for the funding of post retirement health care benefits.
25
Dayton Metro Library Notes to the Basic Financial Statements For the Year Ended December 31, 2009
Note 10 – Post-employment Benefits (continued)
Employer contribution rates are expressed as a percentage of the covered payroll of active members. In 2009, local government employers contributed 14.0 percent of covered payroll. OPERS’ Post Employment Health Care plan was established under, and is administrated in accordance with, Internal Revenue Code 401 (h). Each year, The OPERS retirement board determines the portion of the employer contribution that will be set aside for funding post-employment healthcare benefits. For the period January 1, through March 31, 2009, a portion of the Library’s contribution equal to 7.0 percent of covered payroll was allocated to fund the post-employment healthcare plan. For the period April 1, 2009 through December 31, 2009, a portion of the Library’s contribution equal to 5.5 percent of covered payroll was allocated to fund the postemployment healthcare plan.
The OPERS Retirement Board is also authorized to establish rules for the payment of a portion of the healthcare benefits by the retiree or retiree’s surviving beneficiaries. Payment amounts vary depending on the number of covered dependents and selected coverage.
The Library’s contributions allocated to fund post-employment healthcare benefits for the years ended December 31, 2009, 2008, and 2007 were $819,022, $983,298, and $745,464 respectively; 100 percent has been contributed for 2009, 2008 and 2007.
On September 9, 2004, the OPERS Retirement Board adopted a Health Care Preservation Plan (HCPP) which was effective January 1, 2007. Member and employer contribution rates increased as of January 1, 2006, January 1, 2007, and January 1, 2008, which allowed additional funds to be allocated to the health care plan.
Note 11 – Operating Leases
The Library leases buildings and other equipment under non-cancelable leases. The Library disbursed $228,004 to pay lease costs for the year ended December 31, 2009. Future lease payments are as follows:
Office Lease – The Library leases three spaces at various locations to provide additional services. A summary of the lease agreements is as follows:
Huber Heights – For fiscal year 2009, lease expense amounted to $140,050. The current lease agreement expires on December 31, 2010, with two renewal options for terms of ten years through December 31, 2035. Because the Library has the option not to renew after 2010, only the lease payments through the current lease term are included in the above table of future lease payments.
Moraine – The Library leases space to provide Outreach Services. The lease expense for 2009 amounted to $73,357. The current lease agreement expires on April 30, 2016.
26
Dayton Metro Library Notes to the Basic Financial Statements For the Year Ended December 31, 2009
Note 11 – Operating Leases (continued)
Northmont – The City of Englewood leases a building to the Library for which the Library is responsible for occupancy costs such as electric, gas and maintenance. Because the agreement does not include a base rent and occupancy costs can vary, those costs are not included in the above table of future lease payments. Occupancy costs are approximately $27,000 annually.
Parking Spaces – The Library leases twenty-seven (27) parking spaces for an annual cost of $6,000. The lease is for a term of one year and, in the absence of notification from either party, automatically renews for an unlimited number of successive one-year terms. Due to the infinite nature of the lease, the lease payments are not included in the above table of future lease payments.
Copier Leases – The Library leases four copiers at an annual cost of $10,684. One of the copier leases expire in fiscal year 2010 with the remaining leases expiring in fiscal year 2012.
Note 12 – Interfund Transfers
The general fund transferred $81,927 to the special revenue fund for additional funds needed to cover accrued and vested employee compensated absences. The general fund transferred $52,367 to the Computer fund for the purchase of a future generation of Library Information Systems.
27
2525 north limestone street, ste. 103 springfield, oh 45503
www.cshco.comp. 937.399.2000 f. 937.399.5433
cincinnati | columbus | dayton | middletown | springfield
REPORT ON INTERNAL CONTROL OVER FINANCIAL REPORTING AND ON COMPLIANCE AND OTHER MATTERS BASED ON AN AUDIT OF FINANCIAL STATEMENTS PERFORMED IN ACCORDANCE WITH GOVERNMENT AUDITING STANDARDS
Board of Trustees Dayton Metro Library 215 E. Third Street Dayton, Ohio 45402
We have audited the financial statements of the governmental activities, each major fund, and the aggregate remaining fund information of Dayton Metro Library (the Library) as of and for the year ended December 31, 2009, which collectively comprise the Library’s basic financial statements and have issued our report thereon dated May 25, 2010, wherein we noted the Library reported on the cash basis of accounting. We conducted our audit in accordance with auditing standards generally accepted in the United States of America and the standards applicable to financial audits contained in Government Auditing Standards, issued by the Comptroller General of the United States.
Internal Control Over Financial Reporting
In planning and performing our audit, we considered the Library’s internal control over financial reporting as a basis for designing our auditing procedures for the purpose of expressing our opinions on the financial statements, but not for the purpose of expressing an opinion on the effectiveness of the Library’s internal control over financial reporting. Accordingly, we do not express an opinion on the effectiveness of the Library’s internal control over financial reporting.
A deficiency in internal control exists when the design or operation of a control does not allow management or employees, in the normal course of performing their assigned functions, to prevent or detect misstatements on a timely basis. A material weakness is a deficiency, or combination of deficiencies, in internal control such that there is a reasonable possibility that a material misstatement of the entity’s financial statements will not be prevented, or detected and corrected on a timely basis.
Our consideration of internal control over financial reporting was for the limited purpose described in the first paragraph of this section and was not designed to identify all deficiencies in internal control over financial reporting that might be deficiencies, significant deficiencies or material weaknesses. We did not identify any deficiencies in internal control over financial reporting that we consider to be material weaknesses as defined above.
28
Compliance and Other Matters
As part of obtaining reasonable assurance about whether the Library’s financial statements are free of material misstatement, we performed tests of its compliance with certain provisions of laws, regulations, contracts, and grant agreements, noncompliance with which could have a direct and material effect on the determination of financial statement amounts. However, providing an opinion on compliance with those provisions was not an objective of our audit, and accordingly, we do not express such an opinion. The results of our testing disclosed no instances of noncompliance or other matters that are required to be reported under Government Auditing Standards.
This report is intended solely for the information and use of management and the Board of Trustees and is not intended to be and should not be used by anyone other than these specified parties.
Springfield, Ohio May 25, 2010
29
88 E. Broad St. / Fourth Floor / Columbus, OH 43215‐3506 Telephone: (614) 466‐4514 (800) 282‐0370 Fax: (614) 466‐4490
www.auditor.state.oh.us
DAYTON METRO LIBRARY
MONTGOMERY COUNTY
CLERK’S CERTIFICATION This is a true and correct copy of the report which is required to be filed in the Office of the Auditor of State pursuant to Section 117.26, Revised Code, and which is filed in Columbus, Ohio.
Management’s Discussion and Analysis ........................................................................................... 3-10
Statement of Net Assets –Cash Basis ................................................................................................. 11
Statement of Activities –Cash Basis ..................................................................................................... 12
Statement of Assets and Fund Balances –Cash Basis – Governmental Funds ................................... 13
Statement of Cash Receipts, Disbursements and Changes in Fund Balances –Cash Basis – Governmental Funds ....................................................................... 14
Statement of Receipts, Disbursements and Changes in Fund Balances – Budget and Actual (Budget Basis) – General Fund ...................................................................................... 15
Statement of Fiduciary Net Assets –Cash Basis – Fiduciary Funds..................................................... 16
Notes to the Basic Financial Statements ........................................................................................ 17-28
Report on Internal Control Over Financial Reporting and on Compliance and Other Matters Based on an Audit of Financial Statements Performed in Accordance with Government Auditing Standards ..................................................................... 29-30
2525 north limestone street, ste. 103 springfield, oh 45503
www.cshco.comp. 937.399.2000 f. 937.399.5433
cincinnati | columbus | dayton | middletown | springfield
INDEPENDENT AUDITORS’ REPORT
Board of Trustees Dayton Metro Library 215 East Third Street Dayton, Ohio 45402
We have audited the accompanying financial statements of the governmental activities, each major fund and the aggregate remaining fund information of Dayton Metro Library (the Library), as of and for the year ended December 31, 2010, which collectively comprise the Library’s basic financial statements as listed in the table of contents. These financial statements are the responsibility of management. Our responsibility is to express opinions on these financial statements based on our audit.
We conducted our audit in accordance with auditing standards generally accepted in the United States of America and the standards applicable to financial audits contained in Government Auditing Standards, issued by the Comptroller General of the United States. Those standards require that we plan and perform the audit to reasonably assure whether the financial statements are free of material misstatement. An audit includes examining on a test basis, evidence supporting the amounts and disclosures in the financial statements. An audit also includes assessing the accounting principles used and significant estimates made by management, as well as evaluating the overall financial statement presentation. We believe our audit provides a reasonable basis for our opinions.
As discussed in Note 2, the accompanying financial statements and notes follow the cash accounting basis. This is a comprehensive accounting basis other than accounting principles generally accepted in the United States of America.
In our opinion, the financial statements referred to above present fairly, in all material respects, the respective cash basis financial position of the governmental activities, each major fund and the aggregate remaining fund information of Dayton Metro Library, as of December 31, 2010, and the respective changes in cash basis financial position and the respective budgetary comparisons for the General Fund for the year then ended in conformity with the accounting basis Note 2 describes.
In accordance with Government Auditing Standards, we have also issued our report dated May 31, 2011, on our consideration of the Library’s internal control over financial reporting and our tests of its compliance with certain provisions of laws, regulations, contracts and grant agreements and other matters. The purpose of that report is to describe the scope of our testing of internal control over financial reporting and compliance and the results of that testing, not to provide an opinion on the internal control over financial reporting on compliance. That report is an integral part of an audit performed in accordance with Government Auditing Standards and should be considered in assessing the results of our audit.
2
The Management’s Discussion and Analysis is not a required part of the basic financial statements but is supplementary information the Governmental Accounting Standards Board requires, who considers it to be an essential part of financial reporting for placing the basic financial statements in an appropriate operational, economic, or historical context. We have applied certain limited procedures, which consisted of inquiries of management about the methods of preparing the information and comparing the information for consistency with management’s responses to our inquiries, the basic financial statements, and other knowledge we obtained during our audit of the basic financial statements. We do not express an opinion or provide any assurance on the information because the limited procedures do not provide us with sufficient evidence to express an opinion or provide assurance.
Springfield, Ohio May 31, 2011
Dayton Metro Library Management’s Discussion and Analysis For the Year Ended December 31, 2010
Unaudited
The management’s discussion and analysis of the Dayton Metro Library’s (the Library) financial performance provides an overall review of the Library’s financial activities for the year ended December 31, 2010, within the limitations of the Library’s cash basis of accounting. The intent of the management’s discussion and analysis is to examine the Library’s financial performance as a whole. Readers should also review the basic financial statements and notes to enhance their understanding of the Library’s financial performance. Financial Highlights Key financial highlights for 2010 are as follows: Net assets of governmental activities increased $3,942,490, or 18.3%. Although expenditures for the
year decreased $910,319 or 3.3% from 2009, receipts from governmental activities increased $3,753,930 or 14.1% from 2009. The economic difficulty continued well into 2010 negatively affecting financial support from the State of Ohio. Support from the State of Ohio through the Public Library Fund was $929,718 or 6.1% less than 2009.
The Library’s general receipts are primarily made up of property and other local taxes ($11,772,448)
and other government grants-in-aid, such as the State’s Public Library Fund (PLF) ($17,464,464). These receipts represent respectively 38.9% and 57.7% of the total cash received for governmental activities during the year.
At the end of the fiscal year, the unreserved fund balance in the General fund was $ 7,544,047. This
amount represents 31.3% of total unreserved fund balance and 28.6% of 2010 General fund expenditures ($26,347,770).
Program specific receipts in the form of charges for services and sales, and operating grants and
contributions represent $807,943 or 2.7% of total receipts. This revenue is primarily comprised of charges for maintaining public service programs.
Due to the worldwide economy and its impact on the financial markets, interest rates remain at
historically low levels in 2010 thus having a dramatic negative effect on investment receipts. Although investment receipts increased from $135,555 in 2009 to $180,228 a 33.0% increase, they remain much lower than 2008 receipts of $598,174. In 2010, the Library did invest certain inactive funds in CDARS (Certificate of Deposit Account Registry Service) for public funds that produced a higher yield than savings or money market demand accounts. The average interest rate in 2010 was .12% as compared to .26% in 2009. The average investment yield was 4.19% in January 2008 and had dropped to .13% by December 2010.
Using This Annual Financial Report This annual report is presented in a format consistent with the presentation requirements of Governmental Accounting Standards Board Statement No. 34, as applicable to the Library’s cash basis of accounting. This annual report consists of a series of financial statements and notes to those statements. These statements are prepared and organized so the reader can understand the Library as a financial whole or as an entire operating entity. The statements provide a detailed look at the Library’s specific financial activities and conditions on a cash basis of accounting.
3
Dayton Metro Library Management’s Discussion and Analysis For the Year Ended December 31, 2010
Unaudited
Financial Report Components The statement of net assets and the statement of activities provide information about the cash activities of the Library as a whole. Fund financial statements provide a greater level of detail. Funds are created and maintained on the financial records of the Library as a way to segregate money whose use is restricted to a particular specified purpose. These statements present financial information by fund, presenting funds with the largest balances or most activity in separate columns. The notes to the financial statements are an integral part of the government-wide and fund financial statements and provide expanded explanation and detail regarding the information reported in the statements. Basis of Accounting The basis of accounting is a set of guidelines that determine when financial events are recorded. The Library has elected to present its financial statements on a cash basis of accounting. This basis of accounting is a basis of accounting other than generally accepted accounting principles. Under the Library’s cash basis of accounting, receipts and disbursements are recorded when cash is received or paid. As a result of using the cash basis of accounting, certain assets and their related receipts (such as accounts receivable) and certain liabilities and their related expenses (such as accounts payable) are not recorded in the financial statements. Therefore, when reviewing the financial information and discussion within this report, the reader must keep in mind the limitations resulting from the use of the cash basis of accounting. Reporting the Library as a Whole The statement of net assets and the statement of activities reflect how the Library did financially during 2010, within the limitations of cash basis accounting. The statement of net assets presents the cash balances and investments of the governmental activities of the Library at year end. The statement of activities compares cash disbursements with program receipts for each governmental program. Program receipts include charges paid by the recipient of the program’s goods or services and grants and contributions restricted to meeting the operational or capital requirements of a particular program. General receipts are all receipts not classified as program receipts. The comparison of cash disbursements with program receipts identifies how each governmental function activity draws from the Library’s general receipts. These statements report the Library’s cash position and the changes in cash position. Keeping in mind the limitations of the cash basis of accounting, you can think of these changes as one way to measure the Library’s financial health. Over time, increases or decreases in the Library’s cash position is one indicator of whether the Library’s financial health is improving or deteriorating. When evaluating the Library’s financial condition, you should also consider other non-financial factors as well, such as the Library’s property tax base, the condition of the Library’s capital assets, the extent of the Library’s debt obligations, the reliance on non-local financial resources for operations and the need for continued growth in the major local revenue sources such as property taxes.
4
Dayton Metro Library Management’s Discussion and Analysis For the Year Ended December 31, 2010
Unaudited
The statement of net assets and the statement of activities are comprised of governmental activities only:
Governmental activities – The Library’s services, support services and capital outlay are reported here. Property and other local taxes and government grants-in-aid finance most of these activities. Benefits provided through governmental activities are not necessarily paid for by the people receiving them.
Reporting the Library’s Most Significant Funds Fund financial statements provide detailed information about the Library’s major funds – not the Library as a whole. The Library establishes separate funds to better manage its many activities and to help demonstrate that money that is restricted as to how it may be used is being spent for the intended purpose. The funds of the Library are split into two categories: governmental and fiduciary.
Governmental Funds - Most of the Library’s activities are reported in governmental funds. The governmental fund financial statements provide a detailed view of the Library’s governmental operations and the basic services it provides. Governmental fund information helps determine whether there are more or less financial resources that can be spent to finance the Library’s programs. The Library’s significant governmental funds are presented on the financial statements in separate columns. The information for non-major funds (funds whose activity or balances are not large enough to warrant separate reporting) is combined and presented in total in a single column. The Library’s major governmental funds are the General Fund and the Building and Repair Fund. The programs reported in governmental funds are identical to those reported in the governmental activities section of the entity-wide statements.
Fiduciary Funds - Fiduciary funds are used to account for resources held for the benefit of parties outside the Library. Fiduciary funds are not reflected on the government-wide financial statements because the resources of these funds are not available to support the Library’s programs. The Library has one fiduciary fund, an agency fund for a flexible spending benefit account.
The Library as a Whole Table 1 provides a summary of the Library’s net assets for 2010 compared to 2009 on a cash basis:
Increase2010 2009 (Decrease)
AssetsCash and Cash Equivalents 25,431,418$ 21,488,928$ 3,942,490$ Total Assets 25,431,418$ 21,488,928$ 3,942,490
Net Assets:Restricted 247,044$ 246,777$ 267$ Unrestricted 25,184,374 21,242,151 3,942,223 Total Net Assets 25,431,418$ 21,488,928$ 3,942,490$
(Table 1)Net Assets - Cash Basis
Governmental Activities
5
Dayton Metro Library Management’s Discussion and Analysis For the Year Ended December 31, 2010
Unaudited
As mentioned previously, net assets of governmental activities increased $3,942,490 or 18.3 percent during 2010. Expenditures decreased by 3.3% and receipts increased by 14.1%. The Building and Repair Fund represents $14,369,158 or 59.6% of all unreserved government funds. These funds are presently earmarked to assist in financing infrastructure improvements that the Library has determined are warranted as outlined in the Library’s Strategic and Facilities plans. Table 2 reflects the changes in net assets on a cash basis in 2010 and 2009 for governmental activities.
(Table 2)Changes in Net Assets
GovernmentalReceipts: ActivitiesProgram Receipts: 2010 2009 Charges for Services and Sales 764,951$ 740,288$ Operating Grants and Contributions 42,992 29,344Total Program Receipts 807,943 769,632 General Receipts: Property and Other Local Taxes 11,772,448 7,850,485 Unrestricted Gifts and Contributions 33,385 42,830 Sale of Capital Assets 1,948 - Grants and Entitlements Not Restricted 17,464,464 17,672,232 to Specific Programs Interest 180,228 135,556 Miscellaneous 29,844 65,595Total General Receipts 29,482,317 25,766,698Total Receipts 30,290,260 26,536,330 Disbursements:Library Services: Public Service and Programs 16,447,613 16,761,226 Collection Development and Processing 5,227,184 5,730,793Support Services: Facilities Operation and Maintenance 509,288 493,175 Information Services Support 904,385 890,633 Business Administration 2,840,098 2,829,410Capital Outlay 419,202 552,852Total Disbursements 26,347,770 27,258,089
Increase (Decrease) in Net Assets 3,942,490 (721,759)
Net Assets, January 1 21,488,928 22,210,687Net Assets, December 31 $25,431,418 $21,488,928
6
Dayton Metro Library Management’s Discussion and Analysis For the Year Ended December 31, 2010
Unaudited
General receipts represent 97.3% of the Government’s total receipts, and of this amount, approximately 39.9% are property and other local taxes. Program receipts represent only 2.7 percent of total receipts and are primarily comprised of patron fees, grants, contributions and services provided to other entities. Earnings on investments account for 0.6% of the general receipts. State grants and entitlements comprise 59.2% of the Library’s general receipts. Disbursements for library services consist of expenses for public service and program and collection development and processing. Library service costs for 2010 were 82.3% of total disbursements. Disbursement for support services consist of expenses for facilities operations and maintenance, information services support, and business administration. Capital Outlay expenditures of $419,202 represented 1.6% of expenditures and were primarily for the following:
The IT department purchased 200 HP 6000 PRO Desktop Computers for $122,800, 13 Cisco 2811-S Routers for $34,014, and 19 HP Business Notebooks 4520 for $10,241.
Two major building repairs were incurred during 2010, one, the roof at the New Lebanon Library was replaced for $50,475, and two, the high efficiency boiler at the Burkhardt Library for $15,115.
Nine self-check stations were added to these branches:, Huber Heights Madden Hills, E. C. Doren, Dayton View, East, Westwood, Fort Mckinley, Northtown-Shiloh, Brookville and Belmont. These stations, at a total cost of $71,582, allowing patrons to check-out their library materials without needing a staff member to wait on them. Employees will have more time to spend helping patrons to research and locate the items that they need.
Governmental Activities If you look at the Statement of Activities on page 12, you will see that the first column lists the major services provided by the Library. The next column identifies the costs of providing these services. The major program disbursements for governmental activities are for public service and programs and collection development and processing, which account for 62.4% and 19.8% of all governmental disbursements, respectively. Business administration, facilities operations, and information services support represents 16.1% of all government spending. The next two columns of the statement entitled Program Cash Receipts identify amounts paid by individuals and organizations that are directly charged for services or grants received by the Library that must be used to provide a specific service. The Net Receipt (Disbursement) column compares the program receipts to the cost of the service. This “net cost” amount represents the cost of the service which ends up being paid from money provided by local taxpayers and grants, entitlements, interest earnings and other miscellaneous receipts. These net costs are paid from the general receipts which are presented at the bottom of the Statement. A comparison between the total cost of services and the net cost of services for 2010 and 2009 is presented in Table 3.
7
Dayton Metro Library Management’s Discussion and Analysis For the Year Ended December 31, 2010
Unaudited
(Table 3)
Total Cost Net Cost Total Cost Net Costof Service of Service of Service of Service
Library Services: Public Service and Programs $16,447,613 ($15,752,809) $16,761,226 ($16,115,354) Collection Development and Processing 5,227,184 (5,210,217) 5,730,793 (5,699,063)Support Services: Facilities Operation and Maintenance 509,288 (509,288) 493,175 (493,175) Information Services Support 904,385 (808,213) 890,633 (798,603) Business Administration 2,840,098 (2,840,098) 2,829,410 (2,829,410) Capital Outlay 419,202 (419,202) 552,852 (552,852)
Total Expenses $26,347,770 ($25,539,827) $27,258,089 ($26,488,457)
Governmental Activities2010 2009
Library Service expenditures decreased by $817,222 or 3.6% versus 2009 primarily attributable to decreased expenditures in Services, and acquisition of library materials. Library Service salaries and wages decreased $383,421 or 3.1% over 2009. Benefit costs, mainly driven by health insurance premiums and pension costs, decreased by $31,339 or 0.7% over 2009. Consistent with our strategic initiatives, library material expenditures decreased by $398,236 or 10.9% over 2009. Capital Outlay decreased $133,650 as only critical capital expenditures were addressed in 2010. The dependence upon property tax receipts and unrestricted grants and entitlements is apparent as over 97.3% of governmental activities are supported through these general receipts. The Library’s Funds As illustrated on the Statement of Cash Receipts, Disbursements, and Changes in Fund Balance – Governmental Funds on page 14, total governmental funds had receipts of $30,288,312 and disbursements of $26,347,770. The General Fund is the chief operating fund of the Library. The fund balance of the General Fund increased $773,499. As illustrated on the Statement of Assets and Fund Balances – Governmental Funds on page 13, at the end of the current fiscal year, unreserved fund balance of the General Fund was $7,544,047, while the total General Fund balance reached $8,632,162. As a measure of the General Fund’s liquidity, it may be useful to compare both unreserved fund balance and total fund balance to total fund expenditures. Unreserved fund balance represents 28.6% of total General expenditures, while total fund balance represents 32.8% of that same amount.
8
Dayton Metro Library Management’s Discussion and Analysis For the Year Ended December 31, 2010
Unaudited
General Fund Budgeting Highlights The Library’s budget is prepared according to Ohio law and is based upon accounting for certain transactions on a basis of cash receipts, disbursements, and encumbrances. The most significant budgeted fund is the General Fund. As illustrated on the Statement of Receipts, Disbursements and Changes in Fund Balance – Budget and Actual – General Fund on page 15, final receipts were budgeted at $29,451,030 while actual receipts were $30,172,469. The difference between final budgeted receipts and actual receipts was $721,439. Final disbursements were budgeted at $28,504,144 while actual disbursements were $27,435,885. The Library kept spending below budgeted amounts as demonstrated by the reported variances, but above realized receipts. In addition, the Library made $3,053,148 in transfers from the general fund to other governmental funds. Capital Assets The Library does not report capital assets on its financial statements. The Library does keep track of its capital assets and infrastructure independently. The Library uses a separate software package to accomplish this task. In 2010, the inventory information was internally audited by the Finance Department and corrections, deletions, and additions were recorded. Debt The Library has no debt. Current Issues With few exceptions Ohio’s public libraries depend on the State of Ohio for the major part of their funding. Funds are generated and distributed by the Public Library Fund (PLF). The Public Library Fund, as outlined in the Ohio Revised Code, represents 1.97% of the State’s total general fund tax receipts. While the diversity of state revenue taxes was intended to provide future growth to the Public Library Fund, current economic conditions has actually resulted in a decrease in state tax collections, and therefore, a corresponding decrease in financial support from the State. State funding represented only 47.8% of library funding in 2010 as opposed to 58.1% of funding in 2009. As recently as 1999, 87.6% of total library funding was through the State of Ohio. In the upcoming state biennial budget that begins July 1, 2011, the Public Library Fund is targeted for new cuts. As proposed by Governor John Kasich and as passed by the Ohio House of Representatives, beginning July 1, 2011 through June 30, 2013, Ohio libraries will receive only 95% of funds distributed during fiscal 2011for the period that began July 1, 2010 and ends June 30, 2011. The Library is partially shielded from this decline in state support by the 1.75 mil operating levy approved by voters in 2009. This support, however, is expected to also drop due to the triennial reassessment of property values in Montgomery County in 2011, effective for tax collections in 2012 through 2014. The housing market precipitous declines will almost certainly be reflected in property tax collections, projected to represent nearly 40% of total support from the local community. The Senior Management along with the Board of Directors have been developing strategic plans for the library system that will sustain operations well into the future. The challenge will remain as to how we provide 21st century library services to our constituents in a shrinking revenue environment.
9
Dayton Metro Library Management’s Discussion and Analysis For the Year Ended December 31, 2010
Unaudited
Contacting the Library’s Financial Management This financial report is designed to provide our citizens, taxpayers, investors, and creditors with a general overview of the Library’s finances and to reflect the Library’s accountability for the money it receives, spends and invests. Questions concerning any of the information in this report or requests for additional information should be directed to Mr. Timothy Kambitsch, Executive Director, Dayton Metro Library, 215 East Third Street, Dayton, Ohio 45402-2103. We also offer information regarding the Dayton Metro Library on our web site, www.daytonmetrolibrary.org.
10
Dayton Metro LibraryMontgomery County
Statement of Net Assets - Cash BasisDecember 31, 2010
GovernmentalActivities
AssetsEquity in Pooled Cash and Cash Equivalents 25,184,374$ Restricted Assets: Cash and Cash Equivalents 247,044
Total Assets 25,431,418$
Net AssetsRestricted for: Endowment 247,044$ Unrestricted 25,184,374
Total Net Assets 25,431,418$
See accompanying notes to the basic financial statements
11
Net (Disbursements)Receipts and Changes
Program Cash Receipts in Net Assets
Charges OperatingCash for Services Grants and Governmental
Disbursements and Sales Contributions Activities
Governmental Activities Library Services: Public Service and Programs 16,447,613$ 664,978$ 29,826$ (15,752,809)$ Collection Development and Processing 5,227,184 3,801 13,166 (5,210,217) Support Services: Facilities Operation and Maintenance 509,288 - - (509,288) Information Services Support 904,385 96,172 - (808,213) Business Administration 2,840,098 - - (2,840,098) Capital Outlay 419,202 - - (419,202)
Total Governmental Activities 26,347,770 764,951 42,992 (25,539,827)
General ReceiptsProperty Taxes Levied for General Purposes 11,772,448Unrestricted Gifts and Contributions 33,385Grants and Entitlements not Restricted to Specific Programs 17,464,464Sale of Capital Assets 1,948Earnings on Investment 180,228Miscellaneous 29,844
Total General Receipts 29,482,317
Change in Net Assets 3,942,490
Net Assets Beginning of Year 21,488,928
Net Assets End of Year 25,431,418$
See accompanying notes to the basic financial statements
Dayton Metro Library
Statement of Activities - Cash BasisFor the Year Ended December 31, 2010
Montgomery County
12
Dayton Metro LibraryMontgomery County
Statement of Assets and Fund Balances - Cash BasisGovernmental FundsDecember 31, 2010
Other TotalBuilding & Governmental Governmental
General Repair Fund Funds Funds
AssetsEquity in Pooled Cash and Cash Equivalents 8,632,162$ 14,369,158$ 2,183,054$ 25,184,374$ Restricted Assets: Cash and Cash Equivalents - - 247,044 247,044 Total Assets 8,632,162$ 14,369,158$ 2,430,098$ 25,431,418$
Fund BalancesReserved: Reserved for Encumbrances 1,088,115$ -$ -$ 1,088,115$ Reserved for Endowment - - 247,044 247,044 Unreserved: Undesignated, Reported in: General Fund 7,544,047 - - 7,544,047 Special Revenue Funds - - 1,808,803 1,808,803 Capital Projects Funds - 14,369,158 374,251 14,743,409 Total Fund Balances 8,632,162$ 14,369,158$ 2,430,098$ 25,431,418$
See accompanying notes to the basic financial statements
13
Dayton Metro LibraryMontgomery County
Statement of Cash Receipts, Disbursements and Changes in Fund Balances - Cash Basis Governmental Funds
For the Year Ended December 31, 2010
Other TotalBuilding and Governmental Governmental
General Repair Fund Funds FundsReceiptsProperty and Other Local Taxes 11,772,448$ -$ -$ 11,772,448$ Intergovernmental 17,464,464 - - 17,464,464 Patron Fines and Fees 664,978 - - 664,978 Services Provided to Other Entities 99,973 - - 99,973 Contributions, Gifts and Donations 76,377 - - 76,377 Earnings on Investments 64,385 112,666 3,177 180,228 Miscellaneous 29,844 - - 29,844
Total Receipts 30,172,469 112,666 3,177 30,288,312
DisbursementsCurrent: Library Services: Public Service and Programs 16,447,613 - - 16,447,613 Collection Development and Processing 5,227,184 - - 5,227,184 Support Services: Facilities Operation and Maintenance 509,288 - - 509,288 Information Services 904,385 - - 904,385 Business Administration 2,840,098 - - 2,840,098 Capital Outlay 419,202 - - 419,202
Total Disbursements 26,347,770 - - 26,347,770
Excess of Receipts Over (Under) Disbursements 3,824,699 112,666 3,177 3,940,542
Other Financing Sources (Uses)Sale of Capital Assets 1,948 - - 1,948 Transfers In - 3,000,000 53,148 3,053,148 Transfers Out (3,053,148) - - (3,053,148)
Total Other Financing Sources (Uses) (3,051,200) 3,000,000 53,148 1,948
Net Change in Fund Balances 773,499 3,112,666 56,325 3,942,490
Fund Balances Beginning of Year 7,858,663 11,256,492 2,373,773 21,488,928
Fund Balances End of Year 8,632,162$ 14,369,158$ 2,430,098$ 25,431,418$
See accompanying notes to the basic financial statements
14
Dayton Metro LibraryMontgomery County
Statement of Receipts, Disbursements and ChangesIn Fund Balance - Budget and Actual (Budget Basis)
General FundFor the Year Ended December 31, 2010
Budgeted Amounts Variance withOriginal Final Actual Final Budget
ReceiptsProperty and Other Local Taxes 11,525,650$ 11,525,650$ 11,772,448$ 246,798$ Other Government Grants-In-Aid 15,952,399 17,011,382 17,464,464 453,082 Patron Fines and Fees 752,198 666,198 664,978 (1,220) Services Provided to Other Entities 100,000 100,000 99,973 (27) Contributions, Gifts and Donations 53,000 53,000 76,377 23,377 Earnings on Investments 110,800 64,800 64,385 (415) Miscellaneous 30,000 30,000 29,844 (156)
Total Receipts 28,524,047 29,451,030 30,172,469 721,439
DisbursementsCurrent: Library Services: Salaries and Benefits 18,666,941 18,866,941 18,642,241 224,700 Supplies 501,941 501,941 441,442 60,499 Purchased and Contract Services 4,094,766 4,094,766 3,914,491 180,275 Library Materials and Information 4,165,124 4,165,124 3,877,639 287,485 Other 965,500 85,500 76,391 9,109 Capital Outlay 989,872 789,872 483,681 306,191
Total Disbursements 29,384,144 28,504,144 27,435,885 1,068,259
Excess of Receipts Over (Under) Disbursements (860,097) 946,886 2,736,584 1,789,698
Other Financing Sources (Uses)Sale of Capital Assets - - 1,948 1,948 Transfers Out (150,000) (3,150,000) (3,053,148) 96,852
- Total Other Financing Sources (Uses) (150,000) (3,150,000) (3,051,200) 98,800
Net Change in Fund Balance (1,010,097) (2,203,114) (314,616) 1,888,498
Prior Year Encumbrances Appropriated 866,774 866,774 866,774 -
Fund Balance Beginning of 2010 6,991,889 6,991,889 6,991,889 -
Fund Balance End of 2010 6,848,566$ 5,655,549$ 7,544,047$ 1,888,498$
See accompanying notes to the basic financial statements
15
Dayton Metro LibraryMontgomery County
AgencyAssetsEquity in Pooled Cash and Cash Equivalents 31,741$
Total Assets 31,741$
Net Assets 31,741$
See accompanying notes to the basic financial statements
Statement of Fiduciary Net Assets - Cash BasisFiduciary Funds
December 31, 2010
16
Dayton Metro Library Notes to the Basic Financial Statements For the Year Ended December 31,2010
Note 1 – Description of the Library and Reporting Entity The Dayton Metro Library is organized as a county library under the laws of the State of Ohio. The Library has its own Board of Trustees consisting of seven members: four of whom are appointed by the Montgomery County Commissioners and three of whom are appointed by the Montgomery County Common Pleas Court Judges. Appointments are for seven-year terms and members serve without compensation. Under Ohio statutes, the Library is a body politic and corporate capable of suing and being sued, contracting, acquiring, holding, possessing, and disposing of real property, and of exercising such other powers and privileges conferred upon it by law. The Library also determines and operates under its own budget. Control and management of the Library is governed by sections 3375.33 to 3375.39 of the Ohio Revised Code with the administration of the day-to-day operations of the Library and financial accountability being the responsibility of the Executive Director/Fiscal Officer. The Library is fiscally independent of Montgomery County, although Montgomery County serves in a ministerial capacity as the taxing authority for the Library. The determination to request approval of a tax levy, the role and purpose(s) of the levy, are discretionary decisions made solely by the Board of Library Trustees. Once those decisions are made, Montgomery County must put the levy on the ballot. There is no potential for the Library to provide a financial benefit to or impose a financial burden on Montgomery County. Component units are legally separate organizations for which the Library is financially accountable. The Library is financially accountable for an organization if the Library appoints a voting majority of the organization's governing board and (1) the Library is able to significantly influence the programs or services performed or provided by the organization; or (2) the Library is legally entitled to or can otherwise access the organization's resources; the Library is legally obligated or has otherwise assumed the responsibility to finance the deficits of, or provide financial support to, the organization; or the Library is obligated for the debt of the organization. The Library is also financially accountable for any organizations for which the Library approves the budget, the issuance of debt or the levying of taxes. Component units also include legally separate, tax-exempt entities whose resources are for the direct benefit of the Library, are accessible to the Library and are significant in amount to the Library. The Library has no component units. The Friends of the Dayton Metro Library is a not-for-profit organization with a self-appointing board. The Library is not financially accountable for the organization, nor does the Library approve the budget or the issuance of debt of the organization. The economic resources received or held by the Friends of the Library are not significant to the Library. Therefore, this organization has been excluded from the reporting entity of the Library. The Library’s management believes these financial statements present all activities for which the Library is financially accountable. Note 2 - Summary of Significant Accounting Policies As discussed further in Note 2.C, the financial statements of the Dayton Metro Library have been prepared on a cash basis of accounting. This cash basis of accounting differs from accounting principles generally accepted in the United States of America (GAAP). Generally accepted accounting principles include all relevant Governmental Accounting Standards Board (GASB) pronouncements, which have been applied to the extent they are applicable to the cash basis of accounting. In the government-wide financial statements, Financial Accounting Standards Board (FASB) pronouncements and Accounting Principles Board (APB) opinions issued on or before November 30, 1989, have been applied, to the extent they are applicable to the cash basis of accounting, unless those pronouncements conflict with or contradict GASB pronouncements, in which case GASB prevails. The most significant of the Library’s accounting policies are described below.
17
Dayton Metro Library Notes to the Basic Financial Statements For the Year Ended December 31,2010
Note 2 - Summary of Significant Accounting Policies (continued) A. Basis of Presentation The Library’s basic financial statements consist of government-wide statements, including a statement of net assets and a statement of activities, and fund financial statements, which provide a more detailed level of financial information. Government-wide Financial Statements The statement of net assets and the statement of activities display information about the Library as a whole. These statements include the financial activities of the primary government, except for fiduciary funds. Governmental activities generally are financed through taxes, intergovernmental receipts and other non-exchange transactions. The statement of net assets presents the cash and cash equivalent balances of the governmental activities of the Library at year end. The statement of activities compares disbursements with program receipts for each of the Library's governmental activities. Disbursements are reported by function. A function is a group of related activities designed to accomplish a major service or regulatory program for which the Library is responsible. Program receipts include charges paid by the recipient of the program’s goods or services, grants and contributions restricted to meeting the operational or capital requirements of a particular program, and receipts of interest earned on grants that are required to be used to support a particular program. General receipts are all receipts not classified as program receipts, with certain limited exceptions. The comparison of direct disbursements with program receipts identifies the extent to which each governmental function is self-financing on a cash basis or draws from the Library’s general receipts. Fund Financial Statements During the year, the Library segregates transactions related to certain Library functions or activities in separate funds in order to aid financial management and to demonstrate legal compliance. Fund financial statements are designed to present financial information of the Library at this more detailed level. The focus of governmental fund financial statements is on major funds. Each major fund is presented in a separate column. Non-major funds are aggregated and presented in a single column. Fiduciary funds are reported by type. B. Fund Accounting The Library uses funds to maintain its financial records during the year. A fund is defined as a fiscal and accounting entity with a self balancing set of accounts. The Library’s funds are divided into two categories, governmental and fiduciary. Governmental Funds Governmental funds are financed primarily from taxes, intergovernmental receipts (e.g. grants), and other non-exchange transactions. Monies are assigned to the various governmental funds according to the purposes for which they may or must be used. The following are the Library's major governmental funds:
General Fund - The general fund accounts for all financial resources except those required to be accounted for in another fund. The general fund balance is available to the Library for any purpose provided it is expended or transferred according to the general laws of Ohio.
18
Dayton Metro Library Notes to the Basic Financial Statements For the Year Ended December 31,2010
Note 2 – Summary of Significant Accounting Policies (continued)
Building and Repair Fund - The building and repair fund accounts for monies set aside by the Board of Library Trustees specifically for building projects, including the improvements to the Library and construction of new and future facilities.
The other governmental funds of the Library are the computer fund, special revenue fund, trust and endowment funds. Fiduciary Funds Fiduciary funds include pension trust funds, investment trust funds, private purpose trust funds, and agency funds. Trust funds are used to account for assets held under a trust agreement for individuals, private organizations, or other governments which are not available to support the Library’s own programs. Agency funds are purely custodial in nature and are used to hold resources for individuals, organizations or other governments. The Library’s agency fund accounts for reimbursements of eligible expenses under the health or dependent care flexible spending account. C. Basis of Accounting The Library’s financial statements are prepared using the cash basis of accounting. Under this basis of accounting, receipts are recorded in the Library’s financial records and reported in the financial statements when cash is received rather than when earned and disbursements are recorded when cash is paid rather than when a liability is incurred. As a result of the use of this cash basis of accounting, certain assets and their related revenues (such as accounts receivable and revenue for billed or provided services not yet collected) and certain liabilities and their related expenses (such as accounts payable and expenses for goods or services received but not yet paid, and accrued liabilities and the related expenses) are not recorded in these financial statements. Therefore, when reviewing the financial information and discussion within this report, the reader should keep in mind the limitations resulting from the use of the cash basis of accounting. D. Budgetary Process All funds, (except agency funds), are legally required to be appropriated. The appropriations resolution is the Trustee’s authorization to spend resources and sets limits on cash disbursements plus encumbrances at the level of control selected by the Trustees. The legal level of control has been established at the fund and major category of the object code level for all funds. Budgetary modifications at the legal level of control may only be made by resolution of the Board of Library Trustees. For control purposes, the Library estimates cash receipts for the year. These estimated receipts, together with the unencumbered carry-over balances from the prior year, set a limit on the amount the Trustees may appropriate. The estimated receipts may be revised during the year if projected increases or decreases in receipts are identified by the Fiscal Officer. The amounts reported as the original budgeted amounts on the budgetary statements reflect the amounts of estimated resources when the original appropriations were adopted. The amounts reported as the final budgeted amounts on the budgetary statements reflect the amounts of estimated resources at the time final appropriations were enacted by the Trustees.
19
Dayton Metro Library Notes to the Basic Financial Statements For the Year Ended December 31,2010
Note 2 – Summary of Significant Accounting Policies (continued) The appropriations resolution is subject to amendment throughout the year with the restriction that appropriations should not exceed estimated resources. The amounts reported as the original budgeted amounts reflect the first appropriation ordinance for that fund that covered the entire year, including amounts automatically carried forward from prior years. The amounts reported as the final budgeted amounts represent the final appropriation amounts passed by the Trustees during the year. E. Cash and Cash Equivalents Library records identify the purchase of specific investments by specific funds. To improve cash management, cash received by the Library is pooled and invested. Individual fund integrity is maintained through the Library's records. Interest in the pool is presented as “Equity in Pooled Cash and Cash Equivalents.” All investments of the cash management pool are presented on the financial statements as cash equivalents. Purchases of investments are not recorded as disbursements, and sales of investments are not recorded as receipts. Gains or losses at the time of sale are recorded as receipts or negative receipts, respectively. During 2010, investments were in STAR Ohio, and in Certificate of Deposit Account Registry (CDARS). STAR Ohio is an investment pool managed by the State Treasurer’s Office which allows governments within the State to pool their funds for investment purposes. STAR Ohio is not registered with the SEC as an investment company, but does operate in a manner consistent with Rule2a7 of the Investment Company Act of 1940. Investments in STAR Ohio are valued at STAR Ohio’s share price, which is the price the investment could be sold for on December 31, 2010. CDARS allows the library to purchase certificates of deposit in excess of the FDIC limit with a participating bank. The bank “redeposits” the excess amount above the FDIC limit into other participating institutions. Each bank accepts less than the FDIC limit so that all deposits have FDIC coverage and thus are fully insured. Investment procedures are restricted by the provisions of the Ohio Revised Code. Interest receipt credited to the General Fund, Building and Repair Fund, and Other Governmental Funds during 2010 amounted to $64,385, $,112,666 and $3,177, respectively. F. Restricted Assets Cash, cash equivalents, and investments are reported as restricted when limitations on their use change the nature or normal understanding of their use. Such constraints are either imposed by creditors, contributors, grantors, or laws of other governments, or imposed by law through constitutional provisions or enabling legislation. The government-wide statement of net assets reports $247,044 which is restricted by contributors. G. Capital Assets Acquisitions of property, plant and equipment are recorded as disbursements when paid. These items are not reflected as assets in the accompanying financial statements.
20
Dayton Metro Library Notes to the Basic Financial Statements For the Year Ended December 31,2010
Note 2 – Summary of Significant Accounting Policies (continued) H. Employer Contributions to Cost-Sharing Pension Plans The Library recognizes the disbursement for their employer contributions to cost-sharing pension plans when they are paid. As described in Notes 8 and 10, the employer contributions include portions for pension benefits and for postretirement health care benefits. I. Net Assets Net assets are reported as restricted when there are limitations imposed on their use either through enabling legislation or through external restrictions imposed by creditors, grantors, or laws or regulations of other governments. The Library’s policy is to first apply restricted resources when an obligation is incurred for purposes for which both restricted and unrestricted net assets are available. J. Fund Balance Reserves The Library reserves any portion of fund balances which is not available for appropriation or which is legally segregated for a specific future use. Unreserved fund balance indicates that portion of fund balance which is available for appropriation in future periods. Fund balance reserves have been established for encumbrances and endowments. K. Interfund Transactions Exchange transactions between funds are reported as receipts in the seller funds and as disbursements in the purchaser funds. Subsidies from one fund to another without a requirement for repayment are reported as interfund transfers. Interfund transfers are reported as other financing sources/uses in governmental funds. Repayments from funds responsible for particular disbursements to the funds that initially paid for them are not presented in the financial statements. The Library uses interfund transfers to move unrestricted general fund revenues to finance various programs that the government must account for in other funds in accordance with budgetary authorizations. Note 3 – Budgetary Basis of Accounting The budgetary basis as provided by law is based upon accounting for certain transactions on the basis of cash receipts, disbursements, and encumbrances. The Statement of Receipts, Disbursements and Changes in Fund Balance – Budget and Actual – Budgetary Basis presented for the general fund is prepared on the budgetary basis to provide a meaningful comparison of actual results with the budget. The difference between the budgetary basis and the cash basis is outstanding year end encumbrances, which are treated as disbursements (budgetary basis) rather than as a reservation of fund balance (cash basis). The encumbrances outstanding at year end (budgetary basis) amounted to $1,088,115 for the general fund. Note 4 – Deposits and Investments Monies held by the Library are classified by State statute into three categories. Active monies are public monies determined to be necessary to meet current demands upon the Library treasury. Active monies must be maintained either as cash in the Library treasury, in commercial accounts payable or withdrawable on demand, including negotiable order of withdrawal (NOW) accounts, or in money
21
Dayton Metro Library Notes to the Basic Financial Statements For the Year Ended December 31,2010
Note 4 – Deposits and Investments (continued) market deposit accounts. Inactive deposits are public deposits that the Board has identified as not required for use within the current five year period of designation of depositories. Inactive deposits must either be evidenced by certificates of deposit maturing not later than the end of the current period of designation of depositories, or by savings or deposit accounts including, but not limited to, passbook accounts. Interim deposits are deposits of interim monies. Interim monies are those monies which are not needed for immediate use but which will be needed before the end of the current period of designation of depositories. Interim deposits must be evidenced by time certificates of deposit maturing not more than one year from the date of deposit or by savings or deposit accounts, including passbook accounts. Interim monies held by the Library can be deposited or invested in the following securities:
1. United States Treasury bills, bonds, notes, or any other obligation or security issued by the United States Treasury, or any other obligation guaranteed as to principal and interest by the United States;
2. Bonds, notes, debentures, or any other obligation or security issued by any federal government
agency or instrumentality including, but not limited to, the Federal National Mortgage Association, Federal Home Loan Bank, Federal Farm Credit Bank, Federal Home Loan Mortgage Corporation, Government National Mortgage Association, and Student Loan Marketing Association. All federal agency securities shall be direct issuances of federal government agencies or instrumentalities;
3. Written repurchase agreements in the securities listed above provided the market value of the
securities subject to the repurchase agreement must exceed the principal value of the agreement by at least 2 percent and be marked to market daily, and the term of the agreement must not exceed thirty days;
4. Bonds and other obligations of the State of Ohio or Ohio local governments;
5. Time certificates of deposit or savings or deposit accounts including, but not limited to, passbook
accounts;
6. No-load money market mutual funds consisting exclusively of obligations described in division (1) or (2) and repurchase agreements secured by such obligations, provided that investments in securities described in this division are made only through eligible institutions;
7. The State Treasurer’s investment pool (STAR Ohio).
8. Certificates of Deposits (CDs) properly insured through the FDIC or suitable collateralization,
including the Certificate of Deposit Account Registry Services (CDARS). Effective March 4, 2006, the Ohio General Assembly created Ohio Revised Code 135.144 permitting the library to use the Certificate of Deposit Account Registry Services (CDARS). If the library purchases certificates of deposit for more than the FDIC limit, with a bank participating in CDARS, the bank “redeposits” the excess amounts with other participating institutions. Each bank accepts less than the FDIC limit so all deposits have FDIC coverage.
22
Dayton Metro Library Notes to the Basic Financial Statements For the Year Ended December 31,2010
Note 4 – Deposits and Investments (continued)
9. Commercial Paper and bankers acceptances if Ohio Revised Code training requirements have been met.
Investments in stripped principal or interest obligations, reverse repurchase agreements, and derivatives are prohibited. The issuance of taxable notes for the purpose of arbitrage, the use of leverage, and short selling are also prohibited. An investment must mature within five years from the date of purchase, unless matched to a specific obligation or debt of the Library, and must be purchased with the expectation that it will be held to maturity. Investments may only be made through specified dealers and institutions. At year end, the Library had $3,024 in undeposited cash on hand which is included as part of “Equity in Pooled Cash and Cash Equivalents” on the financial statements. Deposits Custodial credit risk for deposits is the risk that in the event of bank failure, the Library will not be able to recover deposits or collateral securities that are in the possession of an outside party. At year end, $6,005,738 of the Library’s bank balance of $21,872,494 was exposed to custodial credit risk because those deposits were uninsured and collateralized with securities held by the pledging financial institution’s trust department or agent, but not in the Library’s name. The Library has no deposit policy for custodial risk beyond the requirements of State statute. Ohio law requires that deposits be either insured or be protected by eligible securities pledged to and deposited either with the Library or a qualified trustee by the financial institution as security for repayment, or by a collateral pool of eligible securities deposited with a qualified trustee and pledged to secure the repayment of all public monies deposited in the financial institution whose market value at all times shall be at least one hundred five percent of the deposits being secured. Investments Interest Rate Risk: Interest rate risk arises because the fair value of investment changes as interest rates change. The Library’s investment policy addresses interest rate risk by requiring that the Library’s investment portfolio be structured so that securities mature to meet cash requirements for ongoing operations and/or long-term debt payments, thereby avoiding that need to sell securities on the open market prior to maturity, and by investing operating funds primarily in short-term investments. State statute requires that an investment mature within five years from the date of purchase, unless matched to a specific obligation or debt of the Library, and that an investment be purchased with the expectation that it will be held to maturity. At year end the Library had investment in STAR Ohio at a fair value of $4,336,639. STAR Ohio has a maturity of less than one year and is not subject to interest rate penalty on maturity issues. Credit Risk: STAR Ohio carries a rating of AAAm by Standard and Poor’s. The Library has no investment policy dealing with investment credit risk beyond the requirements in state statues. Ohio law requires that STAR Ohio maintain the highest rating provided by at least one nationally recognized standard rating service. The Library’s investment policy limits investments to those authorized by State statute.
23
Dayton Metro Library Notes to the Basic Financial Statements For the Year Ended December 31,2010
Note 4 – Deposits and Investments (continued) Custodial Credit Risk: For an investment, custodial credit risk is the risk that, in the event of the failure of the counterparty, the Library will not be able to recover the value of its investments or collateral securities that are in the possession of an outside party. The Library has no investment policy dealing with investment custodial risk beyond the requirements in ORC 135.14(M)(2) which states, “Payment for investments shall be made only upon the delivery of securities representing such investments to the treasurer, investing authority, or qualified trustee. If the securities transferred are not represented by a certificate, payment shall be made only upon receipt of confirmation of transfer from the custodian by the treasurer, governing board, or qualified trustee.” The Library places no limit on the amount it may invest in any one issuer; however, investments are limited to low risk securities with the expectation of earning market rate of return. Note 5 – Public Library Fund The primary source of revenue for Ohio public libraries is the Public Library Fund (PLF). The PLF is allocated to each county based on the county’s prior intangibles tax of PLF revenues, and its population. The County Budget Commission allocates these funds to the Library based on its needs such as for the construction of new library buildings, improvements, operation, maintenance, or other expenses. The Budget Commission cannot reduce its allocation of these funds to the Library based on any additional revenues the Library receives. During 2010, the Library received $14,431,940 from this funding source. Note 6 – Property Taxes Property taxes include amounts levied against all real property, public utility property, and tangible personal property located in the taxing district of the Library within Montgomery County. Real property tax receipts received in 2010 represent the collection of 2009 taxes. Real property taxes received in 2010 were levied after October 1, 2009 on the assessed values as of January 1, 2009, the lien date. Assessed values for real property taxes are established by State statute at 35 percent of appraised market value. Property taxes are also reduced for applicable homestead and rollback deductions. Homestead and rollback amounts are then paid by the State and are reflected in the accompanying financial statements as Intergovernmental Receipts. Real property taxes are payable annually or semiannually. Public utility property tax receipts received in 2010 represent the collection of 2009 taxes. Public utility real and tangible personal property taxes received in 2010 became a lien on December 31, 2009, were levied after October 1, 2009, and are collected with real property taxes. Public utility real property is assessed at 35 percent of true value; public utility tangible personal property is currently assessed at varying percentages of true value. Montgomery County is responsible for assessing property, and for billing, collecting, and distributing all property taxes on behalf of the Library.
24
Dayton Metro Library Notes to the Basic Financial Statements For the Year Ended December 31,2010
Note 7 - Risk Management The Library is exposed to various risks of loss related to torts; theft of, damage to, and destruction of assets; errors and omissions; injuries to employees; and natural disasters. During 2010, the Library contracted with several companies for various types of insurance coverage as follows:
Company Type of Coverage Amount of Coverage Chubb Insurance Group Building (blanket) $40,458,156 EDP Property 2,640,518 Contents 37,019,187 Third Party Property 25,000 Extra Expense (blanket) 3,000,000 Public Officials 5,000,000Cincinnati Insurance Boiler & Machinery 25,000,000 Automobile 1,000,000 General Liability, (each
occurance) 1,000,000
General Liability, (agg) 2,000,000
Settled claims have not exceeded coverage in any of the last three years and there was no significant reduction in coverage from the prior year. The Library pays the State Workers’ Compensation System a premium based on a rate per $100 of salaries. This rate is calculated based on accident history and administrative costs. The State Workers’ Compensation System administers and pays all claims. Note 8 - Defined Benefit Pension Plan Plan Description - The Library participates in the Ohio Public Employees Retirement System (OPERS). OPERS administers three separate pension plans. The traditional plan is a cost-sharing, multiple-employer defined benefit pension plan. The member-directed plan is a defined contribution plan in which the member invests both member and employer contributions (employer contributions vest over five years at 20 percent per year). Under the member-directed plan, members accumulate retirement assets equal to the value of the member and vested employer contributions plus any investment earnings. The combined plan is a cost-sharing, multiple-employer defined benefit pension plan that has elements of both a defined benefit and a defined contribution plan. Under the combined plan, employer contributions are invested by the retirement system to provide a formula retirement benefit similar to the traditional plan benefit. Member contributions, whose investment is self-directed by the member, accumulate retirement assets in a manner similar to the member-directed plan. OPERS provides retirement, disability, survivor and death benefits and annual cost-of-living adjustments to members of the traditional and combined plans. Members of the member-directed plan do not qualify for ancillary benefits. Authority to establish and amend benefits is provided by Chapter 145 of the Ohio Revised Code. OPERS issues a stand-alone financial report that may be obtained by writing to OPERS, 277 East Town Street, Columbus, OH 43215-4642 or by calling (614) 222-5601 or (800) 222-7377. Funding Policy – The Ohio Revised Code provides statutory authority for member and employer contributions. For the year ended December 31, 2010, members in state and local classifications contributed 10.0 percent of covered payroll.
25
Dayton Metro Library Notes to the Basic Financial Statements For the Year Ended December 31,2010
Note 8 - Defined Benefit Pension Plan (continued) The Library’s contribution rate for 2010 was 14.0 percent of covered payroll. For the period January 1, through February 28, 2010, a portion of the Library’s contribution equal to 5.5 percent of covered payroll was allocated to fund the postemployement healthcare plan. For the period March 1, 2010 through December 31, 2010, a portion of the Library’s contribution equal to 5.0 percent of covered payroll was allocated to fund the postemployment healthcare plan. Employer contribution rates are actuarially determined. State statute sets a maximum contribution rate for the Library of 14 percent. The Library’s required contributions for pension obligations to the traditional, combined, and member- directed plans for the years ended December 31, 2010, 2009, 2008 were $1,179,407, 1,117,751, and $983,298 respectively. The full amount has been contributed for 2010, 2009, 2008. Note 9 – Employee Benefits – Deferred Compensation Plan Employees of the Library may elect to participate in the Ohio Public Employees Deferred Compensation Plan. Under this program, employees elect to defer a portion of their pay. The deferred pay and any income earned on it are not subject to federal and state income taxation until actually received by the employee. Participation in the plan is optional. The deferred compensation is not available to employees until termination of employment, retirement, death or unforeseen emergency. Note 10 – Post-employment Benefits Plan Description – Ohio Public Employees Retirement System (OPERS) administers three separate pension plans: The Traditional Pension Plan – a cost-sharing, multiple-employer defined benefit pension plan; the Member-Directed Plan – a defined contribution plan; and the Combined Plan – a cost sharing, multiple-employer defined benefit pension that has elements of both a defined benefit and defined contribution plan. OPERS maintains a cost-sharing multiple-employer defined benefit post-employment healthcare plan, which includes a medical plan, prescription drug program and Medicare Part B premium reimbursement, to qualifying members of both the Traditional Pension and the Combined Plans. Members of the Member-Directed Plan do not qualify for ancillary benefits, including post-employment healthcare coverage. To qualify for post-employment health care coverage, age-and-service retirees under the Traditional Pension and Combined Plans must have ten years or more years of qualifying Ohio service credit. Health care coverage for disability benefit recipients and qualified survivor benefit recipients is available. The Ohio Revised code permits, but does not require, OPERS to provide health care benefits to eligible members and beneficiaries. Authority to establish and amend benefits is provided in Chapter 145 of the Ohio Revised Code. The heath care coverage provided by OPERS meets the definition of an Other Post Employment Benefit (OPEB) as described in GASB Statement 45. Disclosures for the health care plan are provided separately in the OPERS financial report which may be obtained by writing to OPERS, 277 East Town Street, Columbus, Ohio 43215-4642 or by calling (614) 222-5601 or (800) 222-7377. Funding Policy – The Ohio Revised Code provides the statutory authority requiring public employers to fund post retirement health care through their contributions to OPERS. A portion of each employer’s contribution to OPERS is set aside for the funding of post retirement health care benefits.
26
Dayton Metro Library Notes to the Basic Financial Statements For the Year Ended December 31,2010
Note 10 – Post-employment Benefits (continued) Employer contribution rates are expressed as a percentage of the covered payroll of active members. In 2009, local government employers contributed 14.0 percent of covered payroll. OPERS’ Post Employment Health Care plan was established under, and is administrated in accordance with, Internal Revenue Code 401 (h). Each year, The OPERS retirement board determines the portion of the employer contribution that will be set aside for funding post-employment healthcare benefits. For the period January 1, through February 28, 2010, a portion of the Library’s contribution equal to 5.5 percent of covered payroll was allocated to fund the post-employment healthcare plan. For the period March 1, 2010 through December 31, 2010, a portion of the Library’s contribution equal to 5.0 percent of covered payroll was allocated to fund the postemployment healthcare plan. The OPERS Retirement Board is also authorized to establish rules for the payment of a portion of the healthcare benefits by the retiree or retiree’s surviving beneficiaries. Payment amounts vary depending on the number of covered dependents and selected coverage. The Library’s contributions allocated to fund post-employment healthcare benefits for the years ended December 31, 2010, 2009, and 2008 were $674,843, $819,022, and $983,298 respectively; 100 percent has been contributed for 2010, 2009, 2008. On September 9, 2004, the OPERS Retirement Board adopted a Health Care Preservation Plan (HCPP) which was effective January 1, 2007. Member and employer contribution rates increased as of January 1, 2006, January 1, 2007, and January 1, 2008, which allowed additional funds to be allocated to the health care plan. Note 11 – Operating Leases The Library leases buildings and other equipment under non-cancelable leases. The Library disbursed $214,398 to pay lease costs for the year ended December 31, 2010. Future lease payments are as follows:
Office Lease – The Library leases three spaces at various locations to provide additional services. A summary of the lease agreements is as follows:
Huber Heights – For fiscal year 2010, lease expense amounted to $111,815. The current lease agreement expires on December 31, 2015, with two renewal options for terms of ten years through December 31, 2035. Moraine – The Library leases space to provide Outreach Services. The lease expense for 2010 amounted to $75,592. The current lease agreement expires on April 30, 2016.
27
Dayton Metro Library Notes to the Basic Financial Statements For the Year Ended December 31,2010
Note 11 – Operating Leases (continued)
Northmont – The City of Englewood leases a building to the Library for which the Library is responsible for occupancy costs such as electric, gas and maintenance. Because the agreement does not include a base rent and occupancy costs can vary, those costs are not included in the above table of future lease payments. Occupancy costs are approximately $25,000 annually.
Parking Spaces – The Library leases twenty-seven (27) parking spaces for an annual cost of $6,000. The lease is for a term of one year and, in the absence of notification from either party, automatically renews for an unlimited number of successive one-year terms. Due to the infinite nature of the lease, the lease payments are not included in the above table of future lease payments. Copier Leases – The Library leases four copiers at an annual cost of $5,450. One of the copier leases expired in fiscal year 2010 with the remaining leases expiring in fiscal year 2012. Note 12 – Interfund Transfers The general fund transferred $53,148 to the Computer fund for the purchase of a future generation of Library Information Systems. The general fund transferred $3,000,000 to the Building and Repair Fund for the future construction of facilities.
28
2525 north limestone street, ste. 103 springfield, oh 45503
REPORT ON INTERNAL CONTROL OVER FINANCIAL REPORTING AND ON COMPLIANCE AND OTHER MATTERS BASED ON AN AUDIT OF FINANCIAL STATEMENTS PERFORMED IN ACCORDANCE WITH GOVERNMENT AUDITING STANDARDS
Board of Trustees Dayton Metro Library 215 E. Third Street Dayton, Ohio 45402
We have audited the financial statements of the governmental activities, each major fund, and the aggregate remaining fund information of Dayton Metro Library (the Library) as of and for the year ended December 31, 2010, which collectively comprise the Library’s basic financial statements and have issued our report thereon dated May 31, 2011, wherein we noted the Library reported on the cash basis of accounting. We conducted our audit in accordance with auditing standards generally accepted in the United States of America and the standards applicable to financial audits contained in Government Auditing Standards, issued by the Comptroller General of the United States.
Internal Control Over Financial Reporting
In planning and performing our audit, we considered the Library’s internal control over financial reporting as a basis for designing our auditing procedures for the purpose of expressing our opinions on the financial statements, but not for the purpose of expressing an opinion on the effectiveness of the Library’s internal control over financial reporting. Accordingly, we do not express an opinion on the effectiveness of the Library’s internal control over financial reporting.
A deficiency in internal control exists when the design or operation of a control does not allow management or employees, in the normal course of performing their assigned functions, to prevent or detect and correct misstatements on a timely basis. A material weakness is a deficiency, or combination of deficiencies, in internal control, such that there is a reasonable possibility that a material misstatement of the entity’s financial statements will not be prevented, or detected and corrected on a timely basis.
Our consideration of internal control over financial reporting was for the limited purpose described in the first paragraph of this section and was not designed to identify all deficiencies in internal control over financial reporting that might be deficiencies, significant deficiencies or material weaknesses. We did not identify any deficiencies in internal control over financial reporting that we consider to be material weaknesses as defined above.
30
Compliance and Other Matters
As part of obtaining reasonable assurance about whether the Library’s financial statements are free of material misstatement, we performed tests of its compliance with certain provisions of laws, regulations, contracts, and grant agreements, noncompliance with which could have a direct and material effect on the determination of financial statement amounts. However, providing an opinion on compliance with those provisions was not an objective of our audit, and accordingly, we do not express such an opinion. The results of our tests disclosed no instances of noncompliance or other matters that are required to be reported under Government Auditing Standards.
This report is intended solely for the information and use of management, Board of Trustees and others within the library, and is not intended to be and should not be used by anyone other than these specified parties.
Springfield, Ohio May 31, 2011
1
AN AGREEMENT BETWEEN THE DAYTON METRO LIBRARY AND
THE CITY OF KETTERING TO SUBMIT A JOINT GRANT APPLICATION
FOR LOCAL GOVERNMENT INNOVATION FUNDS This agreement to submit a joint grant application for Local Government Innovation Funds is made by the Dayton Metro Library with it offices located at 215 E. Third Street, Dayton, Ohio 45402 and the City of Kettering, Ohio with its offices located at 3600 Shroyer Road, Kettering, Ohio 45429. WHEREAS, the Dayton Metro Library is interested in the feasibility of expanding or replacing its old branch library building located at 3980 Wilmington Pike, Kettering, Ohio with a new building; and WHEREAS, the City of Kettering is interested in the feasibility of finding a new location and building for its Arts Centre which is currently located at 2655 Olsen Drive, Kettering, Ohio; and WHEREAS, the parties desire to study the feasibility and advisability of constructing and maintaining a joint use facility to be located at 3980 Wilmington Pike and housing both the library branch and the City Arts Centre or constructing and maintaining a joint use facility at another location in the City of Kettering; and WHEREAS, the Local Government Innovation Fund has available grant funds to pay for such a feasibility study; NOW, THEREFORE, the parties through their duly authorized representatives agree as follows: 1. The parties agree to cooperate with each other and jointly submit in 2012 a grant
application for Local Government Innovation Fund grant funds to pay for a feasibility study of a joint use facility as described in the recital paragraphs. Should the grant application be denied, then this Agreement will be void.
2. The parties will pay for the feasibility study with grant funds. The budget for the
feasibility study will be adjusted to match the amount of grant funds awarded. To the extent there is a requirement for the parties to match awarded grant funds with local funds of up to $10,000, the parties agree to each contribute one-half of the required local match amount.
3. In general, the feasibility study will address the feasibility and potential cost
savings, benefits, and drawbacks of building, maintaining, and operating a joint use facility on land owned by the Dayton Metro Library; make recommendations regarding the ownership model for such a facility; make recommendations on building maintenance costs; and the required square footage and design concept of such a shared facility.
2
4. The parties agree to cooperate with each other in the process of consultant
selection for the feasibility study. The parties will jointly create one or more requests for proposals with study specifications and proposal evaluation criteria to solicit proposals for conducting the feasibility study. One or more consultants may be retained by the parties to work on all or portions of the feasibility study as agreed on by the parties. If necessary, the parties will designate one of themselves as the lead agency for acceptance and disbursement of grants funds and for contracting with consultants.
5. This agreement will be effective as of the date it is signed by the last party to sign
below. This agreement will terminate upon completion of the feasibility study. Either party may terminate this agreement by giving 30 days advance written notice of termination to the other party at its business address first written above.
6. The parties may amend this agreement by a written instrument signed by
authorized representatives of both parties.
IN WITNESS WHEREOF, the parties hereto, through their duly authorized representatives, have executed this Agreement.
City of Kettering, Ohio By: Mark W. Schwieterman Date City Manager
Dayton Metro Library By: Tim Kambitsch Date Executive Director/Fiscal Officer
Dayton Metro Library
Board of Trustees
For consideration as a part of the agenda at the March 21, 2012 meeting.
JOINT APPLICATION FOR LOCAL GOVERNEMENT INNOVATION FUND
GRANT WITH THE CITY OF KETTERING - ACTION
The Executive Director recommends adoption of the following resolution by the Board:
A RESOLUTION
WHEREAS, the Dayton Metro Library is interested in the feasibility of expanding or
replacing its old branch library building located at 3980 Wilmington Pike, Kettering,
Ohio; and
WHEREAS, the City of Kettering is interested in the feasibility of finding a new location
and building for its Arts Centre which is currently located at 2655 Olsen Drive, Kettering,
Ohio; and
WHEREAS, the parties desire to study the feasibility and advisability of constructing and
maintaining a joint use facility to be located at 3980 Wilmington Pike and housing both
the library branch and the City Arts Centre or constructing and maintaining a joint use
facility at another location in the City of Kettering;
NOW, THEREFORE, Be It Resolved by the Board of Library Trustees of the Dayton
Metro Library, that:
Section 1. The Executive Director is hereby authorized to file a joint application with the
City of Kettering for a Local Government Innovation Fund grant from the Ohio
Department of Development. All grant funds received are to be used to fund a joint
feasibility study with the City of Kettering concerning a joint use facility to house a
branch library and the City’s Arts Centre as described in the recital paragraphs.
Section 2. The Executive Director is further authorized to enter into one or more
agreements with the City of Kettering to apply for the grant.
Section 3. This Resolution shall take full force and effect immediately upon its adoption.
Passed by Board of Trustees this __________ day of ____________________
2012.
The Local Government Innovation Fund Council 77 South High Street
Applicant provides a thorough, detailed and complete financial informa7on
5
Applicant provided more than minimum requirements but did not provide addi7onal
jus7fica7on or support3
Applicant provided minimal financial informa7on
1
Points
Applicant clearly demonstrates a secondary repayment source.
5
Applicant does not have a secondary repayment source.
0
Points
Points
Collabora/ve Measures
Descrip/on Criteria Max PointsApplicant Self
ScoreValidated Score
Applicant (or collabora7ve partner) is not a county and has a popula7on of less than 20,000
residents5
Applicant (or collabora7ve partner) is a county but has less than 235,000
5
Applicant (or collabora7ve partner) is not a county but has a popula7on 20,001 or greater.
3
Applicant (or collabora7ve partner) is a county with a popula7on of 235,001 residents or more
3
Points
More than one applicant 5
Single applicant 1
Points
Local MatchPercentage of local matching funds being contributed to the project. This may include in-‐kind contribu;ons.
Applicant has executed partnership agreements outlining all collabora;ve partners and par;cipa;on agreements and has resolu;ons of support. (Note: Sole applicants only need to provide a resolu;on of support from its governing
en;ty.)
Par/cipa/ng En//es
Local Government Innova/on Fund Project Scoring Sheet
70% or greater 5
40-‐69.99%
Sec/on 1: Financing Measures
10-‐39.99% 1
Total Sec/on Points
Financial Informa/on
Applicant includes financial informa;on (i.e., service related opera;ng budgets) for the most recent three years and the three year period following the project.
The financial informa;on must be directly related to the scope of the project and will be used as the cost basis for determining any savings
resul;ng from the project.
3
Repayment Structure (Loan Only)
Applicant's popula;on (or the popula;on of the area(s) served) falls within one of the listed categories as determined by the U.S. Census Bureau. Popula;on scoring will be determined by the smallest popula;on listed in the applica;on. Applica;ons from (or
collabora;ng with) small communi;es are preferred.
Popula/on
Sec/on 2: Collabora/ve Measures
Total Sec/on Points
Applicant demonstrates a viable repayment source to support loan
award. Secondary source can be in the form of a debt reserve, bank
par;cipa;on, a guarantee from a local en;ty, or other collateral (i.e.,emergency
Project implements a recommenda7on from an audit or is informed by benchmarking
5
Project does not implement a recommenda7on from an audit and is not informed by
benchmarking0
Points
Applicant clearly demonstrates economic impact 5
Applicant men7ons but does not prove economic impact
3
Applicant does not demonstrate an economic impact
0
Points
Yes 5
No 0
Points
Economic Impact
Applicant demonstrates the project will a promote business environment (i.e., demonstrates a business rela;onship resul;ng from the project) and will
provide for community aKrac;on (i.e., cost avoidance with respect to taxes)
Applicant’s proposal can be replicated by other local governments or scaled
for the inclusion of other local governments.
Sec/on 4: Significance Measures
Performance Audit
Implementa/on/Cost
Benchmarking
The project implements a single recommenda;on from a performance audit provided by the Auditor of State under Chapter 117 of the Ohio Revised
Code or is informed by cost benchmarking.
Probability of Success
Applicant provides a documented need for the project and clearly outlines the
likelihood of the need being met.
Total Sec/on Points
75% or greater 30
Local Government Innova/on Fund Project Scoring Sheet Sec/on 3: Success Measures
Scalable/Replicable Proposal
Past Success
Applicant has successfully implemented, or is following project
guidance from a shared services model, for an efficiency, shared service,
coproduc;on or merger project in the past.
25.01% to 74.99% 20
Less than 25% 10
Expected Return
Applicant demonstrates as a percentage of savings (i.e., actual savings, increased revenue, or cost avoidance ) an expected return. The return must be derived from the
applicant's cost basis. The expected return is ranked in one of the following
percentage categories:
Total Sec/on Points
Response to Economic Demand
The project responds to current substan;al changes in economic demand for local or regional
government services.
2/22/12 Round1
Council Measures
Descrip/on
Council Preference
Council Ranking for Compe;;ve Rounds
Applicant Self Score
Validated Score
Sec/on 4: Significance Measures
Points Assigned
Sec/on 2: Collabora/ve Measures
Sec/on 3: Success Measures
Sec/on 1: Financing Measures
Total Base Points:
Sec/on 5: Council Measures
The Applicant Does Not Fill Out This Sec/on; This is for the Local Government Innova7on Fund Council only. The points for this sec7onis based on the applicant demonstra7ng innova7on or inven7veness with the project
Criteria
Total Sec/on Points (10 max)
Scoring Summary
2/22/12 Round1
Reviewer Comments
April 2, 2012 Mary Beth Thaman City of Kettering 3600 Shroyer Road Kettering, Ohio 45429 RE: Application Cure Letter Dear Mary Beth Thaman: The Ohio Department of Development (Development) has received and is currently reviewing your application for Round 1 of Local Government Innovation Fund program. During this review Development has determined that additional information is needed for your application. The identified item(s) requiring your attention are listed on the attached page(s). Please respond only to the issues raised. Failure to fully address all the identified items could lead to a competitive score reduction or ineligibility for Round 1 of the Local Government Innovation Fund program. A written response from the applicant to this completeness review is due to Development no later than 5:00 p.m. on April 30, 2012. Please send the response in a single email to [email protected] and include “Cure—Project Name” in the subject line. While this cure letter represents the additional information needed for Development review, the Local Government Innovation Council continues to reserve the right to request additional information about your application. Thank you once again for your participation in Local Government Innovation program. Please contact the Office of Redevelopment at [email protected] or 614-995-2292 if you have further questions regarding your application or the information requested in this letter. Sincerely,
Thea J. Walsh, AICP Deputy Chief, Office of Redevelopment Ohio Department of Development
1
Local Government Innovation Fund Completeness Review
Applicant: City of Kettering
Project Name: Books to Brushes, a Kettering Collaborative for a New Library/Cultural Centre
Request Type: Grant
Issues for Response
1. Budget Please provide a line item budget that includes at minimum: 1) the sources of all funds being contributed to the project include all sources—cash, in-kind, etc.; 2) the uses of all funds (provide a line item for each use); 3) the total project costs (including the funding request and the local match. Please be sure that all uses of funds are eligible expenses as set forth in the program guidelines.
Example:
Collaboration Village’s Project Budget
Sources of Funds LGIF Request $100,000 Match Contribution (10%) $ 11,111 Total $111,111
Uses of Funds Consultant Fees for Study $111,111 Total $111,111
Total Project Cost: $111,111
2. Match A minimum of 10% match is required for all projects. Matching funds must be 10% of the total project cost (not 10% of the funding request). Please document your 10% match and provide evidence of the contribution.
3. Resolutions of Support Resolutions of support must be provided by the governing body of the main applicant and each collaborative partner. If the collaborative partner is a private entity with no governing body, a letter of support for the project is required.
4. Partnership Agreements Partnership agreements must be signed by all parties listed as collaborative partners. Please provide a partnership agreement that at minimum: 1) lists all collaborative partners; 2) lists the nature of the partnership; and 3) is signed by all parties. Please note, partnership agreements must be specific to the project for which funding is requested.
Local Government Innovation Fund Completeness Review Applicant: City of Kettering Project Name: Books to Brushes Request Type: Grant Issues for Response April 9, 2012 1. Budget Please provide a line item budget that includes at minimum: 1) the sources of all funds being contributed to the project include all sources—cash, in-kind, etc.; 2) the uses of all funds (provide a line item for each use); 3) the total project costs (including the funding request and the local match. Please be sure that all uses of funds are eligible expenses as set forth in the program guidelines. Example: Books to Brushes Sources of Funds LGIF Request $100,000 Match Contribution (10%) $ 10,000
$5,000 City of Kettering
$5,000 Dayton Metro Library Total $110,000 Uses of Funds Consultant Fees for
Land Survey $20,000
Architectural design $50,000
Management Plan $25,000
Real Estate Evaluation $15,000
Total Project Cost: $110,000 2. Resolutions of Support Attached are the resolutions of support for both the City of Kettering and the Dayton Metro Library. 3. Partnership Agreements Attached is the partnership agreement signed by the City of Kettering and the Dayton Metro Library
Tab 4 - Financial Documentation
We are applying for a $90,000 grant to conduct a shared service feasibility study along with a management plan.
The City of Kettering as the primary applicant is designating $5,000 from its Capital Improvement Fund and the
Dayton Metro Library is designating $5,000 from its general fund to provide matching funds for the project.
Budgeted Expenditures City of Kettering
Dayton Metro
Library Grant
Survey $20,000
Architectural Designs $50,000
Management Plan Development $10,000
Community Meetings (paid by cash from 11.11% matching funds) $5,000 $5,000