CITY OF IMPERIAL 2010 Urban Water Management Plan June 2011 City of Imperial 420 South Imperial Avenue Imperial, CA 92251 Prepared by: Dynamic Consulting Engineers, Inc. 2415 Imperial Business Park Drive, Suite B Imperial, CA 92251 (760) 545-0162 (760) 545-0163 fax
Transcript
CITY OF IMPERIAL
2010 Urban Water Management Plan
June 2011
City of Imperial
420 South Imperial Avenue
Imperial, CA 92251
Prepared by:
Dynamic Consulting Engineers, Inc.
2415 Imperial Business Park Drive, Suite B
Imperial, CA 92251
(760) 545-0162
(760) 545-0163 fax
City of Imperial 2010 Urban Water Management Plan
Page 2 of 132
Table of ContentsContact Sheet ................................................................................................................................. 7
6.3 DMM 3 – System Water Audits, Leak Detection and Repair ........................................ 113
6.4 DMM 4 – Metering with Commodity Rates for New Connections and Retrofit ofExisting Customers.................................................................................................................... 114
6.5 DMM 5 – Large Landscape Conservation Programs and Incentives ............................. 114
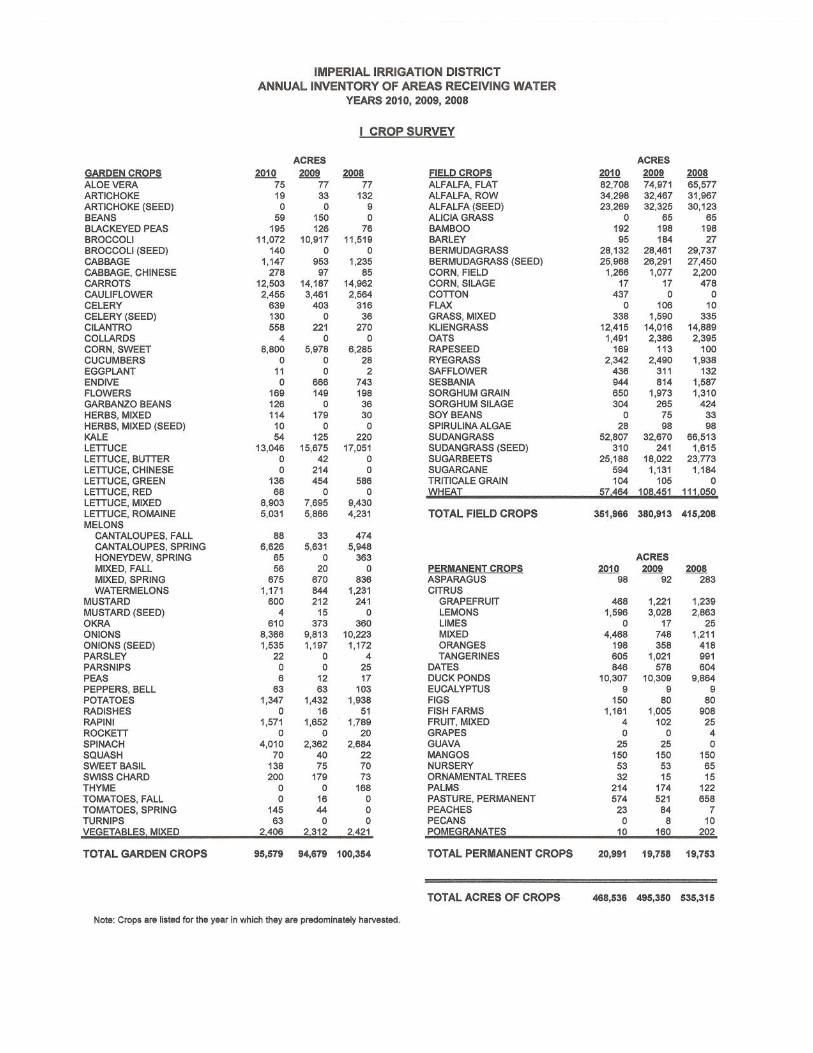
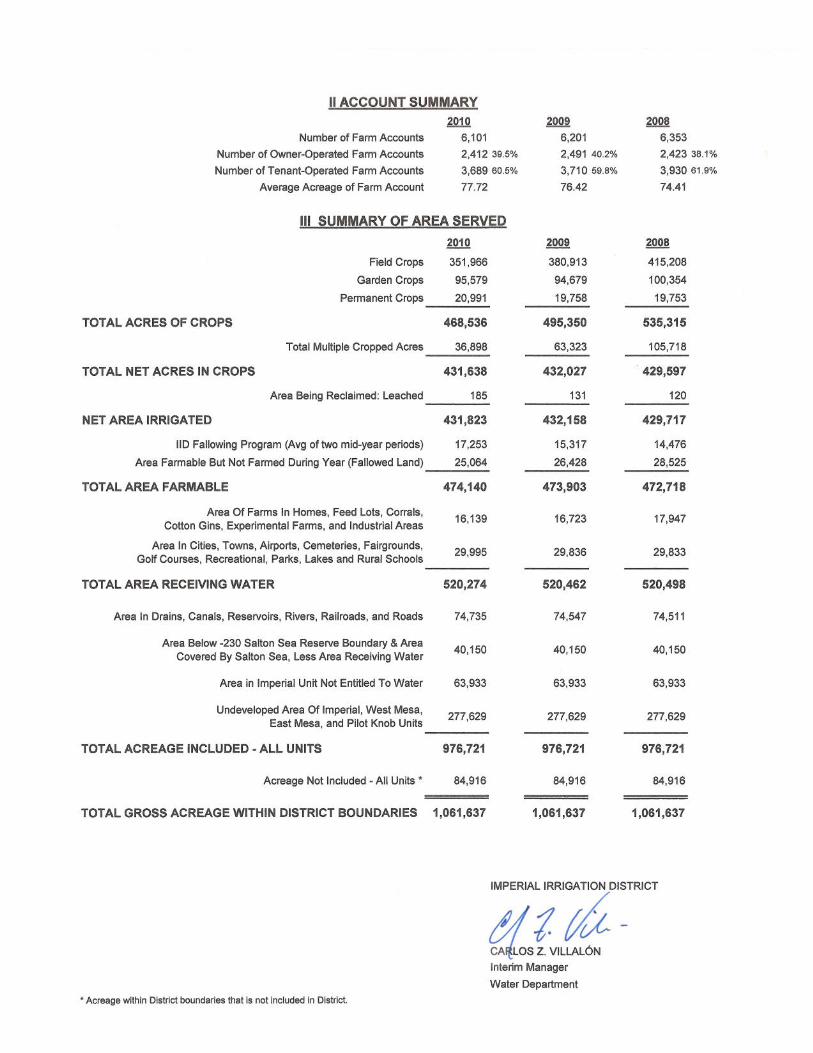
IMPERIAL IRRIGATION DISTRICT ANNUAL INVENTORY OF AREAS RECEIVNGWATER, YEARS 2008-2010.................................................................................................... 130
APPENDIX F ............................................................................................................................... 131
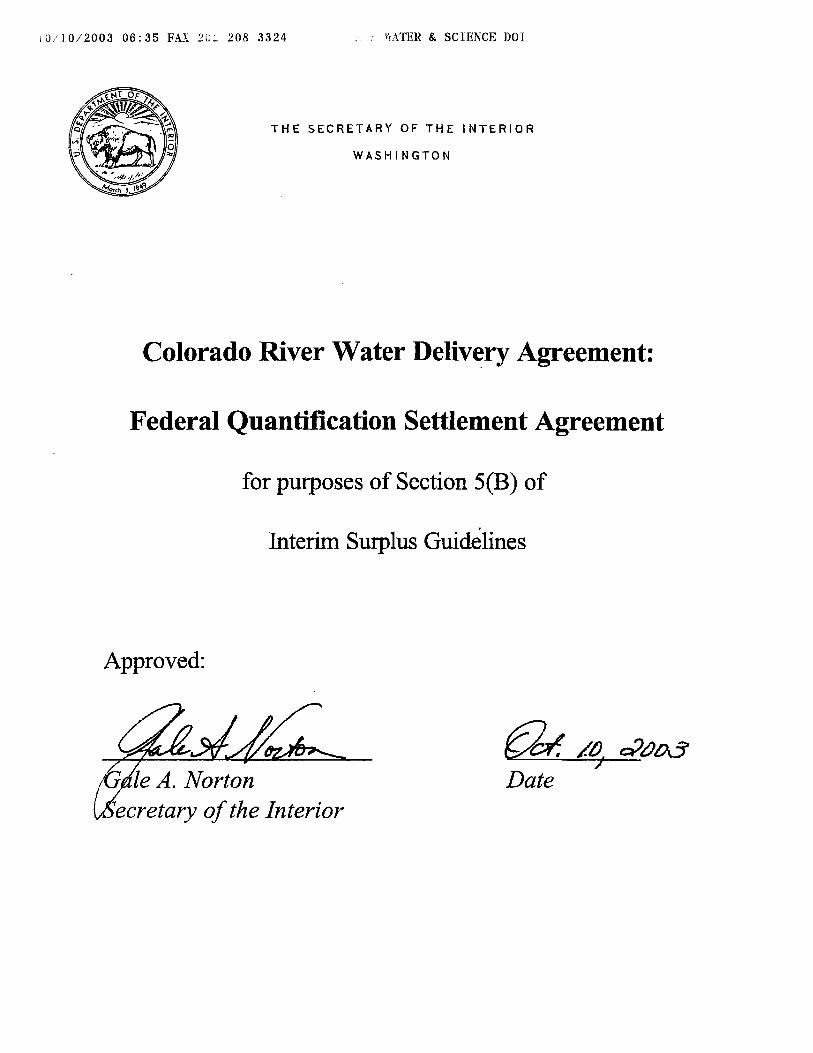
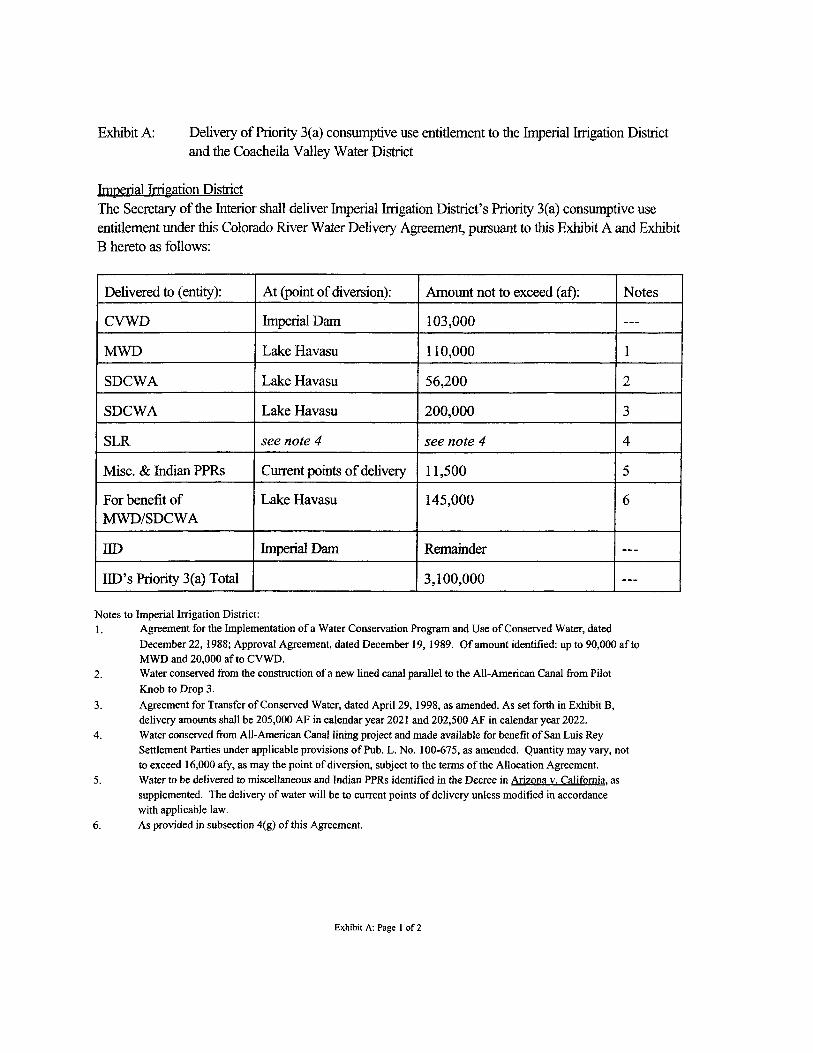
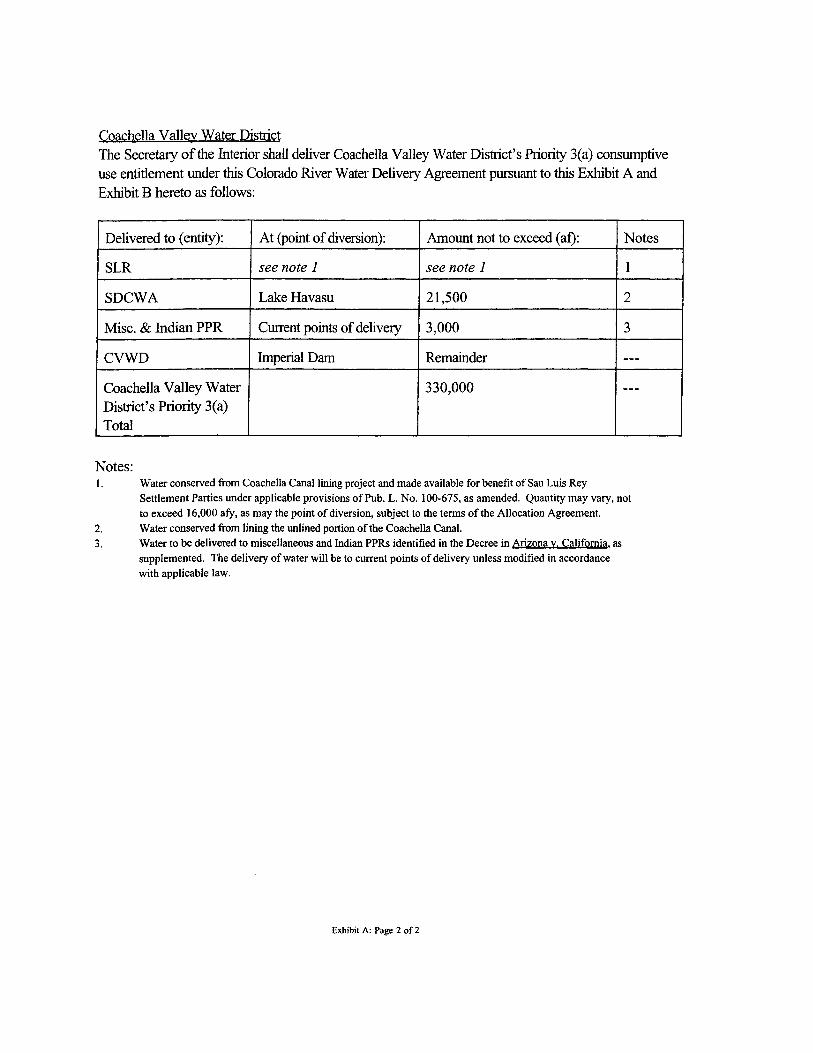
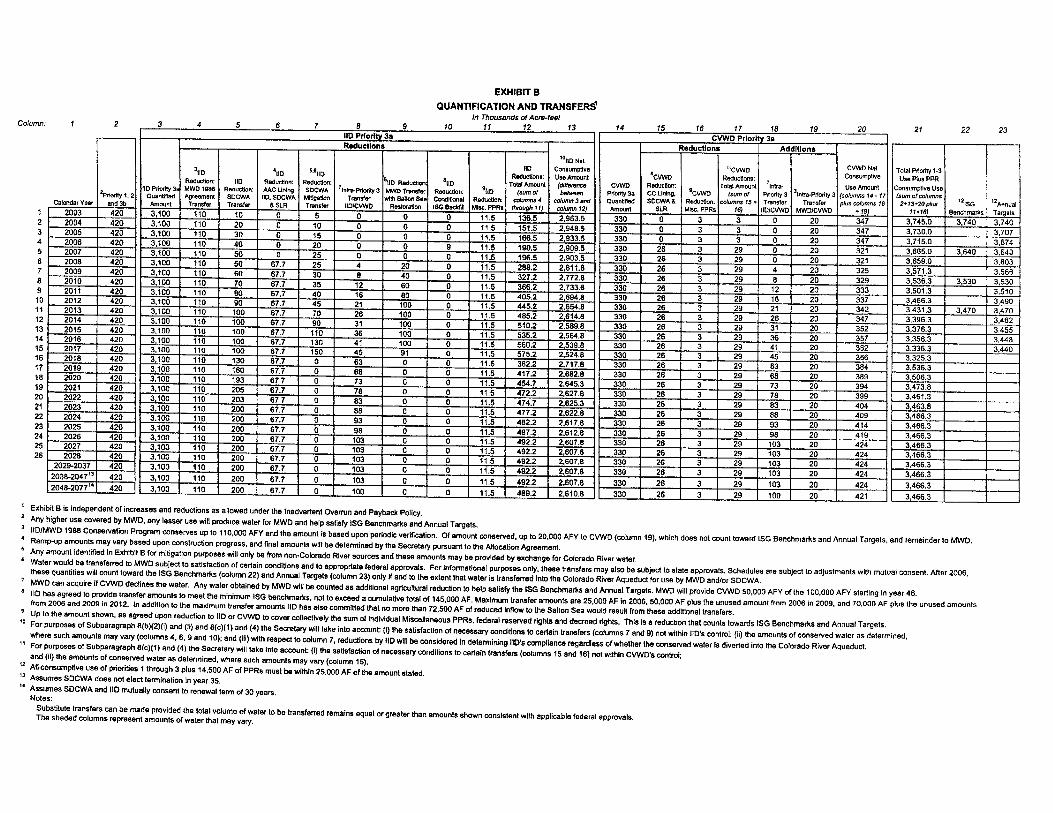
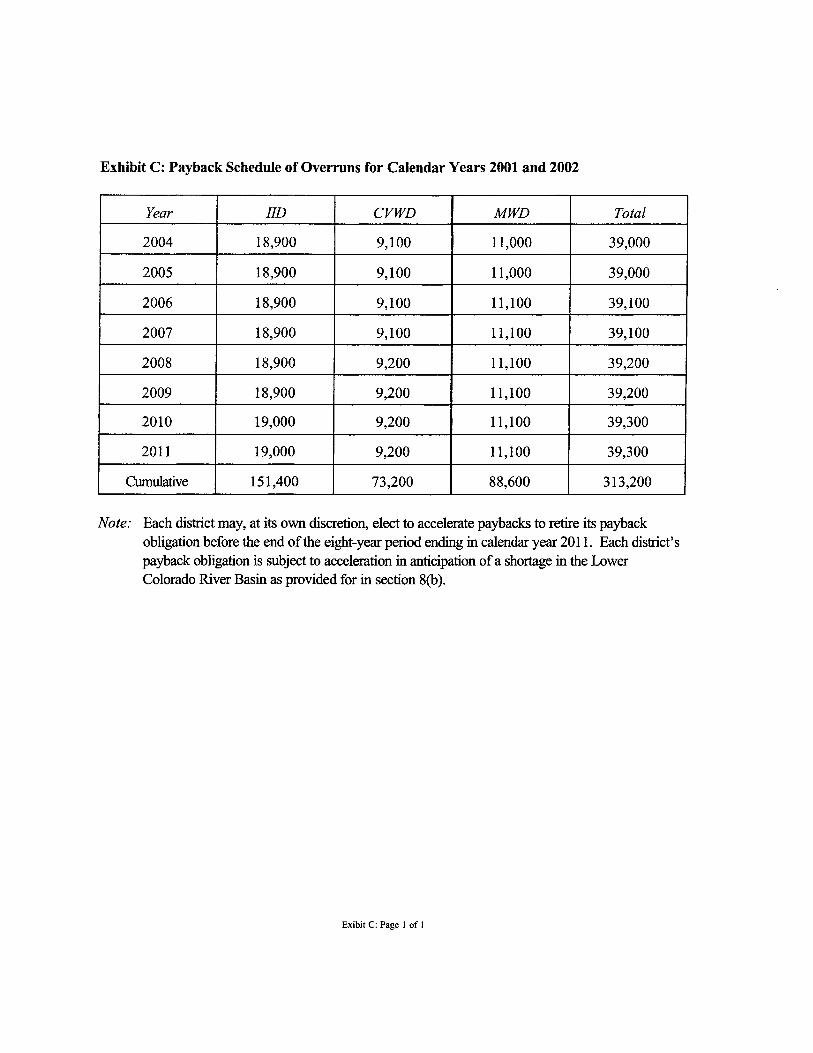
Colorado River Water Delivery Agreement: Federal Quantification Settlement Agreement(QSA)......................................................................................................................................... 131
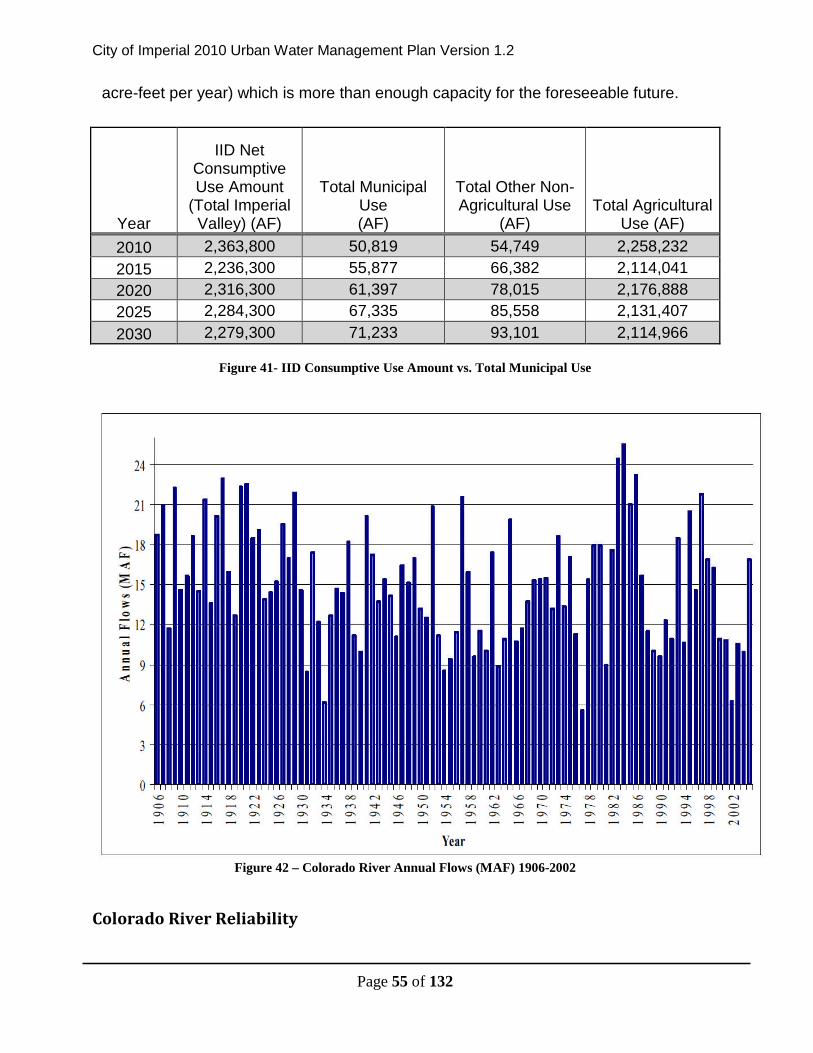
Figure 1 - City of Imperial Average Per Capita per Day Use (2001-2010) ...................................... 8Figure 2 - City of Imperial 2020 Urban Water Use Target ............................................................... 9Figure 3 - Interim Urban Water Use Target for 2015........................................................................ 9Figure 4 - TABLE 1 - Coordination with appropriate agencies ...................................................... 12Figure 5 - Vicinity Map for the City................................................................................................ 16Figure 6 – IID Imperial Unit Service Area...................................................................................... 19Figure 7- City Limits of the City of Imperial .................................................................................. 20Figure 8 - 2010 Distribution System Flows..................................................................................... 22Figure 9 - Imperial County Land Use Distribution ......................................................................... 25Figure 10 - Imperial County Land Use Map ................................................................................... 26Figure 11 - City Climate Data ......................................................................................................... 28Figure 12 - Imperial Valley Population Estimates, California Department of Finance .................. 29Figure 13 – Past and Current Connections by Customer Type ....................................................... 30Figure 14 - Forecasts through 2035 based on Department of Finance Population Projections....... 30Figure 15 – TABLE 2 Current and Projected Population................................................................ 31Figure 16- Unemployment Numbers - Imperial County and Cities ................................................ 31Figure 17 – Year 2000 Demographic Data for Imperial Valley Cities........................................... 32Figure 18 - 2010 Monthly Pumping Records .................................................................................. 33Figure 19 - Chart of the Monthly Fluctuation of the GPCD - 2010 Pumping Records................... 34Figure 20 - Ten Year Average Per Capita per Day Use Data.......................................................... 35Figure 21 - City of Imperial Annual Average Per Capita Per Day Use - Gross Water Method 1... 36Figure 22 – TABLE 13 Base period ranges..................................................................................... 36Figure 23 - California Hydrologic Regions and 2020 Conservation Goals ................................... 37Figure 24 - California 2020 Urban Water Use Target for the Colorado River Region ................... 38Figure 25 TABLE 15 Base daily per capita water use – 5-year range ............................................ 38Figure 26 - City of Imperial 2020 Urban Water Use Target ........................................................... 38Figure 27 - Interim Urban Water Use Target for 2015.................................................................... 39Figure 28 - TABLE 3 Water deliveries - actual, 2005 .................................................................... 39Figure 29 - TABLE 4 Water deliveries - actual, 2010 .................................................................... 40Figure 30 - Estimated Future Water Demand Table........................................................................ 40Figure 31 - TABLE 5 Water deliveries - projected, 2015 ............................................................... 41Figure 32 - TABLE 6 Water deliveries - projected, 2020 ............................................................... 42Figure 33 - TABLE 7 Water deliveries - projected 2025, 2030 ...................................................... 42Figure 34 – TABLE 9 Sales to other water agencies....................................................................... 43Figure 35 – TABLE 10 Additional water uses and losses............................................................... 43Figure 36 - TABLE 11 Total water use ........................................................................................... 43Figure 37 - TABLE 8 Low-income projected water demands ........................................................ 45Figure 38 - TABLE 12 Retail agency demand projections provided to wholesale suppliers.......... 45Figure 39 - TABLE 16 Water supplies - current and projected ...................................................... 48Figure 40 – TABLE 17 Wholesale supplies – existing and planned sources of water.................... 49Figure 41- IID Consumptive Use Amount vs. Total Municipal Use............................................... 55Figure 42 – Colorado River Annual Flows (MAF) 1906-2002....................................................... 55Figure 43 - IID Crop Acreage and Water Use in Imperial Valley (Historical Average)................. 59Figure 44 - Non Agricultural Water Delivery by the IID (Acre-Feet) 2006-2009.......................... 59Figure 45- IID Non-Agricultural Water Delivery ........................................................................... 59Figure 46 – Total Municipal Raw Water Demand (Imperial County Cities) since 2006 (Acre-Feet)
City of Imperial 2010 Urban Water Management Plan
Page 6 of 132
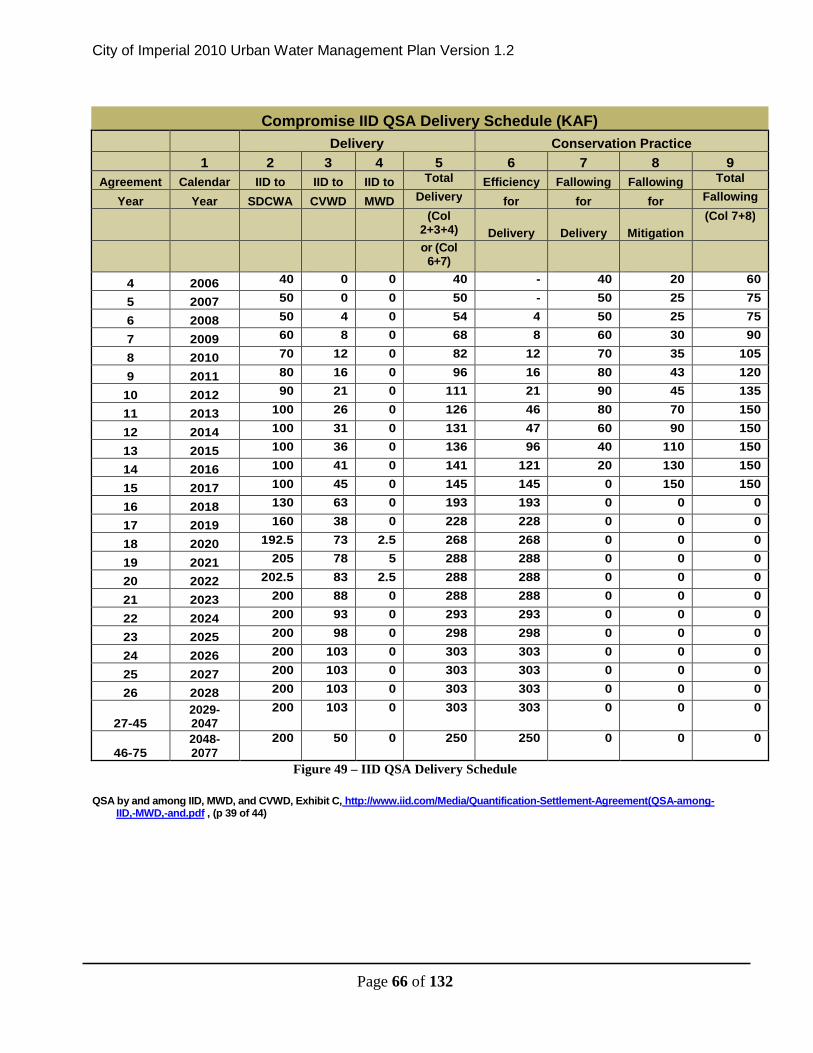
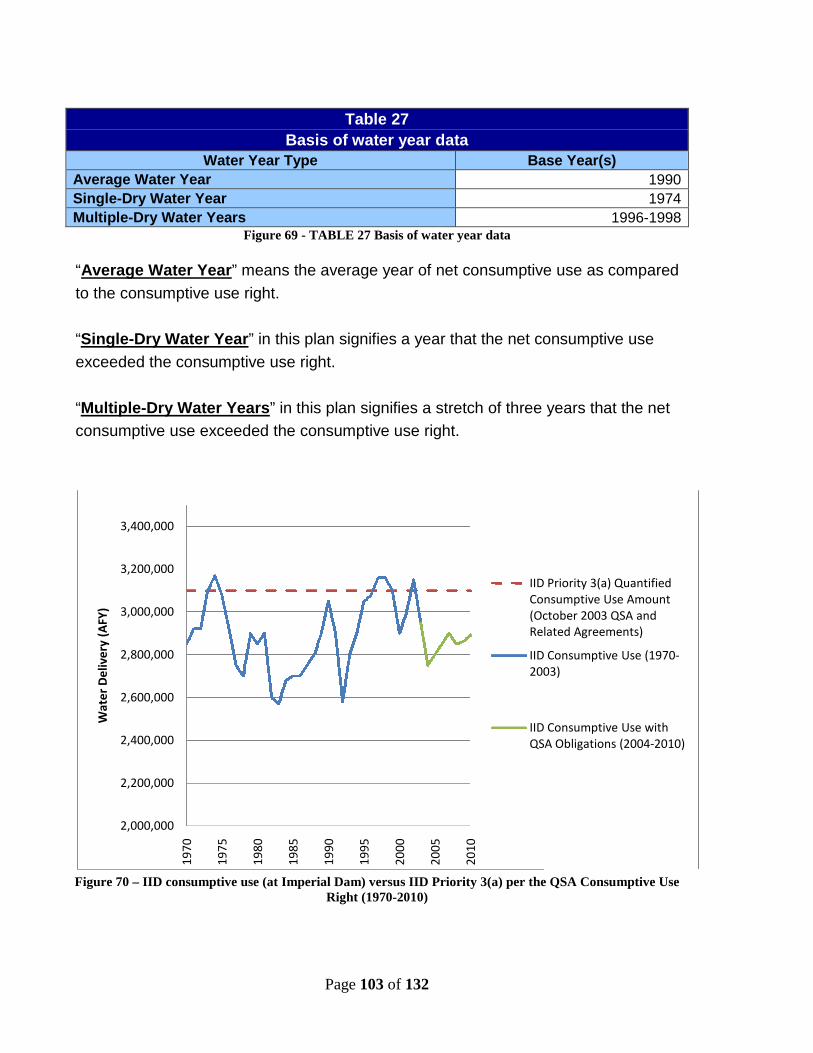
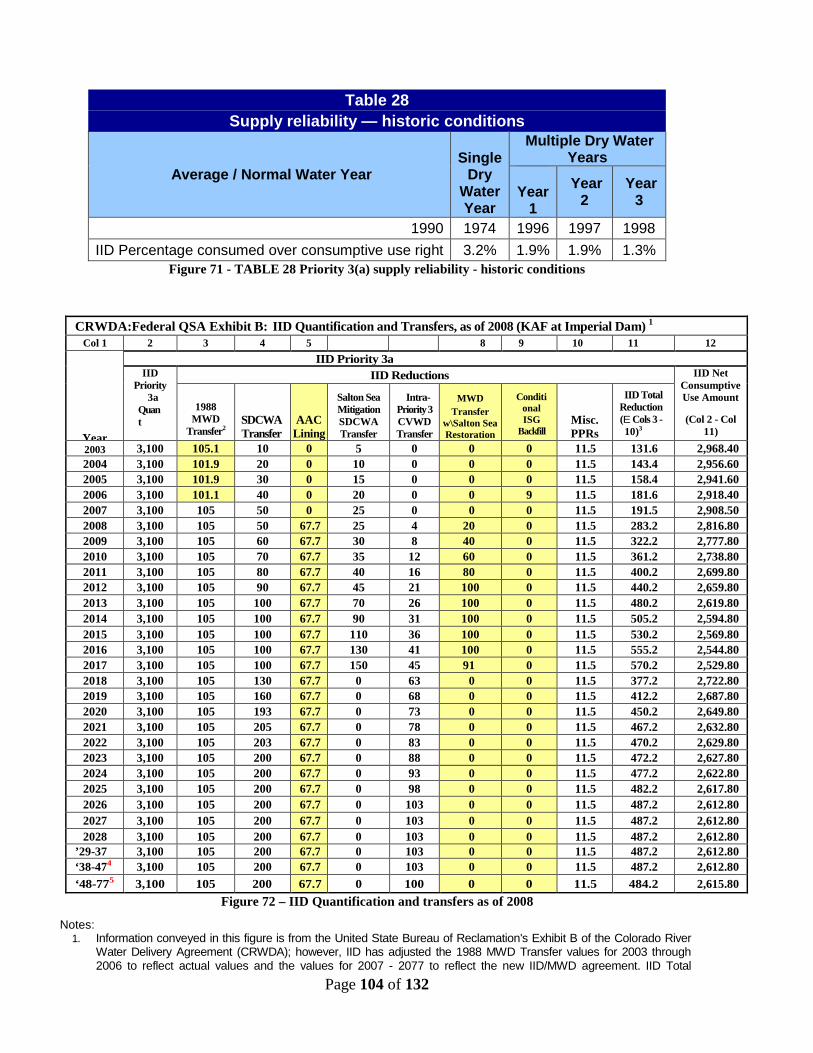
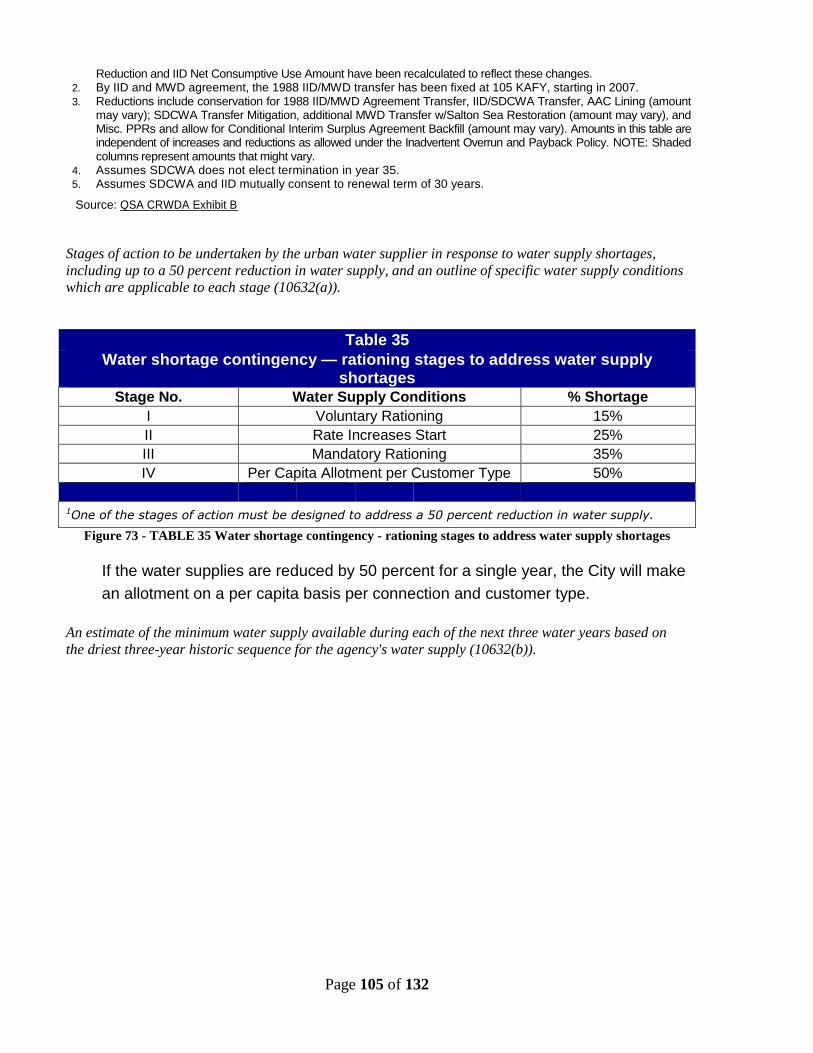
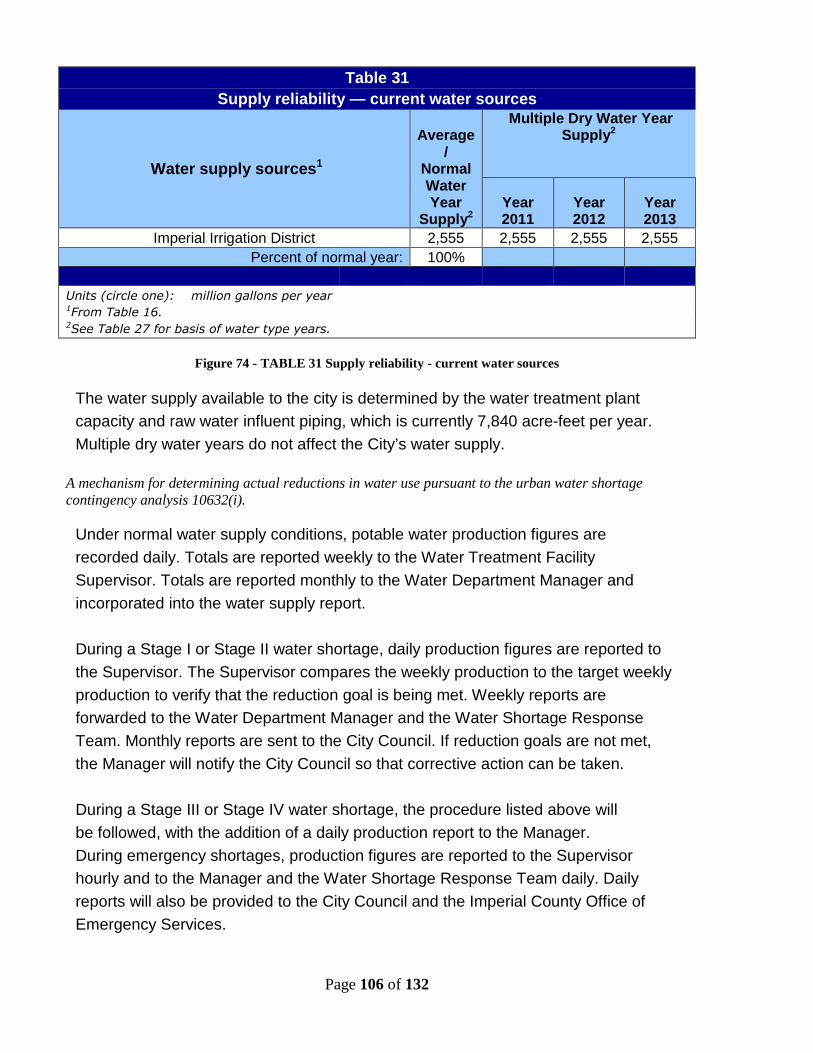
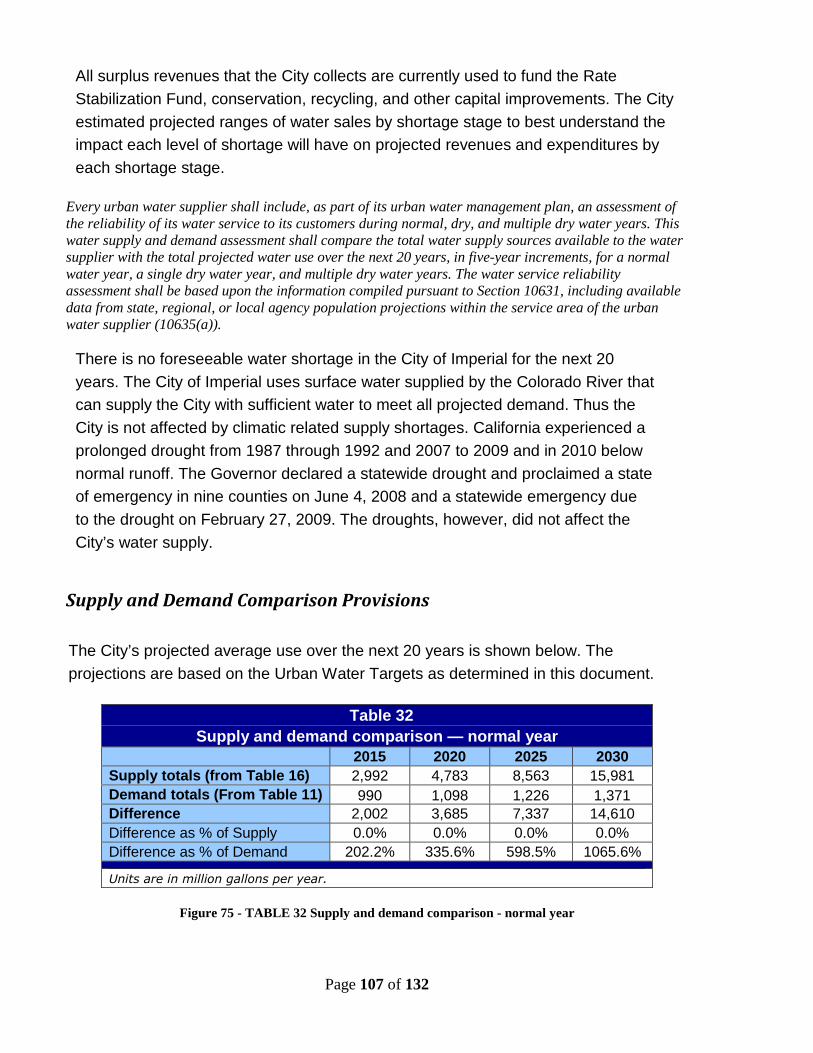
......................................................................................................................................................... 60Figure 47 - Total Estimated Water Flow by the IID........................................................................ 60Figure 48 - Graphical Representation of the Total Water Balance IID Water Use ......................... 61Figure 49 – IID QSA Delivery Schedule......................................................................................... 66Figure 50 - TABLE 18 Groundwater - volume pumped ................................................................. 69Figure 51 - TABLE 19 Groundwater - volume projected to be pumped......................................... 69Figure 52 - TABLE 20 Transfer and exchange opportunities ......................................................... 72Figure 53 - TABLE 21 Recycled water - wastewater collection and treatment .............................. 75Figure 54 – TABLE 22 Recycled water – non-recycled wastewater disposal ................................ 75Figure 55 - TABLE 23 Recycled water - potential future use......................................................... 76Figure 56 - TABLE 24 Recycled Water - 2005 UWMP use projection compared to 2010 actual . 77Figure 57 - TABLE 25 Methods to encourage recycled water use ................................................. 78Figure 58 - TABLE 26 Future water supply projects ...................................................................... 79Figure 59 - TABLE 29 Factors resulting in inconsistency of supply .............................................. 82Figure 60 - TABLE 36 Water shortage contingency - mandatory prohibitions .............................. 85Figure 61 – Water shortage stages and triggering mechanisms ...................................................... 86Figure 62 - Water rationing stages and reduction goals .................................................................. 88Figure 63 - TABLE 37 Water shortage contingency - consumption reduction methods ................ 89Figure 64 - Per Capita Health and Safety water quantity calculations ............................................ 90Figure 65 - TABLE 38 Water shortage contingency - penalties and charges ................................. 92Figure 66 - TABLE 30 Water quality - current and projected water supply impacts ..................... 95Figure 67 - Raw Colorado River Water General Tested Mineral Quality (In IID Delivery System)......................................................................................................................................................... 96Figure 68 - Total Coliform Variations in the IID Canal Delivery System ...................................... 97Figure 69 - TABLE 27 Basis of water year data ........................................................................... 103Figure 70 – IID consumptive use (at Imperial Dam) versus IID Priority 3(a) per the QSAConsumptive Use Right (1970-2010)............................................................................................ 103Figure 71 - TABLE 28 Priority 3(a) supply reliability - historic conditions................................. 104Figure 72 – IID Quantification and transfers as of 2008 ............................................................... 104Figure 73 - TABLE 35 Water shortage contingency - rationing stages to address water supplyshortages ........................................................................................................................................ 105Figure 74 - TABLE 31 Supply reliability - current water sources ................................................ 106Figure 75 - TABLE 32 Supply and demand comparison - normal year........................................ 107Figure 76 - TABLE 33 Supply and demand comparison - single dry year ................................... 108Figure 77 - TABLE 34 Supply and demand comparison - multiple dry-year events.................... 109Figure 78 - Demand Management Measures and CUWCC BMP names...................................... 111
City of Imperial 2010 Urban Water Management Plan
Page 7 of 132
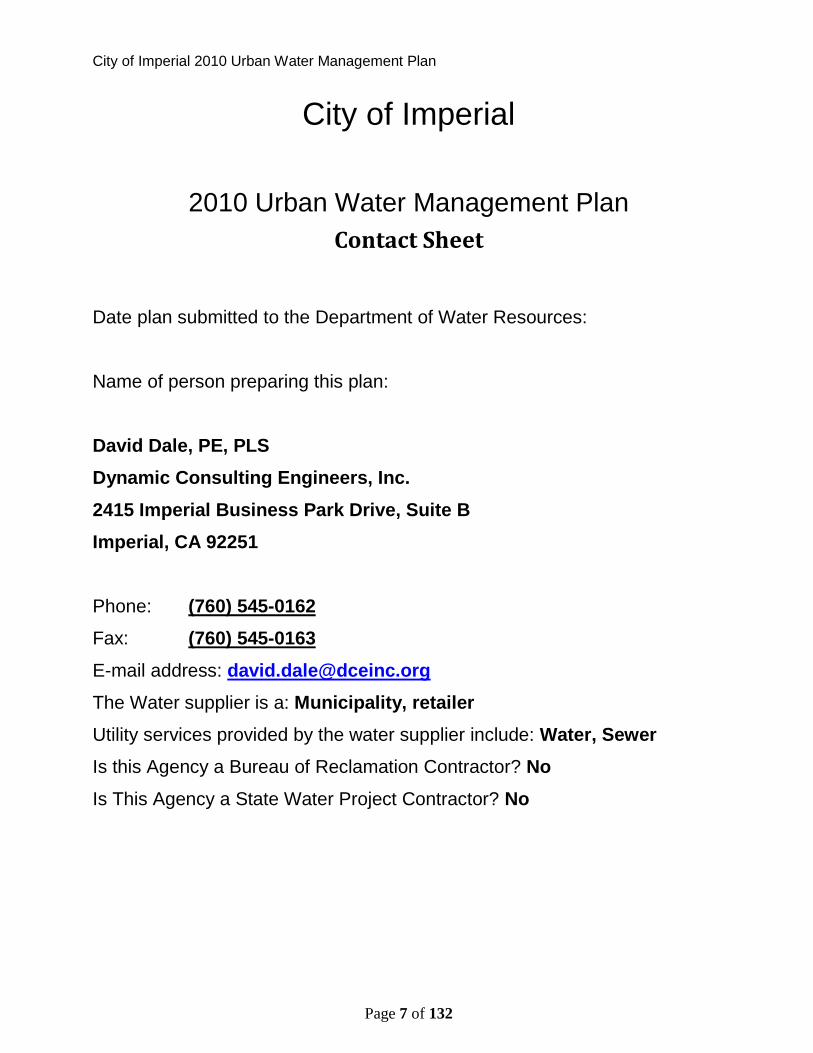
City of Imperial
2010 Urban Water Management Plan
Contact Sheet
Date plan submitted to the Department of Water Resources:
Utility services provided by the water supplier include: Water, Sewer
Is this Agency a Bureau of Reclamation Contractor? No
Is This Agency a State Water Project Contractor? No
City of Imperial 2010 Urban Water Management Plan
Page 8 of 132
Introduction/Executive Summary
The Urban Water Management (UWMP) Act (California Water Code §10610 et seq.)
requires urban water suppliers to report, describe, and evaluate:
• Water deliveries and uses
• Water supply sources
• Efficient water uses
• DMMs, including implementation strategy and schedule
In addition, the Water Conservation Bill of 2009 requires urban water suppliers to report
in their UWMPs base daily per capita water use (baseline), urban water use target,
interim urban water use target, and compliance daily per capita water use.
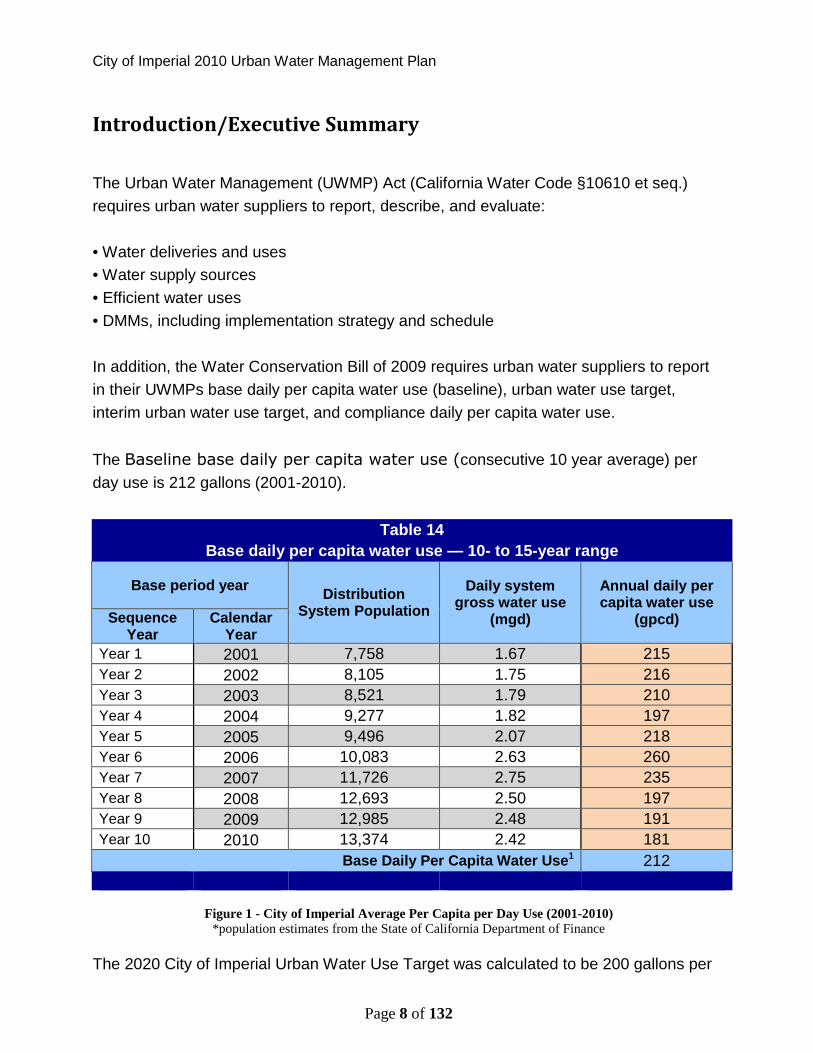
The Baseline base daily per capita water use (consecutive 10 year average) per
day use is 212 gallons (2001-2010).
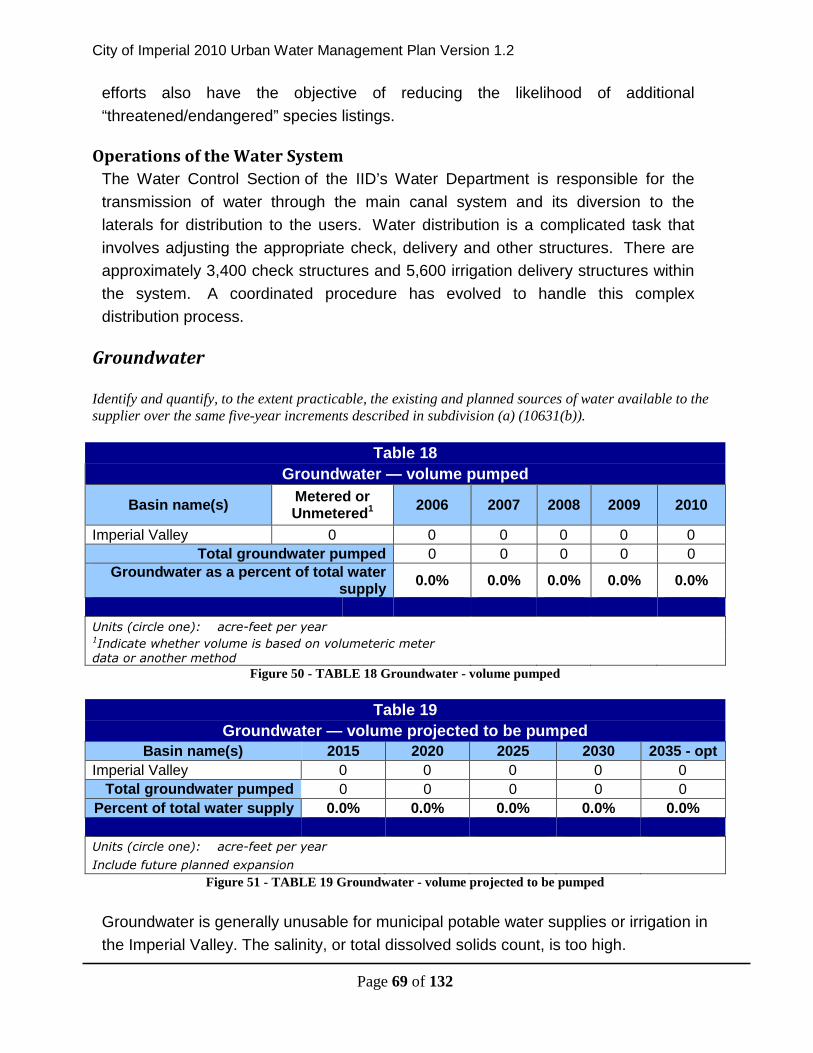
Table 14
Base daily per capita water use — 10- to 15-year range
Base period yearDistribution
System Population
Daily systemgross water use
(mgd)
Annual daily percapita water use
(gpcd)SequenceYear
CalendarYear
Year 1 2001 7,758 1.67 215
Year 2 2002 8,105 1.75 216
Year 3 2003 8,521 1.79 210
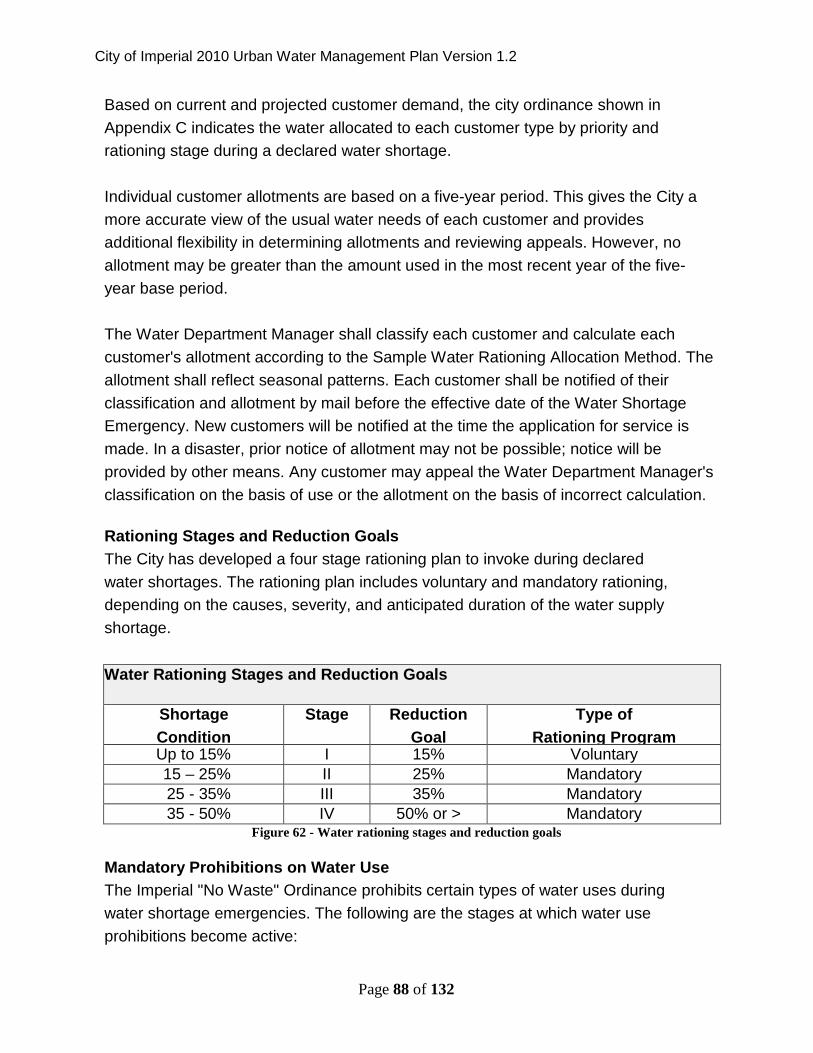
Year 4 2004 9,277 1.82 197
Year 5 2005 9,496 2.07 218
Year 6 2006 10,083 2.63 260
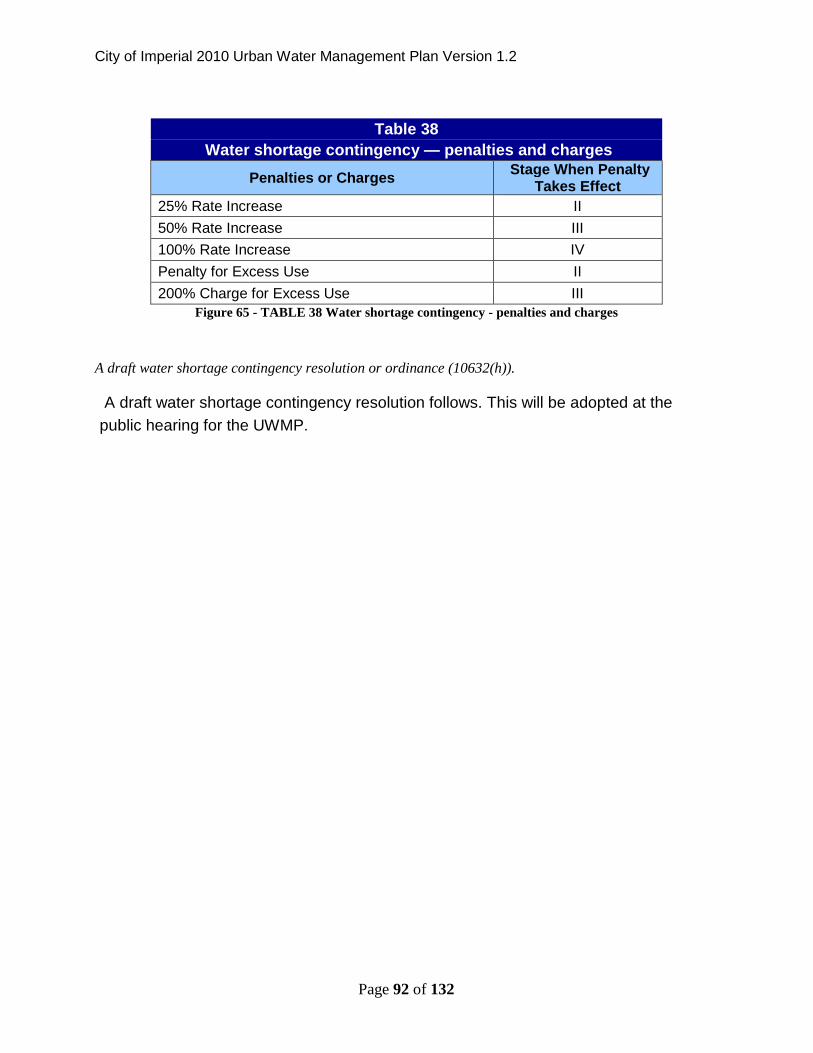
Year 7 2007 11,726 2.75 235
Year 8 2008 12,693 2.50 197
Year 9 2009 12,985 2.48 191
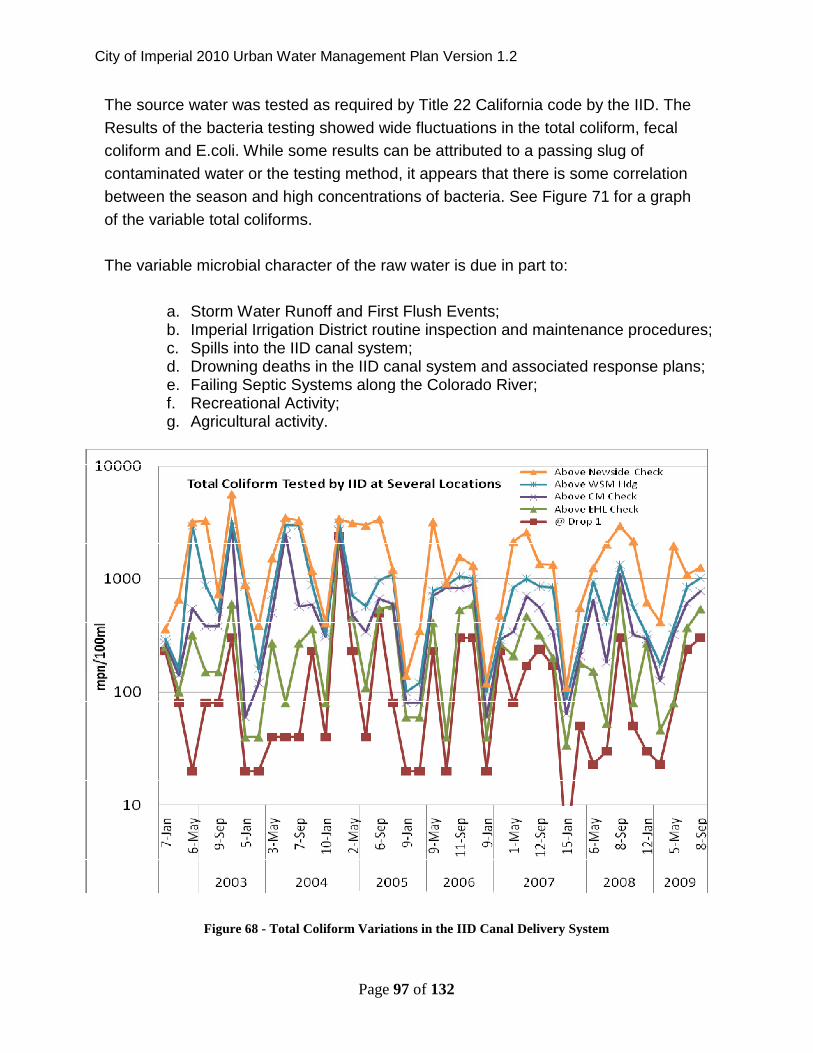
Year 10 2010 13,374 2.42 181
Base Daily Per Capita Water Use1 212
Figure 1 - City of Imperial Average Per Capita per Day Use (2001-2010)*population estimates from the State of California Department of Finance
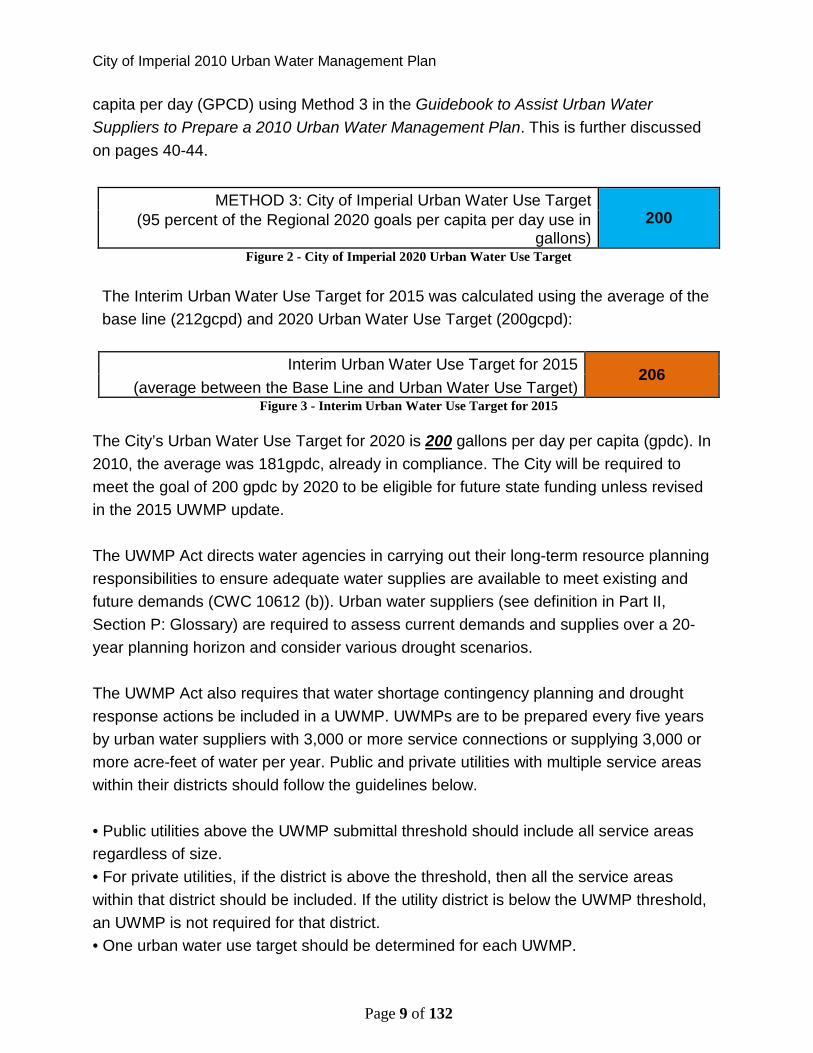
The 2020 City of Imperial Urban Water Use Target was calculated to be 200 gallons per
City of Imperial 2010 Urban Water Management Plan
Page 9 of 132
capita per day (GPCD) using Method 3 in the Guidebook to Assist Urban Water
Suppliers to Prepare a 2010 Urban Water Management Plan. This is further discussed
on pages 40-44.
METHOD 3: City of Imperial Urban Water Use Target200(95 percent of the Regional 2020 goals per capita per day use in
gallons)Figure 2 - City of Imperial 2020 Urban Water Use Target
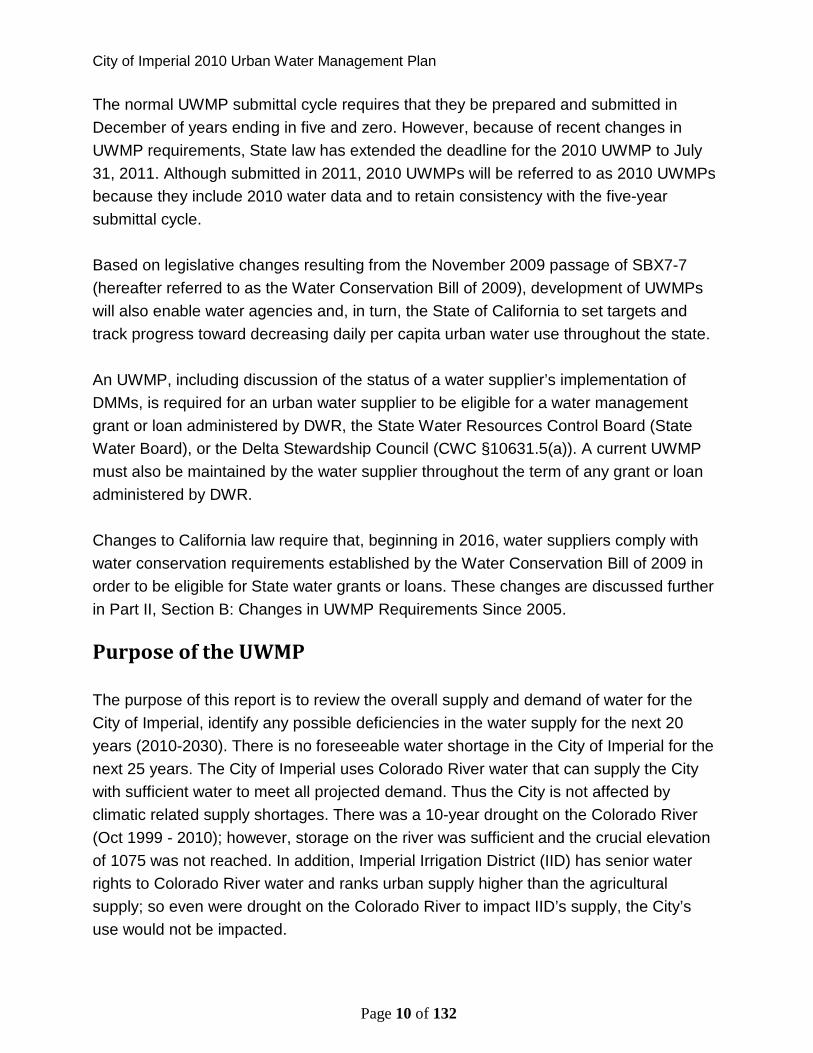
The Interim Urban Water Use Target for 2015 was calculated using the average of the
base line (212gcpd) and 2020 Urban Water Use Target (200gcpd):
Interim Urban Water Use Target for 2015206
(average between the Base Line and Urban Water Use Target)Figure 3 - Interim Urban Water Use Target for 2015
The City’s Urban Water Use Target for 2020 is 200 gallons per day per capita (gpdc). In
2010, the average was 181gpdc, already in compliance. The City will be required to
meet the goal of 200 gpdc by 2020 to be eligible for future state funding unless revised
in the 2015 UWMP update.
The UWMP Act directs water agencies in carrying out their long-term resource planning
responsibilities to ensure adequate water supplies are available to meet existing and
future demands (CWC 10612 (b)). Urban water suppliers (see definition in Part II,
Section P: Glossary) are required to assess current demands and supplies over a 20-
year planning horizon and consider various drought scenarios.
The UWMP Act also requires that water shortage contingency planning and drought
response actions be included in a UWMP. UWMPs are to be prepared every five years
by urban water suppliers with 3,000 or more service connections or supplying 3,000 or
more acre-feet of water per year. Public and private utilities with multiple service areas
within their districts should follow the guidelines below.
• Public utilities above the UWMP submittal threshold should include all service areas
regardless of size.
• For private utilities, if the district is above the threshold, then all the service areas
within that district should be included. If the utility district is below the UWMP threshold,
an UWMP is not required for that district.
• One urban water use target should be determined for each UWMP.
City of Imperial 2010 Urban Water Management Plan
Page 10 of 132
The normal UWMP submittal cycle requires that they be prepared and submitted in
December of years ending in five and zero. However, because of recent changes in
UWMP requirements, State law has extended the deadline for the 2010 UWMP to July
31, 2011. Although submitted in 2011, 2010 UWMPs will be referred to as 2010 UWMPs
because they include 2010 water data and to retain consistency with the five-year
submittal cycle.
Based on legislative changes resulting from the November 2009 passage of SBX7-7
(hereafter referred to as the Water Conservation Bill of 2009), development of UWMPs
will also enable water agencies and, in turn, the State of California to set targets and
track progress toward decreasing daily per capita urban water use throughout the state.
An UWMP, including discussion of the status of a water supplier’s implementation of
DMMs, is required for an urban water supplier to be eligible for a water management
grant or loan administered by DWR, the State Water Resources Control Board (State
Water Board), or the Delta Stewardship Council (CWC §10631.5(a)). A current UWMP
must also be maintained by the water supplier throughout the term of any grant or loan
administered by DWR.
Changes to California law require that, beginning in 2016, water suppliers comply with
water conservation requirements established by the Water Conservation Bill of 2009 in
order to be eligible for State water grants or loans. These changes are discussed further
in Part II, Section B: Changes in UWMP Requirements Since 2005.
Purpose of the UWMP
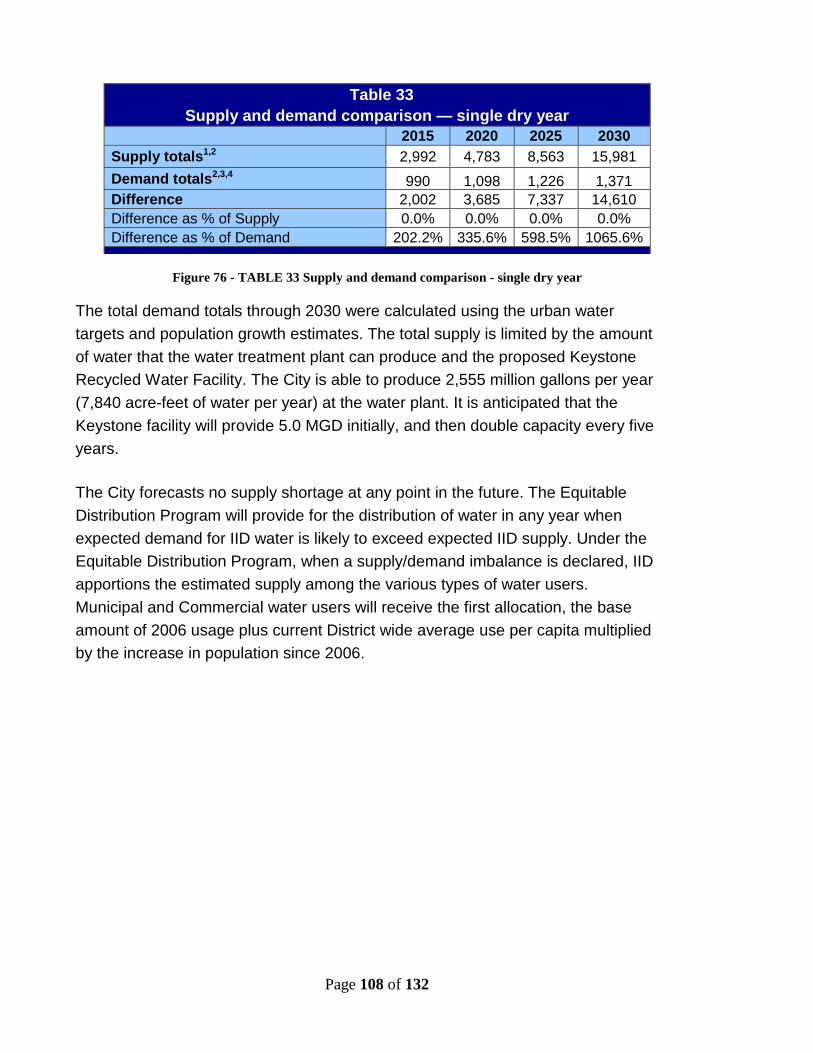
The purpose of this report is to review the overall supply and demand of water for the
City of Imperial, identify any possible deficiencies in the water supply for the next 20
years (2010-2030). There is no foreseeable water shortage in the City of Imperial for the
next 25 years. The City of Imperial uses Colorado River water that can supply the City
with sufficient water to meet all projected demand. Thus the City is not affected by
climatic related supply shortages. There was a 10-year drought on the Colorado River
(Oct 1999 - 2010); however, storage on the river was sufficient and the crucial elevation
of 1075 was not reached. In addition, Imperial Irrigation District (IID) has senior water
rights to Colorado River water and ranks urban supply higher than the agricultural
supply; so even were drought on the Colorado River to impact IID’s supply, the City’s
use would not be impacted.
City of Imperial 2010 Urban Water Management Plan
Page 11 of 132
An awareness of the importance of a sound water policy is important in recognizing that
water in California is becoming a stretched resource. In fact, California’s use of 5.2
MAFY of Colorado River water exceeds its right to 4.4 MAFY. This led to the
Quantification Settlement Agreement of 2010 (QSA), under which the amount of
Colorado River water available to California and to the Imperial Valley was quantified.
Land use decisions based in part upon water resources have significant effects on the
physical, social, and economic character of the county. Although the UWMP is
concerned with long-range goals and objectives, attention should also be given to
currently existing conditions and issues. This approach will enable the City to face
important issues today, thereby avoiding problems in the future.
In addition to the statement of goals, objectives and policies, the UWMP includes
discussions, data, and water conservation programs which provide for the prudent and
conscientious management and utilization of water resources for future development in
the City. The implementation of the UWMP is meant to assure that water resources are
conserved and utilized as efficiently as possible, and to provide for the long-term viability
and availability of this precious resource.
This UWMP follows the outline order of the Guidebook to Assist Urban Water Suppliers to
Prepare a 2010 Urban Water Management Plan (Final, March 2011), and includes the
following:
Section 1 - Plan Preparation Section 2 - System Descriptions Section 3 - System Demands Section 4 - System Supplies Section 5 - Water Shortage Contingency Plans Section 6 - Demand Management Measures
*** Following Paragraphs in italicized text are verbiage from the law.
City of Imperial 2010 Urban Water Management Plan
Page 12 of 132
Section 1 - Plan Preparation
Coordination
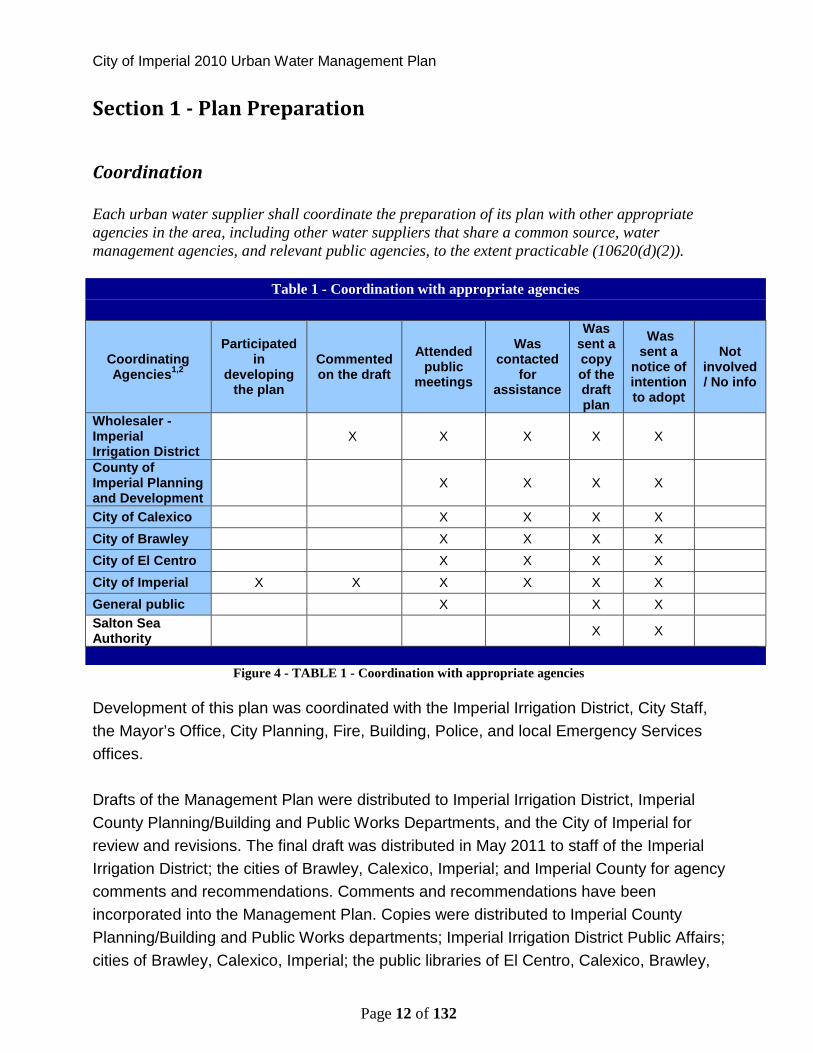
Each urban water supplier shall coordinate the preparation of its plan with other appropriateagencies in the area, including other water suppliers that share a common source, watermanagement agencies, and relevant public agencies, to the extent practicable (10620(d)(2)).
Table 1 - Coordination with appropriate agencies
CoordinatingAgencies
1,2
Participatedin
developingthe plan
Commentedon the draft
Attendedpublic
meetings
Wascontacted
forassistance
Wassent acopyof thedraftplan
Wassent a
notice ofintentionto adopt
Notinvolved/ No info
Wholesaler -ImperialIrrigation District
X X X X X
County ofImperial Planningand Development
X X X X
City of Calexico X X X X
City of Brawley X X X X
City of El Centro X X X X
City of Imperial X X X X X X
General public X X X
Salton SeaAuthority
X X
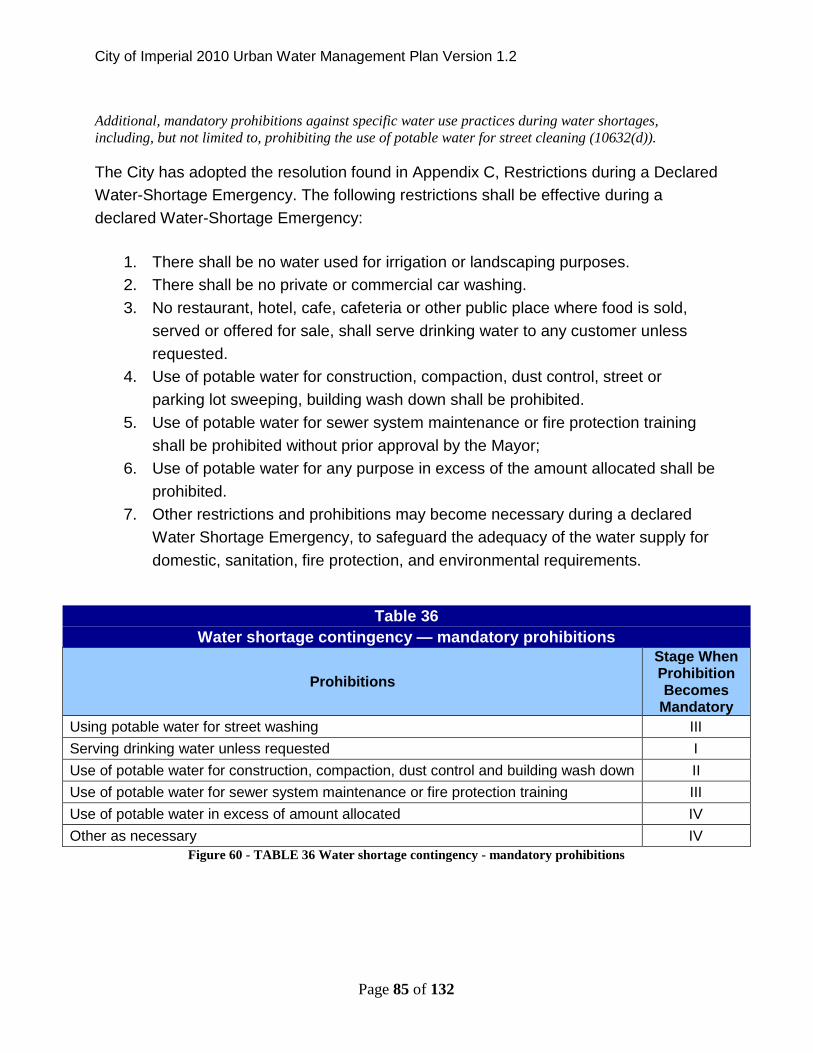
Figure 4 - TABLE 1 - Coordination with appropriate agencies
Development of this plan was coordinated with the Imperial Irrigation District, City Staff,
the Mayor’s Office, City Planning, Fire, Building, Police, and local Emergency Services
offices.
Drafts of the Management Plan were distributed to Imperial Irrigation District, Imperial
County Planning/Building and Public Works Departments, and the City of Imperial for
review and revisions. The final draft was distributed in May 2011 to staff of the Imperial
Irrigation District; the cities of Brawley, Calexico, Imperial; and Imperial County for agency
comments and recommendations. Comments and recommendations have been
incorporated into the Management Plan. Copies were distributed to Imperial County
Planning/Building and Public Works departments; Imperial Irrigation District Public Affairs;
cities of Brawley, Calexico, Imperial; the public libraries of El Centro, Calexico, Brawley,
City of Imperial 2010 Urban Water Management Plan
Page 13 of 132
and Imperial; and to others on request for public review.
Every urban water supplier required to prepare a plan pursuant to this part shall, at least 60 daysprior to the public hearing on the plan required by Section 10642, notify any city or county withinwhich the supplier provides water supplies that the urban water supplier will be reviewing theplan and considering amendments or changes to the plan. The urban water supplier may consultwith, and obtain comments from, any city or county that receives notice pursuant to thissubdivision (10621(b)).
The City provides water to connections within its service boundary only. However, the
city sent notifications to all the cities and other agencies listed in Table 1 at least 60 days
prior to the UWMP public hearing that the plan was being reviewed and changes were
being considered.
The urban water supplier shall provide that portion of its urban water management plan preparedpursuant to this article to any city or county within which it provides water supplies no later than60 days after the submission of its urban water management plan (10635(b)).
A copy of the 2010 UWMP will be provided to each city in the Imperial Valley that is
required to submit an UWMP, the County of Imperial, and the Imperial Irrigation District
no later than 60 days after submission to DWR.
Each urban water supplier shall encourage the active involvement of diverse social, cultural, andeconomic elements of the population within the service area prior to and during the preparation ofthe plan (10642).
Prior to adopting a plan, the urban water supplier shall make the plan available for publicinspection and shall hold a public hearing thereon. Prior to the hearing, notice of the time andplace of hearing shall be published within the jurisdiction of the publicly owned water supplierpursuant to Section 6066 of the Government Code. The urban water supplier shall provide noticeof the time and place of hearing to any city or county within which the supplier provides watersupplies. A privately owned water supplier shall provide an equivalent notice within its servicearea (10642).
The City of Imperial encourages community participation in its urban water management
planning efforts.
Copies of the draft plan were available at City Hall. The City published notice in the local
newspaper of the availability of the draft UWMP for public inspection and stating the date
and time of the public hearing to adopt the UWMP. The notice was published once a
week for two successive weeks.
The hearing took place on June 15th, 2011 at 7:00 pm at City Hall located at:
City of Imperial 2010 Urban Water Management Plan
Page 14 of 132
200 West 9th Street
Imperial, CA. 92251-1637
Following the public meeting, a formal public hearing was held during the regular meeting
of the City Council for review and comment on the draft plan before the City Council’s
approval.
The final plan, which was adopted by City Council on June 15, 2011, was distributed to
the cities of Brawley, Calexico, Calipatria, El Centro, Holtville, and Westmorland; Imperial
County Planning/Building and Public Works departments; Imperial Irrigation District's
Public Affairs; public libraries in the cities of El Centro, Calexico, Brawley, and Imperial;
and to others upon request. The final plan was submitted to the California Department of
Water Resources within 30 days of Council approval.
Plan Adoption, Submittal and Implementation
The amendments to, or changes in, the plan shall be adopted and filed in the manner set forth in Article 3(commencing with Section 10640) (10621(c)).
If changes are necessary to the UWMP after adoption by the city, the City will hold
another public hearing to readopt the plan.
After the hearing, the plan shall be adopted as prepared or as modified after the hearing (10642).An urban water supplier shall implement its plan adopted pursuant to this chapter in accordance with theschedule set forth in its plan (10643).
An urban water supplier shall implement its plan adopted pursuant to this chapter in accordance with theschedule set forth in its plan (10643).
The city will implement the UWMP after adoption. Procedures to implement will include
annual reviews of progress on the Demand Management Measures, use of the UWMP in
developing a revised Water Master Plan and in the planning process of new
development within the City.
An urban water supplier shall submit to the department, the California State Library, and any city orcounty within which the supplier provides water supplies a copy of its plan no later than 30 days afteradoption. Copies of amendments or changes to the plans shall be submitted to the department, theCalifornia State Library, and any city or county within which the supplier provides water supplies within30 days after adoption (10644(a)).
Within 30 days of adoption, the adopted UWMP will be submitted to DWR and the
California State Library. Imperial does not supply water to another city or nor to any area
of Imperial County.
City of Imperial 2010 Urban Water Management Plan
Page 15 of 132
Not later than 30 days after filing a copy of its plan with the department, the urban water supplier and thedepartment shall make the plan available for public review during normal business hours. (10645).
Within 30 days of submitting the UWMP to DWR, the adopted UWMP has been or will be
available for public review during normal business hours. The plan is available for review
at City Hall located at:
200 West 9th Street
Imperial, CA. 92251-1637
City of Imperial 2010 Urban Water Management Plan
Page 16 of 132
Section 2 - System Description
Describe the service area of the supplier (10631(a)).
Service Area Physical Description
Imperial
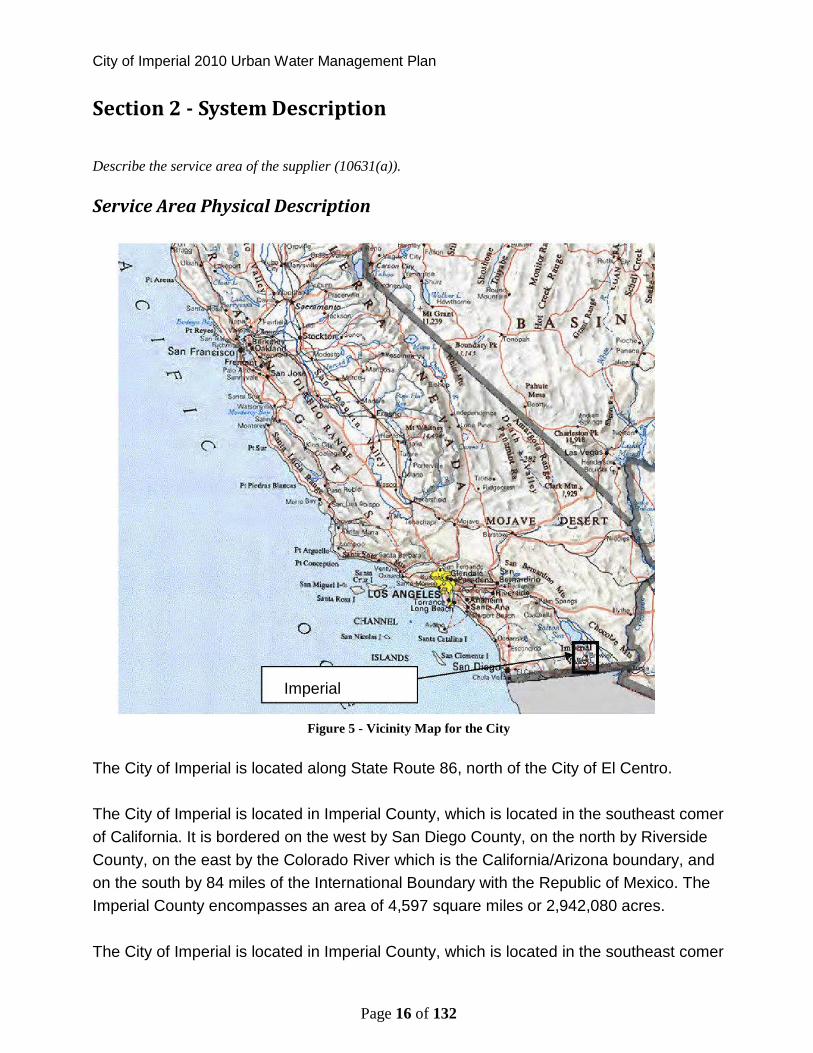
Figure 5 - Vicinity Map for the City
The City of Imperial is located along State Route 86, north of the City of El Centro.
The City of Imperial is located in Imperial County, which is located in the southeast comer
of California. It is bordered on the west by San Diego County, on the north by Riverside
County, on the east by the Colorado River which is the California/Arizona boundary, and
on the south by 84 miles of the International Boundary with the Republic of Mexico. The
Imperial County encompasses an area of 4,597 square miles or 2,942,080 acres.
The City of Imperial is located in Imperial County, which is located in the southeast comer
City of Imperial 2010 Urban Water Management Plan
Page 17 of 132
of California. It is bordered on the west by San Diego County, on the north by Riverside
County, on the east by the Colorado River which is the California/Arizona boundary, and
on the south by 84 miles of the International Boundary with the Republic of Mexico.
Imperial County encompasses an area of 4,597 square miles or 2,942,080 acres. The
Imperial Valley is an area within Imperial County that extends southward for 50 miles
from the southern end of the Salton Sea to Mexico.
The Imperial Valley was created when the Colorado River formed a delta that isolated the
Salton Trough from the Gulf of California. Subsequently, under desert conditions, the
inland sea dried up. Later, the trough was occupied by lakes for various periods, and
deposition into these lakes gave the valley its characteristic flat lands and fertile soils.
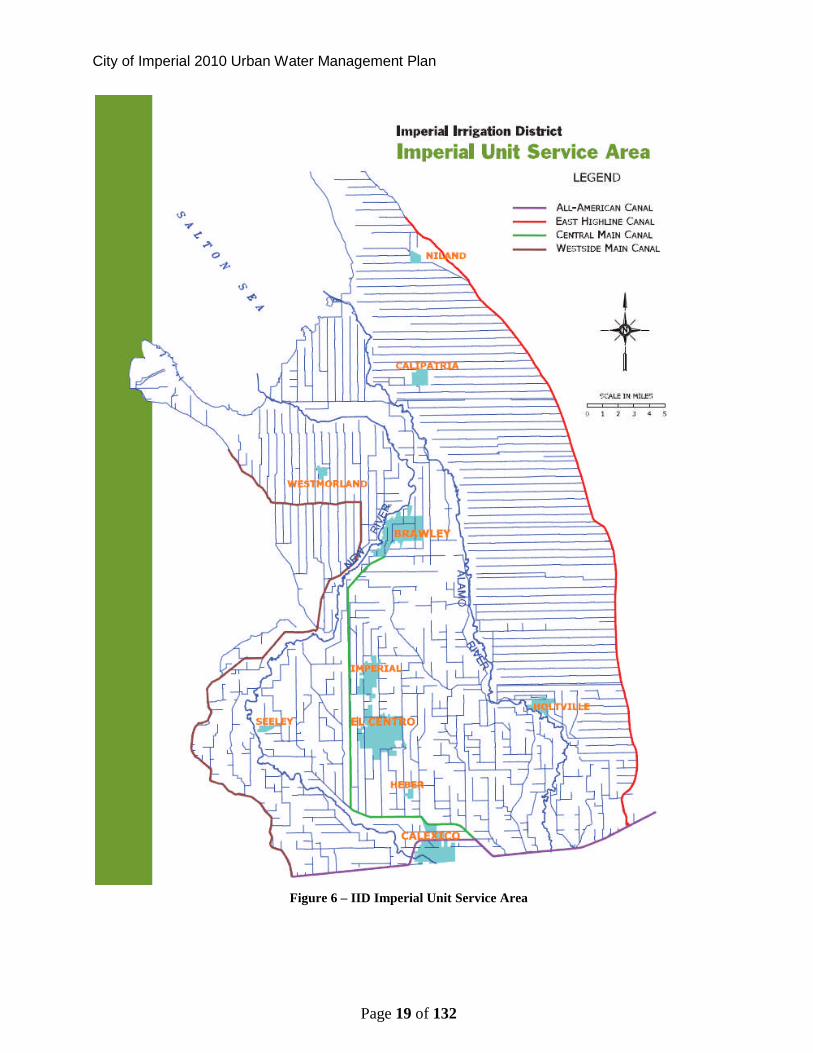
The geographic center of the Imperial Valley is one of the most productive agricultural
areas in the world, despite the fact that it is in a very arid region. The general area of the
Imperial Valley, also known as the Imperial Unit, is bounded on the north by the Salton
Sea, on the south by the U.S./ Mexico border, on the east generally by the East Highline
Canal, and on the west generally by the Westside Main Canal (See Figure 6).
Approximately fifty percent of lands in Imperial Valley are undeveloped and are under
federal ownership and jurisdiction. One-fifth of the nearly 3 million acres in Imperial Valley
are irrigated for agricultural purposes, most notably the areas known as Coachella Valley
and the Imperial Valley. The Net irrigated agriculture area in 2010 consisted of 474,140
acres (IID 2010 Area Receiving Water Report). The developed area within the Imperial
Valley represents less than one percent of the total amount of land. Approximately seven
percent of Imperial Valley is within the boundaries of the Salton Sea.
A significant geographical feature in the Imperial Valley is the Salton Trough, which
contains the Salton Sea and the Imperial Valley, and has been evolving for millions of
years. It is a rift in the earth's crustal plates. The East Pacific Rise is the boundary
between the Pacific and North American Plates. It extends up the Gulf of California by
a series of spreading centers with strike slip faults. The thinning of the crust from the
slow but continuous widening of the Salton Trough causes the earth's magma to rise
closer to the surface and generates abnormally high heat flow, which in turn heats
deep ground waters.
The trough is a structural extension of the Gulf of California. In prehistoric times it
contained the ancient Lake Cahuilla (not to be confused with the present Lake Cahuilla
which is located at the terminus of the Coachella Branch of the All-American Canal).
City of Imperial 2010 Urban Water Management Plan
Page 18 of 132
City of Imperial Water
The City of Imperial receives raw water from the Imperial Irrigation District.
Approximately three percent of the Imperial Irrigation District's untreated water is
ultimately used for urban purposes and is provided indirectly to consumers through a
variety of public and private treatment agencies.
The City of Imperial’s sphere of influence is located within the Imperial Unit of the
Imperial Irrigation District's Irrigation (IID) service area. The 699,092 acre Imperial Unit
serves the Imperial Valley including the urban areas for the cities of Imperial, Calexico,
Imperial and Brawley and approximately a quarter of Imperial County's unincorporated
area. In total, IID delivers water to an area of just over 520,000 acres, including cities,
cemeteries, schools, parks, golf courses, etc. in addition to the irrigated land. The
Imperial Irrigation District's total service area, lying entirely within Imperial Valley, is
divided into four units: Imperial, West Mesa, East Mesa, and Pilot Knob, with a gross
acreage of 1,061,637 acres.
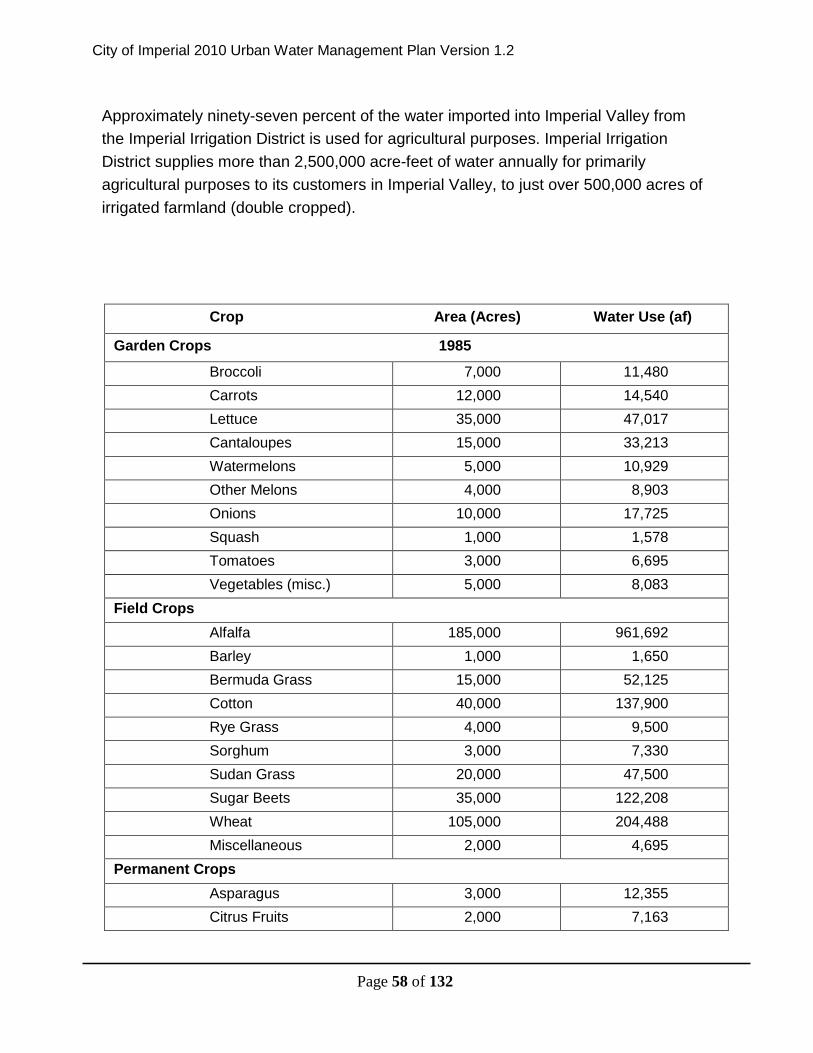
A significant portion (around 97%) of the water demand in the Imperial Region is for
irrigation. Agriculture is successful in this region for two reasons: 1) rich soils which
have accumulated on the valley floor over thousands of years; and 2) the large
quantity of water that is transported 80 miles from the Colorado River via the All-
American Canal and distributed to farmlands by a complex system of smaller canals.
Recycled water low in salinity could be used for agricultural; however, treatment and
distribution of recycled wastewater low in salinity is not cost effective option at this
time. Colorado River water salinity has averaged 760 parts per million over the last 20
years, and treated municipal wastewater is approximately 200-300 ppm higher in
salinity. In addition, agricultural producers are averse to using treated wastewater due
to consumer perceptions that the crops might be tainted.
City of Imperial 2010 Urban Water Management Plan
Page 19 of 132
Figure 6 – IID Imperial Unit Service Area
City of Imperial 2010 Urban Water Management Plan
Page 20 of 132
Figure 7- City Limits of the City of Imperial
City of Imperial 2010 Urban Water Management Plan
Page 21 of 132
Description of City Facilities
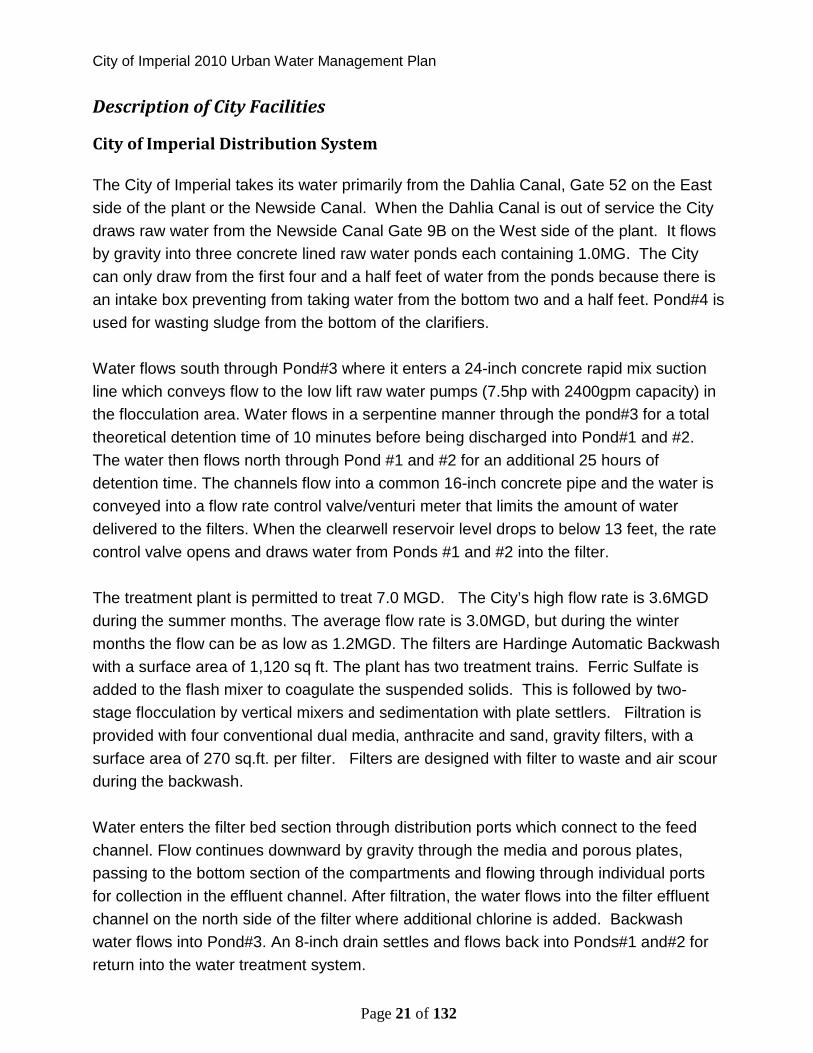
City of Imperial Distribution System
The City of Imperial takes its water primarily from the Dahlia Canal, Gate 52 on the East
side of the plant or the Newside Canal. When the Dahlia Canal is out of service the City
draws raw water from the Newside Canal Gate 9B on the West side of the plant. It flows
by gravity into three concrete lined raw water ponds each containing 1.0MG. The City
can only draw from the first four and a half feet of water from the ponds because there is
an intake box preventing from taking water from the bottom two and a half feet. Pond#4 is
used for wasting sludge from the bottom of the clarifiers.
Water flows south through Pond#3 where it enters a 24-inch concrete rapid mix suction
line which conveys flow to the low lift raw water pumps (7.5hp with 2400gpm capacity) in
the flocculation area. Water flows in a serpentine manner through the pond#3 for a total
theoretical detention time of 10 minutes before being discharged into Pond#1 and #2.
The water then flows north through Pond #1 and #2 for an additional 25 hours of
detention time. The channels flow into a common 16-inch concrete pipe and the water is
conveyed into a flow rate control valve/venturi meter that limits the amount of water
delivered to the filters. When the clearwell reservoir level drops to below 13 feet, the rate
control valve opens and draws water from Ponds #1 and #2 into the filter.
The treatment plant is permitted to treat 7.0 MGD. The City’s high flow rate is 3.6MGD
during the summer months. The average flow rate is 3.0MGD, but during the winter
months the flow can be as low as 1.2MGD. The filters are Hardinge Automatic Backwash
with a surface area of 1,120 sq ft. The plant has two treatment trains. Ferric Sulfate is
added to the flash mixer to coagulate the suspended solids. This is followed by two-
stage flocculation by vertical mixers and sedimentation with plate settlers. Filtration is
provided with four conventional dual media, anthracite and sand, gravity filters, with a
surface area of 270 sq.ft. per filter. Filters are designed with filter to waste and air scour
during the backwash.
Water enters the filter bed section through distribution ports which connect to the feed
channel. Flow continues downward by gravity through the media and porous plates,
passing to the bottom section of the compartments and flowing through individual ports
for collection in the effluent channel. After filtration, the water flows into the filter effluent
channel on the north side of the filter where additional chlorine is added. Backwash
water flows into Pond#3. An 8-inch drain settles and flows back into Ponds#1 and#2 for
return into the water treatment system.
City of Imperial 2010 Urban Water Management Plan
Page 22 of 132
Inactivation with liquid chlorination (sodium hypochlorite 12.5%) is provided in a 7500
gallon clearwell and 2.0MG gallon reservoir at water plant site. There are (2) 2.0 MG
finished water storage tanks located off-site at 14th and O Street and Aten Road and
Cross. There are two booster pumps at each of the offsite tanks rated at 75hp and 150hp
respectively.
(4) new booster pumps were installed at the water plant within the last few years. Each
pump is rated at 150hp. The pumps run at 70psi. One pump is run at a time under a lead
lag and when the demand is high two pumps will run at the same time.
Influent turbidity ranges from 2.34 to 6 NTU. Finished water is typically less than 0.1 NTU.
There are times that the influent raw water is greater than 1,600 MPN/100ml. However it
appears that the average influent water contains less than 1000MPN/100ml. The City has
had TTHM results higher than 80ppb. The third and fourth quarters of 2008 and the first
quarter of 2009 were 102, 94 and 85ppb respectively. If results continue to be high the
City should consider some TTHM reduction methods. HAA5 have been under the MCL of
60ppb, averaging approximately 25ppb.
The removal and inactivation requirements for the plant are 4 log virus reduction and 3
log Giardia reduction. The plant is given 2.5 log virus removal credit through filtration and
2.0 log Giardia removal credit. Therefore it is required to achieve a 0.5 log Giardia
inactivation. Adequate disinfection can be provided to meet the requirements.
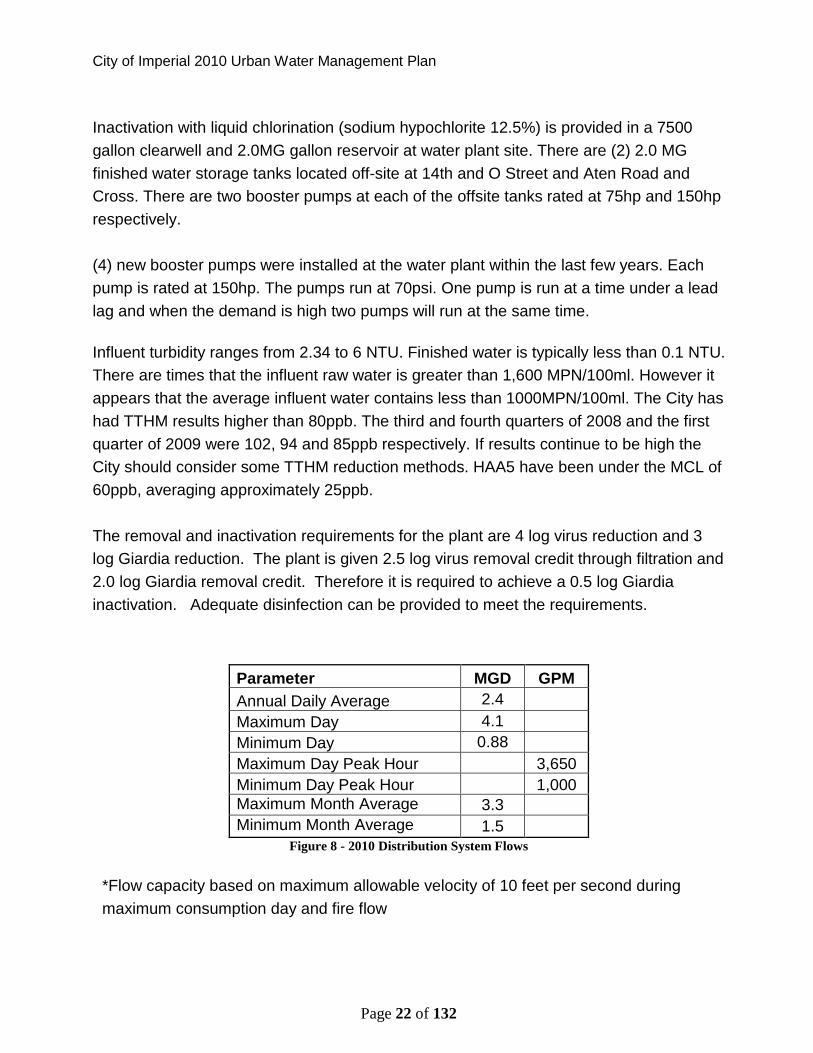
Parameter MGD GPM
Annual Daily Average 2.4
Maximum Day 4.1
Minimum Day 0.88
Maximum Day Peak Hour 3,650
Minimum Day Peak Hour 1,000Maximum Month AverageDaily
3.3Minimum Month AverageDaily
1.5Figure 8 - 2010 Distribution System Flows
*Flow capacity based on maximum allowable velocity of 10 feet per second during
maximum consumption day and fire flow
City of Imperial 2010 Urban Water Management Plan Version 1.2
Page 23 of 132
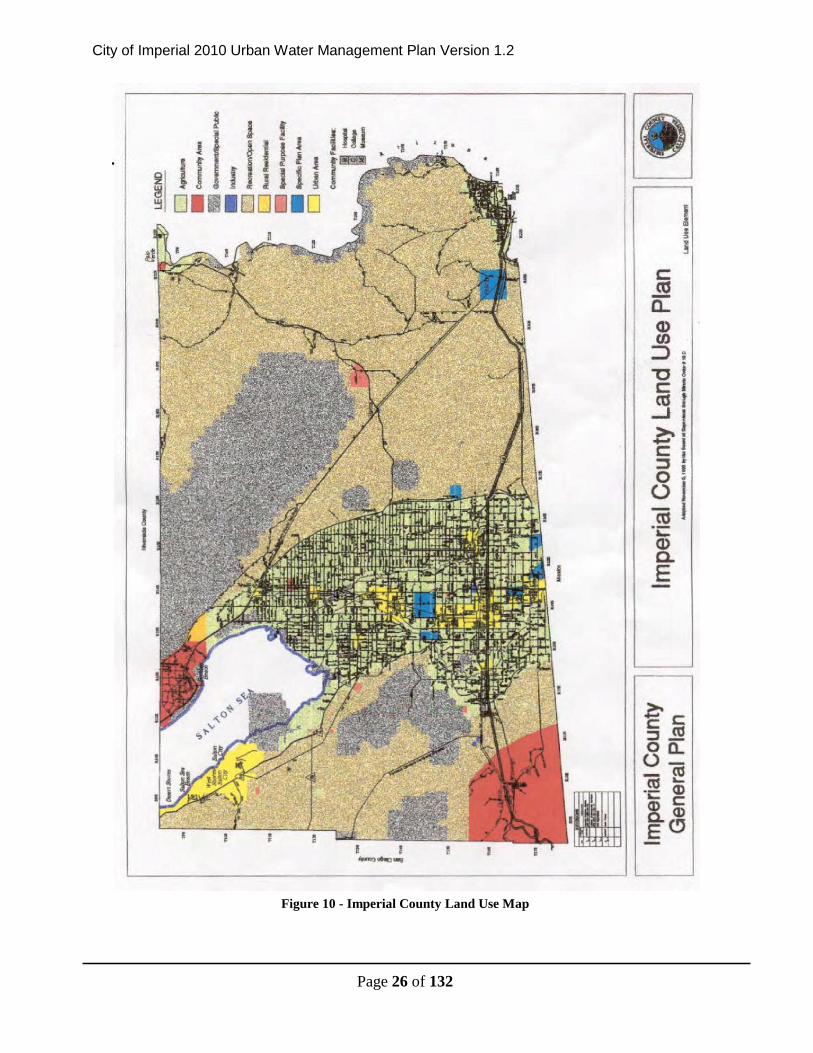
Land Use
The Imperial Valley is predominantly an agricultural area. Agricultural development in
the Imperial Valley began at the turn of the twentieth century and now includes
approximately 475,000 acres of irrigated land that support a $1 billion-plus annual
local agricultural economy. Imperial Irrigation District is the regional water supplier in
the Imperial Valley, delivering Colorado River flows to all agricultural lands and urban
water retailers within its water service area. Imperial Irrigation District operates open
channel gravity flow irrigation and drainage systems and continually strives to develop
innovative ways to improve its operations, increase reliability, and to conserve water.
While the agriculture-based economy is well-established, land use is expected to vary
somewhat over the coming years as urbanization and growth occur adjacent to
existing urban areas. In addition, development of renewable and geothermal energy in
the rural areas is expected.
Current Land Use
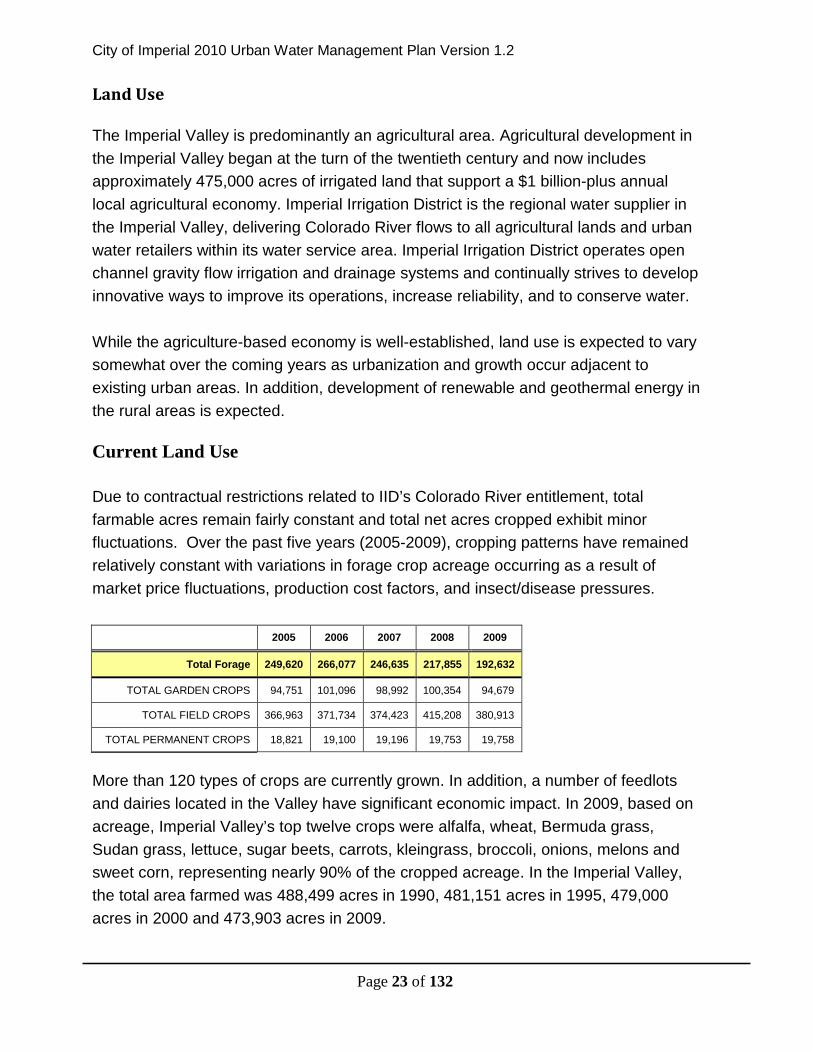
Due to contractual restrictions related to IID’s Colorado River entitlement, total
farmable acres remain fairly constant and total net acres cropped exhibit minor
fluctuations. Over the past five years (2005-2009), cropping patterns have remained
relatively constant with variations in forage crop acreage occurring as a result of
market price fluctuations, production cost factors, and insect/disease pressures.
2005 2006 2007 2008 2009
Total Forage 249,620 266,077 246,635 217,855 192,632
TOTAL GARDEN CROPS 94,751 101,096 98,992 100,354 94,679
TOTAL FIELD CROPS 366,963 371,734 374,423 415,208 380,913
TOTAL PERMANENT CROPS 18,821 19,100 19,196 19,753 19,758
More than 120 types of crops are currently grown. In addition, a number of feedlots
and dairies located in the Valley have significant economic impact. In 2009, based on
acreage, Imperial Valley’s top twelve crops were alfalfa, wheat, Bermuda grass,
Imperial Valley elevations range from a few feet above to 273 feet below mean sea
level. The U.S./Mexico border, located at the southern end of Imperial Valley, has an
elevation of four feet above mean sea level. The Salton Sea located at the northern
end of Imperial Valley, and the water level is 230 feet below MSL (the sea bottom is
273 feet below MSL). The relatively flat topography (235 feet in 35 miles) of the
Imperial Valley and surrounding areas, in conjunction with strong night and day
temperature differentials, particularly in the summer months, produce moderate
winds and deep thermal circulation systems. The thermal systems facilitate general
City of Imperial 2010 Urban Water Management Plan Version 1.2
Page 29 of 132
dispersion of the air.
Wind data from Naval Air Facility El Centro that is used at El Centro Municipal
Airport, show that the prevailing winds blow in a western direction. A crosswind
occasionally blows in a southeast direction.
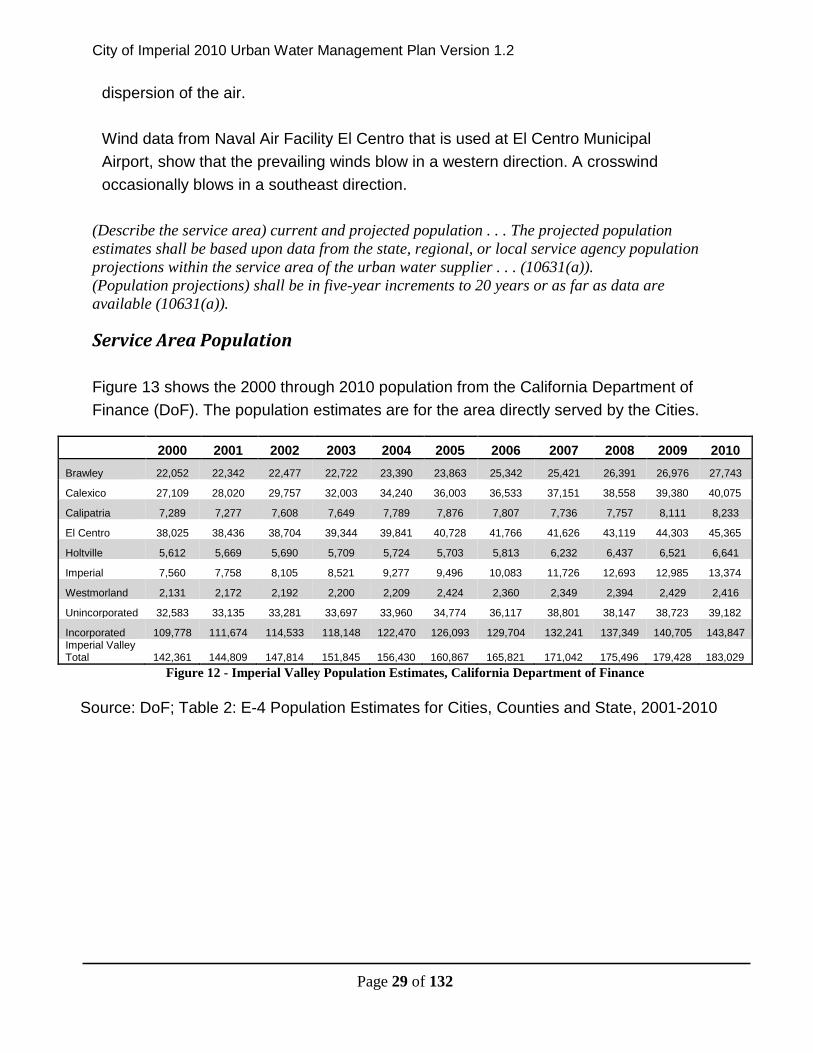
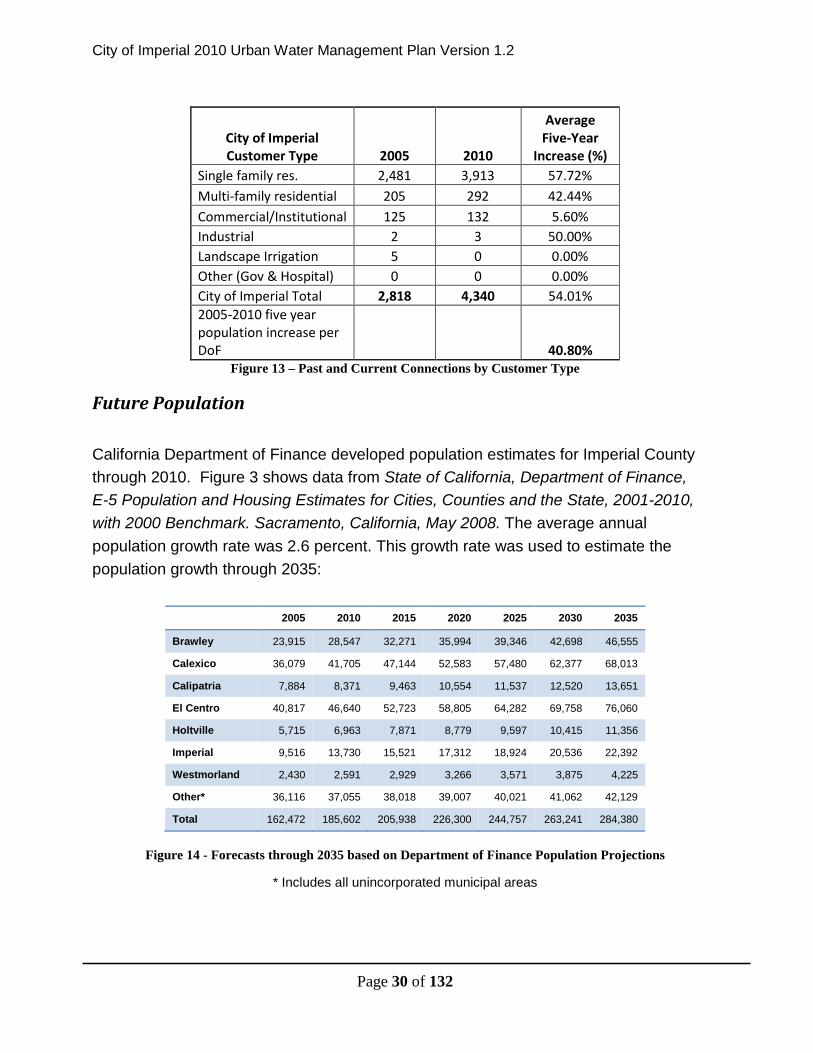
(Describe the service area) current and projected population . . . The projected populationestimates shall be based upon data from the state, regional, or local service agency populationprojections within the service area of the urban water supplier . . . (10631(a)).(Population projections) shall be in five-year increments to 20 years or as far as data areavailable (10631(a)).
Service Area Population
Figure 13 shows the 2000 through 2010 population from the California Department of
Finance (DoF). The population estimates are for the area directly served by the Cities.
Total 162,472 185,602 205,938 226,300 244,757 263,241 284,380
Figure 14 - Forecasts through 2035 based on Department of Finance Population Projections
* Includes all unincorporated municipal areas
City of Imperial 2010 Urban Water Management Plan Version 1.2
Page 31 of 132
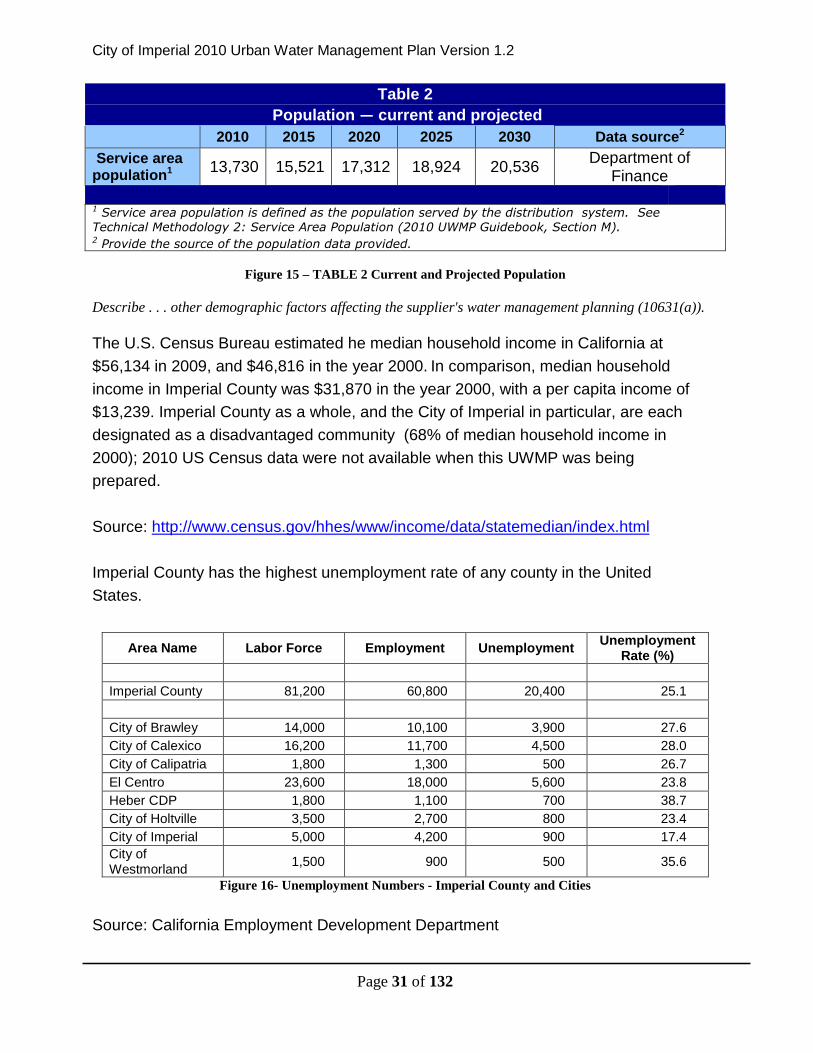
Table 2
Population — current and projected
2010 2015 2020 2025 2030 Data source2
Service areapopulation1 13,730 15,521 17,312 18,924 20,536
Department ofFinance
1 Service area population is defined as the population served by the distribution system. SeeTechnical Methodology 2: Service Area Population (2010 UWMP Guidebook, Section M).2 Provide the source of the population data provided.
Figure 15 – TABLE 2 Current and Projected Population
Describe . . . other demographic factors affecting the supplier's water management planning (10631(a)).
The U.S. Census Bureau estimated he median household income in California at
$56,134 in 2009, and $46,816 in the year 2000. In comparison, median household
income in Imperial County was $31,870 in the year 2000, with a per capita income of
$13,239. Imperial County as a whole, and the City of Imperial in particular, are each
designated as a disadvantaged community (68% of median household income in
2000); 2010 US Census data were not available when this UWMP was being
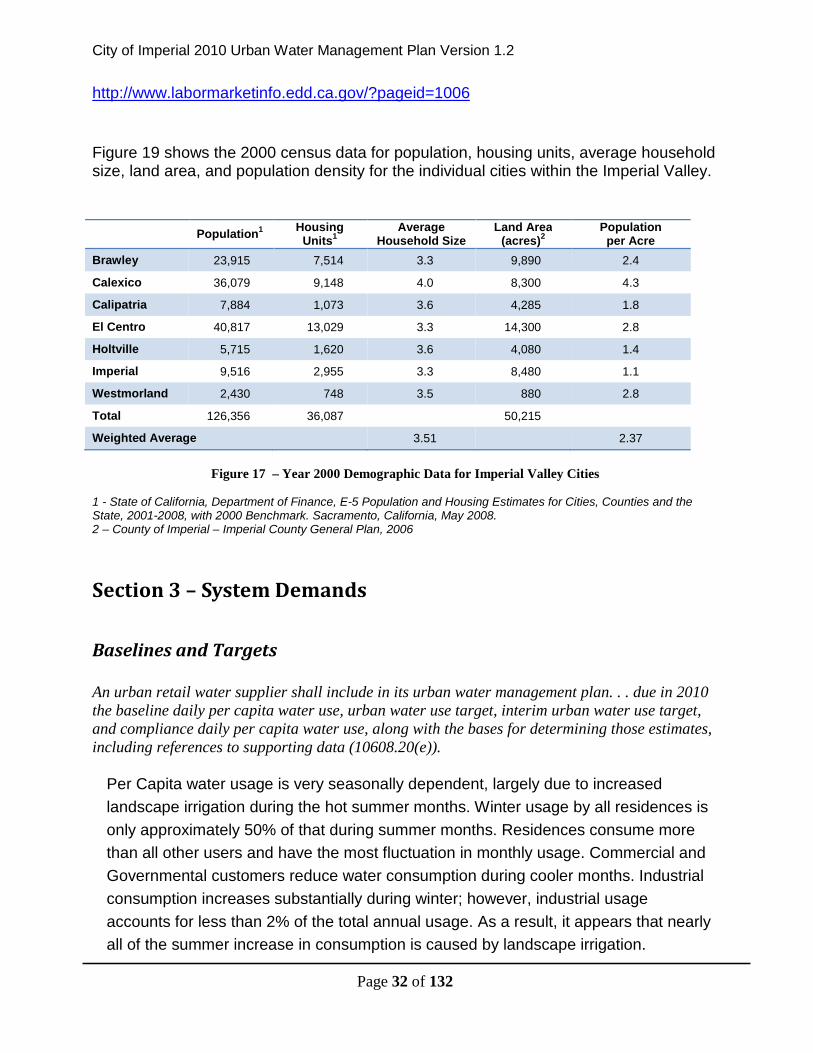
Figure 19 shows the 2000 census data for population, housing units, average householdsize, land area, and population density for the individual cities within the Imperial Valley.
Figure 17 – Year 2000 Demographic Data for Imperial Valley Cities
1 - State of California, Department of Finance, E-5 Population and Housing Estimates for Cities, Counties and theState, 2001-2008, with 2000 Benchmark. Sacramento, California, May 2008.2 – County of Imperial – Imperial County General Plan, 2006
Section 3 – System Demands
Baselines and Targets
An urban retail water supplier shall include in its urban water management plan. . . due in 2010the baseline daily per capita water use, urban water use target, interim urban water use target,and compliance daily per capita water use, along with the bases for determining those estimates,including references to supporting data (10608.20(e)).
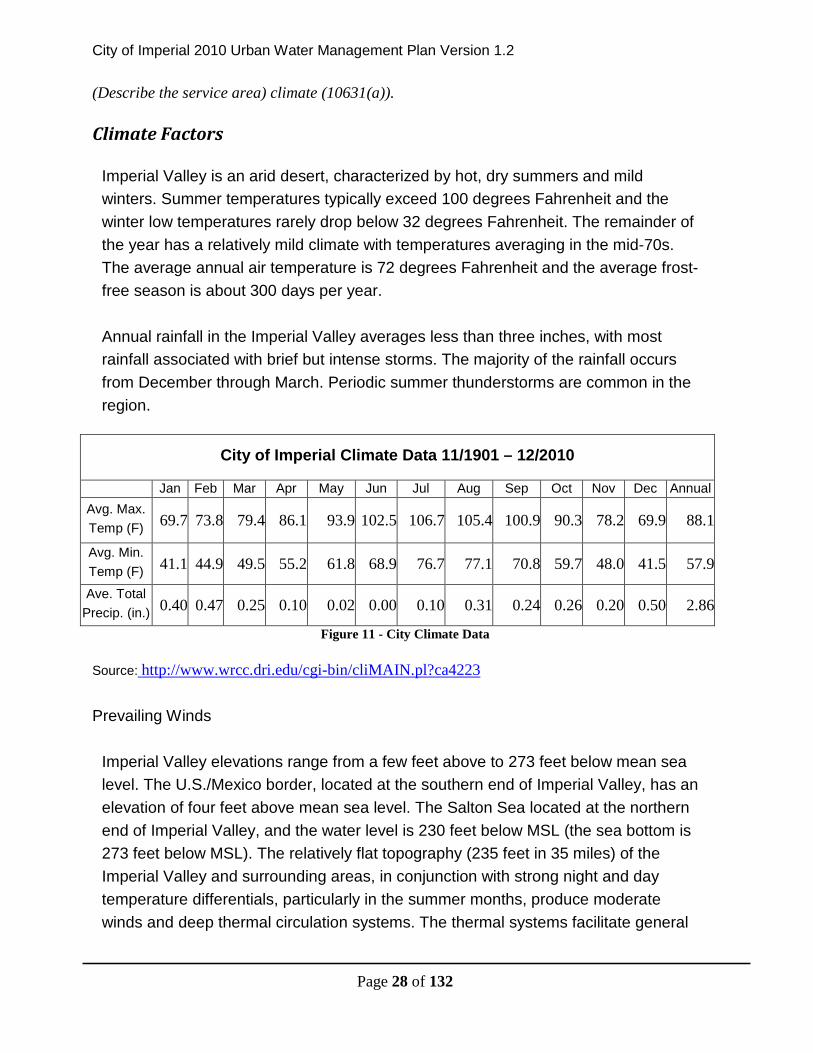
Per Capita water usage is very seasonally dependent, largely due to increased
landscape irrigation during the hot summer months. Winter usage by all residences is
only approximately 50% of that during summer months. Residences consume more
than all other users and have the most fluctuation in monthly usage. Commercial and
Governmental customers reduce water consumption during cooler months. Industrial
consumption increases substantially during winter; however, industrial usage
accounts for less than 2% of the total annual usage. As a result, it appears that nearly
all of the summer increase in consumption is caused by landscape irrigation.
Population1 Housing
Units1
AverageHousehold Size
Land Area(acres)
2Population
per Acre
Brawley 23,915 7,514 3.3 9,890 2.4
Calexico 36,079 9,148 4.0 8,300 4.3
Calipatria 7,884 1,073 3.6 4,285 1.8
El Centro 40,817 13,029 3.3 14,300 2.8
Holtville 5,715 1,620 3.6 4,080 1.4
Imperial 9,516 2,955 3.3 8,480 1.1
Westmorland 2,430 748 3.5 880 2.8
Total 126,356 36,087 50,215
Weighted Average 3.51 2.37
City of Imperial 2010 Urban Water Management Plan Version 1.2
Page 33 of 132
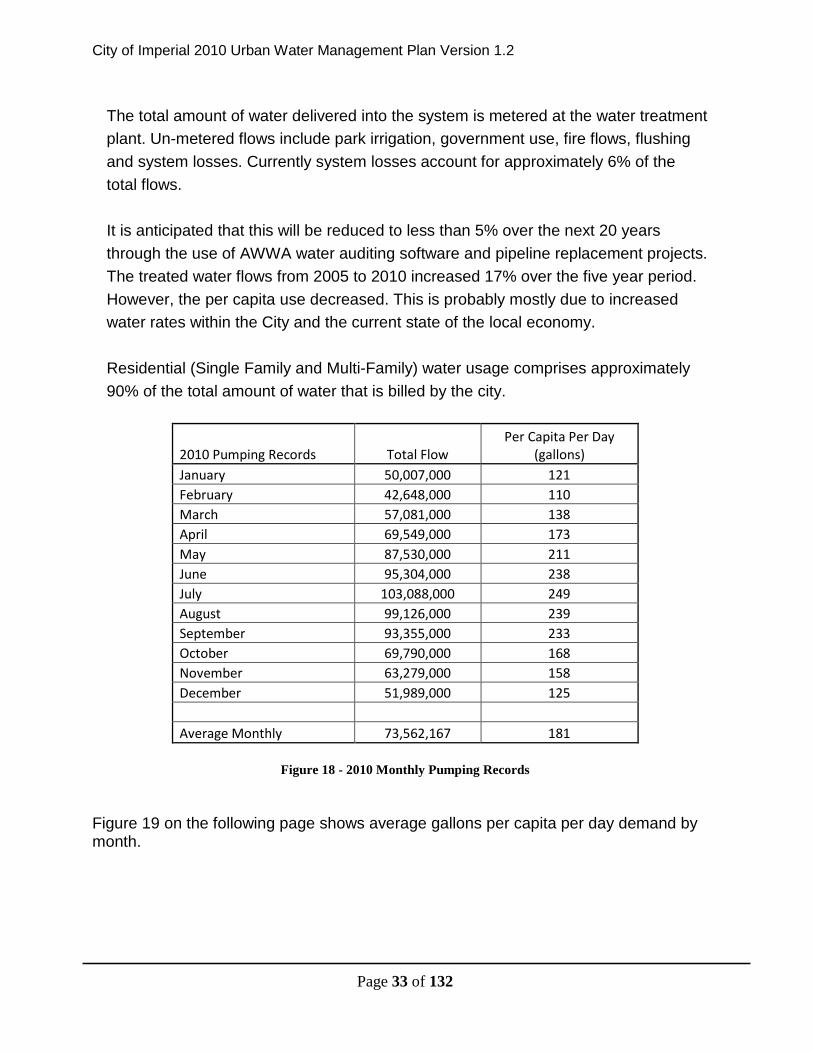
The total amount of water delivered into the system is metered at the water treatment
plant. Un-metered flows include park irrigation, government use, fire flows, flushing
and system losses. Currently system losses account for approximately 6% of the
total flows.
It is anticipated that this will be reduced to less than 5% over the next 20 years
through the use of AWWA water auditing software and pipeline replacement projects.
The treated water flows from 2005 to 2010 increased 17% over the five year period.
However, the per capita use decreased. This is probably mostly due to increased
water rates within the City and the current state of the local economy.
Residential (Single Family and Multi-Family) water usage comprises approximately
90% of the total amount of water that is billed by the city.
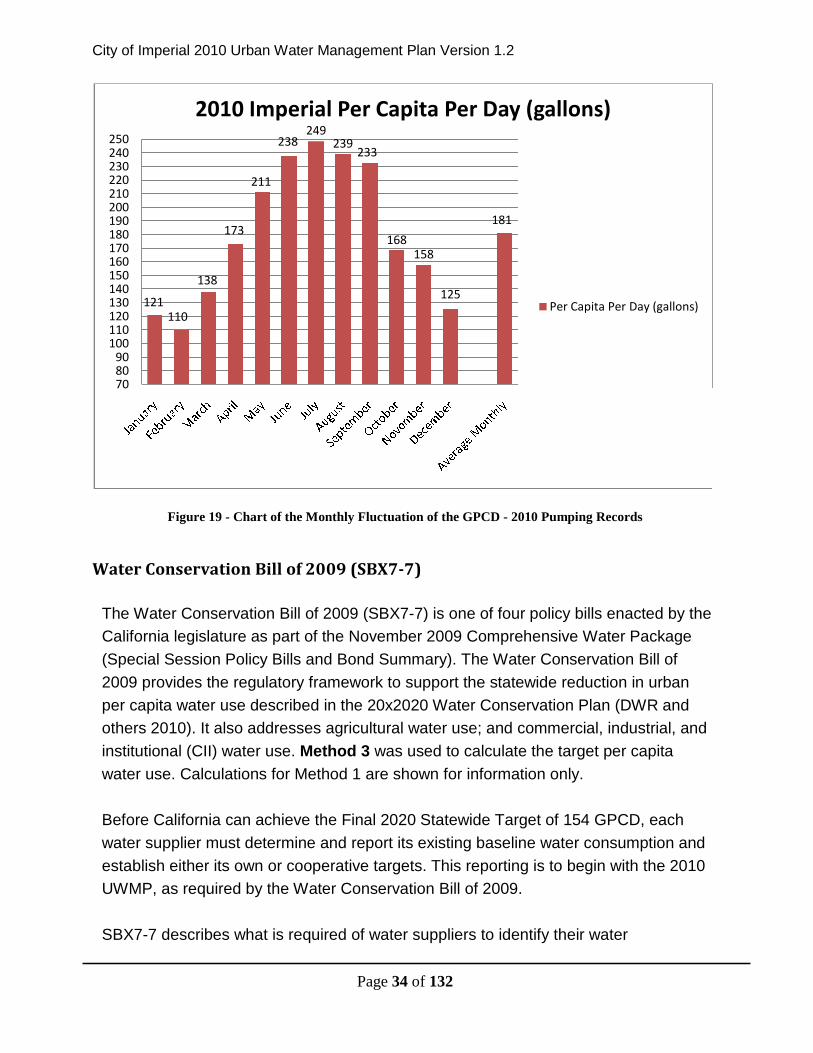
2010 Pumping Records Total FlowPer Capita Per Day
(gallons)
January 50,007,000 121
February 42,648,000 110
March 57,081,000 138
April 69,549,000 173
May 87,530,000 211
June 95,304,000 238
July 103,088,000 249
August 99,126,000 239
September 93,355,000 233
October 69,790,000 168
November 63,279,000 158
December 51,989,000 125
Average Monthly 73,562,167 181
Figure 18 - 2010 Monthly Pumping Records
Figure 19 on the following page shows average gallons per capita per day demand bymonth.
City of Imperial 2010 Urban Water Management Plan Version 1.2
Page 34 of 132
Figure 19 - Chart of the Monthly Fluctuation of the GPCD - 2010 Pumping Records
Water Conservation Bill of 2009 (SBX7-7)
The Water Conservation Bill of 2009 (SBX7-7) is one of four policy bills enacted by the
California legislature as part of the November 2009 Comprehensive Water Package
(Special Session Policy Bills and Bond Summary). The Water Conservation Bill of
2009 provides the regulatory framework to support the statewide reduction in urban
per capita water use described in the 20x2020 Water Conservation Plan (DWR and
others 2010). It also addresses agricultural water use; and commercial, industrial, and
institutional (CII) water use. Method 3 was used to calculate the target per capita
water use. Calculations for Method 1 are shown for information only.
Before California can achieve the Final 2020 Statewide Target of 154 GPCD, each
water supplier must determine and report its existing baseline water consumption and
establish either its own or cooperative targets. This reporting is to begin with the 2010
UWMP, as required by the Water Conservation Bill of 2009.
SBX7-7 describes what is required of water suppliers to identify their water
121110
138
173
211
238249
239233
168158
125
181
708090
100110120130140150160170180190200210220230240250
2010 Imperial Per Capita Per Day (gallons)
Per Capita Per Day (gallons)
City of Imperial 2010 Urban Water Management Plan Version 1.2
Page 35 of 132
conservation targets and track their progress toward achieving those targets. It also
requires that water suppliers document and report targets and progress in UWMPs
(CWC §10608.20(e)).
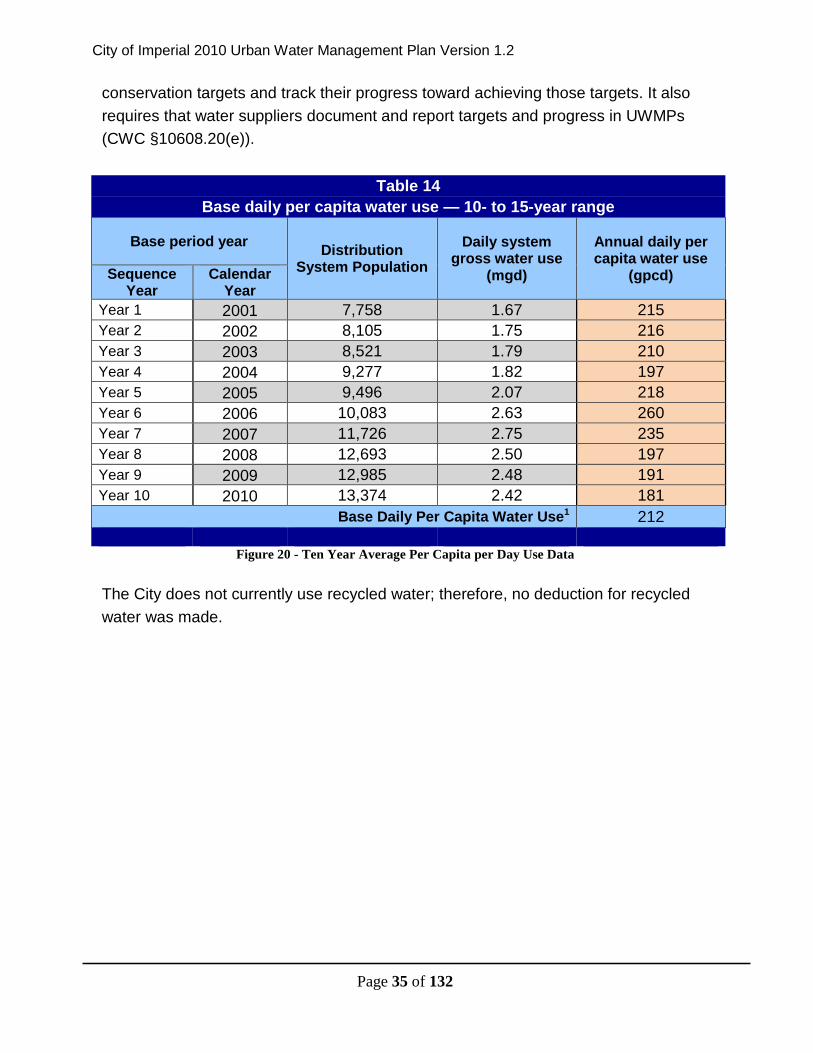
Table 14
Base daily per capita water use — 10- to 15-year range
Base period yearDistribution
System Population
Daily systemgross water use
(mgd)
Annual daily percapita water use
(gpcd)SequenceYear
CalendarYear
Year 1 2001 7,758 1.67 215
Year 2 2002 8,105 1.75 216
Year 3 2003 8,521 1.79 210
Year 4 2004 9,277 1.82 197
Year 5 2005 9,496 2.07 218
Year 6 2006 10,083 2.63 260
Year 7 2007 11,726 2.75 235
Year 8 2008 12,693 2.50 197
Year 9 2009 12,985 2.48 191
Year 10 2010 13,374 2.42 181
Base Daily Per Capita Water Use1 212
Figure 20 - Ten Year Average Per Capita per Day Use Data
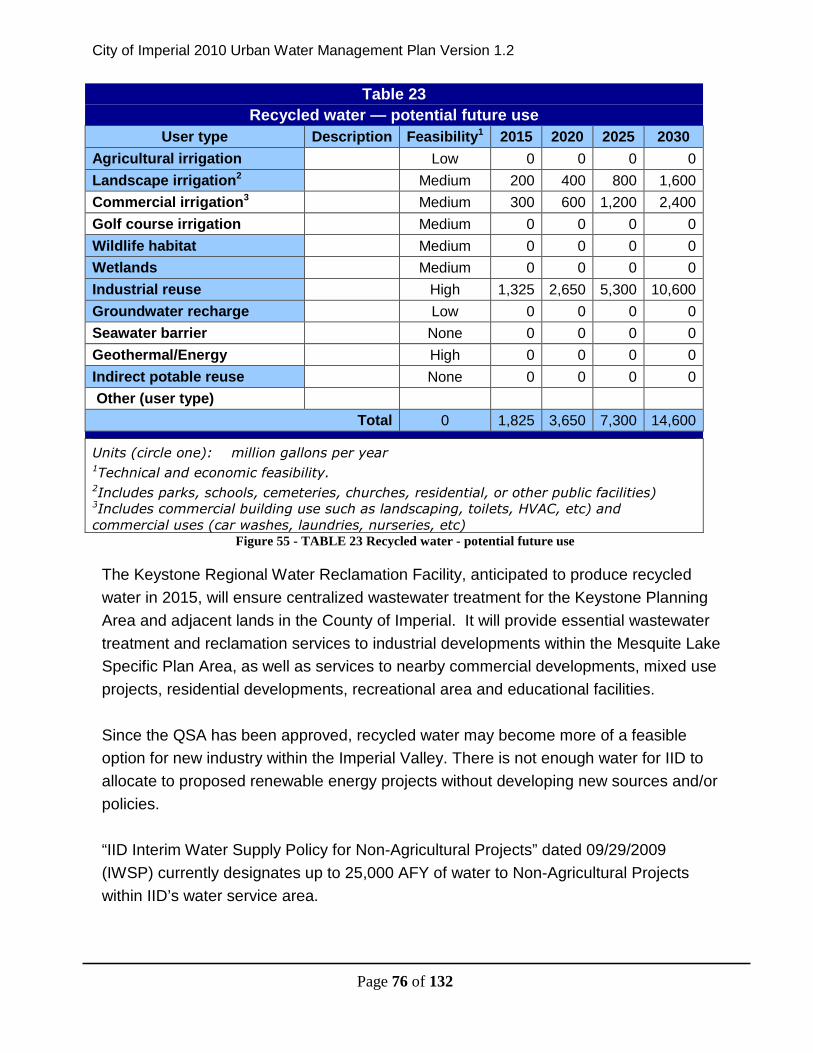
The City does not currently use recycled water; therefore, no deduction for recycled
water was made.
City of Imperial 2010 Urban Water Management Plan Version 1.2
Page 36 of 132
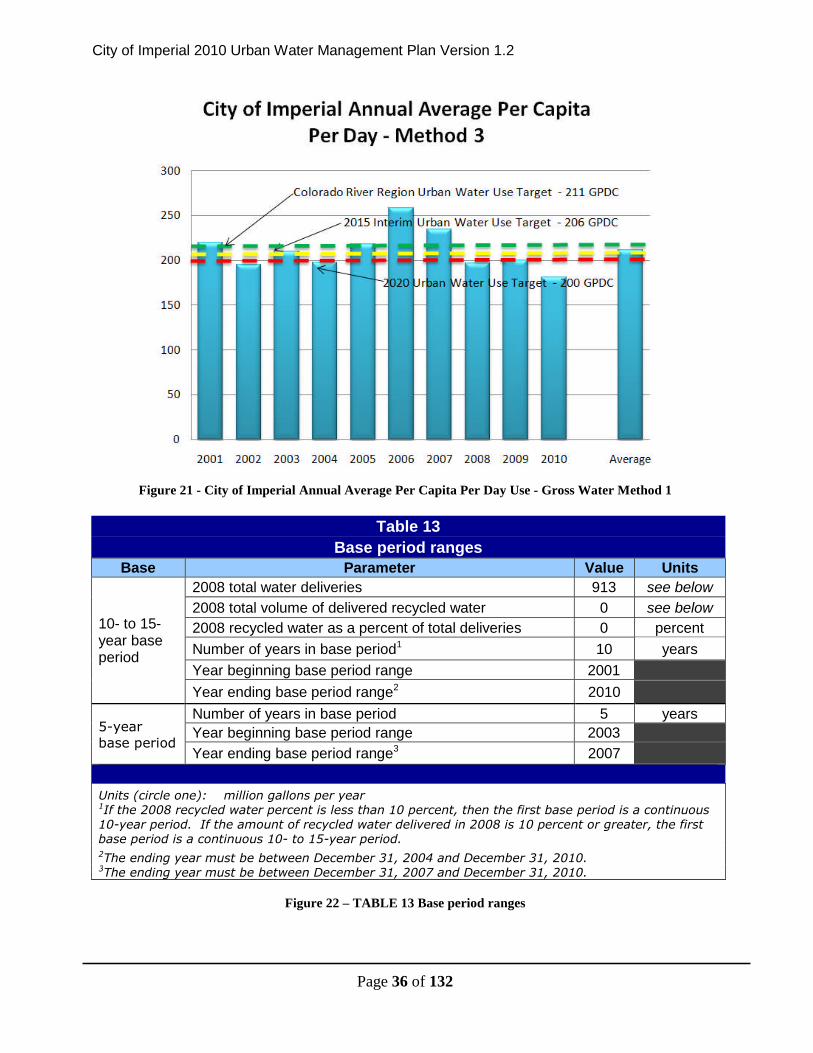
Figure 21 - City of Imperial Annual Average Per Capita Per Day Use - Gross Water Method 1
Table 13
Base period rangesBase Parameter Value Units
10- to 15-year baseperiod
2008 total water deliveries 913 see below
2008 total volume of delivered recycled water 0 see below
2008 recycled water as a percent of total deliveries 0 percent
Number of years in base period1 10 years
Year beginning base period range 2001
Year ending base period range2 2010
5-yearbase period
Number of years in base period 5 years
Year beginning base period range 2003
Year ending base period range3 2007
Units (circle one): million gallons per year1If the 2008 recycled water percent is less than 10 percent, then the first base period is a continuous10-year period. If the amount of recycled water delivered in 2008 is 10 percent or greater, the firstbase period is a continuous 10- to 15-year period.2The ending year must be between December 31, 2004 and December 31, 2010.3The ending year must be between December 31, 2007 and December 31, 2010.
Figure 22 – TABLE 13 Base period ranges
City of Imperial 2010 Urban Water Management Plan Version 1.2
Page 37 of 132
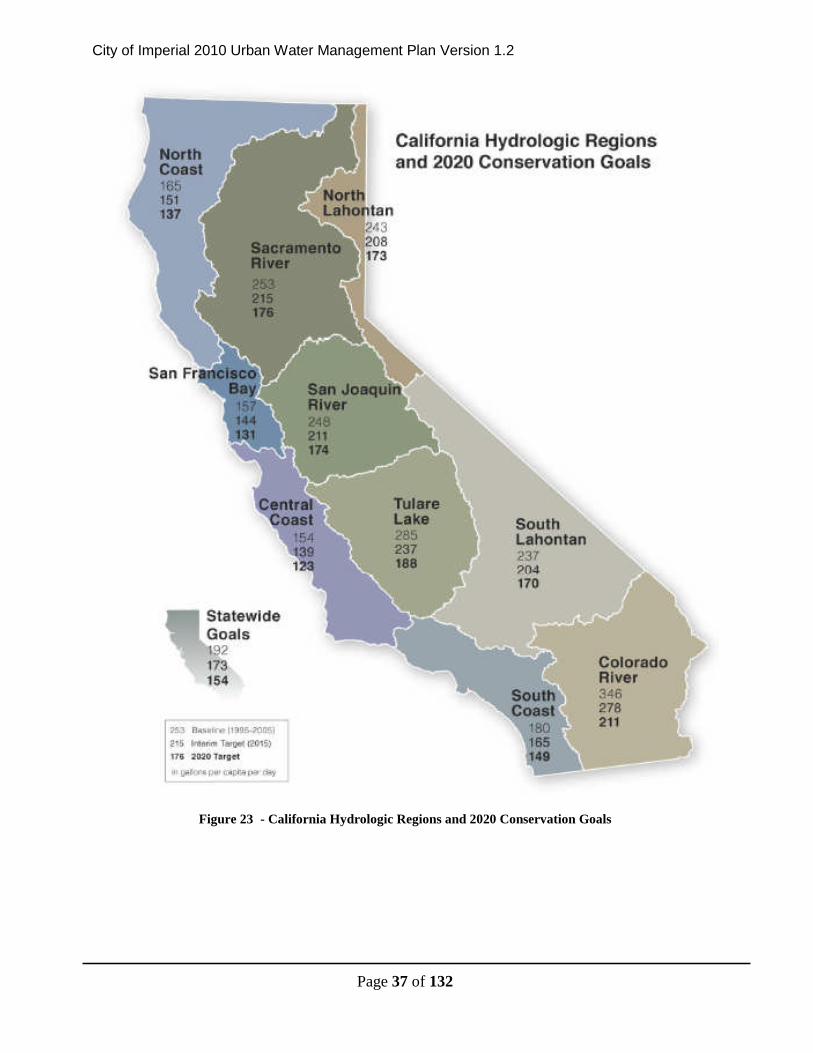
Figure 23 - California Hydrologic Regions and 2020 Conservation Goals
City of Imperial 2010 Urban Water Management Plan Version 1.2
Page 38 of 132
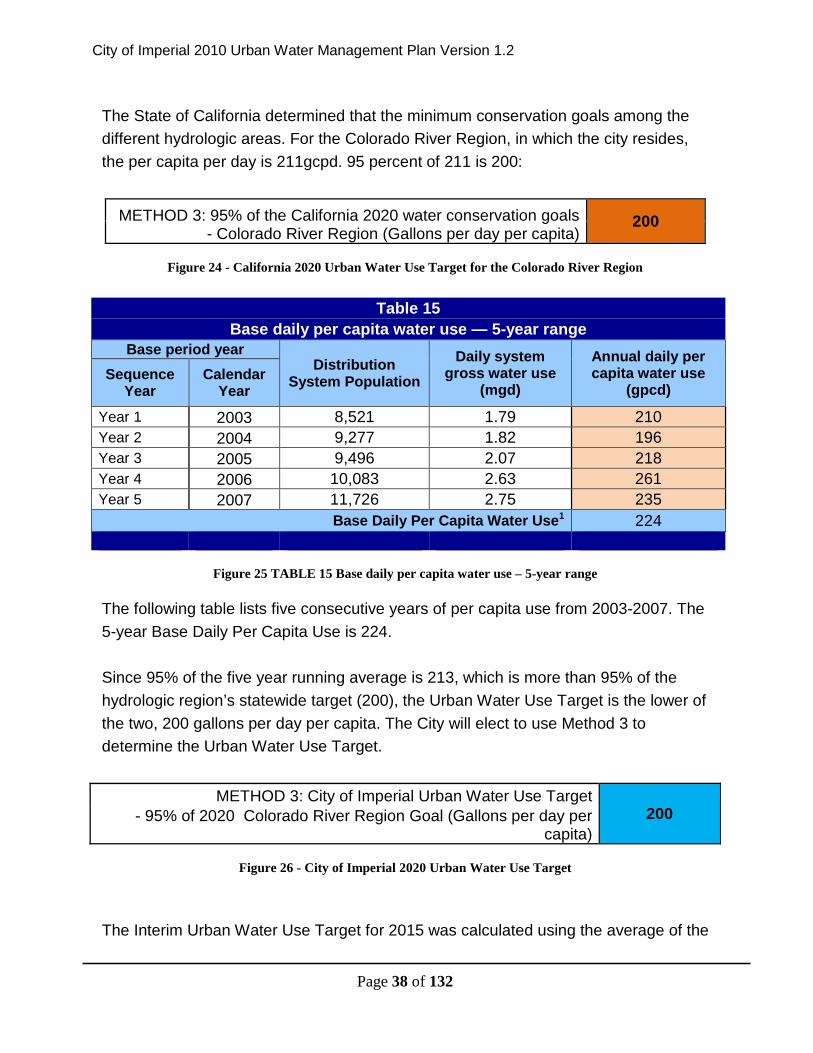
The State of California determined that the minimum conservation goals among the
different hydrologic areas. For the Colorado River Region, in which the city resides,
the per capita per day is 211gcpd. 95 percent of 211 is 200:
METHOD 3: 95% of the California 2020 water conservation goals- Colorado River Region (Gallons per day per capita)
200
Figure 24 - California 2020 Urban Water Use Target for the Colorado River Region
Table 15
Base daily per capita water use — 5-year rangeBase period year
DistributionSystem Population
Daily systemgross water use
(mgd)
Annual daily percapita water use
(gpcd)Sequence
YearCalendar
Year
Year 1 2003 8,521 1.79 210
Year 2 2004 9,277 1.82 196
Year 3 2005 9,496 2.07 218
Year 4 2006 10,083 2.63 261
Year 5 2007 11,726 2.75 235
Base Daily Per Capita Water Use1 224
Figure 25 TABLE 15 Base daily per capita water use – 5-year range
The following table lists five consecutive years of per capita use from 2003-2007. The
5-year Base Daily Per Capita Use is 224.
Since 95% of the five year running average is 213, which is more than 95% of the
hydrologic region’s statewide target (200), the Urban Water Use Target is the lower of
the two, 200 gallons per day per capita. The City will elect to use Method 3 to
determine the Urban Water Use Target.
METHOD 3: City of Imperial Urban Water Use Target200- 95% of 2020 Colorado River Region Goal (Gallons per day per
capita)
Figure 26 - City of Imperial 2020 Urban Water Use Target
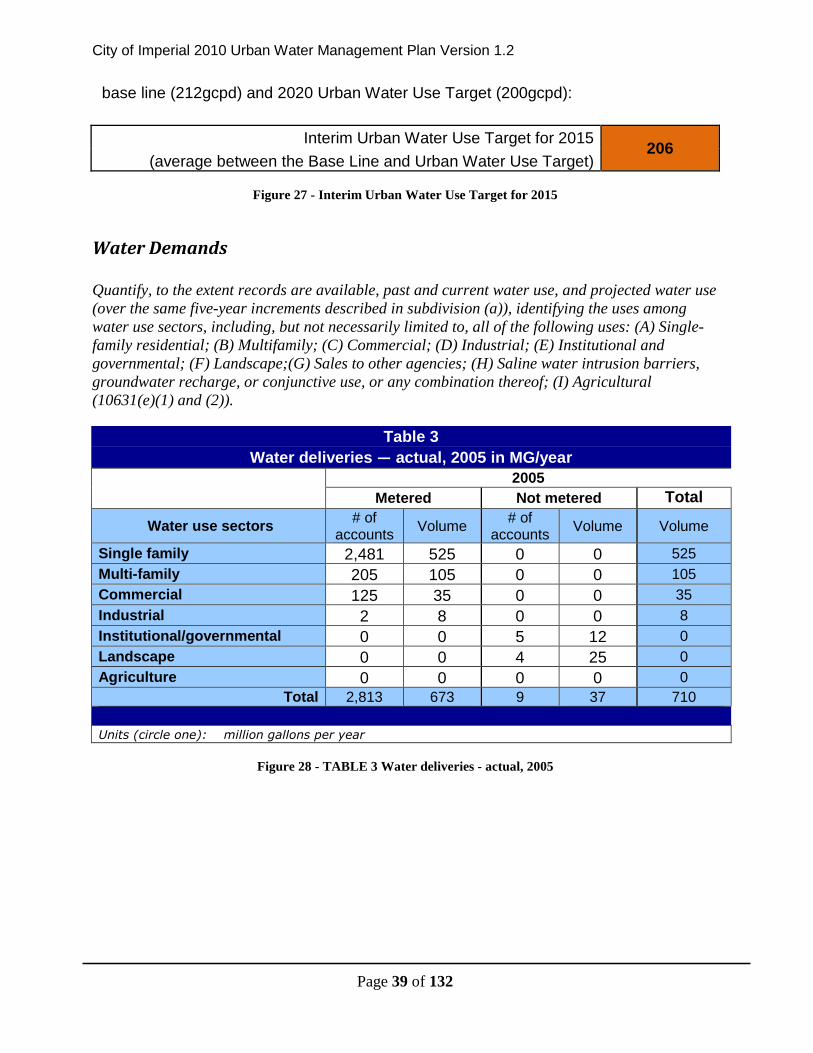
The Interim Urban Water Use Target for 2015 was calculated using the average of the
City of Imperial 2010 Urban Water Management Plan Version 1.2
Page 39 of 132
base line (212gcpd) and 2020 Urban Water Use Target (200gcpd):
Interim Urban Water Use Target for 2015206
(average between the Base Line and Urban Water Use Target)
Figure 27 - Interim Urban Water Use Target for 2015
Water Demands
Quantify, to the extent records are available, past and current water use, and projected water use(over the same five-year increments described in subdivision (a)), identifying the uses amongwater use sectors, including, but not necessarily limited to, all of the following uses: (A) Single-family residential; (B) Multifamily; (C) Commercial; (D) Industrial; (E) Institutional andgovernmental; (F) Landscape;(G) Sales to other agencies; (H) Saline water intrusion barriers,groundwater recharge, or conjunctive use, or any combination thereof; (I) Agricultural(10631(e)(1) and (2)).
Table 3
Water deliveries — actual, 2005 in MG/year2005
Metered Not metered Total
Water use sectors# of
accountsVolume
# ofaccounts
Volume Volume
Single family 2,481 525 0 0 525
Multi-family 205 105 0 0 105
Commercial 125 35 0 0 35
Industrial 2 8 0 0 8
Institutional/governmental 0 0 5 12 0
Landscape 0 0 4 25 0
Agriculture 0 0 0 0 0
Total 2,813 673 9 37 710
Units (circle one): million gallons per year
Figure 28 - TABLE 3 Water deliveries - actual, 2005
City of Imperial 2010 Urban Water Management Plan Version 1.2
Page 40 of 132
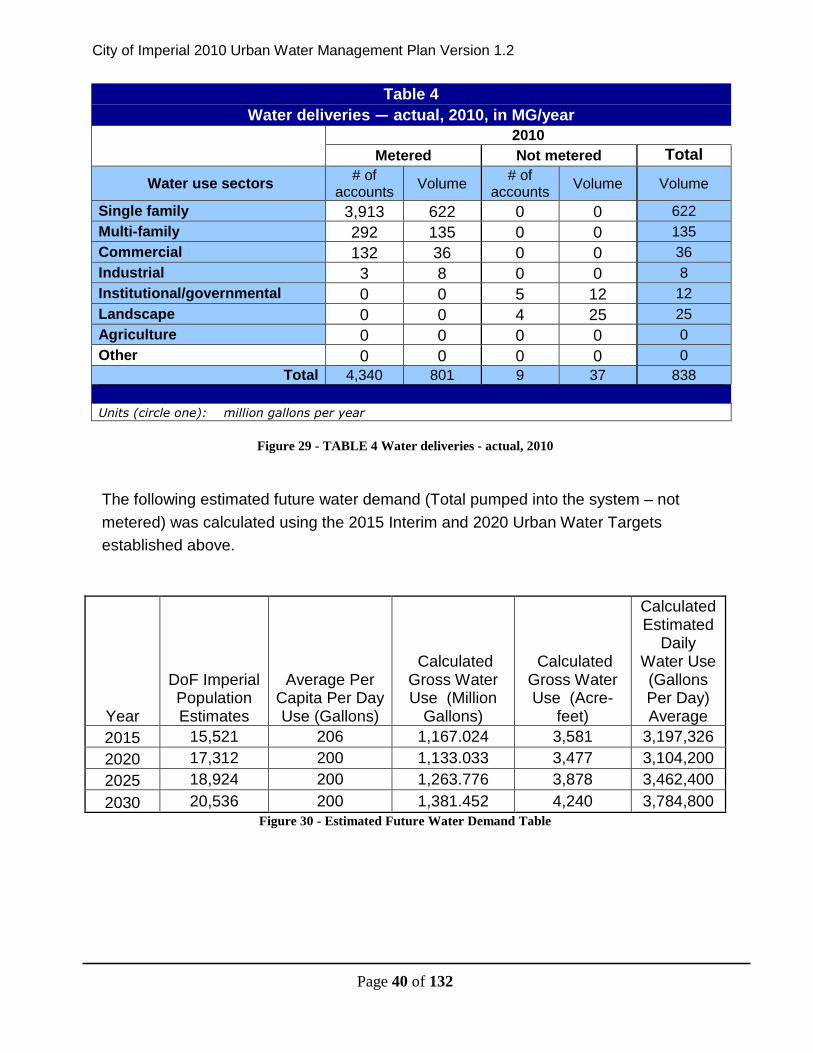
Table 4
Water deliveries — actual, 2010, in MG/year2010
Metered Not metered Total
Water use sectors# of
accountsVolume
# ofaccounts
Volume Volume
Single family 3,913 622 0 0 622
Multi-family 292 135 0 0 135
Commercial 132 36 0 0 36
Industrial 3 8 0 0 8
Institutional/governmental 0 0 5 12 12
Landscape 0 0 4 25 25
Agriculture 0 0 0 0 0
Other 0 0 0 0 0
Total 4,340 801 9 37 838
Units (circle one): million gallons per year
Figure 29 - TABLE 4 Water deliveries - actual, 2010
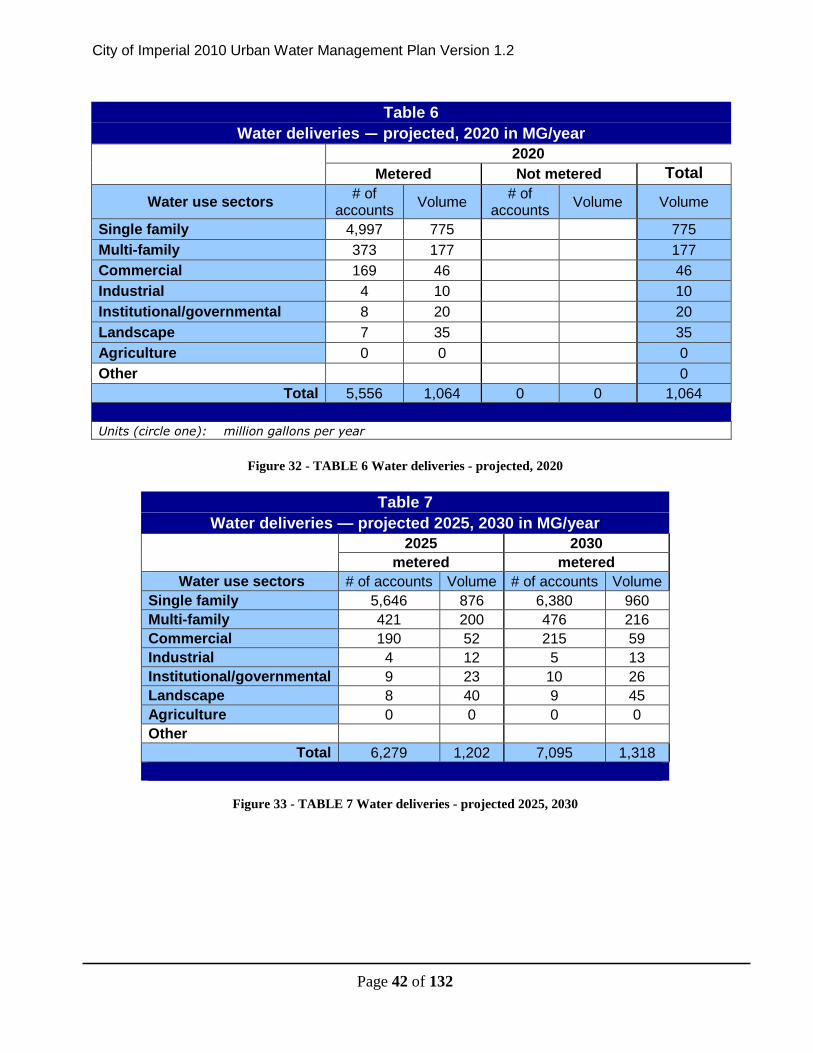
The following estimated future water demand (Total pumped into the system – not
metered) was calculated using the 2015 Interim and 2020 Urban Water Targets
City of Imperial 2010 Urban Water Management Plan Version 1.2
Page 43 of 132
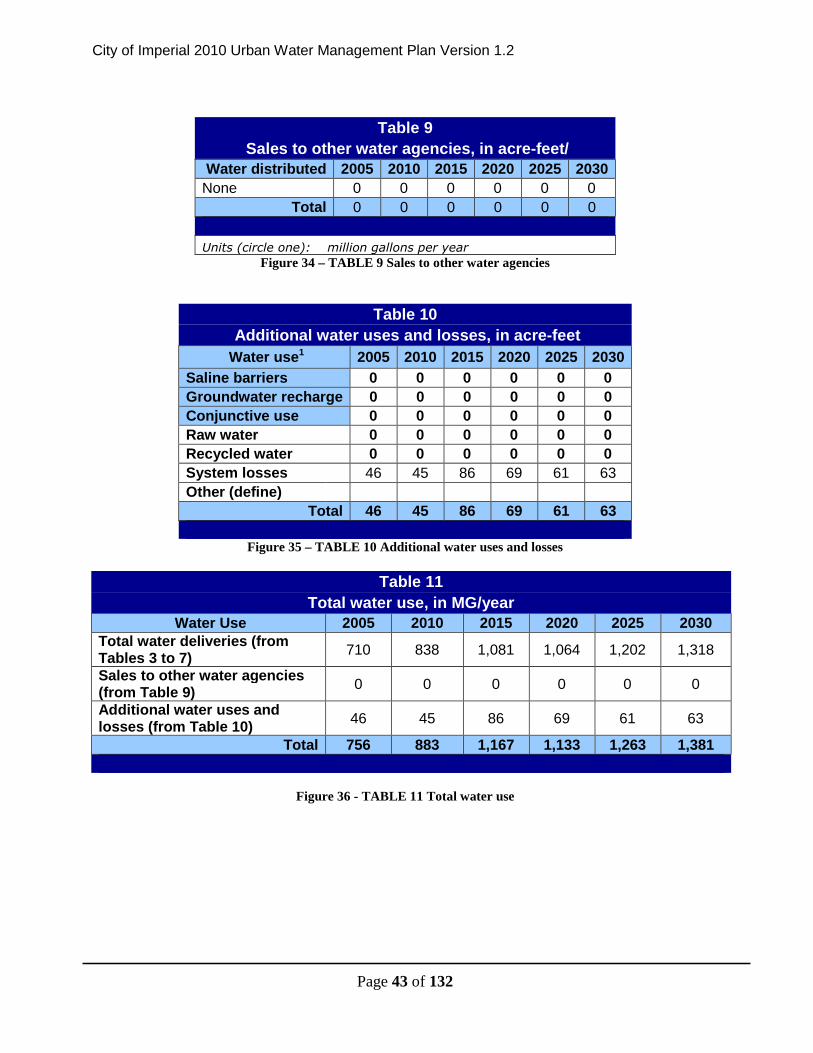
Table 9
Sales to other water agencies, in acre-feet/Water distributed 2005 2010 2015 2020 2025 2030
None 0 0 0 0 0 0
Total 0 0 0 0 0 0
Units (circle one): million gallons per year
Figure 34 – TABLE 9 Sales to other water agencies
Table 10
Additional water uses and losses, in acre-feet
Water use1 2005 2010 2015 2020 2025 2030
Saline barriers 0 0 0 0 0 0
Groundwater recharge 0 0 0 0 0 0
Conjunctive use 0 0 0 0 0 0
Raw water 0 0 0 0 0 0
Recycled water 0 0 0 0 0 0
System losses 46 45 86 69 61 63
Other (define)
Total 46 45 86 69 61 63
Figure 35 – TABLE 10 Additional water uses and losses
Table 11
Total water use, in MG/yearWater Use 2005 2010 2015 2020 2025 2030
Total water deliveries (fromTables 3 to 7)
710 838 1,081 1,064 1,202 1,318
Sales to other water agencies(from Table 9)
0 0 0 0 0 0
Additional water uses andlosses (from Table 10)
46 45 86 69 61 63
Total 756 883 1,167 1,133 1,263 1,381
Figure 36 - TABLE 11 Total water use
City of Imperial 2010 Urban Water Management Plan Version 1.2
Page 44 of 132
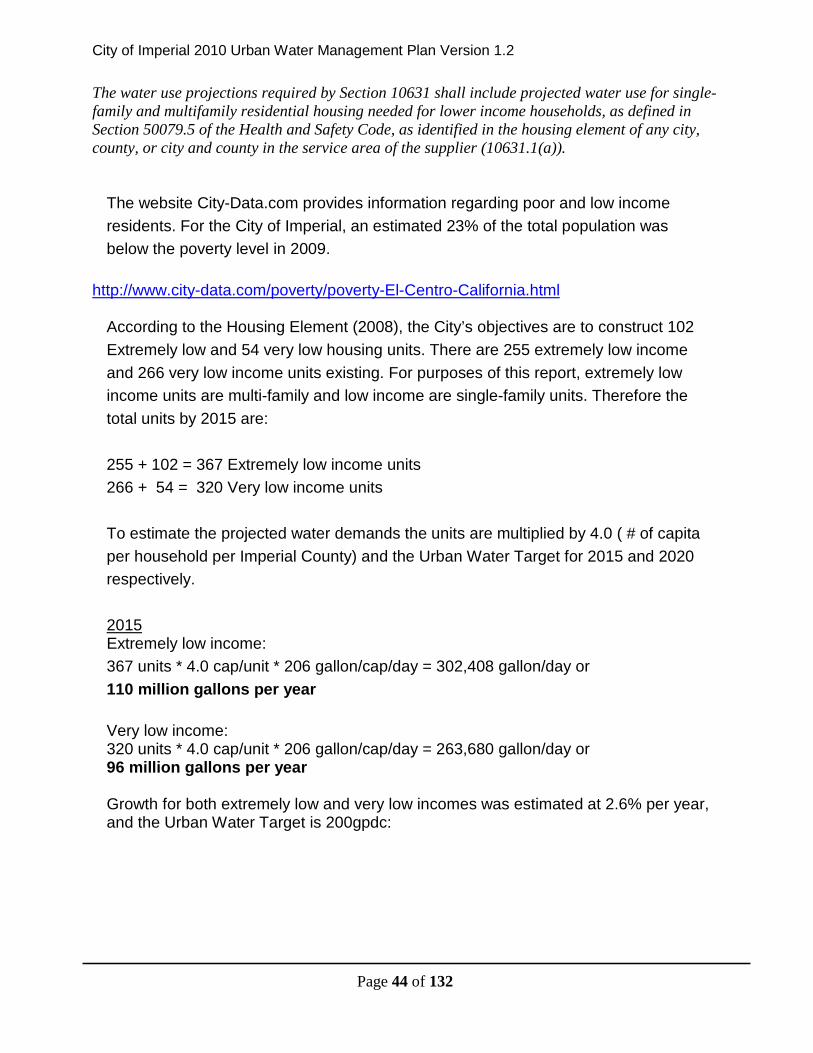
The water use projections required by Section 10631 shall include projected water use for single-family and multifamily residential housing needed for lower income households, as defined inSection 50079.5 of the Health and Safety Code, as identified in the housing element of any city,county, or city and county in the service area of the supplier (10631.1(a)).
The website City-Data.com provides information regarding poor and low income
residents. For the City of Imperial, an estimated 23% of the total population was
According to the Housing Element (2008), the City’s objectives are to construct 102
Extremely low and 54 very low housing units. There are 255 extremely low income
and 266 very low income units existing. For purposes of this report, extremely low
income units are multi-family and low income are single-family units. Therefore the
total units by 2015 are:
255 + 102 = 367 Extremely low income units
266 + 54 = 320 Very low income units
To estimate the projected water demands the units are multiplied by 4.0 ( # of capita
per household per Imperial County) and the Urban Water Target for 2015 and 2020
respectively.
2015Extremely low income:
367 units * 4.0 cap/unit * 206 gallon/cap/day = 302,408 gallon/day or
110 million gallons per year
Very low income:320 units * 4.0 cap/unit * 206 gallon/cap/day = 263,680 gallon/day or96 million gallons per year
Growth for both extremely low and very low incomes was estimated at 2.6% per year,and the Urban Water Target is 200gpdc:
City of Imperial 2010 Urban Water Management Plan Version 1.2
Page 45 of 132
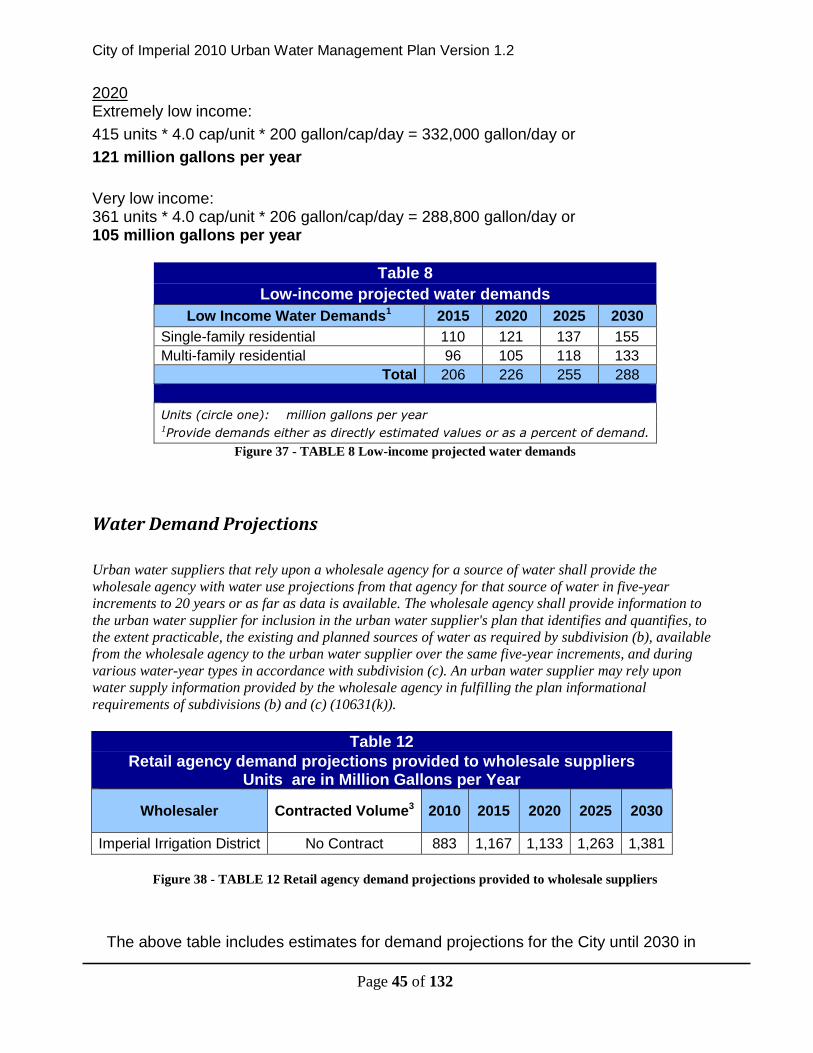
2020Extremely low income:
415 units * 4.0 cap/unit * 200 gallon/cap/day = 332,000 gallon/day or
121 million gallons per year
Very low income:361 units * 4.0 cap/unit * 206 gallon/cap/day = 288,800 gallon/day or105 million gallons per year
Table 8
Low-income projected water demands
Low Income Water Demands1 2015 2020 2025 2030
Single-family residential 110 121 137 155
Multi-family residential 96 105 118 133
Total 206 226 255 288
Units (circle one): million gallons per year1Provide demands either as directly estimated values or as a percent of demand.
Figure 37 - TABLE 8 Low-income projected water demands
Water Demand Projections
Urban water suppliers that rely upon a wholesale agency for a source of water shall provide thewholesale agency with water use projections from that agency for that source of water in five-yearincrements to 20 years or as far as data is available. The wholesale agency shall provide information tothe urban water supplier for inclusion in the urban water supplier's plan that identifies and quantifies, tothe extent practicable, the existing and planned sources of water as required by subdivision (b), availablefrom the wholesale agency to the urban water supplier over the same five-year increments, and duringvarious water-year types in accordance with subdivision (c). An urban water supplier may rely uponwater supply information provided by the wholesale agency in fulfilling the plan informationalrequirements of subdivisions (b) and (c) (10631(k)).
Table 12Retail agency demand projections provided to wholesale suppliers
The above table includes estimates for demand projections for the City until 2030 in
City of Imperial 2010 Urban Water Management Plan Version 1.2
Page 46 of 132
Million Gallons per year. The estimates are based on the projected population growth
and the calculated per capita water demand (Urban Water Use Targets). These
demands are provided to the IID for planning purposes.
The City does not have a contract with the Imperial Irrigation District (IID) that limits
the amount of water available to the City.
Water Use Reduction Plan
Urban wholesale water suppliers shall include in the urban water management plans . . . anassessment of their present and proposed future measures, programs, and policies to helpachieve the water use reductions required by this part (10608.36). Urban retail water suppliersare to prepare a plan for implementing the Water Conservation Bill of 2009 requirements andconduct a public meeting which includes consideration of economic impacts (CWC §10608.26).
The City has enacted the Model Water Efficient Landscape Ordinance for the
requirements found in state legislation under Assembly Bill 1881 that apply to
commercial, industrial and tenant occupied residential property that require
landscaping greater than 2,500 square feet and homeowner landscaping greater
than 5,000 square feet. While for the most part water conservation guidelines only
apply to large landscaping projects, the City encourages its application to smaller
scale projects in order to conserve water.
The following policies are part of the City’s General Plan, in the Conservation
Element:
Water Conservation
Objective 4: All new construction and development should conserve water through
minimizing water usage and waste.
1. All residential construction shall be required to install low-volume toilets,
showers, and faucets.
2. New development projects should install water-conserving appliances (washing
machines, dishwashers).
City of Imperial 2010 Urban Water Management Plan Version 1.2
Page 47 of 132
3. The usage of primarily drought-tolerant native plants shall be required through
review and approval of landscaping plans by City staff.
4. Use of Xeriscape landscaping techniques for homes and businesses should be
strongly encouraged.
5. Residential projects having common green areas and all commercial,
manufacturing, and public projects shall be required to install automatic irrigation
systems.
6. The usage of drip irrigation shall be required were feasible.
7. Alternate water conservation systems such as grey water usage in residences
shall be examined and initiated, if feasible.
8. New residential construction should be preplumbed for reclaimed water through
a dual on-site distribution system. Anticipated non-potable uses include
landscaping, lawn maintenance and crop irrigation. All reclaimed water systems
shall be in compliance with the State of California Regional Water Quality
Control Board guidelines and basin objectives as well as CEQA and NEPA
guidelines.
9. Enforce an ordinance which prohibits over watering of lawns and other
landscaping by prohibiting excessive runoff into streets and other public right-of-
ways.
10.Support regional and state efforts to protect water availability for the Imperial
Valley Area.
11.Encourage efficient management of irrigation water delivery and promote
tailwater recovery programs on farm lands and ranches.
City of Imperial 2010 Urban Water Management Plan Version 1.2
Page 48 of 132
The City also disseminates through its website a free flyer entitled “Outdoor and
Indoor Water Conservation Checklist” that describes in detail methods residents
can use to reduce water usage.
The assessment of the current and proposed measures to help achieve the
water use reduction requirements are analyzed and discussed in the Demand
Management Measures Section.
Section 4 - System Supplies
Water Sources
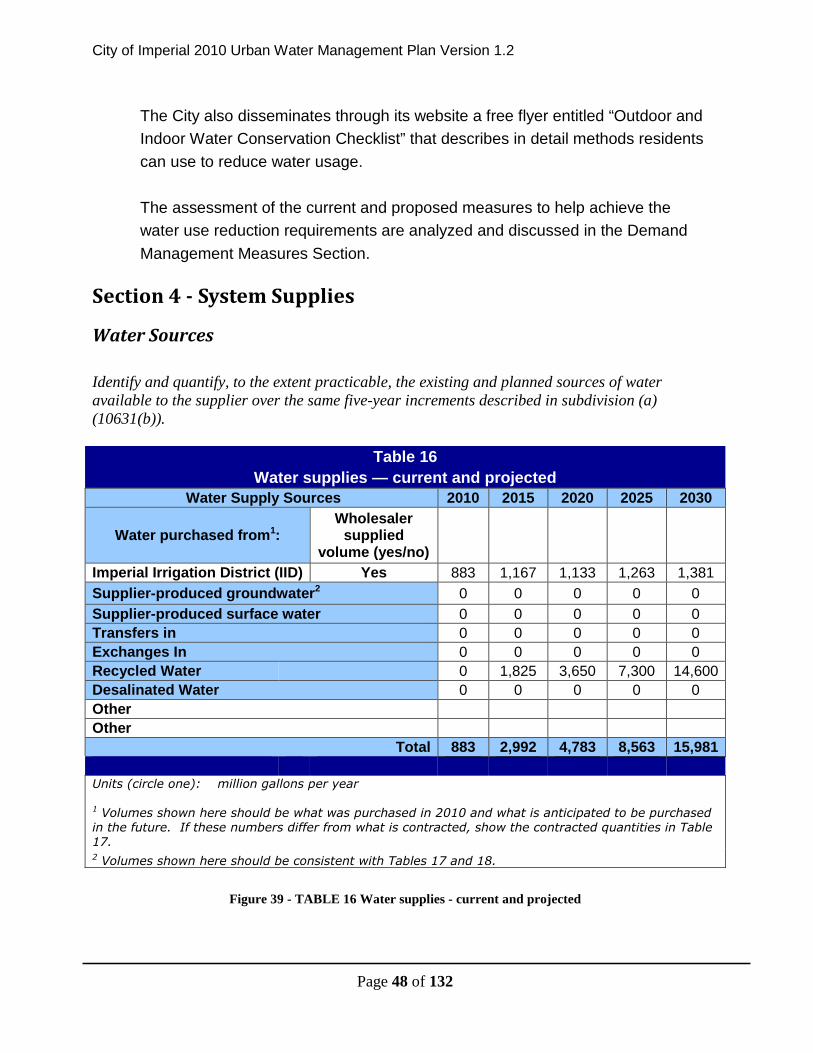
Identify and quantify, to the extent practicable, the existing and planned sources of wateravailable to the supplier over the same five-year increments described in subdivision (a)(10631(b)).
Table 16
Water supplies — current and projectedWater Supply Sources 2010 2015 2020 2025 2030
Water purchased from1:Wholesaler
suppliedvolume (yes/no)
Imperial Irrigation District (IID) Yes 883 1,167 1,133 1,263 1,381
Supplier-produced groundwater2 0 0 0 0 0
Supplier-produced surface water 0 0 0 0 0
Transfers in 0 0 0 0 0
Exchanges In 0 0 0 0 0
Recycled Water 0 1,825 3,650 7,300 14,600
Desalinated Water 0 0 0 0 0
Other
Other
Total 883 2,992 4,783 8,563 15,981
Units (circle one): million gallons per year
1 Volumes shown here should be what was purchased in 2010 and what is anticipated to be purchasedin the future. If these numbers differ from what is contracted, show the contracted quantities in Table17.2 Volumes shown here should be consistent with Tables 17 and 18.
Figure 39 - TABLE 16 Water supplies - current and projected
City of Imperial 2010 Urban Water Management Plan Version 1.2
Page 49 of 132
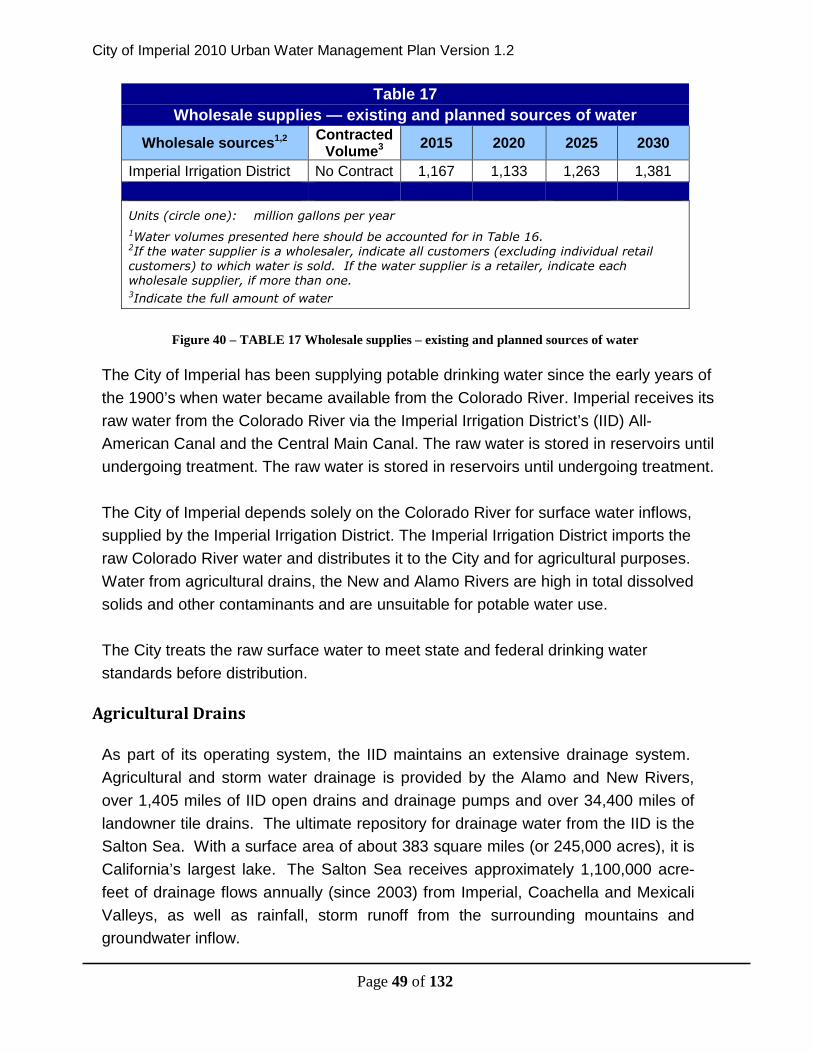
Table 17
Wholesale supplies — existing and planned sources of water
Imperial Irrigation District No Contract 1,167 1,133 1,263 1,381
Units (circle one): million gallons per year
1Water volumes presented here should be accounted for in Table 16.2If the water supplier is a wholesaler, indicate all customers (excluding individual retailcustomers) to which water is sold. If the water supplier is a retailer, indicate eachwholesale supplier, if more than one.3Indicate the full amount of water
Figure 40 – TABLE 17 Wholesale supplies – existing and planned sources of water
The City of Imperial has been supplying potable drinking water since the early years of
the 1900’s when water became available from the Colorado River. Imperial receives its
raw water from the Colorado River via the Imperial Irrigation District’s (IID) All-
American Canal and the Central Main Canal. The raw water is stored in reservoirs until
undergoing treatment. The raw water is stored in reservoirs until undergoing treatment.
The City of Imperial depends solely on the Colorado River for surface water inflows,
supplied by the Imperial Irrigation District. The Imperial Irrigation District imports the
raw Colorado River water and distributes it to the City and for agricultural purposes.
Water from agricultural drains, the New and Alamo Rivers are high in total dissolved
solids and other contaminants and are unsuitable for potable water use.
The City treats the raw surface water to meet state and federal drinking water
standards before distribution.
Agricultural Drains
As part of its operating system, the IID maintains an extensive drainage system.
Agricultural and storm water drainage is provided by the Alamo and New Rivers,
over 1,405 miles of IID open drains and drainage pumps and over 34,400 miles of
landowner tile drains. The ultimate repository for drainage water from the IID is the
Salton Sea. With a surface area of about 383 square miles (or 245,000 acres), it is
California’s largest lake. The Salton Sea receives approximately 1,100,000 acre-
feet of drainage flows annually (since 2003) from Imperial, Coachella and Mexicali
Valleys, as well as rainfall, storm runoff from the surrounding mountains and
groundwater inflow.
City of Imperial 2010 Urban Water Management Plan Version 1.2
Page 50 of 132
There are three general categories which describe the surface water in Imperial
Valley. These are freshwater, brackish water, and saline water. The freshwater
(with TDS generally less than 1,000 ppm) include the All-American Canal and other
canals and laterals which deliver irrigation water to the agricultural fields within the
County. The brackish waters (with TDS in the range of 2,000 to 4,000 ppm) include
the Alamo River, New River and the agricultural drains that flow into these rivers or
directly into the Salton Sea.
The Salton Sea represents the saline water category. Salinity concentrations have
been rising and are currently higher than ocean water (the Salton Sea's current TDS
was approximately 53,000ppm in 2010 vs. an average of 34,000ppm for ocean
water). The Salton Sea evaporates between eight and nine feet per year. The surface
waters in Imperial Valley thus pass through a salinity gradient from the Colorado River
to the Salton Sea.
This regional salinity gradient exists because of the high evaporation of the Imperial
Valley, high temperatures, low annual rainfall, and continual leaching of salts from
irrigated areas due to the high salinity of the Colorado River Water (approximately
750ppm). Evapotranspiration is water transported and evaporated from plants and
surrounding soil surfaces. Although water is continually evaporated from the major
canals, this evaporation represents a relatively minor increase in dissolved solids
concentration because of the short residence times within the water conveyance
system.
Normal evapotranspiration rates from the irrigated fields from efficient irrigation
practices substantially reduce the amount of water and increase the concentration of
salt entering the drainage system. For these reasons and due to salinity within the
soils, a 300% to 500% increase in total dissolved solids concentration is normal within
the Imperial Unit as water is efficiently applied to agricultural lands from the All-
American Canal and is conveyed to the IID drains, the New River and the Alamo
River, and eventually to the Salton Sea.
The increase in salinity is extremely important because it affects the aquatic
ecosystems. However, salinity is not the only water quality issue. The intensive
irrigation in the valley presents the potential for the introduction of agricultural
chemicals, such as pesticides and herbicides, into downstream waters. Field erosion
and dredging activities also result in siltation in the New and Alamo Rivers and the
City of Imperial 2010 Urban Water Management Plan Version 1.2
Page 51 of 132
Salton Sea. The bacteriological quality of these waters is also a concern because
these streams receive locally generated municipal waste discharges, in addition to the
waste load entering the United States from Mexico.
New River
The New River originates in Mexico, and flows northward across the International
Boundary into Imperial Valley.. The flow continues through the Imperial Valley and
ultimately discharges into the Salton Sea. The primary purpose of the New River is to
convey agricultural drainage in the Imperial and Mexicali valleys to the Salton Sea. A
corollary use of the New River is to convey treated community and industrial
wastewaters. This corollary use is strictly controlled in the Imperial Valley by waste
discharge requirements prescribed and enforced by the California Regional Water
Quality Control Board. However, Mexico's corollary use of the New River is largely
ignored and uncontrolled.
Mexico discharges raw and inadequately treated sewage, toxic industrial wastes,
garbage and other solid wastes, animal wastes, and geothermal wastewaters out of
the Mexicali area of Mexico and into the Imperial Valley. This process has continued
for over forty years, resulting in the on-going pollution of the New River at the
International Boundary. As Mexico's industry and population continue to grow, these
problems have a high potential to increase if corrective measures are not taken.
Until August of 1983, the problem of Mexico polluting the New River had been the
responsibility of United States Section of the International Boundary and Water
Commission (IBWC), a joint United States/Mexico federal agency with responsibility
for dealing with border water and sanitation problems between the two nations.
Over a period of thirty years, the California Regional Water Quality Control Board
made several representations to the United States Commissioner on the IBWC to
obtain corrections to the problem. Since 1975, the California Regional Water Quality
Control Board has been monitoring water pollution of the New River to identify the
pollutants actually coming from Mexico. This information is presented to the United
States Commissioner to aid and encourage Mexico in implementing corrective
measures.
In August of 1980, Minute No. 264 to the Mexico-American Water Treaty was signed,
which specified time schedules for completing work that was to result in a full cleanup
City of Imperial 2010 Urban Water Management Plan Version 1.2
Page 52 of 132
of the river. In addition, minimum water quality standards were specified for New
River water quality at the International Boundary. Mexico has been in violation of
practically all of the specified schedules and standards since Minute No. 264 went
into effect in December of 1980. There is no evidence that Minute No. 264 has had
any influence on actions in Mexico to clean up the river.
In July of 1983, the California Regional Water Quality Control Board conducted an
investigation. The purpose of the investigation was to determine the type(s) and
extent of waste discharges into the New River and its tributaries from Mexico so that
possible corrective action could be considered and pursued. The investigation
identified problems that must be addressed to obtain adequate corrections. These
problems included:
1. City sewer lines which are not connected to the City's main sewer system
discharging raw sewage to the river;
2. Breakdowns in the sewer system resulting in the discharge of raw sewage
to the river;
3. Discharge of wastes to the river by septic tank pumpers;
4. Discharge of wastes to the river from adjacent unsewered residences;
5. Discharge of untreated industrial wastes to the river including highly toxic
chemicals wastes, many of which are on the Environmental Protection
Agency's list of 129 priority pollutants and some of which are carcinogens;
6. Inadequate treatment of sewage and industrial wastes by Mexicali, whose
sewage treatment plant consists of nothing more than raw sewage lagoons;
7. Location of the City's garbage dump such that refuse is disposed of directly
into the river water;
8. Discharges of untreated wastes from a slaughterhouse, dairy, and hog
farms;
9. Discharges from residential hog and cattle pens located adjacent to the
river and its tributaries; and
10. Discharge of geothermal wastes to the river.
In August of 1983, a United States/Mexican Agreement for protection and
improvement of the environment in the border area was signed by the Presidents of
Mexico and the United States. Under this agreement, responsibility for border
environmental problems, including the New River pollution problem, was transferred
from the International Boundary and Water Commission to the United States
Environmental Protection Agency for the United States, and to the Mexican
City of Imperial 2010 Urban Water Management Plan Version 1.2
Page 53 of 132
Secretarial de Desarollo Urbano y Ecologia (SDUE) for Mexico. Since this transfer of
responsibility, progress has been slow and it is questionable if the agreement has
served any useful purpose in controlling pollution in the New River.
In April of 1987, Minute No. 274 to the Mexican-American Water Treaty was approved
by the United States and Mexico. The minute provided for a $1.2 million United
States/Mexico jointly funded project to construct certain works in Mexico to reduce
pollution in the New River. Although this project is just a step towards resolving the
pollution problems of the New River, it sets a precedent for the involvement of the
United States in the implementation of corrective actions within Mexicali.
According to the International Boundary and Water Commission of the United States,
additional projects are needed to help reduce water pollution from Mexico. Mexico
and the United States are currently negotiating measures to solve the problem. Upon
agreement between both governments, a new Minute will be approved and added to
the Mexican-American Treaty to supersede Minute No. 274. The main goal of the new
Minute would be to establish a long-term solution to the water pollution problem.
The Alamo River is also polluted with contaminants. A small amount of groundwater
seepage from agricultural fields crosses into Imperial Valley from Mexico to the Alamo
River and has low pollutant concentrations.
The main pollutants in the water are pesticides which get drained into the Alamo River
during irrigation. However, the potential for polluting the Alamo River could increase
not only from the pesticides contained in the water but from potential development at
or near the Alamo River at the International Boundary, such as the new border
crossing that has been constructed near the Alamo River as it crosses into the United
States.
This new border crossing could create an urban sprawl effect in this area of Imperial
Valley, which would increase drainage into the Alamo River. The Alamo River
currently has a small concrete culvert that passes underneath the All-American Canal
which drains seepage water coming from Mexico. Additional flows could impact the
river and present a financial burden to Imperial Valley and lead to environmental
health problems.
An option proposed by the California Regional Water Quality Control Board has been
to shunt the Alamo River into a drainage system which would eventually drain into the
City of Imperial 2010 Urban Water Management Plan Version 1.2
Page 54 of 132
New River before it crosses into the United States. In order for this to happen, both
governments must agree. Presently, nothing has been settled but further negotiations
are currently being reviewed between the United States and Mexico, in hopes to
minimize potential problems that could result from the development of the new border
crossing.
Surface Water from the Colorado River
Water is supplied to the City from the All-American Canal through the Central Main
Canal. The supply point for the water plant is the South Date Canal and the Dahlia
Lateral Number 1. Both of these canals flow north from the Central Main Canal. The
South Date Canal runs immediately east of the treatment facility and has capacity to
deliver 22.6 million gallons per day (MGD) of untreated water to the plant.
The Dahlia Lateral Number 1, located west of the plant, is capable of supplying the
plant with an additional 9.0 mgd. The Dahlia Lateral has been used as a water source
more during the last few years. This is because it has fewer services drawing water
from it than the South Date Canal. It maintains a steadier flow and is a more reliable
source. The capacity of water delivery from the Dahlia Lateral is limited due to the size
of gate 18A and the back pressure of the Lateral. The total amount of raw water that
can currently be supplied to the City is 31.6 mgd (35,755 acre-feet per year).
Rainfall average is less than three inches per year and does not contribute to
Imperial Irrigation District's water supply, although at times it may reduce
agricultural water demand.
As the City grows and develops on existing agricultural land, theoretically there will
be more supply of water available. Agriculture requires more raw water per acre
than developed land.
Municipal water is not a large portion of the total water delivered by the IID. It
represents only approximately three percent (3%) of the total water delivered. The
total municipal use has not significantly changed since 2006. Figure 42 shows the
total water delivered. Since the portion of water used by the municipalities is low
compared to the overall use, it is not anticipated that there will be any shortage of
raw water from the IID. The city’s main constraint of raw water availability is in the
raw water inlet piping capacity. As was mentioned earlier, the total amount of raw
water that can currently be supplied by the IID to the City is 31.6 MGD (35,755
City of Imperial 2010 Urban Water Management Plan Version 1.2
Page 55 of 132
acre-feet per year) which is more than enough capacity for the foreseeable future.
Year
IID NetConsumptiveUse Amount
(Total ImperialValley) (AF)
Total MunicipalUse(AF)
Total Other Non-Agricultural Use
(AF)Total Agricultural
Use (AF)
2010 2,363,800 50,819 54,749 2,258,232
2015 2,236,300 55,877 66,382 2,114,041
2020 2,316,300 61,397 78,015 2,176,888
2025 2,284,300 67,335 85,558 2,131,407
2030 2,279,300 71,233 93,101 2,114,966
Figure 41- IID Consumptive Use Amount vs. Total Municipal Use
Figure 42 – Colorado River Annual Flows (MAF) 1906-2002
Colorado River Reliability
City of Imperial 2010 Urban Water Management Plan Version 1.2
Page 56 of 132
Under the Law of the River, IID has significant historical legal protections in place to
maintain its 3.1 MAF Priority 3a water right to consumptive use of Colorado River
water even during lower Colorado River flow periods.
Historical Data on the Colorado River Water Supply
The Colorado River flow at Lees Ferry has been gauged since 1921. By removing
reservoir and diversion effects, the USBR has created a “natural flow” record for this
site. The long-term (1906- 2004) average natural flow is estimated to be about 15.1
MAF based on the gage record. The annual natural flow records are shown in Figure
2. A few important points should be noted from the natural flow record:
(1) The period 1906-1930 and prior was the available gauge record when many of
the Colorado River compacts were drafted. This period had a 10-year running
average flow of about 17.0 MAF, which is higher than almost any other period
in the gage record.
(2) The 10-year running average from 1934 to 1984 was almost always less than
15 MAF, meaning that the 1922 Compact apportioning 7.5 MAF to the Upper
and Lower Basins could not have been fully satisfied for most of this 50-year
period.
(3) Allocations from the Colorado River total 16.5 MAF, divided as 7.5 MAF each
to the Upper and Lower Basins, and 1.5 MAF to Mexico. The long-term
average natural flows from the gauge record are less than these total
allocations.
Imperial Irrigation District Water Use
The Imperial Irrigation District provides wholesale water service. Demand for water in
the Imperial Unit service area is divided into three basic categories: agricultural,
municipal, and industrial. Presently the Imperial Irrigation District delivered
approximately 97% of its annual flows to agricultural water users, 2% to
municipalities, and 1% percent for industrial purposes.
The Imperial Irrigation District's consumptive use values include the total use of raw
water in the Imperial Unit. These consumptive use values include agriculture, small
acreage, service laterals, municipalities, industrial, losses and unaccounted raw
water. There is no available data that completely distinguishes between these uses of
City of Imperial 2010 Urban Water Management Plan Version 1.2
Page 57 of 132
raw water.
Water distribution systems “lose” water during distribution for several reasons.
Specific water distribution “losses” depend on the type of distribution system. A piped
water distribution system can lose water due to pipe failures or leaks. Open channels,
ponds, reservoirs, and water basins can “lose” water from seepage through the soil,
surface evaporation into the air, and plant consumptive use.
An open channel, gravity flow water distribution system has operational spill.
Operational spills are excess flows discharged from a channel into a drain or other
sump (Salton Sea). Operational spills can result from: carriage water that is required
to fill and empty the reaches of sloping channels; increases in water user flexibility for
water ordering and delivery scheduling; and terminating water deliveries during
rainfall events, storm runoff, and flood flows.
The Imperial Irrigation District has an open channel gravity flow water distribution
system. Its water distribution system losses result from three major conditions:
seepage, operational spills, and evaporation. The Imperial Irrigation District's water
distribution system losses have been reduced through the years by numerous water
conservation and demand management programs and projects. The demand
management programs and projects are described in detail in the Imperial Irrigation
District Demand Management Section of this plan.
Agricultural Water Use in the Imperial Valley
Over 120 types of crops are grown in the Imperial Valley. Most relevant to the Water
Element is an examination of the various crop types, the acreage dedicated to each
and the demand for irrigation water generated by each crop per acre of cultivation.
Water demand is provided below on a net consumption basis and is based upon
historical acreage and water use data. Major water consuming crops include alfalfa
(5.20 ac.ft./acre), asparagus (4.12 ac.ft./acre), cotton (3.45 ac.ft./acre), and tomatoes
(2.23 ac.ft/acre). More efficient crops include carrots (1.21 ac.ft./acre), squash (1.58
ac.ft./acre), and barley (1.64 ac.ft./acre). Since the 2000’s 500,000 acres are in
cultivation over the year including double cropping. Crops grown on this acreage
consume approximately 1,500,000 acre-feet per year. Figure 46 shows the historical
average of individual crop acreage and water use in Imperial Valley over a ten year
period.
City of Imperial 2010 Urban Water Management Plan Version 1.2
Page 58 of 132
Approximately ninety-seven percent of the water imported into Imperial Valley from
the Imperial Irrigation District is used for agricultural purposes. Imperial Irrigation
District supplies more than 2,500,000 acre-feet of water annually for primarily
agricultural purposes to its customers in Imperial Valley, to just over 500,000 acres of
irrigated farmland (double cropped).
Crop Area (Acres) Water Use (af)
Garden Crops 1985
Broccoli 7,000 11,480
Carrots 12,000 14,540
Lettuce 35,000 47,017
Cantaloupes 15,000 33,213
Watermelons 5,000 10,929
Other Melons 4,000 8,903
Onions 10,000 17,725
Squash 1,000 1,578
Tomatoes 3,000 6,695
Vegetables (misc.) 5,000 8,083
Field Crops
Alfalfa 185,000 961,692
Barley 1,000 1,650
Bermuda Grass 15,000 52,125
Cotton 40,000 137,900
Rye Grass 4,000 9,500
Sorghum 3,000 7,330
Sudan Grass 20,000 47,500
Sugar Beets 35,000 122,208
Wheat 105,000 204,488
Miscellaneous 2,000 4,695
Permanent Crops
Asparagus 3,000 12,355
Citrus Fruits 2,000 7,163
City of Imperial 2010 Urban Water Management Plan Version 1.2
Page 59 of 132
Duck Ponds (feed) 8,000 24,000
Jojoba 3,000 10,745
Trees and Vines 1,000 3,582
Miscellaneous 1,000 3,982
Source: Water Requirements and Availability Study. Prepared by Parsons Water
Resources, Inc. for the IID. November 1985.
Figure 43 - IID Crop Acreage and Water Use in Imperial Valley (Historical Average)
Imperial Irrigation District Supply
Figure 44 - Non Agricultural Water Delivery by the IID (Acre-Feet) 2006-2009
Net Evaporation 24,518.4 24,092.3 24,147.0 24,038.1 24,199.0
Total 2,909,519.7 2,909,405.5 3,060,434.7 3,178,403.0 3,014,440.9Figure 47 - Total Estimated Water Flow by the IID
0.0
5,000.0
10,000.0
15,000.0
20,000.0
25,000.0
30,000.0
35,000.0
40,000.0
2006 2007 2008 2009 Average
Total Municipal Raw Water Demand(Imperial County Cities)
Municipal
City of Imperial 2010 Urban Water Management Plan Version 1.2
Page 61 of 132
Figure 48 - Graphical Representation of the Total Water Balance IID Water Use
Water Rights
IID has a longstanding right to import Colorado River water, and holds legal title to
all its water and water rights in trust for landowners and water users within the
District (California Water Code §§20529 and 22437; Bryant v. Yellen, 447 U.S. 352,
371 (1980), fn.23.). These date from as early as 1885, when a number of
individuals, as well as the California Development Company, made a series of
appropriations of Colorado River water pursuant to stipulations of California law for
use in the Imperial Valley.
The right to water from the Colorado River is governed by numerous compacts,
state and federal laws, court decisions and decrees, contracts, and regulatory
0.0
500,000.0
1,000,000.0
1,500,000.0
2,000,000.0
2,500,000.0
3,000,000.0
3,500,000.0
2006 2007 2008 2009 Average
Total Water Balance - IID (In Acre Feet)
Agricultural Non-Agricultural Salton Sea Mitigation Water
Seepage (Delivery) Seepage (AAC) Main Canal Spill
Lateral Spill Net Evaporation
City of Imperial 2010 Urban Water Management Plan Version 1.2
Page 62 of 132
guidelines collectively known as the "Law of the River." These documents apportion
the water and regulate the use and management of the Colorado River among the
seven basin states and Mexico. A brief review of those parts that impact the
Imperial Irrigation District follows:
Colorado River Compact (1921)
In 1921, representatives from the seven Colorado River basin states, with the
authorization of their legislatures and at the urging of the federal government,
began negotiations regarding the distribution of water from the Colorado River. In
November of 1922, the representatives from the upper basin states (Colorado, New
Mexico, Utah and Wyoming) and lower (Arizona, California, and Nevada) signed
the Colorado River Compact (Compact), an interstate agreement giving each basin
perpetual rights to annual apportionments of 7.5 million acre-feet (MAF) of Colorado
River water.
Boulder Canyon Project Act (1928)
The Compact was made effective by provisions in the 1928 Boulder Canyon Project
Act, which authorized construction of Hoover Dam and the All-American Canal, and
served as the United States' consent to accept the Compact. Officially enacted on
June 25, 1929, through a Presidential Proclamation, this act resulted in ratification
of the Compact by six of the basin states and required California to limit its annual
consumptive use to 4.4 MAF of the lower basin's apportionment plus not less than
half of any excess or surplus water unapportioned by the Compact. Arizona refused
to sign and subsequently filed a lawsuit. California abided by this federal mandate
through the implementation of its 1929 Limitation Act. The Boulder Canyon Project
Act further authorized the Secretary to "contract for the storage of water... and for
the delivery thereof for irrigation and domestic uses," and further defined the lower
basin's 7.5 MAF apportionment split, with an annual allocation of 0.3 MAF to
Nevada and 2.8 MAF to Arizona. While the three states never formally accepted or
agreed to these terms, a 1964 Supreme Court decision (Arizona v. California, 373
U.S. 546) declared their consent to be inconsequential since the Boulder Canyon
Project Act was authorized by the Secretary.
California Seven-Party Agreement (1931)
Following implementation of the Boulder Canyon Project Act, the Secretary
City of Imperial 2010 Urban Water Management Plan Version 1.2
Page 63 of 132
requested that California make recommendations regarding distribution of its
allocation of Colorado River water. In August 1931, under chairmanship of the State
Engineer, the California Seven-Party Agreement was developed and authorized by
the affected parties to prioritize California water rights. The Secretary accepted this
agreement and established these priorities through General Regulations issued in
September of 1931. The first four priority allocations account for California's annual
apportionment of 4.4 MAF, with agricultural entities using 3.85 MAF of that total.
The remaining priorities are defined for years in which the Secretary declares that
excess waters are available.
Arizona v. California US Supreme Court Decision (1964, 1979)
In 1963, the Supreme Court issued a decision settling a 25-year-old dispute
between Arizona and California, which stemmed from Arizona's desire to build the
Central Arizona Project to enable use of its full apportionment. California argued
that Arizona's use of water from the Gila River, a Colorado River tributary,
constituted use of its Colorado River apportionment, and that California had
developed a historical use of some of Arizona's apportionment, which, under the
doctrine of prior appropriation, precluded Arizona from developing the project.
The Supreme Court rejected California's arguments, enjoined the Secretary from
delivering water outside the framework of apportionments defined by the law, and
mandated the preparation of annual reports documenting the consumptive use of
water in the three lower basin states. In 1979, the Supreme Court issued a
Supplemental Decree which addressed Present Perfected Rights (PPRs) referred
to in the Colorado River Compact and in the Boulder Canyon Project Act. These
rights are entitlements essentially established under state law, and have priority
over later contract entitlements.
On March 27, 2006, the Supreme Court issued a Consolidated Decree to provide a
single reference to the provisions of the original 1964 decrees and several
subsequent decrees (1966, 1979, 1984, and 2000) that stemmed from the original
ruling. This decree also reflects the settlements of the federal reserved water rights
claim for the Fort Yuma Indian Reservation.
Colorado River Basin Project Act (1968)
Congress authorized construction of a number of water development projects in
City of Imperial 2010 Urban Water Management Plan Version 1.2
Page 64 of 132
both the upper and lower basins, including the Central Arizona Project (CAP) in
1968. The act made the priority of the CAP water supply subordinate to California's
apportionment in times of shortage, and directed the Secretary to prepare, in
consultation with the Colorado River Basin states, long-range operating criteria for
the Colorado River reservoir system.
Quantification Settlement Agreement (QSA) and Related Agreements
The Quantification Settlement Agreement (QSA) and Related Agreements that
became effective in October 2003 are a set of inter-related contracts that settle
certain disputes among the United States, the State of California, Imperial Irrigation
District (IID), Metropolitan Water District (MWD), Coachella Valley Water District
(CVWD) and the San Diego County Water Authority (SDCWA) that became
effective in October 2003. The agreements resolve, for a period of 35 to 75 years,
issues regarding the reasonable and beneficial use of Colorado River water; the
ability to conserve, transfer and acquire conserved Colorado River water; the
quantification of Priorities 3 and 6 within California for the use of Colorado River
water; and the obligation to implement and fund environmental impact mitigation
related to the above.
Conserved water transfer agreements between IID and SDCWA, IID and CVWD
and IID and MWD are all part of the QSA and Related Agreements. These
contracts identify the conserved water volumes and transfer schedules for IID along
with price and payment terms. As specified in the agreements, IID will transfer to
SDCWA up to 200,000 AFY, and to CVWD up to 103 AFY, and MWD 105,000 Acre
AFY of water conserved from delivery system improvements and on-farm efficiency
improvements, all in return for payments totaling billions of dollars. In addition, IID
will transfer up to 67,000 AFY of conserved water from the lining of the All-
American Canal to SDCWA and certain San Luis Rey Indian Tribes 16,500 AFY in
exchange for the payment of all lining project costs and a grant to IID of certain
rights to use the conserved water.
As a result of the QSA and Related Agreements, IID will be able to more efficiently
deliver Colorado River water to the Imperial Valley. Imperial Valley water users will
be able to more effectively irrigate their farms, thus preserving Imperial Valley water
rights and agricultural output, with costs and impacts compensated by the
payments to IID for the conserved water. IID will face minimum future risk from
challenges to the purpose or reasonableness of IID’s water use, and thus enable
the Imperial Valley to rely upon the large senior Colorado River water rights IID
City of Imperial 2010 Urban Water Management Plan Version 1.2
Page 65 of 132
possesses.
In short, the QSA and Related Agreements provide the methods and the means to
allow IID to elevate its Colorado River water use to efficient 21st Century standards
and ensure the continued availability.
In October 2003, all the water districts, the State and the Interior reached
agreement on the final terms of the QSA and related agreements. For closure
among State interests, three elements proved critical. First, the IID, SDCWA,
CVWD and MWD agreed to provide four sources of economic support for Salton
Sea restoration: (1) conditional new transfers between the IID/CDWR and
CDWR/MWD as described in the succeeding paragraph; (2) conditional
reassignment of mitigation water to CDWR for resale to MWD at a price of $250/AF
(in 2003 dollars) per acre-foot delivered to the Salton Sea, provided that the
reassignment is consistent with the restoration of the Salton Sea and satisfies other
conditions; (3) a joint contribution by the IID, CVWD, and SDCWA to the Salton Sea
Restoration Fund established by the California Legislature with payments totaling a
present value of $30 million; and (4) payment by MWD to a Salton Sea Restoration
Fund of $20 (in 2003 dollars) per acre-foot for all special surplus water MWD
receives from the reinstatement of the Interim Surplus Guidelines.
As part of the final negotiations, the IID and CDWR entered into a conditional
agreement for the IID to sell CDWR an aggregate of 800,000 acre-feet of
conserved water, through the year 2017 for delivery to the Salton Sea as mitigation
for impacts of the SDCWA transfer. CDWR is responsible for all mitigation costs,
including environmental and any socioeconomic impacts from land fallowing used
to make water available to CDWR. The water will be sold to CDWR at a price of
$175/acre foot (in 2003 dollars). Therefore, the price received by the IID in any
year equals $175/acre foot adjusted by changes in a contractually defined price
index from 2003 to the year of delivery.
City of Imperial 2010 Urban Water Management Plan Version 1.2
Page 66 of 132
Compromise IID QSA Delivery Schedule (KAF)
Delivery Conservation Practice
1 2 3 4 5 6 7 8 9
Agreement Calendar IID to IID to IID to Total Efficiency Fallowing Fallowing Total
Year Year SDCWA CVWD MWD Delivery for for for Fallowing
(Col2+3+4) Delivery Delivery Mitigation
(Col 7+8)
or (Col6+7)
4 2006 40 0 0 40 - 40 20 60
5 2007 50 0 0 50 - 50 25 75
6 2008 50 4 0 54 4 50 25 75
7 2009 60 8 0 68 8 60 30 90
8 2010 70 12 0 82 12 70 35 105
9 2011 80 16 0 96 16 80 43 120
10 2012 90 21 0 111 21 90 45 135
11 2013 100 26 0 126 46 80 70 150
12 2014 100 31 0 131 47 60 90 150
13 2015 100 36 0 136 96 40 110 150
14 2016 100 41 0 141 121 20 130 150
15 2017 100 45 0 145 145 0 150 150
16 2018 130 63 0 193 193 0 0 0
17 2019 160 38 0 228 228 0 0 0
18 2020 192.5 73 2.5 268 268 0 0 0
19 2021 205 78 5 288 288 0 0 0
20 2022 202.5 83 2.5 288 288 0 0 0
21 2023 200 88 0 288 288 0 0 0
22 2024 200 93 0 293 293 0 0 0
23 2025 200 98 0 298 298 0 0 0
24 2026 200 103 0 303 303 0 0 0
25 2027 200 103 0 303 303 0 0 0
26 2028 200 103 0 303 303 0 0 0
27-452029-2047
200 103 0 303 303 0 0 0
46-752048-2077
200 50 0 250 250 0 0 0
Figure 49 – IID QSA Delivery Schedule
QSA by and among IID, MWD, and CVWD, Exhibit C, http://www.iid.com/Media/Quantification-Settlement-Agreement(QSA-among-IID,-MWD,-and.pdf , (p 39 of 44)
City of Imperial 2010 Urban Water Management Plan Version 1.2
Page 67 of 132
Canal Lining Projects
In 1986, Congress passed Public Law 100-675 that governs the allocation of water
conserved by the lining of the All-American and Coachella canals and assigns
responsibility for the repayment of costs. Water conserved by these projects was to
be made available to the IID, CVWD, and MWD in accordance with the priorities
established under the Seven-Party Agreement. Parties who use the conserved
water were to reimburse the party constructing the project for an apportioned share
the amortized capital costs, plus an apportioned share of the costs of operation,
maintenance, and any net costs the lining projects impose on IID. In 1988,
Congress authorized the Secretary of the Interior to develop a well field or construct
a new lined canal or line previously unlined portions of the All-American Canal in
southeastern California, and to enter into an agreement with the MWD and/or
certain other California water agencies to fund the lining project. The canal is
owned by the United States. An estimated 67,700 acre-feet of water a year that
was lost by seepage into groundwater from unlined portions of the canal is
expected to be saved by this project and made available for use according to the
terms of the QSA and related agreements.
On September 25, 1998, the California Legislature passed Senate Bill 1765
authorizing the sum of $200 million be used by the Director of CDWR to finance
and arrange for lining portions of the All-American and Coachella Canals. The
“Agreement for the Funding of the All-American Canal Lining Project” was
developed by the IID and CDWR, and approved by the Board of Directors of the IID
on July 24, 2001. Pursuant to the agreement with CDWR, CDWR will reimburse
the IID for all costs up to $126 million associated with the canal lining project. The
project also qualifies for an additional $9.5 million of Proposition 50 funding
approved in the November 2002 general election. The total amount of funding
reserved for the canal lining project from the State of California is $135.5 million.
All-American Canal
The All-American Canal (AAC) is the Imperial Valley's lifeline from the Colorado
River. In 2008, 2,878,320 acre-feet of Colorado River water was accounted for by
water balance through the All-American Canal to nine cities and 475,000 acres of
farmable lands throughout the Imperial Valley.
Considered an engineering marvel, even by today's standards, the 80-mile gravity-
flow All-American Canal begins at Imperial Dam on the Colorado River about 20
City of Imperial 2010 Urban Water Management Plan Version 1.2
Page 68 of 132
miles northeast of Yuma, Arizona. Dropping a total of 175 feet between Imperial
Dam and IID’s Westside Main Canal, the All-American Canal extends south and
then west, parallel to the Mexican/American border much of the way.
Crossing 14 miles of sand dunes on the east side of the Imperial Valley, the All-
American Canal ends in the southwest corner of the Imperial Irrigation District's
delivery area. The AAC until 2009 was unlined, resulting in an estimated
67,700AFY in seepage. The All-American Canal Lining Project included 23 miles of
concrete lining.
The Project consisted of the planning; environmental compliance and permitting
activities; preparation of schedules, plans, specifications and cost estimates;
administration; design; construction; and implementation of environmental
mitigation measures required to construct the 23-mile concrete lined canal parallel
to the existing earthen canal, from one mile west of Pilot Knob to Drop 3. The new
concrete lined section of the AAC is expected to conserve 67,700 acre-feet per year
of Colorado River water that was historically lost to seepage, mainly into Mexico.
The new section of concrete lined AAC was constructed parallel to the existing AAC
alignment using conventional construction methods and now permitted the current
unlined section of the AAC to remain in service and to provide normal water
deliveries to IID customers during construction. IID operates and maintains the
Project in accordance with its existing contract with USBR. Construction was
completed in 2009.
Colorado River Environmental Considerations
Several fish species and other wildlife species either directly or indirectly have the
potential to affect Colorado River options, thus changing power operations and the
amount of water deliveries to the lower basin. A number of species that are on
either endangered or threatened lists under the Endangered Species Act are
present in the area of the Lower Colorado River, including among others, the
bonytail chub, razorback sucker, southwestern willow flycatcher and Yuma clapper
rail. To address this issue, a broad-based State/Federal/tribal/private regional
partnership has been formed, which includes water, hydroelectric power and wildlife
management agencies in Arizona, California and Nevada. The objective is to
accommodate current water diversions and power production and optimize
opportunities for future water and power development while working toward the
conservation of habitat and toward recovery of the endangered species. These
City of Imperial 2010 Urban Water Management Plan Version 1.2
Page 69 of 132
efforts also have the objective of reducing the likelihood of additional
“threatened/endangered” species listings.
Operations of the Water System
The Water Control Section of the IID’s Water Department is responsible for the
transmission of water through the main canal system and its diversion to the
laterals for distribution to the users. Water distribution is a complicated task that
involves adjusting the appropriate check, delivery and other structures. There are
approximately 3,400 check structures and 5,600 irrigation delivery structures within
the system. A coordinated procedure has evolved to handle this complex
distribution process.
Groundwater
Identify and quantify, to the extent practicable, the existing and planned sources of water available to thesupplier over the same five-year increments described in subdivision (a) (10631(b)).
Total groundwater pumped 0 0 0 0 0Groundwater as a percent of total water
supply0.0% 0.0% 0.0% 0.0% 0.0%
Units (circle one): acre-feet per year1Indicate whether volume is based on volumeteric meterdata or another method
Figure 50 - TABLE 18 Groundwater - volume pumped
Table 19
Groundwater — volume projected to be pumpedBasin name(s) 2015 2020 2025 2030 2035 - opt
Imperial Valley 0 0 0 0 0
Total groundwater pumped 0 0 0 0 0
Percent of total water supply 0.0% 0.0% 0.0% 0.0% 0.0%
Units (circle one): acre-feet per year
Include future planned expansion
Figure 51 - TABLE 19 Groundwater - volume projected to be pumped
Groundwater is generally unusable for municipal potable water supplies or irrigation in
the Imperial Valley. The salinity, or total dissolved solids count, is too high.
City of Imperial 2010 Urban Water Management Plan Version 1.2
Page 70 of 132
The deepest groundwater is in some cases is believed to be moderately altered
ocean water. Above this level, the water may consist of residuals from prehistoric
fresh water lakes that filled the Salton Trough. Waters at this level vary from low to
moderate salinity. The next higher layers are high temperature, and in places highly
saline waters.
In the central part of the Imperial Valley, the groundwater has a higher salinity than
the Colorado River water, which has an approximate salinity of 750mg/L. Most wells
had total dissolved solids concentrations of between 1,000 and 3,000 mg/L. The ionic
composition of the water in the central part of the valley is similar to that of the East
Mesa. However, as the total dissolved solids concentration increases, the ionic
composition becomes more dominated by sodium chloride. The pH of these waters is
usually slightly basic, with an occasional value less than seven.
In the western section of the valley, water quality varies widely. Almost all of the wells
in Coyote Valley have total dissolved solids concentrations below 500 mg/L; however,
West Mesa wells have levels between 1,800 and 5,200 mg/L.
The shallow aquifers beneath the Imperial Valley are affected by canal seepage and
deep percolation of applied irrigation water (raw Colorado River water) from
agricultural fields.
Percolation from agricultural fields has resulted in local salinities higher than Colorado
River water because of the leaching of salts from these fields. In other areas, mounds
of good quality fresh water have resulted from seepage from irrigation canals. This has
occurred significantly in the unlined major canals and the All-American, East Highline,
and Coachella canals.
Waters within the shallow aquifers of the Salton Trough generally move at right
angles to contours lines, and towards the Salton Sea. Based on pumping data and
water studies on various wells, groundwater is from six to eight feet below the ground
surface level throughout most of the Imperial Valley.
The deep water reservoir underlying Imperial Valley has been estimated at 1.1 billion
to 3.0 billion acre-feet, with total recoverable water estimated to be about twenty
percent of the water in storage.
City of Imperial 2010 Urban Water Management Plan Version 1.2
Page 71 of 132
(Provide a) copy of any groundwater management plan adopted by the urban water supplier, includingplans adopted pursuant to Part 2.75 (commencing with Section 10750), or any other specific authorizationfor groundwater management (10631(b)(1)).
There is no groundwater management plan for the City.
(Provide a) description of any groundwater basin or basins from which the urban water supplier pumpsgroundwater (10631(b)(2)).
The City does not use groundwater.
For those basins for which a court or the board has adjudicated the rights to pump groundwater,(provide) a copy of the order or decree adopted by the court or the board (10631(b)(2)).
The City does not use groundwater.
(Provide a) detailed description and analysis of the location, amount, and sufficiency of groundwaterpumped by the urban water supplier for the past five years. The description and analysis shall be based oninformation that is reasonably available, including, but not limited to, historic use records (10631(b)(3)).
The City does not use groundwater.
(Provide a) detailed description and analysis of the amount and location of groundwater that is projectedto be pumped by the urban water supplier. The description and analysis shall be based on information thatis reasonably available, including, but not limited to, historic use records (10631(b)(4)).
The City does not use groundwater.
Transfer or Opportunities
Describe the opportunities for exchanges or transfers of water on a short-term or long-term basis(10631(d))
The City does not have plans to exchange or transfer water. All agencies within the
Imperial Valley utilize the same raw source water from the Imperial Irrigation District.
However, if connected to another water system there would be the benefit of an
emergency water supply. The City will evaluate the potential for long term
possibilities.
Table 20
Transfer and exchange opportunities
Transfer agencyTransfer orexchange
Short term orlong term
ProposedVolume
None 0 0 0
Total 0 0 0
City of Imperial 2010 Urban Water Management Plan Version 1.2
Page 72 of 132
Units (circle one): million gallons per year
Figure 52 - TABLE 20 Transfer and exchange opportunities
Development of Desalinated WaterDescribe the opportunities for development of desalinated water, including, but not limited to, oceanwater, brackish water, and groundwater, as a long-term supply (10631(i)).
There are no plans to use and treat the brackish groundwater as a long-term supply
in the Imperial Valley.
There are no plans for the City of Imperial to use and treat the brackish groundwater
as a long-term supply in the Imperial Valley. There are no feasible opportunities for
the City of Imperial to independently development of desalinated water sources
within the planning horizon of the 2010 UWMP, because of the supply availability
and cost effectiveness of treating surface water from the Colorado River. If it
becomes financially feasible in the future, there may be consideration for
desalination of brackish groundwater and drain water on a regional basis.
Recycled Water Opportunities
Provide, to the extent available, information on recycled water and its potential for use as a water sourcein the service area of the urban water supplier. The preparation of the plan shall be coordinated withlocal water, wastewater, groundwater, and planning agencies that operate within the supplier's servicearea (10633).
Recycled Water Feasibility
The City of Imperial provides sewer service and has a wastewater treatment plant
which produces secondary (includes de-nitrification) treatment level wastewater.
Treated waste water is discharged to percolation ponds.
Treated wastewater in the City of Imperial does not currently meet Title 22 Standards,
and no wastewater is currently recycled within the City’s service boundary. The WWTP
discharges the treated waste water to IID drainage canals, where it eventually enters
the Salton Sea.
There are potential uses for recycled water that include but is limited to: landscape
irrigation, industrial reuse, wetlands, some agricultural uses (consistent with State
regulations) and wildlife habitat enhancement. There are some recycled water projects
City of Imperial 2010 Urban Water Management Plan Version 1.2
Page 73 of 132
that have been proposed in the Imperial Valley for use in Solar and Geothermal plants.
Keystone Regional Water Reclamation Facility & Wastewater Collection System
In February of 2006, the County of Imperial approved the Mesquite Lake Specific Plan
Area (MLSPA), defining land use and development standards for approximately 5,100
acres. Located within the central Imperial County area, between the Cities of Brawley
and Imperial, the area has seen many proposed projects and generated considerable
interest. However, the high cost of initial infrastructure – specifically, a reliable
wastewater treatment facility – has presented an obstacle to progress.
The region has committed to collaborating across jurisdictional boundaries to
proactively shape the future of job creation in the region. With the recent County
adoption of a traffic impact fee to address roadway improvements in central Imperial
County, and plans for water treatment facilities well underway, the remaining major
infrastructure piece is the Keystone Regional Water Reclamation Facility. The Facility
opens the door for years of development and job creation.
The proposed Keystone Regional Water Reclamation Facility ensures centralized
wastewater treatment for the Keystone Planning Area and adjacent lands in the County
of Imperial. It will provide essential wastewater treatment and reclamation services to
industrial developments within the Mesquite Lake Specific Plan Area, as well as
services to nearby commercial developments, mixed use projects, residential
developments, recreational area and educational facilities.
The Plant design integrated the latest green technology. The project is self-contained,
with solar and co-generation production opportunities. It will be the first plant in
Imperial County to generate Title 22 quality recycled water, utilizing state of the art
membrane technology to produce high quality recycled water. It is initially equipped to
produce up to 5 million gallons per day (MGD) of water for industry, recreation and
irrigation. The build out capacity of the plant is 50 MGD. Users are readily available.
The City is actively seeking funding to build the proposed recycled water facility. It is
anticipated that the 5.0 MGD of recycled water will become available in 2015, and that
the recycled water produced by the facility will double every five years through 2030.
City of Imperial 2010 Urban Water Management Plan Version 1.2
Page 74 of 132
(Describe) the wastewater collection and treatment systems in the supplier's service area, including aquantification of the amount of wastewater collected and treated and the methods of wastewater disposal(10633(a)).
Wastewater Collection and Treatment in Imperial
The City Waste Water Treatment Plant (WWTP) manages wastewater collection and
treatment for the City. All of the wastewater flows from the City (including storm water
run-off), and is collected and treated at the WWTP. The WWTP treats an average of 3.5
The City owns and operates a municipal wastewater treatment facility. The treatment
system consists of preliminary, primary, and secondary treatment before being
disinfected and discharged. Wastewater is discharged o the New River, a water of the
United States, and a tributary to the Salton Sea.
Treatment Process Description
The city owns and operates a wastewater collection, treatment and disposal system and
provides sewerage service to the City of Imperial. The wastewater treatment facility
located at 701 East 14th Street, Imperial, California. The wastewater flows through the
Dolson Drain, Lilac Drain, Rose Drain, Alamo River and then enters the Salton Sea.
The City owns and operates the wastewater treatment plant. Recently the wastewater
treatment plant was expanded to treat an average daily flow (ADF) of 2.4 mgd and a
peak daily flow (PDF) of 4.8 mgd. The current wastewater treatment plant consists of an
influent pumping station, grit chamber, two parallel oxidation ditches, two secondary
clarifiers, an ultraviolet disinfection system, and sludge drying beds.
The City recently upgraded to the facility in the following ways: 1) Installed a new
screening mechanism. Retrofitted the existing headworks channel with a screening
dewatering/system; 2) Installed a packaged lift station, wet well, and appurtenant piping
City of Imperial 2010 Urban Water Management Plan Version 1.2
Page 75 of 132
to deliver water from the existing splitter box to the extended aeration/activated sludge
basin; 3) Installed an extended aeration/activated sludge basin with integral clarifier
treatment system with separate building to house the blowers; 4) Removed the existing
ultraviolet disinfection system and replaced with a higher output capacity UV system; 5)
Constructed 10 additional sludge drying beds; 6) Upgraded the existing electrical to
accommodate the proposed facilities.
(Describe) the quantity of treated wastewater that meets recycled water standards, is being discharged,and is otherwise available for use in a recycled water project (10633(b)).
Table 21
Recycled water — wastewater collection and treatment
Type of Wastewater 2005 2010 2015 2020 2025 2030
Wastewater collected &treated in service area
182.5 547.5 1,825 3,650 7,300 14,600
Volume that meets recycledwater standard
0 0 1,825 3,650 7,300 14,600
Units (circle one): million gallons per year
Figure 53 - TABLE 21 Recycled water - wastewater collection and treatment
There is no current recycled water use in Imperial. It is anticipated that the
Keystone Regional Water Reclamation Facility and Wastewater Collection System
will become online in 2015, producing 5.0 MGD, doubling in capacity every five
years until 2030.
Table 22
Recycled water — non-recycled wastewater disposal
Method of disposal Treatment Level 2010 2015 2020 2025 2030
No method currently used None 0 1,825 3,650 7,300 14,600
(Describe) the recycled water currently being used in the supplier's service area, including, but not limitedto, the type, place, and quantity of use (10633(c)).
(Describe and quantify) the potential uses of recycled water, including, but not limited to, agriculturalirrigation, landscape irrigation, wildlife habitat enhancement, wetlands, industrial reuse, groundwaterrecharge, indirect potable reuse, and other appropriate uses, and a determination with regard to thetechnical and economic feasibility of serving those uses (10633(d)).
City of Imperial 2010 Urban Water Management Plan Version 1.2
Page 76 of 132
Table 23
Recycled water — potential future use
User type Description Feasibility1 2015 2020 2025 2030
Agricultural irrigation Low 0 0 0 0
Landscape irrigation2 Medium 200 400 800 1,600
Commercial irrigation3 Medium 300 600 1,200 2,400
Golf course irrigation Medium 0 0 0 0
Wildlife habitat Medium 0 0 0 0
Wetlands Medium 0 0 0 0
Industrial reuse High 1,325 2,650 5,300 10,600
Groundwater recharge Low 0 0 0 0
Seawater barrier None 0 0 0 0
Geothermal/Energy High 0 0 0 0
Indirect potable reuse None 0 0 0 0
Other (user type)
Total 0 1,825 3,650 7,300 14,600
Units (circle one): million gallons per year1Technical and economic feasibility.2Includes parks, schools, cemeteries, churches, residential, or other public facilities)3Includes commercial building use such as landscaping, toilets, HVAC, etc) andcommercial uses (car washes, laundries, nurseries, etc)
Figure 55 - TABLE 23 Recycled water - potential future use
The Keystone Regional Water Reclamation Facility, anticipated to produce recycled
water in 2015, will ensure centralized wastewater treatment for the Keystone Planning
Area and adjacent lands in the County of Imperial. It will provide essential wastewater
treatment and reclamation services to industrial developments within the Mesquite Lake
Specific Plan Area, as well as services to nearby commercial developments, mixed use
projects, residential developments, recreational area and educational facilities.
Since the QSA has been approved, recycled water may become more of a feasible
option for new industry within the Imperial Valley. There is not enough water for IID to
allocate to proposed renewable energy projects without developing new sources and/or
policies.
“IID Interim Water Supply Policy for Non-Agricultural Projects” dated 09/29/2009
(IWSP) currently designates up to 25,000 AFY of water to Non-Agricultural Projects
within IID’s water service area.
City of Imperial 2010 Urban Water Management Plan Version 1.2
Page 77 of 132
(Describe) the projected use of recycled water within the supplier's service area at the end of 5, 10, 15,and 20 years, and a description of the actual use of recycled water in comparison to uses previouslyprojected pursuant to this subdivision (10633(e)).
The Integrated Regional Water Management Plan (IRWMP) that is currently being
developed will evaluate regional recycling opportunities and potential grant funding for
projects consistent with the Imperial regional goal and objectives, and the State’s
preferences and priorities.
Table 24
Recycled water — 2005 UWMP use projection compared to 2010 actual
Use type 2010 actual use 2005 Projection for 20101
Agricultural irrigation 0 0
Landscape irrigation2 0 0
Commercial irrigation3 0 0
Golf course irrigation 0 0
Wildlife habitat 0 0
Wetlands 0 0
Industrial reuse 0 0
Groundwater recharge 0 0
Seawater barrier 0 0
Geothermal/Energy 0 0
Indirect potable reuse 0 0
Other (user type) 0 0
Other (user type)
Total 0 0
Units: million gallons per year1From the 2005 UWMP.2Includes parks, schools, cemeteries, churches, residential, or other public facilities)3Includes commercial building use such as landscaping, toilets, HVAC, etc) and commercial uses(car washes, laundries, nurseries, etc)
Figure 56 - TABLE 24 Recycled Water - 2005 UWMP use projection compared to 2010 actual
City of Imperial 2010 Urban Water Management Plan Version 1.2
Page 78 of 132
(Describe the) actions, including financial incentives, which may be taken to encourage the use ofrecycled water, and the projected results of these actions in terms of acre-feet of recycled water used peryear (10633(f)).
Table 25
Methods to encourage recycled water use
Projected Results
Actions 2010 2015 2020 2025 2030
Financial incentives 0 1,825 3,650 7,300 14,600
None
Total 0 1,825 3,650 7,300 14,600
Units (circle one): million gallons per year
Figure 57 - TABLE 25 Methods to encourage recycled water use
Depending of funding availability, there may be financial incentives to encourage
developers to connect to the proposed Keystone reclaim facility starting in 2015.
(Provide a) plan for optimizing the use of recycled water in the supplier's service area, including actionsto facilitate the installation of dual distribution systems, to promote recirculating uses, to facilitate theincreased use of treated wastewater that meets recycled water standards, and to overcome any obstaclesto achieving that increased use (10633(g)).
The plans and specifications for the Keystone Regional Water Reclamation Facility &
Wastewater Collection System have been prepared and are ready for construction. The
city is seeking funding sources for the recycled water treatment facility and installing a
dual distribution system. It is currently beyond the City’s resources.
The city will work with future (high water demand) developers and industry to promote
the potential of funding the recycled treatment plant and new purple pipe distribution
systems in the Keystone area.
City of Imperial 2010 Urban Water Management Plan Version 1.2
Page 79 of 132
Future Water Projects
(Describe) all water supply projects and water supply programs that may be undertaken by the urbanwater supplier to meet the total projected water use as established pursuant to subdivision (a) of Section10635. The urban water supplier shall include a detailed description of expected future projects andprograms, other than the demand management programs identified pursuant to paragraph (1) ofsubdivision (f), that the urban water supplier may implement to increase the amount of the water supplyavailable to the urban water supplier in average, single-dry, and multiple-dry water years. Thedescription shall identify specific projects and include a description of the increase in water supply that isexpected to be available from each project. The description shall include an estimate with regard to theimplementation timeline for each project or program (10631(h)).
1Water volumes presented here should be accounted for in Table 16.
2Indicate whether project is likely to happen and what constraints, if any, exist for project implementation.3Provide estimated supply benefits, if available.
Figure 58 - TABLE 26 Future water supply projects
Although the City does not have any future water supply projects planned to increase
the amount of the water supply available, the City if Imperial is a participant in the
Imperial Water Forum. The Imperial IRWMP being developed by the Water Forum
includes evaluation of potential future projects and programs that may be implemented
to increase the amount of the water supply available in all types of years. The Imperial
IRWMP will contain an implementation plan and listing of projects to be implemented to
increase the water supply portfolio. As a participant in the IRWMP, the City is working
within the larger Region through the collaborative IRWM effort to increase the amount
of supply within the Region.
City of Imperial 2010 Urban Water Management Plan Version 1.2
Page 80 of 132
Section 5 – Water Supply Reliability and Water ShortageContingency Planning
Water Supply Reliability
An urban water supplier shall describe in the plan water management tools and options used by thatentity that will maximize resources and minimize the need to import water from other regions (10620(f)).
For any water source that may not be available at a consistent level of use, given specific legal,environmental, water quality, or climatic factors, describe plans to supplement or replace that sourcewith alternative sources or water demand management measures, to the extent practicable (10631(c)(2)).
The main factors that can cause water supply shortages for the City are water
pollution, earthquakes and long term energy outages at the treatment and pumping
facilities.
The Imperial Irrigation District is the only supplier of water to the City, and there is no
alternative source water. The water quality of the agricultural drains, New River and
Alamo River are high in total dissolved solids and other contaminants and are as such
unusable as a potable or irrigation water source.
The City receives water from the All-American and Central Main Canals. If either the
All-American Canal or Central Main Canal were shut down, water could not be
delivered to the treatment plant. The shut down could be for scheduled maintenance
or as a result of an emergency, such as an earthquake. In October 1979, an
earthquake caused levee and slope failures along the All-American Canal east of El
Centro, severely limiting water flow. This is the only time during the last 25 years that
the All-American Canal was shut down.
Maintenance is scheduled to be performed monthly on the South Date Canal and
Dahlia Lateral. Typically, however, the South Date Canal and the Dahlia Lateral are
shut down about three times annually, usually lasting approximately three days each
time. The Central Main Canal and the All-American Canal are seldom shut down. To
perform maintenance on the Central Main Canal, the water level is lowered but
service is not completely interrupted. According to plant operators, this is done every
five to ten years.
In the event that there is a water shortage in the Lower Colorado River Basin, the
Imperial Irrigation District/San Diego County Water Authority water transfer agreement
City of Imperial 2010 Urban Water Management Plan Version 1.2
Page 81 of 132
states that both agencies will share, on a pro-rata basis, any reductions in water to
Imperial Irrigation District should a shortage declaration by the Secretary of the Interior
for the Lower Colorado River Basin affect the Imperial Irrigation District's water
conservation and transfer programs. When the amount of water in usable storage in
Lake Mead is less than 15 million acre-feet and the unregulated inflow into Lake
Powell is forecasted to be less than 8.8 million acre-feet, the Imperial Irrigation District
and the San Diego County Water Authority have agreed to meet and confer to discuss
a supplemental water transfer agreement in anticipation of the shortage.
Should operating conditions on the Colorado River indicate Imperial Irrigation District
may be impacted by reductions in water deliveries; the Imperial Irrigation District will
notify all of its water users by mail and will conduct an educational outreach program in
conjunction with the local media and municipal water systems. The notice will request
all water suppliers, and in particular residential, industrial, and commercial water
users, to conserve water on a voluntary basis. Urban water suppliers will be
responsible for notifying their customers and implementing their own voluntary water
conservation measures and programs.
Urban water supply reductions in the Imperial Unit are not likely to occur during the
next twenty years. Urban water supply shortage stage one is voluntary, has cut back
conditions of less than 15 percent, and is estimated to provide up to 79 percent of the
reduction goal for urban water suppliers. Urban water supply shortage stage two is
voluntary, has cut back conditions of 15 percent to less than 25 percent, and is
estimated to provide 7 to 12 percent of the reduction goal for urban water suppliers.
Urban water supply shortage stage 3 is mandatory, has cut back conditions of 25
percent to less than 35 percent, and is estimated to provide the remainder of any
reduction goals for urban water suppliers.
City of Imperial 2010 Urban Water Management Plan Version 1.2
Page 82 of 132
Table 29
Factors resulting in inconsistency of supply
Water supply sources1
Sp
ecif
icso
urc
en
am
e,
ifan
y
Lim
itati
on
qu
an
tifi
cati
on
Leg
al
En
vir
on
men
tal
Wate
rq
uality
Cli
mati
c
Ad
dit
ion
al
info
rmati
on
Imperial Irrigation District None None None None None None None
Units (circle one): million gallons per year1From Table 16.
Figure 59 - TABLE 29 Factors resulting in inconsistency of supply
There are no known upcoming factors that will result in inconsistency of supply.
Imperial Irrigation District Supply
It is unlikely that the urban water supply of Imperial Irrigation District would ever be
affected, even under shortage or drought conditions on the Colorado River. Urban
water use in the Imperial Unit makes up less than three percent of the total water
delivered by the Imperial Irrigation District. Under a worst case water supply scenario,
the Imperial Irrigation District could meet the demands of urban water users. Due to
the high priority of the Imperial Irrigation District's water rights, Colorado River flows,
and the storage facilities on the Colorado River it is highly unlikely that Imperial
Irrigation District's water supply will be affected, even in dry years.
Water Shortage Contingency Planning
Actions to be undertaken by the urban water supplier to prepare for, and implement during, acatastrophic interruption of water supplies including, but not limited to, a regional power outage, anearthquake, or other disaster (10632(c)).
Upon a catastrophic water supply reduction, mandatory provisions to reduce individual
urban consumer water use will be placed into effect. During a shortage the City would
increase media attention to the water supply situation and would step up public water
education programs, encourage property owners to apply for landscape and interior
water use surveys and continue to advertise the importance of customers installing
efficient plumbing fixtures.
City of Imperial 2010 Urban Water Management Plan Version 1.2
Page 83 of 132
During declared shortages, or when a shortage declaration appears imminent, the City
Manager activates a City water shortage response team. The team includes: water,
fire, planning, health, emergency services, public affairs, parks and recreation, and the
Mayor's Office. During a declared water shortage, the City will accept applications for
new building permits but will not issue permits until the shortage declaration is
rescinded. An appeal process is available and ends at the City Council.
In the event of extended regional power outages, the City will use standby diesel
generators that will power critical functions at the water treatment plant. The fuel
would be brought in every two days. In this way the residents of Imperial would not
lose supply of potable water.
In the event of an earthquake that damages critical components of the water treatment
plant, the City will divert irrigation water into the potable water distribution system.
Under this scenario non-potable water would be delivered to City customers and the
water would have to be boiled by each customer prior to potable water use. The water
could be delivered by diesel powered pumps to the City’s distribution system. If the
All-American or Central Main Canal is damaged and unable to transmit water, the City
will declare a water shortage emergency and will implement the appropriate
conservation measures. The City will have approximately ten days of raw water
storage to rely on from the time of the emergency with these conservation measures
in place.
Imperial Irrigation District Emergency Preparedness Plan
During or immediately after any water supply emergency, IID staff implements the
Emergency Preparedness Plan. The Emergency Preparedness Plan includes
required actions and procedures by IID staff to respond to events that impair water
operation of canals, laterals, drains, dams, and other facilities. These responses are
not normal operation and maintenance activities. Generally, any occurrence that
requires an immediate response is classified as an extreme event or emergency.
The Emergency Preparedness Plan defines the role each responsible employee will
play during an emergency. Water Department staff conducts emergency and/or
disaster response planning in the Water Control Center. Coordination of staffs with
other departments will take place in the General Manager's conference room. All-
American Canal River Division staff planning will be centered in the Imperial Dam
City of Imperial 2010 Urban Water Management Plan Version 1.2
Page 84 of 132
Control House. Other staffs meet and coordinate actions at designated areas.
Established actions and procedures exist for extreme events and emergencies that
endanger operation of the water system. Possible emergencies/extreme events that
endanger operation of the water system could include: earthquakes, storms, rain, run-
off from desert washes, flooding, facility or structure damage, power outages, fire,
vehicles in canals, equipment theft/vandalism, or other disaster. The Imperial Irrigation
District's water delivery and drainage systems do not totally shut down during an
emergency.
The Imperial Irrigation District has conducted Emergency Preparedness Exercises in
the past. Emergency preparedness exercises will be updated with the development of
new emergency preparedness exercises. Water Department staffs trained and
participated with the U. S. Department of the Interior Bureau of Reclamation's
Tabletop Exercise for emergency preparedness.
The cities in the Imperial Unit have a ten-day storage holding capacity requirement.
The Imperial County Office of Emergency Services requires this storage holding
capacity for cities (Imperial Irrigation District, 1998, p.22).
IID is considered a special district in the eyes of the state and the federal government.
A special district has to meet the same requirements as a local city pertaining to
emergency preparedness and emergency management. As such, IID is required to go
through the appropriate channels regarding mutual aid.
In the event of a natural and or man-made disaster, IID would open its Emergency
Operations Center located at headquarters in Imperial, California. IID would then
notify the Operational Area, which is the Imperial County Office of Emergency
Services located in Heber at the Imperial County Fire Department Station # 2. If the
event called for mutual aid IID, the EOC would request assistance from the OA. If the
OA was unable to fulfill this request it would go to the next highest level, which would
be the Regional Emergency Operations Center, located in Los Alamitos.
In the event the REOC was unable to fill the request it would go to the State
Operations Center located in Sacramento. The SOC would fill the request or ask for
federal assistance from the Federal Emergency Management Agency a subsection of
the Federal Department of Homeland Security.
City of Imperial 2010 Urban Water Management Plan Version 1.2
Page 85 of 132
Additional, mandatory prohibitions against specific water use practices during water shortages,including, but not limited to, prohibiting the use of potable water for street cleaning (10632(d)).
The City has adopted the resolution found in Appendix C, Restrictions during a Declared
Water-Shortage Emergency. The following restrictions shall be effective during a
declared Water-Shortage Emergency:
1. There shall be no water used for irrigation or landscaping purposes.
2. There shall be no private or commercial car washing.
3. No restaurant, hotel, cafe, cafeteria or other public place where food is sold,
served or offered for sale, shall serve drinking water to any customer unless
requested.
4. Use of potable water for construction, compaction, dust control, street or
parking lot sweeping, building wash down shall be prohibited.
5. Use of potable water for sewer system maintenance or fire protection training
shall be prohibited without prior approval by the Mayor;
6. Use of potable water for any purpose in excess of the amount allocated shall be
prohibited.
7. Other restrictions and prohibitions may become necessary during a declared
Water Shortage Emergency, to safeguard the adequacy of the water supply for
domestic, sanitation, fire protection, and environmental requirements.
Table 36
Water shortage contingency — mandatory prohibitions
Prohibitions
Stage WhenProhibitionBecomes
Mandatory
Using potable water for street washing III
Serving drinking water unless requested I
Use of potable water for construction, compaction, dust control and building wash down II
Use of potable water for sewer system maintenance or fire protection training III
Use of potable water in excess of amount allocated IV
City of Imperial 2010 Urban Water Management Plan Version 1.2
Page 86 of 132
Consumption reduction methods in the most restrictive stages. Each urban water supplier may use anytype of consumption reduction methods in its water shortage contingency analysis that would reducewater use, are appropriate for its area, and have the ability to achieve a water use reduction consistentwith up to a 50 percent reduction in water supply (10632(e)).
Water Shortage Stages and Triggering Mechanisms
As the water purveyor, the City of Imperial must provide the minimum health and safety
water needs of the community at all times. The water shortage response is designed to
provide a minimum of 50% of normal supply during a severe or extended water
shortage. The rationing program triggering levels shown below were established to
ensure that this goal is met.
Rationing stages may be triggered by groundwater contamination, power failure,
earthquake or other natural disaster.
The City's only potable water source is the Colorado River. Specific criteria for triggering
the City's rationing stages are shown in Figure 63.
Water Shortage Stages and Triggering Mechanisms
Percent
Reduction
of Supply
Stage I Up
to 15%
Stage II
15 - 25%
Stage III
25 - 35%
Stage IV
35 - 50% >
Water Supply Condition
Supply Projected supply
insufficient to
provide 80% of
normal demand,
Or
Projected
supply
insufficient to
provide 75% of
normal demand, Or
Projected
supply insufficient
to
provide 65% of
normal
demand, Or
Projected
supply
insufficient to
provide 50% of
normal demand,
Or
Water Quality Contamination
of 10% of water
supply (exceeds
primary drinking
water standards)
Contamination
of 20% of water
supply (exceeds
primary drinking
water standards)
Contamination of
30% of water
supply (exceeds
primary drinking
water standards)
Contamination
of 40% of water
supply (exceeds
primary drinking
water standards)
Figure 61 – Water shortage stages and triggering mechanisms
City of Imperial 2010 Urban Water Management Plan Version 1.2
Page 87 of 132
Water Allotment Methods
The City has established the following allocation method for each customer type. See
the city ordinance for sample water shortage rationing allocation method.
Single Family Hybrid of Per-capita and Percentage Reduction
Multifamily Hybrid of Per-capita and Percentage Reduction
CommercialPercentage Reduction
Industrial Percentage Reduction
Gov’t/Institutional Percentage Reduction
Recreational Percentage Reduction - vary by efficiency
Water Shortage Rationing Allocation Method
Single-family account allocations may be determined as follows: assuming 4 persons
or less per home, an account would receive 11 HCF per month (68 gpcd) plus 55% of
their historic use, not to exceed an upper limit. The upper limit on additional water may
be 30 HCF per year (i.e., 132 HCF + 50% historic ≤ 162 HCF a year). Appeals would
be available for additional people. For each additional person at a home the allotment
is increased by 4 HCF per billing period (49 gcd).
Multi-residential account allocations may be determined as follows: assuming 3
persons or less per unit, accounts receive 6 HCF per unit per month (49 gcd), plus
40% of their historic use, not to exceed an upper limit. The upper limit on additional
water may be 10 HCF per year per unit (i.e., 72 HCF + 40% historic ≤ 82 HCF a year).
Appeals would be available for additional people. For each additional person, the
allotment increases by 4 HCF per billing period (49 gcd).
Increased allocations for residential accounts would be limited to the following:
Greater number of residents than assumed by plan.
Medical conditions requiring additional water.
Commercial, Industrial and Institutional would receive a percentage reduction from
historical use. The historical use period used to determine the baseline amount may
vary based on specific factors. Appeals would be available for increased business,
census or other factors. New Customers Per-capita (no allocation for new landscaping
during a water shortage.)
City of Imperial 2010 Urban Water Management Plan Version 1.2
Page 88 of 132
Based on current and projected customer demand, the city ordinance shown in
Appendix C indicates the water allocated to each customer type by priority and
rationing stage during a declared water shortage.
Individual customer allotments are based on a five-year period. This gives the City a
more accurate view of the usual water needs of each customer and provides
additional flexibility in determining allotments and reviewing appeals. However, no
allotment may be greater than the amount used in the most recent year of the five-
year base period.
The Water Department Manager shall classify each customer and calculate each
customer's allotment according to the Sample Water Rationing Allocation Method. The
allotment shall reflect seasonal patterns. Each customer shall be notified of their
classification and allotment by mail before the effective date of the Water Shortage
Emergency. New customers will be notified at the time the application for service is
made. In a disaster, prior notice of allotment may not be possible; notice will be
provided by other means. Any customer may appeal the Water Department Manager's
classification on the basis of use or the allotment on the basis of incorrect calculation.
Rationing Stages and Reduction Goals
The City has developed a four stage rationing plan to invoke during declared
water shortages. The rationing plan includes voluntary and mandatory rationing,
depending on the causes, severity, and anticipated duration of the water supply
shortage.
Water Rationing Stages and Reduction Goals
Shortage
Condition
Stage Reduction
Goal
Type of
Rationing ProgramUp to 15% I 15% Voluntary15 – 25% II 25% Mandatory25 - 35% III 35% Mandatory35 - 50% IV 50% or > Mandatory
Figure 62 - Water rationing stages and reduction goals
Mandatory Prohibitions on Water Use
The Imperial "No Waste" Ordinance prohibits certain types of water uses during
water shortage emergencies. The following are the stages at which water use
prohibitions become active:
City of Imperial 2010 Urban Water Management Plan Version 1.2
Page 89 of 132
Table 37
Water shortage contingency — consumption reduction methods
ConsumptionReduction Methods
StageWhen
MethodTakesEffect
ProjectedReduction
(%)
Education Program All Stages Yes
Demand Reduction Program All stages Yes
Voluntary Plumbing Fixture Replacement All stages Yes
Use Prohibitions All stages Yes
Water Shortage Pricing All stages Yes
Voluntary Rationing I No
Restrict Building Permits II, III, IV No
Mandatory Rationing II, III, IV No
Percentage Reduction by Customer Type II, III, IV No
Priorities for use of available potable water during shortages were based on input from
the City Emergency Response Team, citizen groups, and legal requirements set forth
in the California Water Code, Sections 350-358. Water allocations are established for
all customers according to the following ranking system:
Minimum health and safety allocations for interior residential needs (includes
single family, multi-family, hospitals and convalescent facilities, retirement and
mobile home communities, and student housing, and fire fighting and public
safety)
Commercial, industrial, institutional/governmental operations (where water is used
for manufacturing and for minimum health and safety allocations for employees
and visitors), to maintain jobs and economic base of the community (not for
landscape uses)
Existing landscaping
New customers, proposed projects without permits when shortage declared.
Health and Safety Requirements
Based on commonly accepted estimates of interior residential water use in the United
States, Figure 66 indicates per capita health and safety water requirements. In Stage I
City of Imperial 2010 Urban Water Management Plan Version 1.2
Page 90 of 132
shortages, customers may adjust either interior or outdoor water use (or both), in order
to meet the voluntary water reduction goal.
However, under Stage II, Stage III and Stage IV mandatory rationing programs, the
City has established a health and safety allotment of 50 gpcd (which translates to 24
HCF per person per year), because that amount of water is sufficient for essential
interior water with no habit or plumbing fixture changes. If customers wish to change
water use habits or plumbing fixtures, 50 gpcd is sufficient to provide for limited non-
essential (i.e. outdoor) uses.
Stage IV mandatory rationing, which is likely to be declared only as the result of a
prolonged water shortage or as a result of a disaster, would require that customers
make changes in their interior water use habits (for instance, not flushing toilets unless
“necessary” or taking less frequent showers).
Per Capita Health and Safety Water Quantity Calculations
Non-
Conserving
Habit Changes 1 Conserving Fixtures 2
Toilets 4 flushes x 3.5 gpf 14 3 flush x 3.5 gpf 10.5 4 flush x 1.6 gpf 6.4Shower 5 min x 3.0 gpm 15 4 min x 3.0 gpm 12 5 min x 2.0 10
Washer 12.0 gpcd 12 11.0 gpcd 11 10.0 gpcd 10
Kitchen 4 gpcd 4 4 gpcd 3 4 gpcd 3
other 4 gpcd 4 4 gpcd 4 4 gpcd 4
Gallons per person per day 49 40.5 33.4
CCF per person per year 24 20 16
1 Reduced shower use results from shorter length of shower and reduced flow. Reduced
washer use results from fuller loads.
2 Fixtures include ULF 1.6 gpf toilets, 2.0 gpm showerheads, faucet aerators and efficient
clothes washers.Figure 64 - Per Capita Health and Safety water quantity calculations
An analysis of the impacts of each of the actions and conditions described in subdivisions (a) to (f),inclusive, on the revenues and expenditures of the urban water supplier, and proposed measures toovercome those impacts, such as the development of reserves and rate adjustments (10632(g)).
Mechanism to Determine Reductions in Water Use
Under normal water supply conditions, potable water production figures are
recorded daily. Totals are reported weekly to the Water Treatment Facility
Supervisor. Totals are reported monthly to the Water Department Manager and
incorporated into the water supply report.
City of Imperial 2010 Urban Water Management Plan Version 1.2
Page 91 of 132
During a Stage I or Stage II water shortage, daily production figures are reported to
the Supervisor. The Supervisor compares the weekly production to the target weekly
production to verify that the reduction goal is being met. Weekly reports are
forwarded to the Water Department Manager and the Water Shortage Response
Team. Monthly reports are sent to the City Council. If reduction goals are not met,
the Manager will notify the City Council so that corrective action can be taken.
During a Stage III or Stage IV water shortage, the procedure listed above will
be followed, with the addition of a daily production report to the Manager.
During emergency shortages, production figures are reported to the Supervisor
hourly and to the Manager and the Water Shortage Response Team daily. Daily
reports will also be provided to the City Council and the Imperial County Office of
Emergency Services.
All surplus revenues that the City collects are currently used to fund the Rate
Stabilization Fund, conservation, recycling, and other capital improvements. The City
estimated projected ranges of water sales by shortage stage to best understand the
impact each level of shortage will have on projected revenues and expenditures by
each shortage stage.
Penalties or charges for excessive use, where applicable (10632(f)).
Any customer violating the regulations and restrictions on water use set forth in the
“No Waste" Ordinance shall receive a written warning for the first such violation.
Upon a second violation, the customer shall receive a written warning and the City
may cause a flow-restrictor to be installed in the service. If a flow-restrictor is placed,
the violator shall pay the cost of the installation and removal. Any willful violation
occurring subsequent to the issuance of the second written warning shall constitute
a misdemeanor and may be referred to the Office of the City Attorney for
prosecution. If water service is disconnected, it shall be restored only upon payment
of the turn-on charge fixed by the City Council.
There shall be rate increases starting with a 25% rate increase at Stage II; 50% at
Stage III, and a 100% increase at Stage IV. See Appendix D, Establishment of Rate
Increases During a Water Shortage for more information.
City of Imperial 2010 Urban Water Management Plan Version 1.2
Page 92 of 132
Table 38
Water shortage contingency — penalties and charges
Penalties or ChargesStage When Penalty
Takes Effect
25% Rate Increase II
50% Rate Increase III
100% Rate Increase IV
Penalty for Excess Use II
200% Charge for Excess Use III
Figure 65 - TABLE 38 Water shortage contingency - penalties and charges
A draft water shortage contingency resolution or ordinance (10632(h)).
A draft water shortage contingency resolution follows. This will be adopted at the
public hearing for the UWMP.
City of Imperial 2010 Urban Water Management Plan Version 1.2
Page 93 of 132
Draft Resolution to Declare a Water Shortage Emergency
CITY OF IMPERIAL
IMPERIAL COUNTY,
CALIFORNIA Date
The City Council of Imperial does hereby resolve as follows:
PURSUANT to California Water Code Section 350 et seq., the Council has conducted duly
noticed public hearings to establish the criteria under which a water shortage emergency may
be declared.
WHEREAS, the Council finds, determines and declares as follows:
(a) The City is the water purveyor for the property owners and inhabitants of Imperial;
(b) The demand for water service is not expected to lessen.
(c) When the potable water supply available to the City falls at or below the Stage II
triggering levels described in the most current Urban Water Management Plan, the City
will declare a water shortage emergency. The water supply would not be adequate to
meet the ordinary demands and requirements of water consumers and there may be
insufficient water for human consumption, sanitation, fire protection, and environmental
requirements. This condition is likely to exist until groundwater contamination is
remedied and/or water system damage resulting from a disaster is repaired and normal
water service is restored.
NOW, THEREFORE, BE IT RESOLVED that the City Council of Imperial hereby directs the
Mayor to find, determine, declare and conclude that a water shortage emergency condition
exists that threatens the adequacy of water supply, until the City's water supply is deemed
adequate and potable. After the declaration of a water shortage emergency, the Mayor is
directed to determine the appropriate Rationing Stage and implement the City's Water Shortage
Emergency Response.
FURTHERMORE, the Council shall periodically conduct proceedings to determine additional
restrictions and regulations which may be necessary to safeguard the adequacy and quality of
the water supply for domestic, sanitation, fire protection, and environmental requirements.
City of Imperial 2010 Urban Water Management Plan Version 1.2
Page 94 of 132
Moratorium on New Connections during a Water Shortage
CITY OF IMPERIAL
IMPERIAL COUNTY,
CALIFORNIA Date
The City Council of Imperial does hereby resolve as follows:
The Municipal Code of the City of Imperial is hereby amended to read as follows:
XX-5 MORATORIUM ON SERVICE COMMITMENTS AND CONNECTIONS
2. When the City declares a water shortage emergency, the following regulations shall
become effective immediately and shall continue in full force and effect to prohibit the
following while it remains in full force and effect:
a. The City shall not issue oral or written commitments to provide new or expanded
water service, including will-serve letters.
b. The City shall not sell meters for water service connections, despite the prior
issuance of will-serve letters or other oral or written service commitments, unless
building permits have been issued.
c. The City shall not provide new or expanded water service connections, despite the
prior issuance of will-serve letters or other oral or written service commitments and
meters, unless building permits have been issued.
d. The City shall not provide water for use on any new plantings installed after the
declaration of a Water Shortage Emergency.
e. The City shall not annex territory located outside the City's service boundary.
3. The following uses are exempt from the moratorium and upon application to the City
shall receive necessary water service commitments and connections to receive water
from the City:
a. Uses, including but not limited to, commercial, industrial, single and multifamily
residential, for which a building permit has been issued by the City on or before the
declaration of a Water Shortage Emergency.
b. Uses, including but not limited to, commercial, industrial, single and multifamily
residential, for which a retail meter had been purchased from the City before the
declaration of a Water Shortage Emergency, as evidenced by a written receipt and
for which a building permit has been issued and remains in full force and effect.
c. Publicly owned and operated facilities, including but not limited to schools, fire
stations, police stations, and hospitals and other facilities as necessary to protect
the public health, safety and welfare.
City of Imperial 2010 Urban Water Management Plan Version 1.2
Page 95 of 132
Water Quality
The plan shall include information, to the extent practicable, relating to the quality of existing sources ofwater available to the supplier over the same five-year increments as described in subdivision (a) ofSection 10631, and the manner in which water quality affects water management strategies and supplyreliability (10634).
The Safe Drinking Water Act (“SDWA”) was amended on August 6, 1998 to include
“systems providing water for human consumption that deliver water by constructed
conveyances such as irrigation canals.” On October 27, 1998 the IID signed a
Compliance Agreement with the California Department of Public Health (“CDPH”)
requiring that all domestic users with service pipes to the IID’s canal system must
receive an alternate supply of water for drinking and cooking. The alternate supply
must be of sufficient quality to achieve an equivalent level of public health
protection as provided by the SDWA. On May 19, 2000, CDPH provided written
notice that the IID had met the requirements of the Compliance Agreement and that
the IID faced no further enforcement actions. The IID continues to meet the
conditions of the Compliance Agreement.
To comply with US Environmental Protection Agency (EPA) requirements and
avoid termination of canal water service, residents in the IID service area who do
not receive treated water service must obtain alternative water service for drinking
and cooking from a state-approved provider. To avoid penalties that could exceed
$25,000 a day, IID strictly enforces this rule. The section tracks nearly 4,000 raw
water service accounts required by the California Department of Public Health
(CDPH) to have alternate drinking water service. The section maintains a small-
acreage pipe and drinking water database, and provides an annual compliance
update to CDPH.
Table 30
Water quality — current and projected water supply impactsWater source Description of condition 2010 2015 2020 2025 2030
Imperial Irrigation DistrictRaw Water Supply
Water Pollution 0 0 0 0 0
Units (circle one): million gallons per year
Figure 66 - TABLE 30 Water quality - current and projected water supply impacts
It is not anticipated that there will be any major raw water quality disruptions. The
following describe the water quality concerns that were discussed in the recent
City of Imperial 2010 Urban Water Management Plan Version 1.2
Page 96 of 132
Sanitary Survey completed in 2010:
Source Water General Minerals
The bicarbonate alkalinity of the Colorado River raw water ranges from 160 to 200
mg/L. The hardness ranged from 190 to 240 mg/L. TDS ranged from 720 mg/L to
840 mg/L. The following summarizes the monitoring results for alkalinity, hardness
and total dissolved solids (TDS) for samples collected from the IID system since
2003.
Sample
Location Date TDS (mg/L)
Bicarbonate
Alkalinity (mg/L)
Hardness asCaCO3(mg/L)
Drop 1 10/15/04 770 190 350
Drop 1 10/14/05 800 190 360
Drop 1 10/27/06 830 200 380
Drop 1 10/26/07 820 200 350
Drop 1 10/24/08 820 190 360
East High Line 10/15/04 770 190 350
East High Line 10/14/05 800 190 360
East High Line 10/27/06 830 200 350
East High Line 10/26/07 860 240 370
East High Line 10/24/08 850 190 360
Central Main 10/15/04 790 190 350
Central Main 10/14/05 790 190 360
Central Main 10/27/06 780 190 350
Central Main 10/26/07 840 200 370
Central Main 10/24/08 720 190 370
Westside Main 10/15/04 820 190 350
Westside Main 10/14/05 810 190 360
Westside Main 10/27/06 790 190 370
Westside Main 10/26/07 800 200 360
Westside Main 10/24/08 820 190 360Figure 67 - Raw Colorado River Water General Tested Mineral Quality (In IID Delivery System)
Water Pollution
The City participated in the Sanitary Survey Update 2010. The sanitary survey
update provides the most recent information on the potential contaminant sources
of the raw water supply. The main concern identified in the Sanitary Survey is the
variable Microbial Character of the raw water.
City of Imperial 2010 Urban Water Management Plan
The source water was tested as requir
Results of the bacteria testing showed wide fluctuations in the total coliform, fecal
coliform and E.coli. While some results
contaminated water or the testing
between the season and high concentrations of bacteria.
of the variable total coliforms.
The variable microbial character of the raw water is
a. Storm Water Runoff and First Flush Events;b. Imperial Irrigation District routine inspection and maintenance procedures;c. Spills into the IID canal system;d. Drowning deaths in the IID canal system and associated response plans;e. Failing Septic Systems along the Colorado River;f. Recreational Activity;g. Agricultural activity.
Figure 68 - Total Coliform Variations
ban Water Management Plan Version 1.2
Page 97 of 132
The source water was tested as required by Title 22 California code by the IID. The
esults of the bacteria testing showed wide fluctuations in the total coliform, fecal
coliform and E.coli. While some results can be attributed to a passing slug
contaminated water or the testing method, it appears that there is some correlation
between the season and high concentrations of bacteria. See Figure 71
of the variable total coliforms.
The variable microbial character of the raw water is due in part to:
Storm Water Runoff and First Flush Events;gation District routine inspection and maintenance procedures;
Spills into the IID canal system;Drowning deaths in the IID canal system and associated response plans;Failing Septic Systems along the Colorado River;Recreational Activity;
activity.
Total Coliform Variations in the IID Canal Delivery System
code by the IID. The
esults of the bacteria testing showed wide fluctuations in the total coliform, fecal
can be attributed to a passing slug of
e correlation
See Figure 71 for a graph
gation District routine inspection and maintenance procedures;
Drowning deaths in the IID canal system and associated response plans;
in the IID Canal Delivery System
City of Imperial 2010 Urban Water Management Plan Version 1.2
Page 98 of 132
According to the Sanitary Survey Update 2010, it appears that there is some
correlation of high total coliform between the various locations. It also appears that
the longer the water is in the IID canal system, the higher the Total Coliform counts.
It appears that there is an additional coliform source or that the conditions support
bacteria growth within the IID canal system.
Temperature is widely recognized as an important controlling factor in influencing
bacterial growth. In climates where water temperatures are warm such as the
Imperial Valley, bacterial growth may be very rapid. Most bacteria thrive at
temperatures at or around that of the human body 98.6°F (37°C), and some, such
as Escherichia coli (E. coli), are normal parts of the human intestinal flora. These
organisms are mesophiles (moderate-temperature-loving), with an optimum growth
temperature between 77°F (25°C) and 104°F (40°C).
The Sanitary Survey included recommendations for the City to reduce the impact of
possible contaminants for the next five years. The City plans to implement the
recommendations in the survey.
Drought Planning
Describe the reliability of the water supply and vulnerability to seasonal or climatic shortage, to theextent practicable, and provide data for each of the following: (A) an average water year, (B) a single drywater year, (C) multiple dry water years (10631(c)(1)).
Under the Law of the River, IID retains a legal right to annual net consumptive use of
3.1 MAF from the Colorado River. Under the terms of various agreements and laws,
the annual Colorado River flows would have to be reduced to less than 5.0 MAF
(one-third of historic average) before the water supply to IID would be impacted.
Nevertheless, in the face of a large-scale water supply disruption in the western
states, IID is potentially subject to some water supply reduction.
Even in drought years with Lower Colorado River flows less than 7.5 MAF, the
existing laws and agreements provide security that the IID should receive its Present
Perfected Rights of 2.6 MAF and its overall water allocation remains at 3.1 MAF. This
protection is based on the following:
1885 California water right, based on reasonable and beneficial use of
approximately 7 MAF, conveyed to IID on June 22, 1916.
City of Imperial 2010 Urban Water Management Plan Version 1.2
Page 99 of 132
1922 Colorado River Compact requires the Upper Basin states to ensure the
supply of 7.5 MAF at Lees Ferry for use by the Lower Basin states (actually
stated as 75 MAF over 10 years). Thus, it is the responsibility of the Upper
Basin states to provide the full Lower Basin allocation; even in drought years
and even if the 10-year running average annual water supply of the river is
less than 15.0 MAF.
1931 Seven-Party Agreement provides a schedule of apportionments and
priorities, which the parties requested “The Division of Water Resource to, in
all respects, recognize… and recommend to the Secretary of the Interior…
for insertion in any and all contracts for water made by him pursuant to the
terms of the Boulder Canyon Project Act…Pursuant to the provisions . . .
California was apportioned 4.4 million AF per year out of the lower basin
allocation of 7.5 million AF per year, plus 50% of any available surplus
water.”
1931 IID agreed to limit its California pre-1914 appropriate water rights in
quantity and priority to the apportionments and priorities contained in the
Seven-Party Agreement.
1968 Colorado River Basin Project Act states that all deliveries to the Central
Arizona Project (CAP) and all other post-1968 water deliveries are
subordinate to pre-existing Colorado River water rights in the Lower Basin,
regardless of each state’s allocations under the 1928 Boulder Canyon
Project Act. Therefore, all post-1968 rights in the Lower Basin, including the
CAP’s, are effectively junior in priority to California’s Colorado River
diversions under its 4.4 MAF rights. Post-1968 rights in the Lower Basin are
estimated to be 1.8 MAF.
1979 Supplemental Decree in Arizona v. California retains IID’s present
perfected rights to use of the Colorado River water. If water supply shortages
occur along the Colorado River, IID’s present perfected rights must be
satisfied prior to the satisfaction of any nonperfected rights, regardless of
state lines and Federal agreements. IID has a present perfected right to 2.6
MAF.
2003 QSA/Transfer Agreements slightly modify the guaranteed senior water
right of IID within California under the terms of the Seven Party Agreement
(senior to CVWD, MWD and San Diego city and county), as follows: IID
retains its priority 3(a) right to 3.1 MAF of net consumptive use (including
transfers out of the IID service area) at Imperial Dam; however, if IID does
City of Imperial 2010 Urban Water Management Plan Version 1.2
Page 100 of 132
not use its full annual apportionment, then MWD can import the balance up
to California’s 4.4 MAF per year allocation.
2007 USBR interim guidelines provide that shortages in Lake Mead storage,
and decreasing water levels in the reservoir, will prompt reductions in the
deliveries to Arizona and Nevada, but that California deliveries will remain at
4.4 MAF. If California deliveries remain to be 4.4 MAF, then IID deliveries
should likewise remain at the agreed right of 3.1 MAF net consumptive use
under the terms of the QSA/Transfer Agreements.
Because IID’s 2000 Regional UWMP was deemed obsolete and is no longer
supported by IID due to the consumptive use limits agreed upon in the QSA, the
water supplies available during a normal year are best represented by the post-QSA
era (2003 and later). This represents the maximum amount of supply available and is
thus the new normal water year. This is the age of limits for IID, where water is not
necessarily tightly constrained or scarce, but rather the supply is no longer unlimited
due to the agreements with other QSA participants.
Distribution and Priority of Deliveries within IID
See http://www.iid.com/Water/EquitableDistribution for more information.
For the single dry and multiple dry water years assessment, IID’s Equitable
Distribution Plan (EDP) governs. The EDP was adopted in 2007, along with
subsequent regulations, allowing the IID Board to make an annual determination as
to Supply/Demand Imbalance (SDI) conditions. On October 26, 2008, IID staff
summarized the situation in a board presentation, by noting that a 64% probability
existed of demand exceeding supply in the 2009 calendar year, even assuming no
overrun were to occur in 2008. Similarly, the Hanemann Brookes Study opined that
SDI situations were likely to occur “4 or 5 times out of the next 10 years”, and from
2003 through 2008 IID was accounted as overrunning its annual water limit three
times. The Equitable Distribution Plan and the Supply/Demand Imbalance are
discussed in Item 4 under the single dry and multiple dry year projections.
Future apportionment of municipal, industrial, geothermal, feedlots/dairies, and
environmental resources was prescribed in the EDP. The EDP prescribes the
amount of water that IID water users receive during periods of supply/demand
imbalance (SDI).
City of Imperial 2010 Urban Water Management Plan Version 1.2
Page 101 of 132
The Interim Water Supply Policy, approved on 09/29/09, describes the amount of
water available for Non-Agricultural projects and describes the required fees.
Under SDI conditions, industrial and geothermal water users are placed into two
categories: (1) For users with existing contracts (as of 2008), water allocated is
based on past use, not-to-exceed contracted amount and contract terms; and (2) for
contracts after 2008, water allocation is based on anticipated use. The contract
terms include not-to-exceed amounts, and considerations for water availability.
Future water allocation for dairies and feed lots is based on historical practices.
Environmental resources use is based on the amount of mitigation area that has
been developed.
IID has established an Equitable Distribution Plan and implementing regulations,
together referred to as the Equitable Distribution Program, that are designed to
provide for the distribution of water in any year when expected demand for water is
likely to exceed expected supply. Under the Equitable Distribution Program, when a
supply/demand imbalance is declared, IID apportions the estimated supply among
the various types of water users as follows:
a) Municipal and Commercial Users – Municipal and Commercial water users will
receive the first allocation, the base amount of 2006 usage plus current District
wide average use per capita multiplied by the increase in population since 2006.
b) Industrial Users – For existing contracts, estimated based on past use, not to
exceed contracted amount and contract terms. For new contracts, estimated
based on anticipated use, not to exceed contract amount and contract terms,
taking into consideration the Interim Water Supply Policy dated 09/29/09.
c) Feedlots and Dairies – Estimated based upon past use and consideration of
future changes;
d) Environmental Resources Water – Estimated based upon the amount reasonably
necessary to achieve the purposes of the District's commitments, taking past use
into account; and
e) Agricultural Lands – Straight Line Apportionment. Subtract the estimated demand
for categories a through d above from Available Water Supply, and then divide the
remaining supply by the total number of Eligible Agricultural Acres. The amount of
water apportioned to acreage that does not comply with Eligible Agricultural Acres
will be placed in the District Water Exchange.
As part of the Equitable Distribution Plan, a District Water Exchange is established so
City of Imperial 2010 Urban Water Management Plan Version 1.2
Page 102 of 132
that agricultural water users can sell and buy water. This provides flexibility for some
agricultural water users to obtain water in addition to their straight line apportionment.
Consumptive use is not the same as delivery. Exhibit B of the Colorado River Water
Delivery Agreement dated October 2003 (CRWDA), particularly column 13,
summarizes the “IID Net Consumptive Use Amount”, which is indicative of future
supplies as measured at Imperial Dam. Agricultural water demands will decrease in an
amount equivalent to the water conservation attributable to on-farm efficiency
measures (setting aside outside factors such as annual rainfall, differences attributable
to the intensity of farming within IID such as acreage in production, double cropping,
and market conditions, etc.) and IID system conservation and efficiency measures, so
while IID’s total volume in this column is declining, so too are its agricultural demands.
However, as a consequence of reducing the agricultural water demand through
increased on-farm and system efficiency, less water is available for years when
agricultural demand may be higher than normal, such as in years of low rainfall or due
to cropping choices made by Imperial Valley growers. Such intermittent spikes in
higher agricultural demand means less water is available for non-agricultural
development.
Similarly, reductions attributable to system conservation efforts and the All-American
Canal Lining Project are a result of the implementation of conservation measures, so
there is no net decline in the water available for IID’s water users as a result of water
conservation and transfer projects.
The variability in IID’s historical net consumptive use, which can be seen in Figure
73, is representative of the historic variability in agricultural deliveries, since IID’s
MCI deliveries are relatively small and fairly consistent. Historic variations in
agricultural water demand actually exceed, but are similar in magnitude, to the
408,000 AF per year of transfers called for in the QSA/Transfer Agreements. For
example, agricultural water demands for 1970-2003 varied from a low of 2.555
MAF per year to a high of 3.172 MAF per year – a variation of 617,000 AF. The
greatest variation for one year to the next was 326,000 AF, while several 2-year
variations are in excess of 300,000 AF. Under the terms of the QSA/Transfer
Agreements, IID has a variable demand and a fixed supply which can lead to the
supply/ imbalances described above (overruns and under-runs); however, with
implementation the Equitable Distribution Plan, these variations are expected to be
much less.
Page 103 of 132
Table 27
Basis of water year dataWater Year Type Base Year(s)
Average Water Year 1990
Single-Dry Water Year 1974
Multiple-Dry Water Years 1996-1998Figure 69 - TABLE 27 Basis of water year data
“Average Water Year” means the average year of net consumptive use as compared
to the consumptive use right.
“Single-Dry Water Year” in this plan signifies a year that the net consumptive use
exceeded the consumptive use right.
“Multiple-Dry Water Years” in this plan signifies a stretch of three years that the net
consumptive use exceeded the consumptive use right.
Figure 70 – IID consumptive use (at Imperial Dam) versus IID Priority 3(a) per the QSA Consumptive UseRight (1970-2010)
2,000,000
2,200,000
2,400,000
2,600,000
2,800,000
3,000,000
3,200,000
3,400,000
19
70
19
75
19
80
19
85
19
90
19
95
20
00
20
05
20
10
Wat
er
De
live
ry(A
FY)
IID Priority 3(a) QuantifiedConsumptive Use Amount(October 2003 QSA andRelated Agreements)
IID Consumptive Use (1970-2003)
IID Consumptive Use withQSA Obligations (2004-2010)
Page 104 of 132
Table 28
Supply reliability — historic conditions
Average / Normal Water YearSingle
DryWaterYear
Multiple Dry WaterYears
Year1
Year2
Year3
1990 1974 1996 1997 1998
IID Percentage consumed over consumptive use right 3.2% 1.9% 1.9% 1.3%
Figure 72 – IID Quantification and transfers as of 2008
Notes:1. Information conveyed in this figure is from the United State Bureau of Reclamation's Exhibit B of the Colorado River
Water Delivery Agreement (CRWDA); however, IID has adjusted the 1988 MWD Transfer values for 2003 through2006 to reflect actual values and the values for 2007 - 2077 to reflect the new IID/MWD agreement. IID Total
Page 105 of 132
Reduction and IID Net Consumptive Use Amount have been recalculated to reflect these changes.2. By IID and MWD agreement, the 1988 IID/MWD transfer has been fixed at 105 KAFY, starting in 2007.3. Reductions include conservation for 1988 IID/MWD Agreement Transfer, IID/SDCWA Transfer, AAC Lining (amount
may vary); SDCWA Transfer Mitigation, additional MWD Transfer w/Salton Sea Restoration (amount may vary), andMisc. PPRs and allow for Conditional Interim Surplus Agreement Backfill (amount may vary). Amounts in this table areindependent of increases and reductions as allowed under the Inadvertent Overrun and Payback Policy. NOTE: Shadedcolumns represent amounts that might vary.
4. Assumes SDCWA does not elect termination in year 35.5. Assumes SDCWA and IID mutually consent to renewal term of 30 years.
Source: QSA CRWDA Exhibit B
Stages of action to be undertaken by the urban water supplier in response to water supply shortages,including up to a 50 percent reduction in water supply, and an outline of specific water supply conditionswhich are applicable to each stage (10632(a)).
Table 35Water shortage contingency — rationing stages to address water supply
shortagesStage No. Water Supply Conditions % Shortage
I Voluntary Rationing 15%
II Rate Increases Start 25%
III Mandatory Rationing 35%
IV Per Capita Allotment per Customer Type 50%
1One of the stages of action must be designed to address a 50 percent reduction in water supply.
Figure 73 - TABLE 35 Water shortage contingency - rationing stages to address water supply shortages
If the water supplies are reduced by 50 percent for a single year, the City will make
an allotment on a per capita basis per connection and customer type.
An estimate of the minimum water supply available during each of the next three water years based onthe driest three-year historic sequence for the agency's water supply (10632(b)).
Page 106 of 132
Table 31
Supply reliability — current water sources
Water supply sources1
Average/
NormalWaterYear
Supply2
Multiple Dry Water YearSupply2
Year2011
Year2012
Year2013
Imperial Irrigation District 2,555 2,555 2,555 2,555
Percent of normal year: 100%
Units (circle one): million gallons per year1From Table 16.2See Table 27 for basis of water type years.
Figure 74 - TABLE 31 Supply reliability - current water sources
The water supply available to the city is determined by the water treatment plant
capacity and raw water influent piping, which is currently 7,840 acre-feet per year.
Multiple dry water years do not affect the City’s water supply.
A mechanism for determining actual reductions in water use pursuant to the urban water shortagecontingency analysis 10632(i).
Under normal water supply conditions, potable water production figures are
recorded daily. Totals are reported weekly to the Water Treatment Facility
Supervisor. Totals are reported monthly to the Water Department Manager and
incorporated into the water supply report.
During a Stage I or Stage II water shortage, daily production figures are reported to
the Supervisor. The Supervisor compares the weekly production to the target weekly
production to verify that the reduction goal is being met. Weekly reports are
forwarded to the Water Department Manager and the Water Shortage Response
Team. Monthly reports are sent to the City Council. If reduction goals are not met,
the Manager will notify the City Council so that corrective action can be taken.
During a Stage III or Stage IV water shortage, the procedure listed above will
be followed, with the addition of a daily production report to the Manager.
During emergency shortages, production figures are reported to the Supervisor
hourly and to the Manager and the Water Shortage Response Team daily. Daily
reports will also be provided to the City Council and the Imperial County Office of
Emergency Services.
Page 107 of 132
All surplus revenues that the City collects are currently used to fund the Rate
Stabilization Fund, conservation, recycling, and other capital improvements. The City
estimated projected ranges of water sales by shortage stage to best understand the
impact each level of shortage will have on projected revenues and expenditures by
each shortage stage.
Every urban water supplier shall include, as part of its urban water management plan, an assessment ofthe reliability of its water service to its customers during normal, dry, and multiple dry water years. Thiswater supply and demand assessment shall compare the total water supply sources available to the watersupplier with the total projected water use over the next 20 years, in five-year increments, for a normalwater year, a single dry water year, and multiple dry water years. The water service reliabilityassessment shall be based upon the information compiled pursuant to Section 10631, including availabledata from state, regional, or local agency population projections within the service area of the urbanwater supplier (10635(a)).
There is no foreseeable water shortage in the City of Imperial for the next 20
years. The City of Imperial uses surface water supplied by the Colorado River that
can supply the City with sufficient water to meet all projected demand. Thus the
City is not affected by climatic related supply shortages. California experienced a
prolonged drought from 1987 through 1992 and 2007 to 2009 and in 2010 below
normal runoff. The Governor declared a statewide drought and proclaimed a state
of emergency in nine counties on June 4, 2008 and a statewide emergency due
to the drought on February 27, 2009. The droughts, however, did not affect the
City’s water supply.
Supply and Demand Comparison Provisions
The City’s projected average use over the next 20 years is shown below. The
projections are based on the Urban Water Targets as determined in this document.
Table 32
Supply and demand comparison — normal year2015 2020 2025 2030
Units are in Million Gallons per year.1Consider the same sources as in Table 16. If new sources of water are planned, add a column to thetable and specify the source, timing, and amount of water.2Provide in the text of the UWMP text that discusses how single-dry-year water supply volumes weredetermined.3Consider the same demands as in Table 3. If new water demands are anticipated, add a column tothe table and specify the source, timing, and amount of water.4The urban water target determined in this UWMP will be considered when developing the 2020 waterdemands included in this table.
(Describe and provide a schedule of implementation for) each water demand management measure thatis currently being implemented, or scheduled for implementation, including the steps necessary toimplement any proposed measures, including, but not limited to, all of the following: (A) water surveyprograms for single-family residential and multifamily residential customers; (B) residential plumbingretrofit; (C) system water audits, leak detection, and repair; (D) metering with commodity rates for allnew connections and retrofit of existing connections; (E) large landscape conservation programs andincentives; (F) high-efficiency washing machine rebate programs; (G) public information programs; (H)school education programs; (I) conservation programs for commercial, industrial, and institutionalaccounts; (J) wholesale agency programs; (K) conservation pricing;(L) water conservation coordinator;(M) water waste prohibition; (N) residential ultra-lowflush toilet replacement programs (10631(f)(1) and(2).
A description of the methods, if any, that the supplier will use to evaluate the effectiveness of waterdemand management measures implemented or described under the plan (10631(f)(3)).
An estimate, if available, of existing conservation savings on water use within the supplier's service area,and the effect of the savings on the supplier's ability to further reduce demand (10631(f)(4)).
An evaluation of each water demand management measure listed in paragraph (1) of subdivision (f) thatis not currently being implemented or scheduled for implementation. In the course of the evaluation, firstconsideration shall be given to water demand management measures, or combination of measures, thatoffer lower incremental costs than expanded or additional water supplies. This evaluation shall do all ofthe following: (1) Take into account economic and noneconomic factors, including environmental, social,health, customer impact, and technological factors; (2) Include a cost-benefit analysis, identifying totalbenefits and total costs; (3) Include a description of funding available to implement any planned watersupply project that would provide water at a higher unit cost; (4) Include a description of the watersupplier’s legal authority to implement the measure and efforts to work with other relevant agencies toensure the implementation of the measure and to share the cost of implementation (10631(g)).
Page 111 of 132
Demand management measures andCalifornia Urban Water Conservation Council BMP names
CUWCC BMP Organization and Names (2009 MOU) UWMP DMMs
Type Category BMP # BMP name DMM # DMM name
Foundational OperationsPractices 1.1.1 Conservation Coordinator L
Water conservationcoordinator
1.1.2 Water Waste Prevention M Water waste prohibition
1.1.3Wholesale AgencyAssistance Programs
JWholesale agencyprograms
1.2 Water Loss Control CSystem water audits, leakdetection, and repair
1.3
Metering with CommodityRates for All NewConnections and Retrofitof Existing Connections
D
Metering with commodityrates for all newconnections and retrofit ofexisting connections
1.4Retail ConservationPricing
K Conservation pricing
EducationPrograms
2.1Public InformationPrograms
GPublic informationprograms
2.2School EducationPrograms
H School educationprograms
Programmatic Residential
3.1Residential assistanceprogram
A
Water survey programs forsingle-family residentialand multifamily residentialcustomers
1
BResidential plumbingretrofit
3.2 Landscape water survey A
Water survey programs forsingle-family residentialand multifamily residentialcustomers