144
City of San José Annual Report on City Services 2018-19 A Report from the City Auditor Report #19-11 December 2019

City of San José
Annual Report on City Services 2018-19
A Report from the City Auditor
Report #19-11
December 2019
THIS REPORT WAS REPRODUCED AT TAXPAYERS’ EXPENSE
You are welcome to keep this copy if it is useful to you.
If you no longer need this copy, you are encouraged to return it to:
Office of the City Auditor
City of San José
200 East Santa Clara Street
San José, CA 95113
We maintain an inventory of past audit reports, and your cooperation
will help us save on extra copying costs.
This report can be found on-line at:
http://www.sanjoseca.gov/servicesreport

Annual Report on City Services 2018-19
December 18, 2019
City of San JoséOffice of the City Auditor
The Office of the City Auditor is pleased to present the twelfth City ofSan José Annual Report on City Services. This report providesperformance data on the cost, quantity, quality, timeliness, and publicopinion of City services. It includes historical trends and comparisons totargets and other cities. The report is intended to be informational and toprovide the public with an independent, impartial assessment of theservices the City provides with their tax dollars.
Background
With a population of 1,043,000, San José is the tenth largest city in theUnited States and the third largest city in California. The City of San Joséserves an ethnically diverse population—about 36 percent Asian, 32percent Hispanic, and 25 percent white. Roughly 40 percent of San Joséresidents are foreign born. More than half of residents speak a languageother than English at home.
In 2018, San José’s median household income increased to $113,000;however, the cost of living in San José is among the highest in the nation.Fifteen percent of San José households earned less than $35,000. Anestimated 6,100 residents are homeless.
Resident Survey
2019 marked San José’s ninth year of participation in The NationalCommunity SurveyTM, a collaborative effort between National ResearchCenter, Inc. (NRC) and the International City/County Management
Association (ICMA). In addition, for the first time this year, the CityAuditor's Office worked with the Knight Foundation and San Jose StateUniversity to implement a parallel survey of university students and faculty.
As in past years, residents identified safety and the economy as prioritiesfor the San José community. While two thirds of respondents expected toremain in San José over the next five years, less than half rated the qualityof life as good or excellent. As described in more detail in this report,ratings for many City services were similar to prior years. However,ratings for some City services have declined as the City has struggled torecover from budget and service reductions earlier in the decade.
Financial Condition
For the first time in seven years, the City's revenues for governmentalactivities exceeded its expenditures. As a result, the City's net positionincreased in 2018-19. The City's liquidity ratio and unassigned GeneralFund balance also increased, which bolster the City's position in the eventof an economic downturn. The City also added value to its capital assets,though it still faces an estimated $1.5 billion deferred maintenance andinfrastructure backlog.
Operating Budget and Staffing
In 2018-19, the City’s departmental operating expenditures totaled $1.5billion*, or about $1,450 per resident. Despite a projected General Fundshortfall of $4.3 million at the beginning of the year, the City has generally
Honorable Mayor and MembersOf the City Council200 East Santa Clara StreetSan Jose, CA 95113
1City of San José – Annual Report on City Services 2018-19

increased spending in recent years. The City Manager’s 2019-20 BudgetMessage, however, forecasted budget shortfalls for three of the next fouryears.
Increased staffing in recent years has nearly restored staffing levels to whatthey were 10 years ago; however, about half of all City departmentsremain below those levels. San José employs about 6.1 people per 1,000residents—fewer than any other large California city we surveyed.
* Expenditures from the City’s Operating Budget totaled $3.7 billion. This also includes GeneralFund capital and Citywide expenditures, reserves, transfers, and various non-General Fundoperating and enterprise fund expenditures (e.g., capital, debt service, pass-through grant funds)and operating or other reserves.
Performance Results by City Service Area
The City of San José provides a wide array of services that city residents,businesses, and other stakeholders count on. 2019 marks the secondyear this report includes the newly created City Service Area Dashboards.Last year, the City Administration selected its top six measuresrepresenting achievements in each City Service Area. Some highlightedresults from these service areas include:
Public Safety
• Police handled about 1.2 million calls for service and responded toabout 196,000 Priority 1 to 4 incidents in 2018-19. The citywideaverage response time for Priority 1 calls was 7.1 minutes, with 52percent of Priority 1 calls meeting the six-minute target. Forty-sixpercent of Priority 2 calls met their 11-minute response target. Onaverage, Police responded to Priority 2 calls in 19.9 minutes.
• San José experienced 2,883 major crimes per 100,000 residents in2018, marking the first year since 2012 that San José's per capita crimerate was higher than both the state and national rates, though itremains below other major California cities such as Los Angeles, SanFrancisco, and Oakland.
• Fire responded to about 91,900 incidents in 2018-19, including 3,100
fires. The Department responded to 74 percent of Priority 1 incidentswithin its time standard of eight minutes (target: 80 percent), which isan improvement from the last two years. The Department respondedto 92 percent of Priority 2 incidents within 13 minutes (target: 80percent).
Community and Economic Development
• Jobs per employed resident in San José increased slightly, to 0.83. It isstill below the Envision 2040 target of 1.1 job per employed resident.San José's unemployment rate is low, however, declining to just 2.7percent in 2018-19.
• In 2018-19, developers completed 111 new affordable housing unitswith City help, bringing the total number of affordable units to almost21,000. Availability of quality, affordable housing remains among thelowest rated characteristics of the city, however, with 82 percent ofresidents rating the availability as "poor."
• Seventy-nine percent of plan checks for development projects werecompleted within processing time targets. Sixty-nine percent ofbuilding inspections occurred within the target time of 24 hours. In2018-19, the the value of construction increased; however, the volumeof construction decreased for the second straight year.
Transportation and Aviation Services
• While overall City streets maintain a rating of "fair" based on thePavement Condition Index (PCI), the passage of Measure T inNovember 2018 will enable the Department of Transportation torepair residential streets beginning in 2020. The Department also filled19,700 potholes in 2018-19. Twenty-one percent of residents rated theCity's street repair services as "good" or "excellent," a marked increasefrom 14 percent last year.
• The fatal and injury crash rate rose slightly to 2.2 per 1,000 residents in2018, but remains below the national rate, which was 5.9 in 2017.
2 City of San José – Annual Report on City Services 2018-19
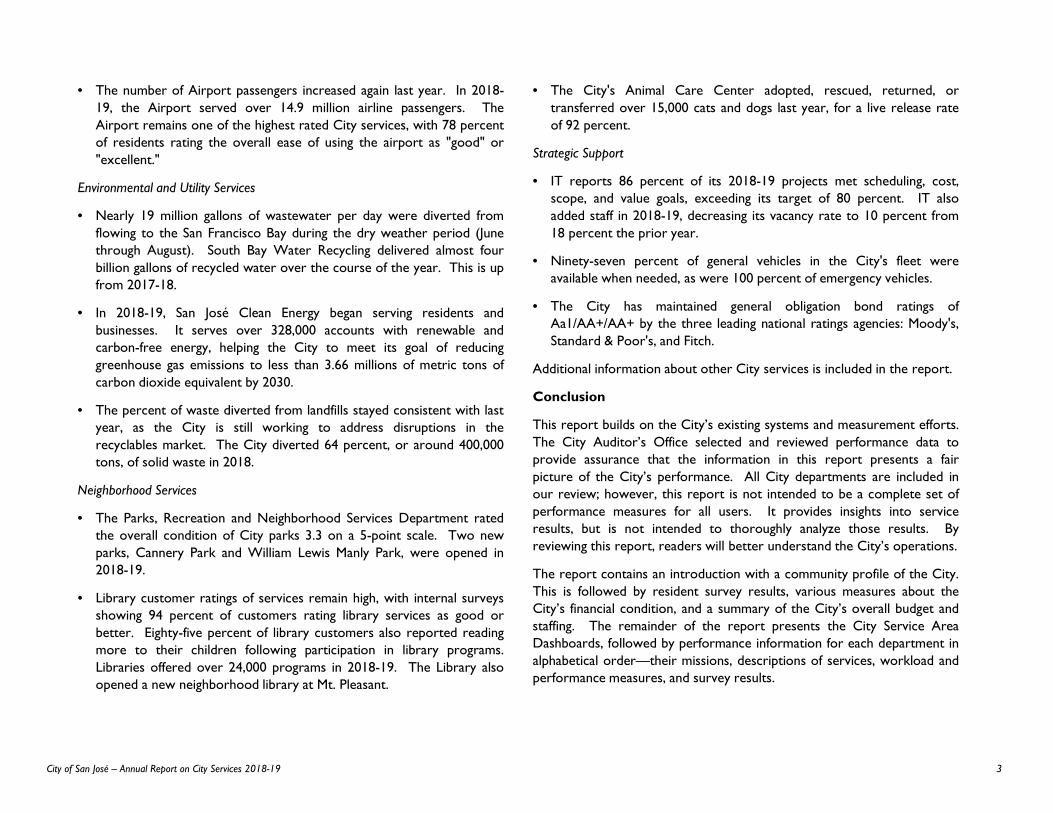
• The number of Airport passengers increased again last year. In 2018-19, the Airport served over 14.9 million airline passengers. TheAirport remains one of the highest rated City services, with 78 percentof residents rating the overall ease of using the airport as "good" or"excellent."
Environmental and Utility Services
• Nearly 19 million gallons of wastewater per day were diverted fromflowing to the San Francisco Bay during the dry weather period (Junethrough August). South Bay Water Recycling delivered almost fourbillion gallons of recycled water over the course of the year. This is upfrom 2017-18.
• In 2018-19, San José Clean Energy began serving residents andbusinesses. It serves over 328,000 accounts with renewable andcarbon-free energy, helping the City to meet its goal of reducinggreenhouse gas emissions to less than 3.66 millions of metric tons ofcarbon dioxide equivalent by 2030.
• The percent of waste diverted from landfills stayed consistent with lastyear, as the City is still working to address disruptions in therecyclables market. The City diverted 64 percent, or around 400,000tons, of solid waste in 2018.
Neighborhood Services
• The Parks, Recreation and Neighborhood Services Department ratedthe overall condition of City parks 3.3 on a 5-point scale. Two newparks, Cannery Park and William Lewis Manly Park, were opened in2018-19.
• Library customer ratings of services remain high, with internal surveysshowing 94 percent of customers rating library services as good orbetter. Eighty-five percent of library customers also reported readingmore to their children following participation in library programs.Libraries offered over 24,000 programs in 2018-19. The Library alsoopened a new neighborhood library at Mt. Pleasant.
• The City's Animal Care Center adopted, rescued, returned, ortransferred over 15,000 cats and dogs last year, for a live release rateof 92 percent.
Strategic Support
• IT reports 86 percent of its 2018-19 projects met scheduling, cost,scope, and value goals, exceeding its target of 80 percent. IT alsoadded staff in 2018-19, decreasing its vacancy rate to 10 percent from18 percent the prior year.
• Ninety-seven percent of general vehicles in the City's fleet wereavailable when needed, as were 100 percent of emergency vehicles.
• The City has maintained general obligation bond ratings ofAa1/AA+/AA+ by the three leading national ratings agencies: Moody's,Standard & Poor's, and Fitch.
Additional information about other City services is included in the report.
Conclusion
This report builds on the City’s existing systems and measurement efforts.The City Auditor’s Office selected and reviewed performance data toprovide assurance that the information in this report presents a fairpicture of the City’s performance. All City departments are included inour review; however, this report is not intended to be a complete set ofperformance measures for all users. It provides insights into serviceresults, but is not intended to thoroughly analyze those results. Byreviewing this report, readers will better understand the City’s operations.
The report contains an introduction with a community profile of the City.This is followed by resident survey results, various measures about theCity’s financial condition, and a summary of the City’s overall budget andstaffing. The remainder of the report presents the City Service AreaDashboards, followed by performance information for each department inalphabetical order—their missions, descriptions of services, workload andperformance measures, and survey results.
3City of San José – Annual Report on City Services 2018-19

Additional copies of this report are available from the Auditor’s Office and are posted on our website at www.sanjoseca.gov/servicesreport. We thank the many departments that contributed to this report. This report would not be possible without their support. We would also like to thank the Knight Foundation and San Jose State University for their interest and participation in our resident survey.
Respectfully submitted,
Joe RoisCity Auditor
Audit staff: Stephanie Noble, Juan Barragan, Chris Bernedo, Shirley Duong, Katrina Gutierrez, Brittney Harvey, Leonard Hyman, Marisa Lin, Gitanjali Mandrekar, Ebele Obi, Ali Pauly, Vicki Sun, Caroline Wurden
4 City of San José – Annual Report on City Services 2018-19

TABLE OF CONTENTS
RESIDENT SURVEY
FINANCIAL CONDITION
OPERATING BUDGET AND STAFFING
CITY SERVICE AREA (CSA) DASHBOARDS
PERFORMANCE RESULTS
Airport
City Attorney
City Auditor
City Clerk
City Manager
Community Energy
Economic Development
Environmental Services
Finance
Fire
Housing
Human Resources
Independent Police Auditor
Information Technology
Library
Parks, Recreation and Neighborhood Services
Planning, Building and Code Enforcement
Development Services
Police
Public Works
Retirement Services
Transportation
INTRODUCTION
Background
Community Profile
Scope & Methodology
15
21
31
37
45
49
51
53
55
59
61
67
75
77
83
87
89
91
95
101
107
110
113
121
127
131
7
8
10
14
5City of San José – Annual Report on City Services 2018-19

6 City of San José – Annual Report on City Services 2018-19
INTRODUCTION
Background
Community Profile
Scope and Methodology
BACKGROUND
This
purpose
••
•
•
The
performance
number
items
City
public
October
All
complete
comparisons
cities,
After
Accomplishments,
Management
included
cost
to
continue
This
City's
criminal
Clara
residents
the
7City of San José – Annual Report on City Services 2018-19

INTRODUCTION
BACKGROUND
The first section of this report contains information on resident perceptions
of the city, City services, and City staff; the City’s financial condition; and the
City’s operating budget and staffing. It also includes City Service Area (CSA)
dashboards – the top six measures representing achievements in the City's
key lines of business. The remainder of the report displays performance
information by department, in alphabetical order. The departments are as
follows:
• Airport
• City Attorney
• City Auditor
• City Clerk
• City Manager
• Community Energy
• Economic Development
• Environmental Services
• Finance
• Fire
• Housing
• Human Resources
• Independent Police Auditor
• Information Technology
• Library
• Parks, Recreation and Neighborhood Services
• Planning, Building and Code Enforcement
• Police
• Public Works
• Retirement
• Transportation
The Office of the City Auditor thanks staff from each City department for
their time, information, and cooperation in the creation of this report.
ACKNOWLEDGEMENTS
CITY GOVERNMENT
This is the twelfth Annual City Auditor’s Report on City Services. The
purpose of this report is to:
• improve government transparency and accountability,
• provide consolidated performance and workload information on City
services,
• allow City officials and staff members to make informed management
decisions, and
• report to the public on the state of City departments, programs, and
services.
The report contains summary information including workload and
performance results for the fiscal year ended June 30, 2019. We limited the
number and scope of workload and performance indicators in this report to
items we identified as the most useful, relevant, and accurate indicators of
City government performance that would also be of general interest to the
public. This report also includes the results of a resident survey, completed in
October 2019, rating the quality of City services.
All City departments are included in our review; however this report is not a
complete set of performance measures. The report provides three types of
comparisons when available: historical trends, selected comparisons to other
cities, and selected comparisons to stated targets.
After completing the first annual report on the City’s Service Efforts and
Accomplishments, the City Auditor’s Office published Performance
Management and Reporting in San José; A Proposal for Improvement, which
included suggestions for improving quality and reliability of performance and
cost data. Since issuing that report we have worked with the Budget Office
to assist a number of City departments in improving their measures. We will
continue to work with departments towards improving their data.
This report covers the functions of the City government of San José. The
City's residents are also served by the County of Santa Clara, which provides
criminal justice, health and hospital, housing, and social services. The Santa
Clara Valley Water District provides water and flood protection to San José
residents. San José contains 240 schools. Fifteen public school districts serve
the City's children.
San
29
city,
member
The
map)
There
of
City
Auditor,
Some
departments
For
owned
cities
Saratoga
communities
The
upcoming
•••••
The
meeting
8 City of San José – Annual Report on City Services 2018-19

INTRODUCTION
*Details of the boards and commissions can be found on the City’s website.
perceptions
the
(CSA)
City's
performance
as
for
CITY GOVERNMENT
The City Council also holds Council Committee meetings each month. The
decisions made in these meetings are brought to the main Council meeting
for approval.
City Council Committees:
• Community & Economic Development Committee
• Neighborhood Services & Education Committee
• Public Safety, Finance & Strategic Support Committee
• Rules & Open Government Committee
• Smart Cities & Service Improvements Committee
• Transportation & Environment Committee
City of San José
Council District Map
Note: Each district
represents about
100,000 in population.
COMMUNITY PROFILE
San
States
population
southern
47
San
938
However,
indicated,
Finance
we
THE CITY'S RESIDENTS ARE DIVERSE
The
demographics
services
services
San José was established as El Pueblo de San José de Guadalupe on November
29, 1777, 73 years before California achieved statehood. San José is a charter
city, operating under a council/manager form of government. There is an 11-
member City Council and many Council-appointed boards and commissions.*
The Mayor is elected citywide; Council members are elected by district (see
map).
There were 21 City departments and offices during fiscal year 2018-19. Five
of the departments and offices are run by officials directly appointed by the
City Council. Those officials are the City Manager, City Attorney, City
Auditor, Independent Police Auditor, and City Clerk.
Some departments and programs serve expanded service areas. These
departments include Environmental Services, Public Works, and the Airport.
For example, the San José/Santa Clara Regional Wastewater Facility is co-
owned by the cities of San José and Santa Clara and provides service to those
cities as well as Milpitas, Cupertino, Los Gatos, Monte Sereno, Campbell, and
Saratoga. The Airport serves the entire South Bay region and neighboring
communities.
The Mayor's June 2019 budget message addressed several priorities for the
upcoming year, with proposed investments in the areas of:
• Education and Opportunity,
• Housing and Homelessness,
• Public Safety,
• Blight and Beautification Efforts, and
• Community Building and Empowerment.
The City Council meets weekly to direct City operations. The Council meeting schedule and agendas can be viewed online.
9City of San José – Annual Report on City Services 2018-19
INTRODUCTION
The
meeting
COMMUNITY PROFILE
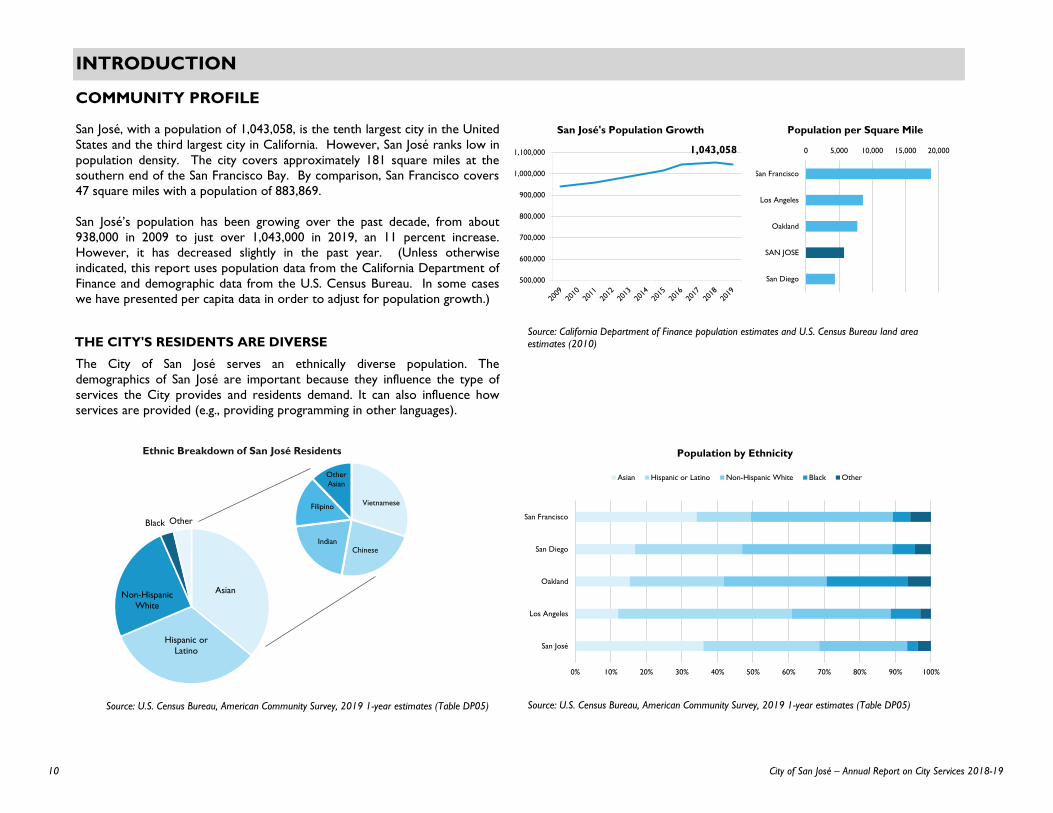
San José, with a population of 1,043,058, is the tenth largest city in the United
States and the third largest city in California. However, San José ranks low in
population density. The city covers approximately 181 square miles at the
southern end of the San Francisco Bay. By comparison, San Francisco covers
47 square miles with a population of 883,869.
San José’s population has been growing over the past decade, from about
938,000 in 2009 to just over 1,043,000 in 2019, an 11 percent increase.
However, it has decreased slightly in the past year. (Unless otherwise
indicated, this report uses population data from the California Department of
Finance and demographic data from the U.S. Census Bureau. In some cases
we have presented per capita data in order to adjust for population growth.)
THE CITY'S RESIDENTS ARE DIVERSE
The City of San José serves an ethnically diverse population. The
demographics of San José are important because they influence the type of
services the City provides and residents demand. It can also influence how
services are provided (e.g., providing programming in other languages).
MANY RESIDENTS ARE FOREIGN BORN
Despite
residents
slight
of
residents
The
English
report
proportion
same
Ethnic Breakdown of San José Residents
0 5,000 10,000 15,000 20,000
San Francisco
Los Angeles
Oakland
SAN JOSE
San Diego
Population per Square Mile
San Francisco
0% 10% 20% 30% 40% 50% 60% 70% 80% 90% 100%
San José
Los Angeles
Oakland
San Diego
San Francisco
Population by Ethnicity
Asian Hispanic or Latino Non-Hispanic White Black Other
1,043,058
500,000
600,000
700,000
800,000
900,000
1,000,000
1,100,000
San José's Population Growth
THE MEDIAN AGE IS SLIGHTLY LOWER THAN THE UNITED
STATES' GENERALLY
The
than
According
registered
(November
Source: California Department of Finance population estimates and U.S. Census Bureau land area estimates (2010)
Source: U.S. Census Bureau, American Community Survey, 2019 1-year estimates (Table DP05)Source: U.S. Census Bureau, American Community Survey, 2019 1-year estimates (Table DP05)
Asian
Hispanic or
Latino
Non-Hispanic
White
Black Other
Vietnamese
ChineseIndian
Filipino
Other
Asian
10 City of San José – Annual Report on City Services 2018-19

INTRODUCTION
MANY RESIDENTS ARE FOREIGN BORN
Despite the overall growth in population, the proportion of foreign born
residents is about the same as it was ten years ago—though there has been a
slight demographic shift within the foreign born population. The percentage
of residents born in Asia has increased slightly, while the percentage of
residents born in Latin America has decreased.
The proportion of the City's residents that speak a language other than
English at home has increased in the past ten years, though the number that
report they speak English less than “very well” is about the same. The
proportion of the City’s residents who are not U.S. citizens is also about the
same as it was a decade ago.
North
America AfricaEurope
Latin
America
Asia
Foreign Born Population by Region
Characteristics of San José Residents
Only speak English at home
Speak English at least "very well"
Born in the United States
Speak another language at home
Do not
Foreign-born
0% 10% 20% 30% 40% 50% 60% 70% 80% 90% 100%
English only
Asian or
Pacific
Islander
Language
Spanish
Other Indo-
European
Language
Other
Language
Languages Spoken at Home
0%
5%
10%
15%
20%
25%
under
5 years
5-19
years
20-34
years
35-44
years
45-54
years
55-64
years
65-74
years
75 or
more
years
San José Resident Age
2009
2018
30 32 34 36 38 40
San Francisco
SAN JOSE
Oakland
Los Angeles
San Diego
Median Age of Residents
THE MEDIAN AGE IS SLIGHTLY LOWER THAN THE UNITED
STATES' GENERALLY
The City’s population has a median age of 37 years. This is 1.2 years younger
than the median age of the U.S. population. Ten years ago, it was 35 years.
According to the County Registrar, approximately 71 percent of the 886,000
registered voters in Santa Clara County voted in the last midterm election
(November 2018).
Source: U.S. Census Bureau, American Community Survey, 2019 1-year estimates (Table DP02)
Source: U.S. Census Bureau, American Community Survey, 2019 1-year estimates (Table DP02)
Source: U.S. Census Bureau, American Community Survey, 2019 1-year estimates (Table DP05)
11City of San José – Annual Report on City Services 2018-19
INTRODUCTION
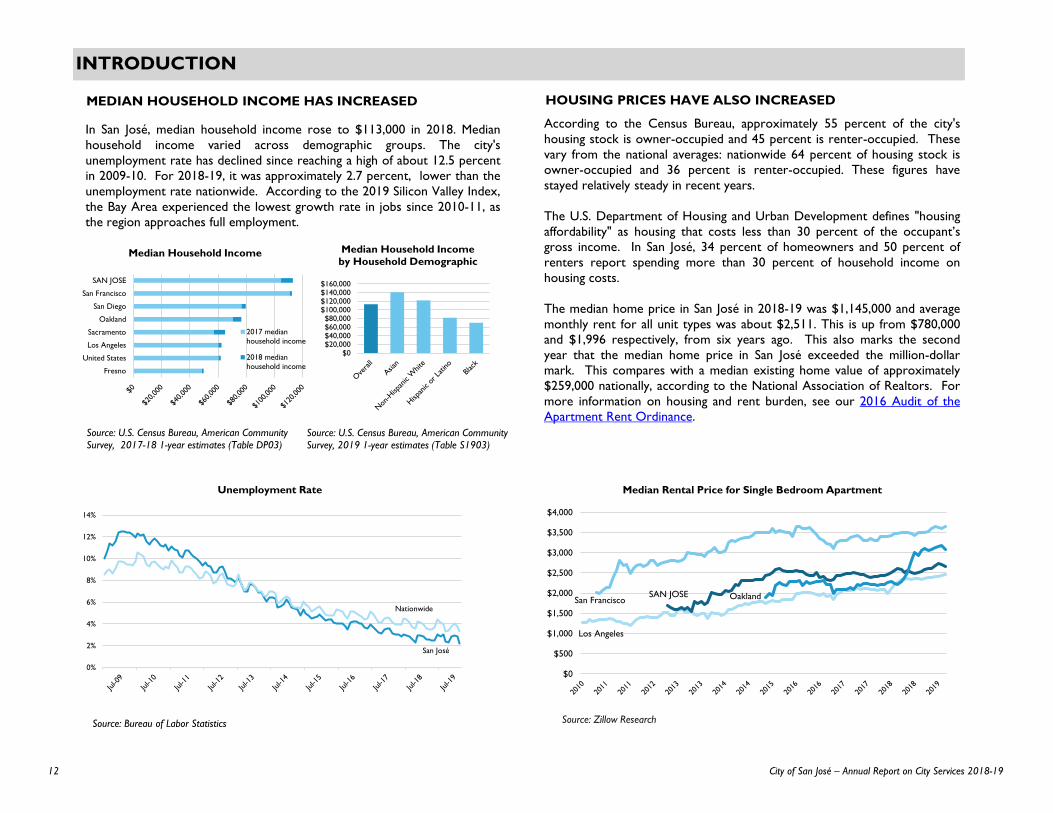
MEDIAN HOUSEHOLD INCOME HAS INCREASED
In San José, median household income rose to $113,000 in 2018. Median
household income varied across demographic groups. The city's
unemployment rate has declined since reaching a high of about 12.5 percent
in 2009-10. For 2018-19, it was approximately 2.7 percent, lower than the
unemployment rate nationwide. According to the 2019 Silicon Valley Index,
the Bay Area experienced the lowest growth rate in jobs since 2010-11, as
the region approaches full employment.
HOUSING PRICES HAVE ALSO INCREASED
According to the Census Bureau, approximately 55 percent of the city's
housing stock is owner-occupied and 45 percent is renter-occupied. These
vary from the national averages: nationwide 64 percent of housing stock is
owner-occupied and 36 percent is renter-occupied. These figures have
stayed relatively steady in recent years.
The U.S. Department of Housing and Urban Development defines "housing
affordability" as housing that costs less than 30 percent of the occupant’s
gross income. In San José, 34 percent of homeowners and 50 percent of
renters report spending more than 30 percent of household income on
housing costs.
The median home price in San José in 2018-19 was $1,145,000 and average
monthly rent for all unit types was about $2,511. This is up from $780,000
and $1,996 respectively, from six years ago. This also marks the second
year that the median home price in San José exceeded the million-dollar
mark. This compares with a median existing home value of approximately
$259,000 nationally, according to the National Association of Realtors. For
more information on housing and rent burden, see our 2016 Audit of the
Apartment Rent Ordinance.
DESPITE HIGH MEDIAN INCOMES, MANY RESIDENTS MAY
EXPERIENCE ECONOMIC DISTRESS
Source: Zillow Research
$0$20,000$40,000$60,000$80,000
$100,000$120,000$140,000$160,000
Median Household Income by Household Demographic
Source: U.S. Census Bureau, American Community Survey, 2019 1-year estimates (Table S1903)
Source: Bureau of Labor Statistics
San José
Nationwide
0%
2%
4%
6%
8%
10%
12%
14%
Unemployment Rate
Source: U.S. Census Bureau, American Community Survey, 2017-18 1-year estimates (Table DP03)
Fresno
United States
Los Angeles
Sacramento
Oakland
San Diego
San Francisco
SAN JOSE
Median Household Income
2017 median
household income
2018 median
household income
The
percent
17
assistance
estimated
percent)
transitional
as
Despite
percent
would
about
chapter
Los Angeles
SAN JOSESan Francisco Oakland
$0
$500
$1,000
$1,500
$2,000
$2,500
$3,000
$3,500
$4,000
Median Rental Price for Single Bedroom Apartment
12 City of San José – Annual Report on City Services 2018-19

INTRODUCTION
city's
These
is
have
"housing
occupant’s
of
on
average
000
second
dollar
approximately
For
the
DESPITE HIGH MEDIAN INCOMES, MANY RESIDENTS MAY
EXPERIENCE ECONOMIC DISTRESS SCOPE & METHODOLOGY
The
Auditor’s
accordance
standards
appropriate
conclusions
obtained
on
The
City
fully
Auditor’s
reviewed
researched
audit
computer
absolute
intent
presented
SELECTION OF INDICATORS
This
reviewed
budget
Map of Median Household Income
Source: U.S. Census Bureau, American Community Survey, 2017 5-year estimates (Table S1903).
According to the Living Wage Calculator, a living wage in the San José metropolitan area for a single,working adult was $38,500 in 2018. This represents estimated minimum expenses for a single adult for
a year, including food, housing, and transportation. It does not include savings for retirement orpurchasing a home, for example. For a family of four in San José, with two children and two workingadults, the living wage calculation was nearly $92,000 in household income, or $46,000 for each adult.
In 2018, a full-time, minimum-wage employee in San José would have earned just over $28,000 a year.
(In January 2019, the minimum wage increased to $15.00 per hour, or just over $31,000 a year.)
$0
$20,000
$40,000
$60,000
$80,000
$100,000
$120,000
1 Adult 1 Adult1 Child
2 Adults(1 working)
2 Adults(1 working)
1 Child
2 Adults 2 Adults1 Child
2 Adults2 Children
2 Adults3 Children
Estimated Minimum Annual Living Expenses inSan José - Sunnyvale - Santa Clara Metropolitan Area (2018)
Annual taxes
Other
Transportation
Housing
Medical
Child Care
Food
San José minimum
wage earnings (2019)
San José minimum
wage earnings (2018)
Source: U.S. Census Bureau, American Community Survey, 2018 1-year estimates (Table S1701)
0%
2%
4%
6%
8%
10%
12%
Poverty Rates by Demographic
The cost of living in San José is among the highest in the country. About 15
percent of households earned less than $35,000 in income and benefits, and
17 percent of the population received supplemental income or public
assistance. The city's overall poverty rate in 2018 was 8.3 percent. An
estimated 6,097 residents are homeless, and of these, around 5,117 (84
percent) are unsheltered—that is, not in an emergency shelter or
transitional housing (for more information, see the Housing chapter, as well
as our 2018 Audit of Homelessness Assistance Services).
Despite high median household income and low unemployment, only 22
percent of respondents in the resident survey thought that the economy
would have a positive impact on their income over the next six months—
about ten percentage points lower than last year. (See the Resident Survey
chapter and Economic Development chapter for more information.)
13City of San José – Annual Report on City Services 2018-19
INTRODUCTION
SCOPE & METHODOLOGY
The City Auditor’s Office prepared this report in accordance with the City
Auditor’s FY 2019-20 Work Plan. We conducted this performance audit in
accordance with generally accepted government auditing standards. Those
standards require that we plan and perform the audit to obtain sufficient,
appropriate evidence to provide a reasonable basis for our findings and
conclusions based on our audit objectives. We believe that the evidence
obtained provides a reasonable basis for our findings and conclusions based
on our audit objectives.
The workload and performance results that are outlined here reflect current
City operations. The report is intended to be informational and does not
fully analyze performance results. The independent auditors in the City
Auditor’s Office compiled and reviewed departmental performance data. We
reviewed information for reasonableness and consistency. We questioned or
researched data that needed additional explanation. We did not, however,
audit the accuracy of source documents or the reliability of the data in
computer-based systems. Our review of data was not intended to give
absolute assurance that all information was free from error. Rather, our
intent was to provide reasonable assurance that the reported information
presented a fair picture of the City’s performance.
SELECTION OF INDICATORS
This report relies on existing performance measures, most of which are
reviewed yearly by Council, staff, and interested residents during the annual
budget process. It also relies on existing benchmarking data.
We used audited information from the City’s Comprehensive Annual
Financial Reports (CAFRs). We cited mission statements, performance
targets, performance outcomes, workload outputs, and budget information
from the City’s annual operating budget. We held numerous discussions with
City staff to determine which performance information was most useful and
reliable to include in this report. Where possible, we included ten years or
more of historical data. We strove to maintain consistency with prior years’
reports by including most of the same performance indicators; however, due
to issues such as reporting and program updates, some indicators have
changed.
We welcome input from City Council, City staff, and the public on how to
improve this report in future years. Please contact us with suggestions at
COMPARISONS TO OTHER CITIES
Where possible and relevant, we have included benchmark comparisons to
other cities (usually other large California cities, the state, or the nation). It
should be noted that we took care to ensure that performance data
comparisons with other cities compare like with like; however, other cities
rarely provide exactly the same programs or measure data with exactly the
same methodology.
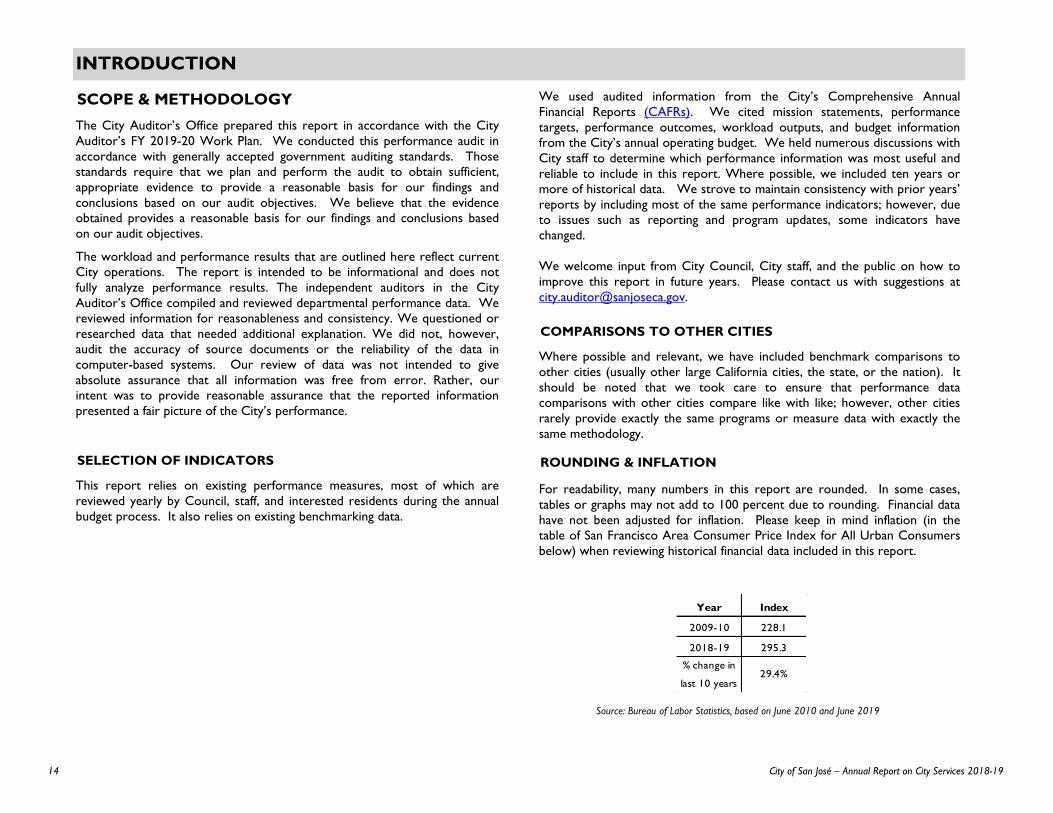
ROUNDING & INFLATION
For readability, many numbers in this report are rounded. In some cases,
tables or graphs may not add to 100 percent due to rounding. Financial data
have not been adjusted for inflation. Please keep in mind inflation (in the
table of San Francisco Area Consumer Price Index for All Urban Consumers
below) when reviewing historical financial data included in this report.
Source: Bureau of Labor Statistics, based on June 2010 and June 2019
Year Index
2009-10 228.1
2018-19 295.3
% change in
last 10 years29.4%
14 City of San José – Annual Report on City Services 2018-19

RESIDENT SURVEY
Resident perceptions about Quality of Life and City Services in San José
15City of San José – Annual Report on City Services 2018-19

RESIDENT SURVEY
How residents rate their overall quality of life is an indicator of the overallhealth of a community. This can include opinions about a community’s naturaland built environments; the availability of services and amenities; overallfeelings about safety or the economic health of the community; and otheraspects of life.
Several aspects of community quality were rated highly by survey respondents,including shopping opportunities and opportunities to volunteer. Most ratingsfrom 2019 are similar compared to those from 2018. Positive results onoverall image or reputation increased from 32 percent to 36 percent in thepast year. The availability of affordable housing and the cost of living remainthe lowest rated community characteristics. Three in four respondents saidcost of living is "poor."
2019 marked San José’s ninth year of participation in The National CommunitySurvey™ (referred to throughout this report as the resident survey). TheNational Community Survey™ is a collaborative effort between NationalResearch Center, Inc. (NRC) and the International City/County ManagementAssociation (ICMA). The survey was developed by NRC to provide astatistically valid sampling of resident opinions about their community andservices provided by local government. Survey results in this chapter and inthe following chapters provide the opinions of 4,388 residents of the City whoresponded to either a mail or online survey.
Complete survey results are posted online at sanjoseca.gov/servicesreport.The end of this chapter provides more specific information about the surveymethodology.
QUALITY OF LIFE IN SAN JOSÉ
Overall quality of life
43%
Plan to remain in San José
64%Would recommend San José as a place to live
44%
0%
10%
20%
30%
40%
50%
60%
70%
80%
90%
100%
Quality of Life Indicators
San José's overall image/reputation, 36%
Place to live, 53%Place to raise children, 44%
Place to retire, 13%
Place to visit, 36%
Place to work, 64%
% of Respondents Rating San Joséas "Excellent" or "Good"
100% 80% 60% 40% 20% 0% 20% 40% 60% 80% 100%
Cost of living in San José
Availability of affordable quality housing
Traffic flow on major streets
Ease of travel by public transportation in San José
Variety of housing options
Cleanliness of San José
Availability of affordable quality child care/preschool
Availability of affordable quality mental health care
Ease of public parking
Overall appearance of San José
Vibrant downtown/commercial area
Ease of travel by car in San José
Public places where people want to spend time
Ease of travel by bicycle in San José
Neighborliness of residents in San José
Overall quality of new development in San José
Air quality
K-12 education
Ease of walking in San José
Availability of affordable quality health care
Availability of paths and walking trails
Availability of preventive health services
Adult educational opportunities
Availability of affordable quality food
Recreational opportunities
Opportunities to participate in social events
Fitness opportunities (classes, trails, etc.)
Overall quality of business establishments
Opportunities to see cultural/arts/music activities
Opportunities for community participation
Openness and acceptance of the community
Employment opportunities
Opportunities to participate in spiritual events
Opportunities to volunteer
Shopping opportunities
Poor/Fair Good/Excellent
Ratings of Community Characteristics
16 City of San José – Annual Report on City Services 2018-19
RESIDENT SURVEY
100% 80% 60% 40% 20% 0% 20% 40% 60% 80% 100%
Code enforcement (weeds, abandoned buildings, etc.)
Street repair
Crime prevention
Gang prevention efforts
Land use, planning and zoning
Building permit services
Traffic enforcement
Street tree maintenance
Street cleaning
Sidewalk maintenance
Graffiti removal
Services to low-income people
Bus or transit services
Traffic signal timing
Cable television
Economic development
Preservation of natural areas (open space)
Emergency preparedness services
Services to youth
Police services
Services to seniors
Street lighting
Utility billing
Public information services
Overall customer service by San José employees
Animal control
Power (electric and/or gas) utility
Drinking water
Fire prevention and education
Storm drainage
Recreation centers or facilities
City parks
Recreation programs or classes
Sewer services
Recycling
Availability of flights at San José International Airport
Yard waste pick-up
Garbage collection
Ambulance or emergency medical services
Overall ease of using San José International Airport
Public library services
Fire services
Poor/Fair Good/Excellent
Quality of Government ServicesCITYWIDE QUALITY OF SERVICES
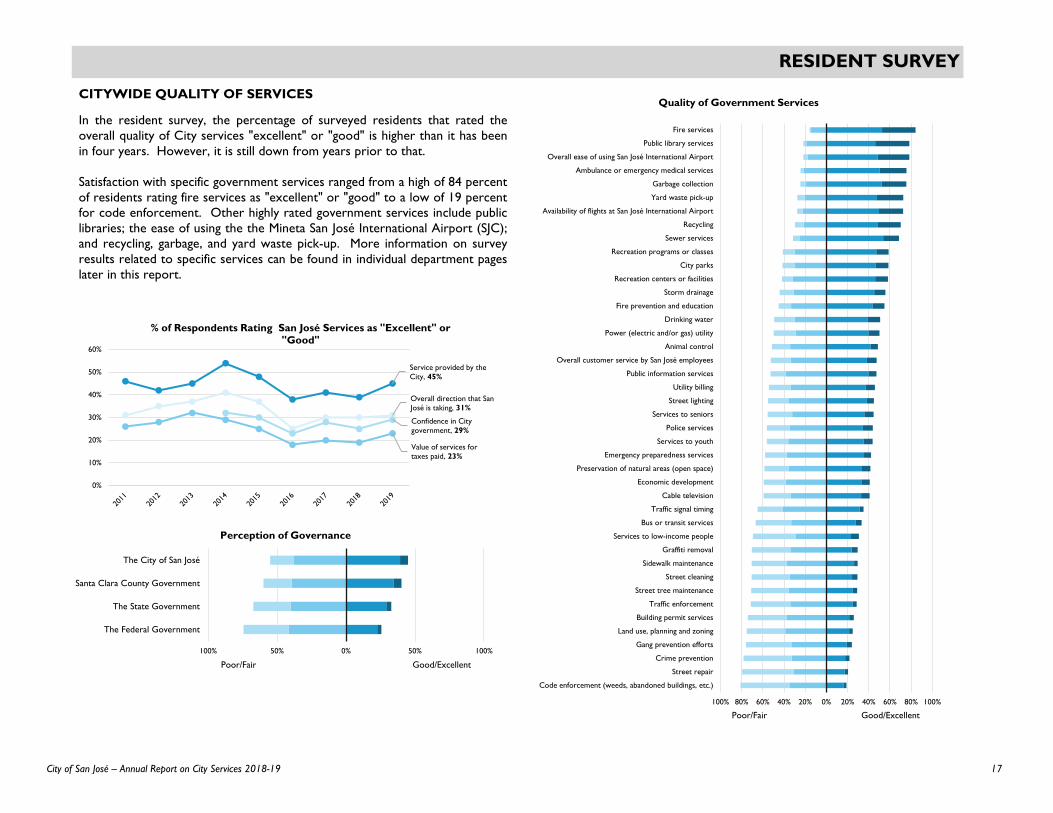
In the resident survey, the percentage of surveyed residents that rated theoverall quality of City services "excellent" or "good" is higher than it has beenin four years. However, it is still down from years prior to that.
Satisfaction with specific government services ranged from a high of 84 percentof residents rating fire services as "excellent" or "good" to a low of 19 percentfor code enforcement. Other highly rated government services include publiclibraries; the ease of using the the Mineta San José International Airport (SJC);and recycling, garbage, and yard waste pick-up. More information on surveyresults related to specific services can be found in individual department pageslater in this report.
Service provided by the City, 45%
Overall direction that San José is taking, 31%
Confidence in City government, 29%
Value of services for taxes paid, 23%
0%
10%
20%
30%
40%
50%
60%
% of Respondents Rating San José Services as "Excellent" or "Good"
100% 50% 0% 50% 100%
The Federal Government
The State Government
Santa Clara County Government
The City of San José
Poor/Fair Good/Excellent
Perception of Governance
17City of San José – Annual Report on City Services 2018-19
RESIDENT SURVEY
Voted in local elections, 85%
Attended a local public meeting, 27%
Campaigned for an issue, cause, or candidate, 30%
0%
10%
20%
30%
40%
50%
60%
70%
80%
90%
100%
Public Participation in San José
0% 25% 50% 75% 100%
Overall built environment (buildings, design, etc.)
Health and wellness opportunities
Sense of community
Opportunities for education and enrichment
Quality of overall natural environment
Overall ease of travel
Overall economic health
Overall feeling of safety
Resident Priorities in San José
Essential Very important
100% 50% 0% 50% 100%
Overall confidence
Overall direction
Acting in the best interest of the community
Treating all residents fairly
Welcoming resident involvement
Being honest
Poor/Fair Good/Excellent
Public Trust and Confidence in City Government
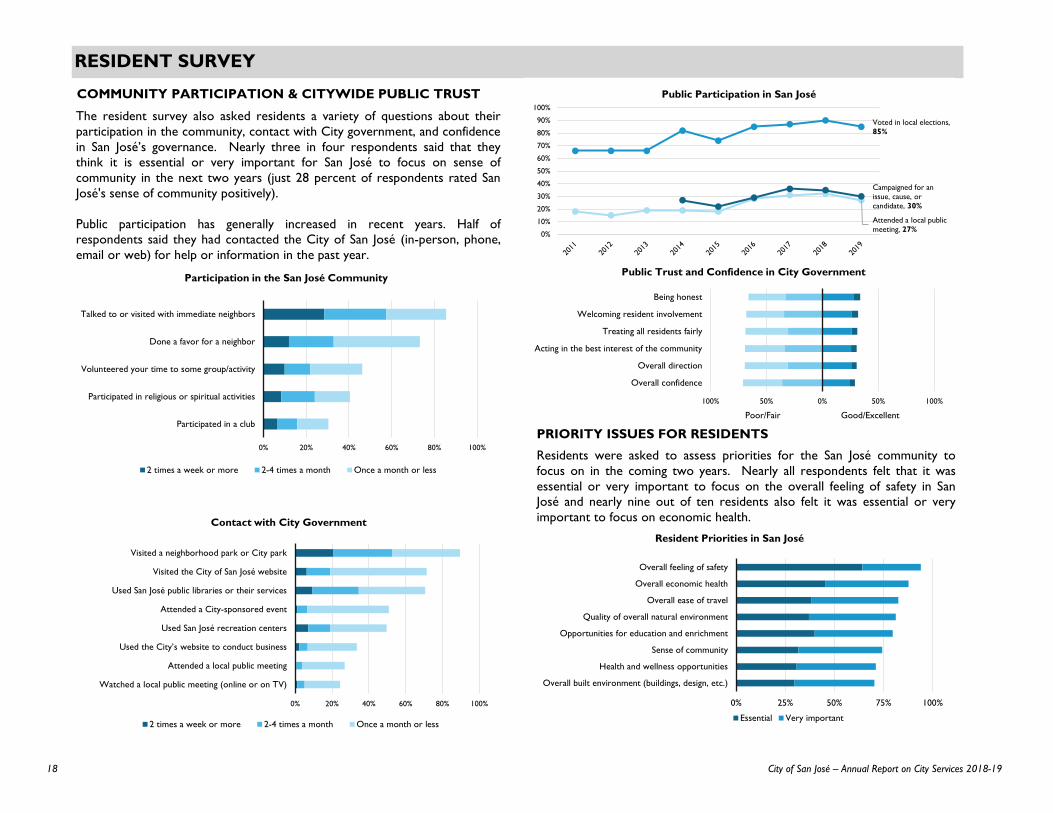
PRIORITY ISSUES FOR RESIDENTS
Residents were asked to assess priorities for the San José community tofocus on in the coming two years. Nearly all respondents felt that it wasessential or very important to focus on the overall feeling of safety in SanJosé and nearly nine out of ten residents also felt it was essential or veryimportant to focus on economic health.
0% 20% 40% 60% 80% 100%
Watched a local public meeting (online or on TV)
Attended a local public meeting
Used the City’s website to conduct business
Used San José recreation centers
Attended a City-sponsored event
Used San José public libraries or their services
Visited the City of San José website
Visited a neighborhood park or City park
Contact with City Government
2 times a week or more 2-4 times a month Once a month or less
COMMUNITY PARTICIPATION & CITYWIDE PUBLIC TRUST
The resident survey also asked residents a variety of questions about theirparticipation in the community, contact with City government, and confidencein San José’s governance. Nearly three in four respondents said that theythink it is essential or very important for San José to focus on sense ofcommunity in the next two years (just 28 percent of respondents rated SanJosé's sense of community positively).
Public participation has generally increased in recent years. Half ofrespondents said they had contacted the City of San José (in-person, phone,email or web) for help or information in the past year.
0% 20% 40% 60% 80% 100%
Participated in a club
Participated in religious or spiritual activities
Volunteered your time to some group/activity
Done a favor for a neighbor
Talked to or visited with immediate neighbors
Participation in the San José Community
2 times a week or more 2-4 times a month Once a month or less
18 City of San José – Annual Report on City Services 2018-19

RESIDENT SURVEY
SAN JOSE STATE UNIVERSITY
2019 marked the first year that San Jose State University (SJSU) participatedin the resident survey. The university sent a shortened version of theresident survey to students, faculty, and staff to complete online. (See surveymethodology section for more details.) The SJSU survey was administeredby NRC, same as the citywide survey. Nearly 700 students, faculty, and staffresponded to the survey. Around three-quarters of respondents live in SanJosé.
On many measures, SJSU responses and citywide responses were similar. Asshown above, SJSU respondents and citywide respondents similarly rated theoverall quality of life and the city as a place to work. Citywide respondentsgave the city higher ratings as a place to live. Seventy-one percent of SJSUrespondents said that they were likely to recommend studying in San José tosomeone who asks.
Additional characteristics were rated similarly across the survey groups. Forexample, ratings for cleanliness, appearance, public places where people wantto spend time, sense of community, economic health, and overall reputationwere similar. In some other cases, responses varied significantly. Citywiderespondents rated shopping and employment opportunities higher than SJSUrespondents. SJSU respondents rated the quality of new development,vibrancy of downtown, and opportunities to attend cultural activities higherthan citywide respondents.
Though not all SJSU respondents live in San José, they all use City services,such as roads and parking. SJSU and citywide responses varied significantly inthe ease of different modes of travel, as shown below. Generally, SJSUrespondents rated alternatives to driving higher than citywide respondents.Forty-six percent of SJSU respondents rated the overall ease of getting toand from the university as "excellent" or "good."
citywide
SJSU
citywide
SJSU
citywide
SJSU
100% 80% 60% 40% 20% 0% 20% 40% 60% 80% 100%
San José as a place to live*
San José as a place to work
The overall quality of life in San José
Poor/Fair Good/Excellent
Quality of Life Comparison
SHARED PRIORITIES FOR THE CITYRespondents in both surveys rated the overall feeling of safety, economichealth, and ease of travel as three top priorities that were "essential" or"very important" to focus on in the coming two years.
0%
10%
20%
30%
40%
50%
60%
Traffic flow* Ease of travel bypublic
transporation*
Ease of publicparking*
Ease of travel bycar*
Ease of travel bybicycle*
Ease of walking*
Rate
d "e
xcel
lent
" or
"goo
d"
Ease of Travel in San José
Citywide SJSU
0% 25% 50% 75% 100%
Sense of community*
Health and wellness opportunities
Overall built environment (buildings, design, etc.)
Quality of overall natural environment
Opportunities for education and enrichment*
Overall ease of travel*
Overall economic health
Overall feeling of safety
SJSU Priorities in San José
Essential Very important
* Statistically significant differences are indicated with an asterisk.
* Statistically significant differences are indicated with an asterisk.
* Statistically significant differences are indicated with an asterisk.
19City of San José – Annual Report on City Services 2018-19

RESIDENT SURVEYSURVEY METHODOLOGY
The survey data presented in this report was collected and analyzed by theNational Research Center, Inc. on behalf of the the City Auditor's Office.
The survey consultant mailed surveys to a statistically valid sample of 3,000 SanJosé households starting in August 2019. They also sent postcards to anadditional 1,000 random households inviting residents to complete the surveyonline. (Seventy-seven, or about 2 percent, of mailings were returned tosender.) Completed surveys were received from 601 residents, for a responserate of 15 percent.
The consultant selected survey respondents at random and tracked surveyresponses by each quadrant of the City (Northeast, Southeast, Northwest,Southwest). Participation was encouraged with multiple mailings; self-addressed,postage-paid envelopes; and three language choices—English, Spanish, andVietnamese. Of the 601 completed surveys, 587 were completed in English, 11in Spanish, and three in Vietnamese. The survey consultant statistically re-weighted results, as necessary, to reflect the actual demographic composition ofthe entire community.
An additional 3,760 residents completed an online “opt-in” survey, which waspublicized through a press release, social media, and flyers in City facilities,including libraries and community centers, all of which were translated intoSpanish and Vietnamese. A link to the survey was also posted on the City'swebsite and multilingual flyers were distributed to community groups. Thesurvey consultant has protocols to review the integrity of "opt-in" surveyresponses, such as checking for repeat IP addresses.
Upon completion of data collection of both the mail and “opt-in” surveys, thesurvey consultant compared data from the two samples to determine whether itwas appropriate to combine, or blend, both samples together. Based on thesimilarity of the mail and “opt-in” sample characteristics, the survey consultantdetermined that the two samples could be blended.
To blend the data, the consultant weighted “opt-in” survey data using acalibration technique that takes into consideration behavioral characteristics ofthe sample, as well as demographic data. This calibration technique reduces thedifferences that may occur between the mail and “opt-in” samples by using themail results to inform the weighting scheme of the “opt-in” sample.
To do this, the survey consultant calculated an index score based onrespondents' levels of engagement in the community (e.g., contact with Cityemployees, recreation center use, frequency of volunteering). They thencategorized index scores into four equal groups and used the “norms” for thecategorized index scores from the random mail sample as part of theweighting scheme for the “opt-in” sample.
The precision of estimates made from surveys are usually described by a“level of confidence” and accompanying “confidence interval” (or margin oferror). A traditional level of confidence, and the one used here, is 95percent. The margin of error around results for this survey is plus or minustwo percentage points. With this margin of error, one may conclude thatwhen 60 percent of survey respondents report that a particular service is“excellent” or “good,” somewhere between 58 to 62 percent of all residentsare likely to feel that way. Differences between 2018 and 2019 results can beconsidered statistically significant if they are plus or minus six percentagepoints.
More opt-in survey responses were received this year than in past years,attributable in part to expanded outreach efforts for the 2019 survey. As anote, responses on some questions may have increased due to theparticipation of City departments (e.g., Library and Parks, Recreation andNeighborhood Services) in promoting the survey. This may representsampling differences and should be considered within the context of otherperformance measures.
For complete methodology, see Appendix C of the Technical Appendices,posted online at sanjoseca.gov/servicesreport.
In addition, for the first time this year, the City Auditor's Office worked withthe Knight Foundation and San Jose State University to implement a parallelsurvey of university students and faculty. This survey used a slightlyabbreviated version of the City's survey and substituted "campus" for"neighborhood" where appropriate (e.g., "rate how safe you feel on campusduring the day"). The university encouraged participation with a messagefrom the president. Responses were submitted online by 694 students,faculty, and staff. The consultant used statistical tests to determine whetherresponses from SJSU varied significantly from citywide responses within a 95percent confidence level.
20 City of San José – Annual Report on City Services 2018-19
FINANCIAL CONDITION
Financial condition is the measure of how healthy a city’s finances are
at a particular point in time.
Unless otherwise noted, information in this chapter is from the City’s audited
Comprehensive Annual Financial Report (CAFR). Other chapters use adopted
budget information. The CAFR differs from the City’s annual Adopted Operating
Budget in the timing and treatment of some revenues and expenditures.
In February 2016, this Office published our first report on financial condition.
This chapter builds on those efforts by providing both background information
about the City’s finances and measures of financial condition. See this chapter’s
endnotes for definitions and links to the City’s numerous financial documents.
For more information, see Measuring San José’s Financial Condition.
WHAT MAKES UP THE CITY GOVERNMENT?
Most
activity
at
José
These
Fund
Many
support
the
airlines
21City of San José – Annual Report on City Services 2018-19
FINANCIAL CONDITION
WHAT IS FINANCIAL CONDITION?
Financial condition is the measure of how healthy a city’s finances are at a
particular point in time. A city is considered financially healthy if it can deliver
the services its residents expect with the resources its residents provide, both
now and in the future. A city that is financially healthy is prepared to respond
to residents’ needs as they change over time or when unforeseen events arise,
while laying the groundwork for long-term projects that will impact services
many years down the line.
Cities in poor financial condition are not able to provide the services that
residents want, either now or in the future. They’re more susceptible to
economic downturns—requiring cutbacks in services and maintenance—and
they may have difficulty recovering from financial setbacks.
WHAT MAKES UP THE CITY GOVERNMENT?
Most of what the City government does is considered to be a governmental
activity, meaning that the programs and departments are funded by the public
at large and can be used by everyone who lives in, works in, or travels to San
José. This includes police, fire, libraries, roads, parks, and code enforcement.
These governmental activities are primarily funded through the City’s General
Fund (the City’s primary, unrestricted operating fund).
Many cities operate programs that don’t receive general tax revenue to
support their operations. These are called business-type activities. For example,
the Mineta San José International Airport is supported through fees from
airlines and passengers and rent from concessionaires. Interest,
Investment
Earnings,
and Other
6%
Sales Taxes
15%
License
Fees and
Lodging
Taxes
7%
Grants
12%
Property
Taxes
27%
Fines, Fees,
Utilities, and
User Charges
33%
2018-19Interest,
Investment
Earnings,
and Other
4%
Sales Taxes
9%License
Fees and
Lodging
Taxes
4%
Grants
12%
Property
Taxes
38%
Fines, Fees,
Utilities, and User
Charges
33%
2009-10
$0
$500
$1,000
$1,500
$2,000
Total City Revenues ($millions)
Governmental Activities
Business-Type Activities
$0
$50
$100
$150
$200
$250
$300
Business-Type Revenues by Source ($millions)
Wastewater
Airport
Muni Water
Parking
System
Clean Energy
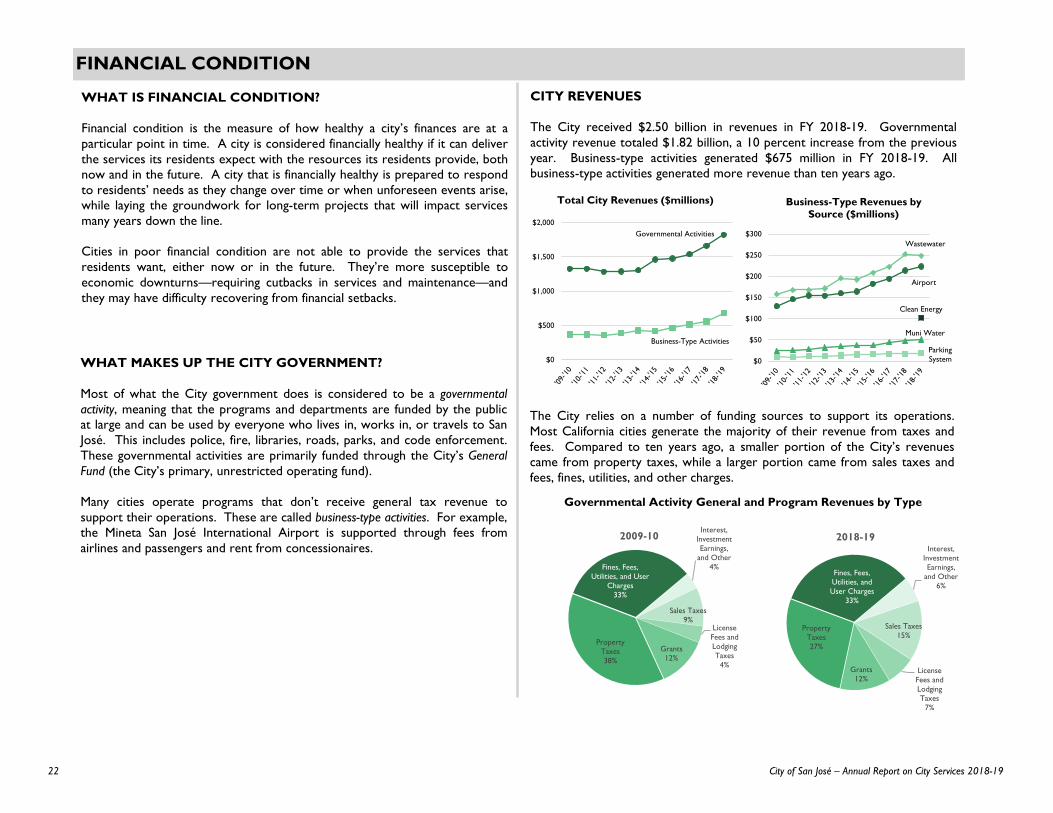
CITY REVENUES
The City received $2.50 billion in revenues in FY 2018-19. Governmental
activity revenue totaled $1.82 billion, a 10 percent increase from the previous
year. Business-type activities generated $675 million in FY 2018-19. All
business-type activities generated more revenue than ten years ago.
The City relies on a number of funding sources to support its operations.
Most California cities generate the majority of their revenue from taxes and
fees. Compared to ten years ago, a smaller portion of the City’s revenues
came from property taxes, while a larger portion came from sales taxes and
fees, fines, utilities, and other charges.
Governmental Activity General and Program Revenues by Type
22 City of San José – Annual Report on City Services 2018-19
FINANCIAL CONDITION
Investment
Governmental
previous
All
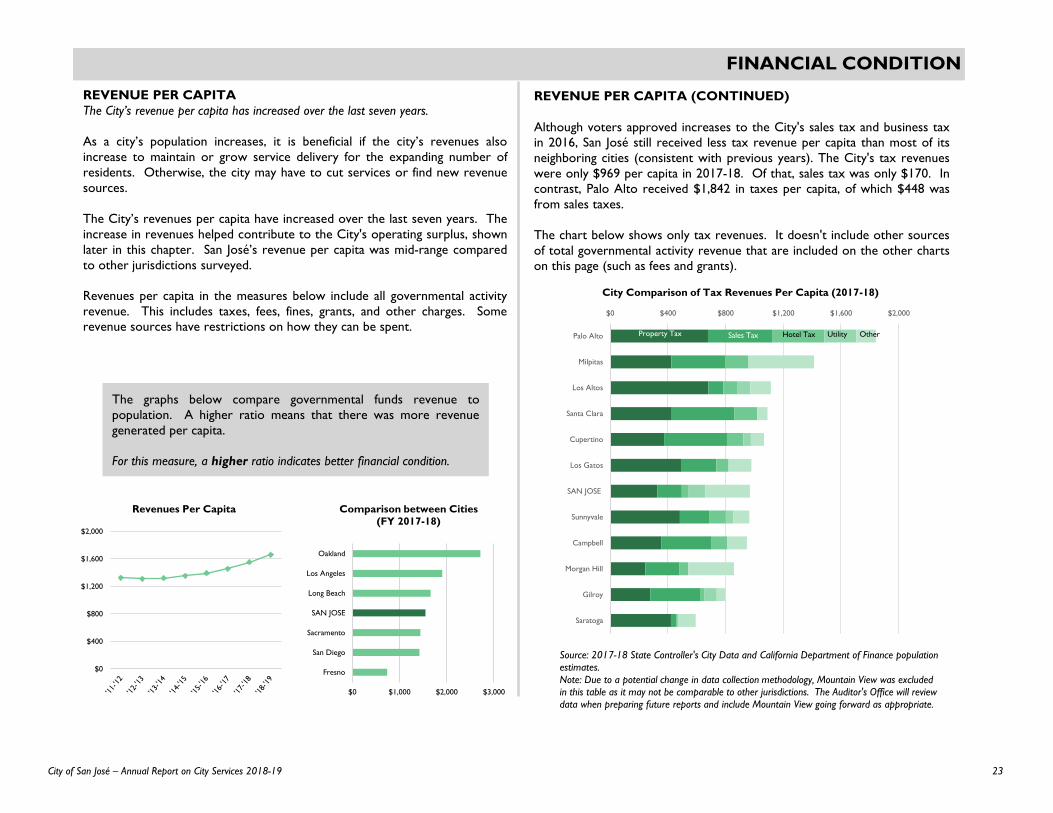
REVENUE PER CAPITA (CONTINUED)
Although voters approved increases to the City's sales tax and business tax
in 2016, San José still received less tax revenue per capita than most of its
neighboring cities (consistent with previous years). The City's tax revenues
were only $969 per capita in 2017-18. Of that, sales tax was only $170. In
contrast, Palo Alto received $1,842 in taxes per capita, of which $448 was
from sales taxes.
The chart below shows only tax revenues. It doesn't include other sources
of total governmental activity revenue that are included on the other charts
on this page (such as fees and grants).
REVENUE PER CAPITA
The City’s revenue per capita has increased over the last seven years.
As a city’s population increases, it is beneficial if the city’s revenues also
increase to maintain or grow service delivery for the expanding number of
residents. Otherwise, the city may have to cut services or find new revenue
sources.
The City’s revenues per capita have increased over the last seven years. The
increase in revenues helped contribute to the City's operating surplus, shown
later in this chapter. San José’s revenue per capita was mid-range compared
to other jurisdictions surveyed.
Revenues per capita in the measures below include all governmental activity
revenue. This includes taxes, fees, fines, grants, and other charges. Some
revenue sources have restrictions on how they can be spent.
The graphs below compare governmental funds revenue to
population. A higher ratio means that there was more revenue
generated per capita.
For this measure, a higher ratio indicates better financial condition.
$0 $1,000 $2,000 $3,000
Fresno
San Diego
Sacramento
SAN JOSE
Long Beach
Los Angeles
Oakland
Comparison between Cities(FY 2017-18)
$0
$400
$800
$1,200
$1,600
$2,000
Revenues Per Capita
Source: 2017-18 State Controller's City Data and California Department of Finance population estimates.
Note: Due to a potential change in data collection methodology, Mountain View was excluded in this table as it may not be comparable to other jurisdictions. The Auditor's Office will review data when preparing future reports and include Mountain View going forward as appropriate.
$0 $400 $800 $1,200 $1,600 $2,000
Saratoga
Gilroy
Morgan Hill
Campbell
Sunnyvale
SAN JOSE
Los Gatos
Cupertino
Santa Clara
Los Altos
Milpitas
Palo Alto
City Comparison of Tax Revenues Per Capita (2017-18)
Sales TaxProperty Tax Hotel Tax Utility Other
23City of San José – Annual Report on City Services 2018-19

FINANCIAL CONDITION
$0
$500
$1,000
$1,500
$2,000
$2,500
Total City Expenses ($millions)
Governmental Activities
Business-Type Activities
$0
$50
$100
$150
$200
$250
Business-Type Expenses by Source ($millions)
Wastewater
Airport
Muni
Water
Parking
System
Clean Energy
CITY EXPENSES
The City’s total expenses decreased in 2018-19 to $2.38 billion, compared to
a ten-year high of $2.42 billion last year. Governmental activity expenditures,
75 percent of the total, decreased by 8 percent from last year. Expenses from
business-type activities have steadily increased over the last ten years.
These expenses include non-cash expenses such as depreciation (see “City
Capital Assets and Spending” later in this chapter). Revenue sources are often
restricted in how they can be spent. As a result, reducing expenses for one
service does not necessarily mean that expenses can be increased for another
service, because the revenue may not be transferable.
In 2018-19, the reduction in expenditures included a decrease in the liability
for net other post-employment benefits (OPEB). This reduction was due to
the implementation of a new voluntary benefit program (VEBA) for employees
as well as changes in actuarial assumptions. In prior years, expenditure growth
included public safety personnel and equipment costs, higher debt service
payments, expanded service delivery, and increased capital outlay and capital
maintenance expenditures.
EXPENDITURES PER CAPITA
The City’s expenditures per capita have decreased over the last year.
As a city adapts its service delivery over time and as its population changes,
the amount of money expended per capita can shift. If the expenditures
increase compared to population, it may indicate that new services were
added, or that service delivery has become more expensive or less efficient.
After four years of increasing governmental funds expenditures per capita, the
City’s expenditures per capita decreased in 2018-19. The decrease in
expenditures helped contribute to the City's operating surplus, shown later in
this chapter.
San José's expenditures per capita were mid-range compared to other
surveyed jurisdictions. The level and types of service offered may vary
between cities.
The graphs below compare governmental funds expenditures to
population. A lower ratio means that there were fewer
expenditures per capita.
For this measure, a lower ratio indicates a potentially lower level of
service provided to residents.
$0 $1,000 $2,000 $3,000
Fresno
Sacramento
San Diego
SAN JOSE
Long Beach
Los Angeles
Oakland
Comparison between Cities
(FY 2017-18)
$0
$300
$600
$900
$1,200
$1,500
$1,800
Expenditures per Capita
Note: In FY 2017-18, there were $1 million of expenses from San José Clean Energy.
24 City of San José – Annual Report on City Services 2018-19

FINANCIAL CONDITION
OPERATING SURPLUS/DEFICIT
The City’s General Fund had an operating surplus last year.
Ideally, a city’s revenues will equal its expenditures; it will break even, rather
than spending too little on services or too much. If the City spends too much
on services, it has an operating deficit—it spent more than the revenues it
brought in. Operating deficits that continue for years are unsustainable for a
city’s financial health.
In 2018-19, the General Fund operating surplus was $83 million. General
Fund revenues grew by 9 percent while expenditures decreased 3 percent.
The growth in revenues was attributed to an increase in property tax and
sales tax.
Last year, in 2017-18, when San José's operating deficit was $35 million, San
José had the largest operating deficit compared to revenues of any city
surveyed.
-5% 0% 5% 10% 15% 20%
SAN JOSE
San Diego
Sacramento
Long Beach
Fresno
Los Angeles
Oakland
Comparison between Cities(FY 2017-18)
-$60
-$40
-$20
$0
$20
$40
$60
$80
$100
Operating Surplus/Deficit ($millions)
0 1 2 3 4
Los Angeles
Oakland
Long Beach
Fresno
San Diego
Sacramento
SAN JOSE
Comparison between Cities(FY 2017-18)
ABILITY TO PAY EXPENSES
The City had more cash available in its General Fund compared to the liabilities owed
than it did in prior years.
Cash and investments that can be quickly turned into cash enable the City to
pay bills that will come due in the short term (within one year or sooner).
The amount the City had in its treasury in cash and investments compared to
the liabilities owed increased in 2018-19, following two years of decline. As of
June 30, 2019, the City’s cash and investments were over four times the
amount that it owed within the next year.
In 2017-18, San José's ratio of cash to liabilities was higher than other cities
surveyed. This means that San José was in a comparatively good position to
pay short-term obligations with cash and investments compared to other
cities.
The graphs below show the amount of money that the City has in
cash and investments compared to the amount of short-term
obligations the City owes, all within the General Fund. A higher
ratio shows a better ability to pay short-term obligations.
For this measure, a higher ratio indicates better financial condition.
0
1
2
3
4
5
Liquidity Ratio
The graph below to the left shows the difference between the
City’s General Fund total revenues and expenditures. The graph
below to the right expresses this as a comparison ratio (surplus or
deficit divided by revenues).
For this measure, a higher number indicates a better financial condition.
25City of San José – Annual Report on City Services 2018-19
FINANCIAL CONDITION
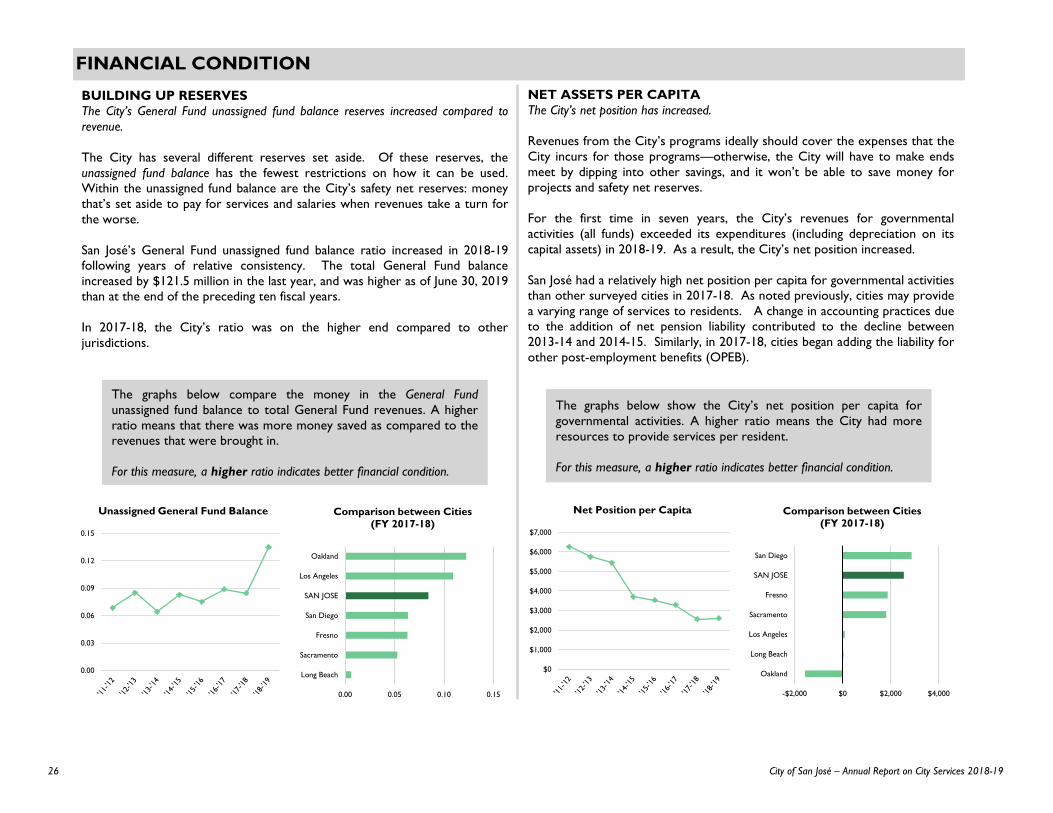
NET ASSETS PER CAPITA
The City’s net position has increased.
Revenues from the City’s programs ideally should cover the expenses that the
City incurs for those programs—otherwise, the City will have to make ends
meet by dipping into other savings, and it won’t be able to save money for
projects and safety net reserves.
For the first time in seven years, the City’s revenues for governmental
activities (all funds) exceeded its expenditures (including depreciation on its
capital assets) in 2018-19. As a result, the City’s net position increased.
San José had a relatively high net position per capita for governmental activities
than other surveyed cities in 2017-18. As noted previously, cities may provide
a varying range of services to residents. A change in accounting practices due
to the addition of net pension liability contributed to the decline between
2013-14 and 2014-15. Similarly, in 2017-18, cities began adding the liability for
other post-employment benefits (OPEB).
-$2,000 $0 $2,000 $4,000
Oakland
Long Beach
Los Angeles
Sacramento
Fresno
SAN JOSE
San Diego
Comparison between Cities(FY 2017-18)
owed
to
to
of
the
cities
to
other
The graphs below show the City’s net position per capita for
governmental activities. A higher ratio means the City had more
resources to provide services per resident.
For this measure, a higher ratio indicates better financial condition.
$0
$1,000
$2,000
$3,000
$4,000
$5,000
$6,000
$7,000
Net Position per Capita
BUILDING UP RESERVES
The City’s General Fund unassigned fund balance reserves increased compared to
revenue.
The City has several different reserves set aside. Of these reserves, the
unassigned fund balance has the fewest restrictions on how it can be used.
Within the unassigned fund balance are the City’s safety net reserves: money
that’s set aside to pay for services and salaries when revenues take a turn for
the worse.
San José’s General Fund unassigned fund balance ratio increased in 2018-19
following years of relative consistency. The total General Fund balance
increased by $121.5 million in the last year, and was higher as of June 30, 2019
than at the end of the preceding ten fiscal years.
In 2017-18, the City’s ratio was on the higher end compared to other
jurisdictions.
0.00 0.05 0.10 0.15
Long Beach
Sacramento
Fresno
San Diego
SAN JOSE
Los Angeles
Oakland
Comparison between Cities(FY 2017-18)
The graphs below compare the money in the General Fund
unassigned fund balance to total General Fund revenues. A higher
ratio means that there was more money saved as compared to the
revenues that were brought in.
For this measure, a higher ratio indicates better financial condition.
0.00
0.03
0.06
0.09
0.12
0.15
Unassigned General Fund Balance
26 City of San José – Annual Report on City Services 2018-19

FINANCIAL CONDITION
CITY OBLIGATIONS AND DEBT
In total, the City had $7 billion in obligations as of June 30, 2019. Of this,
$438 million was for short-term obligations and $6.5 billion was for long-term
obligations.
Short-term obligations are due within the next year. This includes things like
accrued wages that City employees have earned, and accounts payable
(money owed for supplies or for services rendered).
Long-term obligations are generally not due within the next year, but will need
to be paid in the future. Long-term obligations include:
• The accrued vacation and sick leave that employees have earned but
haven’t taken.
• Bonds that the City has issued to finance the purchase, construction, and
renovation of City-owned facilities. The payment of bond debt, called
debt service, includes payment of principal and interest. For more
information, see the Finance Department chapter.
• Pensions and other post-employment benefits (OPEB), which includes
healthcare for retired City employees. For more information, see the
Retirement Services chapter.
Who has to pay the City’s debt?
Separate entities within the broad City organization are legally
responsible for different parts of the City’s debt. On the one hand,
the City is not legally obligated to use the City’s general revenues to
pay the business-type obligations. On the other hand, the City’s
business-type revenues are restricted and may not be used to pay
other debt obligations.
ABILITY TO PAY OBLIGATIONS
Less than three years of revenue would be required to pay the City’s obligations.
A city the size of San José has both short- and long-term obligations that must
be paid in the future, such as accounts payable and bonds payable. The fewer
number of years of annual revenue needed to pay the City’s obligations, the
better the City’s financial condition.
In 2018-19, 2.8 years of revenues would be required to pay the City’s
obligations. In 2014-15, the City began including its net pension liability, which
totaled nearly $1.7 billion that year, to the calculation of total liabilities. OPEB
liabilities were added in 2017-18, and totaled $1.1 billion that year.
San José had more liabilities compared to revenues than all other cities
surveyed in 2017-18.
0 1 2 3 4
SAN JOSE
Oakland
Los Angeles
Sacramento
Long Beach
San Diego
Fresno
Comparison between Cities(FY 2017-18)
The graphs below compare the City’s short- and long-term
obligations to the City’s annual revenues (including all governmental
and business-type activities). A lower ratio shows that the City was
able to pay a larger portion of its debts with annual revenues.
For this measure, a lower ratio indicates better financial condition.
0.0
0.5
1.0
1.5
2.0
2.5
3.0
3.5
Near-Term Solvency Ratio
Note: 2011-12 through 2013-14 do not include net pension liability; 2017-18 on includes OPEB liabilities.
27City of San José – Annual Report on City Services 2018-19
FINANCIAL CONDITION
$0 $2,000 $4,000 $6,000 $8,000
Los Angeles
Long Beach
Sacramento
Oakland
SAN JOSE
San Diego
Fresno
Comparison between Cities(FY 2017-18)
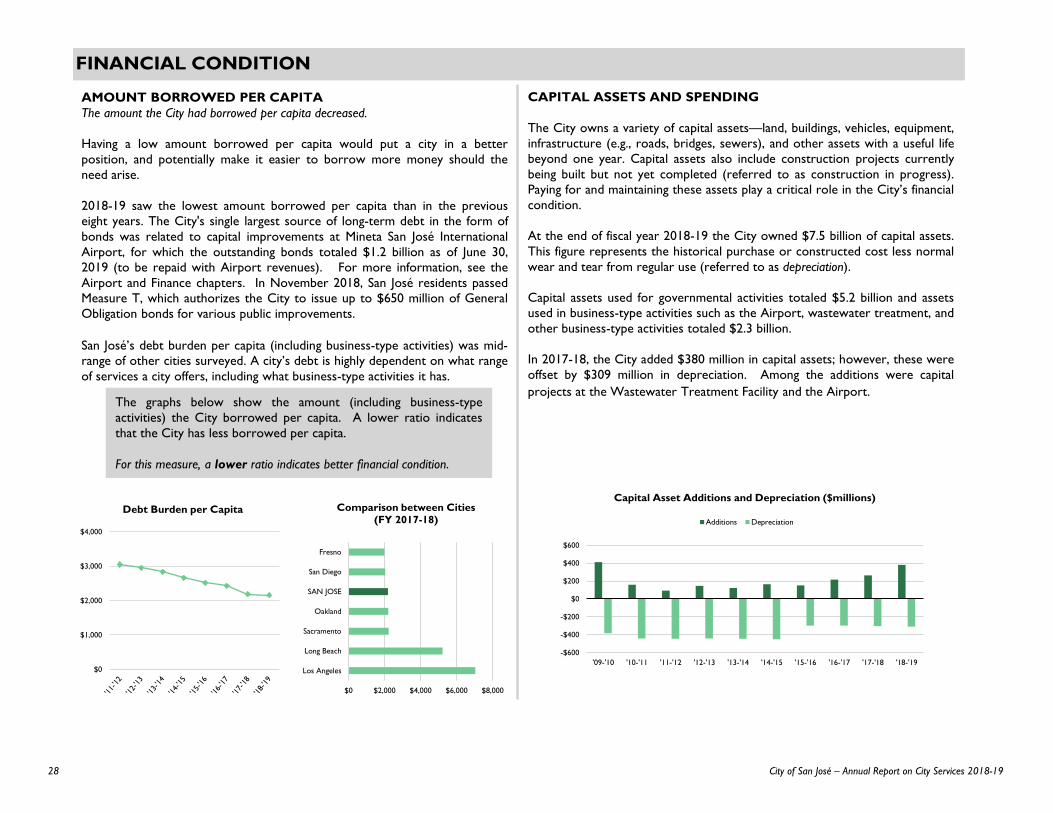
AMOUNT BORROWED PER CAPITA
The amount the City had borrowed per capita decreased.
Having a low amount borrowed per capita would put a city in a better
position, and potentially make it easier to borrow more money should the
need arise.
2018-19 saw the lowest amount borrowed per capita than in the previous
eight years. The City's single largest source of long-term debt in the form of
bonds was related to capital improvements at Mineta San José International
Airport, for which the outstanding bonds totaled $1.2 billion as of June 30,
2019 (to be repaid with Airport revenues). For more information, see the
Airport and Finance chapters. In November 2018, San José residents passed
Measure T, which authorizes the City to issue up to $650 million of General
Obligation bonds for various public improvements.
San José’s debt burden per capita (including business-type activities) was mid-
range of other cities surveyed. A city’s debt is highly dependent on what range
of services a city offers, including what business-type activities it has.
The graphs below show the amount (including business-type
activities) the City borrowed per capita. A lower ratio indicates
that the City has less borrowed per capita.
For this measure, a lower ratio indicates better financial condition.
$0
$1,000
$2,000
$3,000
$4,000
Debt Burden per Capita
CAPITAL ASSETS AND SPENDING
The City owns a variety of capital assets—land, buildings, vehicles, equipment,
infrastructure (e.g., roads, bridges, sewers), and other assets with a useful life
beyond one year. Capital assets also include construction projects currently
being built but not yet completed (referred to as construction in progress).
Paying for and maintaining these assets play a critical role in the City’s financial
condition.
At the end of fiscal year 2018-19 the City owned $7.5 billion of capital assets.
This figure represents the historical purchase or constructed cost less normal
wear and tear from regular use (referred to as depreciation).
Capital assets used for governmental activities totaled $5.2 billion and assets
used in business-type activities such as the Airport, wastewater treatment, and
other business-type activities totaled $2.3 billion.
In 2017-18, the City added $380 million in capital assets; however, these were
offset by $309 million in depreciation. Among the additions were capital
projects at the Wastewater Treatment Facility and the Airport.
-$600
-$400
-$200
$0
$200
$400
$600
'09-'10 '10-'11 '11-'12 '12-'13 '13-'14 '14-'15 '15-'16 '16-'17 '17-'18 '18-'19
Capital Asset Additions and Depreciation ($millions)
Additions Depreciation
28 City of San José – Annual Report on City Services 2018-19
FINANCIAL CONDITION
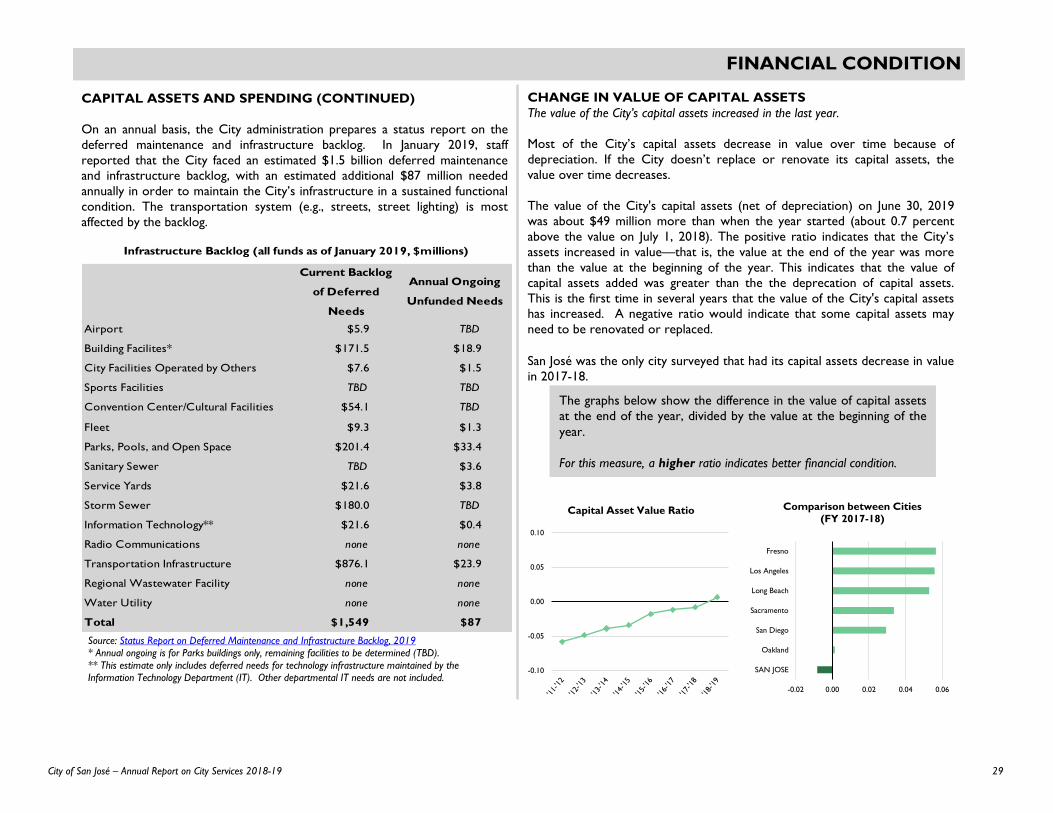
CAPITAL ASSETS AND SPENDING (CONTINUED)
On an annual basis, the City administration prepares a status report on the
deferred maintenance and infrastructure backlog. In January 2019, staff
reported that the City faced an estimated $1.5 billion deferred maintenance
and infrastructure backlog, with an estimated additional $87 million needed
annually in order to maintain the City’s infrastructure in a sustained functional
condition. The transportation system (e.g., streets, street lighting) is most
affected by the backlog.
-0.02 0.00 0.02 0.04 0.06
SAN JOSE
Oakland
San Diego
Sacramento
Long Beach
Los Angeles
Fresno
Comparison between Cities(FY 2017-18)
CHANGE IN VALUE OF CAPITAL ASSETS
The value of the City’s capital assets increased in the last year.
Most of the City’s capital assets decrease in value over time because of
depreciation. If the City doesn’t replace or renovate its capital assets, the
value over time decreases.
The value of the City's capital assets (net of depreciation) on June 30, 2019
was about $49 million more than when the year started (about 0.7 percent
above the value on July 1, 2018). The positive ratio indicates that the City’s
assets increased in value—that is, the value at the end of the year was more
than the value at the beginning of the year. This indicates that the value of
capital assets added was greater than the the deprecation of capital assets.
This is the first time in several years that the value of the City's capital assets
has increased. A negative ratio would indicate that some capital assets may
need to be renovated or replaced.
San José was the only city surveyed that had its capital assets decrease in value
in 2017-18.
-0.10
-0.05
0.00
0.05
0.10
Capital Asset Value Ratio
The graphs below show the difference in the value of capital assets
at the end of the year, divided by the value at the beginning of the
year.
For this measure, a higher ratio indicates better financial condition.
Source: Status Report on Deferred Maintenance and Infrastructure Backlog, 2019* Annual ongoing is for Parks buildings only, remaining facilities to be determined (TBD).
** This estimate only includes deferred needs for technology infrastructure maintained by theInformation Technology Department (IT). Other departmental IT needs are not included.
Current Backlog
of Deferred
Needs
Annual Ongoing
Unfunded Needs
Airport $5.9 TBD
Building Facilites* $171.5 $18.9
City Facilities Operated by Others $7.6 $1.5
Sports Facilities TBD TBD
Convention Center/Cultural Facilities $54.1 TBD
Fleet $9.3 $1.3
Parks, Pools, and Open Space $201.4 $33.4
Sanitary Sewer TBD $3.6
Service Yards $21.6 $3.8
Storm Sewer $180.0 TBD
Information Technology** $21.6 $0.4
Radio Communications none none
Transportation Infrastructure $876.1 $23.9
Regional Wastewater Facility none none
Water Utility none none
Total $1,549 $87
Infrastructure Backlog (all funds as of January 2019, $millions)
29City of San José – Annual Report on City Services 2018-19
FINANCIAL CONDITION
ENDNOTES (CONTINUED)
City Obligations and Debt: The bonds and loans payable noted on this page includes some debt
for which the City has limited obligation or is not legally liable. This includes City of San JoséFinancing Authority lease revenue bonds; the City is responsible for making annual leasepayments so long as there is beneficial use and occupancy of the leased facility. In addition to
debt noted on this page, the City manages, but is not liable for, long-term debt associated withthe former Redevelopment Agency and conduit financing related to multi-family housingrevenue bonds. For more information on the total debt managed, see the Finance
Department chapter. CAFR Source: Statement of Net Position
Ability to Pay Obligations: Other Post-employment Benefits (OPEB) begin to be included for
2017-18 data. Formula: (Primary Government Liabilities - Unearned Revenues) / PrimaryGovernment Revenues. CAFR Source: Government-wide Statement of Net Position andStatement of Activities
Debt Burden per Capita: This measure reflects all primary government bonded debt, whichincludes governmental and business-type activities. Population estimates are from the State of
California, Department of Finance. Trust and Agency funds, including the Pension Trust Fundsand the Successor Agency to the Redevelopment Agency, are not included. Formula: TotalOutstanding Debt for the Primary Government / Population. CAFR Source: Statistical Section
Capital Assets: Assets are valued at cost minus accumulated depreciation. Some assets may befully depreciated. Trust and Agency funds, including the Pension Trust Funds and the
Successor Agency to the Redevelopment Agency, are not included. CAFR Source: CapitalAssets Note Disclosure
Change in Value of Capital Assets: This measure represents the net value of all primarygovernment capital assets, which includes those owned by governmental activities andbusiness-type activities. Land, intangible assets, and construction in progress are not
depreciated. Formula: (Ending Net Value of Primary Government Capital Assets - BeginningNet Value) / Beginning Net Value. CAFR Source: Capital Assets Note Disclosure andReconciliation of the Changes in Fund Balances for Governmental Funds to the Statement of
Activities
ADDITIONAL REPORTS FOR MORE INFORMATION
The City of San José prepares numerous financial and budgetary documents during the fiscal year.
The Comprehensive Annual Financial Report (CAFR) provides the City’s audited financial
statements, notes to those statements, the City Management’s Discussion and Analysis of thefinancial information and trends, as well as other essential information. All measures included inthis chapter were calculated using data from the City’s CAFR. The Comprehensive Annual
Debt Report contains information such as recent debt issued by the City and the outstandingdebt portfolio. The Annual Debt Report is a key document to better understand the City’s debt,which is relevant for several measures presented in this report.
Visit: Finance Department’s Report Homepage.
ENDNOTES
What Makes Up the City Government: Trust and Agency funds, including the Pension Trust
Funds and the Successor Agency to the Redevelopment Agency, are not included in revenues.
City Revenues: The City also doesn’t receive 100 percent of the sales tax levied in Santa Clara
County. The City receives less in tax revenue per capita than many other Santa Clara Countycities. CAFR Source: Government-wide Statement of Activities and Statistical Section (unlessotherwise noted).
Revenue per Capita: This measure includes all governmental funds. Note: for all measures, SanFrancisco is not included as a benchmark city because it is a City/County structure. Formula:
Total government funds revenues / Population. CAFR Source: Governmental FundsStatement of Revenues, Expenditures, and Changes in Fund Balances, and Statistical Section
City Expenses: Trust and Agency funds, including the Pension Trust Funds and the SuccessorAgency to the Redevelopment Agency, are not included in expenses. CAFR Source:Government-wide Statement of Activities
Expenditures per Capita: This measure includes all governmental funds. Formula: Totalgovernment funds expenditures / Population. CAFR Source: Governmental Funds Statement
of Revenues, Expenditures, and Changes in Fund Balances, and Statistical Section
Operating Surplus/Deficit: This measure includes only the General Fund. Formula: General Fund
revenues – General Fund expenditures (for San José 5-year chart); (General Fund revenues –General Fund expenditures) / General Fund revenues (for comparison with other cities).CAFR Source: Governmental Funds Statement of Revenues, Expenditures, and Changes in
Fund Balances
Ability to Pay Expenses: This measure considers cash and investments held in the City Treasury
in the General Fund, as compared to liabilities. It is important to note that measures of cashand investments are a snapshot as of a given date. As a result, information could change thefollowing day as cash flows in and out in revenues and bills paid. Formula: Total General Fund
Cash and Investments / (General Fund Liabilities – General Fund Unearned Revenue). CAFRSource: Governmental Funds Balance Sheet
Building up Reserves: This measure focuses on General Fund unassigned fund balance.
Unassigned fund balance includes contingency reserves and budget stabilization reserves(designed to buffer against financial shocks) and certain earmarked reserves (set aside for a
purpose but potentially available in a catastrophic need). This measure shows short-runfinancial position. Formula: Unassigned General Fund Balance / Total General Fund Revenues.CAFR Source: Governmental Funds Balance Sheet; Governmental Funds Statement of
Revenues, Expenditures, and Changes in Fund Balance
Net Assets per Capita: This measure considers only governmental activities. Business type
activities are not included. Formula: Governmental Activities Net Position / Population. CAFRSource: Government-wide Statement of Activities and Statistical Section
30 City of San José – Annual Report on City Services 2018-19
OPERATING BUDGET AND STAFFING
Operating Budget and Staffing for City Services
31City of San José – Annual Report on City Services 2018-19
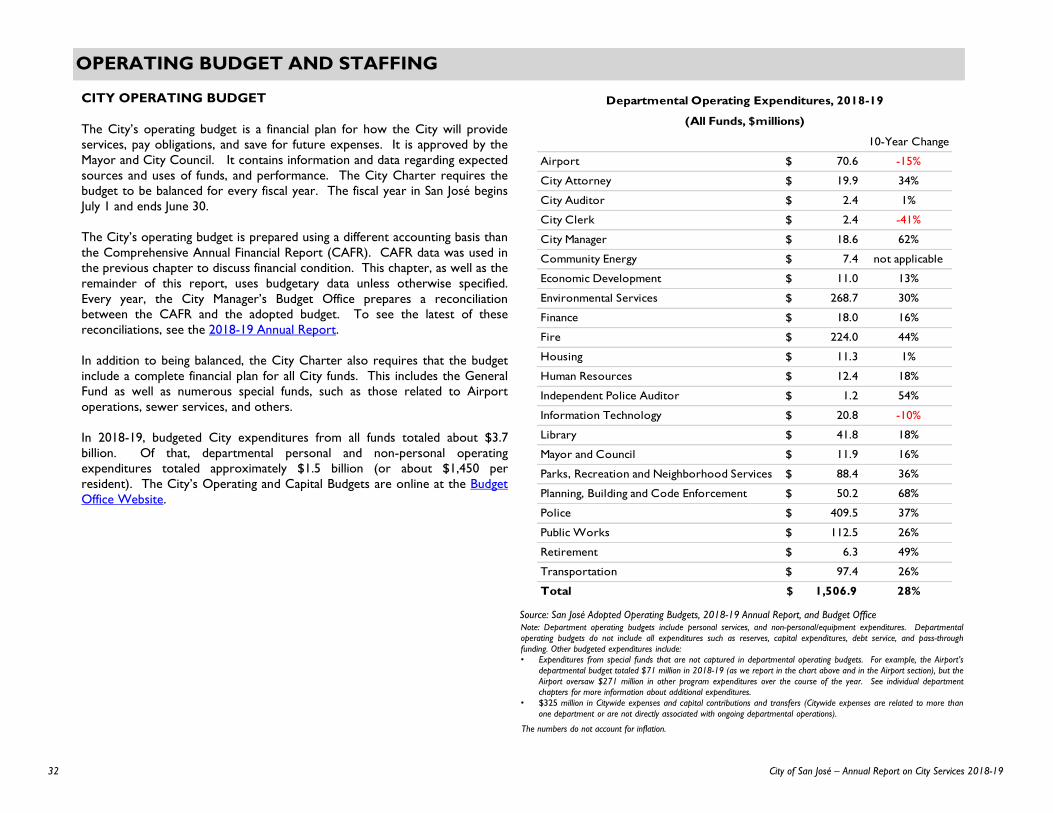
OPERATING BUDGET AND STAFFING
Note: Department operating budgets include personal services, and non-personal/equipment expenditures. Departmental
operating budgets do not include all expenditures such as reserves, capital expenditures, debt service, and pass-through
funding. Other budgeted expenditures include:
• Expenditures from special funds that are not captured in departmental operating budgets. For example, the Airport’s
departmental budget totaled $71 million in 2018-19 (as we report in the chart above and in the Airport section), but the
Airport oversaw $271 million in other program expenditures over the course of the year. See individual department
chapters for more information about additional expenditures.
• $325 million in Citywide expenses and capital contributions and transfers (Citywide expenses are related to more than
one department or are not directly associated with ongoing departmental operations).
Source: San José Adopted Operating Budgets and Annual Reports
Source: San José Adopted Operating Budgets, 2018-19 Annual Report, and Budget Office
The numbers do not account for inflation.
10-Year Change
Airport 70.6$ -15%
City Attorney 19.9$ 34%
City Auditor 2.4$ 1%
City Clerk 2.4$ -41%
City Manager 18.6$ 62%
Community Energy 7.4$ not applicable
Economic Development 11.0$ 13%
Environmental Services 268.7$ 30%
Finance 18.0$ 16%
Fire 224.0$ 44%
Housing 11.3$ 1%
Human Resources 12.4$ 18%
Independent Police Auditor 1.2$ 54%
Information Technology 20.8$ -10%
Library 41.8$ 18%
Mayor and Council 11.9$ 16%
Parks, Recreation and Neighborhood Services 88.4$ 36%
Planning, Building and Code Enforcement 50.2$ 68%
Police 409.5$ 37%
Public Works 112.5$ 26%
Retirement 6.3$ 49%
Transportation 97.4$ 26%
Total 1,506.9$ 28%
Departmental Operating Expenditures, 2018-19
(All Funds, $millions)
CITY OPERATING BUDGET
The City’s operating budget is a financial plan for how the City will provide
services, pay obligations, and save for future expenses. It is approved by the
Mayor and City Council. It contains information and data regarding expected
sources and uses of funds, and performance. The City Charter requires the
budget to be balanced for every fiscal year. The fiscal year in San José begins
July 1 and ends June 30.
The City’s operating budget is prepared using a different accounting basis than
the Comprehensive Annual Financial Report (CAFR). CAFR data was used in
the previous chapter to discuss financial condition. This chapter, as well as the
remainder of this report, uses budgetary data unless otherwise specified.
Every year, the City Manager’s Budget Office prepares a reconciliation
between the CAFR and the adopted budget. To see the latest of these
reconciliations, see the 2018-19 Annual Report.
In addition to being balanced, the City Charter also requires that the budget
include a complete financial plan for all City funds. This includes the General
Fund as well as numerous special funds, such as those related to Airport
operations, sewer services, and others.
In 2018-19, budgeted City expenditures from all funds totaled about $3.7
billion. Of that, departmental personal and non-personal operating
expenditures totaled approximately $1.5 billion (or about $1,450 per
resident). The City’s Operating and Capital Budgets are online at the Budget
Office Website.
32 City of San José – Annual Report on City Services 2018-19
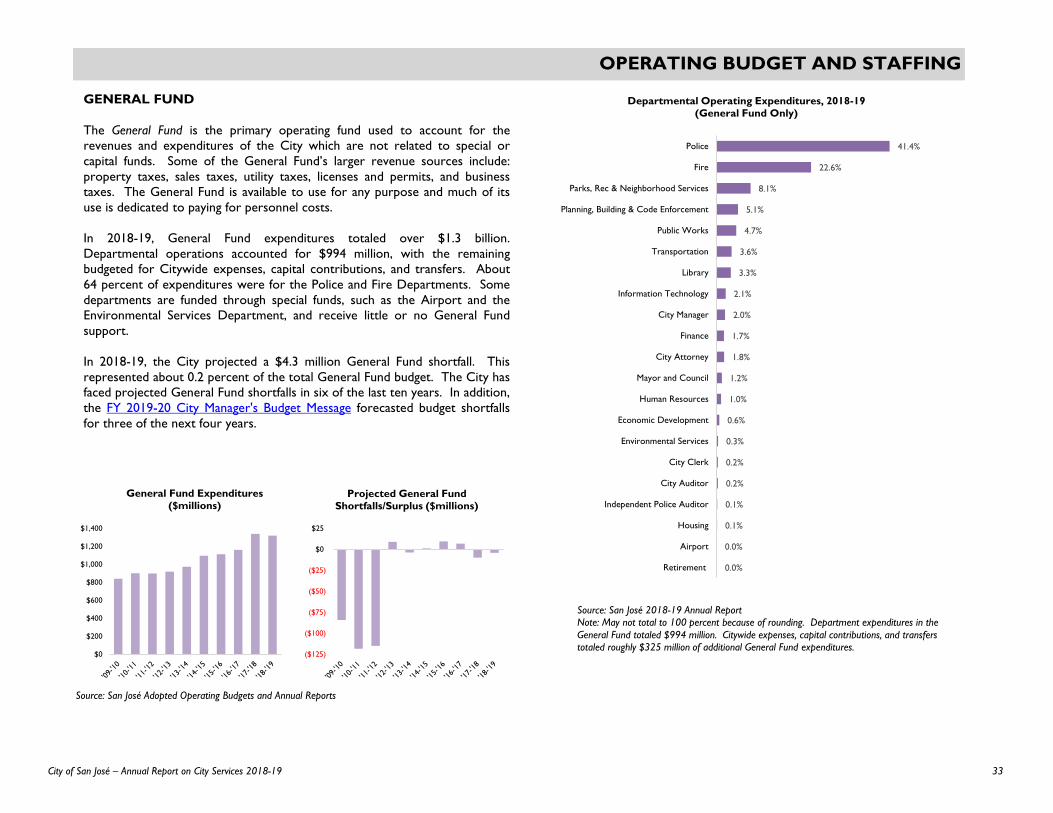
OPERATING BUDGET AND STAFFING
Departmental
through
Airport’s
the
department
thanSource: San José Adopted Operating Budgets and Annual Reports
$0
$200
$400
$600
$800
$1,000
$1,200
$1,400
General Fund Expenditures ($millions)
($125)
($100)
($75)
($50)
($25)
$0
$25
Projected General Fund Shortfalls/Surplus ($millions)
Source: San José 2018-19 Annual Report Note: May not total to 100 percent because of rounding. Department expenditures in the
General Fund totaled $994 million. Citywide expenses, capital contributions, and transfers totaled roughly $325 million of additional General Fund expenditures.
0.0%
0.0%
0.1%
0.1%
0.2%
0.2%
0.3%
0.6%
1.0%
1.2%
1.8%
1.7%
2.0%
2.1%
3.3%
3.6%
4.7%
5.1%
8.1%
22.6%
41.4%
Retirement
Airport
Housing
Independent Police Auditor
City Auditor
City Clerk
Environmental Services
Economic Development
Human Resources
Mayor and Council
City Attorney
Finance
City Manager
Information Technology
Library
Transportation
Public Works
Planning, Building & Code Enforcement
Parks, Rec & Neighborhood Services
Fire
Police
Departmental Operating Expenditures, 2018-19 (General Fund Only)
GENERAL FUND
The General Fund is the primary operating fund used to account for the
revenues and expenditures of the City which are not related to special or
capital funds. Some of the General Fund’s larger revenue sources include:
property taxes, sales taxes, utility taxes, licenses and permits, and business
taxes. The General Fund is available to use for any purpose and much of its
use is dedicated to paying for personnel costs.
In 2018-19, General Fund expenditures totaled over $1.3 billion.
Departmental operations accounted for $994 million, with the remaining
budgeted for Citywide expenses, capital contributions, and transfers. About
64 percent of expenditures were for the Police and Fire Departments. Some
departments are funded through special funds, such as the Airport and the
Environmental Services Department, and receive little or no General Fund
support.
In 2018-19, the City projected a $4.3 million General Fund shortfall. This
represented about 0.2 percent of the total General Fund budget. The City has
faced projected General Fund shortfalls in six of the last ten years. In addition,
the FY 2019-20 City Manager's Budget Message forecasted budget shortfalls
for three of the next four years.
33City of San José – Annual Report on City Services 2018-19
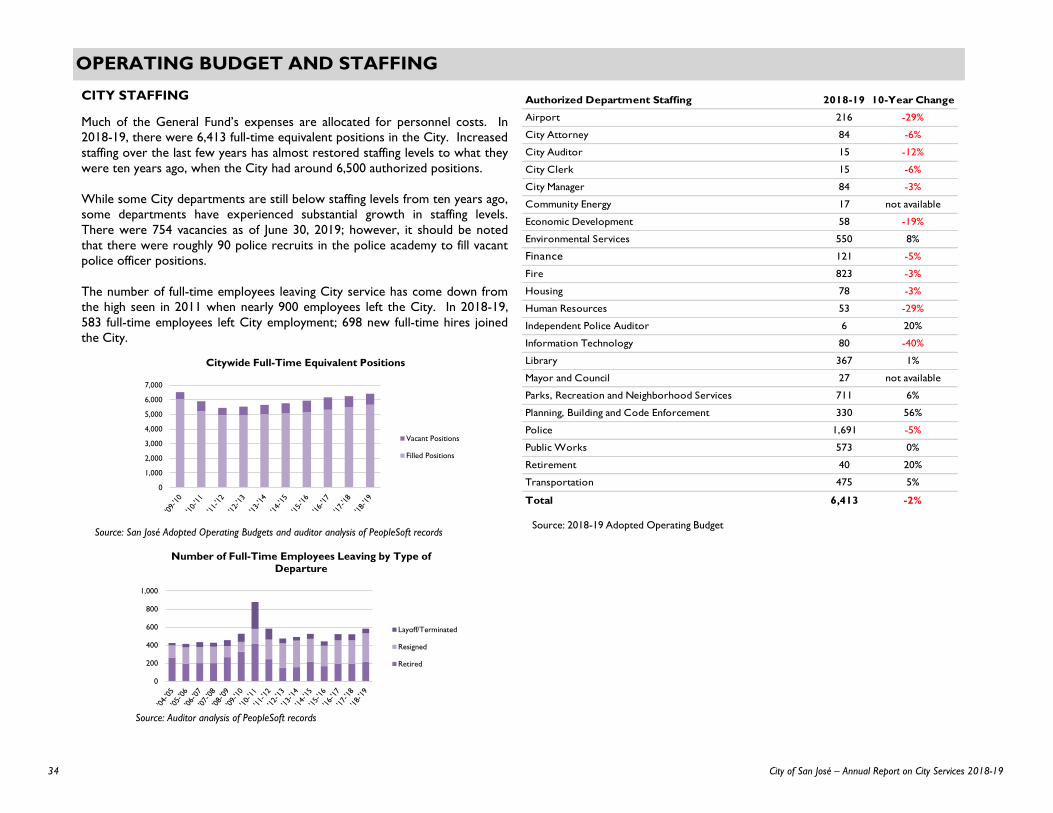
OPERATING BUDGET AND STAFFING
0
200
400
600
800
1,000
Number of Full-Time Employees Leaving by Type of Departure
Layoff/Terminated
Resigned
Retired
CITY STAFFING
Much of the General Fund’s expenses are allocated for personnel costs. In
2018-19, there were 6,413 full-time equivalent positions in the City. Increased
staffing over the last few years has almost restored staffing levels to what they
were ten years ago, when the City had around 6,500 authorized positions.
While some City departments are still below staffing levels from ten years ago,
some departments have experienced substantial growth in staffing levels.
There were 754 vacancies as of June 30, 2019; however, it should be noted
that there were roughly 90 police recruits in the police academy to fill vacant
police officer positions.
The number of full-time employees leaving City service has come down from
the high seen in 2011 when nearly 900 employees left the City. In 2018-19,
583 full-time employees left City employment; 698 new full-time hires joined
the City.
Source: San José Adopted Operating Budgets and auditor analysis of PeopleSoft recordsSource: 2018-19 Adopted Operating Budget
Source: Auditor analysis of PeopleSoft records
0
1,000
2,000
3,000
4,000
5,000
6,000
7,000
Citywide Full-Time Equivalent Positions
Vacant Positions
Filled Positions
Authorized Department Staffing 2018-19 10-Year Change
Airport 216 -29%
City Attorney 84 -6%
City Auditor 15 -12%
City Clerk 15 -6%
City Manager 84 -3%
Community Energy 17 not available
Economic Development 58 -19%
Environmental Services 550 8%
Finance 121 -5%
Fire 823 -3%
Housing 78 -3%
Human Resources 53 -29%
Independent Police Auditor 6 20%
Information Technology 80 -40%
Library 367 1%
Mayor and Council 27 not available
Parks, Recreation and Neighborhood Services 711 6%
Planning, Building and Code Enforcement 330 56%
Police 1,691 -5%
Public Works 573 0%
Retirement 40 20%
Transportation 475 5%
Total 6,413 -2%
34 City of San José – Annual Report on City Services 2018-19

OPERATING BUDGET AND STAFFING
0 2 4 6 8 10 12 14
SAN JOSE
San Diego
Sacramento
Oakland
Long Beach
Los Angeles
2018-19 Authorized Full-Time Positions per 1,000 Residents
CITY STAFFING (CONTINUED)
In 2018-19, the City of San José had 6.1 authorized positions per 1,000
residents, far fewer than other large California cities. The number of
authorized positions per 1,000 residents was also less than San José’s 20-year
average of 6.7.
Total employee compensation for operating funds rose to $1.06 billion in
2018-19. Cash compensation and other benefit costs have risen above 2009-
10 levels, partly driven by a restoration of former staffing levels. Moreover,
retirement benefit costs have more than doubled. For more information, see
the Retirement Services chapter.
0.0
1.0
2.0
3.0
4.0
5.0
6.0
7.0
8.0
9.0
Authorized Full-Time Positions per 1,000 population
Source: 2011 Fiscal and Service Level Emergency Report, November 2011, San José 2012-13 through 2018-19 Adopted Operating Budgets
$355
$640
$70
$0
$100
$200
$300
$400
$500
$600
$700
$800
$900
$1,000
$1,100
'09-'10 '10-'11 '11-'12 '12-'13 '13-'14 '14-'15 '15-'16 '16-'17 '17-'18 '18-'19
Retirement, Fringe, and Cash Compensation (Operating Funds Only, $millions)
Cash Compensation Retirement Other Benefits
Source: Auditor analysis of FMS records
Source: 2018-19 Operating Budgets from each jurisdiction and California Department of Finance Demographic Research Unit
Note: The type and range of services may vary across jurisdictions.
35City of San José – Annual Report on City Services 2018-19
OPERATING BUDGET AND STAFFING
ADDITIONAL REPORTS FOR MORE INFORMATION
The City of San José prepares numerous budgetary documents during the
fiscal year.
The City’s Annual Adopted Operating Budget details how the City will
pay for services and operations. The Adopted Operating Budget contains key
information about the City’s budgets and performance, broken down by broad
areas of City service delivery and City departments. It also contains
information about the sources and uses of operating funds. Visit:
City Manager’s Budget Office 2019-20 adopted operating budget homepage.
The City Manager’s Budget Office also prepares an Annual Adopted
Capital Budget and a Five Year Capital Improvement Program to
outline how the City will maintain and grow its capital assets. This document
provides detailed information about the planned capital investments in the
City’s assets such as buildings, parks, and transportation infrastructure. Visit:
City Manager’s Budget Office 2019-20 adopted capital budget homepage.
The Annual Report provides unaudited information on the financial status of
the City at the end of each fiscal year. The focus of the Annual Report is a
comparison of actual revenue collections and expenditures to projections and
appropriations included in the budget. This report also provides information
about each City fund, including the status of the year-end reserve levels. Visit:
City Manager's Budget Office 2018-19 Annual Report.
The Five Year Forecast includes projected revenues and expenditures for
the General Fund and revenue projections for the Capital Improvement
Program. Visit: City Manager's Budget Office Five Year Forecast homepage.
The Fees and Charges Report documents the majority of the fees and
charges within the General Fund and selected fees within other funds. Some
fees for enterprise activities, such as the Airport, are not included as they are
approved separately. Visit: City Manager's Budget Office Proposed Fees and
Charges.
36 City of San José – Annual Report on City Services 2018-19
CITY SERVICE AREA (CSA) DASHBOARDS
City Service Areas (CSAs) integrate services provided in individual departments into the
City’s five key lines of business: Community and Economic Development; Environmental
and Utility Services; Neighborhood Services; Public Safety; and Transportation and
Aviation Services. An additional CSA, referred to as "Strategic Support," represents the
internal functions that enable the other five CSAs to provide services to the community.
In FY 2017-18, the City Administration was instructed to select the top six measures
representing achievements in each CSA. These measures are presented in the following
section.
For more information about specific departments, see their corresponding chapters later
in the report.
Target: 80%
37City of San José – Annual Report on City Services 2018-19
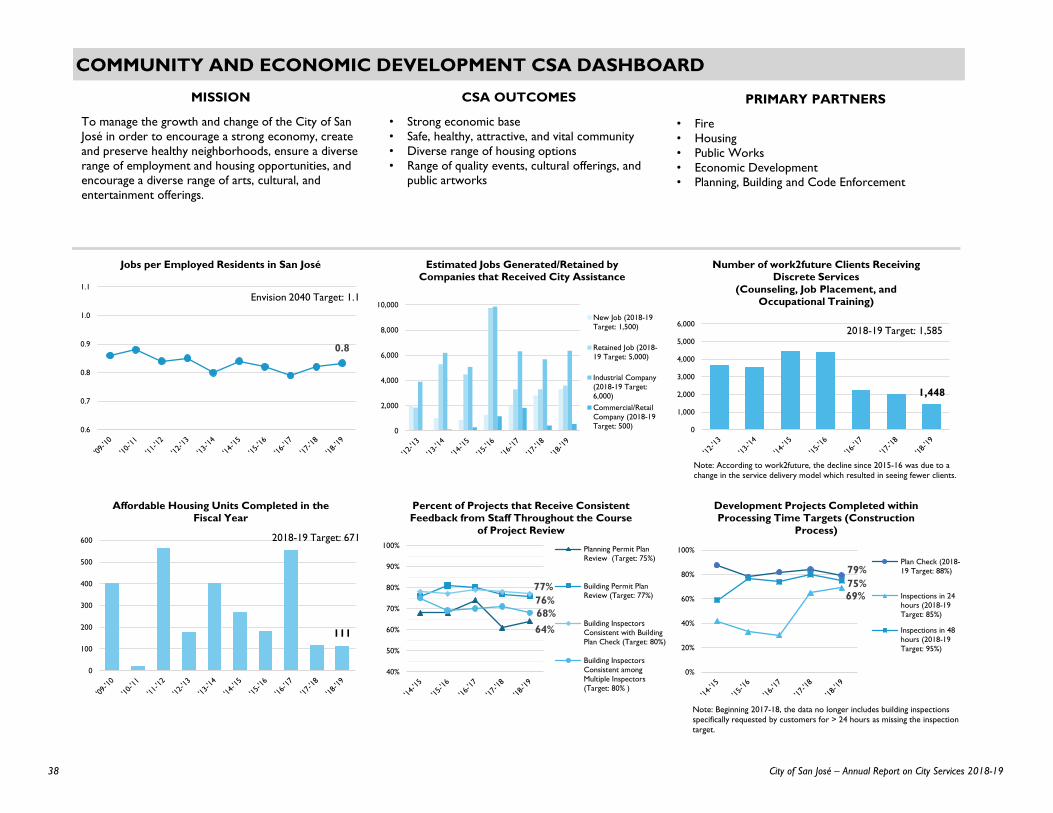
COMMUNITY AND ECONOMIC DEVELOPMENT CSA DASHBOARD
MISSION
To manage the growth and change of the City of San
José in order to encourage a strong economy, create
and preserve healthy neighborhoods, ensure a diverse
range of employment and housing opportunities, and
encourage a diverse range of arts, cultural, and
entertainment offerings.
0
2,000
4,000
6,000
8,000
10,000
Estimated Jobs Generated/Retained by Companies that Received City Assistance
New Job (2018-19
Target: 1,500)
Retained Job (2018-
19 Target: 5,000)
Industrial Company
(2018-19 Target:
6,000)
Commercial/Retail
Company (2018-19
Target: 500)
0.8
0.6
0.7
0.8
0.9
1.0
1.1
Jobs per Employed Residents in San José
Envision 2040 Target: 1.1
1,448
0
1,000
2,000
3,000
4,000
5,000
6,000
Number of work2future Clients Receiving Discrete Services
(Counseling, Job Placement, and Occupational Training)
2018-19 Target: 1,585
76%
77%
68%
64%
40%
50%
60%
70%
80%
90%
100%
Percent of Projects that Receive Consistent Feedback from Staff Throughout the Course
of Project Review
Planning Permit Plan
Review (Target: 75%)
Building Permit Plan
Review (Target: 77%)
Building Inspectors
Consistent with Building
Plan Check (Target: 80%)
Building Inspectors
Consistent among
Multiple Inspectors
(Target: 80% )
69%
75%
79%
0%
20%
40%
60%
80%
100%
Development Projects Completed within Processing Time Targets (Construction
Process)
Plan Check (2018-
19 Target: 88%)
Inspections in 24
hours (2018-19
Target: 85%)
Inspections in 48
hours (2018-19
Target: 95%)
CSA OUTCOMES
• Strong economic base
• Safe, healthy, attractive, and vital community
• Diverse range of housing options
• Range of quality events, cultural offerings, and
public artworks
PRIMARY PARTNERS
• Fire
• Housing
• Public Works
• Economic Development
• Planning, Building and Code Enforcement
111
0
100
200
300
400
500
600
Affordable Housing Units Completed in the Fiscal Year
2018-19 Target: 671
Note: Beginning 2017-18, the data no longer includes building inspections
specifically requested by customers for > 24 hours as missing the inspection
target.
Note: According to work2future, the decline since 2015-16 was due to a
change in the service delivery model which resulted in seeing fewer clients.
38 City of San José – Annual Report on City Services 2018-19
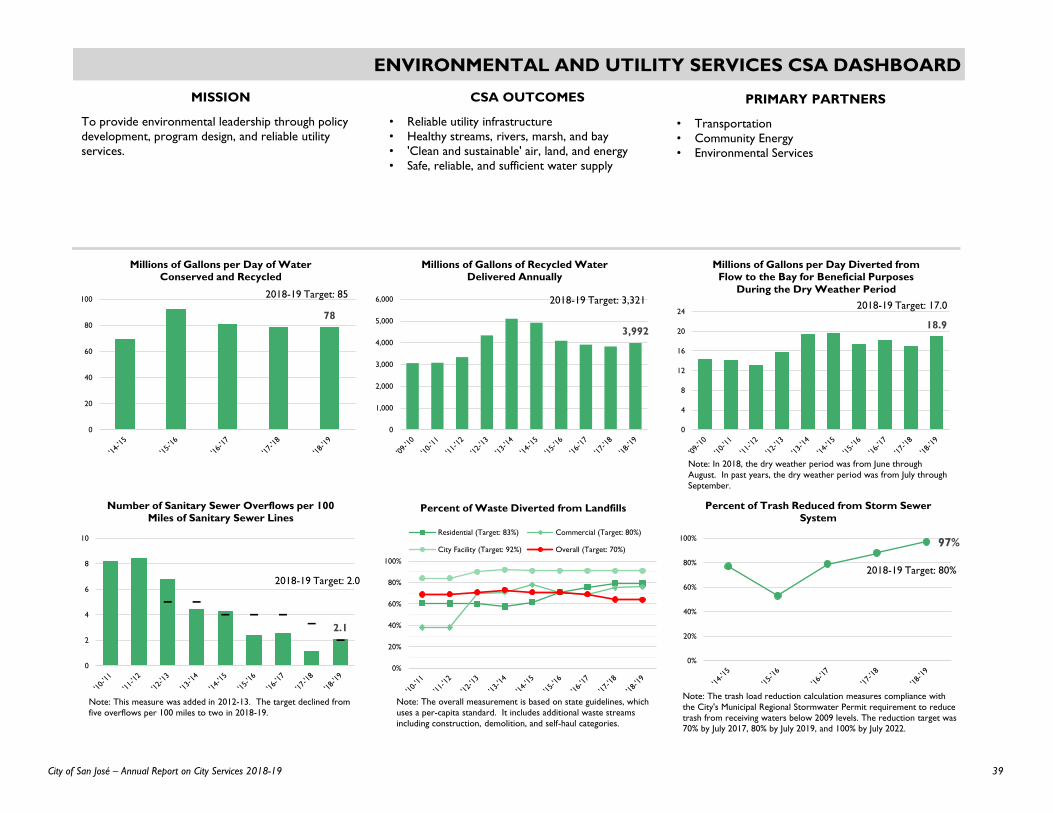
ENVIRONMENTAL AND UTILITY SERVICES CSA DASHBOARD
78
0
20
40
60
80
100
Millions of Gallons per Day of Water Conserved and Recycled
2018-19 Target: 85
2.1
0
2
4
6
8
10
Number of Sanitary Sewer Overflows per 100 Miles of Sanitary Sewer Lines
2018-19 Target: 2.0
97%
0%
20%
40%
60%
80%
100%
Percent of Trash Reduced from Storm Sewer System
2018-19 Target: 80%
3,992
0
1,000
2,000
3,000
4,000
5,000
6,000
Millions of Gallons of Recycled Water Delivered Annually
2018-19 Target: 3,321
18.9
0
4
8
12
16
20
24
Millions of Gallons per Day Diverted from Flow to the Bay for Beneficial Purposes
During the Dry Weather Period
2018-19 Target: 17.0
20%
40%
60%
80%
Pe
rce
nt o
f N
MISSION
To provide environmental leadership through policy
development, program design, and reliable utility
services.
CSA OUTCOMES
• Reliable utility infrastructure
• Healthy streams, rivers, marsh, and bay
• 'Clean and sustainable' air, land, and energy
• Safe, reliable, and sufficient water supply
PRIMARY PARTNERS
• Transportation
• Community Energy
• Environmental Services
inspection
Note: This measure was added in 2012-13. The target declined from
five overflows per 100 miles to two in 2018-19.
Note: The trash load reduction calculation measures compliance with
the City's Municipal Regional Stormwater Permit requirement to reduce
trash from receiving waters below 2009 levels. The reduction target was
70% by July 2017, 80% by July 2019, and 100% by July 2022.
Note: In 2018, the dry weather period was from June through
August. In past years, the dry weather period was from July through
September.
0%
20%
40%
60%
80%
100%
Percent of Waste Diverted from Landfills
Residential (Target: 83%) Commercial (Target: 80%)
City Facility (Target: 92%) Overall (Target: 70%)
Note: The overall measurement is based on state guidelines, which
uses a per-capita standard. It includes additional waste streams
including construction, demolition, and self-haul categories.
39City of San José – Annual Report on City Services 2018-19

NEIGHBORHOOD SERVICES CSA DASHBOARD
97%
20%
40%
60%
80%
Pe
rce
nt o
f N
94%
0%
20%
40%
60%
80%
100%
Percent of Customers Rating Library Services as Good or Better (Point of Service)
2018-19 Target: 91%
87%
0%
20%
40%
60%
80%
100%
Percent of Community Center Participants Rating City Efforts at Providing Recreational
Opportunities as "Good" or "Excellent" (Point of Service)
2018-19 Target: 88%
85%
0%
20%
40%
60%
80%
100%
Percent of Parents and Caregivers who Report Reading More to their Children
Following Participation in a Library Program or Study
2018-19 Target: 80%
92%
0%
20%
40%
60%
80%
100%
Animal Care Center Live Release Rate
2018-19 Target: 92%3.3 3.4 3.3 3.3
0
1
2
3
4
5
0%
20%
40%
60%
80%
100%
'15-'16 '16-'17 '17-'18 '18-'19
Percent of Park Acres by Park Condition Assessment (PCA) Score
1 or less 1 to 2 2 to 3
3 to 4 4 to 5 Avg. PCA Score
MISSION
To serve, foster, and strengthen the community by
providing access to lifelong learning, opportunities to
enjoy life, and preserving healthy neighborhoods.
CSA OUTCOMES
• Safe and clean parks, facilities, and attractions
• Vibrant cultural, learning, recreation, and
leisure opportunities
• Healthy neighborhoods and capable
communities
PRIMARY PARTNERS
• Library
• Public Works
• Planning, Building and Code Enforcement
• Parks, Recreation and Neighborhood Services
Source: Internal survey conducted by the Library. Source:: Internal survey conducted by PRNS. Source: Internal survey conducted by the Library.
trash from receiving waters below 2009 levels. The reduction target was
73%
92% 94%
82%90% 87%
0%
20%
40%
60%
80%
100%
Tier 1 (6-Year) Tier 2 (5-Year) Tier 3 (3-Year)
Percent of Multiple Occupancy Permit Program Buildings Receiving Routine
Inspection within Designated Cycle Time
'17-'18 '18-'19
5-Year Goal: 88%
Condition scores range from 1 (unacceptable) to 5 (new or like new).
Measurement for 2018-19 was conducted in August 2019.
40 City of San José – Annual Report on City Services 2018-19
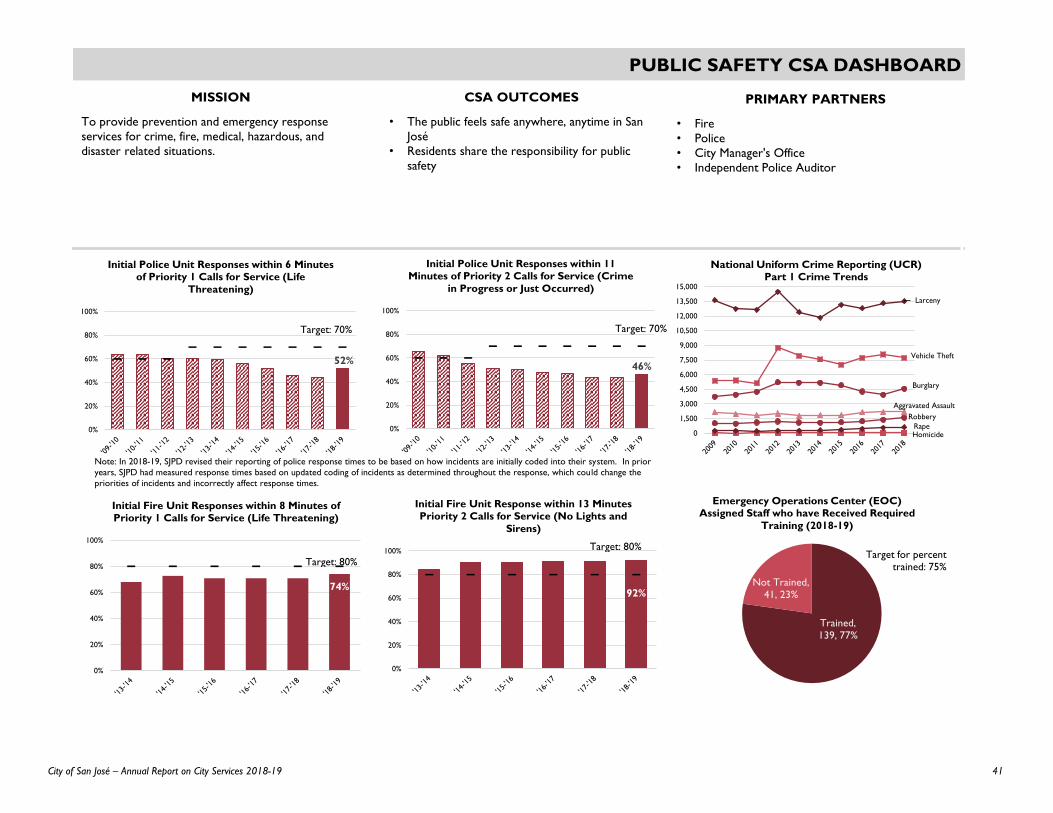
PUBLIC SAFETY CSA DASHBOARD
52%
0%
20%
40%
60%
80%
100%
Initial Police Unit Responses within 6 Minutes of Priority 1 Calls for Service (Life
Threatening)
46%
0%
20%
40%
60%
80%
100%
Initial Police Unit Responses within 11 Minutes of Priority 2 Calls for Service (Crime
in Progress or Just Occurred)
74%
0%
20%
40%
60%
80%
100%
Initial Fire Unit Responses within 8 Minutes of Priority 1 Calls for Service (Life Threatening)
92%
0%
20%
40%
60%
80%
100%
Initial Fire Unit Response within 13 Minutes Priority 2 Calls for Service (No Lights and
Sirens)
Trained, 139, 77%
Not Trained, 41, 23%
Emergency Operations Center (EOC) Assigned Staff who have Received Required
Training (2018-19)
Target for percent trained: 75%
HomicideRape
Robbery
Aggravated Assault
Burglary
Larceny
Vehicle Theft
0
1,500
3,000
4,500
6,000
7,500
9,000
10,500
12,000
13,500
15,000
National Uniform Crime Reporting (UCR) Part 1 Crime Trends
MISSION
To provide prevention and emergency response
services for crime, fire, medical, hazardous, and
disaster related situations.
CSA OUTCOMES
• The public feels safe anywhere, anytime in San
José
• Residents share the responsibility for public
safety
PRIMARY PARTNERS
• Fire
• Police
• City Manager's Office
• Independent Police Auditor
Target: 70% Target: 70%
Target: 80%
Target: 80%
Note: In 2018-19, SJPD revised their reporting of police response times to be based on how incidents are initially coded into their system. In prior
years, SJPD had measured response times based on updated coding of incidents as determined throughout the response, which could change the
priorities of incidents and incorrectly affect response times.
41City of San José – Annual Report on City Services 2018-19

STRATEGIC SUPPORT CSA DASHBOARD
88.2%
11.8%
0%
20%
40%
60%
80%
100%
Percent of Positions Filled as a Total of Budgeted Positions (June 30)
Filled (2018-19 Target: 88.4%) Vacant (2018-19 Target: 11.6%)
71%
0%
20%
40%
60%
80%
100%
Percent of Non-Management Employee Performance Appraisals Completed on
Schedule
100%
97%
90%
92%
94%
96%
98%
100%
Percent of Equipment Available for Use When Needed
Emergency Vehicles (Target = 100%)
General Fleet (Target = 95%)
85%
0%
20%
40%
60%
80%
100%
Percent of City Facilities with a Condition Assessment Rating of Good or Better
2018-19 Target: 85%
Note: Results reflect ratings of facilities assessed during the
fiscal year. In 2018-19, this represented 40 individual facilities.
Data not available in 2013-14 and 2015-16.
Percent of Information Technology Project Success Rate Measured on Schedule, Cost,
Scope, and Value
86%
MISSION
To effectively develop, manage, and safeguard the
City’s fiscal, physical, technological, and human
resources to enable and enhance the delivery of City
services and projects.
CSA OUTCOMES
• Sound fiscal management that facilitates
meeting the needs of the community
• A high performing workforce that is
committed to exceeding internal and external
customer expectations
• Effective use of technology
• Safe and functional public infrastructure,
facilities, and equipment
PRIMARY PARTNERS
• Finance
• Public Works
• Human Resources
• Information Technology
Target Project Success Rate: 80%
The current measurement of project success is the IT CIO’s internal
assessment of staff’s project success. In the future, IT’s C3PO will
report on all chartered technology projects in the City.
Moody'sStandard and
Poor'sFitch
'13-'14 Aa1 AA+ AA+
'14-'15 Aa1 AA+ AA+
'15-'16 Aa1 AA+ AA+
'16-'17 Aa1 AA+ AA+
'17-'18 Aa1 AA+ AA+
'18-'19 Aa1 AA+ AA+
Target Aa1 AA+ AA+
City's Bond Ratings
(General Obligation Bond Rating)
42 City of San José – Annual Report on City Services 2018-19
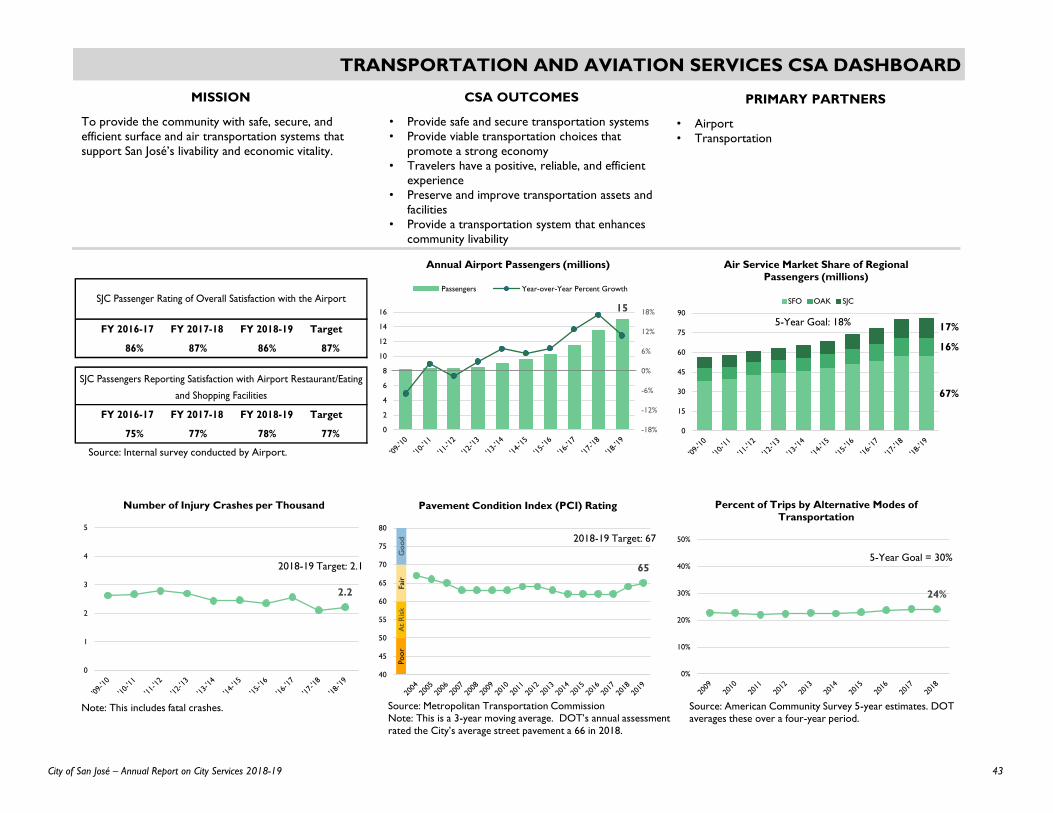
TRANSPORTATION AND AVIATION SERVICES CSA DASHBOARD
CSA OUTCOMES
• Provide safe and secure transportation systems
• Provide viable transportation choices that
promote a strong economy
• Travelers have a positive, reliable, and efficient
experience
• Preserve and improve transportation assets and
facilities
• Provide a transportation system that enhances
community livability
Po
or
At
Ris
k
Fair
G
oo
d
65
40
45
50
55
60
65
70
75
80
Pavement Condition Index (PCI) Rating
2018-19 Target: 67
67%
16%
17%
0
15
30
45
60
75
90
Air Service Market Share of Regional Passengers (millions)
SFO OAK SJC
5-Year Goal: 18%
15
-18%
-12%
-6%
0%
6%
12%
18%
0
2
4
6
8
10
12
14
16
Annual Airport Passengers (millions)
Passengers Year-over-Year Percent Growth
24%
0%
10%
20%
30%
40%
50%
Percent of Trips by Alternative Modes of Transportation
5-Year Goal = 30%
Source: American Community Survey 5-year estimates. DOT averages these over a four-year period.
MISSION
To provide the community with safe, secure, and
efficient surface and air transportation systems that
support San José’s livability and economic vitality.
PRIMARY PARTNERS
• Airport
• Transportation
Source: Internal survey conducted by Airport.
Source: Metropolitan Transportation CommissionNote: This is a 3-year moving average. DOT’s annual assessment
rated the City’s average street pavement a 66 in 2018.
2.2
0
1
2
3
4
5
Number of Injury Crashes per Thousand
2018-19 Target: 2.1
FY 2016-17 FY 2017-18 FY 2018-19 Target
75% 77% 78% 77%
SJC Passenger Rating of Overall Satisfaction with the Airport
FY 2016-17 FY 2017-18 FY 2018-19 Target
86% 87% 86% 87%
SJC Passengers Reporting Satisfaction with Airport Restaurant/Eating
and Shopping Facilities
Note: This includes fatal crashes.
43City of San José – Annual Report on City Services 2018-19

44 City of San José – Annual Report on City Services 2018-19
AIRPORT
The mission of the Airport is to connect, serve, and inspire.
45City of San José – Annual Report on City Services 2018-19

AIRPORT
The City operates Mineta San José International Airport, which provides non-stop air
service to 40 U.S. destinations, including Newark, Baltimore/Washington, Chicago,
New York, and four Hawaiian islands (Hawaii, Kauai, Maui, and Oahu). Additionally, it
provides non-stop service to several international locations including Beijing,
Guadalajara, Tokyo, London, and Vancouver for a total of 49 non-stop destinations
served (down from 53 last year).
The Airport had 215.5 authorized positions in 2018-19. The Airport does not receive
General Fund dollars; Airport operational revenues include rents, concession fees,
parking, and landing fees. In 2018-19, operating revenues totaled $174.8 million, the
highest total in the past ten years.
Airport operating expenditures, excluding debt service, totaled $70.6 million.* As of
June 30, 2019, outstanding bonds totaled $1.2 billion, with an additional $52.2 million
in commercial paper notes. Total debt service for the fiscal year was $92.8 million.
Debt service has tripled from 10 years ago; this is a result of debt incurred during the
Airport’s major modernization and renovation that began in 2005.** The bonds
issued in 2007 were restructured and refunded in 2017.
*Operating expenditures do not include police and fire services at the Airport, debt service, capital projectexpenditures or reserves. The cost of police and fire services has increased from $14.3 last year to $16.1 million in
FY 2018-19.**Total debt service in 2018-19 was partly paid by passenger facility charges ($27.0 million) and customer facilitycharges ($18.7 million); a net debt service of $47.1 million is paid by Airport operating revenues. See the November
2017 audit — Airport Financial Projections: Balancing ongoing Debt-Service Obligations with Increasing OperationalNeeds.
$0
$10
$20
$30
$40
$50
$60
$70
$80
Airport Operating Expenditures
Personal Non-Personal/Equipment
$62
$32
$33
$47
$0
$20
$40
$60
$80
$100
$120
$140
$160
$180
$200
Airport Operating Revenues ($millions)
Other Revenue
Concession revenue
Public parking fees
Airline rates and charges
0%
20%
40%
60%
80%
100%
2011 2012 2013 2014 2015 2016 2017 2018 2019
RESIDENT SURVEY% of San José residents rating services as
"excellent" or "good"
Overall ease of using Mineta Airport
Availability of flights at Mineta Airport
78%
72%
0
50
100
150
200
250
300
350
Authorized Positions
$1,282
$0
$200
$400
$600
$800
$1,000
$1,200
$1,400
$1,600
Outstanding Debt ($millions)
$93
$0
$20
$40
$60
$80
$100
$120
Annual Debt Payments ($millions)
Note: Reductions prior to 2010-11 include outsourcing
custodial and curbside management services.
46 City of San José – Annual Report on City Services 2018-19
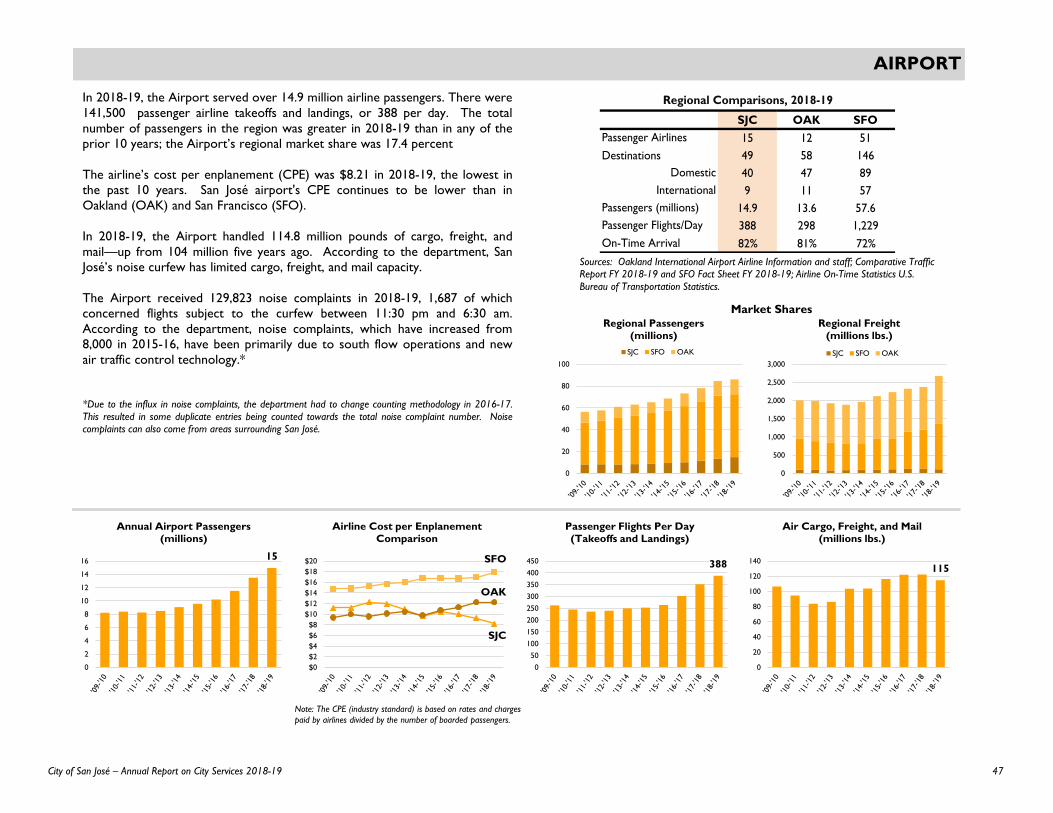
AIRPORT
115
0
20
40
60
80
100
120
140
Air Cargo, Freight, and Mail(millions lbs.)
In 2018-19, the Airport served over 14.9 million airline passengers. There were
141,500 passenger airline takeoffs and landings, or 388 per day. The total
number of passengers in the region was greater in 2018-19 than in any of the
prior 10 years; the Airport’s regional market share was 17.4 percent
The airline’s cost per enplanement (CPE) was $8.21 in 2018-19, the lowest in
the past 10 years. San José airport's CPE continues to be lower than in
Oakland (OAK) and San Francisco (SFO).
In 2018-19, the Airport handled 114.8 million pounds of cargo, freight, and
mail—up from 104 million five years ago. According to the department, San
José’s noise curfew has limited cargo, freight, and mail capacity.
The Airport received 129,823 noise complaints in 2018-19, 1,687 of which
concerned flights subject to the curfew between 11:30 pm and 6:30 am.
According to the department, noise complaints, which have increased from
8,000 in 2015-16, have been primarily due to south flow operations and new
air traffic control technology.*
*Due to the influx in noise complaints, the department had to change counting methodology in 2016-17.
This resulted in some duplicate entries being counted towards the total noise complaint number. Noise
complaints can also come from areas surrounding San José.
Sources: Oakland International Airport Airline Information and staff; Comparative Traffic Report FY 2018-19 and SFO Fact Sheet FY 2018-19; Airline On-Time Statistics U.S.
Bureau of Transportation Statistics.
SJC OAK SFO
15 12 51
Destinations 49 58 146
40 47 89
9 11 57
14.9 13.6 57.6
388 298 1,229
82% 81% 72%On-Time Arrival
Passenger Flights/Day
Regional Comparisons, 2018-19
Passengers (millions)
International
Domestic
Passenger Airlines
0
20
40
60
80
100
Regional Passengers (millions)
SJC SFO OAK
0
500
1,000
1,500
2,000
2,500
3,000
Regional Freight(millions lbs.)
SJC SFO OAK
Market Shares
15
0
2
4
6
8
10
12
14
16
Annual Airport Passengers (millions)
$0
$2
$4
$6
$8
$10
$12
$14
$16
$18
$20
Airline Cost per Enplanement Comparison
OAK
SJC
SFO388
0
50
100
150
200
250
300
350
400
450
Passenger Flights Per Day (Takeoffs and Landings)
Note: The CPE (industry standard) is based on rates and charges
paid by airlines divided by the number of boarded passengers.
47City of San José – Annual Report on City Services 2018-19

48 City of San José – Annual Report on City Services 2018-19
CITY ATTORNEY
The mission of the San José City Attorney’s office is to provide excellent
legal services, consistent with the highest professional and ethical
standards, with the goal of protecting and advancing the City’s interests in
serving the people of San José.
49City of San José – Annual Report on City Services 2018-19

CITY ATTORNEY
The City Attorney’s Office provides legal counsel and advice, prepares legal
documents, and provides legal representation to advocate, defend, and
prosecute on behalf of the City of San José and the Successor Agency to the
San José Redevelopment Agency.
The 2018-19 operating expenditures for the City Attorney’s Office totaled
$19.9 million, which is comprised of personal and non-personal expenditures.
In addition, the City Attorney's Office was responsible for $3.9 million in
other costs, including the management of $3.5 million in general liability claims.
Although staffing increased in recent years, it is still lower compared to a
decade ago.
The City Attorney’s Office handled 935 new claims and litigation matters in
2018-19 and prepared or reviewed more than 9,000 legal transactions,
documents, and memoranda. In 2018-19, litigation-related collections totaled
about $11.7 million, while general liability payments totaled about $3.5 million,
as noted above.
$0
$5
$10
$15
$20
$25
City Attorney Operating Expenditures ($millions)
Personal Services Non-Personal/Equipment
0
20
40
60
80
100
120
City Attorney Authorized Positions
$0
$10
$20
$30
$40
$50
Litigation-Related Collections and General Liability Payments
($millions)
Litigation Collections General Liability Payments
0
200
400
600
800
1,000
1,200
1,400
1,600
Claims and Lawsuits
Lawsuits and administrative actions filed or initated by the City
Lawsuits filed against the City
Claims (General Liability and Workers' Compensation) filed against the City
Note: Litigation-related collections spiked in 2016-17
largely due to a Housing Authority settlement.
50 City of San José – Annual Report on City Services 2018-19

CITY AUDITOR
The mission of the San José City Auditor’s Office is to independently
assess and report on City operations and services.
51City of San José – Annual Report on City Services 2018-19
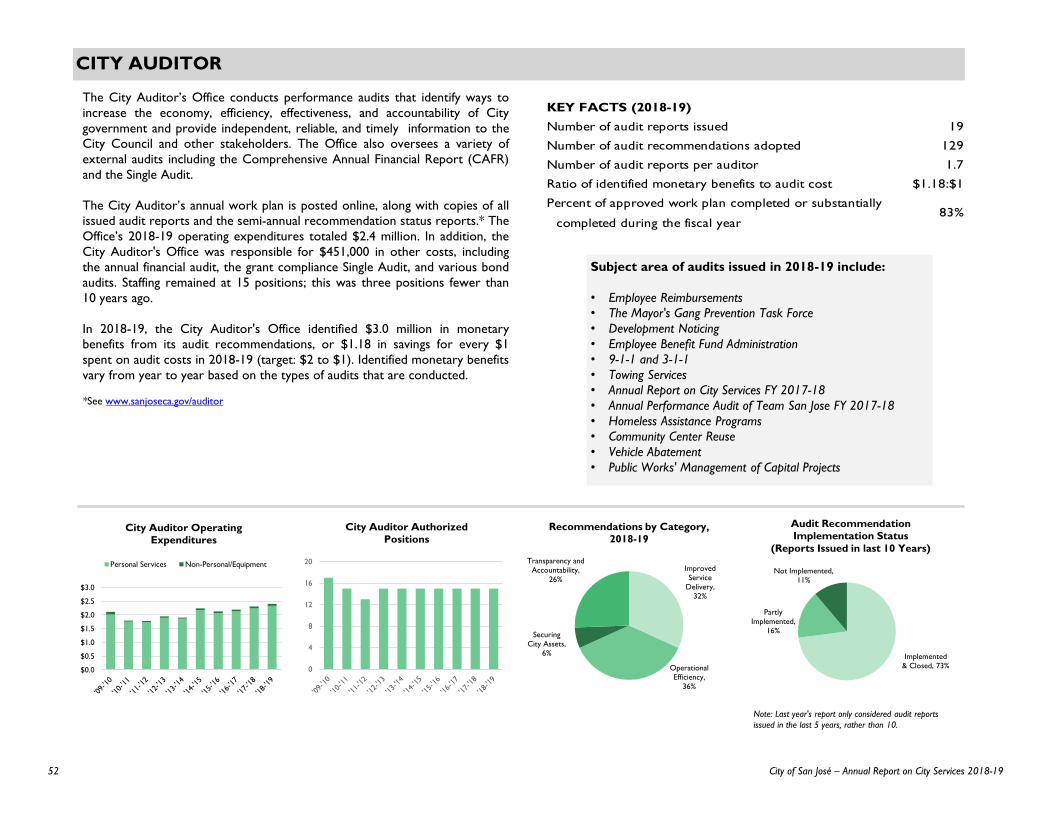
CITY AUDITOR
The City Auditor’s Office conducts performance audits that identify ways to
increase the economy, efficiency, effectiveness, and accountability of City
government and provide independent, reliable, and timely information to the
City Council and other stakeholders. The Office also oversees a variety of
external audits including the Comprehensive Annual Financial Report (CAFR)
and the Single Audit.
The City Auditor’s annual work plan is posted online, along with copies of all
issued audit reports and the semi-annual recommendation status reports.* The
Office’s 2018-19 operating expenditures totaled $2.4 million. In addition, the
City Auditor's Office was responsible for $451,000 in other costs, including
the annual financial audit, the grant compliance Single Audit, and various bond
audits. Staffing remained at 15 positions; this was three positions fewer than
10 years ago.
In 2018-19, the City Auditor's Office identified $3.0 million in monetary
benefits from its audit recommendations, or $1.18 in savings for every $1
spent on audit costs in 2018-19 (target: $2 to $1). Identified monetary benefits
vary from year to year based on the types of audits that are conducted.
*See www.sanjoseca.gov/auditor
$0.0
$0.5
$1.0
$1.5
$2.0
$2.5
$3.0
City Auditor Operating Expenditures
Personal Services Non-Personal/Equipment
0
4
8
12
16
20
City Auditor Authorized Positions
Implemented
& Closed, 73%
Partly
Implemented,
16%
Not Implemented,
11%
Audit Recommendation Implementation Status
(Reports Issued in last 10 Years)
Target
Subject area of audits issued in 2018-19 include:
• Employee Reimbursements
• The Mayor's Gang Prevention Task Force
• Development Noticing
• Employee Benefit Fund Administration
• 9-1-1 and 3-1-1
• Towing Services
• Annual Report on City Services FY 2017-18
• Annual Performance Audit of Team San Jose FY 2017-18
• Homeless Assistance Programs
• Community Center Reuse
• Vehicle Abatement
• Public Works' Management of Capital Projects
KEY FACTS (2018-19)
Number of audit reports issued 19
Number of audit recommendations adopted 129
Number of audit reports per auditor 1.7
Ratio of identified monetary benefits to audit cost $1.18:$1
Percent of approved work plan completed or substantially
completed during the fiscal year83%
Improved
Service
Delivery,
32%
Operational
Efficiency,
36%
Securing
City Assets,
6%
Transparency and
Accountability,
26%
Recommendations by Category, 2018-19
Note: Last year's report only considered audit reports
issued in the last 5 years, rather than 10.
52 City of San José – Annual Report on City Services 2018-19

CITY CLERK
The mission of the San José City Clerk is to maximize public access
to municipal government.
Note: Spikes in expenditures in 2010
Elections expenditures are now consolidated Citywide.
53City of San José – Annual Report on City Services 2018-19

CITY CLERK
**In accordance with the City's Ethics and Open Government Provisions, which include a matrix of public meeting requirements.
$0
$1
$2
$3
$4
$5
City Clerk Operating Expenditures ($millions)
Personal Services Non-Personal/Equipment
Note: Spikes in expenditures in 2010-11 were due to elections.
Elections expenditures are now consolidated Citywide.
0
4
8
12
16
20
City Clerk Authorized Positions
KEY FACTS (2018-19)
Number of meetings staffed 192
Number of agendas posted online 343
Number of Council agenda items 810
Number of ordinances processed 69
Number of resolutions processed 470
Number of records requested (e.g., legislative
histories, contracts, election related documents)
City staff requests 498
Public requests 568
Estimated number of contracts processed 2,040
Number of campaign filings processed 437
Council agendas posted 10 days before a meeting** 100%
Council synopsis posted by the next meeting** 83%
Council Committee minutes posted 5 days before
the relevant Council meeting**
Decision-Making Bodies minutes posted within 10 days** 74%
1,066
26%
The City Clerk’s Office assists the City Council in the legislative process and
maintains the legislative history of the City Council. The Office is responsible for
open government, campaign finance, lobbyist registration, statements of economic
interest, and other public disclosure requirements.* The Office is also responsible
for preparing and distributing agenda items for City Council and various Committee
meetings; providing access to the City’s legislative records and documents under the
California Public Records Act; and reviewing all City contracts for administrative
compliance.
The City Clerk’s operating expenditures totaled $2.4 million in 2018-19, with $2.1
million in personal services and $0.3 million in non-personal expenditures. In addition,
the City Clerk was responsible for $3.4 million in Citywide expenses, out of which
$1.8 million was spent in elections and ballot measures. Staffing remained unchanged
at 15 positions.
The Clerk’s Office also provides administrative support to the Mayor and Council
Offices, tracking office budgets and facilitating the disbursement of grants (410 in
2018-19). The Office coordinated the recruitment of 25 full-time and 12 part-time
staff for the Mayor and Council Offices.
During the 2019 Boards and Commissions Spring Recruitment, the City Clerk’s
Office recruited for 50 appointed positions by screening and processing 137 online
applications.
*The City Auditor’s Office conducted an Audit of the Office of the City Clerk in 2015-16, an Audit on OpenGovernment in 2016-17, and an Audit of Form 700s in 2019-20.
54 City of San José – Annual Report on City Services 2018-19

CITY MANAGER
The mission of the San José City Manager’s Office is to provide strategic leadership that supports the Mayor and the City Council and motivates
and challenges the organization to deliver high quality services that meet the community's needs.
55City of San José – Annual Report on City Services 2018-19

CITY MANAGER
0
20
40
60
80
100
City Manager Authorized Positions
$0
$5
$10
$15
$20
City Manager Operating Expenditures ($millions)
Personal Services Non-Personal/Equipment
Functions of the City Manager's Office:
• Agenda Services oversees agenda development for Council Committees and develops weekly agendas for the City Council and Rules & OpenGovernment Committee with the offices of the City Attorney and the City Clerk.
• Budget develops and monitors the City's operating and capital budgets, ensuring the City's fiscal health.• Civic Innovation executes the City's Smart City Vision, overseeing projects aiming to improve the efficiency and effectiveness of City services
through the use of data and technology.• Communications corresponds with the media on Citywide issues, manages CivicCenter TV, oversees the City’s website, and coordinates the
Open Government program, including coordination of Citywide public records requests.• Policy Development supports the City Council in the formulation, interpretation, and application of public policy.• Intergovernmental Relations monitors state and federal laws and policies, while advocating for legislation addressing City concerns.• Employee Relations negotiates labor contracts and supports a positive, productive, and respectful work environment.
For the Office of Emergency Management and Office of Immigrant Affairs, see next page. For the Office of Economic Development, see p. 61.
The Office of the City Manager (CMO) develops public policy, leads theorganization, and manages Citywide service delivery. 2018-19 operatingexpenditures totaled $18.6 million, including personal and non-personalexpenditures. In addition, the CMO was responsible for $4.6 million inCitywide expenses, which included $1.4 million for Public, Educational, andGovernment Access Facilities capital expenditures. Staffing in 2018-19totaled 84.
35%
34%
38%
42%
46%
49%
47%
45%
19%
17%
15%
13%
0% 50% 100%
Gallup PublicAdministrationDatabase 2019
2016
2017
2019
City Employee Engagement Survey Results
Engaged Not Engaged Actively Disengaged
Engaged—Go above and beyond, are passionate about their work.Not Engaged—Do fine work, but for whom it is just a job.Actively Disengaged—Are disgruntled and may create disruption
Note: No survey was completed in 2018.
KEY FACTS (2018-19)Staff reports approved for City Council consideration 642City Council referrals assigned 77Information memoranda issued 81Neighborhoods Commission meetings staffed 18Community budget meetings held 5Public records requests responded to or coordinated 316Public records requests received Citywide 3,761
56 City of San José – Annual Report on City Services 2018-19

CITY MANAGER
Emergency Operactions Center activation in response to the Curie Fire on July 10, 2018.
Folklórico at World Refugee Day Celebration at City Hall.
42%
0%
20%
40%
60%
80%
100%
RESIDENT SURVEY% of San José residents rating San José's emergency preparedness as
"Excellent" or "Good"
63%
0%
20%
40%
60%
80%
100%
RESIDENT SURVEY% of San José residents rating San José's openness and acceptance as
"Excellent" or "Good"
OFFICE OF EMERGENCY MANAGEMENT
The Office of Emergency Management (OEM) leads efforts to protect life,property, and the environment by managing programs that prevent andrespond to disasters and emergencies. In September 2017, the City movedthe OEM - formerly the Office of Emergency Services - from the FireDepartment to the CMO. OEM's Ready San José! programs include publicoutreach and training in emergency preparedness.
OEM adminsters the Community Emergency Response Team (CERT)trainings. The purpose of the program is to train residents and businesseson how to organize, respond, and recover from major emergencies, such asearthquakes, fires, and floods. The program was reactivated last year.
OFFICE OF IMMIGRANT AFFAIRS
The Office of Immigrant Affairs (OIA) aims to enable civic, economic,linguistic, and social inclusion of immigrants and refugees in San José in away that facilitates opportunities for everyone to reach their fullestpotential. In 2016, City Council adopted the Welcoming San José Plan,which recommends a set of strategies centered on leadership andcommunications; access and engagement; education; economic opportunity;and safe, healthy, and connected communities. OIA collaborates withnonprofits and the County of Santa Clara to support citizenship workshopevents, the Rapid Response Network, and the Pro Bono ImmigrationNetwork. There were 1,212 calls to the Rapid Response Network in 2018-19 to support those impacted by federal immigration enforcement efforts.
RESIDENT SURVEY57% of respondents report they stocked supplies for an emergency.
OIA KEY FACTS (2018-19)City staff receiving language access training 338Citizenship workshop events 3
Total workshop participants 597Participants completed and filed their paperwork 398
Fee waiver applications completed 221
OEM KEY FACTS (2018-19)People reached through public engagement 2,083Graduates from Community Emergency Response Team course 159Emergency Operations Center (EOC) Staff 180
EOC Staff trained this year 84EOC Staff trained overall 139
EOC Percentage staff trained 77%
57City of San José – Annual Report on City Services 2018-19

58 City of San José – Annual Report on City Services 2018-19

COMMUNITY ENERGY
The mission of the Community Energy Department is to procure clean, cost effective energy for the benefit of its customers.
59City of San José – Annual Report on City Services 2018-19
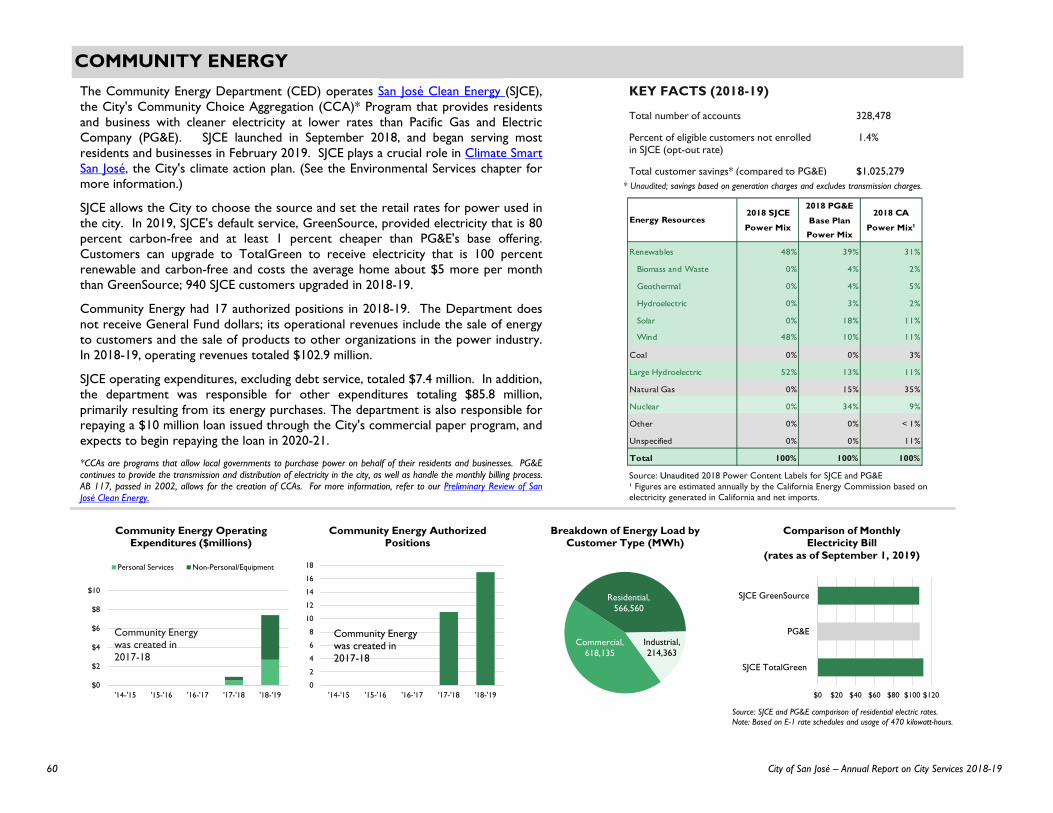
The Community Energy Department (CED) operates San José Clean Energy (SJCE),the City's Community Choice Aggregation (CCA)* Program that provides residentsand business with cleaner electricity at lower rates than Pacific Gas and ElectricCompany (PG&E). SJCE launched in September 2018, and began serving mostresidents and businesses in February 2019. SJCE plays a crucial role in Climate SmartSan José, the City's climate action plan. (See the Environmental Services chapter formore information.)
SJCE allows the City to choose the source and set the retail rates for power used inthe city. In 2019, SJCE's default service, GreenSource, provided electricity that is 80percent carbon-free and at least 1 percent cheaper than PG&E's base offering.Customers can upgrade to TotalGreen to receive electricity that is 100 percentrenewable and carbon-free and costs the average home about $5 more per monththan GreenSource; 940 SJCE customers upgraded in 2018-19.
Community Energy had 17 authorized positions in 2018-19. The Department doesnot receive General Fund dollars; its operational revenues include the sale of energyto customers and the sale of products to other organizations in the power industry.In 2018-19, operating revenues totaled $102.9 million.
SJCE operating expenditures, excluding debt service, totaled $7.4 million. In addition,the department was responsible for other expenditures totaling $85.8 million,primarily resulting from its energy purchases. The department is also responsible forrepaying a $10 million loan issued through the City's commercial paper program, andexpects to begin repaying the loan in 2020-21.
*CCAs are programs that allow local governments to purchase power on behalf of their residents and businesses. PG&Econtinues to provide the transmission and distribution of electricity in the city, as well as handle the monthly billing process.AB 117, passed in 2002, allows for the creation of CCAs. For more information, refer to our Preliminary Review of SanJosé Clean Energy.
KEY FACTS (2018-19)
Total number of accounts 328,478
Percent of eligible customers not enrolled 1.4%in SJCE (opt-out rate)
Total customer savings* (compared to PG&E) $1,025,279
Source: Unaudited 2018 Power Content Labels for SJCE and PG&E¹ Figures are estimated annually by the California Energy Commission based on electricity generated in California and net imports.
$0
$2
$4
$6
$8
$10
'14-'15 '15-'16 '16-'17 '17-'18 '18-'19
Community Energy Operating Expenditures ($millions)
Personal Services Non-Personal/Equipment
0
2
4
6
8
10
12
14
16
18
'14-'15 '15-'16 '16-'17 '17-'18 '18-'19
Community Energy Authorized Positions
Community Energywas created in 2017-18
$0 $20 $40 $60 $80 $100 $120
SJCE TotalGreen
PG&E
SJCE GreenSource
Comparison of Monthly Electricity Bill
(rates as of September 1, 2019)
Community Energywas created in 2017-18
Commercial, 618,135
Residential, 566,560
Industrial, 214,363
Breakdown of Energy Load by Customer Type (MWh)
Source: SJCE and PG&E comparison of residential electric rates.Note: Based on E-1 rate schedules and usage of 470 kilowatt-hours.
* Unaudited; savings based on generation charges and excludes transmission charges.
Energy Resources2018 SJCE
Power Mix
2018 PG&E
Base Plan
Power Mix
2018 CA
Power Mix¹
Renewables 48% 39% 31%
Biomass and Waste 0% 4% 2%
Geothermal 0% 4% 5%
Hydroelectric 0% 3% 2%
Solar 0% 18% 11%
Wind 48% 10% 11%
Coal 0% 0% 3%
Large Hydroelectric 52% 13% 11%
Natural Gas 0% 15% 35%
Nuclear 0% 34% 9%
Other 0% 0% < 1%
Unspecified 0% 0% 11%
Total 100% 100% 100%
COMMUNITY ENERGY
60 City of San José – Annual Report on City Services 2018-19

ECONOMIC DEVELOPMENT
The mission of the Office of Economic Development is to catalyze job creation, private investment, revenue generation, and talent development and attraction.
61City of San José – Annual Report on City Services 2018-19

ECONOMIC DEVELOPMENT
Sources: Bureau of Labor Statistics and 2018 American Community Survey
The City of San José’s Office of Economic Development (OED) leads theCity’s economic strategy, provides assistance for businesses, manages theCity’s real estate assets, helps connect employers with trained workers, andsupports art and cultural amenities in the community.
OED manages several incentive programs for businesses, among them theForeign Trade Zone and the Business Cooperation Program which refundscompanies a portion of use taxes allocated to the City.
OED also oversees agreements with the non-profit operator of the City’sConvention & Cultural Facilities (Team San Jose) and agreements for otherCity-owned cultural facilities.
In 2018-19, OED's operating expenditures totaled $11 million. This includespersonal and non-personal expenditures. The department was responsible for$83.2 million of other costs, including $46.8 million in capital and $9.3 millionin Citywide expenses. Citywide expenses included $1.6 million in propertyleases where the City is the tenant, a $1 million subsidy to the Tech Museumand $1 million to the SJ Works: Youth Jobs Initiative. The City also supportedthe Convention & Cultural Facilities with $4.7 million from hotel tax revenues.
$0
$2
$4
$6
$8
$10
$12
$14
OED Operating Expenditures ($millions)
Personal Services Non-Personal/Equipment
0
10
20
30
40
50
60
70
80
OED Authorized Positions
Note: In ‘11-‘12, Real Estate Services was added to OED.
Note: In ‘13-‘14, the transition of work2future client services to the Foundation eliminated 24 positions.
ECONOMIC STRATEGY WORKPLAN
The current workplan seeks to expand economic opportunity and mobilitythrough business support and facilitation, talent development, supportingtransportation infrastructure, and encouraging downtown development.Recent work included launching "Manufacture : San Jose", a new initiativededicated to growing our manufacturing sector, negotiating a revenue captureagreement with eBay Inc., and the development of retail strategies for NorthSan José, downtown, and citywide. OED staff have also taken a role inresponding to the housing crisis working with the Housing Catalyst Team andon the Cost of Residential Development report and the Development FeeFramework Council priority. OED staff have also engaged in developing theAnti-Displacement Workplan with a specific focus on small businessretention. Source: Office of Economic Development
Shopping opportunities, 73%
Quality of business and service establishments, 56%Quality of economic development, 41%
Vibrant downtown, 30%
0%
10%
20%
30%
40%
50%
60%
70%
80%
90%
100%
2011 2012 2013 2014 2015 2016 2017 2018 2019
RESIDENT SURVEY% of San José residents rating as "excellent" or "good"
Unemployment Rate 2.7%Median Household Income $ 113,036
KEY FACTS (2018-19)
62 City of San José – Annual Report on City Services 2018-19

ECONOMIC DEVELOPMENT
$0.0
$0.5
$1.0
$1.5
$2.0
$2.5
$3.0
$3.5
$4.0
$4.5
Estimated Tax Revenue Generated by OED-assisted Companies ($millions)
new retained combined
Note: The methodology changed in ‘11-‘12. OED revised estimates for '17-'18.
0.83
0.6
0.7
0.8
0.9
1.0
1.1
Jobs Per Employed Residents in San JoséBalance at 1.0 job per resident
Envision 2040 target: 1.1 jobs per resident
0
2,000
4,000
6,000
8,000
10,000
12,000
Estimated Jobs Created or Retained by OED-assisted Companies
new retained combined
64%
64%
0%
10%
20%
30%
40%
50%
60%
70%
80%
90%
100%
RESIDENT SURVEY% of San José residents rating as "excellent" or "good"
Employment opportunities
San José as a place to work
Note: OED revised estimates for '17-'18.
Sources: American Community Survey 5-Year Estimates (2010 through 2017) and 1-Year Estimate for 2018; Association of Bay Area Governments projection (prior to 2010)
BUSINESS DEVELOPMENT AND JOBS
OED promotes business in San José by providing assistance, information, accessto services, and facilitation of the development permit process (also seeDevelopment Services in the Planning, Building and Code Enforcement section).In 2018-19, OED provided development facilitation services to 69 businesses.It also coordinated the Business Owner Space network, through which clientsreceive information, technical and human resources support. Partnerorganizations, like SCORE, a mentoring and training provider to smallbusinesses, provide other services.*
OED estimated companies that received its assistance generated $3.2 million intax revenues (business and sales taxes). In 2018-19, this included the attractionof Hewlett Packard Enterprise, Micron, and Bloom Energy. About $3.73 in taxrevenue was generated for every $1 of OED expenditure on businessdevelopment.
One of OED’s main goals is to catalyze job creation. Companies and businessesthat received OED assistance created about 3,300 jobs and retained about3,600 jobs in 2018-19. With about 443,000 jobs located within the city, SanJosé has less than one job per employed resident. Palo Alto, by contrast, hasmore than three jobs per employed resident. San José is the only large U.S.city where more residents commute to work outside city limits, rather thaninto the city. (See the CSA Dashboard chapter for additional information.)
* For more information on the small business network, see www.businessownerspace.com
RESIDENT SURVEY56% of employed San José residents report they work inside the boundaries of the City
63City of San José – Annual Report on City Services 2018-19
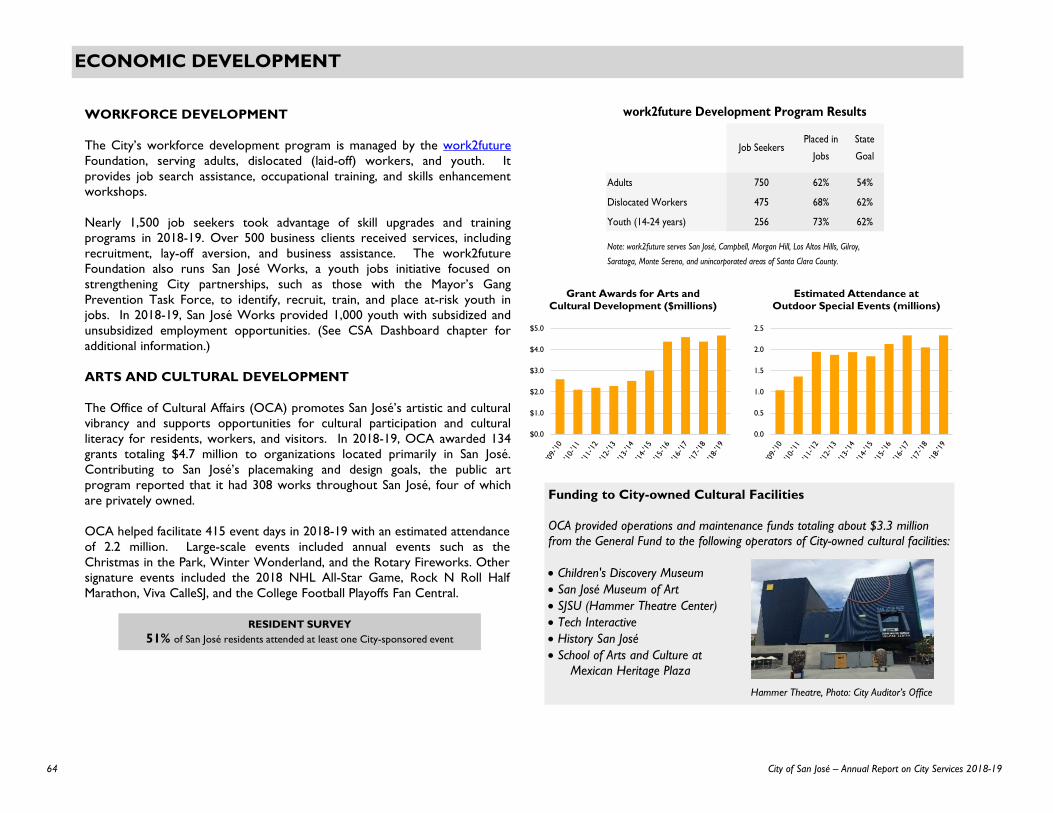
ECONOMIC DEVELOPMENT
WORKFORCE DEVELOPMENT
The City’s workforce development program is managed by the work2futureFoundation, serving adults, dislocated (laid-off) workers, and youth. Itprovides job search assistance, occupational training, and skills enhancementworkshops.
Nearly 1,500 job seekers took advantage of skill upgrades and trainingprograms in 2018-19. Over 500 business clients received services, includingrecruitment, lay-off aversion, and business assistance. The work2futureFoundation also runs San José Works, a youth jobs initiative focused onstrengthening City partnerships, such as those with the Mayor’s GangPrevention Task Force, to identify, recruit, train, and place at-risk youth injobs. In 2018-19, San José Works provided 1,000 youth with subsidized andunsubsidized employment opportunities. (See CSA Dashboard chapter foradditional information.)
ARTS AND CULTURAL DEVELOPMENT
The Office of Cultural Affairs (OCA) promotes San José’s artistic and culturalvibrancy and supports opportunities for cultural participation and culturalliteracy for residents, workers, and visitors. In 2018-19, OCA awarded 134grants totaling $4.7 million to organizations located primarily in San José.Contributing to San José’s placemaking and design goals, the public artprogram reported that it had 308 works throughout San José, four of whichare privately owned.
OCA helped facilitate 415 event days in 2018-19 with an estimated attendanceof 2.2 million. Large-scale events included annual events such as theChristmas in the Park, Winter Wonderland, and the Rotary Fireworks. Othersignature events included the 2018 NHL All-Star Game, Rock N Roll HalfMarathon, Viva CalleSJ, and the College Football Playoffs Fan Central.
Funding to City-owned Cultural Facilities
OCA provided operations and maintenance funds totaling about $3.3 million from the General Fund to the following operators of City-owned cultural facilities:
• Children's Discovery Museum• San José Museum of Art• SJSU (Hammer Theatre Center)• Tech Interactive• History San José• School of Arts and Culture at
Mexican Heritage Plaza
Hammer Theatre, Photo: City Auditor’s Office
0.0
0.5
1.0
1.5
2.0
2.5
Estimated Attendance at Outdoor Special Events (millions)
$0.0
$1.0
$2.0
$3.0
$4.0
$5.0
Grant Awards for Arts and Cultural Development ($millions)
RESIDENT SURVEY51% of San José residents attended at least one City-sponsored event
Adults 750 62% 54%
Dislocated Workers 475 68% 62%
Youth (14-24 years) 256 73% 62%
Note: work2future serves San José, Campbell, Morgan Hill, Los Altos Hills, Gilroy,
Saratoga, Monte Sereno, and unincorporated areas of Santa Clara County.
Job SeekersPlaced in
Jobs
State
Goal
work2future Development Program Results
64 City of San José – Annual Report on City Services 2018-19
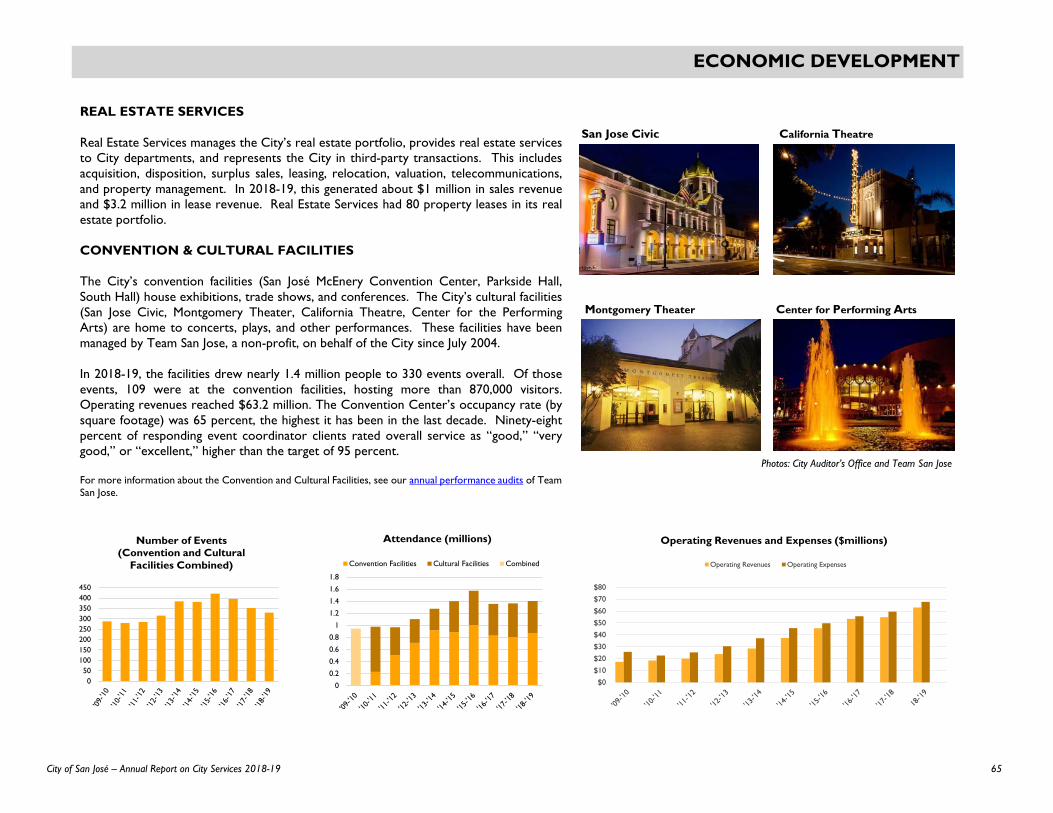
ECONOMIC DEVELOPMENT
REAL ESTATE SERVICES
Real Estate Services manages the City’s real estate portfolio, provides real estate servicesto City departments, and represents the City in third-party transactions. This includesacquisition, disposition, surplus sales, leasing, relocation, valuation, telecommunications,and property management. In 2018-19, this generated about $1 million in sales revenueand $3.2 million in lease revenue. Real Estate Services had 80 property leases in its realestate portfolio.
CONVENTION & CULTURAL FACILITIES
The City’s convention facilities (San José McEnery Convention Center, Parkside Hall,South Hall) house exhibitions, trade shows, and conferences. The City’s cultural facilities(San Jose Civic, Montgomery Theater, California Theatre, Center for the PerformingArts) are home to concerts, plays, and other performances. These facilities have beenmanaged by Team San Jose, a non-profit, on behalf of the City since July 2004.
In 2018-19, the facilities drew nearly 1.4 million people to 330 events overall. Of thoseevents, 109 were at the convention facilities, hosting more than 870,000 visitors.Operating revenues reached $63.2 million. The Convention Center’s occupancy rate (bysquare footage) was 65 percent, the highest it has been in the last decade. Ninety-eightpercent of responding event coordinator clients rated overall service as “good,” “verygood,” or “excellent,” higher than the target of 95 percent.
For more information about the Convention and Cultural Facilities, see our annual performance audits of Team San Jose.
Photos: City Auditor’s Office and Team San Jose
San Jose Civic California Theatre
Center for Performing ArtsMontgomery Theater
050
100150200250300350400450
Number of Events(Convention and Cultural
Facilities Combined)
0
0.2
0.4
0.6
0.8
1
1.2
1.4
1.6
1.8
Attendance (millions)
Convention Facilities Cultural Facilities Combined
$0$10$20$30$40$50$60$70$80
Operating Revenues and Expenses ($millions)
Operating Revenues Operating Expenses
65City of San José – Annual Report on City Services 2018-19

66 City of San José – Annual Report on City Services 2018-19

ENVIRONMENTAL SERVICES
The mission of the Environmental Services Department is to deliver world-class utility services and programs to improve our health,
environment, and economy.
67City of San José – Annual Report on City Services 2018-19

ENVIRONMENTAL SERVICES
$0
$50
$100
$150
$200
$250
$300
ESD Operating Expenditures ($millions)
Personal Services Non-Personal/Equipment
0
100
200
300
400
500
600
ESD Authorized Positions
The Environmental Services Department (ESD) provides recycling and garbageservices, wastewater treatment, potable water delivery, stormwatermanagement, and recycled water management. ESD also manages programsto conserve water and energy resources and achieve other environmentalgoals.
ESD provides Citywide coordination of efforts to protect and conserve air,land, water, and energy resources through policy development, education,and grant-seeking. This work is guided by the City’s Climate Smart San JoséPlan and regulatory requirements.
Most ESD revenue comes from various customer fees and charges;approximately 1 percent of its budget comes from the General Fund (about$5.2 million in 2018-19).
In 2018-19, ESD’s operating expenditures totaled $268.7 million, includingpersonal and non-personal expenditures. In addition, the department wasresponsible for other expenditures including $120.9 million in capitalexpenditures and $2.2 million in Citywide expenditures. Staffing in 2018-19included 550 full-time equivalent positions, a slight decrease from 2017-18 butrepresenting a 9 percent increase from ten years ago.
Wastewater treatment,
331
Other, 75
Recycling and Garbage Services, 45
Stormwater Management, 40
Potable Water Delivery, 35
Recycled Water Management, 24
ESD Staffing Breakdown by Positions per Service (2018-19)
Wastewater Treatment
26%
Recycling and Garbage Services
47%Potable Water Delivery
15%
Other6%
Recycled Water Management3%
Stormwater Management3%
ESD Expenditures Breakdown (2018-19)
39% Air quality
42% Quality of overall natural environment in San José
42% Preservation of natural areas such as open space, farmlands, and
greenbelts
74% of San José residents made efforts to make their homes more
energy efficient during the past 12 months
% of San José residents surveyed who rated the following as
"excellent" or "good"
RESIDENT SURVEY
68 City of San José – Annual Report on City Services 2018-19

ENVIRONMENTAL SERVICESRECYCLING & GARBAGE SERVICESsdfdf
ESD provides recycling and garbage services to over 326,000 residentialhouseholds in San José through contracted service providers. ESD alsoprovides waste management programs and services for San José businesses,large events, public areas, and City facilities. It manages contracts forcommercial collection and recyclables processing, organics processing, andconstruction waste collection services in the City. ESD’s operatingexpenditures for recycling and garbage services was $125.3 million.sdfsdf
The state monitors each jurisdiction’s “per capita disposal rate” and requiresthat 50 percent of solid waste be diverted* from landfills. The Department ofResources Recycling and Recovery, CalRecycle, has taken a statewideapproach to meet the State’s goal of achieving 75 percent “recycling” by 2020.sdfsdf
Since 2007, San José has diverted at least 60 percent of waste, including 64percent in 2018. However, disruptions in the recyclables market may impactthe City's ability to meet state diversion requirements in future years. In 2018,China implemented its "National Sword" policy, restricting the imports ofrecyclable materials. China also implemented tariffs of up to 50 percent onrecyclable imports. California's cities have historically relied on exportingrecyclable materials to China to meet state diversion goals. The City isexploring infrastructure and partnership opportunities to manage recyclablesdomestically and help achieve state diversion requirements.
sdfsdf
* “Diversion” refers to any combination of waste prevention, recycling, reuse, and composting activities thatreduces waste disposed at landfills. (Source: CA Integrated Waste Management Board)
50%
60%
70%
80%
90%
100%
RESIDENT SURVEY% of San José residents rating services as "excellent" or
"good"
Yard waste pickup
Garbage collection
Recycling
0
100,000
200,000
300,000
400,000
500,000
Tons of Residential Solid Waste Recycled vs. Landfilled
Solid waste recycled,reused, or composted
Solid waste landfilled
RESIDENT SURVEY
94% of San José residents surveyed reported recycling athome "usually" or "always"sdfsdf
46% of San José residents rated utility billing "excellent" or"good"
$0
$5
$10
$15
$20
$25
$30
$35
San José Garbage and Recycling Monthly Bills (32-gallon cart)
$0 $10 $20 $30 $40 $50 $60
Cupertino
Santa Clara
Redwood City
Mountain View
SAN JOSE
Milpitas
Sunnyvale
Palo Alto
Comparison of Monthly Residential Garbage and Recycling Rates (2018-19)
Sources: Rates listed on local government websites for municipalities provided.Note: Rates listed for all municipalities are for the 32-gallon cart size (with the exception of Sunnyvale’s 35-gallon cart and Milpitas's 26-gallon cart.) Although this is San José’s smallest and standard cart, some municipalities offer smaller 20-gallon bins.
69City of San José – Annual Report on City Services 2018-19
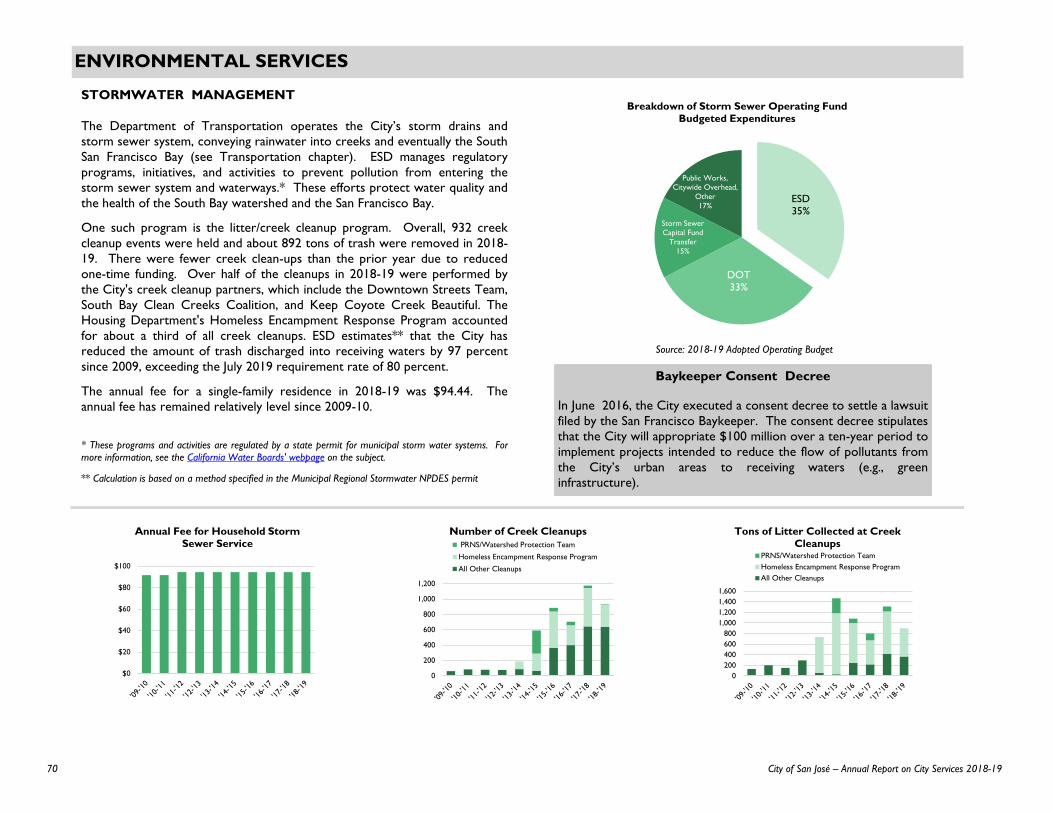
ENVIRONMENTAL SERVICES
0
200
400
600
800
1,000
1,200
Number of Creek Cleanups PRNS/Watershed Protection Team
Homeless Encampment Response Program
All Other Cleanups
0200400600800
1,0001,2001,4001,600
Tons of Litter Collected at Creek Cleanups
PRNS/Watershed Protection TeamHomeless Encampment Response ProgramAll Other Cleanups
$0
$20
$40
$60
$80
$100
Annual Fee for Household Storm Sewer Service
ESD35%
DOT33%
Storm Sewer Capital Fund
Transfer15%
Public Works, Citywide Overhead,
Other17%
Breakdown of Storm Sewer Operating Fund Budgeted Expenditures
Baykeeper Consent Decree
In June 2016, the City executed a consent decree to settle a lawsuitfiled by the San Francisco Baykeeper. The consent decree stipulatesthat the City will appropriate $100 million over a ten-year period toimplement projects intended to reduce the flow of pollutants fromthe City’s urban areas to receiving waters (e.g., greeninfrastructure).
Source: 2018-19 Adopted Operating Budget
STORMWATER MANAGEMENT
The Department of Transportation operates the City’s storm drains andstorm sewer system, conveying rainwater into creeks and eventually the SouthSan Francisco Bay (see Transportation chapter). ESD manages regulatoryprograms, initiatives, and activities to prevent pollution from entering thestorm sewer system and waterways.* These efforts protect water quality andthe health of the South Bay watershed and the San Francisco Bay.sdfsdf
One such program is the litter/creek cleanup program. Overall, 932 creekcleanup events were held and about 892 tons of trash were removed in 2018-19. There were fewer creek clean-ups than the prior year due to reducedone-time funding. Over half of the cleanups in 2018-19 were performed bythe City's creek cleanup partners, which include the Downtown Streets Team,South Bay Clean Creeks Coalition, and Keep Coyote Creek Beautiful. TheHousing Department's Homeless Encampment Response Program accountedfor about a third of all creek cleanups. ESD estimates** that the City hasreduced the amount of trash discharged into receiving waters by 97 percentsince 2009, exceeding the July 2019 requirement rate of 80 percent.sdfsdf
The annual fee for a single-family residence in 2018-19 was $94.44. Theannual fee has remained relatively level since 2009-10.
sdsdfsdfs* These programs and activities are regulated by a state permit for municipal storm water systems. Formore information, see the California Water Boards' webpage on the subject.sdfsdfs
** Calculation is based on a method specified in the Municipal Regional Stormwater NPDES permit
70 City of San José – Annual Report on City Services 2018-19
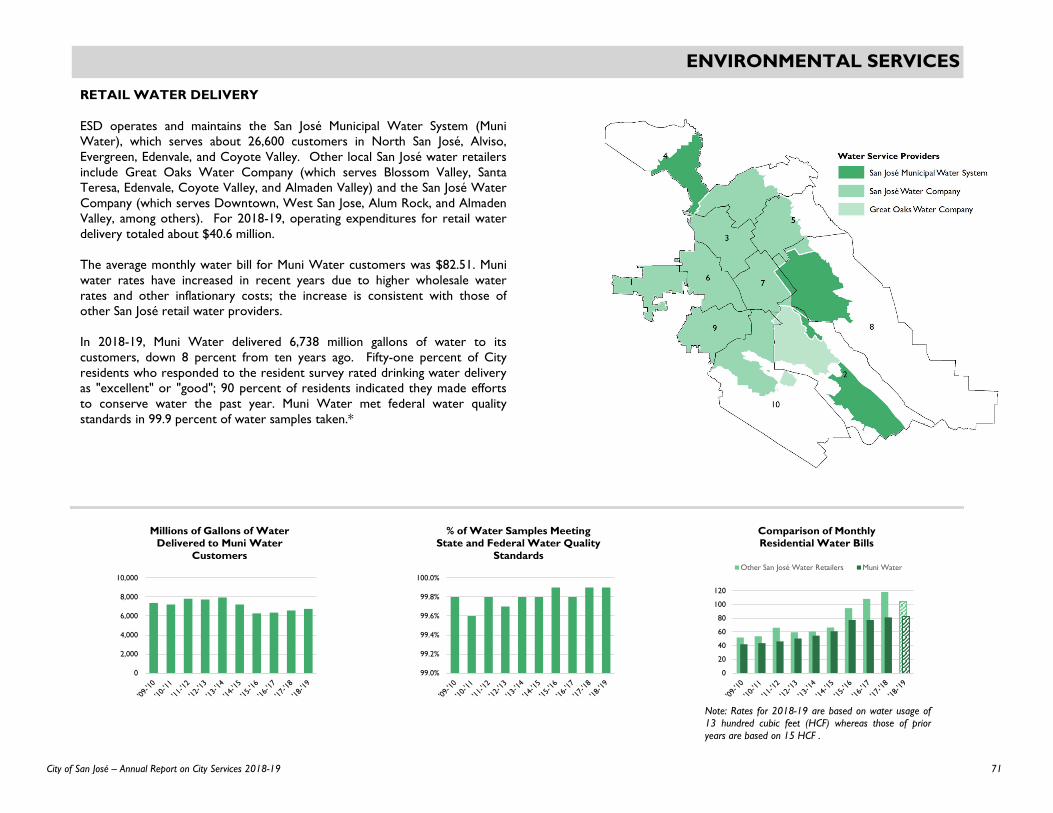
ENVIRONMENTAL SERVICES
`
0
20
40
60
80
100
120
Comparison of Monthly Residential Water Bills
Other San José Water Retailers Muni Water
0
2,000
4,000
6,000
8,000
10,000
Millions of Gallons of Water Delivered to Muni Water
Customers
99.0%
99.2%
99.4%
99.6%
99.8%
100.0%
% of Water Samples Meeting State and Federal Water Quality
Standards
RETAIL WATER DELIVERY
ESD operates and maintains the San José Municipal Water System (MuniWater), which serves about 26,600 customers in North San José, Alviso,Evergreen, Edenvale, and Coyote Valley. Other local San José water retailersinclude Great Oaks Water Company (which serves Blossom Valley, SantaTeresa, Edenvale, Coyote Valley, and Almaden Valley) and the San José WaterCompany (which serves Downtown, West San Jose, Alum Rock, and AlmadenValley, among others). For 2018-19, operating expenditures for retail waterdelivery totaled about $40.6 million.
The average monthly water bill for Muni Water customers was $82.51. Muniwater rates have increased in recent years due to higher wholesale waterrates and other inflationary costs; the increase is consistent with those ofother San José retail water providers.
In 2018-19, Muni Water delivered 6,738 million gallons of water to itscustomers, down 8 percent from ten years ago. Fifty-one percent of Cityresidents who responded to the resident survey rated drinking water deliveryas "excellent" or "good"; 90 percent of residents indicated they made effortsto conserve water the past year. Muni Water met federal water qualitystandards in 99.9 percent of water samples taken.*
Note: Rates for 2018-19 are based on water usage of13 hundred cubic feet (HCF) whereas those of prioryears are based on 15 HCF .
71City of San José – Annual Report on City Services 2018-19

ENVIRONMENTAL SERVICES
WASTEWATER TREATMENT
The City’s Department of Transportation maintains the City’s sanitary sewersystem (see Transportation chapter) that flows to the San José-Santa ClaraRegional Wastewater Facility. ESD staff at the Facility provides wastewatertreatment for approximately 1.5 million residents in San José and surroundingcommunities. The Facility is co-owned with the City of Santa Clara; however,it is managed and operated by ESD. ESD also manages pretreatment programsto control for pollutants at their source. For 2018-19, operating expenditurestotaled $70.8 million. ESD wastewater treatment operations account for thelargest share of ESD employees: 331 full-time budgeted positions out of 550total.
The Wastewater Facility continues to meet the Regional Water QualityControl Board’s permit requirements for water discharged into the SanFrancisco Bay. In 2018-19, pollutant discharge requirements were met orsurpassed 100 percent of the time.
The cost per million gallons treated was $1,367. Aging infrastructure at theFacility has required increased maintenance and capital costs. In accordancewith the Plant Master Plan adopted in 2013, the City is moving forward withover $2 billion in long-term capital improvement projects to upgrade andrebuild the facility over the next 30 years.*
* For more information, see the Capital Improvement Program webpage.
$0
$200
$400
$600
$800
$1,000
$1,200
$1,400
$1,600
'15-'16 '16-'17 '17-'18 '18-'19
Cost per Millions of Gallons Treated
htt // j /A
0
20
40
60
80
100
120
Millions of Gallons per Day Discharged to Bay During
Average Dry Weather Season
$0 $10 $20 $30 $40 $50 $60
Palo Alto
SAN JOSE
Mountain View
Santa Clara
Cupertino Santiary Dist.
West Valley Sanitation Dist.
Sunnyvale
Milpitas
Comparison of Monthly Sewer Rates* (2018-19)
* Sewer rates pay for costs of the sewer system as well as wastewater treatment.Sources: Rates listed on local government websites for municipalities provided.
Wastewater treatment service area includes
1.5 million residents in the South Bay Area.
Allowed by State
Note: Based on 2018 Annual Self-Monitoring Report. In 2018, the dry weather period was from June through August. In past years, the dry weather period was from July through September.
72 City of San José – Annual Report on City Services 2018-19
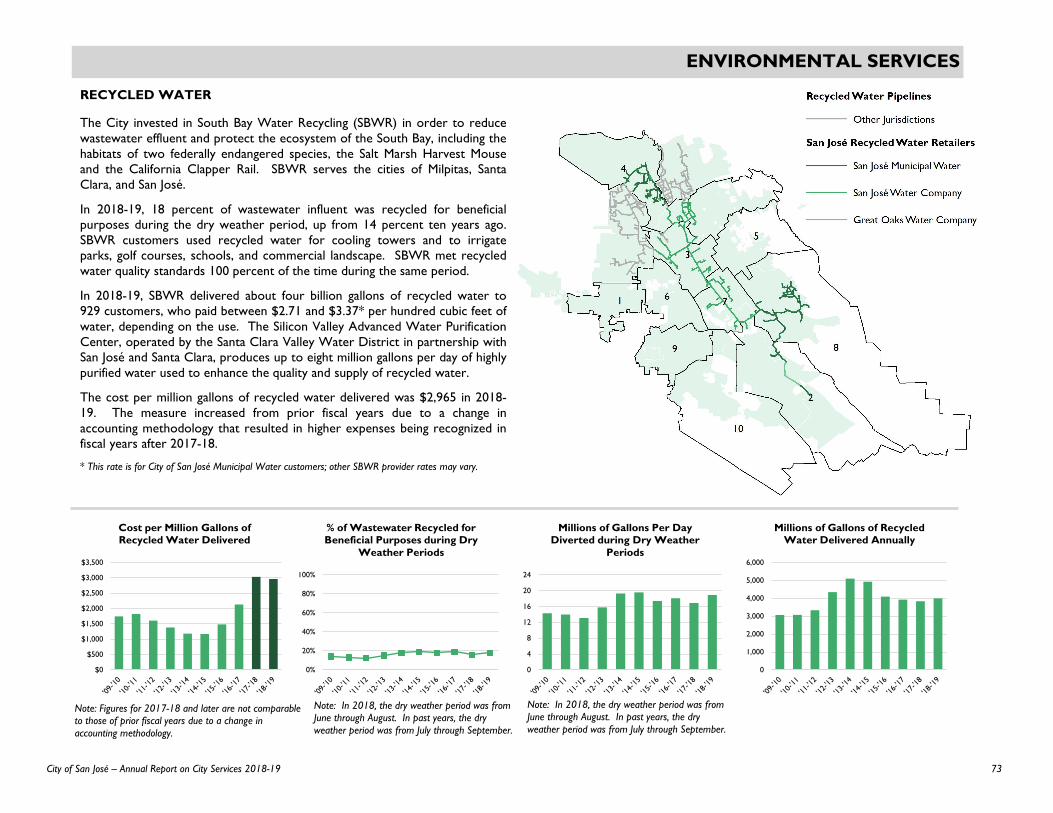
ENVIRONMENTAL SERVICES
RECYCLED WATERasdasdThe City invested in South Bay Water Recycling (SBWR) in order to reducewastewater effluent and protect the ecosystem of the South Bay, including thehabitats of two federally endangered species, the Salt Marsh Harvest Mouseand the California Clapper Rail. SBWR serves the cities of Milpitas, SantaClara, and San José.asdas
In 2018-19, 18 percent of wastewater influent was recycled for beneficialpurposes during the dry weather period, up from 14 percent ten years ago.SBWR customers used recycled water for cooling towers and to irrigateparks, golf courses, schools, and commercial landscape. SBWR met recycledwater quality standards 100 percent of the time during the same period.asdasd
In 2018-19, SBWR delivered about four billion gallons of recycled water to929 customers, who paid between $2.71 and $3.37* per hundred cubic feet ofwater, depending on the use. The Silicon Valley Advanced Water PurificationCenter, operated by the Santa Clara Valley Water District in partnership withSan José and Santa Clara, produces up to eight million gallons per day of highlypurified water used to enhance the quality and supply of recycled water.asdasd
The cost per million gallons of recycled water delivered was $2,965 in 2018-19. The measure increased from prior fiscal years due to a change inaccounting methodology that resulted in higher expenses being recognized infiscal years after 2017-18.asdasd* This rate is for City of San José Municipal Water customers; other SBWR provider rates may vary.
0
1,000
2,000
3,000
4,000
5,000
6,000
Millions of Gallons of Recycled Water Delivered Annually
$0
$500
$1,000
$1,500
$2,000
$2,500
$3,000
$3,500
Cost per Million Gallons of Recycled Water Delivered
0%
20%
40%
60%
80%
100%
% of Wastewater Recycled for Beneficial Purposes during Dry
Weather Periods
0
4
8
12
16
20
24
Millions of Gallons Per Day Diverted during Dry Weather
Periods
Note: Figures for 2017-18 and later are not comparable to those of prior fiscal years due to a change in accounting methodology.
Note: In 2018, the dry weather period was from June through August. In past years, the dry weather period was from July through September.
Note: In 2018, the dry weather period was from June through August. In past years, the dry weather period was from July through September.
73City of San José – Annual Report on City Services 2018-19

CLIMATE SMART SAN JOSÉ On February 27, 2018, the San José City Council adopted the Climate Smart San José Plan. The plan is a continuation of the 2007 San José Green Vision, andrepresents San José's commitment to meeting the greenhouse gas (GHG) emission reduction targets of the Paris Climate Agreement. Climate Smart San Josélays out eight goals, focusing on reducing air pollution, saving water, and creating a stronger and healthier community.
ESD staff has also created a Climate Smart Dashboard to track progress on GHG emissions and Climate Smart milestones. The dashboard presents data onstrategies related to energy, mobility, water, and economy. See the dashboard online at the following link: http://dashboard.climatesmartsj.org
Climate Smart Goals Status to Date
1. By 2021, San José Clean Energy (SJCE) will offer 100 percent greenhouse gas-free power as a base product.
SJCE started serving both residents and businesses in February 2019. SJCE provides electricity that is 45
percent renewable and 80 percent carbon free. It is on track to be 100 percent carbon neutral by 2021. (See
the Community Energy chapter for more information.)
2. By 2040, San José will be the world's first one gigawatt solar city. Total solar capacity installed is 168 megawatts.
3. By 2030, 60 percent of all passenger vehicles in the City will be electric, making San José the electric car
capital of the U.S.
The City Council adopted a building reach code that requires electric vehicle readiness in all buildings with an
application for a building permit submitted after 2019.
4. Beginning in 2020, all new homes will be Zero Net Energy and, by 2030, 25 percent of all existing homes will
be energy efficient and all-electric.
The City Council adopted a natural gas infrastructure prohibition for all new detached accessory dwelling units,
single-family, and low-rise multi-family buildings with an application for a building permit submitted after 2019.
5. By 2030, San José will create an additional 22 million square feet of commercial workspace located within a
half-mile of transit.
In 2018-19, the City issued permits totaling 2.35 million square feet of commercial, office, retail space within a
half-mile of transit.
6. By 2030, San José will have developed 40,000 dwelling units in urban villages and focused growth areas.Since the adoption of the General Plan in 2011, the City has permitted approximately 9,586 units within urban
villages and focused growth areas.
7. By 2040, only four out of ten commute trips in San José will be taken in single-occupancy vehicles. An estimated 4 percent of commutes are by walking or cycling.
8. By 2030, San José will reduce its per capita residential water consumption by 30 percent compared to 2009
levels.
In 2018, residential water consumption was 48.69 gallons per capita per day, a reduction of 19 percent
compared to 2009 levels.
74 City of San José – Annual Report on City Services 2018-19
FINANCE
The mission of the Finance Department is to manage, protect and report on the City of San José's financial resources to enhance the City's financial
condition for our residents, businesses, and investors.
75City of San José – Annual Report on City Services 2018-19

FINANCE
RDA and Housing Set-Aside
TABs/CSCDA Loans/HUD/ERAF,
$1.57
Airport Revenue
Bonds/CP, $1.21
CSJFA Bonds/CP
Notes/Lease-Purchase
Agreements, $0.52CSJ GO
Bonds/HUD Loan, $0.32
Land-Secured
Financing, $0.13
Sewer Revenue
Bonds/State Loans, $0.10
Outstanding Debt Issued by All Agencies, June 30, 2019
($billions)
0.0%
0.5%
1.0%
1.5%
2.0%
2.5%
$0.0
$0.2
$0.4
$0.6
$0.8
$1.0
$1.2
$1.4
$1.6
$1.8
City Cash and Investments($billions)
Cash and Investments Average ROI
0
20
40
60
80
100
120
140
Authorized Positions
The Finance Department manages the City’s debt, investments, disbursements,financial reporting, purchasing, insurance, and revenue collection. In 2018-19 thedepartment had 121 authorized positions, and its operating expenditures totaled$18 million. This included personal and non-personal/equipment expenditures. Inaddition, Finance was responsible for $253.2 million in other expenses, including$228.2 million in debt service.
The Accounting Division is responsible for timely payments to vendors andemployees, and for providing relevant financial information to the public. RevenueManagement supports timely billing and revenue collection efforts. The divisioncollected $1 billion of the City's overall revenue in 2018-19, which includes salestax and other revenues.
Purchasing is responsible for ensuring cost-effective procurement of qualityproducts and services, and ensuring adequate insurance coverage for the City’sassets. In 2018-19, the department procured $164.2 million dollars of productsand services, a decrease from $191.4 million last year. Much of this decrease isdue to expensive purchases last year, including electric buses for the Airport, newfire trucks, and a helicopter for the Police Department.
Treasury manages the City’s cash and investment portfolio. The primary objectivesof the investment program, in priority order, are safety, liquidity, and yield. In2018-19, investment funds earned an average of 2.2 percent. Treasury also issuesdebt and administers a debt portfolio totaling $4.6 billion at the end of 2018-19.Actual debt issued was $640 million in 2018-19, primarily resulting from refundingdebt associated with the Successor Agency to the Redevelopment Agency (SARA).
$0
$5
$10
$15
$20
Operating Expenditures($millions)
Personal Services Non-Personal/Equipment
$0
$50
$100
$150
$200
$250
Total Dollars Procured($millions)
$0
$1
$2
$3
$4
$5
$6
$7
Total Debt Managed($billions)
Note: Total debt managed includes conduit debt outstanding (multifamily housing revenue bonds). Pie chart to the right does not include conduit debt. For more information, see the City’s Comprehensive Annual Debt Reports.
KEY FACTS (2018-19)Average investment portfolio $1.6 BillionTotal debt managed $4.5 BillionSan José credit rating: Moody's Aa1
S&P AA+Fitch AA+
76 City of San José – Annual Report on City Services 2018-19
FIRE
The mission of the San José Fire Department is to serve the community by
protecting life, property, and the environment through prevention and
response.
77City of San José – Annual Report on City Services 2018-19

FIRE
0
200
400
600
800
1,000
Fire Department Authorized Positions
$0
$50
$100
$150
$200
$250
Fire Department Operating Expenditures ($millions)
Personal Services Non-Personal/Equipment
The mission of the San José Fire Department is to serve the community by
protecting life, property, and the environment through prevention and
response.
The San José Fire Department provides fire suppression, emergency medical
services (EMS), and fire prevention services to residents and visitors within
San José’s geographic boundaries, totaling approximately 200 square miles
(including some unincorporated areas). Other fire prevention services include
regulatory enforcement of fire and hazardous materials codes through
inspection activities and construction plan reviews for residents and
businesses. The Department provides emergency Advanced Life Support first-
response services, and the County of Santa Clara contracts with a private
company for emergency ambulance services.
In 2018-19, the Department’s operating expenditures totaled $224 million.
This includes personal and non-personal expenditures. The Department was
responsible for additional costs including $14.7 million in Citywide and other
expenses, of which $6.7 million was for workers' compensation claims. There
were 823 authorized positions in the Department in 2018-19.
84%
76%
0%
20%
40%
60%
80%
100%
RESIDENT SURVEY
% of San José residents rating services
as "excellent" or "good"
Fire Services Ambulance or EMS
55%
0%
20%
40%
60%
80%
100%
RESIDENT SURVEY% of San José residents rating fire
prevention and education as "excellent" or "good"
Source: San José Fire Department, photo of Engine 13
Source: San José Fire Department, photo of Communications staff
78 City of San José – Annual Report on City Services 2018-19

FIRE
Note: Fire Station #20 dedicated to Mineta San José International Airport. Fire Station #33 closed in August 2010. Incidents
the numbering of Fire Station #32 for future use.
Fire Stations and Number of 2018-19
Emergency Incidents by Station Areas (see following page for graph of data)
Source: Auditor analysis based on incident data provided by Fire Department. Note: Data shows incidents by geographic area, not by responding unit.
* Fire Station #20 dedicated to Mineta San José International Airport. Fire Station #33 closed in August 2010. Incidents within the district of Station #33handled by other stations. The Department has reserved the numbering of Fire Station #32 for future use.
KEY FACTS (2018-19)
Fire stations 33
Engine companies 32
Truck companies 9
Squad units 3
Emergency incidents
Emergency medical incidents 57,500
Fires 3,100
Rescue, Haz Mat, and non-fire
hazards6,700
Other 24,600
Total 91,900
Other category includes service requests, false alarms, good intent responses, and canceled en
route incidents
79City of San José – Annual Report on City Services 2018-19
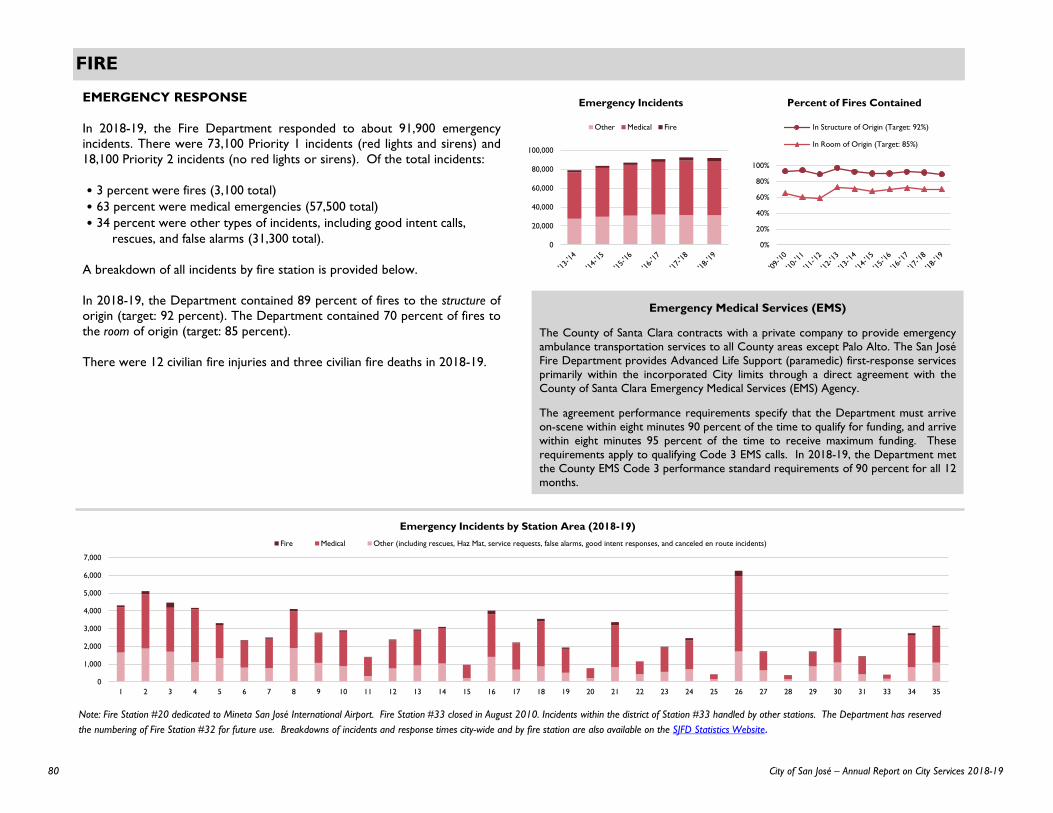
FIRE
Note: Fire Station #20 dedicated to Mineta San José International Airport. Fire Station #33 closed in August 2010. Incidents within the district of Station #33 handled by other stations. The Department has reserved
the numbering of Fire Station #32 for future use. Breakdowns of incidents and response times city-wide and by fire station are also available on the SJFD Statistics Website.
EMERGENCY RESPONSE
In 2018-19, the Fire Department responded to about 91,900 emergency
incidents. There were 73,100 Priority 1 incidents (red lights and sirens) and
18,100 Priority 2 incidents (no red lights or sirens). Of the total incidents:
• 3 percent were fires (3,100 total)
• 63 percent were medical emergencies (57,500 total)
• 34 percent were other types of incidents, including good intent calls,
rescues, and false alarms (31,300 total).
A breakdown of all incidents by fire station is provided below.
In 2018-19, the Department contained 89 percent of fires to the structure of
origin (target: 92 percent). The Department contained 70 percent of fires to
the room of origin (target: 85 percent).
There were 12 civilian fire injuries and three civilian fire deaths in 2018-19.
0
20,000
40,000
60,000
80,000
100,000
Emergency Incidents
Other Medical Fire
0
1,000
2,000
3,000
4,000
5,000
6,000
7,000
1 2 3 4 5 6 7 8 9 10 11 12 13 14 15 16 17 18 19 20 21 22 23 24 25 26 27 28 29 30 31 33 34 35
Emergency Incidents by Station Area (2018-19)
Fire Medical Other (including rescues, Haz Mat, service requests, false alarms, good intent responses, and canceled en route incidents)
0%
20%
40%
60%
80%
100%
Percent of Fires Contained
In Structure of Origin (Target: 92%)
In Room of Origin (Target: 85%)
Emergency Medical Services (EMS)
The County of Santa Clara contracts with a private company to provide emergency
ambulance transportation services to all County areas except Palo Alto. The San José
Fire Department provides Advanced Life Support (paramedic) first-response services
primarily within the incorporated City limits through a direct agreement with the
County of Santa Clara Emergency Medical Services (EMS) Agency.
The agreement performance requirements specify that the Department must arrive
on-scene within eight minutes 90 percent of the time to qualify for funding, and arrive
within eight minutes 95 percent of the time to receive maximum funding. These
requirements apply to qualifying Code 3 EMS calls. In 2018-19, the Department met
the County EMS Code 3 performance standard requirements of 90 percent for all 12
months.
Note: Fire Station #20 dedicated to Mineta San José International Airport. Fire Station #33 closed in August 2010. Incidentsnumbering of Fire Station #32 for future use.
KEY FACTS (2018-19)
Fire stations 33
Engine companies 32
Truck companies 9
Squad units 3
Emergency incidents
Emergency medical incidents 57,500
Fires 3,100
Rescue, Haz Mat, and non-fire
hazards6,700
Other 24,600
Total 91,900
80 City of San José – Annual Report on City Services 2018-19
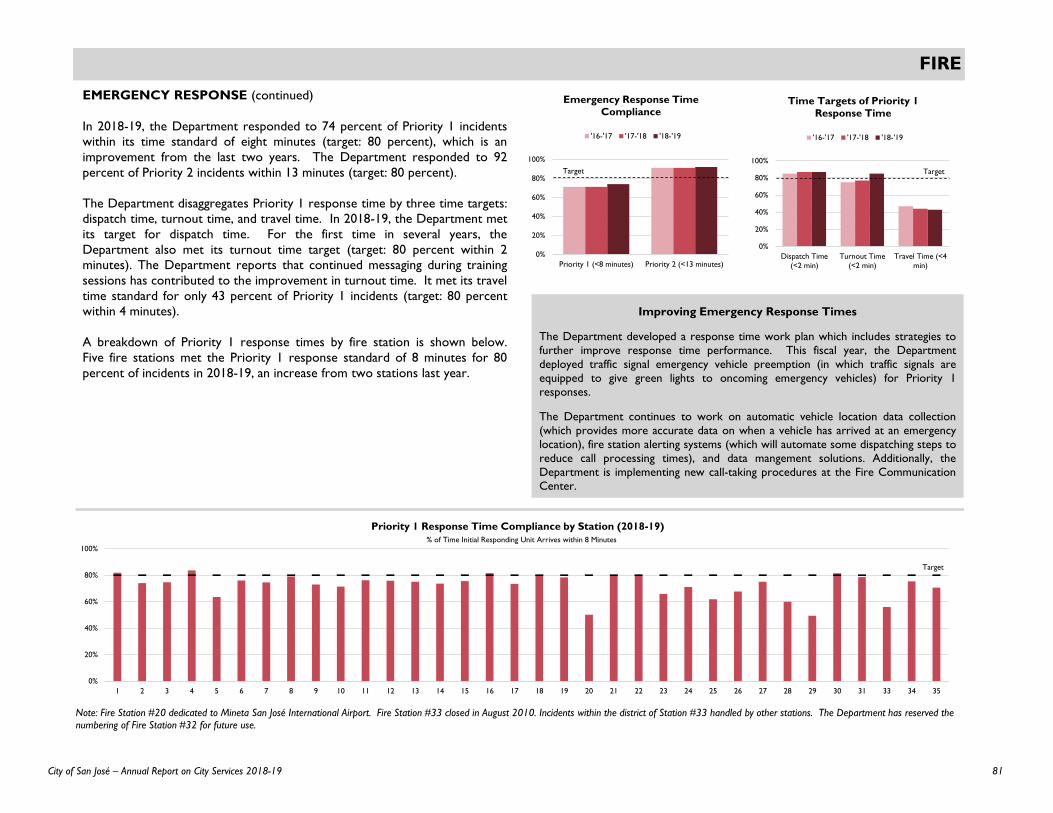
FIRE
EMERGENCY RESPONSE (continued)
In 2018-19, the Department responded to 74 percent of Priority 1 incidents
within its time standard of eight minutes (target: 80 percent), which is an
improvement from the last two years. The Department responded to 92
percent of Priority 2 incidents within 13 minutes (target: 80 percent).
The Department disaggregates Priority 1 response time by three time targets:
dispatch time, turnout time, and travel time. In 2018-19, the Department met
its target for dispatch time. For the first time in several years, the
Department also met its turnout time target (target: 80 percent within 2
minutes). The Department reports that continued messaging during training
sessions has contributed to the improvement in turnout time. It met its travel
time standard for only 43 percent of Priority 1 incidents (target: 80 percent
within 4 minutes).
A breakdown of Priority 1 response times by fire station is shown below.
Five fire stations met the Priority 1 response standard of 8 minutes for 80
percent of incidents in 2018-19, an increase from two stations last year.
0%
20%
40%
60%
80%
100%
Dispatch Time
(<2 min)
Turnout Time
(<2 min)
Travel Time (<4
min)
Time Targets of Priority 1 Response Time
'16-'17 '17-'18 '18-'19
Target
0%
20%
40%
60%
80%
100%
Priority 1 (<8 minutes) Priority 2 (<13 minutes)
Emergency Response Time Compliance
'16-'17 '17-'18 '18-'19
0%
20%
40%
60%
80%
100%
1 2 3 4 5 6 7 8 9 10 11 12 13 14 15 16 17 18 19 20 21 22 23 24 25 26 27 28 29 30 31 33 34 35
Priority 1 Response Time Compliance by Station (2018-19)
% of Time Initial Responding Unit Arrives within 8 Minutes
Note: Fire Station #20 dedicated to Mineta San José International Airport. Fire Station #33 closed in August 2010. Incidents within the district of Station #33 handled by other stations. The Department has reserved the numbering of Fire Station #32 for future use.
Target
Improving Emergency Response Times
The Department developed a response time work plan which includes strategies to
further improve response time performance. This fiscal year, the Department
deployed traffic signal emergency vehicle preemption (in which traffic signals are
equipped to give green lights to oncoming emergency vehicles) for Priority 1
responses.
The Department continues to work on automatic vehicle location data collection
(which provides more accurate data on when a vehicle has arrived at an emergency
location), fire station alerting systems (which will automate some dispatching steps to
reduce call processing times), and data mangement solutions. Additionally, the
Department is implementing new call-taking procedures at the Fire Communication
Center.
Target
81City of San José – Annual Report on City Services 2018-19

FIRE
Fire Safety Inspections
The Department inspects existing buildings and newly constructed buildings to ensure
compliance with the fire code. As of June 2019, San José had approximately 12,000
buildings that were eligible for a fire inspection, including 87 high-rises, 670 educational
facilities, and 5,300 multi-family residences and hotels/motels. The frequency of the
inspection cycle depends on the building use and type. For example, high-rises,
schools, and multi-family residences are required by the State Fire Marshal to have
annual inspections. In 2018-19, the Department completed 100 percent of state-
mandated inspections.
FIRE PREVENTION
The Bureau of Fire Prevention provides regulatory enforcement of fire and
hazardous materials codes, investigates fire cause, and educates the
community to reduce injuries, loss of life, and property damage from fires and
other accidents. Both fire fighters and fire prevention inspectors conduct initial
inspections to check for compliance with fire codes. In 2018-19, the
Department performed 11,700 initial fire inspections. Fire fighters conducted
5,400 of these initial inspections and fire prevention inspectors conducted the
remaining. About 81 percent of initial inspections conducted were code
compliant, and therefore did not require a follow-up inspection.
The Bureau of Fire Prevention also conducts investigations based on
complaints received from residents or businesses. In 2018-19, 200 complaints
were investigated. In addition, the Department conducted about 370 plan
reviews for special events.
In 2018-19, fire prevention inspectors conducted over 250 investigations and
were able to determine that about 120 of those investigations were caused by
arson.
FIRE SAFETY CODE COMPLIANCE
(DEVELOPMENT SERVICES)
Fire Safety Code Compliance enforces the City’s Fire and Health and Safety
Codes during the development plan review and inspection processes, in
coordination with the Development Services partners in the Permit Center
(see Planning, Building & Code Enforcement Department chapter). This
includes both engineering and hazardous materials reviews. In 2018-19, Fire
Code Compliance civilian and sworn staff performed 7,100 fire plan checks
and 7,900 inspections for Development Services customers. Fire plan reviews
were conducted within established time targets for 80 percent of projects in
2018-19.
The Development Services partners in the Permit Center are: • Planning, Building & Code Enforcement Department (see PBCE section)
• Fire Department• Public Works Department (See Public Works section)
0
2,000
4,000
6,000
8,000
10,000
12,000
Fire Prevention Inspections(on existing buildings)
Initial Inspections performed Re-inspections Performed
0
2,000
4,000
6,000
8,000
10,000
Inspections Performed Plan Checks Performed
Fire Safety Code Compliance -Workload (Development Services)
0
100
200
300
400
Arson Investigations
# of arson investigations
# of investigations resulting in arson determination
0% 25% 50% 75% 100%
Buildings with Assembly
Spaces
Buildings without State-
Mandated Annual Inspections
Buildings with State-Mandated
Annual Inspections
'18-'19 '17-'18
Completion of Initial Fire Inspections
82 City of San José – Annual Report on City Services 2018-19
HOUSING
The mission of the Housing Department is to strengthen and revitalize our community through housing and neighborhood investment.
83City of San José – Annual Report on City Services 2018-19

HOUSING
The Housing Department employs multiple strategies to meet the housing needsof San José residents, who face some of the highest housing costs in the nation.These strategies include:• Administering a variety of single-family and multi-family lending programs,• Recommending housing-related policies,• Financing new affordable housing construction,• Extending the useful lives of existing housing through rehabilitation,• Managing rent stabilization programs and tenant protection programs, and• Addressing homelessness through a regional “housing first” model.
Additionally, the Department administers a number of federal and state grantprograms, including the Community Development Block Grant (CDBG) program.
The Housing Department’s operating expenditures totaled $11.3 million in 2018-19. This included personal and non-personal/equipment expenditures. Thedepartment was responsible for an additional $29.7 million in Citywide and otherexpenses, including $16.7 million for loans and grants.
Funding for the Department included revenues from the Department’s loanportfolio that continued to generate program income (principal outstanding as ofNovember 2019 was $578.1 million). Additional revenues come from variousstate and federal grants. Also included were Affordable Housing Impact Fees,which went into effect at the end of 2015-16, totaling $1.4 million in revenues in2018-19.
$0
$2
$4
$6
$8
$10
$12
Housing Operating Expenditures ($millions)
Personal Services Non-Personal/Equipment
0
10
20
30
40
50
60
70
80
90
Housing Authorized Positions
Loan Repayments, Interest, and Miscellaneous Revenues $50,022,102
HEAP Grant $11,389,987
Fees and Charges* $7,794,679
Community Development Block Grant (CDBG) $6,948,870
Rental Rights $3,654,882
Bond Administration Fee $1,489,511
HOME Grants Revenue $1,464,624
Housing Opportunities for People with AIDS (HOPWA) $1,028,037
HOPWA Special Projects $616,039
Emergency Shelter Grant (ESG) $526,552
Dahlia Grant $80,000
Total $85,015,283
2018-19 Housing Program Funds Received
$0
$10
$20
$30
$40
$50
$60
$70
$80
$90
$100
Comparison of Funding Sources ($millions)
Federal State and Local Loan repayments, interest, other revenue
* Fees and Charges increased from $212,000 last year due to revenue from projects subject toInclusionary Housing Policy In-lieu fees and Affordable Housing Impact fees.
84 City of San José – Annual Report on City Services 2018-19

HOUSING
AFFORDABLE HOUSING
Building New Affordable Housing
The availability of affordable housing has continued to be an area of concernfor San José residents for a number of years. In 2019, only 6 percent rated theavailability of affordable housing as “excellent” or “good,” while 82 percentconsidered availability to be “poor.”
The City's efforts to increase the supply of affordable housing in San Joséinclude making loans to developers and authorizing conduit financing. In 2018-19, developers completed 111 newly affordable housing units with City help.For new projects under construction, the City committed an average per-unitsubsidy of about $104,500 (for 820 affordable housing units) in 2018-19.According to the Department, unit costs can vary widely depending upon avariety of factors. As of November 2019, there was a total of nearly 21,000affordable housing units in San José.
Rehabilitating Existing Housing & Financing Home Buying
Although these programs have been dramatically reduced since 2012, low-income homeowners whose homes are in need of repairs can qualify for Cityfinancial help to rehabilitate them. In 2018-19, the Department providedminor repairs for 289 homes in partnership with Rebuilding Together SiliconValley and Habitat for Humanity. Two rehabiliations for single-family homeswere completed.
Previously, people who wanted to buy homes in San José could receivefinancial help, including down payment assistance, through various Cityprograms. These programs have since been discontinued due to lack offunding.
0
100
200
300
400
500
Rehabilitated Units
Major Rehabilitations Minor Repairs
0%
10%
20%
30%
40%
50%
60%
70%
80%
90%
100%
2011 2012 2013 2014 2015 2016 2017 2018 2019
RESIDENT SURVEY% of residents rating housing opportunities as "excellent"
or "good"
Variety of housingoptions
Availability ofaffordable qualityhousing
0
100
200
300
400
500
600
Number of Affordable Housing Units Completed in the Fiscal
Year
$0
$50
$100
$150
$200
Average Per-Unit Subsidy for New Projects Under
Construction ($thousands)
Completed New Construction
0
50
100
150
200
250
Number of Homebuyers Assisted
50%
19% 18%
6%
Note: This measure was based on completed projects prior to '15-'16
Note: This program has been discontinued.
85City of San José – Annual Report on City Services 2018-19
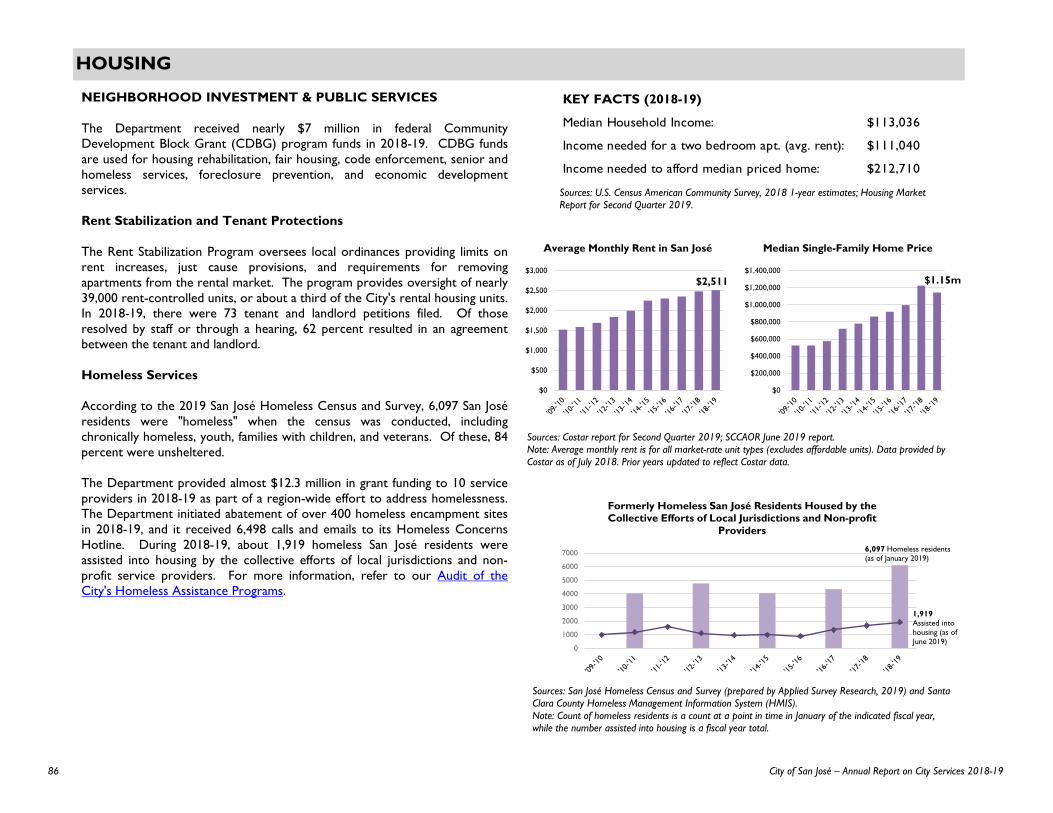
HOUSING
Sources: U.S. Census American Community Survey, 2018 1-year estimates; Housing Market Report for Second Quarter 2019.
$0
$200,000
$400,000
$600,000
$800,000
$1,000,000
$1,200,000
$1,400,000
Median Single-Family Home Price
Sources: Costar report for Second Quarter 2019; SCCAOR June 2019 report.Note: Average monthly rent is for all market-rate unit types (excludes affordable units). Data provided by Costar as of July 2018. Prior years updated to reflect Costar data.
$0
$500
$1,000
$1,500
$2,000
$2,500
$3,000
Average Monthly Rent in San José
0
1000
2000
3000
4000
5000
6000
7000
Formerly Homeless San José Residents Housed by the Collective Efforts of Local Jurisdictions and Non-profit
Providers
6,097 Homeless residents(as of January 2019)
1,919 Assisted into housing (as of June 2019)
$2,511 $1.15m
Sources: San José Homeless Census and Survey (prepared by Applied Survey Research, 2019) and Santa Clara County Homeless Management Information System (HMIS).Note: Count of homeless residents is a count at a point in time in January of the indicated fiscal year, while the number assisted into housing is a fiscal year total.
KEY FACTS (2018-19)
Median Household Income: $113,036
Income needed for a two bedroom apt. (avg. rent): $111,040
Income needed to afford median priced home: $212,710
NEIGHBORHOOD INVESTMENT & PUBLIC SERVICES
The Department received nearly $7 million in federal CommunityDevelopment Block Grant (CDBG) program funds in 2018-19. CDBG fundsare used for housing rehabilitation, fair housing, code enforcement, senior andhomeless services, foreclosure prevention, and economic developmentservices.
Rent Stabilization and Tenant Protections
The Rent Stabilization Program oversees local ordinances providing limits onrent increases, just cause provisions, and requirements for removingapartments from the rental market. The program provides oversight of nearly39,000 rent-controlled units, or about a third of the City's rental housing units.In 2018-19, there were 73 tenant and landlord petitions filed. Of thoseresolved by staff or through a hearing, 62 percent resulted in an agreementbetween the tenant and landlord.
Homeless Services
According to the 2019 San José Homeless Census and Survey, 6,097 San Joséresidents were "homeless" when the census was conducted, includingchronically homeless, youth, families with children, and veterans. Of these, 84percent were unsheltered.
The Department provided almost $12.3 million in grant funding to 10 serviceproviders in 2018-19 as part of a region-wide effort to address homelessness.The Department initiated abatement of over 400 homeless encampment sitesin 2018-19, and it received 6,498 calls and emails to its Homeless ConcernsHotline. During 2018-19, about 1,919 homeless San José residents wereassisted into housing by the collective efforts of local jurisdictions and non-profit service providers. For more information, refer to our Audit of theCity's Homeless Assistance Programs.
86 City of San José – Annual Report on City Services 2018-19

HUMAN RESOURCES
The mission of the Human Resources Department recognizes that our City is powered by
people and we are committed to providing high quality, essential services, and support our
employees and departments. Its primary purpose is to enable the City’s employees to serve a
diverse and thriving San José community by providing valuable services to attract, hire, and
retain employees; facilitate employee engagement; promote safety and wellness; and provide
opportunities to develop skills and grow in a career with the nation’s 10th largest City.
87City of San José – Annual Report on City Services 2018-19

HUMAN RESOURCES
The Human Resources Department (HR) manages employee benefits, health
and safety, and employment services. In 2018-19, HR’s operating expenditures
totaled $12.4 million, and included 52.5 positions. HR was also responsible for
$90.5 million in other costs, including payments to benefit providers and
workers' compensation costs.
In 2018-19, HR facilitated the hiring of 698 new full-time employees (newly
hired, reemployed, or rehired) and 755 internal appointments (promotions
and transfers).
While the cost of Kaiser family coverage has dropped in the past year, health
care premiums have increased significantly over the last ten years. Overall City
spending on health benefits has reached $55.5 million.
In 2017-18, the City Council approved outsourcing the City's workers’
compensation function. In 2018-19, there were 804 new claims and 3,097
open claims. Workers’ compensation payments totaled $19.5 million.
HR also administers the City’s Voluntary Employees' Beneficiary Association
(VEBA) plan (established in November 2017) and the Tier 3 Retirement plan
(52 active members as of June 30, 2019), and continues to oversee the
voluntary 457 deferred compensation plan. The percentage of employees
participating in the 457 plan has increased slightly in recent years; from 68
percent in 2015-16 to 73 percent of eligible employees in 2018-19.
For more information, see the March 2019 audit report, Employee Benefit Fund Administration:
Opportunities Exist to Improve Controls.
0
300
600
900
1,200
1,500
$0
$5
$10
$15
$20
$25
Workers' Compensation Payments & New Claims
WC Claims Cost ($millions)
Number of New Claims
$0
$500
$1,000
$1,500
$2,000
$2,500
Kaiser Family Plan Premium Rates
City Contribution Employee Contribution
$0
$2
$4
$6
$8
$10
$12
$14
Human Resources Operating Expenditures ($millions)
Personal Non-Personal/Equipment
0
1,000
2,000
3,000
4,000
5,000
6,000
7,000
Citywide Staffing and Vacancies
(as of June 30)
Filled Positions Vacancies
0
10
20
30
40
50
60
70
80
Human Resources Authorized Positions
Note: In 2018-19, HR began several initiatives and trainings to help reduce workplace injuries.
0
100
200
300
400
500
600
700
800
New Full-Time Hires (Citywide)
KEY FACTS (2018-19)
Number of City employees (budgeted full-time equivalents) 6,413
Covered lives (active employees and dependents) 10,952
Percentage of employees with timely performance appraisals
Non-management 71%
Management 92%
Turnover Rate
All employees (resignation, termination, retirements, etc.) 14%
Less retirements 11%
88 City of San José – Annual Report on City Services 2018-19
INDEPENDENT POLICE AUDITOR
The mission of the San José Independent Police Auditor is to provide
independent oversight of the citizen complaint process to ensure its
fairness, thoroughness, and objectivity.
89City of San José – Annual Report on City Services 2018-19
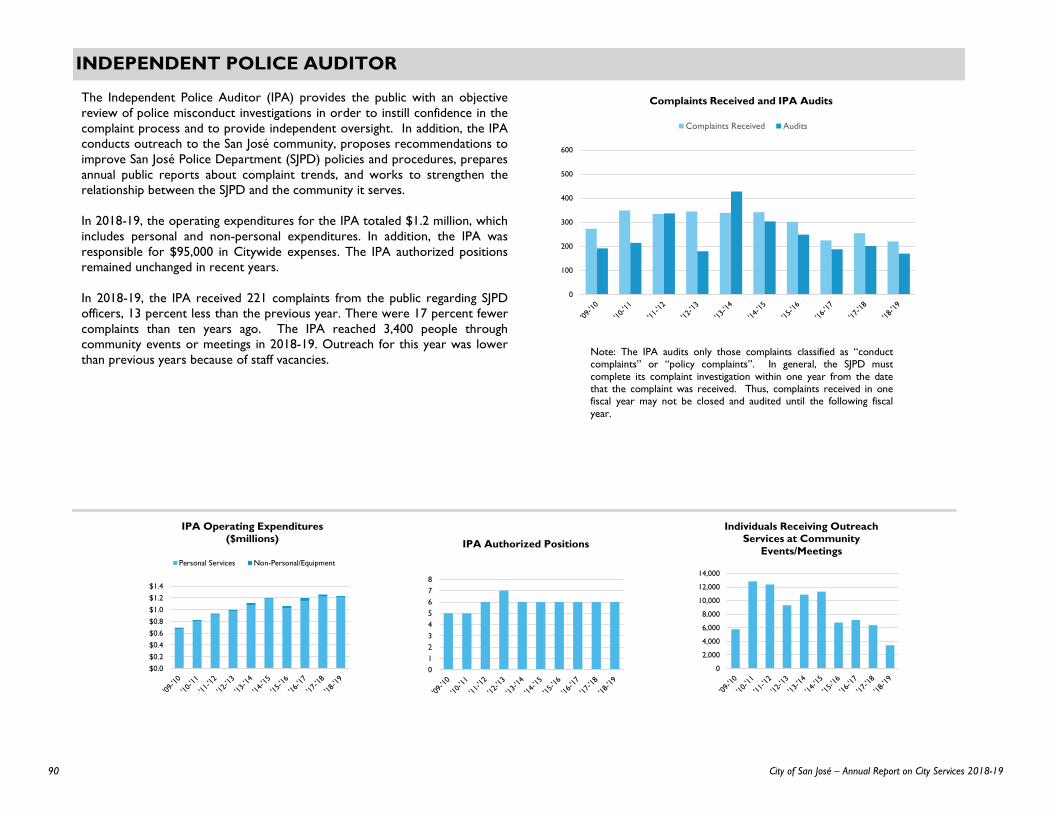
INDEPENDENT POLICE AUDITOR
The Independent Police Auditor (IPA) provides the public with an objective
review of police misconduct investigations in order to instill confidence in the
complaint process and to provide independent oversight. In addition, the IPA
conducts outreach to the San José community, proposes recommendations to
improve San José Police Department (SJPD) policies and procedures, prepares
annual public reports about complaint trends, and works to strengthen the
relationship between the SJPD and the community it serves.
In 2018-19, the operating expenditures for the IPA totaled $1.2 million, which
includes personal and non-personal expenditures. In addition, the IPA was
responsible for $95,000 in Citywide expenses. The IPA authorized positions
remained unchanged in recent years.
In 2018-19, the IPA received 221 complaints from the public regarding SJPD
officers, 13 percent less than the previous year. There were 17 percent fewer
complaints than ten years ago. The IPA reached 3,400 people through
community events or meetings in 2018-19. Outreach for this year was lower
than previous years because of staff vacancies.
0
100
200
300
400
500
600
Complaints Received and IPA Audits
Complaints Received Audits
Note: The IPA audits only those complaints classified as “conductcomplaints” or “policy complaints”. In general, the SJPD must
complete its complaint investigation within one year from the datethat the complaint was received. Thus, complaints received in onefiscal year may not be closed and audited until the following fiscal
year.
$0.0
$0.2
$0.4
$0.6
$0.8
$1.0
$1.2
$1.4
IPA Operating Expenditures ($millions)
Personal Services Non-Personal/Equipment
0
2,000
4,000
6,000
8,000
10,000
12,000
14,000
Individuals Receiving Outreach Services at Community
Events/Meetings
0
1
2
3
4
5
6
7
8
IPA Authorized Positions
90 City of San José – Annual Report on City Services 2018-19
INFORMATION TECHNOLOGY
The mission of Information Technology is to execute, secure, and sustain the civic technology solutions that allow San José to thrive
as a community.
91City of San José – Annual Report on City Services 2018-19

INFORMATION TECHNOLOGY
020406080
100120140160
IT Authorized Positions
Non Call Center Call Center
The Information Technology Department (IT) provides Citywide informationand communications technology strategy and infrastructure that supportmunicipal services. IT is responsible for cybersecurity, Citywide datacommunications management, and customer support. It also manages anumber of enterprise applications including the Financial Management System(FMS), PeopleSoft HR/Payroll System, the Budget System, the Municipal AreaNetwork (MAN), and the City's open data portal.
The City of San José ranked second in the 2019 Digital Cities Awards for theCity's use of technology for operational effectiveness, customer engagement,and innovation and was the recipient of other leadership awards.
IT operating expenditures totaled $21 million in 2018-19. IT was alsoresponsible for $108,000 in Citywide expenses. Authorized staffing totaled 80full-time equivalent positions, including 12 positions at the Customer ContactCenter. IT's vacancy rate decreased from 18 percent in 2017-18 to 10 percentin June 2019.
In 2018-19, IT rolled-out cybersecurity education and awareness events;Incident Response program implementation; and a security review/supportprogram for major contracts, externals audits, insurance, and bonding.
IT aims to have network services (systems, voice, and network) and businessapplications available 99.9 percent and 99.8 percent of the time, respectively(new measures adopted for 2018-19). The City’s network, telephones, andsystems and business applications met or almost met that target in 2018-19.
IT Strategic Plan IT is in the final stages of a three-year strategic plan to modernize the City's technology portfolio and implement a management structure that reinforces the City's transformation to secure, customer-centric digital services and data-driven decision making. In furtherance of those goals, IT implemented or worked on the following:
• City Cybersecurity Office• City Portfolio-Products-Projects Management (C3PO) maturity• My San Jose application update releases• New City open data portal• Integrated Permitting System upgrade• Business Tax Amnesty System implementation
(See CSA Dashboard chapter for IT's project success rates.)
$0
$5
$10
$15
$20
$25
IT Operating Expenditures (millions)
Personal Services Non-Personal/Equipment
KEY FACTS (2018-19)Customer Contact calls 157,175Service desk requests 16,603Network outages 7Computers 7,577*Enterprise servers 373
99.66%
95%
96%
97%
98%
99%
100%
% Uptime for Business Applications
99.96%
95%
96%
97%
98%
99%
100%
% Uptime and Availability for Systems, Network and Voice
Previous years' data is not available because this measure was restructured and adopted in 2019-20
Previous years' data is not available because this is a new measure adopted in 2019-20
*This includes decommissioned or computers not in use. IT is currently in the process ofreviewing this data to only include computers in use.
92 City of San José – Annual Report on City Services 2018-19

CUSTOMER CONTACT CENTER
The City’s Customer Contact Center (408/535-3500 [email protected]) is one of the primary points of Cityinformation for residents, businesses, and employees. The Center is availableto respond to resident queries during regular business hours and has ananswering service respond to resident questions after hours. Otherdepartments also maintain customer contact centers to respond to specificresident concerns or questions.
Since April 2017, the My San Jose app accumulated about 55,000 users, andreceived about 173,500 service requests in 2018-19. Staff reported that it wasable to close out 97 percent of the requests. IT considers a request closedwhen no further action will be performed on the request because the workwas completed or staff cannot perform any additional work.
In 2018-19, the Customer Contact Center staff answered 90 percent of callsreceived (target: 85 percent). Forty-one percent of the calls were self-servicecalls and redirected to a service provider or answered by the after-hoursvendor. The average wait time for calls answered by the Customer ContactCenter staff was 2.26 minutes (forecast: 3 minutes). In response to our Auditof 9-11 and 3-11: Changes to Call Handling and Increased Hiring Efforts CouldImprove Call Answering Times, IT and the Police and Fire Departments areworking on transitioning some non-emergency calls to the Customer ContactCenter. As of June 2019, the Customer Contact Center absorbed the FireCommunications non-emergency calls. Additional changes are planned forimplementation by April 2020.
Source: My San Jose
My San Jose
My San Jose allows residents to request City services through theapplication or website. Many requests feed directly into therelevant department workorder systems. Residents can file andtrack their service requests through this application.
0%
20%
40%
60%
80%
100%
% of Customer Contact Center Calls Answered*
0
50
100
150
200
250
300
350
Customer Contact Center Calls (thousands)
0
1
2
3
4
5
6
7
8
Customer Contact Center Average Wait Time (minutes)
50% 60% 70% 80% 90% 100%
Customer Service
Quality of Work
Timeliness
Overall Satisfaction
% of Overall Internal Customers Rating IT Services as "Excellent"
or "Good"
*Starting 2017-18, the data includes calls answered by staff, self-serviced calls, and after hours service. Previous years' data only included calls answered by staff.
INFORMATION TECHNOLOGY
93City of San José – Annual Report on City Services 2018-19

94 City of San José – Annual Report on City Services 2018-19
LIBRARY
The San José Public Library’s mission is to enrich lives by fostering lifelong learning and by ensuring that every member of the community has access
to a vast array of ideas and information.
95City of San José – Annual Report on City Services 2018-19
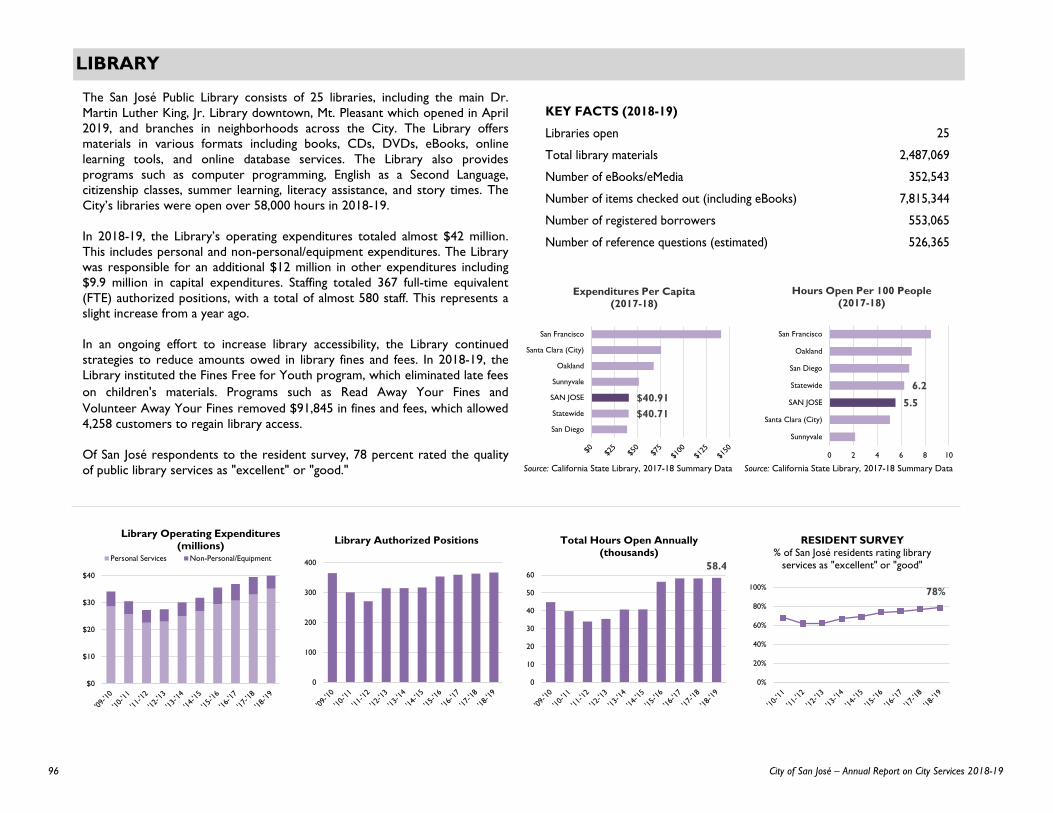
LIBRARY
The San José Public Library consists of 25 libraries, including the main Dr.Martin Luther King, Jr. Library downtown, Mt. Pleasant which opened in April2019, and branches in neighborhoods across the City. The Library offersmaterials in various formats including books, CDs, DVDs, eBooks, onlinelearning tools, and online database services. The Library also providesprograms such as computer programming, English as a Second Language,citizenship classes, summer learning, literacy assistance, and story times. TheCity’s libraries were open over 58,000 hours in 2018-19.
In 2018-19, the Library’s operating expenditures totaled almost $42 million.This includes personal and non-personal/equipment expenditures. The Librarywas responsible for an additional $12 million in other expenditures including$9.9 million in capital expenditures. Staffing totaled 367 full-time equivalent(FTE) authorized positions, with a total of almost 580 staff. This represents aslight increase from a year ago.
In an ongoing effort to increase library accessibility, the Library continuedstrategies to reduce amounts owed in library fines and fees. In 2018-19, theLibrary instituted the Fines Free for Youth program, which eliminated late feeson children's materials. Programs such as Read Away Your Fines andVolunteer Away Your Fines removed $91,845 in fines and fees, which allowed4,258 customers to regain library access.
Of San José respondents to the resident survey, 78 percent rated the qualityof public library services as "excellent" or "good."
$0
$10
$20
$30
$40
Library Operating Expenditures (millions)
Personal Services Non-Personal/Equipment
0
100
200
300
400
Library Authorized Positions
58.4
0
10
20
30
40
50
60
Total Hours Open Annually (thousands)
78%
0%
20%
40%
60%
80%
100%
RESIDENT SURVEY% of San José residents rating library
services as "excellent" or "good"
$40.71$40.91
San Diego
Statewide
SAN JOSE
Sunnyvale
Oakland
Santa Clara (City)
San Francisco
Expenditures Per Capita (2017-18)
Source: California State Library, 2017-18 Summary Data
5.5
6.2
0 2 4 6 8 10
Sunnyvale
Santa Clara (City)
SAN JOSE
Statewide
San Diego
Oakland
San Francisco
Hours Open Per 100 People (2017-18)
Source: California State Library, 2017-18 Summary Data
KEY FACTS (2018-19)
Libraries open 25
Total library materials 2,487,069
Number of eBooks/eMedia 352,543
Number of items checked out (including eBooks) 7,815,344
Number of registered borrowers 553,065
Number of reference questions (estimated) 526,365
96 City of San José – Annual Report on City Services 2018-19

LIBRARY
6.2 million
0
1
2
3
4
5
6
7
8
9
Number of Estimated Visitors to Main and Branch Libraries
(millions)
LIBRARY COLLECTION AND CIRCULATION
In 2018-19, the Library’s collection totaled almost 2.5 million items, includingover 1.8 million print materials (such as books and periodicals), and over352,000 eResources (eBooks, eMagazines, eMusic, eMovies, and onlinelearning tools). The Library also provides access to subscription-based onlineresources on a variety of topics, such as career development, technologytraining, consumer resources, language learning, and online high school classes.
San José’s 2017-18 circulation per capita (excluding eBooks) was higher thanthe statewide mean. Total circulation in 2018-19 (including eBooks) was 7.8million, and eResource circulation continues to grow.
Seventy-one percent of respondents to the resident survey indicated they, orsomeone in their household, used San José libraries at least once in the last 12months. Online holds to reserve materials decreased slightly from theprevious year with library borrowers placing about 519,000 online holds toreserve materials in 2018-19.
Approximately 16 percent of the Library’s collection includes materials inlanguages other than English (over 400,000 items). The Library actively collectsmaterials in 19 languages, including Spanish, Vietnamese, Chinese, Hindi,Persian, Tagalog, Russian, Korean, and Japanese. In total, the Library maintainsmaterials in 95 languages.
0%
20%
40%
60%
80%
2014 2015 2016 2017 2018 2019
RESIDENT SURVEYIn the last 12 months, about how many times have you or other
household members used San José public libraries or their services?
Once a month or less
2 to 4 times a month
2 times a week or more
1.5
2
0 1 2 3 4 5 6
Statewide
SAN JOSE
Oakland
San Francisco
San Diego
Sunnyvale
Santa Clara (City)
Materials Per Capita (2017-18)
5.5
7.9
0 10 20
Statewide
San Diego
Oakland
SAN JOSE
San Francisco
Sunnyvale
Santa Clara (city)
Circulation Per Capita (2017-18)
Source: California State Library, 2017-18 Summary Data
Source: California State Library, 2017-18 Summary Data (does not include eBooks)
0
100
200
300
400
Non-English Collection (thousands)
Other VietnameseSpanish Chinese
7 million
0
4
8
12
16
Total Circulation (millions)
Circulation of Other Materials Circulation of eBooks
0.0
0.5
1.0
1.5
2.0
2.5
Total Collection (millions)Books and periodicals Audio
Videos and DVDs eBooks/eMedia
Note: In 2014-15, the methodology to tabulate eBooks changed. Prior data may not be comparable.
Note: Prior to August 2017, the Library and San Jose State University shared their catalog, and these years include circulation for the shared catalog.
97City of San José – Annual Report on City Services 2018-19

LIBRARY
Source: San José Library Department
Source: San José Library Department
94%
0%
20%
40%
60%
80%
100%
Percent of Library Customers Rating Staff Assistance as Good
or Excellent
Source: Library customer surveys. Note: In 2016-17, the methodology to tabulate staff assistance changed. Prior data may not be comparable.
0.0
0.5
1.0
1.5
2.0
2.5
Computer Sessions in Library (millions)
Note: Does not include wireless connections or use of personal devices.
The Library promotes reading and literacy, and supports school readiness. Programsinclude preschool and early education initiatives, story time, summer learning, digitalliteracy, adult and family literacy programs, and more. More information about Libraryprograms can be found at sjpl.org/events.
In May 2018, the City Council formally adopted the Education and Digital LiteracyStrategy, which codifies the Library's role in leading the City's Education and DigitalLiteracy Initiative.
In 2018-19, libraries offered over 24,000 programs with total attendance growing tomore than 472,600. SJPL Works, the Library’s business and workforce developmentcenter, began holding programs in 2016-17. In 2018-19, SJPL Works offered 275business programs, with over 2,400 participants attending sessions.
Programming and program attendance has continued to grow. Over the last twoyears, the number of programs and program attendance has grown in the Life Skills,Storytime & Literacy program, and STEAM & Digital Literacy areas. In February 2018,the Library launched Coding5k, an initiative to teach coding and computer science to5,000 unduplicated students each year through 2020. In 2018-19, more than 6,400children and youth participated in a coding, computer science, or technology programat City libraries.
See CSA Dashboard chapter for additional measures related to Library activities.
0
40,000
80,000
120,000
160,000
200,000
Number of Program Participants
Community Engagement Exploration & LearningLife Skills STEAM & Digital LiteracyStorytime & Literacy
0
1,000
2,000
3,000
4,000
5,000
6,000
7,000
8,000
Number of ProgramsCommunity Engagement Exploration & LearningLife Skills STEAM & Digital LiteracyStorytime & Literacy
98 City of San José – Annual Report on City Services 2018-19
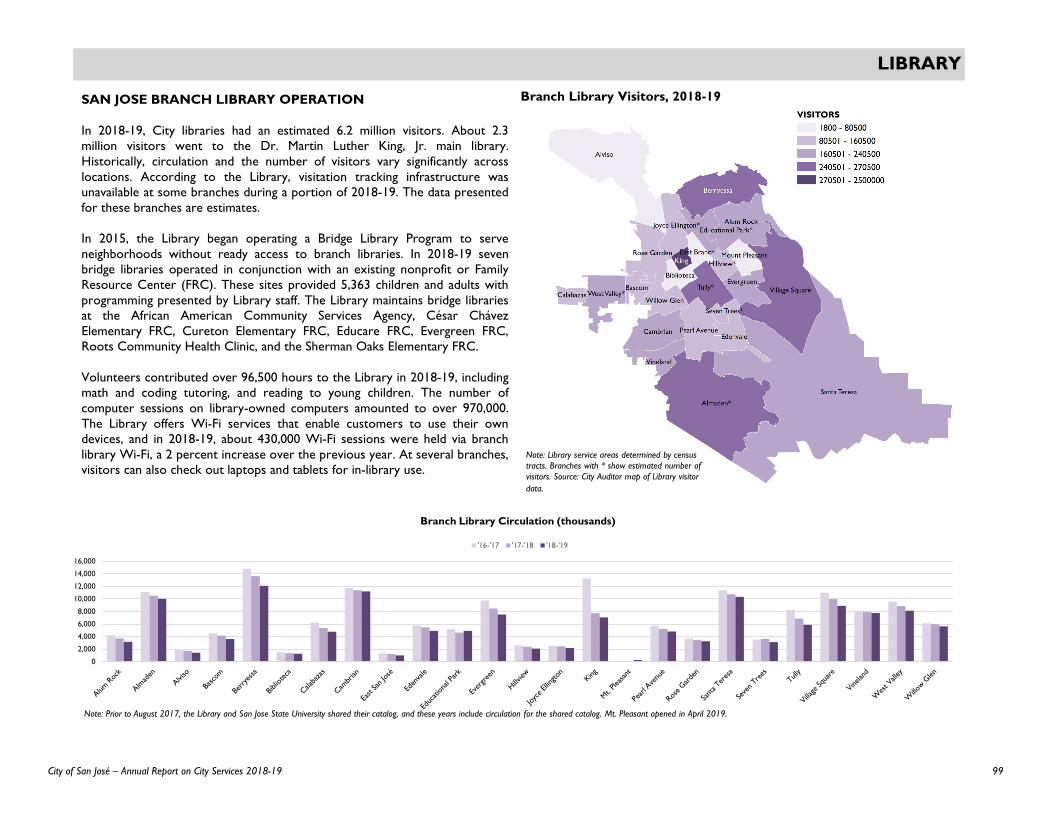
LIBRARY
SAN JOSE BRANCH LIBRARY OPERATION
In 2018-19, City libraries had an estimated 6.2 million visitors. About 2.3million visitors went to the Dr. Martin Luther King, Jr. main library.Historically, circulation and the number of visitors vary significantly acrosslocations. According to the Library, visitation tracking infrastructure wasunavailable at some branches during a portion of 2018-19. The data presentedfor these branches are estimates.
In 2015, the Library began operating a Bridge Library Program to serveneighborhoods without ready access to branch libraries. In 2018-19 sevenbridge libraries operated in conjunction with an existing nonprofit or FamilyResource Center (FRC). These sites provided 5,363 children and adults withprogramming presented by Library staff. The Library maintains bridge librariesat the African American Community Services Agency, César ChávezElementary FRC, Cureton Elementary FRC, Educare FRC, Evergreen FRC,Roots Community Health Clinic, and the Sherman Oaks Elementary FRC.
Volunteers contributed over 96,500 hours to the Library in 2018-19, includingmath and coding tutoring, and reading to young children. The number ofcomputer sessions on library-owned computers amounted to over 970,000.The Library offers Wi-Fi services that enable customers to use their owndevices, and in 2018-19, about 430,000 Wi-Fi sessions were held via branchlibrary Wi-Fi, a 2 percent increase over the previous year. At several branches,visitors can also check out laptops and tablets for in-library use.
Branch Library Visitors, 2018-19
Note: Library service areas determined by census tracts. Branches with * show estimated number of visitors. Source: City Auditor map of Library visitor data.
0
2,000
4,000
6,000
8,000
10,000
12,000
14,000
16,000
Branch Library Circulation (thousands)
'16-'17 '17-'18 '18-'19
Note: Prior to August 2017, the Library and San Jose State University shared their catalog, and these years include circulation for the shared catalog. Mt. Pleasant opened in April 2019.
99City of San José – Annual Report on City Services 2018-19

100 City of San José – Annual Report on City Services 2018-19
PARKS, RECREATION AND NEIGHBORHOOD SERVICES
The mission of Parks, Recreation and Neighborhood Services is to build healthy communities through people, parks, and programs.
101City of San José – Annual Report on City Services 2018-19
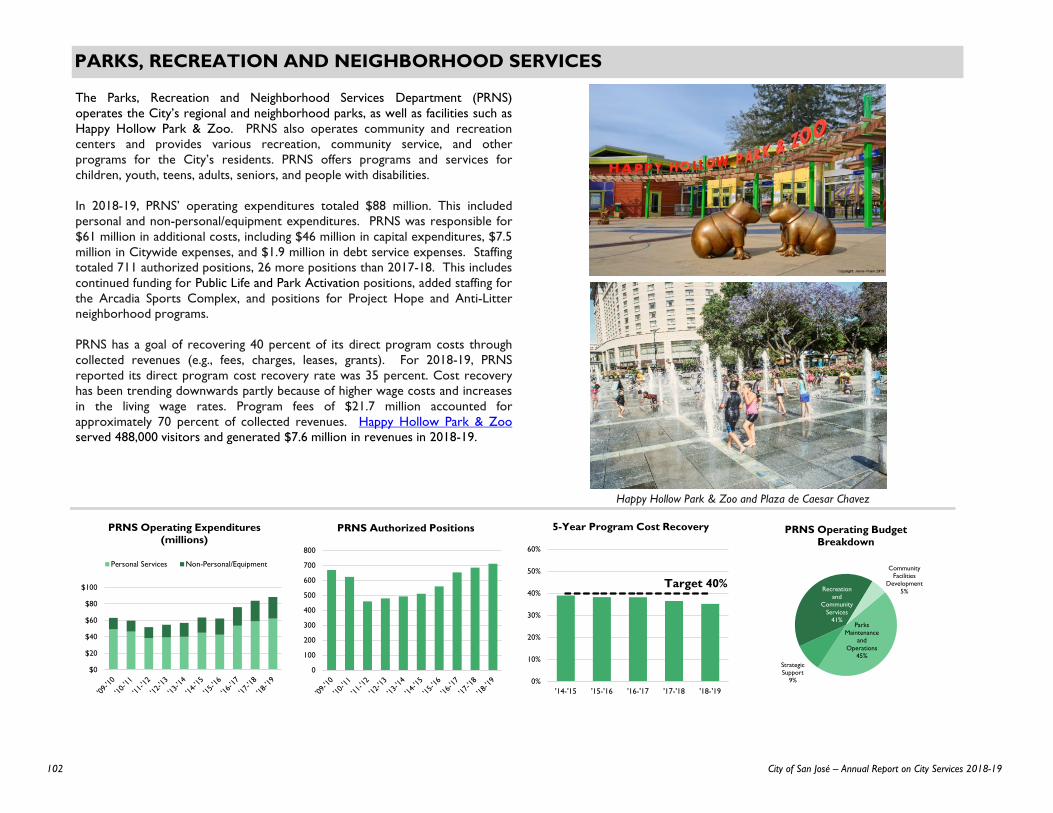
PARKS, RECREATION AND NEIGHBORHOOD SERVICES
Target 40%
0%
10%
20%
30%
40%
50%
60%
'14-'15 '15-'16 '16-'17 '17-'18 '18-'19
5-Year Program Cost Recovery
$0
$20
$40
$60
$80
$100
PRNS Operating Expenditures (millions)
Personal Services Non-Personal/Equipment
0
100
200
300
400
500
600
700
800
PRNS Authorized Positions
Parks Maintenance
and Operations
45%Strategic Support
9%
Recreation and
Community Services
41%
Community Facilities
Development5%
PRNS Operating Budget Breakdown
Happy Hollow Park & Zoo and Plaza de Caesar Chavez
The Parks, Recreation and Neighborhood Services Department (PRNS)operates the City’s regional and neighborhood parks, as well as facilities such asHappy Hollow Park & Zoo. PRNS also operates community and recreationcenters and provides various recreation, community service, and otherprograms for the City’s residents. PRNS offers programs and services forchildren, youth, teens, adults, seniors, and people with disabilities.
In 2018-19, PRNS’ operating expenditures totaled $88 million. This includedpersonal and non-personal/equipment expenditures. PRNS was responsible for$61 million in additional costs, including $46 million in capital expenditures, $7.5million in Citywide expenses, and $1.9 million in debt service expenses. Staffingtotaled 711 authorized positions, 26 more positions than 2017-18. This includescontinued funding for Public Life and Park Activation positions, added staffing forthe Arcadia Sports Complex, and positions for Project Hope and Anti-Litterneighborhood programs.
PRNS has a goal of recovering 40 percent of its direct program costs throughcollected revenues (e.g., fees, charges, leases, grants). For 2018-19, PRNSreported its direct program cost recovery rate was 35 percent. Cost recoveryhas been trending downwards partly because of higher wage costs and increasesin the living wage rates. Program fees of $21.7 million accounted forapproximately 70 percent of collected revenues. Happy Hollow Park & Zooserved 488,000 visitors and generated $7.6 million in revenues in 2018-19.
102 City of San José – Annual Report on City Services 2018-19
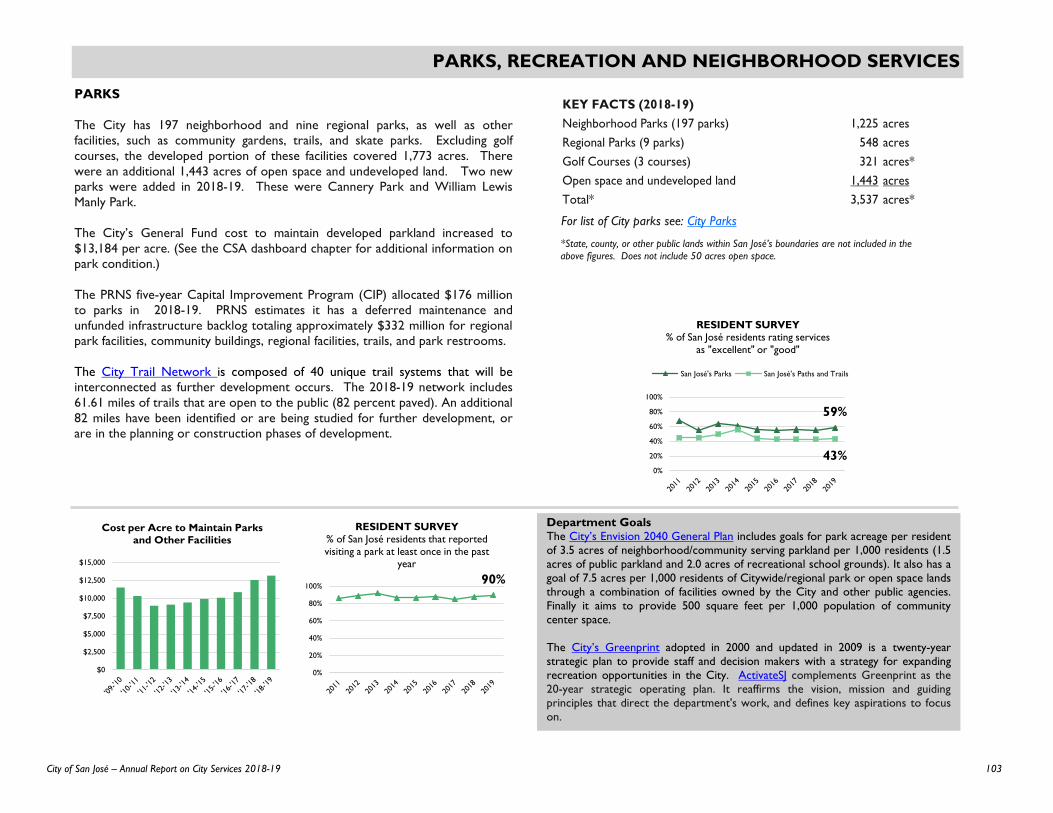
PARKS, RECREATION AND NEIGHBORHOOD SERVICES
KEY FACTS (2018-19)Neighborhood Parks (197 parks) 1,225 acresRegional Parks (9 parks) 548 acresGolf Courses (3 courses) 321 acres*Open space and undeveloped land 1,443 acresTotal* 3,537 acres*
59%
43%0%
20%
40%
60%
80%
100%
RESIDENT SURVEY% of San José residents rating services
as "excellent" or "good"
San José's Parks San José's Paths and Trails
$0
$2,500
$5,000
$7,500
$10,000
$12,500
$15,000
Cost per Acre to Maintain Parks and Other Facilities
90%
0%
20%
40%
60%
80%
100%
RESIDENT SURVEY% of San José residents that reported visiting a park at least once in the past
year
*State, county, or other public lands within San José’s boundaries are not included in theabove figures. Does not include 50 acres open space.
For list of City parks see: City Parks
PARKS
The City has 197 neighborhood and nine regional parks, as well as otherfacilities, such as community gardens, trails, and skate parks. Excluding golfcourses, the developed portion of these facilities covered 1,773 acres. Therewere an additional 1,443 acres of open space and undeveloped land. Two newparks were added in 2018-19. These were Cannery Park and William LewisManly Park.
The City’s General Fund cost to maintain developed parkland increased to$13,184 per acre. (See the CSA dashboard chapter for additional information onpark condition.)
The PRNS five-year Capital Improvement Program (CIP) allocated $176 millionto parks in 2018-19. PRNS estimates it has a deferred maintenance andunfunded infrastructure backlog totaling approximately $332 million for regionalpark facilities, community buildings, regional facilities, trails, and park restrooms.
The City Trail Network is composed of 40 unique trail systems that will beinterconnected as further development occurs. The 2018-19 network includes61.61 miles of trails that are open to the public (82 percent paved). An additional82 miles have been identified or are being studied for further development, orare in the planning or construction phases of development.
Department GoalsThe City’s Envision 2040 General Plan includes goals for park acreage per residentof 3.5 acres of neighborhood/community serving parkland per 1,000 residents (1.5acres of public parkland and 2.0 acres of recreational school grounds). It also has agoal of 7.5 acres per 1,000 residents of Citywide/regional park or open space landsthrough a combination of facilities owned by the City and other public agencies.Finally it aims to provide 500 square feet per 1,000 population of communitycenter space.
The City’s Greenprint adopted in 2000 and updated in 2009 is a twenty-yearstrategic plan to provide staff and decision makers with a strategy for expandingrecreation opportunities in the City. ActivateSJ complements Greenprint as the20-year strategic operating plan. It reaffirms the vision, mission and guidingprinciples that direct the department's work, and defines key aspirations to focuson.
103City of San José – Annual Report on City Services 2018-19
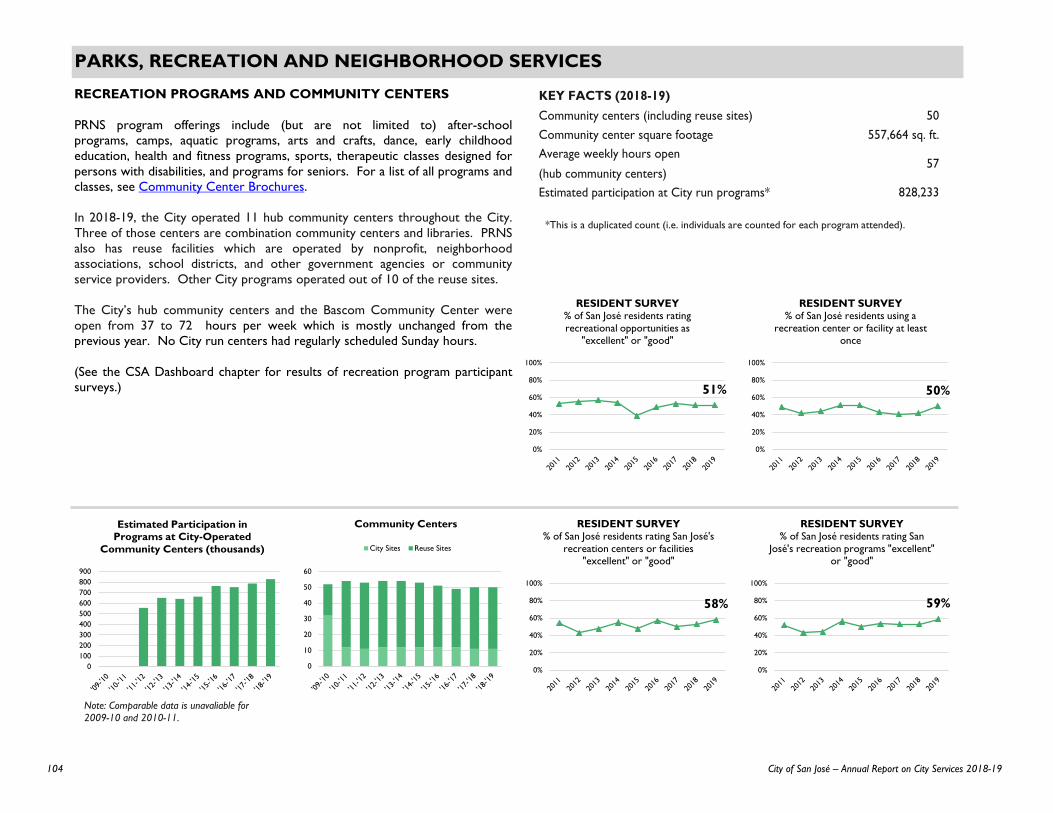
PARKS, RECREATION AND NEIGHBORHOOD SERVICES
RECREATION PROGRAMS AND COMMUNITY CENTERS
PRNS program offerings include (but are not limited to) after-schoolprograms, camps, aquatic programs, arts and crafts, dance, early childhoodeducation, health and fitness programs, sports, therapeutic classes designed forpersons with disabilities, and programs for seniors. For a list of all programs andclasses, see Community Center Brochures.
In 2018-19, the City operated 11 hub community centers throughout the City.Three of those centers are combination community centers and libraries. PRNSalso has reuse facilities which are operated by nonprofit, neighborhoodassociations, school districts, and other government agencies or communityservice providers. Other City programs operated out of 10 of the reuse sites.
The City’s hub community centers and the Bascom Community Center wereopen from 37 to 72 hours per week which is mostly unchanged from theprevious year. No City run centers had regularly scheduled Sunday hours.
(See the CSA Dashboard chapter for results of recreation program participantsurveys.)
*This is a duplicated count (i.e. individuals are counted for each program attended).
51%
0%
20%
40%
60%
80%
100%
RESIDENT SURVEY% of San José residents rating recreational opportunities as
"excellent" or "good"
50%
0%
20%
40%
60%
80%
100%
RESIDENT SURVEY% of San José residents using a
recreation center or facility at least once
0100200300400500600700800900
Estimated Participation in Programs at City-Operated
Community Centers (thousands)
0
10
20
30
40
50
60
Community Centers
City Sites Reuse Sites
58%
0%
20%
40%
60%
80%
100%
RESIDENT SURVEY% of San José residents rating San José's
recreation centers or facilities "excellent" or "good"
59%
0%
20%
40%
60%
80%
100%
RESIDENT SURVEY% of San José residents rating San
José's recreation programs "excellent" or "good"
Note: Comparable data is unavaliable for 2009-10 and 2010-11.
KEY FACTS (2018-19)Community centers (including reuse sites) 50Community center square footage 557,664 sq. ft.Average weekly hours open
(hub community centers)57
Estimated participation at City run programs* 828,233
104 City of San José – Annual Report on City Services 2018-19

PARKS, RECREATION AND NEIGHBORHOOD SERVICES
Facilities in bold are hub community centers operated by the City. Facilities with (N) are NeighborhoodCenters and facilities with (S) are Satellite Centers. Neighborhood centers are less than 10,000 square feet ofspace that generally house organizations who offer targeted types of services. Satellite centers are largerfacilities, with roughly 10,000-20,000 square feet of space. Satellite centers can house multiple service providerswhich are often larger organizations with multiple branches. The Old Alviso Community Center and the OldHillview Library are currently not in use. For more information see our 2018 audit Community Center Reuse:Efficient Monitoring and Better Data Can Help Determine the Next Phase of Reuse.
RECREATION PROGRAMS AND COMMUNITY CENTERS(continued)
Source: Auditor generated based on Public Works data
City of San José Community Centers Map
City-run hub community centers
• Reuse centers
Alma Community Center (Youth & Senior) (S) Mayfair Community Center (hub)
Almaden Community Center (hub) McKinley Community Center (N)
Almaden Winery Community Center (S) Meadowfair Community Center (N)
Almaden (The Spot) Youth Center (N) Millbrook Community Center (N)
Alum Rock Youth Center (S) Noble House Neighborhood Center (N)
Alviso Youth Community Center (S) Noble Modular Community Center (N)
Backesto Neighborhood Center (N) Northside Community Center (S)
Bascom Community Center & Library (hub) Olinder Neighborhood Center (N)
Berryessa Community Center (hub) Old Alviso Community Center (Closed)
Berryessa Youth Center (S) Old Hillview Library (Closed)
Bramhall Park Neighborhood Center (N) Paul Moore Community Center (N)
Calabazas Community Center (N) Rainbow Park Neighborhood Center (N)
Camden Community Center (hub) Roosevelt Community Center (hub)
Capitol Park (Goss) Community Center (N) San Tomas Community Center (N)
Cypress Senior Center (hub) Seven Trees Community Center (hub)
Edenvale Community Center (S) Sherman Oaks Community Center (N)
Edenvale Youth Center (N) Shirakawa Community Center (S)
Evergreen Community Center (hub) Southside Community Center (hub)
Gardner Community Center (S) Spartan Keyes Neighborhood Center (N)
Hamann Park Community Center (N) Starbird Community Center (S)
Hank Lopez Community Center (N) Vista Park Community Center (N)
Houge Park Community Center (N) Washington United Youth Center (S)
Joseph George Youth Center (N) Welch Park Neighborhood Center (N)
Kirk Community Center (S) West San José Community Center (S)
Los Paseos Youth Center (S)Willow Glen Community & Senior Center (hub)
Community Centers in Operation (as of June 30, 2019)
105City of San José – Annual Report on City Services 2018-19
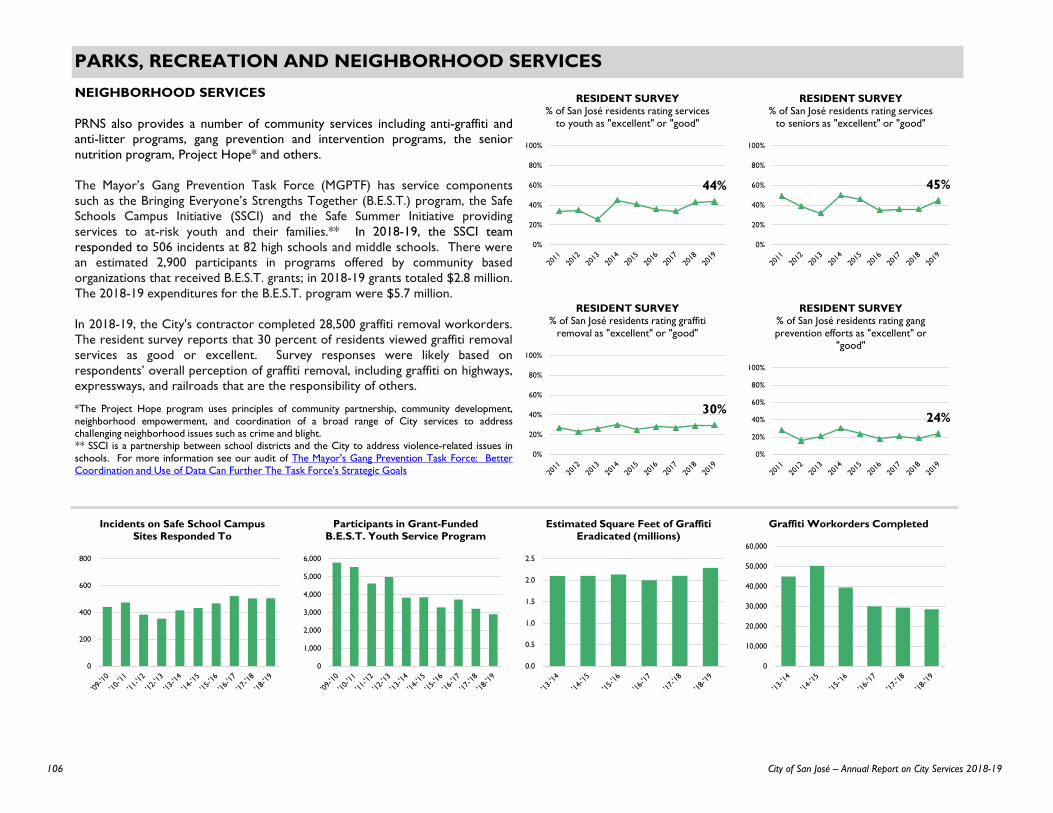
PARKS, RECREATION AND NEIGHBORHOOD SERVICES
NEIGHBORHOOD SERVICES
PRNS also provides a number of community services including anti-graffiti andanti-litter programs, gang prevention and intervention programs, the seniornutrition program, Project Hope* and others.
The Mayor’s Gang Prevention Task Force (MGPTF) has service componentssuch as the Bringing Everyone’s Strengths Together (B.E.S.T.) program, the SafeSchools Campus Initiative (SSCI) and the Safe Summer Initiative providingservices to at-risk youth and their families.** In 2018-19, the SSCI teamresponded to 506 incidents at 82 high schools and middle schools. There werean estimated 2,900 participants in programs offered by community basedorganizations that received B.E.S.T. grants; in 2018-19 grants totaled $2.8 million.The 2018-19 expenditures for the B.E.S.T. program were $5.7 million.
In 2018-19, the City's contractor completed 28,500 graffiti removal workorders.The resident survey reports that 30 percent of residents viewed graffiti removalservices as good or excellent. Survey responses were likely based onrespondents’ overall perception of graffiti removal, including graffiti on highways,expressways, and railroads that are the responsibility of others.
*The Project Hope program uses principles of community partnership, community development,neighborhood empowerment, and coordination of a broad range of City services to addresschallenging neighborhood issues such as crime and blight.** SSCI is a partnership between school districts and the City to address violence-related issues inschools. For more information see our audit of The Mayor's Gang Prevention Task Force: BetterCoordination and Use of Data Can Further The Task Force's Strategic Goals
44%
0%
20%
40%
60%
80%
100%
RESIDENT SURVEY% of San José residents rating services
to youth as "excellent" or "good"
45%
0%
20%
40%
60%
80%
100%
RESIDENT SURVEY% of San José residents rating services
to seniors as "excellent" or "good"
30%
0%
20%
40%
60%
80%
100%
RESIDENT SURVEY% of San José residents rating graffiti
removal as "excellent" or "good"
24%
0%
20%
40%
60%
80%
100%
RESIDENT SURVEY% of San José residents rating gang prevention efforts as "excellent" or
"good"
0
200
400
600
800
Incidents on Safe School Campus Sites Responded To
0
1,000
2,000
3,000
4,000
5,000
6,000
Participants in Grant-Funded B.E.S.T. Youth Service Program
0.0
0.5
1.0
1.5
2.0
2.5
Estimated Square Feet of Graffiti Eradicated (millions)
0
10,000
20,000
30,000
40,000
50,000
60,000
Graffiti Workorders Completed
106 City of San José – Annual Report on City Services 2018-19
PLANNING, BUILDING AND CODE ENFORCEMENT
The mission of the Planning, Building and Code Enforcement Department is to facilitate the preservation and building of a safe, attractive, vibrant and
sustainable San José through partnership with and exceptional service to our diverse communities and customers.
107City of San José – Annual Report on City Services 2018-19
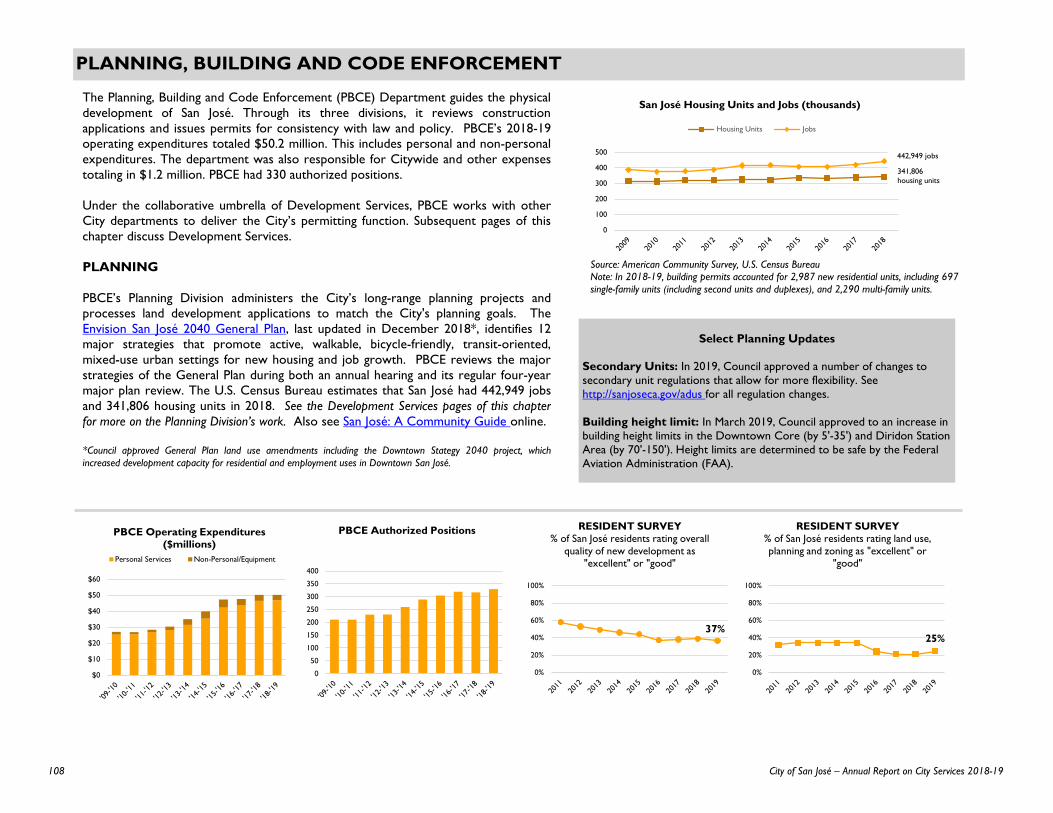
PLANNING, BUILDING AND CODE ENFORCEMENT
Select Planning Updates
Secondary Units: In 2019, Council approved a number of changes to secondary unit regulations that allow for more flexibility. See http://sanjoseca.gov/adus for all regulation changes.
Building height limit: In March 2019, Council approved to an increase in building height limits in the Downtown Core (by 5'-35') and Diridon Station Area (by 70'-150'). Height limits are determined to be safe by the Federal Aviation Administration (FAA).
$0
$10
$20
$30
$40
$50
$60
PBCE Operating Expenditures ($millions)
Personal Services Non-Personal/Equipment
0
50
100
150
200
250
300
350
400
PBCE Authorized Positions
0%
20%
40%
60%
80%
100%
RESIDENT SURVEY% of San José residents rating overall
quality of new development as "excellent" or "good"
0%
20%
40%
60%
80%
100%
RESIDENT SURVEY% of San José residents rating land use, planning and zoning as "excellent" or
"good"
0
100
200
300
400
500
San José Housing Units and Jobs (thousands)
Housing Units Jobs
Source: American Community Survey, U.S. Census BureauNote: In 2018-19, building permits accounted for 2,987 new residential units, including 697 single-family units (including second units and duplexes), and 2,290 multi-family units.
25%37%
442,949 jobs
341,806 housing units
The Planning, Building and Code Enforcement (PBCE) Department guides the physicaldevelopment of San José. Through its three divisions, it reviews constructionapplications and issues permits for consistency with law and policy. PBCE’s 2018-19operating expenditures totaled $50.2 million. This includes personal and non-personalexpenditures. The department was also responsible for Citywide and other expensestotaling in $1.2 million. PBCE had 330 authorized positions.
Under the collaborative umbrella of Development Services, PBCE works with otherCity departments to deliver the City’s permitting function. Subsequent pages of thischapter discuss Development Services.
PLANNING
PBCE’s Planning Division administers the City’s long-range planning projects andprocesses land development applications to match the City's planning goals. TheEnvision San José 2040 General Plan, last updated in December 2018*, identifies 12major strategies that promote active, walkable, bicycle-friendly, transit-oriented,mixed-use urban settings for new housing and job growth. PBCE reviews the majorstrategies of the General Plan during both an annual hearing and its regular four-yearmajor plan review. The U.S. Census Bureau estimates that San José had 442,949 jobsand 341,806 housing units in 2018. See the Development Services pages of this chapterfor more on the Planning Division’s work. Also see San José: A Community Guide online.
*Council approved General Plan land use amendments including the Downtown Stategy 2040 project, whichincreased development capacity for residential and employment uses in Downtown San José.
108 City of San José – Annual Report on City Services 2018-19
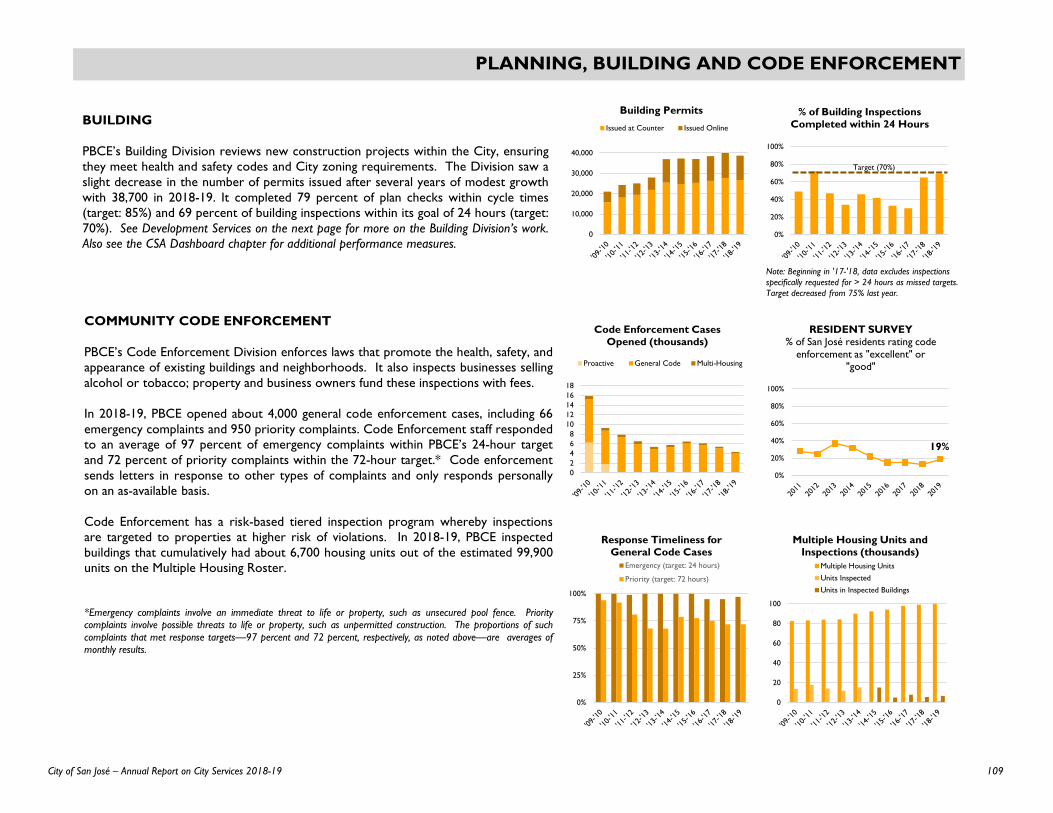
PLANNING, BUILDING AND CODE ENFORCEMENT
COMMUNITY CODE ENFORCEMENT
PBCE’s Code Enforcement Division enforces laws that promote the health, safety, andappearance of existing buildings and neighborhoods. It also inspects businesses sellingalcohol or tobacco; property and business owners fund these inspections with fees.
In 2018-19, PBCE opened about 4,000 general code enforcement cases, including 66emergency complaints and 950 priority complaints. Code Enforcement staff respondedto an average of 97 percent of emergency complaints within PBCE’s 24-hour targetand 72 percent of priority complaints within the 72-hour target.* Code enforcementsends letters in response to other types of complaints and only responds personallyon an as-available basis.
Code Enforcement has a risk-based tiered inspection program whereby inspectionsare targeted to properties at higher risk of violations. In 2018-19, PBCE inspectedbuildings that cumulatively had about 6,700 housing units out of the estimated 99,900units on the Multiple Housing Roster.
*Emergency complaints involve an immediate threat to life or property, such as unsecured pool fence. Prioritycomplaints involve possible threats to life or property, such as unpermitted construction. The proportions of suchcomplaints that met response targets—97 percent and 72 percent, respectively, as noted above—are averages ofmonthly results.
BUILDING
PBCE’s Building Division reviews new construction projects within the City, ensuringthey meet health and safety codes and City zoning requirements. The Division saw aslight decrease in the number of permits issued after several years of modest growthwith 38,700 in 2018-19. It completed 79 percent of plan checks within cycle times(target: 85%) and 69 percent of building inspections within its goal of 24 hours (target:70%). See Development Services on the next page for more on the Building Division’s work.Also see the CSA Dashboard chapter for additional performance measures.
0%
25%
50%
75%
100%
Response Timeliness for General Code Cases
Emergency (target: 24 hours)
Priority (target: 72 hours)
0
20
40
60
80
100
Multiple Housing Units and Inspections (thousands)
Multiple Housing Units
Units Inspected
Units in Inspected Buildings
0%
20%
40%
60%
80%
100%
RESIDENT SURVEY% of San José residents rating code
enforcement as "excellent" or "good"
0
10,000
20,000
30,000
40,000
Building PermitsIssued at Counter Issued Online
0%
20%
40%
60%
80%
100%
% of Building Inspections Completed within 24 Hours
02468
1012141618
Code Enforcement Cases Opened (thousands)
Proactive General Code Multi-Housing
Note: Beginning in '17-'18, data excludes inspections specifically requested for > 24 hours as missed targets. Target decreased from 75% last year.
Target (70%)
19%
109City of San José – Annual Report on City Services 2018-19
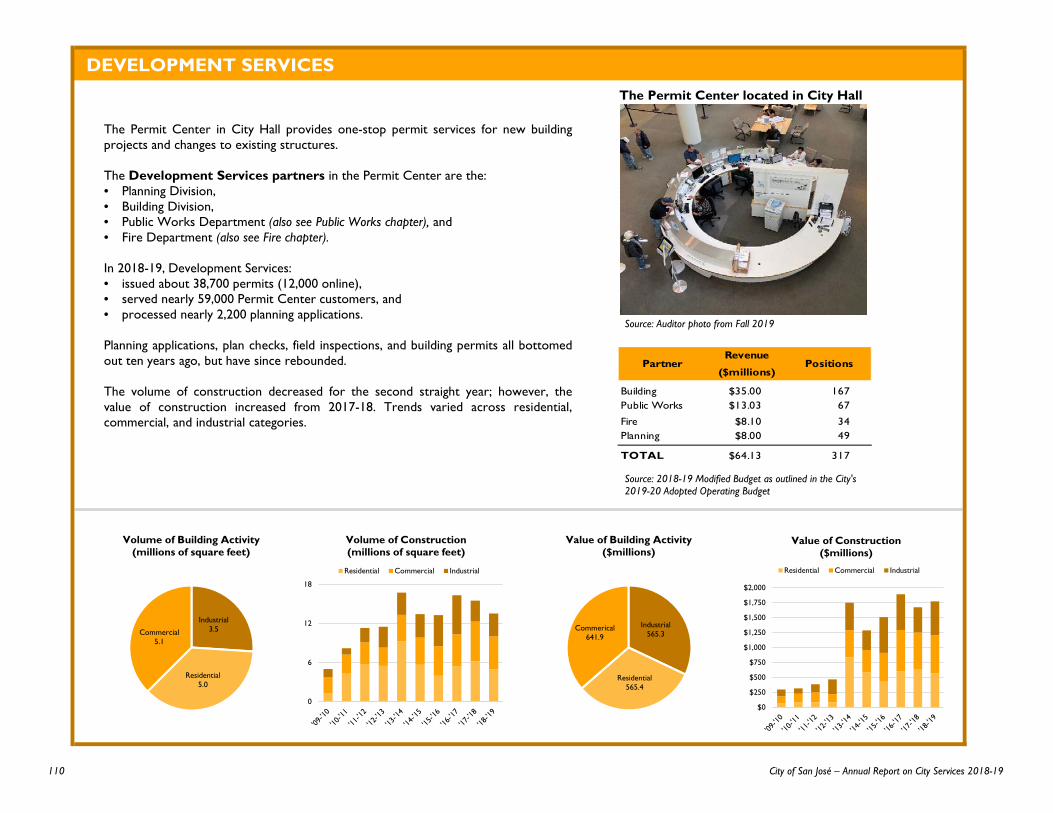
DEVELOPMENT SERVICES
The Permit Center in City Hall provides one-stop permit services for new buildingprojects and changes to existing structures.
The Development Services partners in the Permit Center are the:• Planning Division,• Building Division,• Public Works Department (also see Public Works chapter), and• Fire Department (also see Fire chapter).
In 2018-19, Development Services:• issued about 38,700 permits (12,000 online),• served nearly 59,000 Permit Center customers, and• processed nearly 2,200 planning applications.
Planning applications, plan checks, field inspections, and building permits all bottomedout ten years ago, but have since rebounded.
The volume of construction decreased for the second straight year; however, thevalue of construction increased from 2017-18. Trends varied across residential,commercial, and industrial categories.
Source: Auditor photo from Fall 2019
Industrial3.5
Residential5.0
Commercial5.1
Volume of Building Activity (millions of square feet)
0
6
12
18
Volume of Construction (millions of square feet)
Residential Commercial Industrial
Industrial565.3
Residential565.4
Commerical641.9
Value of Building Activity ($millions)
$0
$250
$500
$750
$1,000
$1,250
$1,500
$1,750
$2,000
Value of Construction ($millions)
Residential Commercial Industrial
Source: 2018-19 Modified Budget as outlined in the City's 2019-20 Adopted Operating Budget
The Permit Center located in City Hall
PartnerRevenue
($millions)Positions
Building $35.00 167Public Works $13.03 67
Fire $8.10 34Planning $8.00 49
TOTAL $64.13 317
110 City of San José – Annual Report on City Services 2018-19
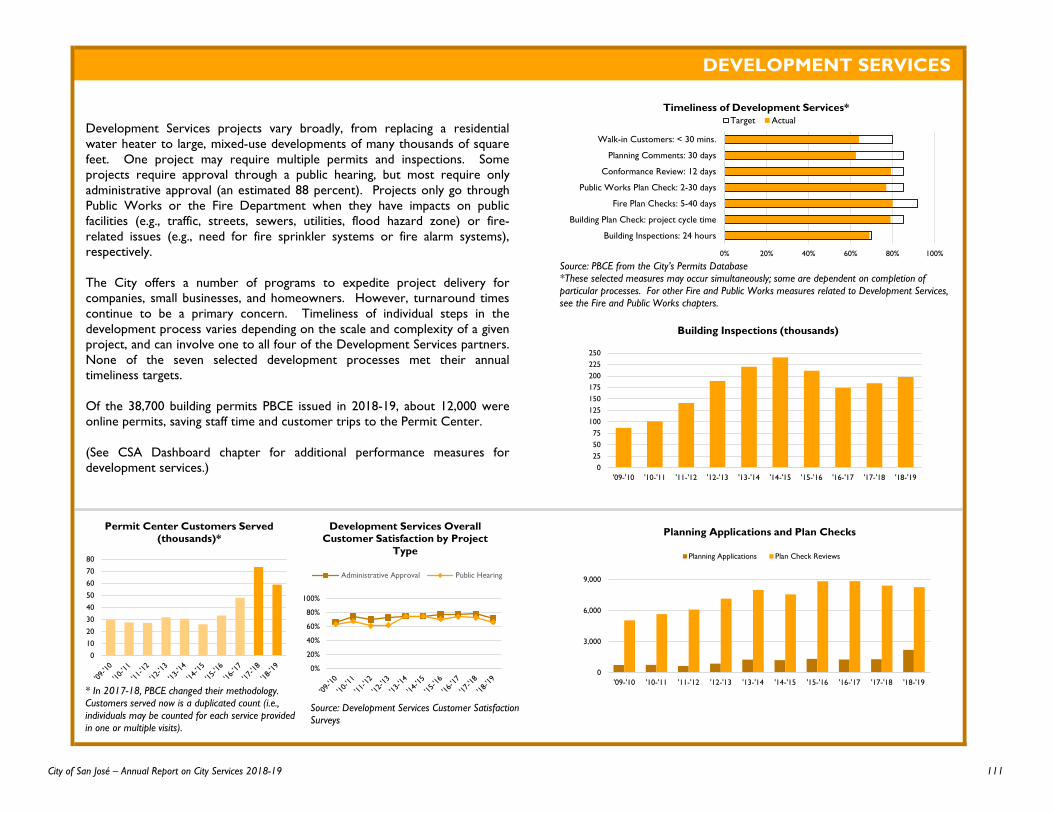
DEVELOPMENT SERVICES
Development Services projects vary broadly, from replacing a residentialwater heater to large, mixed-use developments of many thousands of squarefeet. One project may require multiple permits and inspections. Someprojects require approval through a public hearing, but most require onlyadministrative approval (an estimated 88 percent). Projects only go throughPublic Works or the Fire Department when they have impacts on publicfacilities (e.g., traffic, streets, sewers, utilities, flood hazard zone) or fire-related issues (e.g., need for fire sprinkler systems or fire alarm systems),respectively.
The City offers a number of programs to expedite project delivery forcompanies, small businesses, and homeowners. However, turnaround timescontinue to be a primary concern. Timeliness of individual steps in thedevelopment process varies depending on the scale and complexity of a givenproject, and can involve one to all four of the Development Services partners.None of the seven selected development processes met their annualtimeliness targets.
Of the 38,700 building permits PBCE issued in 2018-19, about 12,000 wereonline permits, saving staff time and customer trips to the Permit Center.
(See CSA Dashboard chapter for additional performance measures fordevelopment services.)
0
10
20
30
40
50
60
70
80
Permit Center Customers Served (thousands)*
0%
20%
40%
60%
80%
100%
Development Services Overall Customer Satisfaction by Project
Type
Administrative Approval Public Hearing
0% 20% 40% 60% 80% 100%
Building Inspections: 24 hours
Building Plan Check: project cycle time
Fire Plan Checks: 5-40 days
Public Works Plan Check: 2-30 days
Conformance Review: 12 days
Planning Comments: 30 days
Walk-in Customers: < 30 mins.
Timeliness of Development Services*Target Actual
Source: PBCE from the City’s Permits Database*These selected measures may occur simultaneously; some are dependent on completion ofparticular processes. For other Fire and Public Works measures related to Development Services,see the Fire and Public Works chapters.
0255075
100125150175200225250
'09-'10 '10-'11 '11-'12 '12-'13 '13-'14 '14-'15 '15-'16 '16-'17 '17-'18 '18-'19
Building Inspections (thousands)
0
3,000
6,000
9,000
'09-'10 '10-'11 '11-'12 '12-'13 '13-'14 '14-'15 '15-'16 '16-'17 '17-'18 '18-'19
Planning Applications and Plan Checks
Planning Applications Plan Check Reviews
Source: Development Services Customer Satisfaction Surveys
* In 2017-18, PBCE changed their methodology.Customers served now is a duplicated count (i.e.,individuals may be counted for each service providedin one or multiple visits).
111City of San José – Annual Report on City Services 2018-19

112 City of San José – Annual Report on City Services 2018-19

POLICE
The San José Police Department’s mission is to create safe places to live, work and learn through community partnerships.
113City of San José – Annual Report on City Services 2018-19
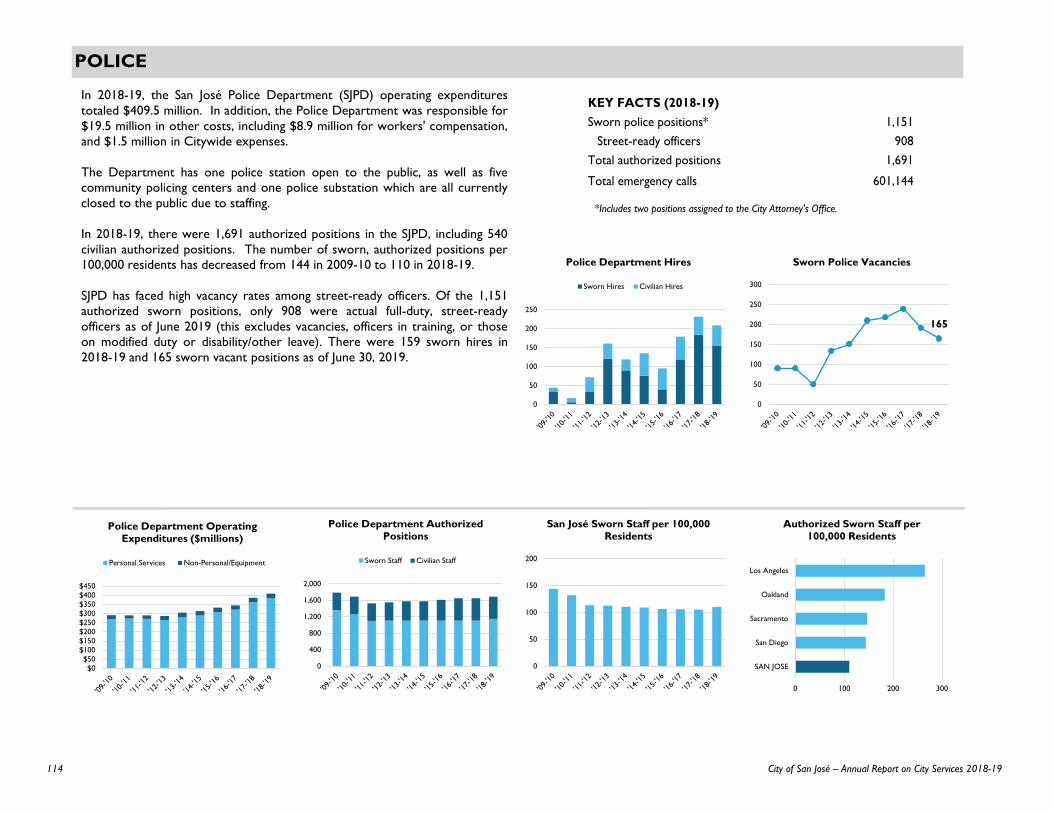
POLICE
In 2018-19, the San José Police Department (SJPD) operating expenditurestotaled $409.5 million. In addition, the Police Department was responsible for$19.5 million in other costs, including $8.9 million for workers' compensation,and $1.5 million in Citywide expenses.
The Department has one police station open to the public, as well as fivecommunity policing centers and one police substation which are all currentlyclosed to the public due to staffing.
In 2018-19, there were 1,691 authorized positions in the SJPD, including 540civilian authorized positions. The number of sworn, authorized positions per100,000 residents has decreased from 144 in 2009-10 to 110 in 2018-19.
SJPD has faced high vacancy rates among street-ready officers. Of the 1,151authorized sworn positions, only 908 were actual full-duty, street-readyofficers as of June 2019 (this excludes vacancies, officers in training, or thoseon modified duty or disability/other leave). There were 159 sworn hires in2018-19 and 165 sworn vacant positions as of June 30, 2019.
165
0
50
100
150
200
250
300
Sworn Police Vacancies
*Includes two positions assigned to the City Attorney's Office.
$0$50
$100$150$200$250$300$350$400$450
Police Department Operating Expenditures ($millions)
Personal Services Non-Personal/Equipment
0
400
800
1,200
1,600
2,000
Police Department Authorized Positions
Sworn Staff Civilian Staff
0
50
100
150
200
San José Sworn Staff per 100,000 Residents
0 100 200 300
SAN JOSE
San Diego
Sacramento
Oakland
Los Angeles
Authorized Sworn Staff per 100,000 Residents
0
50
100
150
200
250
Police Department Hires
Sworn Hires Civilian Hires
KEY FACTS (2018-19)Sworn police positions* 1,151
Street-ready officers 908Total authorized positions 1,691
Total emergency calls 601,144
114 City of San José – Annual Report on City Services 2018-19
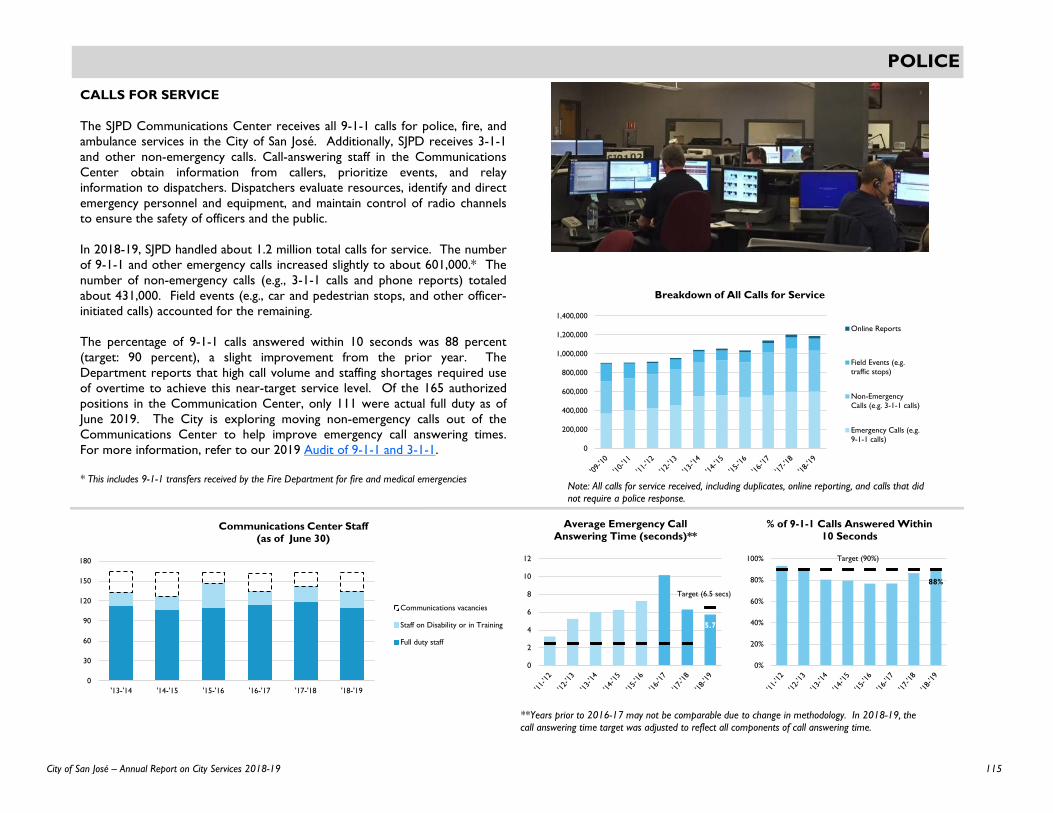
POLICE
CALLS FOR SERVICE
The SJPD Communications Center receives all 9-1-1 calls for police, fire, andambulance services in the City of San José. Additionally, SJPD receives 3-1-1and other non-emergency calls. Call-answering staff in the CommunicationsCenter obtain information from callers, prioritize events, and relayinformation to dispatchers. Dispatchers evaluate resources, identify and directemergency personnel and equipment, and maintain control of radio channelsto ensure the safety of officers and the public.
In 2018-19, SJPD handled about 1.2 million total calls for service. The numberof 9-1-1 and other emergency calls increased slightly to about 601,000.* Thenumber of non-emergency calls (e.g., 3-1-1 calls and phone reports) totaledabout 431,000. Field events (e.g., car and pedestrian stops, and other officer-initiated calls) accounted for the remaining.
The percentage of 9-1-1 calls answered within 10 seconds was 88 percent(target: 90 percent), a slight improvement from the prior year. TheDepartment reports that high call volume and staffing shortages required useof overtime to achieve this near-target service level. Of the 165 authorizedpositions in the Communication Center, only 111 were actual full duty as ofJune 2019. The City is exploring moving non-emergency calls out of theCommunications Center to help improve emergency call answering times.For more information, refer to our 2019 Audit of 9-1-1 and 3-1-1.
* This includes 9-1-1 transfers received by the Fire Department for fire and medical emergencies
0
30
60
90
120
150
180
'13-'14 '14-'15 '15-'16 '16-'17 '17-'18 '18-'19
Communications Center Staff(as of June 30)
Communications vacancies
Staff on Disability or in Training
Full duty staff
5.7
0
2
4
6
8
10
12
Average Emergency Call Answering Time (seconds)**
88%
0%
20%
40%
60%
80%
100%
% of 9-1-1 Calls Answered Within 10 Seconds
Note: All calls for service received, including duplicates, online reporting, and calls that did not require a police response.
0
200,000
400,000
600,000
800,000
1,000,000
1,200,000
1,400,000
Breakdown of All Calls for Service
Online Reports
Field Events (e.g.traffic stops)
Non-EmergencyCalls (e.g. 3-1-1 calls)
Emergency Calls (e.g.9-1-1 calls)
Target (90%)
**Years prior to 2016-17 may not be comparable due to change in methodology. In 2018-19, the call answering time target was adjusted to reflect all components of call answering time.
Target (6.5 secs)
115City of San José – Annual Report on City Services 2018-19
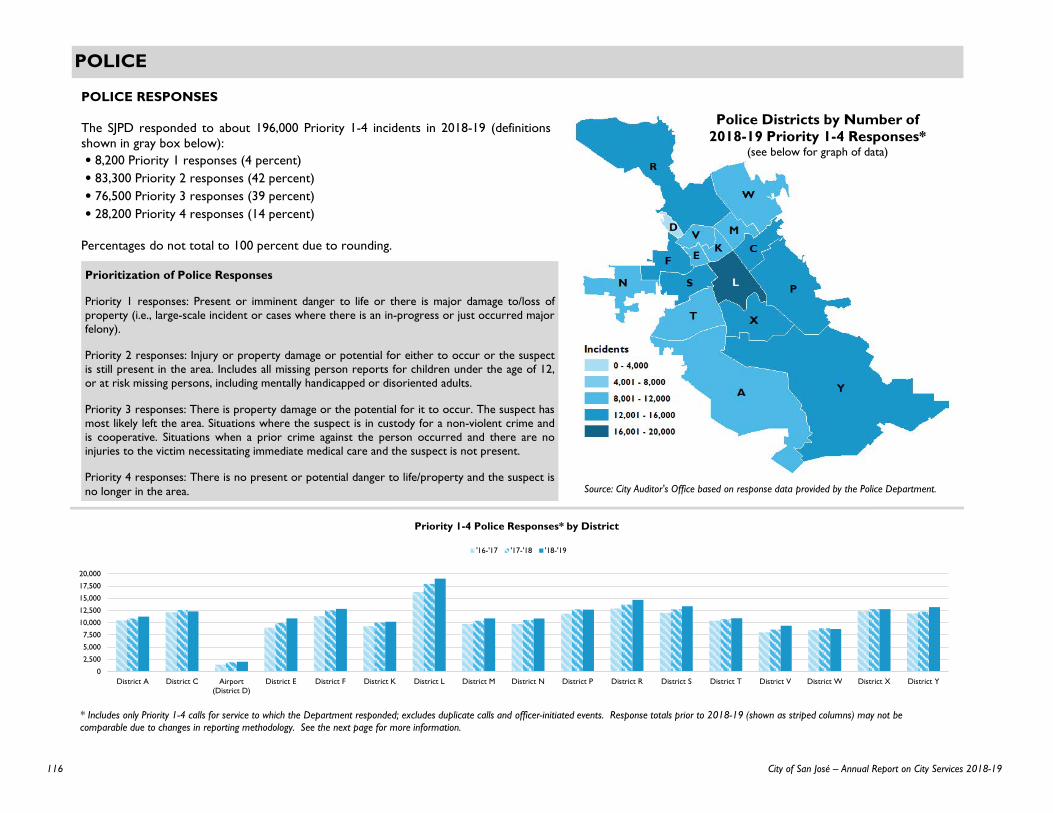
POLICE
POLICE RESPONSES
The SJPD responded to about 196,000 Priority 1-4 incidents in 2018-19 (definitionsshown in gray box below):• 8,200 Priority 1 responses (4 percent)• 83,300 Priority 2 responses (42 percent)• 76,500 Priority 3 responses (39 percent)• 28,200 Priority 4 responses (14 percent)
Percentages do not total to 100 percent due to rounding.
Prioritization of Police Responses
Priority 1 responses: Present or imminent danger to life or there is major damage to/loss ofproperty (i.e., large-scale incident or cases where there is an in-progress or just occurred majorfelony).
Priority 2 responses: Injury or property damage or potential for either to occur or the suspectis still present in the area. Includes all missing person reports for children under the age of 12,or at risk missing persons, including mentally handicapped or disoriented adults.
Priority 3 responses: There is property damage or the potential for it to occur. The suspect hasmost likely left the area. Situations where the suspect is in custody for a non-violent crime andis cooperative. Situations when a prior crime against the person occurred and there are noinjuries to the victim necessitating immediate medical care and the suspect is not present.
Priority 4 responses: There is no present or potential danger to life/property and the suspect isno longer in the area.
0
2,500
5,000
7,500
10,000
12,500
15,000
17,500
20,000
District A District C Airport(District D)
District E District F District K District L District M District N District P District R District S District T District V District W District X District Y
Priority 1-4 Police Responses* by District
'16-'17 '17-'18 '18-'19
Source: City Auditor's Office based on response data provided by the Police Department.
* Includes only Priority 1-4 calls for service to which the Department responded; excludes duplicate calls and officer-initiated events. Response totals prior to 2018-19 (shown as striped columns) may not becomparable due to changes in reporting methodology. See the next page for more information.
Police Districts by Number of 2018-19 Priority 1-4 Responses*
(see below for graph of data)
116 City of San José – Annual Report on City Services 2018-19

POLICE
POLICE RESPONSE TIMES
In 2018-19, the citywide average response time* for Priority 1 calls was 7.1minutes (target: 6 minutes). The citywide average 19.9 minute response timefor Priority 2 calls was well above the target of 11 minutes.
As staffing reductions have affected the SJPD, the Department has focused onmaintaining the Priority 1 response times as these calls involve present orimminent danger to life or major property loss. Priority 2 calls are those whichinvolve either injury or property damage, or the potential for either to occur.
The Department disaggregates response times by three time targets:processing time, queuing time, and driving time. In 2018-19 the Departmentprocessing time for both Priority 1 and 2 were close to targets while queuingtime for Priority 1 was just slightly above target.
In 2018-19, all but three districts exceeded the 6 minute target response timefor Priority 1 calls. Response time may vary across districts because of the sizeor physical characteristics of an area, whether there are adjacent policeservice areas, population density, traffic conditions, and officer staffing levels.
19.9
0
5
10
15
20
25
Average Priority 2 Police Response Time* (minutes)
0
2
4
6
8
10
12
District A District C Airport(District D)
District E District F District K District L District M District N District P District R District S District T District V District W District X District Y
Priority 1 Average Police Response Times* (minutes)
'16-'17 '17-'18 '18-'19
7.1
0
5
10
15
20
25
Average Priority 1 Police Response Time* (minutes)
Target (6 min.)
Target (11 min.)
0
3
6
9
12
15
Processing (<1.5min)
Queuing (<3.5min)
Driving (<6 min)
Priority 2 Response Time Breakdown* (minutes)
'16-'17 '17-'18 '18-'19
0
3
6
9
12
15
Processing (<1.5min)
Queuing (<0.5min)
Driving (<4 min)
Priority 1 Response Time Breakdown* (minutes)
'16-'17 '17-'18 '18-'19
Target (6 min.)
*Response times prior to 2018-19 (shown as striped columns) may not be comparable due to changes in reporting methodology. In 2018-19, SJPD revised their reporting of police response times to be based on howincidents are initially coded into their system. In prior years, SJPD had measured response times based on updated coding of incidents as determined throughout the response, which could change the priorities ofincidents and incorrectly affect response times.
117City of San José – Annual Report on City Services 2018-19
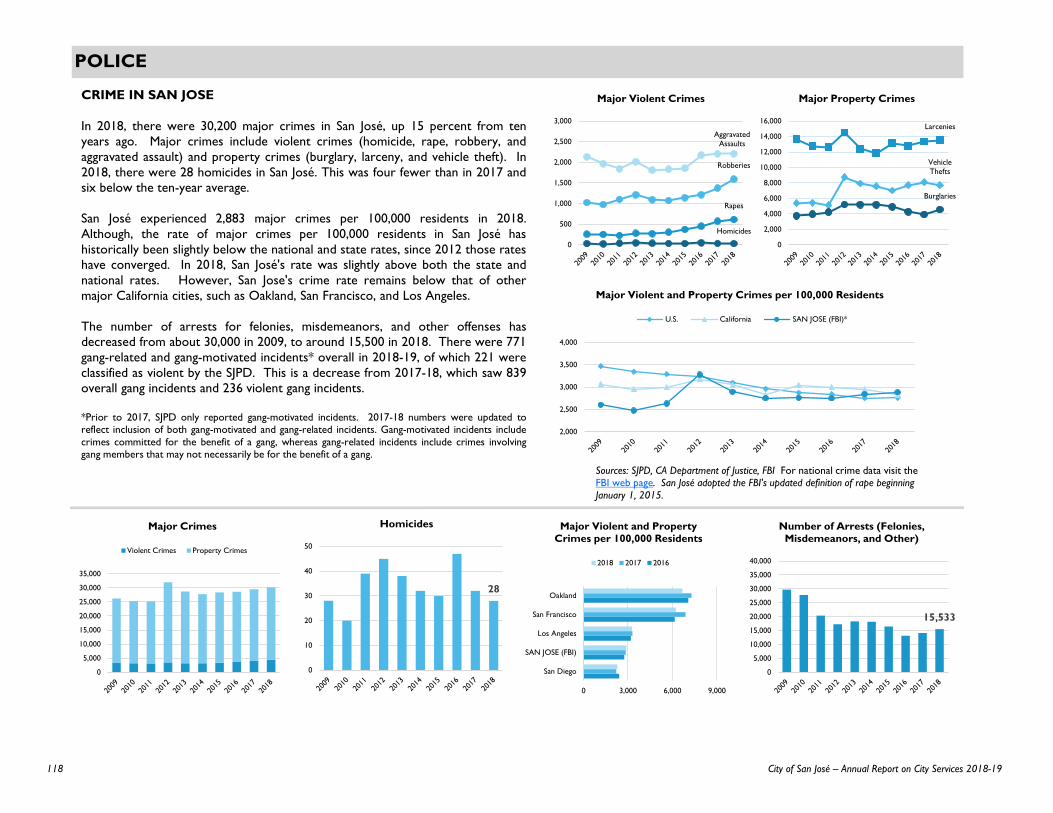
POLICE
Sources: SJPD, CA Department of Justice, FBI For national crime data visit the FBI web page. San José adopted the FBI's updated definition of rape beginning January 1, 2015.
CRIME IN SAN JOSE
In 2018, there were 30,200 major crimes in San José, up 15 percent from tenyears ago. Major crimes include violent crimes (homicide, rape, robbery, andaggravated assault) and property crimes (burglary, larceny, and vehicle theft). In2018, there were 28 homicides in San José. This was four fewer than in 2017 andsix below the ten-year average.
San José experienced 2,883 major crimes per 100,000 residents in 2018.Although, the rate of major crimes per 100,000 residents in San José hashistorically been slightly below the national and state rates, since 2012 those rateshave converged. In 2018, San José's rate was slightly above both the state andnational rates. However, San Jose's crime rate remains below that of othermajor California cities, such as Oakland, San Francisco, and Los Angeles.
The number of arrests for felonies, misdemeanors, and other offenses hasdecreased from about 30,000 in 2009, to around 15,500 in 2018. There were 771gang-related and gang-motivated incidents* overall in 2018-19, of which 221 wereclassified as violent by the SJPD. This is a decrease from 2017-18, which saw 839overall gang incidents and 236 violent gang incidents.
*Prior to 2017, SJPD only reported gang-motivated incidents. 2017-18 numbers were updated toreflect inclusion of both gang-motivated and gang-related incidents. Gang-motivated incidents includecrimes committed for the benefit of a gang, whereas gang-related incidents include crimes involvinggang members that may not necessarily be for the benefit of a gang.
Larcenies
Vehicle Thefts
Burglaries
0
2,000
4,000
6,000
8,000
10,000
12,000
14,000
16,000
Major Property Crimes
0
5,000
10,000
15,000
20,000
25,000
30,000
35,000
Major Crimes
Violent Crimes Property Crimes
28
0
10
20
30
40
50
Homicides
0 3,000 6,000 9,000
San Diego
SAN JOSE (FBI)
Los Angeles
San Francisco
Oakland
Major Violent and Property Crimes per 100,000 Residents
2018 2017 2016
15,533
0
5,000
10,000
15,000
20,000
25,000
30,000
35,000
40,000
Number of Arrests (Felonies, Misdemeanors, and Other)
Aggravated Assaults
Robberies
Rapes
Homicides
0
500
1,000
1,500
2,000
2,500
3,000
Major Violent Crimes
2,000
2,500
3,000
3,500
4,000
Major Violent and Property Crimes per 100,000 Residents
U.S. California SAN JOSE (FBI)*
118 City of San José – Annual Report on City Services 2018-19
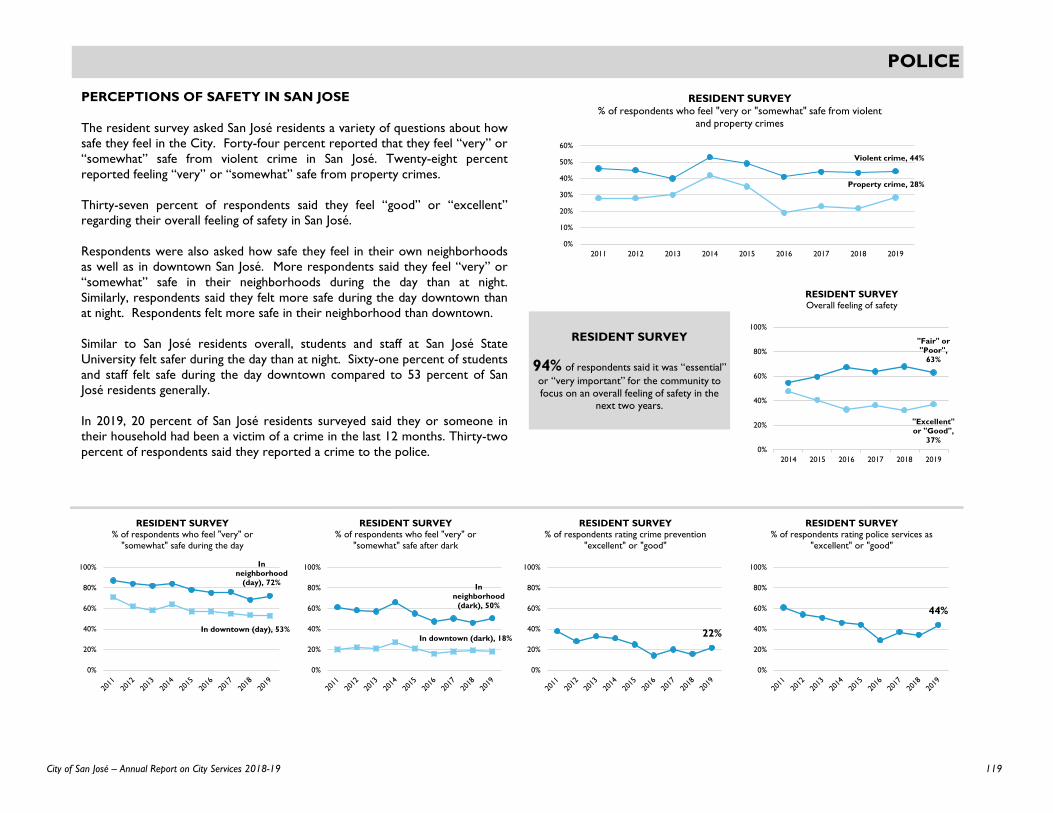
POLICE
PERCEPTIONS OF SAFETY IN SAN JOSE
The resident survey asked San José residents a variety of questions about howsafe they feel in the City. Forty-four percent reported that they feel “very” or“somewhat” safe from violent crime in San José. Twenty-eight percentreported feeling “very” or “somewhat” safe from property crimes.
Thirty-seven percent of respondents said they feel “good” or “excellent”regarding their overall feeling of safety in San José.
Respondents were also asked how safe they feel in their own neighborhoodsas well as in downtown San José. More respondents said they feel “very” or“somewhat” safe in their neighborhoods during the day than at night.Similarly, respondents said they felt more safe during the day downtown thanat night. Respondents felt more safe in their neighborhood than downtown.
Similar to San José residents overall, students and staff at San José StateUniversity felt safer during the day than at night. Sixty-one percent of studentsand staff felt safe during the day downtown compared to 53 percent of SanJosé residents generally.
In 2019, 20 percent of San José residents surveyed said they or someone intheir household had been a victim of a crime in the last 12 months. Thirty-twopercent of respondents said they reported a crime to the police.
In neighborhood
(day), 72%
In downtown (day), 53%
0%
20%
40%
60%
80%
100%
RESIDENT SURVEY% of respondents who feel "very" or
"somewhat" safe during the day
In neighborhood
(dark), 50%
In downtown (dark), 18%
0%
20%
40%
60%
80%
100%
RESIDENT SURVEY% of respondents who feel "very" or
"somewhat" safe after dark
22%
0%
20%
40%
60%
80%
100%
RESIDENT SURVEY% of respondents rating crime prevention
"excellent" or "good"
44%
0%
20%
40%
60%
80%
100%
RESIDENT SURVEY% of respondents rating police services as
"excellent" or "good"
RESIDENT SURVEY
94% of respondents said it was “essential”or “very important” for the community to focus on an overall feeling of safety in the
next two years."Excellent" or "Good",
37%
"Fair" or "Poor",
63%
0%
20%
40%
60%
80%
100%
2014 2015 2016 2017 2018 2019
RESIDENT SURVEYOverall feeling of safety
Property crime, 28%
Violent crime, 44%
0%
10%
20%
30%
40%
50%
60%
2011 2012 2013 2014 2015 2016 2017 2018 2019
RESIDENT SURVEY% of respondents who feel "very or "somewhat" safe from violent
and property crimes
119City of San José – Annual Report on City Services 2018-19
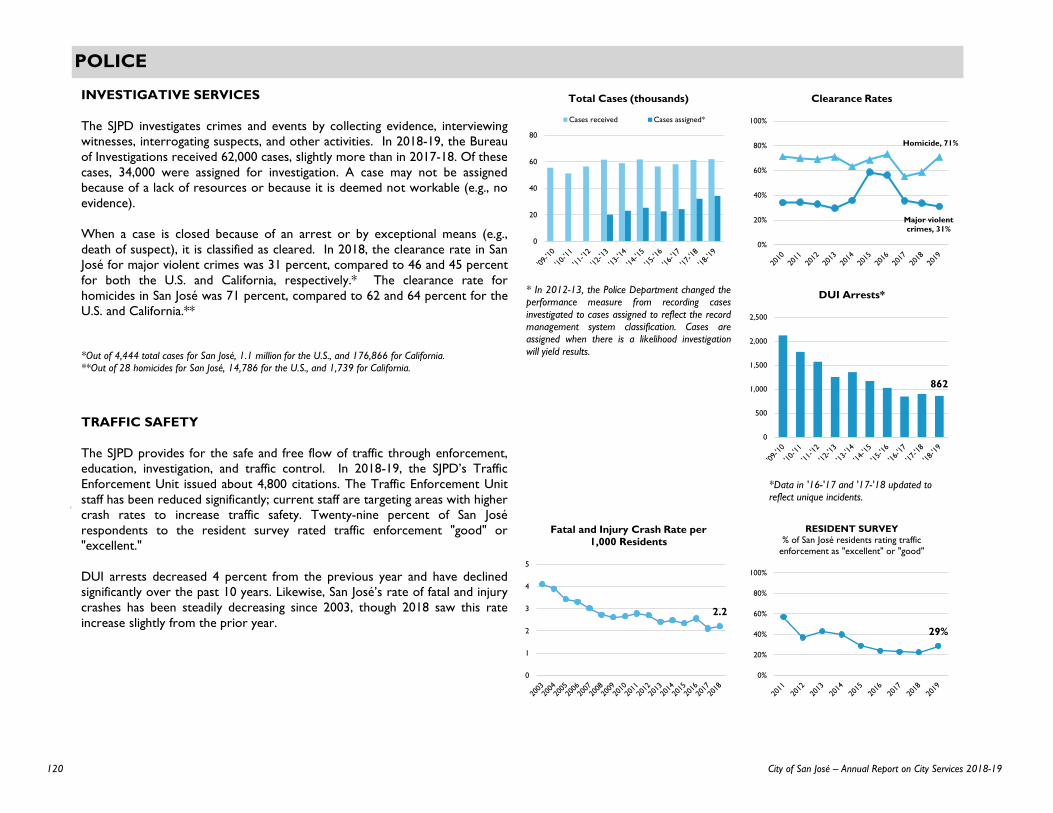
POLICE
INVESTIGATIVE SERVICES
The SJPD investigates crimes and events by collecting evidence, interviewingwitnesses, interrogating suspects, and other activities. In 2018-19, the Bureauof Investigations received 62,000 cases, slightly more than in 2017-18. Of thesecases, 34,000 were assigned for investigation. A case may not be assignedbecause of a lack of resources or because it is deemed not workable (e.g., noevidence).
When a case is closed because of an arrest or by exceptional means (e.g.,death of suspect), it is classified as cleared. In 2018, the clearance rate in SanJosé for major violent crimes was 31 percent, compared to 46 and 45 percentfor both the U.S. and California, respectively.* The clearance rate forhomicides in San José was 71 percent, compared to 62 and 64 percent for theU.S. and California.**
*Out of 4,444 total cases for San José, 1.1 million for the U.S., and 176,866 for California.**Out of 28 homicides for San José, 14,786 for the U.S., and 1,739 for California.
TRAFFIC SAFETY
The SJPD provides for the safe and free flow of traffic through enforcement,education, investigation, and traffic control. In 2018-19, the SJPD’s TrafficEnforcement Unit issued about 4,800 citations. The Traffic Enforcement Unitstaff has been reduced significantly; current staff are targeting areas with highercrash rates to increase traffic safety. Twenty-nine percent of San Josérespondents to the resident survey rated traffic enforcement "good" or"excellent."
DUI arrests decreased 4 percent from the previous year and have declinedsignificantly over the past 10 years. Likewise, San José’s rate of fatal and injurycrashes has been steadily decreasing since 2003, though 2018 saw this rateincrease slightly from the prior year.
Major violent crimes, 31%
Homicide, 71%
0%
20%
40%
60%
80%
100%
Clearance Rates
862
0
500
1,000
1,500
2,000
2,500
DUI Arrests*
29%
0%
20%
40%
60%
80%
100%
RESIDENT SURVEY% of San José residents rating traffic
enforcement as "excellent" or "good"
0
20
40
60
80
Total Cases (thousands)
Cases received Cases assigned*
* In 2012-13, the Police Department changed theperformance measure from recording casesinvestigated to cases assigned to reflect the recordmanagement system classification. Cases areassigned when there is a likelihood investigationwill yield results.
2.2
0
1
2
3
4
5
Fatal and Injury Crash Rate per 1,000 Residents
*Data in '16-'17 and '17-'18 updated toreflect unique incidents.
120 City of San José – Annual Report on City Services 2018-19
PUBLIC WORKS
The mission of the Public Works Department is to provide excellent service in building a smart and sustainable community, maintaining and
managing City assets, and serving the animal care needs of the community.
121City of San José – Annual Report on City Services 2018-19
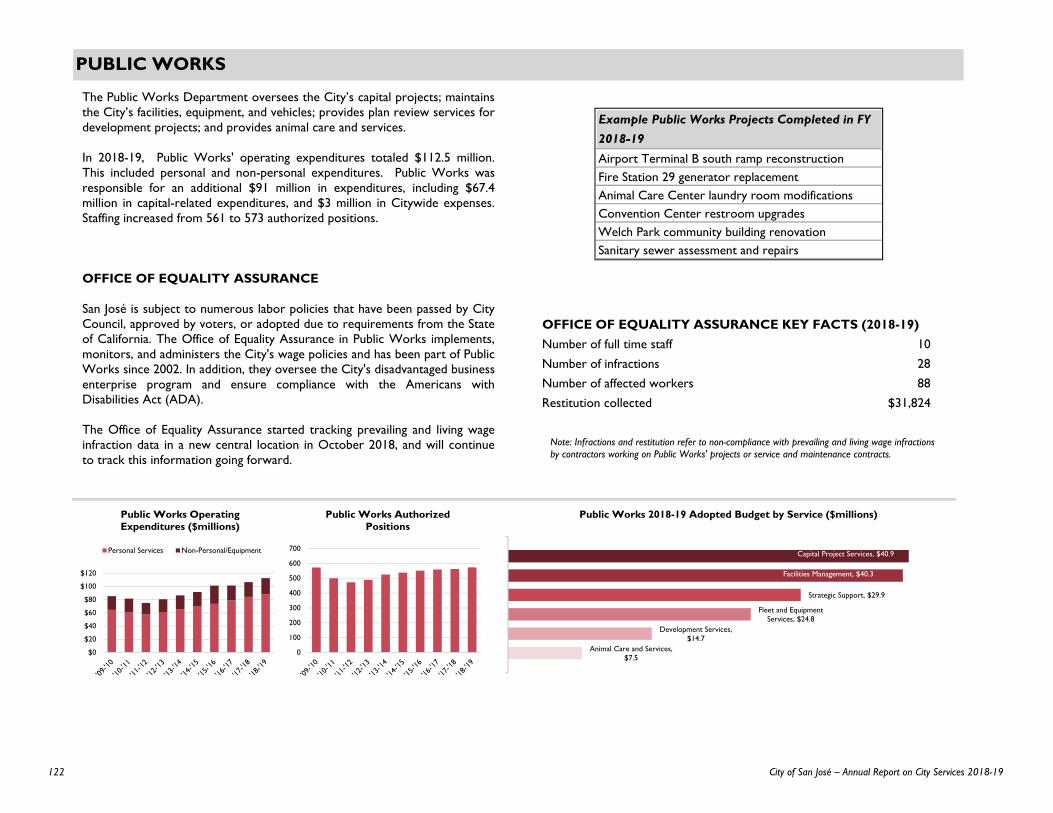
PUBLIC WORKS
$0
$20
$40
$60
$80
$100
$120
Public Works Operating Expenditures ($millions)
Personal Services Non-Personal/Equipment
0
100
200
300
400
500
600
700
Public Works Authorized Positions
Animal Care and Services, $7.5
Development Services, $14.7
Fleet and Equipment Services, $24.8
Strategic Support, $29.9
Facilities Management, $40.3
Capital Project Services, $40.9
Public Works 2018-19 Adopted Budget by Service ($millions)
The Public Works Department oversees the City’s capital projects; maintainsthe City’s facilities, equipment, and vehicles; provides plan review services fordevelopment projects; and provides animal care and services.
In 2018-19, Public Works' operating expenditures totaled $112.5 million.This included personal and non-personal expenditures. Public Works wasresponsible for an additional $91 million in expenditures, including $67.4million in capital-related expenditures, and $3 million in Citywide expenses.Staffing increased from 561 to 573 authorized positions.
OFFICE OF EQUALITY ASSURANCE
San José is subject to numerous labor policies that have been passed by CityCouncil, approved by voters, or adopted due to requirements from the Stateof California. The Office of Equality Assurance in Public Works implements,monitors, and administers the City's wage policies and has been part of PublicWorks since 2002. In addition, they oversee the City's disadvantaged businessenterprise program and ensure compliance with the Americans withDisabilities Act (ADA).
The Office of Equality Assurance started tracking prevailing and living wageinfraction data in a new central location in October 2018, and will continueto track this information going forward.
Example Public Works Projects Completed in FY
2018-19
Airport Terminal B south ramp reconstructionFire Station 29 generator replacementAnimal Care Center laundry room modificationsConvention Center restroom upgradesWelch Park community building renovationSanitary sewer assessment and repairs
Note: Infractions and restitution refer to non-compliance with prevailing and living wage infractions by contractors working on Public Works' projects or service and maintenance contracts.
OFFICE OF EQUALITY ASSURANCE KEY FACTS (2018-19)Number of full time staff 10
Number of infractions 28Number of affected workers 88
Restitution collected $31,824
122 City of San José – Annual Report on City Services 2018-19
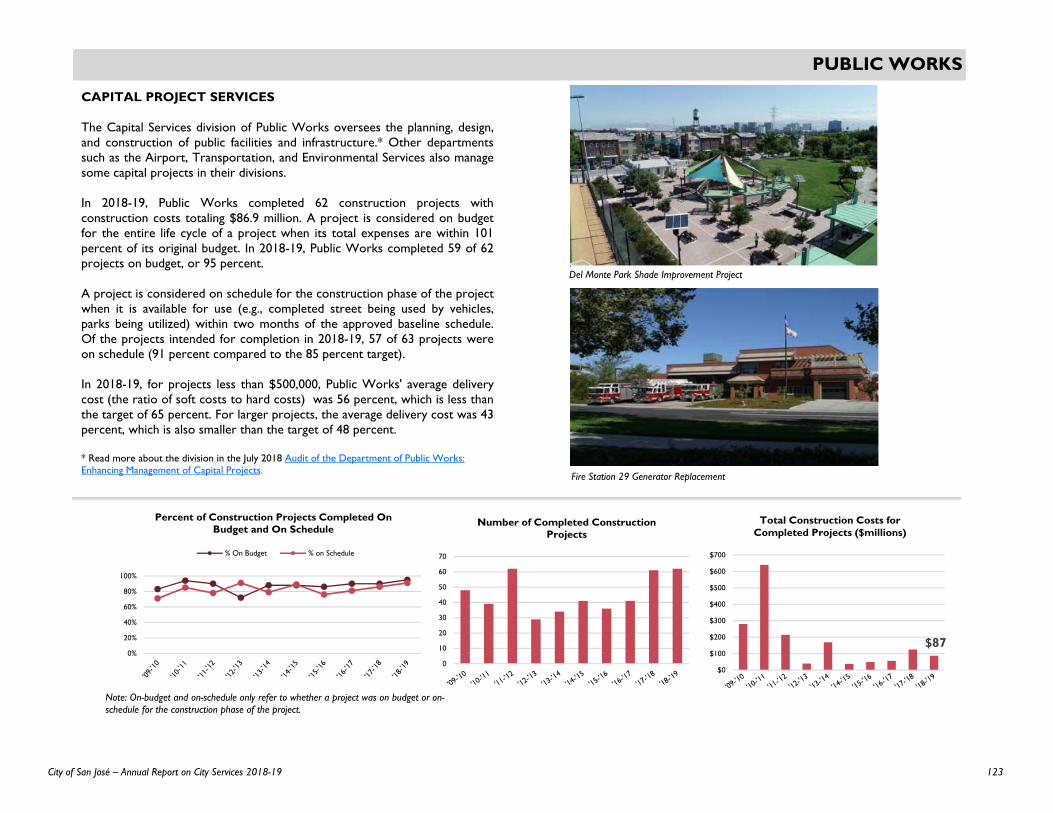
PUBLIC WORKS
CAPITAL PROJECT SERVICES
The Capital Services division of Public Works oversees the planning, design,and construction of public facilities and infrastructure.* Other departmentssuch as the Airport, Transportation, and Environmental Services also managesome capital projects in their divisions.
In 2018-19, Public Works completed 62 construction projects withconstruction costs totaling $86.9 million. A project is considered on budgetfor the entire life cycle of a project when its total expenses are within 101percent of its original budget. In 2018-19, Public Works completed 59 of 62projects on budget, or 95 percent.
A project is considered on schedule for the construction phase of the projectwhen it is available for use (e.g., completed street being used by vehicles,parks being utilized) within two months of the approved baseline schedule.Of the projects intended for completion in 2018-19, 57 of 63 projects wereon schedule (91 percent compared to the 85 percent target).
In 2018-19, for projects less than $500,000, Public Works' average deliverycost (the ratio of soft costs to hard costs) was 56 percent, which is less thanthe target of 65 percent. For larger projects, the average delivery cost was 43percent, which is also smaller than the target of 48 percent.
* Read more about the division in the July 2018 Audit of the Department of Public Works:Enhancing Management of Capital Projects.
0
10
20
30
40
50
60
70
Number of Completed Construction Projects
Note: On-budget and on-schedule only refer to whether a project was on budget or on-schedule for the construction phase of the project.
$87
$0
$100
$200
$300
$400
$500
$600
$700
Total Construction Costs for Completed Projects ($millions)
0%
20%
40%
60%
80%
100%
Percent of Construction Projects Completed On Budget and On Schedule
% On Budget % on Schedule
Fire Station 29 Generator Replacement
Del Monte Park Shade Improvement Project
123City of San José – Annual Report on City Services 2018-19

PUBLIC WORKS
FACILITIES MANAGEMENT
The Facilities Management division manages 2.8 million square feet in 224 Cityfacilities, including City Hall (over 500,000 square feet). Services includemaintenance, improvements, special event support, and property management.
The division completed 16,398 corrective and preventive work orders in 2018-19,nearly 10 percent less than a year ago and 33 percent less than three years ago.According to Public Works, this drop is a result of HVAC vacancies. Seventy-eightpercent of 10,461 preventive maintenance work orders were completed during theyear.
As of January 2019, Public Works estimated a facilities maintenance backlog forCity-owned and operated facilities of over $171 million in one-time costs, as well as$19 million in annual unfunded costs. The estimated one-time maintenance backlogfor City facilities operated by others is about $54 million, but this does not includethe SAP Center, Sharks Ice, or Municipal Stadium.
FLEET & EQUIPMENT SERVICES
Fleet and Equipment Services manages procurement and maintenance to provide asafe and reliable fleet of 2,819 City vehicles and pieces of equipment. Public Workscompleted 20,995 repairs and preventive work orders in 2018-19, slightly less thana year ago. Emergency vehicles were available for use when needed 100 percent ofthe time in 2018-19; the City’s general fleet was available when needed 97 percentof the time.
In 2007, the City committed to ensuring 100 percent of public vehicles run onalternative fuels. In 2018-19, 46 percent of City vehicles ran on alternative fuels,including compressed natural gas, propane, electricity, and biodiesel.
As of January 2019, Public Works estimated a vehicle and equipment deferredmaintenance and infrastructure backlog of $9.3 million in one-time costs, slightlymore than the previous year.
0
0.5
1
1.5
2
2.5
3
3.5
Facilities Managed, by Millions of Square Feet
Yard/Other
Community Center
Library
Police/Fire
City Hall
0
500
1,000
1,500
2,000
2,500
3,000
City Vehicles & Equipment
All Others General, Light Police
Fire General, Heavy
Note: "Other" includes PRNS reuse sites. See the PRNS chapter for more information about the reuse program.
$0.36
$2.22
General, Heavy
(tractors, loaders)$1.85
Equipment ClassCost/Mile Estimate
Police
Fire
General, Light
(sedans, vans)$0.39
KEY FACTS (2018-19)Total number of City facilities 224Square footage 2.8 millionCompleted corrective & preventitive work orders 16,398Total completed solar installations on City sites 25
KEY FACTS (2018-19)Total number of vehicles & equipment 2,819
Completed repairs & preventitive work orders 20,995
Percent of fleet running on alternative fuel 46%
124 City of San José – Annual Report on City Services 2018-19
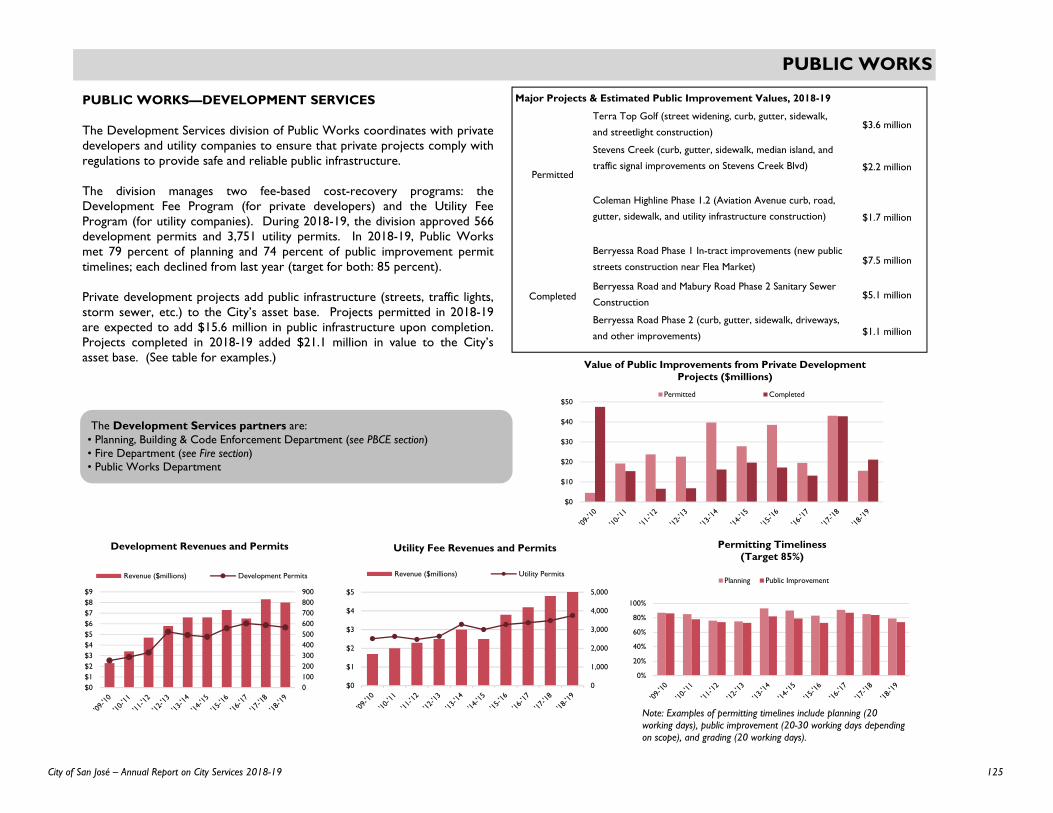
PUBLIC WORKS
0100200300400500600700800900
$0$1$2$3$4$5$6$7$8$9
Development Revenues and Permits
Revenue ($millions) Development Permits
0
1,000
2,000
3,000
4,000
5,000
$0
$1
$2
$3
$4
$5
Utility Fee Revenues and Permits
Revenue ($millions) Utility Permits
0%
20%
40%
60%
80%
100%
Permitting Timeliness (Target 85%)
Planning Public Improvement
PUBLIC WORKS—DEVELOPMENT SERVICES
The Development Services division of Public Works coordinates with privatedevelopers and utility companies to ensure that private projects comply withregulations to provide safe and reliable public infrastructure.
The division manages two fee-based cost-recovery programs: theDevelopment Fee Program (for private developers) and the Utility FeeProgram (for utility companies). During 2018-19, the division approved 566development permits and 3,751 utility permits. In 2018-19, Public Worksmet 79 percent of planning and 74 percent of public improvement permittimelines; each declined from last year (target for both: 85 percent).
Private development projects add public infrastructure (streets, traffic lights,storm sewer, etc.) to the City’s asset base. Projects permitted in 2018-19are expected to add $15.6 million in public infrastructure upon completion.Projects completed in 2018-19 added $21.1 million in value to the City’sasset base. (See table for examples.)
The Development Services partners are: • Planning, Building & Code Enforcement Department (see PBCE section)• Fire Department (see Fire section)• Public Works Department
$0
$10
$20
$30
$40
$50
Value of Public Improvements from Private Development Projects ($millions)
Permitted Completed
Note: Examples of permitting timelines include planning (20 working days), public improvement (20-30 working days depending on scope), and grading (20 working days).
Major Projects & Estimated Public Improvement Values, 2018-19
Terra Top Golf (street widening, curb, gutter, sidewalk,
and streetlight construction)$3.6 million
Stevens Creek (curb, gutter, sidewalk, median island, and
traffic signal improvements on Stevens Creek Blvd) $2.2 million
Coleman Highline Phase 1.2 (Aviation Avenue curb, road,
gutter, sidewalk, and utility infrastructure construction) $1.7 million
Berryessa Road Phase 1 In-tract improvements (new public
streets construction near Flea Market)$7.5 million
Berryessa Road and Mabury Road Phase 2 Sanitary Sewer
Construction$5.1 million
Berryessa Road Phase 2 (curb, gutter, sidewalk, driveways,
and other improvements) $1.1 million
Permitted
Completed
125City of San José – Annual Report on City Services 2018-19
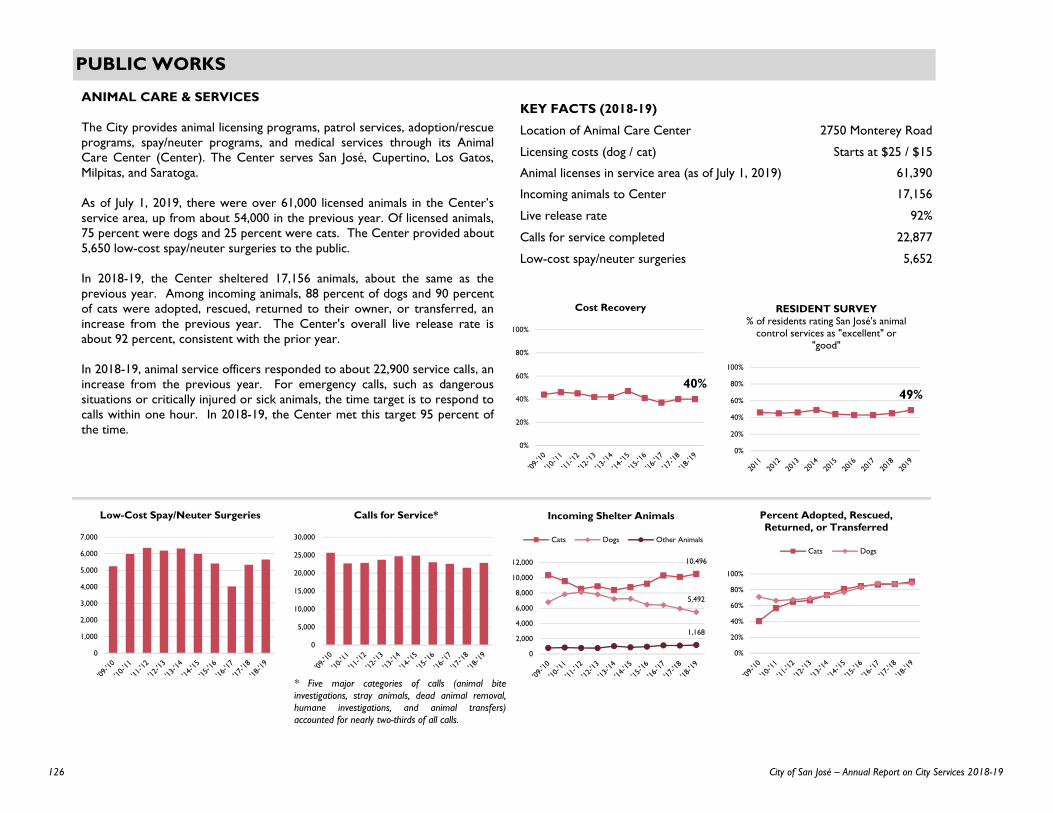
PUBLIC WORKS
0
1,000
2,000
3,000
4,000
5,000
6,000
7,000
Low-Cost Spay/Neuter Surgeries
0
5,000
10,000
15,000
20,000
25,000
30,000
Calls for Service*
10,496
5,492
1,168
0
2,000
4,000
6,000
8,000
10,000
12,000
Incoming Shelter Animals
Cats Dogs Other Animals
* Five major categories of calls (animal biteinvestigations, stray animals, dead animal removal,humane investigations, and animal transfers)accounted for nearly two-thirds of all calls.
0%
20%
40%
60%
80%
100%
Percent Adopted, Rescued, Returned, or Transferred
Cats Dogs
ANIMAL CARE & SERVICES
The City provides animal licensing programs, patrol services, adoption/rescueprograms, spay/neuter programs, and medical services through its AnimalCare Center (Center). The Center serves San José, Cupertino, Los Gatos,Milpitas, and Saratoga.
As of July 1, 2019, there were over 61,000 licensed animals in the Center’sservice area, up from about 54,000 in the previous year. Of licensed animals,75 percent were dogs and 25 percent were cats. The Center provided about5,650 low-cost spay/neuter surgeries to the public.
In 2018-19, the Center sheltered 17,156 animals, about the same as theprevious year. Among incoming animals, 88 percent of dogs and 90 percentof cats were adopted, rescued, returned to their owner, or transferred, anincrease from the previous year. The Center's overall live release rate isabout 92 percent, consistent with the prior year.
In 2018-19, animal service officers responded to about 22,900 service calls, anincrease from the previous year. For emergency calls, such as dangeroussituations or critically injured or sick animals, the time target is to respond tocalls within one hour. In 2018-19, the Center met this target 95 percent ofthe time.
49%
0%
20%
40%
60%
80%
100%
RESIDENT SURVEY% of residents rating San José's animal
control services as "excellent" or "good"
40%
0%
20%
40%
60%
80%
100%
Cost Recovery
KEY FACTS (2018-19)
Location of Animal Care Center 2750 Monterey Road
Licensing costs (dog / cat) Starts at $25 / $15
Animal licenses in service area (as of July 1, 2019) 61,390
Incoming animals to Center 17,156
Live release rate 92%
Calls for service completed 22,877
Low-cost spay/neuter surgeries 5,652
126 City of San José – Annual Report on City Services 2018-19
RETIREMENT SERVICES The
City
Department
Employment
The
providing
assets
In
40
in
retirement
fees
The
benefits
employees
contributions
grown
*Theemployeeschapter
Noteadministrative
and
The mission of the Office of Retirement Services is to provide quality
services in the delivery of pension and related benefits and maintain
financially sound pension plans.
127City of San José – Annual Report on City Services 2018-19
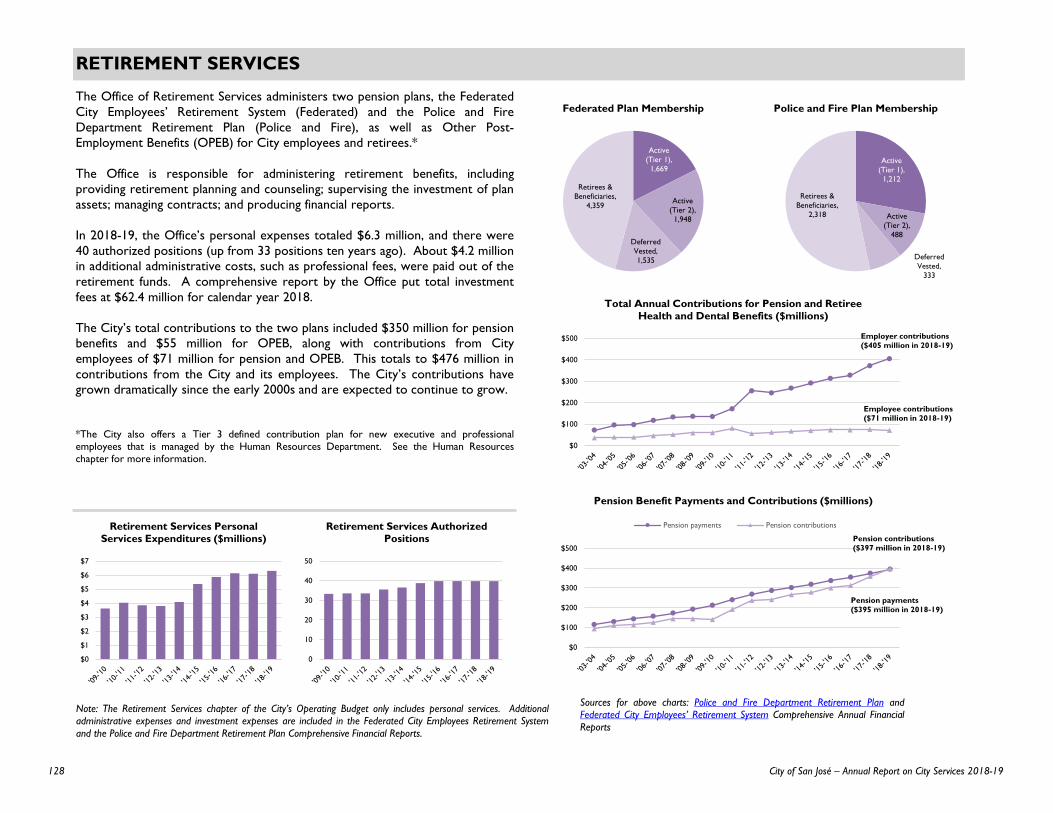
RETIREMENT SERVICES
The Office of Retirement Services administers two pension plans, the Federated
City Employees’ Retirement System (Federated) and the Police and Fire
Department Retirement Plan (Police and Fire), as well as Other Post-
Employment Benefits (OPEB) for City employees and retirees.*
The Office is responsible for administering retirement benefits, including
providing retirement planning and counseling; supervising the investment of plan
assets; managing contracts; and producing financial reports.
In 2018-19, the Office’s personal expenses totaled $6.3 million, and there were
40 authorized positions (up from 33 positions ten years ago). About $4.2 million
in additional administrative costs, such as professional fees, were paid out of the
retirement funds. A comprehensive report by the Office put total investment
fees at $62.4 million for calendar year 2018.
The City’s total contributions to the two plans included $350 million for pension
benefits and $55 million for OPEB, along with contributions from City
employees of $71 million for pension and OPEB. This totals to $476 million in
contributions from the City and its employees. The City’s contributions have
grown dramatically since the early 2000s and are expected to continue to grow.
*The City also offers a Tier 3 defined contribution plan for new executive and professionalemployees that is managed by the Human Resources Department. See the Human Resourceschapter for more information.
$0
$1
$2
$3
$4
$5
$6
$7
Retirement Services Personal Services Expenditures ($millions)
0
10
20
30
40
50
Retirement Services Authorized Positions
Note: The Retirement Services chapter of the City’s Operating Budget only includes personal services. Additionaladministrative expenses and investment expenses are included in the Federated City Employees Retirement System
and the Police and Fire Department Retirement Plan Comprehensive Financial Reports.
Active
(Tier 1),
1,669
Active
(Tier 2),
1,948
Deferred
Vested,
1,535
Retirees &
Beneficiaries,
4,359
Federated Plan Membership
Active
(Tier 1),
1,212
Active
(Tier 2),
488
Deferred
Vested,
333
Retirees &
Beneficiaries,
2,318
Police and Fire Plan MembershipAs
from
current
than
The
by
These
$
As
funded
and
In
City
passed
F
reduction
2
Additionally,
(VEBA),
into
time
$0
$100
$200
$300
$400
$500
Total Annual Contributions for Pension and Retiree Health and Dental Benefits ($millions)
$0
$100
$200
$300
$400
$500
Pension Benefit Payments and Contributions ($millions)
Pension payments Pension contributions
Sources for above charts: Police and Fire Department Retirement Plan andFederated City Employees’ Retirement System Comprehensive Annual Financial
Reports
Employer contributions
($405 million in 2018-19)
Employee contributions
($71 million in 2018-19)
Pension payments
($395 million in 2018-19)
Pension contributions
($397 million in 2018-19)
Source:Comprehensive Financial Reports and Actuarial Valuations
128 City of San José – Annual Report on City Services 2018-19

RETIREMENT SERVICES
Source: Police and Fire Department Retirement Plan and Federated City Employees’ Retirement System Comprehensive Financial Reports and Actuarial Valuations
$0
$2
$4
$6
$8
$10
$12
Retirement Plan Net Assets ($billions)
Federated Police and Fire
$0
$2
$4
$6
$8
$10
$12
Retirement Plan Total Liabilities ($billions)
Federated Police and Fire
As of June 30, 2019, there were 6,677 retirees or beneficiaries of the plans, up
from 4,891 ten years ago. Over that period, the ratio of active members (i.e.,
current employees contributing to the plans) to beneficiaries has declined to less
than 1:1. In 1980, the ratio was nearly 5:1.
The pension and OPEB plans’ total liabilities exceeded the values of their assets
by $2.5 billion for Federated and $1.9 billion for Police and Fire respectively.
These net liabilities totaled about $260,000 per Federated member and over
$430,000 per Police and Fire member.
As of the June 30, 2018 actuarial valuations, the Federated and Police and Fire
funded ratios (or percent of liabilities covered by plan assets) were 53 percent
and 77 percent for the respective pension plans.
In 2016, San José voters passed Measure F, as part of a settlement between the
City and its bargaining units, to supersede a previous retirement reform measure
passed in 2012 (Measure B), which had been subject to legal challenges. Measure
F was intended to preserve certain retirement benefits while maintaining some
reduction in the growth of plan liabilities. Among other things, it improved Tier
2 benefits and closed retiree healthcare to new members.
Additionally, the City established a Voluntary Employee Beneficiary Association
(VEBA), a defined contribution plan for retiree healthcare expenses, which went
into effect in 2018. The VEBA allowed employees, with some exceptions, a one-
time opt-in to the plan and was intended to help reduce OPEB liabilities.
0%
20%
40%
60%
80%
100%
Federated Funded Status
Pension OPEB
0%
20%
40%
60%
80%
100%
Police and Fire Funded Status
Pension OPEB
Sources: Federated City Employees’ Retirement System and Police and Fire Department Retirement Plan Actuarial Valuations
Note: Funded status calculated using the actuarial value of assets, which differs from the market value, as gains/losses are recognized over five years to minimize the effect of market volatility on contributions. As of '16-'17, OPEB funded status reflects changes to asset and liability calculations
based on newly implemented guidance from the Government Accounting Standards Board.
The
according
pension
generally
During
pension
Police
respectively
6
As
retirement
$
paidreturns
-
1.0
2.0
3.0
4.0
5.0
Ratio of Active Members to Retirees and Beneficiaries
11%
71%
87%
7%
77%
53%
43%22%
Source: Police and Fire Department Retirement Plan and Federated City Employees’ Retirement System Comprehensive Financial Reports and Actuarial Valuations
129City of San José – Annual Report on City Services 2018-19

RETIREMENT SERVICES
Public
Equity,
31%
Private
Equity,
22%
Short-term
Bonds,
19%
Market
Neutral
Strategies,
7%
Other,
21%
Police and Fire Pension Actual Asset Allocation
Public
Equity,
30%
Private
Equity,
25%
Short-term
Bonds,
19%
Market
Neutral
Strategies,
8%
Other,
18%
Federated Pension Actual Asset Allocation
Source: Federated City Employees’ Retirement System and Police and Fire Department Retirement Plan Comprehensive Annual Financial Reports. Note: Asset classes not in top four largest categories grouped in
"other", such as other bonds, real estate, commodities, and cash.
The retirement plans’ assets are distributed among various types of investments,
according to each board’s investment policies. As of June 30, 2019, both
pension plans held the largest portions of their assets in “alternatives,” which are
generally investments outside of traditional stocks, bonds, or cash.
During 2018-19, both Federated and Police and Fire had a net rates of return on
pension plan assets of 4.3 percent. Over the past five years, the Federated and
Police and Fire pensions’ annualized net returns have been 3.2 and 3.8 percent,
respectively. The assumed rate of return, or discount rate*, for both plans was
6.75 percent as of June 30, 2019.
As a result of the positive investment returns, as well as payments for
retirement benefits and health care premiums, total plan assets increased from
$6.01 billion last year to $6.20 billion on June 30, 2019.
*The assumed rate of return, or discount rate, is the annual rate used to discount pensions expected to be
paid in the future to current dollars. For pension plans, it is often based on average expected investmentreturns over a long time horizon.
-20%
-15%
-10%
-5%
0%
5%
10%
15%
20%
Federated Rate of Return, Net of Fees
-20%
-15%
-10%
-5%
0%
5%
10%
15%
20%
Police and Fire Rate of Return, Net of Fees
Discount rate
(6.75% in
2018-19)
Discount rate
(6.75% in
2018-19)
4.3%
4.3%
130 City of San José – Annual Report on City Services 2018-19
TRANSPORTATION
The mission of the Transportation Department is to plan, develop, operate, and maintain transportation facilities, services, and related systems which
contribute to the livability and economic health of the City.
131City of San José – Annual Report on City Services 2018-19

TRANSPORTATION
The Department of Transportation (DOT) has eight core service groups to: planand develop transportation projects; optimize traffic flow and safety; maintainstreet pavement; maintain traffic signals, signs, markings, and streetlights; maintainstreet landscapes and street trees; clean and repair sanitary sewers; maintainstorm sewers; and maintain public parking. Additional staff provide strategicsupport, such as budget and information technology services.
In 2018-19, DOT’s operating expenditures totaled $97.4 million, including personaland non-personal expenditures. In addition, the Department was responsible forother expenditures including $55 million in capital related expenditures and $19.9million in Citywide and other expenditures. DOT had 475 authorized positions;staffing was slightly up (5 percent) compared to levels 10 years ago.
2018 American Community Survey, 1-year estimates, table B08006
956Trafficsignalintersections
345On-street bikeway miles
561Acres of streetlandscape
14City parking lots andgarages
2,300Parkingmeters
2,434Miles of street
65,100Streetlights
269,000Street trees
Street lighting, 45%
Traffic signal timing, 35%
Street cleaning, 29%
Sidewalk maintenance, 30%
Public parking, 26%10%
20%
30%
40%
50%
60%
RESIDENT SURVEY% of San José residents rating transportation-related services as
"excellent" or "good"
Ease of walking, 41%
Overall ease of travel, 36%
Travel by bicycle, 33%
Travel by car, 30%
Traffic flow, 15%10%
20%
30%
40%
50%
60%
RESIDENT SURVEY% of San José residents rating travel modes as "excellent" or "good"
$0
$20
$40
$60
$80
$100
DOT Operating Expenditures (millions)
Personal Services Non-Personal/Equipment
0
100
200
300
400
500
DOT Authorized Positions
0% 10% 20% 30% 40% 50% 60% 70% 80% 90% 100%
Other
Bicycle
Walk
Work at Home
Transit
Carpool
Drive alone
San José Residents' Mode of Commuting to Work
Envision 2040 General Plan Target American Community Survey 2018
San José‘s goal is to substantially increase the proportion of commute travel using modes other than the single-occupant vehicle by 2040. For example, no more than 40 percent of commute trips should be driving alone, and transit should comprise at least 20 percent.
132 City of San José – Annual Report on City Services 2018-19

TRANSPORTATION
TRANSPORTATION SAFETY & OPERATIONS
Transportation Safety & Operations manages various traffic safety programs tofacilitate safe and efficient travel within San José. Nearly 48,000 school childrenreceived traffic safety education in 2018-19, and a new messaging campaign forsenior pedestrian safety awareness was developed. DOT also installs flashingbeacons, median islands, and curb ramps to enhance pedestrian crossings onmajor roads and near areas with high pedestrian traffic to improve safety.
In 2015, the City adopted Vision Zero, a policy that recognizes traffic deaths aspreventable and unacceptable, and prioritizes human life over mobility and highvehicle speeds. Under Vision Zero, the City’s goal is to reduce, and ultimatelyeliminate, traffic fatalities and severe injuries. In 2018, there were 52 trafficfatalities—46 percent were pedestrians, and their median age was 56. Therewere also 195 severe injuries from traffic collisions, the highest amount in thepast five years.
Despite these increases, San José’s rate of fatal and injury crashes has remainedwell below the national rate, with 2018 resulting in a rate of 2.2 per 1,000residents. In comparison, the national rate was 5.9 per 1,000 residents in 2017.
TRANSPORTATION PLANNING & PROJECT DELIVERY
Planning & Project Delivery supports the development of San José’stransportation infrastructure. This includes coordinating transportation and landuse planning studies, managing the Capital Improvement Program, and workingwith regional transportation agencies such as VTA, BART, and Caltrans.
In 2018-19, DOT budgeted $239 million towards its traffic capital improvementprogram. Regional projects include freeway and transit infrastructureimprovements; local projects include major street improvements, such as roadresurfacing and bike lane installation.
San José currently has 396 miles of bikeways, including 345 miles of on-streetbicycle lanes and routes (installed by DOT) and 51 miles of paved trails (installedby Parks, Recreation and Neighborhood Services). There are nine additionalmiles of gravel (interim) trails that may be subject to future paving. San José isfour-fifths of the way to its 2020 goal of 400 miles of on-street bikeways and 100miles of off-street bike trails.
0
100
200
300
400
500
600
700
Pedestrian and Bicycle Injury Crashes (calendar year)
San José
Nationwide
0
1
2
3
4
5
6
7
8
Fatal and Injury Crash Rate per 1,000 Residents
0
20
40
60
80
100
Transportation Projects in Progress
Local Projects Regional Projects
Example Local & Regional Transportation Projects(FY 2018-19)
• Autumn Parkway - Phase II • BART Phase II• Safe Pathways to Diridon Station • Caltrain Electrification• 680 Sound Wall • High Speed Rail
0
100
200
300
400
500
Miles of Bikeways
On-Street Miles Off-Street Miles (Paved)
2020 Target
Source: National fatal and injury crash rate data comes from the National Highway Traffic Safety Administration (NHTSA) Traffic Safety Facts Report, 2017. Data prior to 2016 is not comparable due to different sample designs used by NHTSA, so only 2016 and 2017 years are shown.
133City of San José – Annual Report on City Services 2018-19
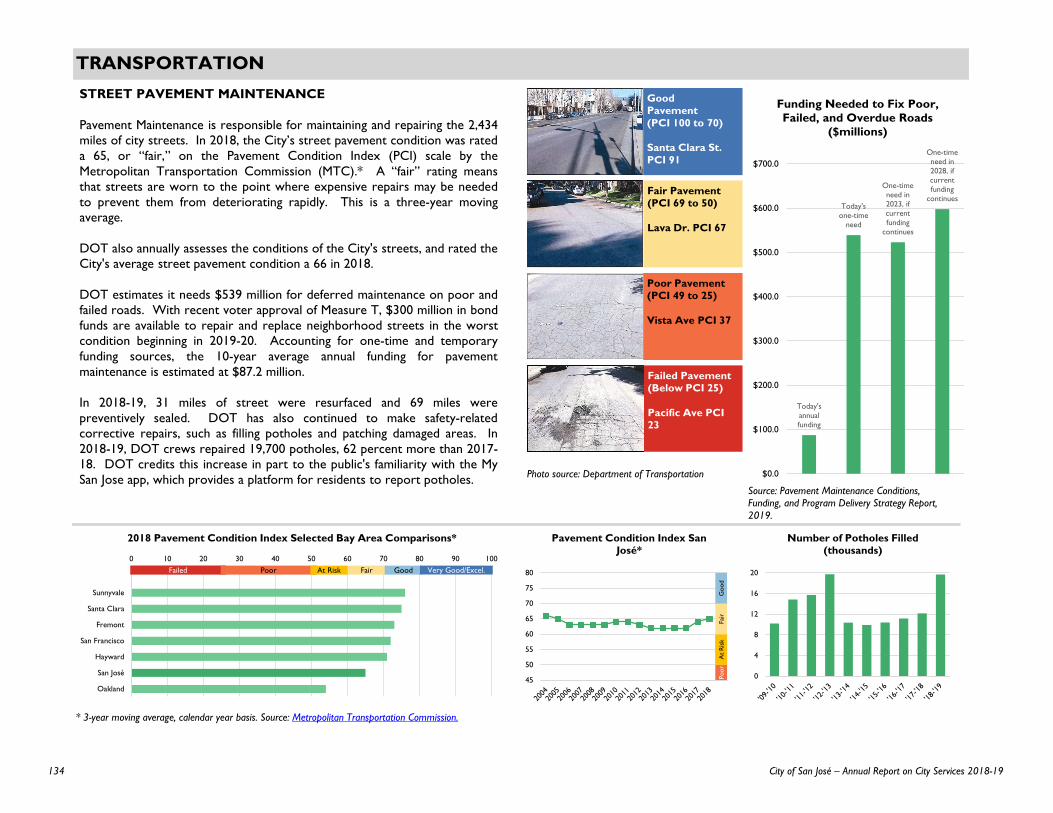
TRANSPORTATION
Today's annual funding
Today's one-time
need
One-time need in 2023, if current funding
continues
One-time need in 2028, if current funding
continues
$0.0
$100.0
$200.0
$300.0
$400.0
$500.0
$600.0
$700.0
Funding Needed to Fix Poor, Failed, and Overdue Roads
($millions)
0 10 20 30 40 50 60 70 80 90 100
Oakland
San José
Hayward
San Francisco
Fremont
Santa Clara
Sunnyvale
2018 Pavement Condition Index Selected Bay Area Comparisons*
0
4
8
12
16
20
Number of Potholes Filled (thousands)
* 3-year moving average, calendar year basis. Source: Metropolitan Transportation Commission.
STREET PAVEMENT MAINTENANCE
Pavement Maintenance is responsible for maintaining and repairing the 2,434miles of city streets. In 2018, the City’s street pavement condition was rateda 65, or “fair,” on the Pavement Condition Index (PCI) scale by theMetropolitan Transportation Commission (MTC).* A “fair” rating meansthat streets are worn to the point where expensive repairs may be neededto prevent them from deteriorating rapidly. This is a three-year movingaverage.
DOT also annually assesses the conditions of the City's streets, and rated theCity's average street pavement condition a 66 in 2018.
DOT estimates it needs $539 million for deferred maintenance on poor andfailed roads. With recent voter approval of Measure T, $300 million in bondfunds are available to repair and replace neighborhood streets in the worstcondition beginning in 2019-20. Accounting for one-time and temporaryfunding sources, the 10-year average annual funding for pavementmaintenance is estimated at $87.2 million.
In 2018-19, 31 miles of street were resurfaced and 69 miles werepreventively sealed. DOT has also continued to make safety-relatedcorrective repairs, such as filling potholes and patching damaged areas. In2018-19, DOT crews repaired 19,700 potholes, 62 percent more than 2017-18. DOT credits this increase in part to the public's familiarity with the MySan Jose app, which provides a platform for residents to report potholes.
Poor
At R
iskFa
irG
ood
45
50
55
60
65
70
75
80
Pavement Condition Index San José*
Failed Poor At Risk Fair Good Very Good/Excel.
Photo source: Department of Transportation
Failed Pavement (Below PCI 25)
Pacific Ave PCI 23
Good Pavement (PCI 100 to 70)
Santa Clara St. PCI 91
Fair Pavement (PCI 69 to 50)
Lava Dr. PCI 67
Poor Pavement (PCI 49 to 25)
Vista Ave PCI 37
Source: Pavement Maintenance Conditions, Funding, and Program Delivery Strategy Report, 2019.
134 City of San José – Annual Report on City Services 2018-19

TRANSPORTATION
21%
0%
20%
40%
60%
80%
100%
RESIDENT SURVEY% of San José residents rating street
repair as "excellent" or "good"
Source: Department of Transportation StreetSaver data as of November 2019.
Map of Pavement Condition
See the City's Pavement Condition Interactive Map online!
Newly constructed or resurfaced; few signs of
distress
Excellent
or very
good
Low levels of distress; needs preventive
maintenance
Good
Significant distress; requires rehabilitation or preventive maintenance
Fair
Deteriorated pavement; will quickly turn "poor" without
maintenance
At risk
Excessive distress; requires major, costly
rehabilitation
Poor
Extremely rough; needs expensive reconstruction
Failed
135City of San José – Annual Report on City Services 2018-19

TRANSPORTATION
DOT crews completed roadway marking services within established priorityguidelines2 100 percent of the time in 2018-19. Fifty-nine percent of roadwaymarkings met visibility and operational guidelines.
Ninety-eight percent of San José’s 65,100 streetlights3 were operational; 49percent of reported malfunctions were repaired within seven days. DOTrepaired 11,077 streetlights in 2018-19. As of 2018-19 the City has convertedor installed about 28,000 LED streetlights, up from about 3,000 LEDstreetlights in 2013.
Traffic Signals
956 traffic signal intersections in San José
1,884 repairs and 553 preventive maintenance activities completed
22% of malfunctions responded to within 30 minutes (Target: 40%)
Traffic and Street Name Signs
122,000 traffic control and street name signs in San José (estimate)
491 repairs and 5,519 preventive maintenance activities completed
100% of sign repair requests completed within established guidelines1 (Target: 98%)
81% of signs in good condition (Target: 83%)
1. 24 hours, 7 days, or 21 days—depending on the priority
Roadway Markings
5.7 million square feet of roadway markings
239 maintenance requests completed
100% of service requests completed within prioritized operational guidelines2 (Target: 99%)
59% of markings met visibility and operational guidelines (Target: 62%)
2. 24 hours, 7 days, or 21 days—depending on the priority
Streetlights
65,100 streetlights3 in San José, including 28,000 LED streetlights
11,100 repairs completed
98% of streetlights in operational condition (Target: 98%)
3. includes other types of street lighting, not just streetlights
0
1,000
2,000
3,000
4,000
Number of Traffic Signal Maintenance Activities
Repairs Preventive Maintenance
0%
20%
40%
60%
80%
100%
Percent of Roadway Markings Meeting Visibility and
Operational Guidelines
Photo source: AuditorPhoto source: Department of Transportation
TRAFFIC MAINTENANCE
The Traffic Maintenance Division is responsible for maintaining the City’straffic signals, traffic signs, roadway markings, and streetlights. In 2018-19,DOT made 1,884 repairs to traffic signals. DOT responded to signalmalfunctions within 30 minutes 22 percent of the time, down from the 38percent reported the year prior. DOT attributes this decrease to newvacancies in the electrician classification and recruiting challenges. DOT isevaluating contractual and recruiting strategies to meet its target of 40percent of traffic signal malfunctions responded to within 30 minutes.
DOT’s response to traffic and street name sign service requests fell withinestablished guidelines1 100 percent of the time in 2018-19, exceeding thetarget of 98 percent. Over 5,500 signs were preventively maintained.
136 City of San José – Annual Report on City Services 2018-19

TRANSPORTATION
SANITARY SEWERS
DOT maintains more than 2,000 miles of sanitary sewers and 20 sewer pumpstations. DOT is responsible for maintaining uninterrupted sewer flow to theSan José-Santa Clara Regional Wastewater Facility. (The Facility is operated bythe Environmental Services Department (ESD). For more information see theESD chapter.)
DOT conducts proactive cleaning to reduce sanitary sewer stoppages andoverflows. Over 900 miles were cleaned in 2018-19, and 585 sewer repairswere completed. DOT responded to 42 sewer overflows in 2018-19, 20 morethan last year. The number of main line stoppages that needed to be clearedwas 210 in 2018-19. DOT estimates 57 percent of sanitary sewer problemswere responded to within 30 minutes.*
0
200
400
600
800
1,000
1,200
Sewer Miles Cleaned
01020304050607080
02468
10121416
Street Sweeping
Debris Collected (Thousand Tons)
Curb Sweeping (Thousand Miles) [Right Axis]
0
200
400
600
800
1,000
Sewer Stoppages and Overflows Cleared
Sewer Main Line Stoppages Sanitary Sewer Overflows
0
500
1,000
1,500
2,000
2,500
Storm Calls
Note: 2009-10 was an above-normal storm year. Prior to 2014-15, storm calls counted only storm drain inlet stoppages.
STORM DRAINAGE
DOT and ESD ensure that all of the City’s streets are swept of roadwayparticulate and debris that may collect in gutters. DOT’s street sweepers cleanthe downtown area, major streets, and bike routes; the City contractsresidential street sweeping.
DOT annually cleans over 30,000 storm drain inlets so that rain and stormwater runoff flow unimpeded through storm drains into the San Francisco Bay.Proactive cleaning of storm drain inlets prevents harmful pollutants, trash, anddebris from entering the Bay and reduces the potential for blockages andflooding during heavy rains.
In 2018-19, DOT reports that there were 23 declared storm days and 1,296storm call responses. The number of stoppages and calls varies depending onthe severity of rainfall. DOT also maintains 30 storm water pump stations andcleans wet-wells during summer months.
Note: DOT changed its methodology in 2018-19 to include both the preventive and reactive stoppages cleared. Before, DOT was only capturing reactive stoppages cleared in this measure.
0%
20%
40%
60%
80%
100%
Percentage of Sanitary Sewer Problems Responded to within 30
Minutes*
Note: Previously, debris numbers were reported with the assumption that sweepers were 100 percent full. Starting in 2018-19, DOT based reporting on the approximate percent sweepers were full.
* DOT changed itsmethodology in 2018-19 to excludework assignmentswithout a start time.Due to incompletedata, 2017-18 data is an estimate based on a subset of workassignments.
137City of San José – Annual Report on City Services 2018-19
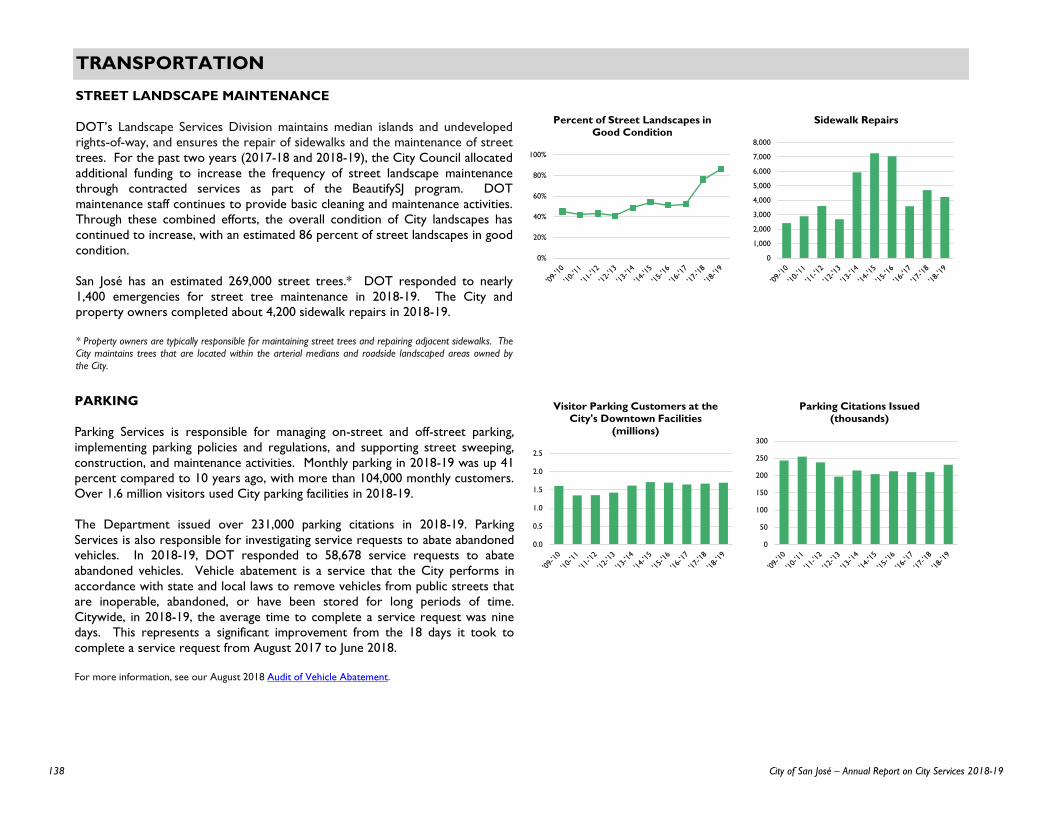
TRANSPORTATION
STREET LANDSCAPE MAINTENANCE
DOT’s Landscape Services Division maintains median islands and undevelopedrights-of-way, and ensures the repair of sidewalks and the maintenance of streettrees. For the past two years (2017-18 and 2018-19), the City Council allocatedadditional funding to increase the frequency of street landscape maintenancethrough contracted services as part of the BeautifySJ program. DOTmaintenance staff continues to provide basic cleaning and maintenance activities.Through these combined efforts, the overall condition of City landscapes hascontinued to increase, with an estimated 86 percent of street landscapes in goodcondition.
San José has an estimated 269,000 street trees.* DOT responded to nearly1,400 emergencies for street tree maintenance in 2018-19. The City andproperty owners completed about 4,200 sidewalk repairs in 2018-19.
* Property owners are typically responsible for maintaining street trees and repairing adjacent sidewalks. TheCity maintains trees that are located within the arterial medians and roadside landscaped areas owned bythe City.
0.0
0.5
1.0
1.5
2.0
2.5
Visitor Parking Customers at the City's Downtown Facilities
(millions)
0
50
100
150
200
250
300
Parking Citations Issued (thousands)
0%
20%
40%
60%
80%
100%
Percent of Street Landscapes in Good Condition
0
1,000
2,000
3,000
4,000
5,000
6,000
7,000
8,000
Sidewalk Repairs
PARKING
Parking Services is responsible for managing on-street and off-street parking,implementing parking policies and regulations, and supporting street sweeping,construction, and maintenance activities. Monthly parking in 2018-19 was up 41percent compared to 10 years ago, with more than 104,000 monthly customers.Over 1.6 million visitors used City parking facilities in 2018-19.
The Department issued over 231,000 parking citations in 2018-19. ParkingServices is also responsible for investigating service requests to abate abandonedvehicles. In 2018-19, DOT responded to 58,678 service requests to abateabandoned vehicles. Vehicle abatement is a service that the City performs inaccordance with state and local laws to remove vehicles from public streets thatare inoperable, abandoned, or have been stored for long periods of time.Citywide, in 2018-19, the average time to complete a service request was ninedays. This represents a significant improvement from the 18 days it took tocomplete a service request from August 2017 to June 2018.
For more information, see our August 2018 Audit of Vehicle Abatement.
138 City of San José – Annual Report on City Services 2018-19

NOTES
139City of San José – Annual Report on City Services 2018-19
NOTES
140 City of San José – Annual Report on City Services 2018-19

NOTES
141City of San José – Annual Report on City Services 2018-19

NOTES
142 City of San José – Annual Report on City Services 2018-19


