20
City of Springfield, Massachusetts 1 FY13 Budget Recommendations Overview June 12, 2012
| Date post: | 24-Dec-2015 |
| Category: |
Documents |
| Upload: | susan-corey-morris |
| View: | 221 times |
| Download: | 4 times |

City of Springfield, Massachusetts
1
FY13 Budget Recommendations
Overview
June 12, 2012
City of Springfield, Massachusetts
2
Agenda• FY13 Budget Overview• FY13 Budget Challenge• FY13 Budget Solutions• Overview of Spending & Revenue• Next Steps• Estimated Tax Rate Impacts• Four Year Forecast

City of Springfield, Massachusetts
3
FY13 Budget Overview• Overall Budget:
• Discretionary vs. Non-Discretionary:
• City / Schools Breakdown:
FY11 Actual
FY12Adopted
FY12Projected (Q3)
FY13Recommended
% Change from FY12 Adopted
% Change from FY12 Projected
(Q3)545,187,696 542,203,022 561,074,383 551,776,343 1.8% -1.8%
FY12 Adopted
FY12 Projected
FY13 Recommended
% Change from FY12 Adopted
% Change from FY12 Projected
City 211,368,692 212,403,852 207,490,077 -1.8% -2.3%Schools 330,834,330 348,670,531 344,286,266 4.1% -1.3%TOTAL 542,203,022 561,074,383 551,776,343 1.8% -1.8%
FY11 ACTUAL FY12 ADOPTED
FY12 PROJECTED
FY13 RECOMMENDED
Subtotal (Non-Discretionary) 419,049,602 430,414,970 447,129,324 443,370,552 % of Total 77% 79% 80% 80%
City Discretionary Subtotal (Discretionary) 126,138,094 111,788,052 113,945,059 108,405,790 % of Total 23% 21% 20% 20%
City of Springfield, Massachusetts
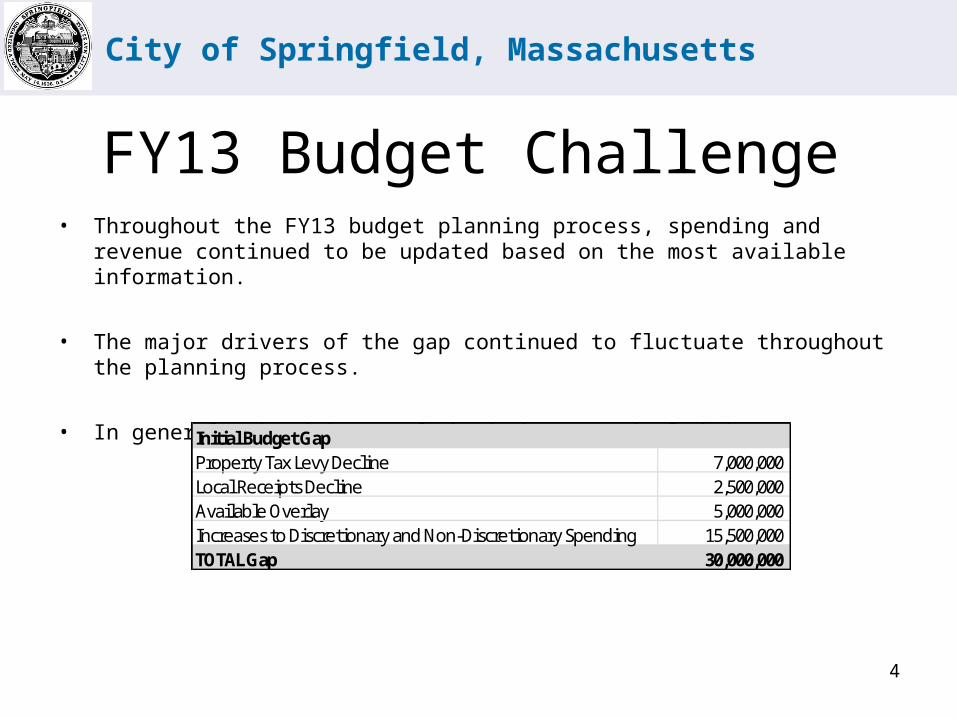
FY13 Budget Challenge• Throughout the FY13 budget planning process, spending and revenue continued to
be updated based on the most available information.
• The major drivers of the gap continued to fluctuate throughout the planning process.
• In general, the drivers of the budget gap included:
4
Initial Budget GapProperty Tax Levy Decline 7,000,000 Local Receipts Decline 2,500,000 Available Overlay 5,000,000 Increases to Discretionary and Non-Discretionary Spending 15,500,000 TOTAL Gap 30,000,000

City of Springfield, Massachusetts
5
FY13 Budget Solutions• To solve for the projected budget gap, many solutions were used to balance budget
reductions, revenues and use of reserves:
FY13 Budget BalancingFY13 Initial Gap (based on Departmental Budget requests submitted 1/23/12) (30,121,049) Spending Reductions - All Departments 15,042,414 Spending Reductions - School Transportation 1,685,378 Spending Reductions - Debt Service 1,000,000 Revenue Increases (no Council Action Required) - TJO, HHS, Assessors, Medicaid, Meals) 963,000 Revenue Increases - Schools Administrative Rate 2,121,457 Revenue Increases - (pending Council Action) 1,334,800 Revenue Increases - Additional Levy 289,000 DPW - EF Retained Earnings 300,000 Account Surplus Sweeps (Grants, Retirement Incentive) 385,000 Fire Training Center 1,000,000 Overlay Surplus 5,000,000 Additional Stabilization (7M intitially built in) 1,000,000 FY13 Gap as of 5/31/12 (0)

City of Springfield, Massachusetts
FY13 Budget Solutions
• Every department was impacted by budget reductions.– $10.2 million in reductions from personal services (salaries, benefits, elimination
of vacant positions, layoffs); – $4.6 million in reductions from other than personal services (OTPS);– $269,000 in reductions in capital expenditures.
• Overall, the budget reductions across departments impacted 108.0 requested FTEs which is divided into:
– Elimination of 96.0 FTE vacancies and the layoff of 12.0 FTEs.
– 12.0 FTE Layoffs Include 2.0 HHS,1.0 HR, 4.0 Parks, 2.0 Facilities, 1.0 IT, 2.0 Libraries
– Negotiations with all the city unions which may impact some of the proposed layoffs
– The General Fund FTE complement is at its lowest to date at 1,207.3 FTEs. That is a reduction of 374 FTEs or 24% since Fiscal Year 2008
6
DEPARTMENT FY08 FY09 FY10 FY11 FY12 FY13 Change
FY08 - FY13% Change
FY08 - FY13City GRAND TOTAL 1,581.5 1,557.9 1,433.2 1,410.3 1,302.8 1,207.3 -374.2 -24%

City of Springfield, Massachusetts
Position Reduction Impacts– Public Safety Division: Police- 22 vacant sworn officer positions and 9 vacant civilian
positions including detention attendants and cadets; Fire – 12 vacancies (11 firefighters; 1 clerical in Prevention Bureau) Brown out ladder 9 full time and potentially another company depending how much overtime is needed.; Dispatch – two new positions necessary for combining dispatch to one central location
– PBRM Division – 6 layoffs and 2 vacancies effecting the After School Program and Facilities internal operations – Less programs available for children
– HHS Division – 3.5 vacancies and 4.0 layoffs including outreach workers and senior clerks. As a result, 3 branches are closing.
– DPW Division – 7 vacancies including street sweeping and motor equipment operators. Reducing the number of street sweepings
– Planning and Economic Development Division – 4 vacancies including building and code inspectors. Less inspections done in the community
– A&F Division - 5.5 vacancies and 2 layoffs including 3-1-1,Treasurer and Collector Customer Service Reps and Computer, Telephone and HR Coordinators – Wait times increase for both tax payers and employees
7

City of Springfield, Massachusetts
FY13 Budget Solutions
• The City is responsible for funding 100% of School Transportation costs, which totals $21.7 million in Fiscal Year 2013.
• This is a reduction from the original request by $1.7 million from– Current year operating efficiencies; – Utilizing the PVTA for some services; and – Assuming State funding for homelessness transportation as approved by the
State House of Representatives.
8
Spending Reductions - School Transportation 1,685,378

City of Springfield, Massachusetts
FY13 Budget Solutions
• The City is responsible for 100% of all City and School department debt service for large scale capital projects.
• The City has a Capital Improvement Plan (CIP) worth $413 million. It was hoped that an investment in the issuance of new debt to help meet some of these critical capital needs could be afforded in Fiscal Year 2013.
• No new long-term debt issuances can be contemplated for next year – that means– No new road projects
– No demolitions for blight
– No new upgrades or major maintenance projects to facilities
• Note – The City will need to consider short term debt issuance for storm related costs and will consider short term debt services for the most critical projects.
9
Spending Reductions - Debt Service 1,000,000
City of Springfield, Massachusetts
FY13 Budget Solutions
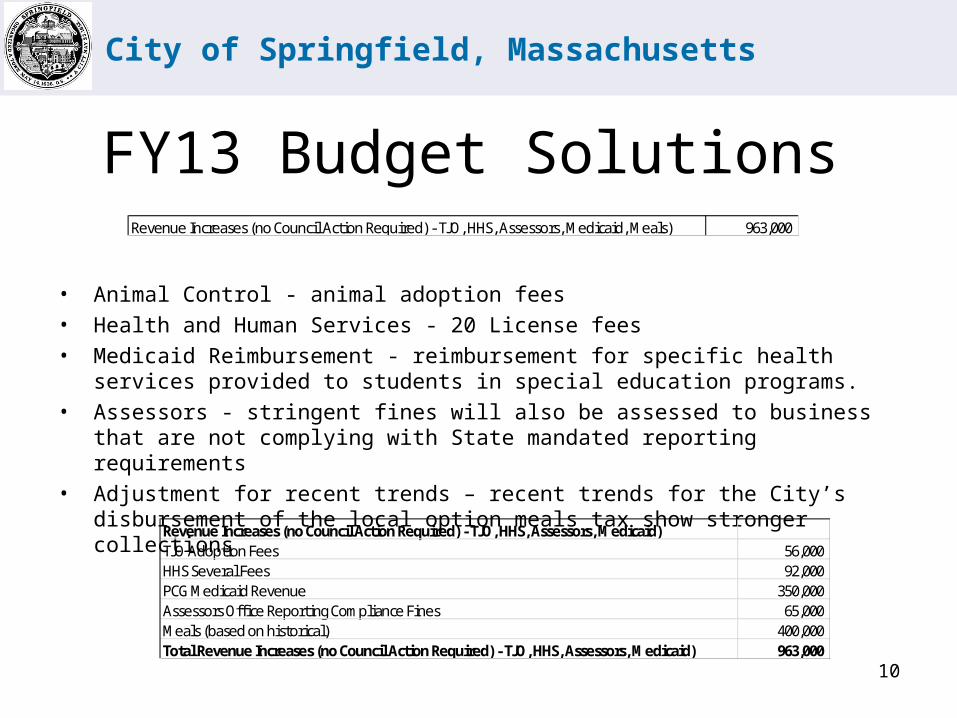
• Animal Control - animal adoption fees • Health and Human Services - 20 License fees • Medicaid Reimbursement - reimbursement for specific health services provided to
students in special education programs. • Assessors - stringent fines will also be assessed to business that are not complying
with State mandated reporting requirements • Adjustment for recent trends – recent trends for the City’s disbursement of the local
option meals tax show stronger collections
10
Revenue Increases (no Council Action Required) - TJO, HHS, Assessors, Medicaid, Meals) 963,000
Revenue Increases (no Council Action Required) - TJO, HHS, Assessors, Medicaid)TJO Adoption Fees 56,000 HHS Several Fees 92,000 PCG Medicaid Revenue 350,000 Assessors Offi ce Reporting Compliance Fines 65,000 Meals (based on historical) 400,000 Total Revenue Increases (no Council Action Required) - TJO, HHS, Assessors, Medicaid) 963,000
City of Springfield, Massachusetts
FY13 Budget Solutions
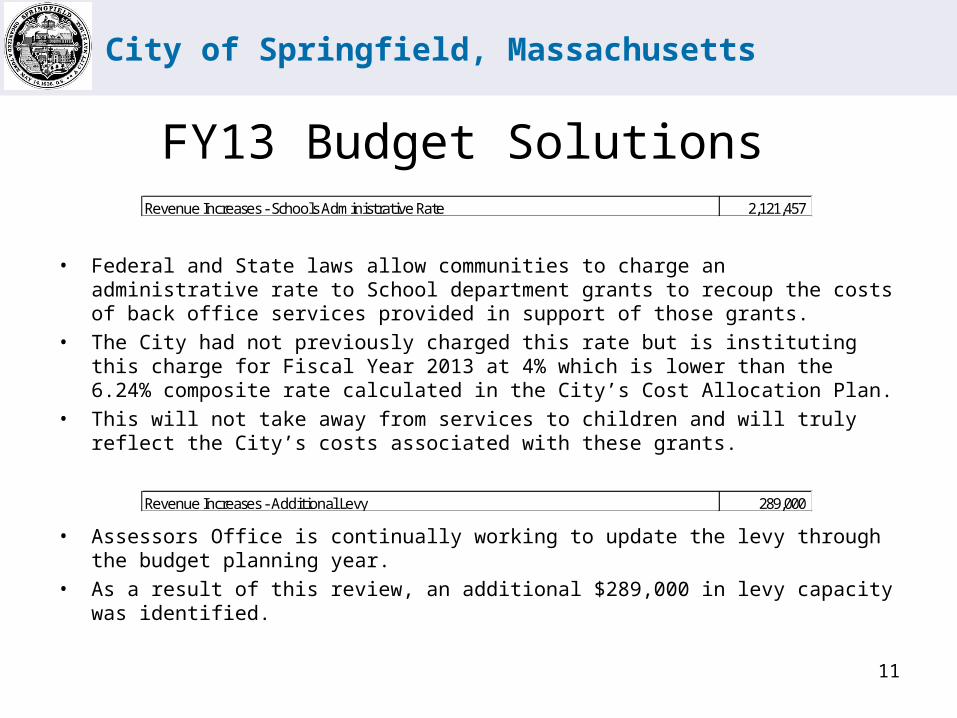
• Federal and State laws allow communities to charge an administrative rate to School department grants to recoup the costs of back office services provided in support of those grants.
• The City had not previously charged this rate but is instituting this charge for Fiscal Year 2013 at 4% which is lower than the 6.24% composite rate calculated in the City’s Cost Allocation Plan.
• This will not take away from services to children and will truly reflect the City’s costs associated with these grants.
• Assessors Office is continually working to update the levy through the budget planning year.
• As a result of this review, an additional $289,000 in levy capacity was identified.
11
Revenue Increases - Schools Administrative Rate 2,121,457
Revenue Increases - Additional Levy 289,000

City of Springfield, Massachusetts
FY13 Budget Solutions
• City departments submitted revenue increases totaling $1.3 million that are pending City Council review and action.
– Trash Fee - $10 increase to the trash fee– Trash Demand Fee – increase to be consistent with the demand fee for taxes – Hotel / Motel Tax - enacting the final municipal partnership act local option – City Clerk Fees - increases to physicians fees, tag sales, charitable solicitations,
raffle permits and dog licenses (note: General Gov’t Committee recommends $187K)
– Building Code Fees - updating the entire fee schedule for building permits based upon comparisons made to surrounding communities.
– Animal Control Fees - increases for boarding and impounding
12
Revenue Increases - (pending Council Action) 1,334,800
Revenue Increases - (pending Council Action)Trash Fee $10 Increase 400,000 Trash Demand Fee Increase to $15 20,000 Hotel Tax 400,000 Clerk Fees 135,000 Building Code Fees 367,000 TJO Boarding and Impound Fees 12,800 Total Revenue Increases - (pending Council Action) 1,334,800
City of Springfield, Massachusetts
FY13 Budget Solutions
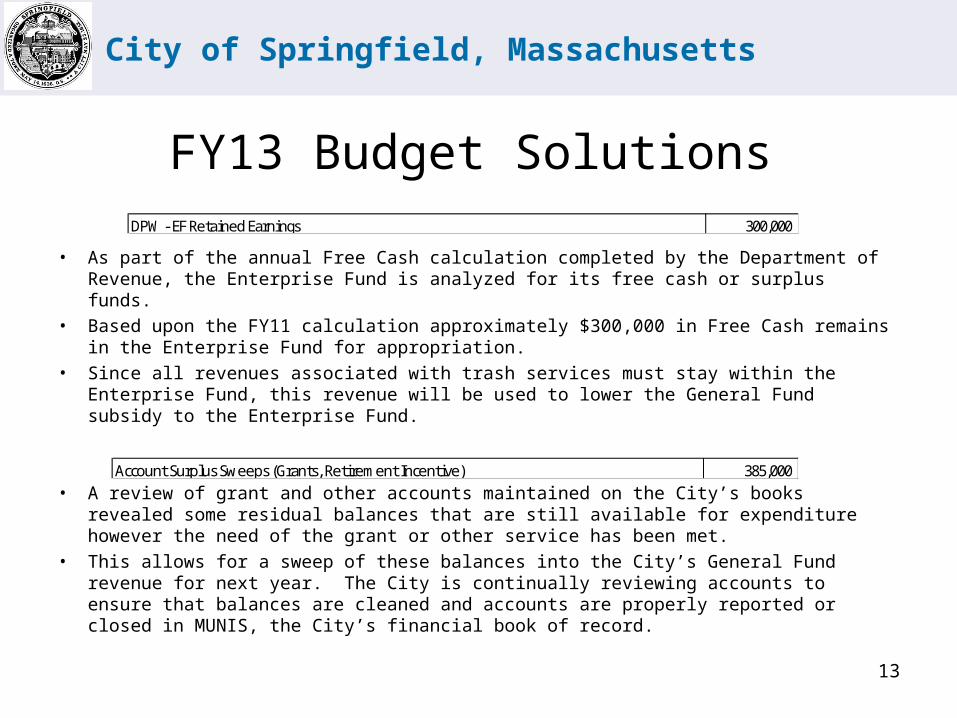
• As part of the annual Free Cash calculation completed by the Department of Revenue, the Enterprise Fund is analyzed for its free cash or surplus funds.
• Based upon the FY11 calculation approximately $300,000 in Free Cash remains in the Enterprise Fund for appropriation.
• Since all revenues associated with trash services must stay within the Enterprise Fund, this revenue will be used to lower the General Fund subsidy to the Enterprise Fund.
• A review of grant and other accounts maintained on the City’s books revealed some residual balances that are still available for expenditure however the need of the grant or other service has been met.
• This allows for a sweep of these balances into the City’s General Fund revenue for next year. The City is continually reviewing accounts to ensure that balances are cleaned and accounts are properly reported or closed in MUNIS, the City’s financial book of record.
13
DPW - EF Retained Earnings 300,000
Account Surplus Sweeps (Grants, Retirement Incentive) 385,000

City of Springfield, Massachusetts
FY13 Budget Solutions
•In Fiscal Year 2012, the City finalized the sale of its Fire Training Center to the State in order for the State to operate a western MA facility for training. •The City will receive $2 million from this sale and proposes using $1 million toward City operating costs. •The remaining $1 million may be used to address some capital needs of the Fire department for apparatus and support vehicles replacement. •As part of the sale, the City has free access to the training center.
•Annually, the City’s Board of Assessors reviews the overlay account to determine if obligations have been met and balances can be declared as surplus. •Each year, the City reserves a new amount for that fiscal years potential obligations.•The Assessors have declared surpluses in the overlay accounts for FY07, FY08, FY09 and FY10 totaling $5 million.
14
Fire Training Center 1,000,000
Overlay Surplus 5,000,000

City of Springfield, Massachusetts
FY13 Budget Solutions
• The City is proposing to use a total of $9.8 million in reserves in FY13– $8.0 million will support General Fund Revenues for operating costs– $1.8 million will be set aside in a separate reserve account for the State’s share
of the Quinn bill to be used, if necessary, pending the outcome of current contract negotiations.
• The amount recommended would leave the fund balance at 5.48% of the overall budget which complies with the City’s financial ordinances.
• Utilizing reserves is necessary to fund programs and services that would otherwise be decimated by that level of reductions.
15
Additional Stabilization (7M intitially built in) 1,000,000
Balance As of 5/31/12 40,054,054 FY13 Use of Reserves (8,000,000) Quinn Reserve (1,800,000) Projected Year End Stabilization Balance30,254,054
Stabilization Reserve Fund

City of Springfield, Massachusetts
16

City of Springfield, Massachusetts
17
Next Steps
• Budget Document – What’s Included– Overview Information– Divisional Details– Appendices (including the MYFP)– MUNIS Reports– Orders
• City Council Hearings
• Budget Adoption
• Setting Tax Rate
• Planning for next four years
City of Springfield, Massachusetts
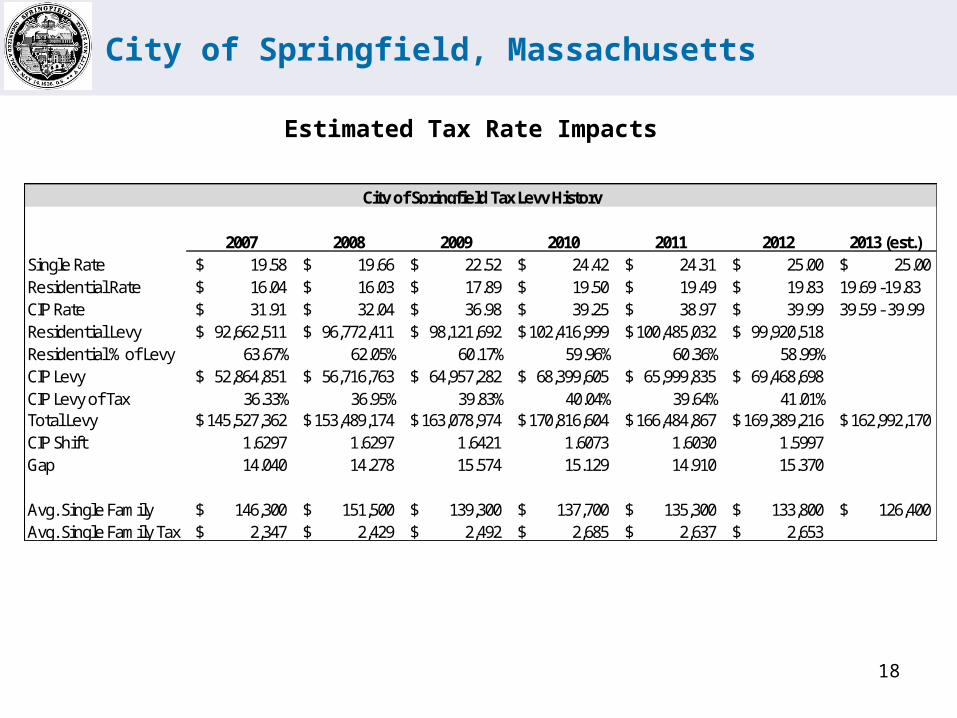
Estimated Tax Rate Impacts
18
2007 2008 2009 2010 2011 2012 2013 (est.)Single Rate 19.58$ 19.66$ 22.52$ 24.42$ 24.31$ 25.00$ 25.00$ Residential Rate 16.04$ 16.03$ 17.89$ 19.50$ 19.49$ 19.83$ 19.69 -19.83CIP Rate 31.91$ 32.04$ 36.98$ 39.25$ 38.97$ 39.99$ 39.59 - 39.99Residential Levy 92,662,511$ 96,772,411$ 98,121,692$ 102,416,999$ 100,485,032$ 99,920,518$ Residential % of Levy 63.67% 62.05% 60.17% 59.96% 60.36% 58.99%CIP Levy 52,864,851$ 56,716,763$ 64,957,282$ 68,399,605$ 65,999,835$ 69,468,698$ CIP Levy of Tax 36.33% 36.95% 39.83% 40.04% 39.64% 41.01%Total Levy 145,527,362$ 153,489,174$ 163,078,974$ 170,816,604$ 166,484,867$ 169,389,216$ 162,992,170$ CIP Shift 1.6297 1.6297 1.6421 1.6073 1.6030 1.5997 Gap 14.040 14.278 15.574 15.129 14.910 15.370
Avg. Single Family 146,300$ 151,500$ 139,300$ 137,700$ 135,300$ 133,800$ 126,400$ Avg. Single Family Tax 2,347$ 2,429$ 2,492$ 2,685$ 2,637$ 2,653$
City of Springfield Tax Levy History

City of Springfield, Massachusetts
Estimated Tax Rate Impacts
19
VALUATION TAX BILLFY Avg Value Inc/Dec % Chg Rate Tax Bill Inc/Dec % Chg1996 76,100$ 20.33$ 1,547$ 1997 75,500$ (600)$ -0.79% 20.38$ 1,539$ (8) -0.52%1998 75,600$ 100$ 0.13% 20.60$ 1,557$ 18 1.17%1999 77,600$ 2,000$ 2.65% 20.65$ 1,602$ 45 2.89%2000 81,900$ 4,300$ 5.54% 20.80$ 1,704$ 102 6.37%2001 86,600$ 4,700$ 5.74% 20.35$ 1,762$ 58 3.40%2002 91,300$ 4,700$ 5.43% 19.88$ 1,815$ 53 3.01%2003 100,400$ 9,100$ 9.97% 19.41$ 1,949$ 134 7.38%2004 108,300$ 7,900$ 7.87% 18.99$ 2,057$ 108 5.54%2005 120,900$ 12,600$ 11.63% 17.51$ 2,117$ 60 2.92%2006 131,200$ 10,300$ 8.52% 17.00$ 2,230$ 113 5.34%2007 146,300$ 15,100$ 11.51% 16.04$ 2,347$ 117 5.25%2008 151,500$ 5,200$ 3.55% 16.03$ 2,429$ 82 3.49%2009 139,300$ (12,200)$ -8.05% 17.89$ 2,492$ 63 2.59%2010 137,700$ (1,600)$ -1.15% 19.50$ 2,685$ 193 7.74%2011 135,300$ (2,400)$ -1.74% 19.49$ 2,637$ (48) -1.79%2012 133,800$ (1,500)$ -1.11% 19.83$ 2,653$ 16 0.61%2013 126,400$ (7,400)$ -5.53% $19.69 - $19.83 TBD 0.00%
Average Springfield Single Family Tax Bill
City of Springfield, Massachusetts
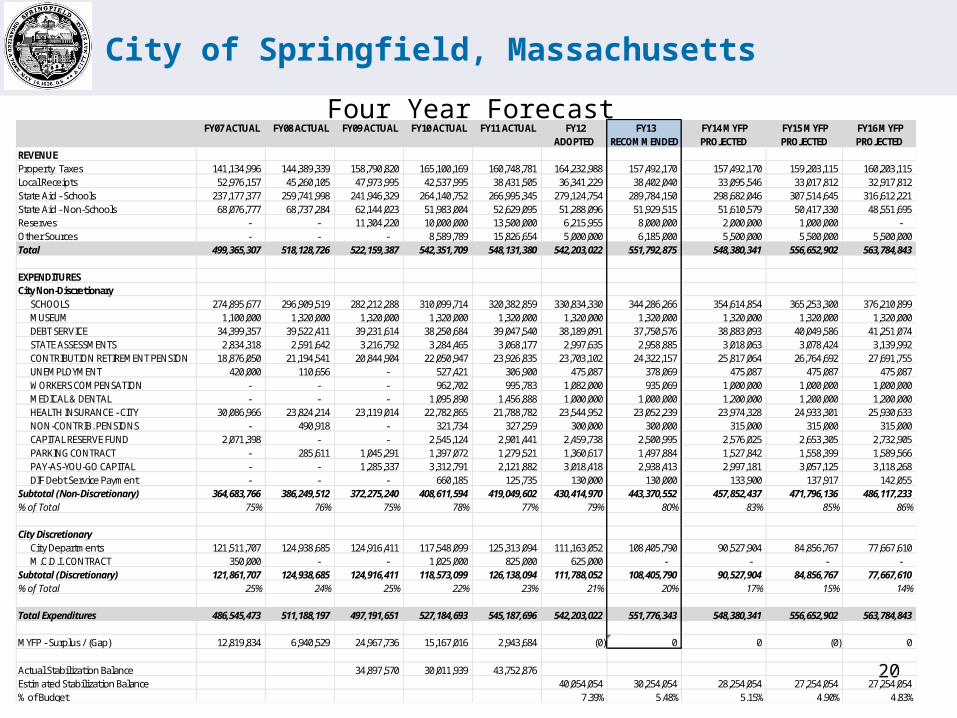
Four Year Forecast
20
FY07 ACTUAL FY08 ACTUAL FY09 ACTUAL FY10 ACTUAL FY11 ACTUAL FY12 ADOPTED
FY13 RECOMMENDED
FY14 MYFP PROJECTED
FY15 MYFP PROJECTED
FY16 MYFP PROJECTED
REVENUEProperty Taxes 141,134,996 144,389,339 158,790,820 165,100,169 160,748,781 164,232,988 157,492,170 157,492,170 159,203,115 160,203,115 Local Receipts 52,976,157 45,260,105 47,973,995 42,537,995 38,431,505 36,341,229 38,402,040 33,095,546 33,017,812 32,917,812 State Aid - Schools 237,177,377 259,741,998 241,946,329 264,140,752 266,995,345 279,124,754 289,784,150 298,682,046 307,514,645 316,612,221 State Aid - Non-Schools 68,076,777 68,737,284 62,144,023 51,983,004 52,629,095 51,288,096 51,929,515 51,610,579 50,417,330 48,551,695 Reserves - - 11,304,220 10,000,000 13,500,000 6,215,955 8,000,000 2,000,000 1,000,000 - Other Sources - - - 8,589,789 15,826,654 5,000,000 6,185,000 5,500,000 5,500,000 5,500,000 Total 499,365,307 518,128,726 522,159,387 542,351,709 548,131,380 542,203,022 551,792,875 548,380,341 556,652,902 563,784,843
EXPENDITURESCity Non-Discretionary
SCHOOLS 274,895,677 296,909,519 282,212,288 310,099,714 320,382,859 330,834,330 344,286,266 354,614,854 365,253,300 376,210,899 MUSEUM 1,100,000 1,320,000 1,320,000 1,320,000 1,320,000 1,320,000 1,320,000 1,320,000 1,320,000 1,320,000 DEBT SERVICE 34,399,357 39,522,411 39,231,614 38,250,684 39,047,540 38,189,091 37,750,576 38,883,093 40,049,586 41,251,074 STATE ASSESSMENTS 2,834,318 2,591,642 3,216,792 3,284,465 3,068,177 2,997,635 2,958,885 3,018,063 3,078,424 3,139,992 CONTRIBUTION RETIREMENT PENSION 18,876,050 21,194,541 20,844,904 22,050,947 23,926,835 23,703,102 24,322,157 25,817,064 26,764,692 27,691,755 UNEMPLOYMENT 420,000 110,656 - 527,421 306,900 475,087 378,069 475,087 475,087 475,087 WORKERS COMPENSATION - - - 962,702 995,783 1,082,000 935,069 1,000,000 1,000,000 1,000,000 MEDICAL & DENTAL - - - 1,095,890 1,456,888 1,000,000 1,000,000 1,200,000 1,200,000 1,200,000 HEALTH INSURANCE - CITY 30,086,966 23,824,214 23,119,014 22,782,865 21,788,782 23,544,952 23,052,239 23,974,328 24,933,301 25,930,633 NON-CONTRIB. PENSIONS - 490,918 - 321,734 327,259 300,000 300,000 315,000 315,000 315,000 CAPITAL RESERVE FUND 2,071,398 - - 2,545,124 2,901,441 2,459,738 2,500,995 2,576,025 2,653,305 2,732,905 PARKING CONTRACT - 285,611 1,045,291 1,397,072 1,279,521 1,360,617 1,497,884 1,527,842 1,558,399 1,589,566 PAY-AS-YOU-GO CAPITAL - - 1,285,337 3,312,791 2,121,882 3,018,418 2,938,413 2,997,181 3,057,125 3,118,268 DIF Debt Service Payment - - - 660,185 125,735 130,000 130,000 133,900 137,917 142,055
Subtotal (Non-Discretionary) 364,683,766 386,249,512 372,275,240 408,611,594 419,049,602 430,414,970 443,370,552 457,852,437 471,796,136 486,117,233 % of Total 75% 76% 75% 78% 77% 79% 80% 83% 85% 86%
City Discretionary City Departments 121,511,707 124,938,685 124,916,411 117,548,099 125,313,094 111,163,052 108,405,790 90,527,904 84,856,767 77,667,610
M.C.D.I. CONTRACT 350,000 - - 1,025,000 825,000 625,000 - - - - Subtotal (Discretionary) 121,861,707 124,938,685 124,916,411 118,573,099 126,138,094 111,788,052 108,405,790 90,527,904 84,856,767 77,667,610 % of Total 25% 24% 25% 22% 23% 21% 20% 17% 15% 14%
Total Expenditures 486,545,473 511,188,197 497,191,651 527,184,693 545,187,696 542,203,022 551,776,343 548,380,341 556,652,902 563,784,843
MYFP - Surplus / (Gap) 12,819,834 6,940,529 24,967,736 15,167,016 2,943,684 (0) 0 0 (0) 0
Actual Stabilization Balance 34,897,570 30,011,939 43,752,876 Estimated Stabilization Balance 40,054,054 30,254,054 28,254,054 27,254,054 27,254,054 % of Budget 7.39% 5.48% 5.15% 4.90% 4.83%


