City of Sydney Green Environmental sustainability progress report Quarter 4, 2012/13 A detailed quarterly overview of the City of Sydney’s progress against our environmental sustainability targets for both the local government area (LGA) and the City’s own operations. Sydney2030/Green/Global/Connected
Transcript
City of Sydney Green Environmental sustainability progress report Quarter 4, 2012/13 A detailed quarterly overview of the City of Sydney’s progress against our environmental sustainability targets for both the local government area (LGA) and the City’s own operations. Sydney2030/Green/Global/Connected
Sydney2030/Green/Global/Connected
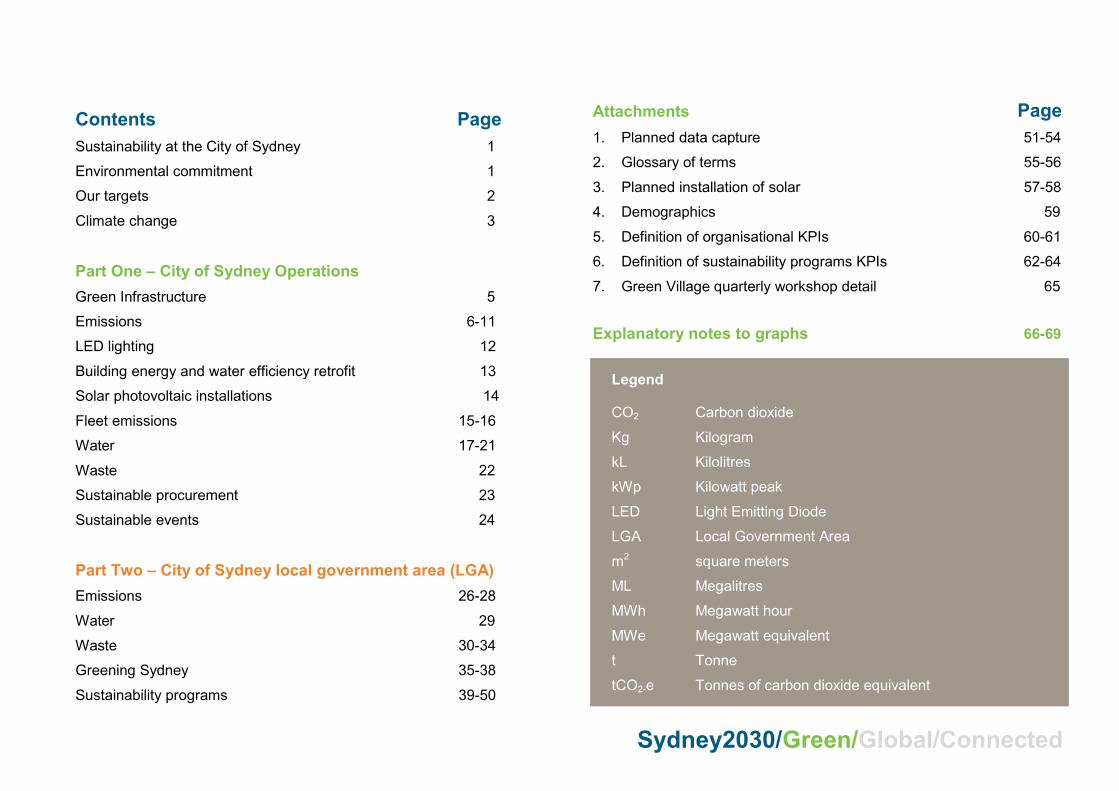
Contents Page Sustainability at the City of Sydney 1
Environmental commitment 1
Our targets 2
Climate change 3
Part One – City of Sydney Operations Green Infrastructure 5
Emissions 6-11
LED lighting 12
Building energy and water efficiency retrofit 13
Solar photovoltaic installations 14
Fleet emissions 15-16
Water 17-21
Waste 22
Sustainable procurement 23
Sustainable events 24
Part Two – City of Sydney local government area (LGA) Emissions 26-28
Water 29
Waste 30-34
Greening Sydney 35-38
Sustainability programs 39-50
Attachments Page
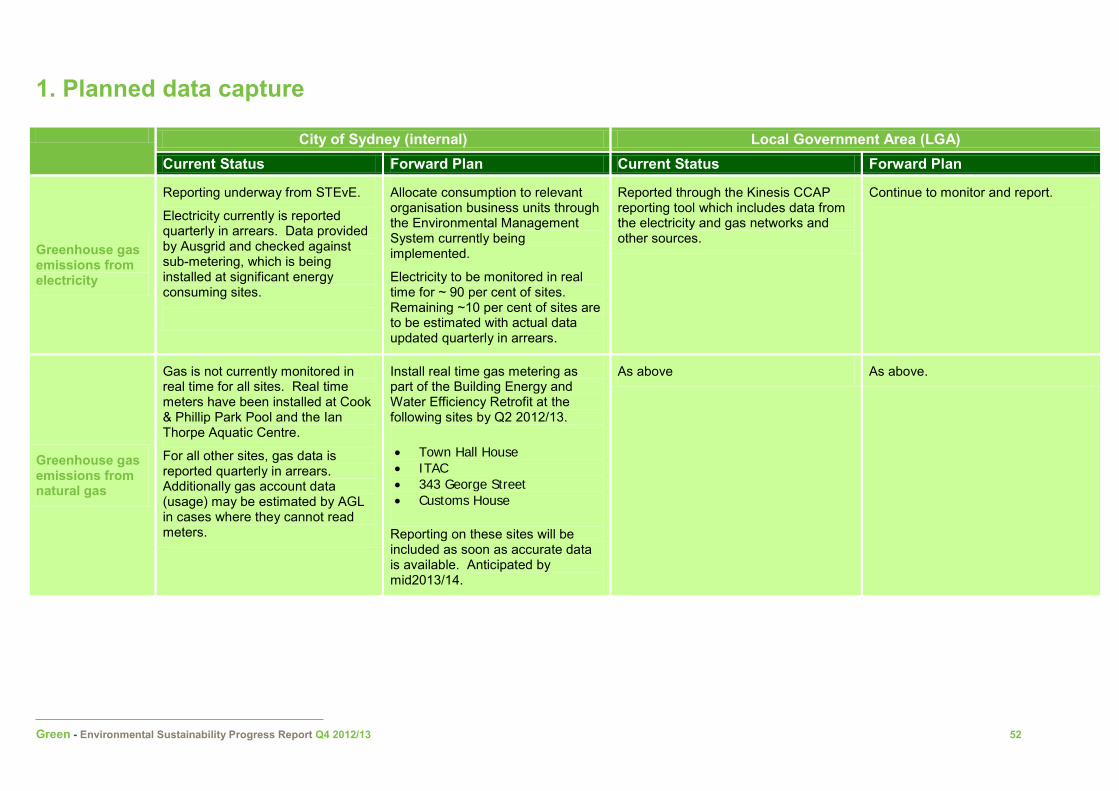
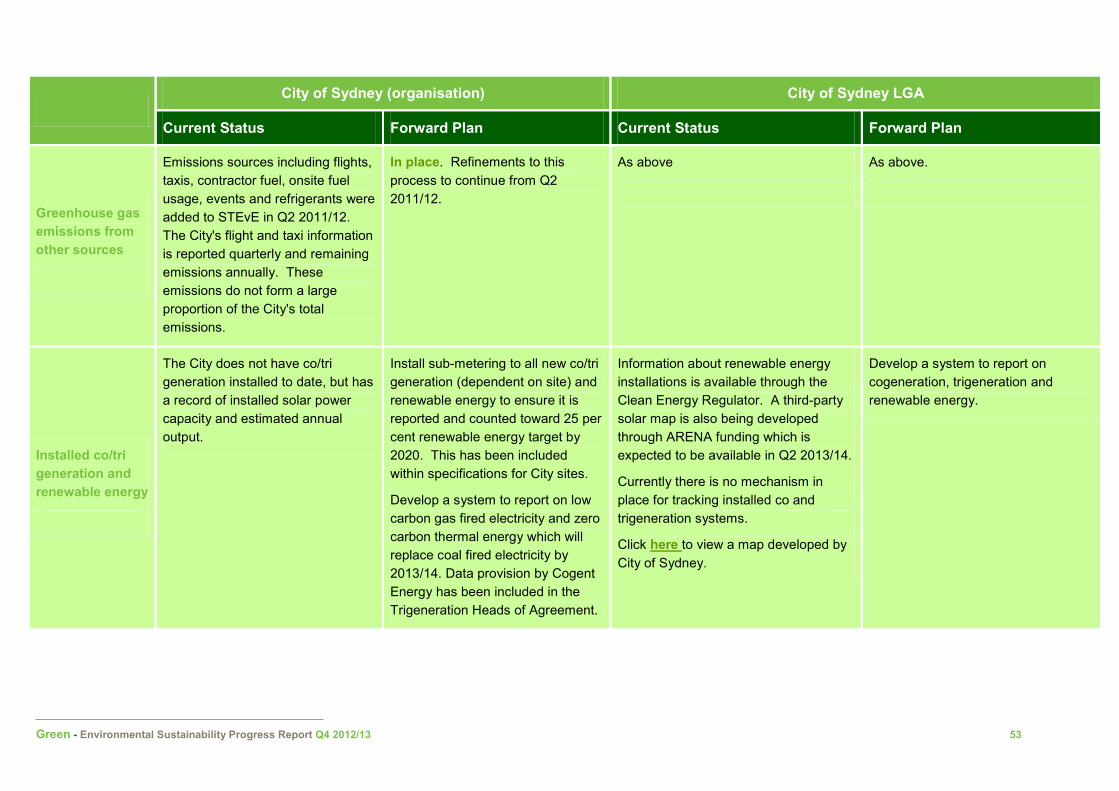
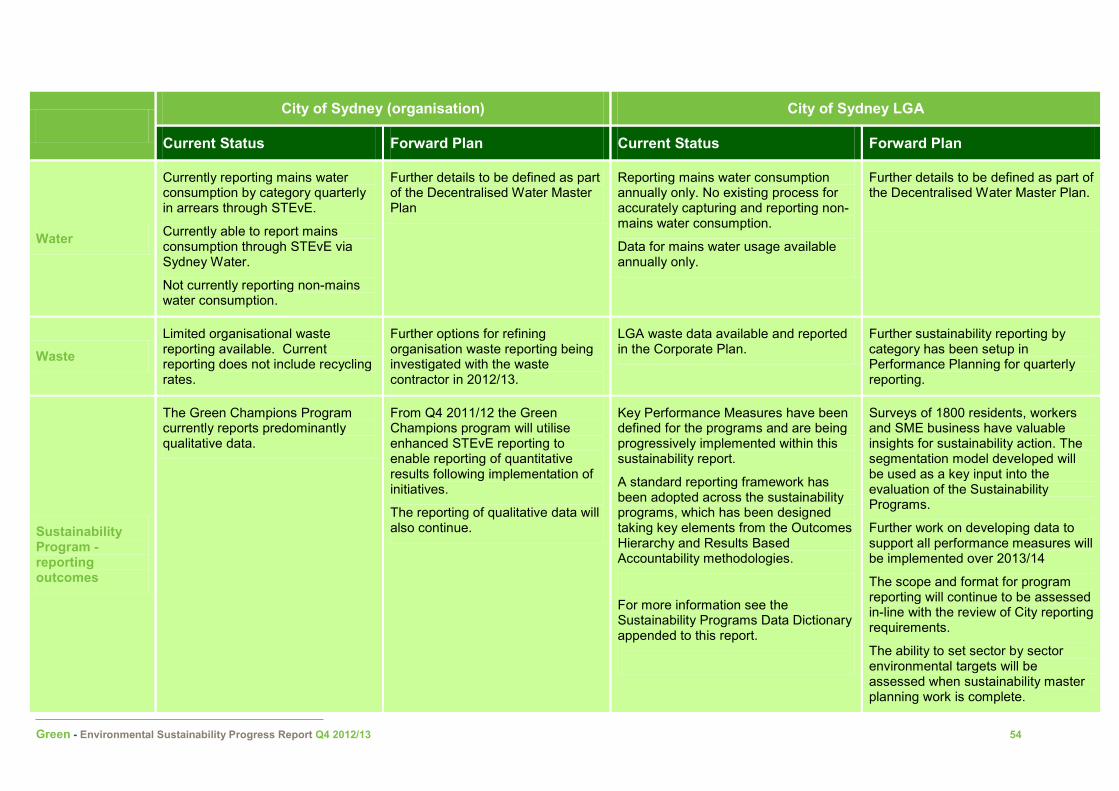
1. Planned data capture 51-54
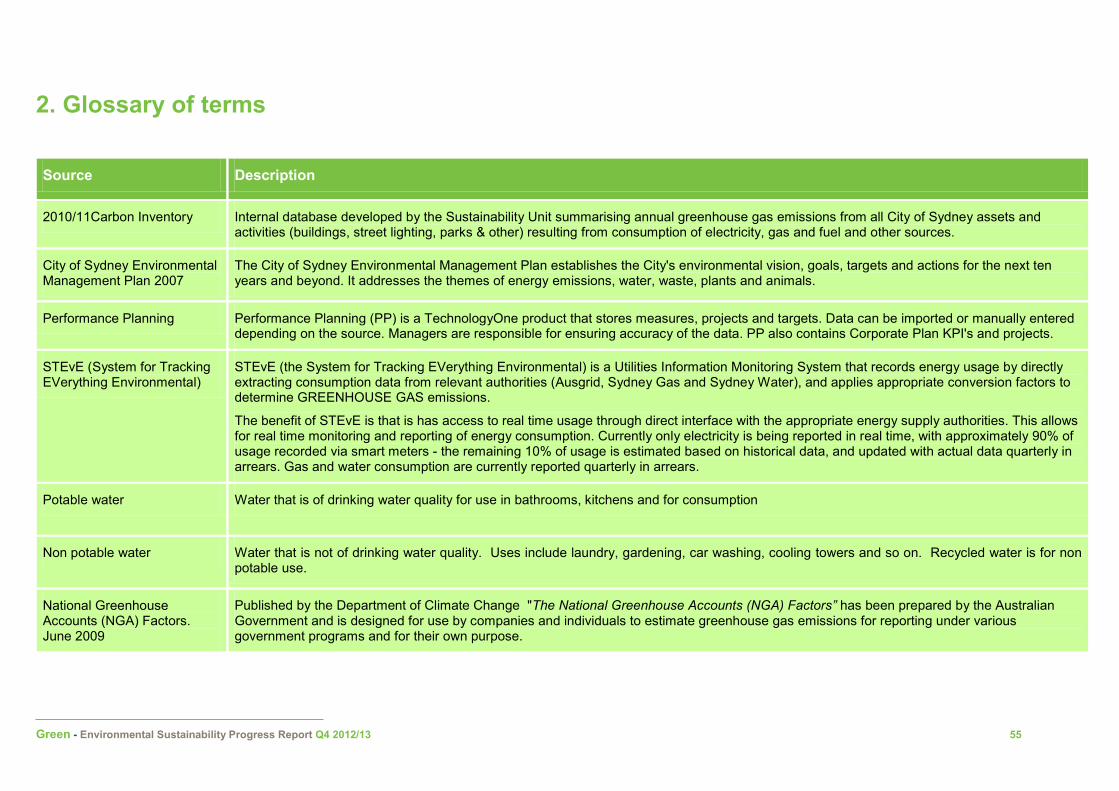
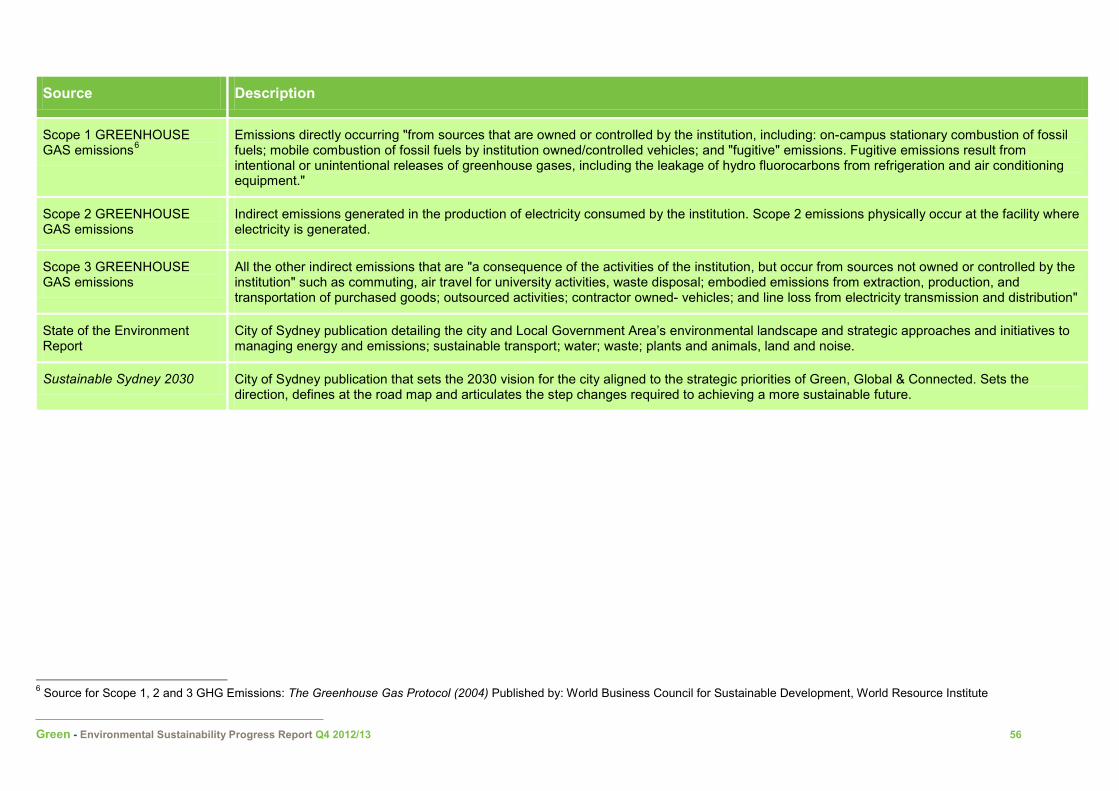
2. Glossary of terms 55-56
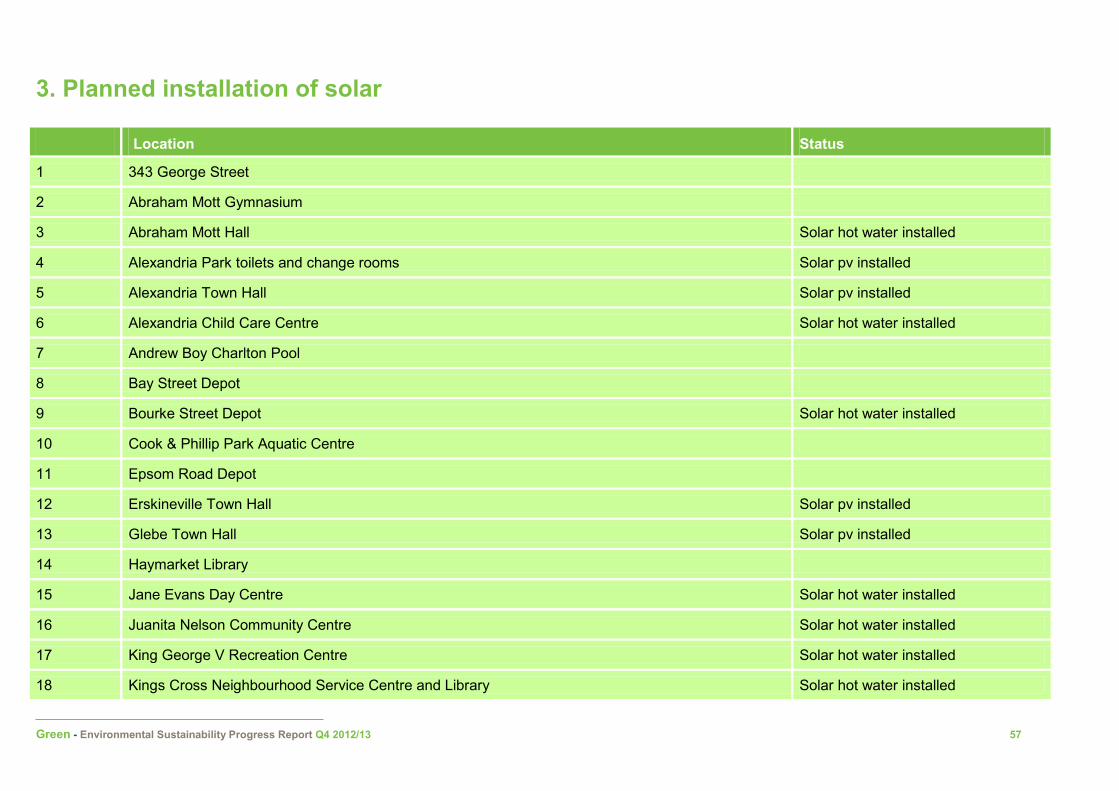
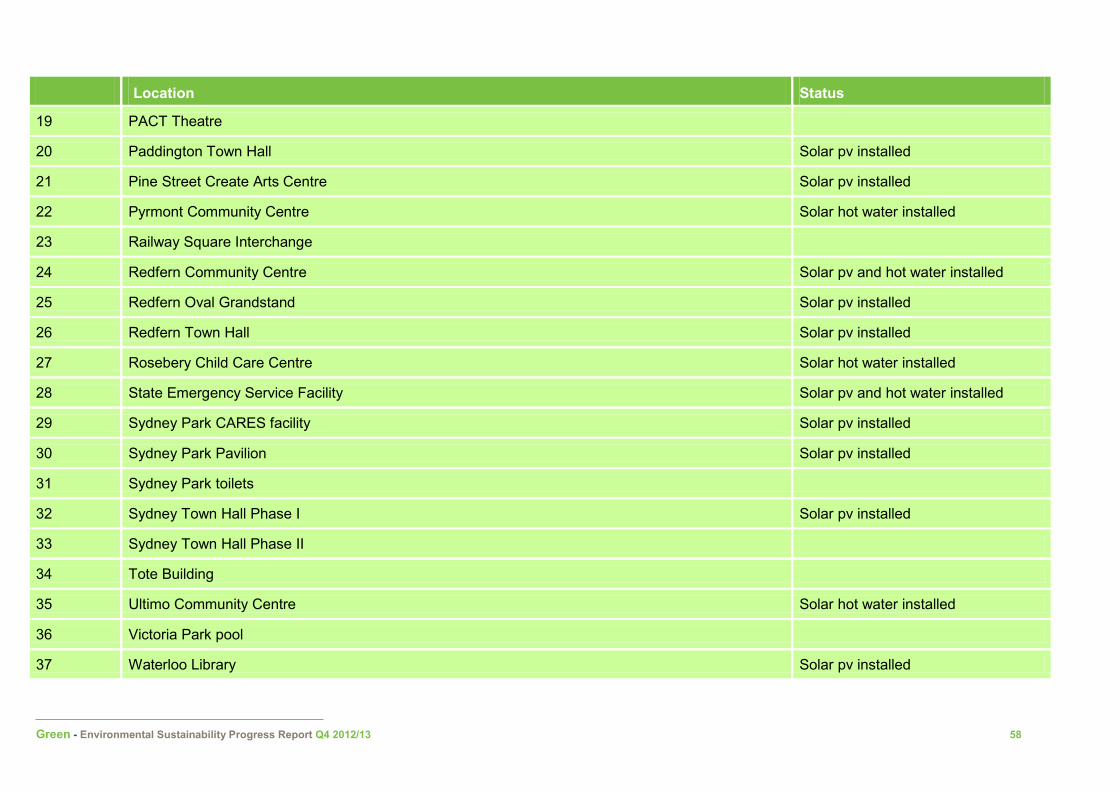
3. Planned installation of solar 57-58
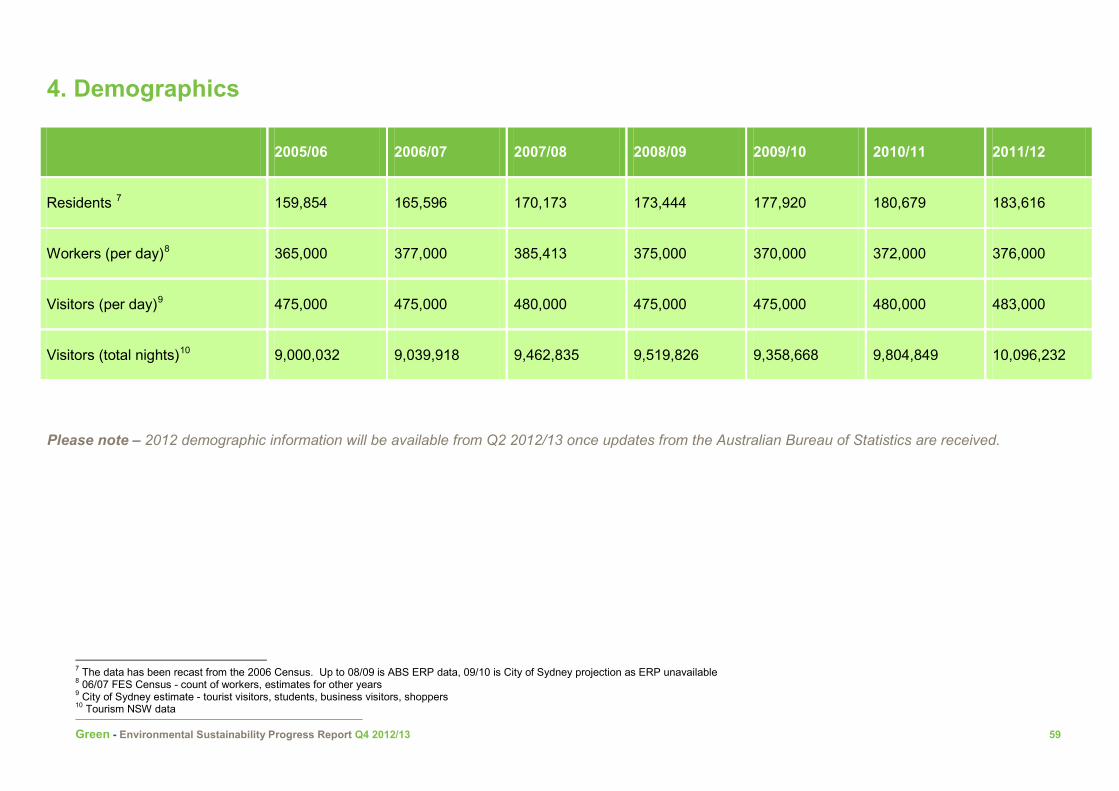
4. Demographics 59
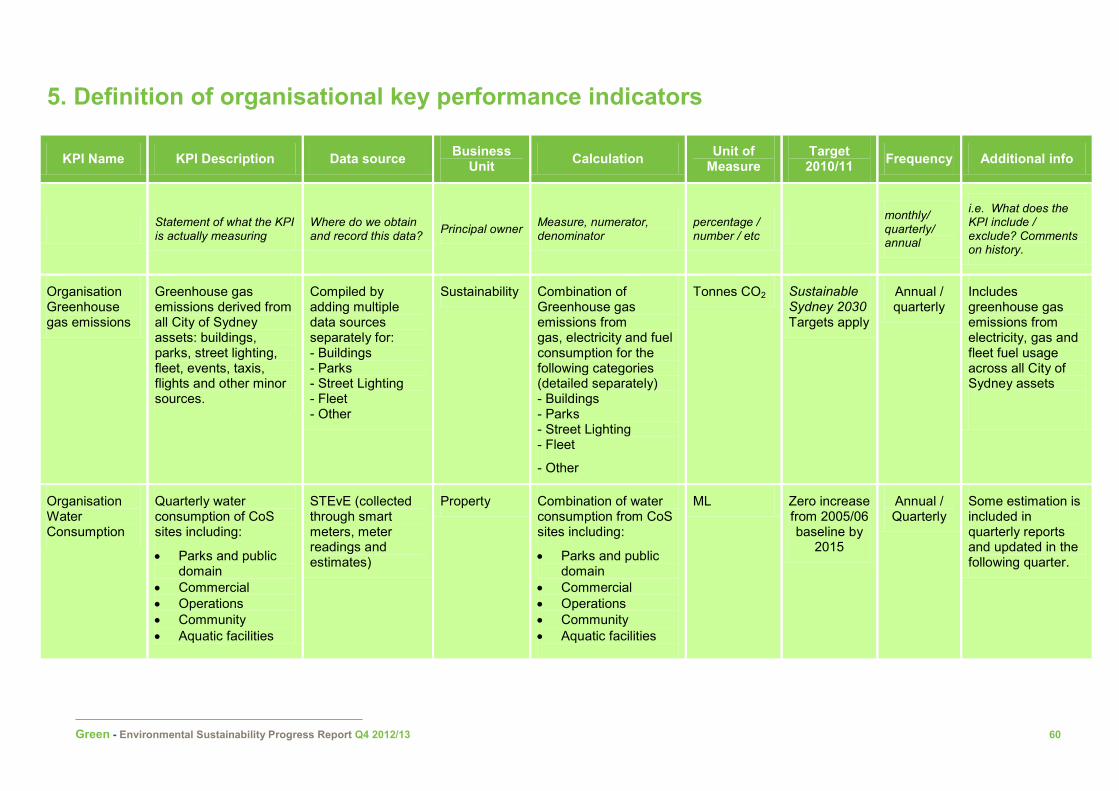
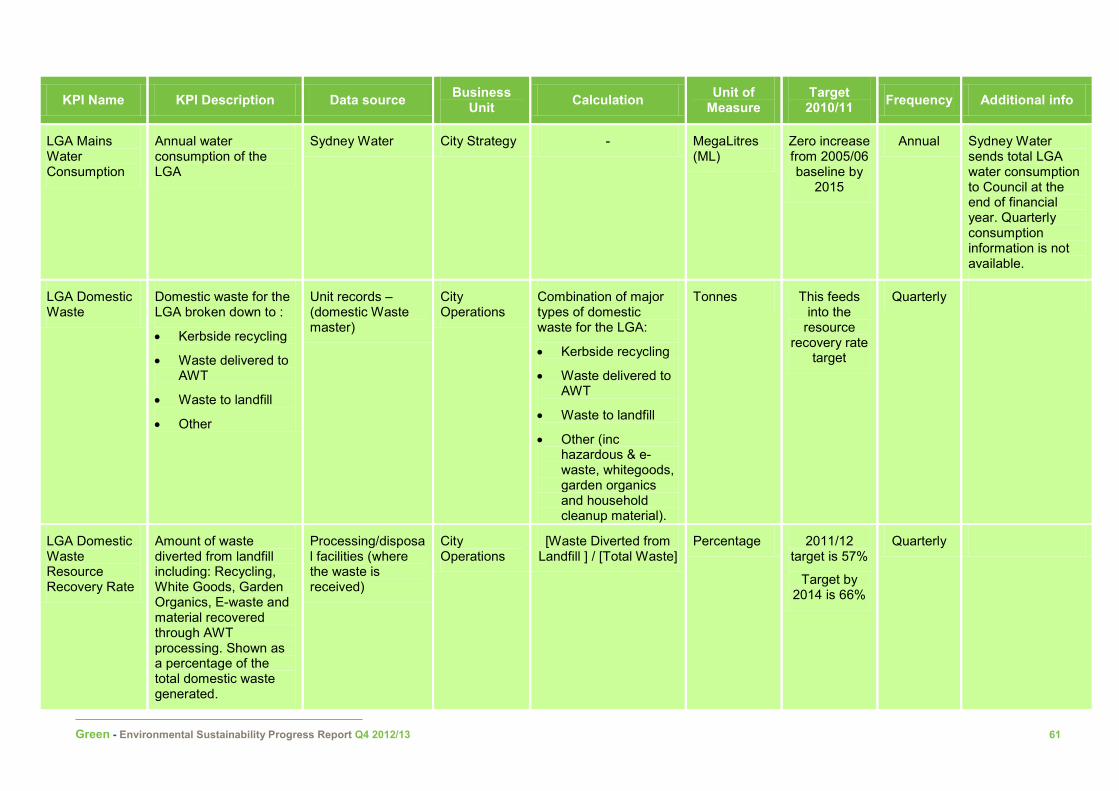
5. Definition of organisational KPIs 60-61
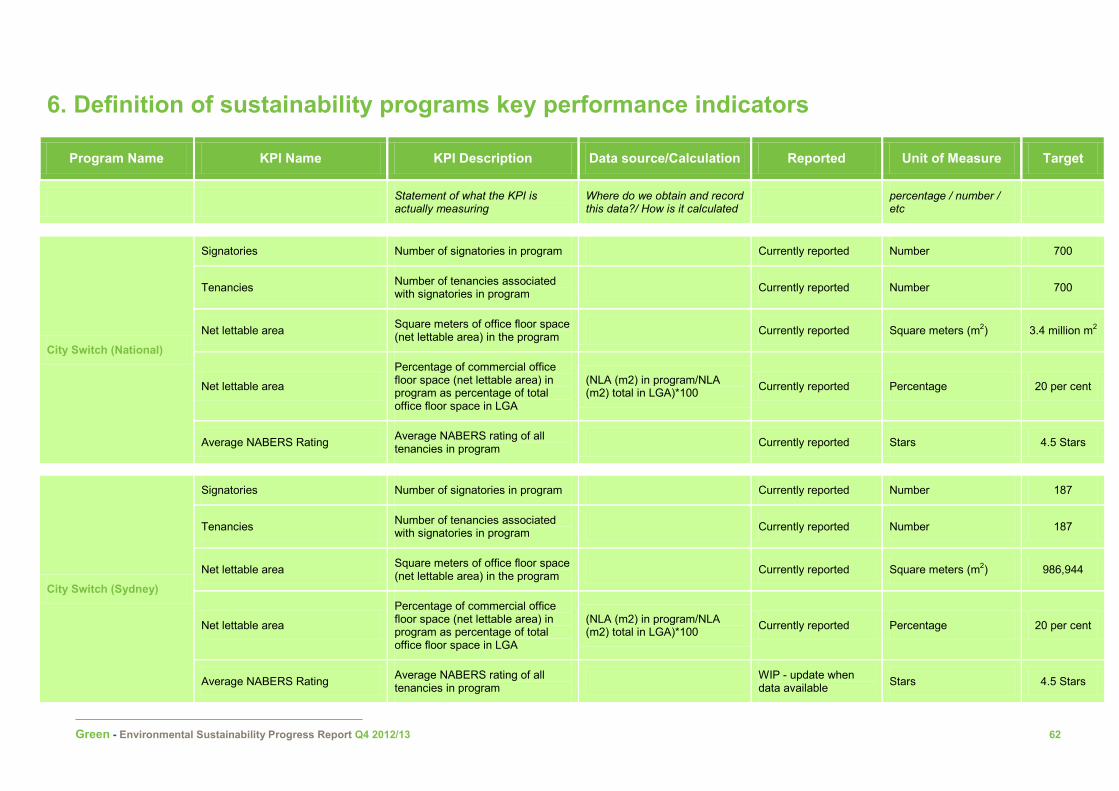
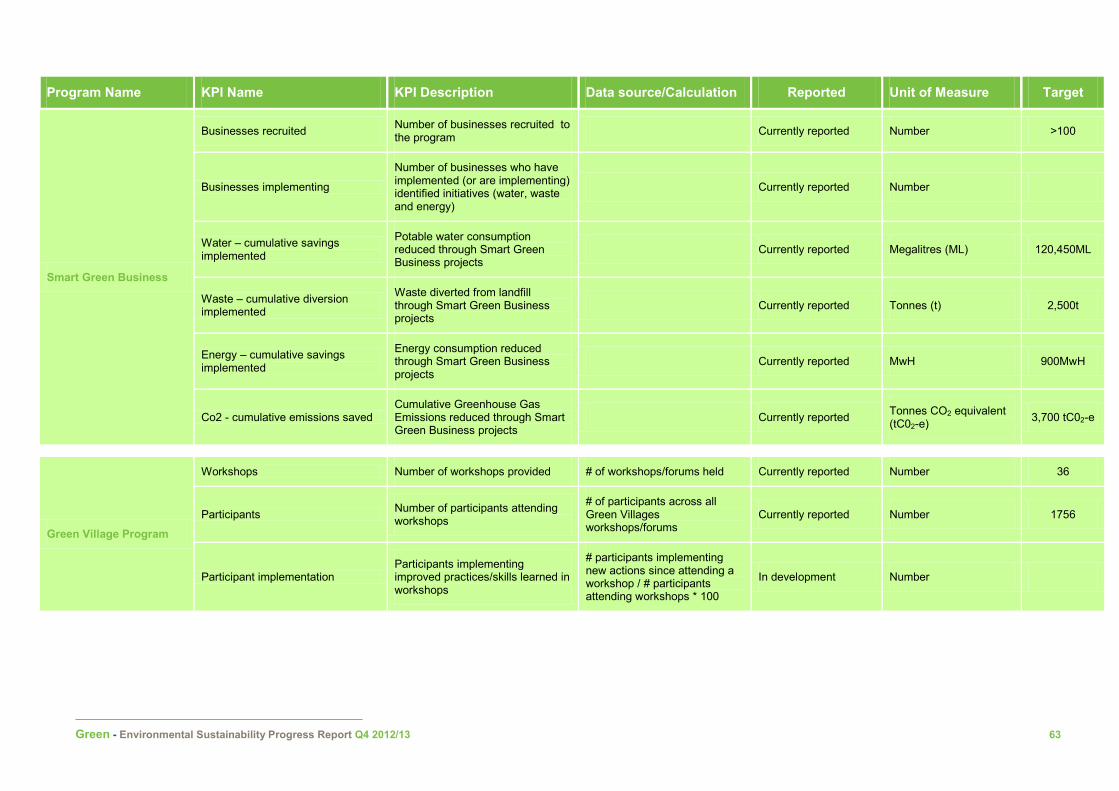
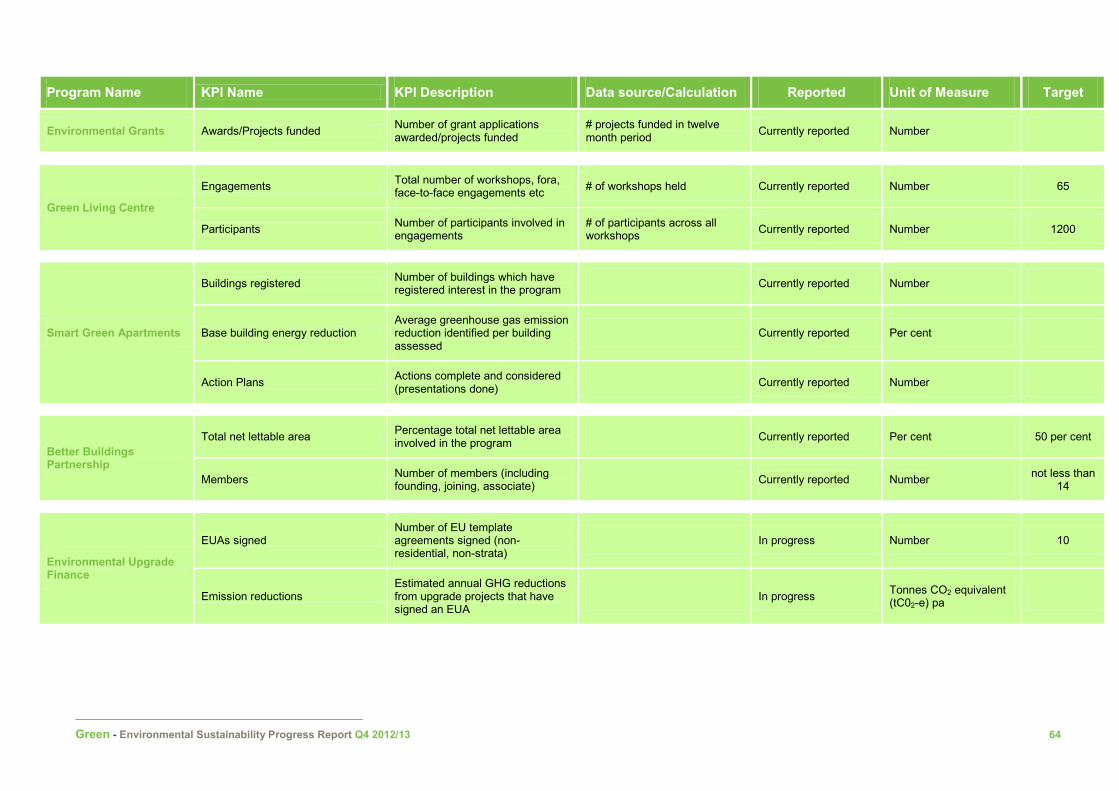
6. Definition of sustainability programs KPIs 62-64
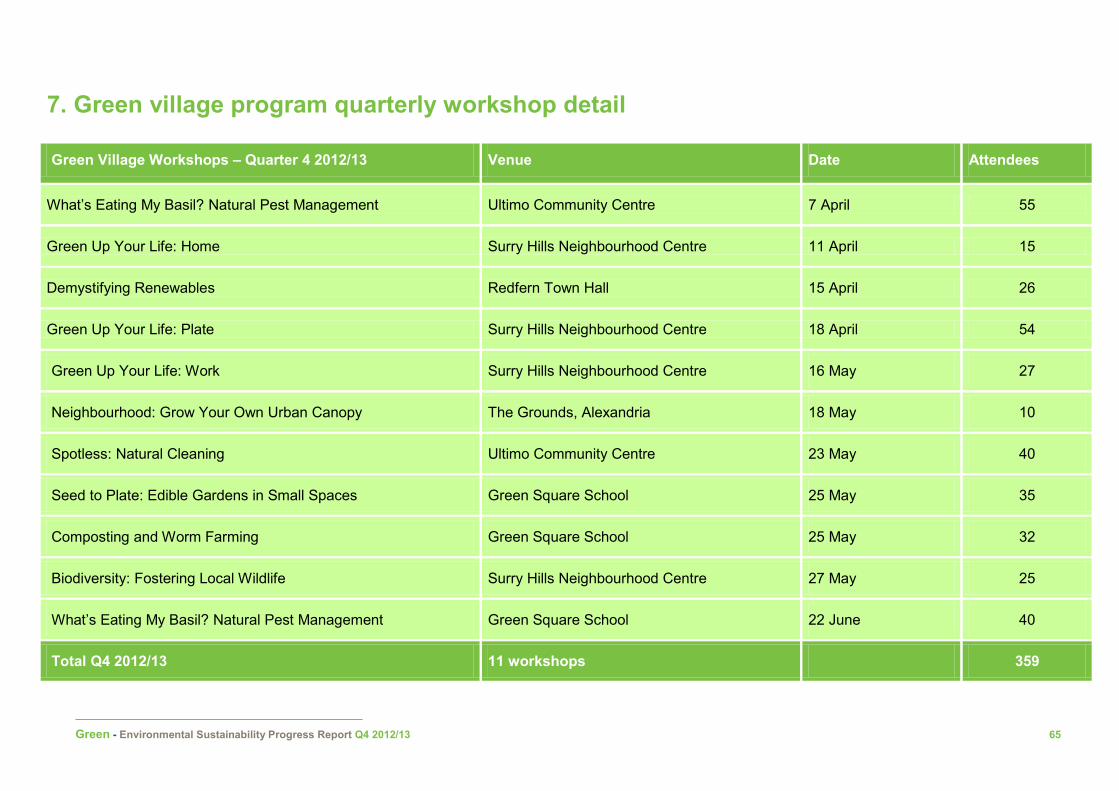
7. Green Village quarterly workshop detail 65
Explanatory notes to graphs 66-69
Legend
CO2 Carbon dioxide
Kg Kilogram
kL Kilolitres
kWp Kilowatt peak
LED Light Emitting Diode
LGA Local Government Area
m2 square meters
ML Megalitres
MWh Megawatt hour
MWe Megawatt equivalent
t Tonne
tCO2-e Tonnes of carbon dioxide equivalent
Green - Environmental Sustainability Progress Report Q4 2012/13 0
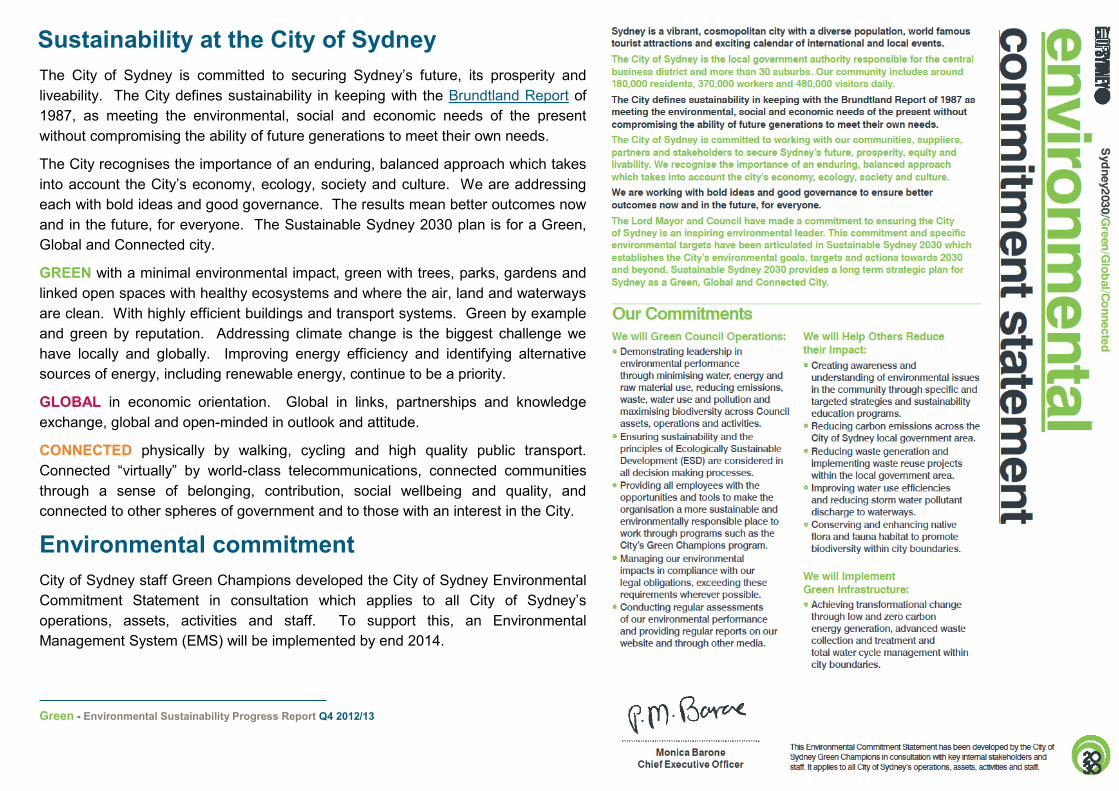
Sustainability at the City of Sydney The City of Sydney is committed to securing Sydney’s future, its prosperity and liveability. The City defines sustainability in keeping with the Brundtland Report of 1987, as meeting the environmental, social and economic needs of the present without compromising the ability of future generations to meet their own needs.
The City recognises the importance of an enduring, balanced approach which takes into account the City’s economy, ecology, society and culture. We are addressing each with bold ideas and good governance. The results mean better outcomes now and in the future, for everyone. The Sustainable Sydney 2030 plan is for a Green, Global and Connected city.
GREEN with a minimal environmental impact, green with trees, parks, gardens and linked open spaces with healthy ecosystems and where the air, land and waterways are clean. With highly efficient buildings and transport systems. Green by example and green by reputation. Addressing climate change is the biggest challenge we have locally and globally. Improving energy efficiency and identifying alternative sources of energy, including renewable energy, continue to be a priority.
GLOBAL in economic orientation. Global in links, partnerships and knowledge exchange, global and open-minded in outlook and attitude.
CONNECTED physically by walking, cycling and high quality public transport. Connected “virtually” by world-class telecommunications, connected communities through a sense of belonging, contribution, social wellbeing and quality, and connected to other spheres of government and to those with an interest in the City.
Environmental commitment City of Sydney staff Green Champions developed the City of Sydney Environmental Commitment Statement in consultation which applies to all City of Sydney’s operations, assets, activities and staff. To support this, an Environmental Management System (EMS) will be implemented by end 2014.
Green - Environmental Sustainability Progress Report Q4 2012/13 2
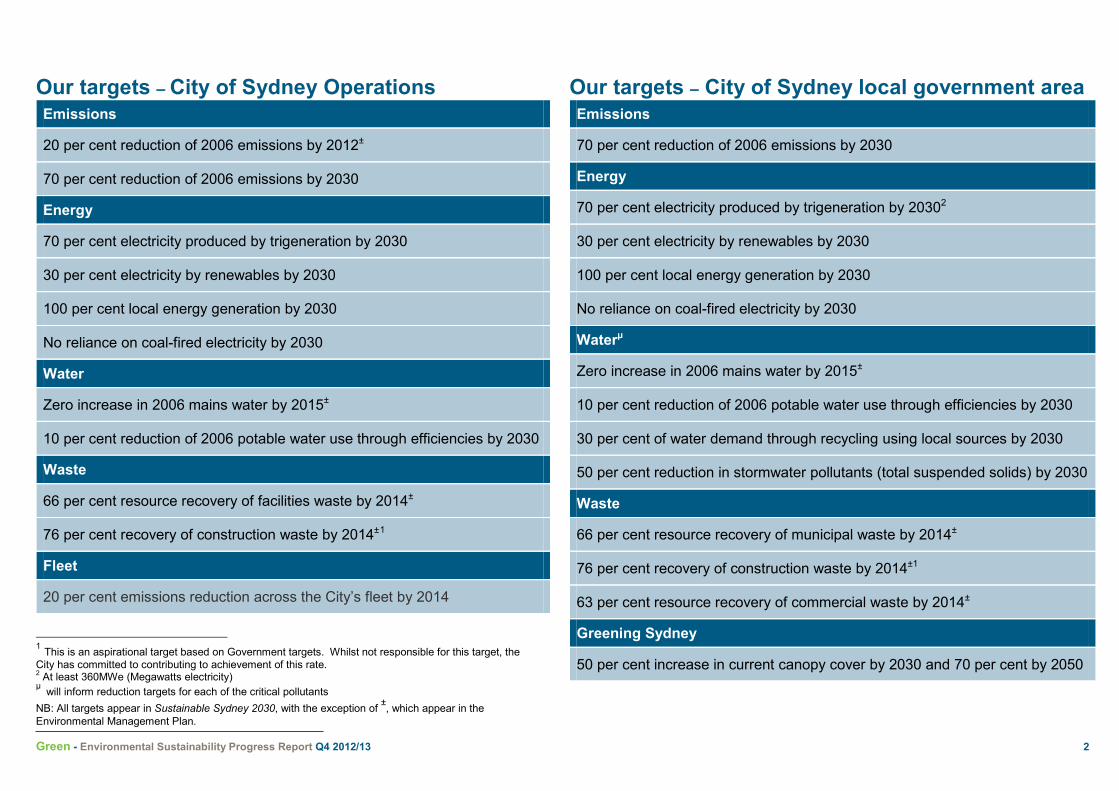
Our targets – City of Sydney Operations
Emissions
20 per cent reduction of 2006 emissions by 2012±
70 per cent reduction of 2006 emissions by 2030
Energy
70 per cent electricity produced by trigeneration by 2030
30 per cent electricity by renewables by 2030
100 per cent local energy generation by 2030
No reliance on coal-fired electricity by 2030
Water
Zero increase in 2006 mains water by 2015±
10 per cent reduction of 2006 potable water use through efficiencies by 2030
Waste
66 per cent resource recovery of facilities waste by 2014±
76 per cent recovery of construction waste by 2014±1
Fleet
20 per cent emissions reduction across the City’s fleet by 2014
1 This is an aspirational target based on Government targets. Whilst not responsible for this target, the City has committed to contributing to achievement of this rate. 2 At least 360MWe (Megawatts electricity) µ will inform reduction targets for each of the critical pollutants NB: All targets appear in Sustainable Sydney 2030, with the exception of ±, which appear in the Environmental Management Plan.
Our targets – City of Sydney local government area
Emissions
70 per cent reduction of 2006 emissions by 2030
Energy
70 per cent electricity produced by trigeneration by 20302
30 per cent electricity by renewables by 2030
100 per cent local energy generation by 2030
No reliance on coal-fired electricity by 2030
Waterµ
Zero increase in 2006 mains water by 2015±
10 per cent reduction of 2006 potable water use through efficiencies by 2030
30 per cent of water demand through recycling using local sources by 2030
50 per cent reduction in stormwater pollutants (total suspended solids) by 2030
Waste
66 per cent resource recovery of municipal waste by 2014±
76 per cent recovery of construction waste by 2014±1
63 per cent resource recovery of commercial waste by 2014±
Greening Sydney
50 per cent increase in current canopy cover by 2030 and 70 per cent by 2050
Green - Environmental Sustainability Progress Report Q4 2012/13 3
Climate change The best available scientific evidence tells us that greenhouse gas emissions from human activity, particularly our use of energy from fossil fuels are contributing to climate change and the change is occurring faster than initially predicted2.
Climate change occurs as a result of “greenhouse gasses” building up in the atmosphere. These include carbon dioxide (CO2), methane (CH4), nitrous oxide (N2O) and CFCs. The gasses trap heat radiating from Earth toward space, warming the surface of the planet. Only stopping or dramatically reducing greenhouse gas emissions can slow the changes we are experiencing now.
In its Fourth Assessment Report, the Intergovernmental Panel on Climate Change (IPCC), a group of 1,300 independent scientific experts from countries all over the world under the auspices of the United Nations, concluded that there is a more than 90 per cent probability that human activities over the past 250 years have warmed our planet.
Cities have a critical role in reducing greenhouse gas emissions because though they cover only 2 per cent of the Earth’s land surface, they have more than 50 per cent of the population and cause 75 per cent of the world’s emissions.
The City is developing a Climate Change Adaptation Plan to help us prioritise and plan actions needed to prepare the city for the environmental, social and economic impacts of climate change.
Centralised coal-fired power generation is responsible for 80 per cent of the city’s greenhouse gas emissions and a large proportion of Australia’s emissions. Power stations lose more than two-thirds of their primary energy to the atmosphere with further losses in the grid and are a major user of water. 2 National Aeronautics and Space Administration (NASA) http://climate.nasa.gov/causes/
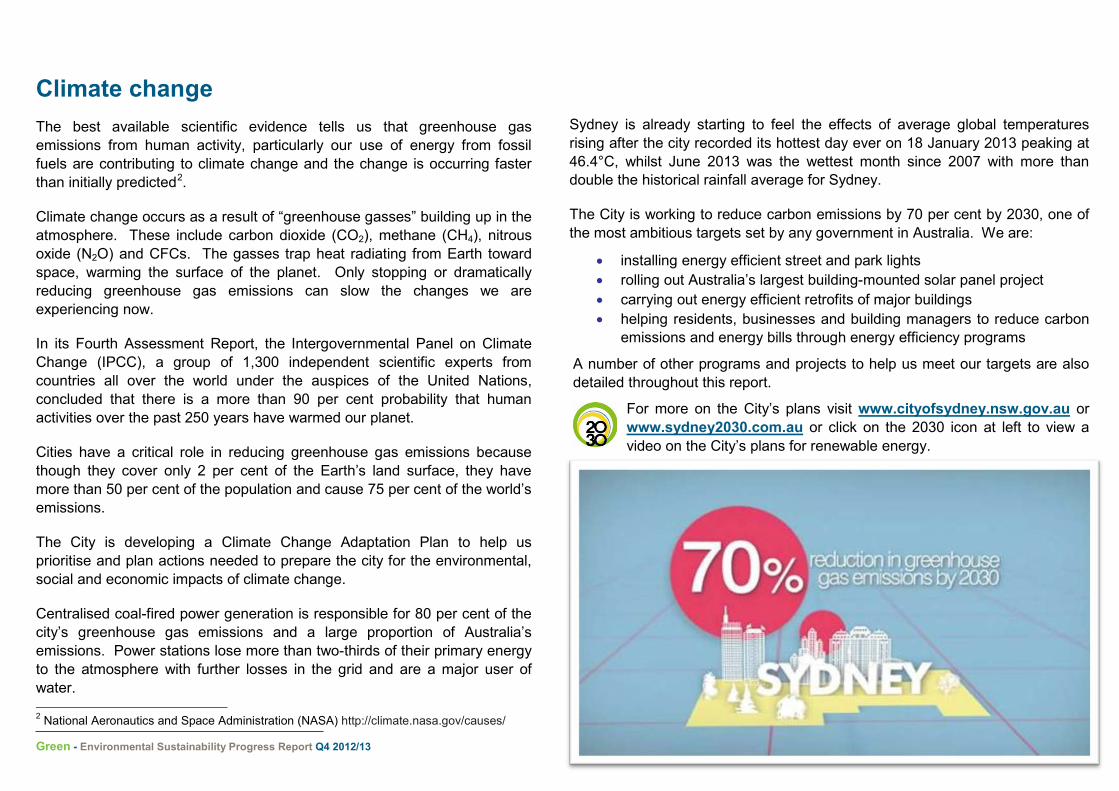
Sydney is already starting to feel the effects of average global temperatures rising after the city recorded its hottest day ever on 18 January 2013 peaking at 46.4°C, whilst June 2013 was the wettest month since 2007 with more than double the historical rainfall average for Sydney.
The City is working to reduce carbon emissions by 70 per cent by 2030, one of the most ambitious targets set by any government in Australia. We are:
• installing energy efficient street and park lights • rolling out Australia’s largest building-mounted solar panel project • carrying out energy efficient retrofits of major buildings • helping residents, businesses and building managers to reduce carbon
emissions and energy bills through energy efficiency programs
A number of other programs and projects to help us meet our targets are also detailed throughout this report.
For more on the City’s plans visit www.cityofsydney.nsw.gov.au or www.sydney2030.com.au or click on the 2030 icon at left to view a video on the City’s plans for renewable energy.
Green - Environmental Sustainability Progress Report Q4 2012/13 3
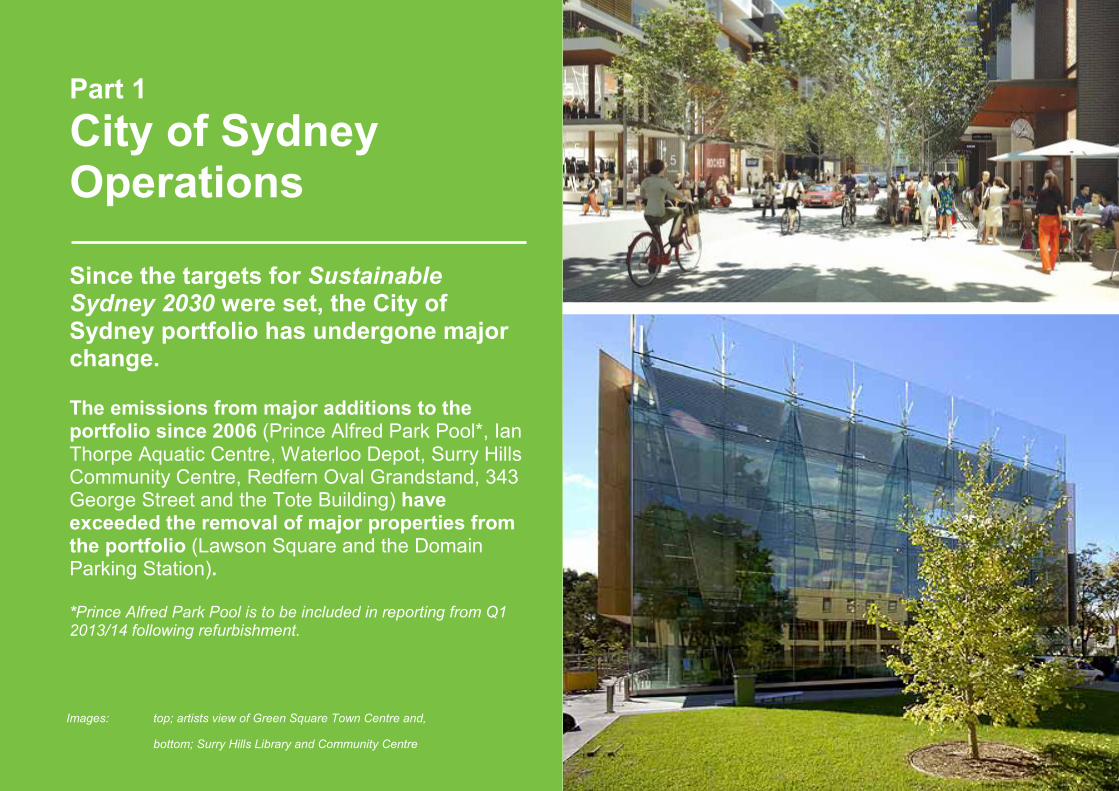
Part 1 City of Sydney Operations Since the targets for Sustainable Sydney 2030 were set, the City of Sydney portfolio has undergone major change. The emissions from major additions to the portfolio since 2006 (Prince Alfred Park Pool*, Ian Thorpe Aquatic Centre, Waterloo Depot, Surry Hills Community Centre, Redfern Oval Grandstand, 343 George Street and the Tote Building) have exceeded the removal of major properties from the portfolio (Lawson Square and the Domain Parking Station). *Prince Alfred Park Pool is to be included in reporting from Q1 2013/14 following refurbishment.
Images: top; artists view of Green Square Town Centre and,
bottom; Surry Hills Library and Community Centre
Green - Environmental Sustainability Progress Report Q4 2012/13 5
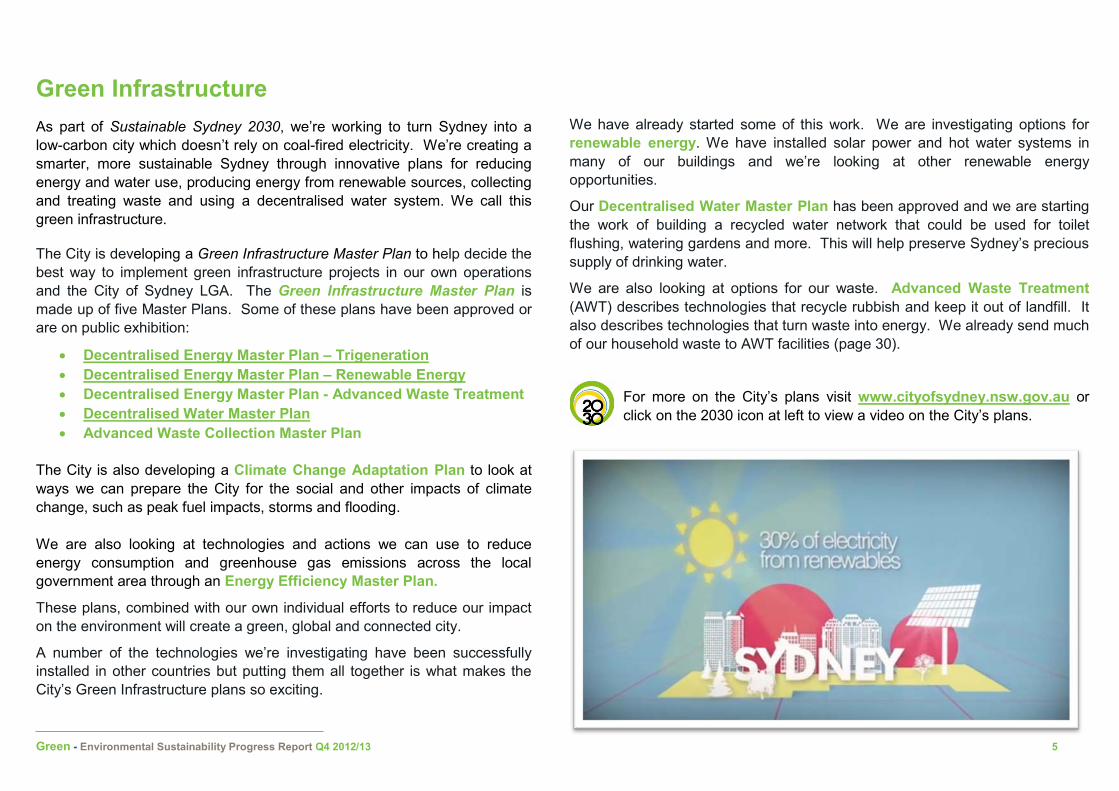
Green Infrastructure As part of Sustainable Sydney 2030, we’re working to turn Sydney into a low-carbon city which doesn’t rely on coal-fired electricity. We’re creating a smarter, more sustainable Sydney through innovative plans for reducing energy and water use, producing energy from renewable sources, collecting and treating waste and using a decentralised water system. We call this green infrastructure.
The City is developing a Green Infrastructure Master Plan to help decide the best way to implement green infrastructure projects in our own operations and the City of Sydney LGA. The Green Infrastructure Master Plan is made up of five Master Plans. Some of these plans have been approved or are on public exhibition:
• Decentralised Energy Master Plan – Trigeneration • Decentralised Energy Master Plan – Renewable Energy • Decentralised Energy Master Plan - Advanced Waste Treatment • Decentralised Water Master Plan • Advanced Waste Collection Master Plan
The City is also developing a Climate Change Adaptation Plan to look at ways we can prepare the City for the social and other impacts of climate change, such as peak fuel impacts, storms and flooding. We are also looking at technologies and actions we can use to reduce energy consumption and greenhouse gas emissions across the local government area through an Energy Efficiency Master Plan.
These plans, combined with our own individual efforts to reduce our impact on the environment will create a green, global and connected city.
A number of the technologies we’re investigating have been successfully installed in other countries but putting them all together is what makes the City’s Green Infrastructure plans so exciting.
We have already started some of this work. We are investigating options for renewable energy. We have installed solar power and hot water systems in many of our buildings and we’re looking at other renewable energy opportunities.
Our Decentralised Water Master Plan has been approved and we are starting the work of building a recycled water network that could be used for toilet flushing, watering gardens and more. This will help preserve Sydney’s precious supply of drinking water.
We are also looking at options for our waste. Advanced Waste Treatment (AWT) describes technologies that recycle rubbish and keep it out of landfill. It also describes technologies that turn waste into energy. We already send much of our household waste to AWT facilities (page 30).
For more on the City’s plans visit www.cityofsydney.nsw.gov.au or click on the 2030 icon at left to view a video on the City’s plans.
Green - Environmental Sustainability Progress Report Q4 2012/13 6
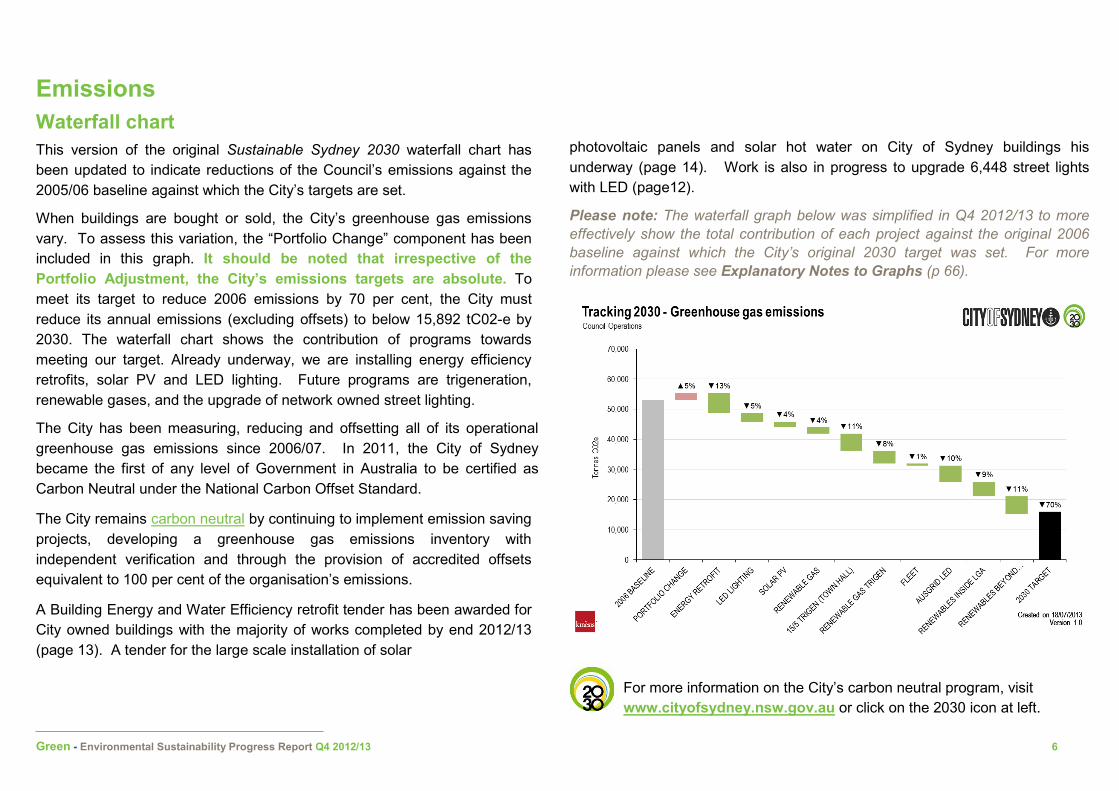
Emissions Waterfall chart This version of the original Sustainable Sydney 2030 waterfall chart has been updated to indicate reductions of the Council’s emissions against the 2005/06 baseline against which the City’s targets are set.
When buildings are bought or sold, the City’s greenhouse gas emissions vary. To assess this variation, the “Portfolio Change” component has been included in this graph. It should be noted that irrespective of the Portfolio Adjustment, the City’s emissions targets are absolute. To meet its target to reduce 2006 emissions by 70 per cent, the City must reduce its annual emissions (excluding offsets) to below 15,892 tC02-e by 2030. The waterfall chart shows the contribution of programs towards meeting our target. Already underway, we are installing energy efficiency retrofits, solar PV and LED lighting. Future programs are trigeneration, renewable gases, and the upgrade of network owned street lighting.
The City has been measuring, reducing and offsetting all of its operational greenhouse gas emissions since 2006/07. In 2011, the City of Sydney became the first of any level of Government in Australia to be certified as Carbon Neutral under the National Carbon Offset Standard.
The City remains carbon neutral by continuing to implement emission saving projects, developing a greenhouse gas emissions inventory with independent verification and through the provision of accredited offsets equivalent to 100 per cent of the organisation’s emissions.
A Building Energy and Water Efficiency retrofit tender has been awarded for City owned buildings with the majority of works completed by end 2012/13 (page 13). A tender for the large scale installation of solar
photovoltaic panels and solar hot water on City of Sydney buildings his underway (page 14). Work is also in progress to upgrade 6,448 street lights with LED (page12).
Please note: The waterfall graph below was simplified in Q4 2012/13 to more effectively show the total contribution of each project against the original 2006 baseline against which the City’s original 2030 target was set. For more information please see Explanatory Notes to Graphs (p 66).
For more information on the City’s carbon neutral program, visit www.cityofsydney.nsw.gov.au or click on the 2030 icon at left.
Green - Environmental Sustainability Progress Report Q4 2012/13 7
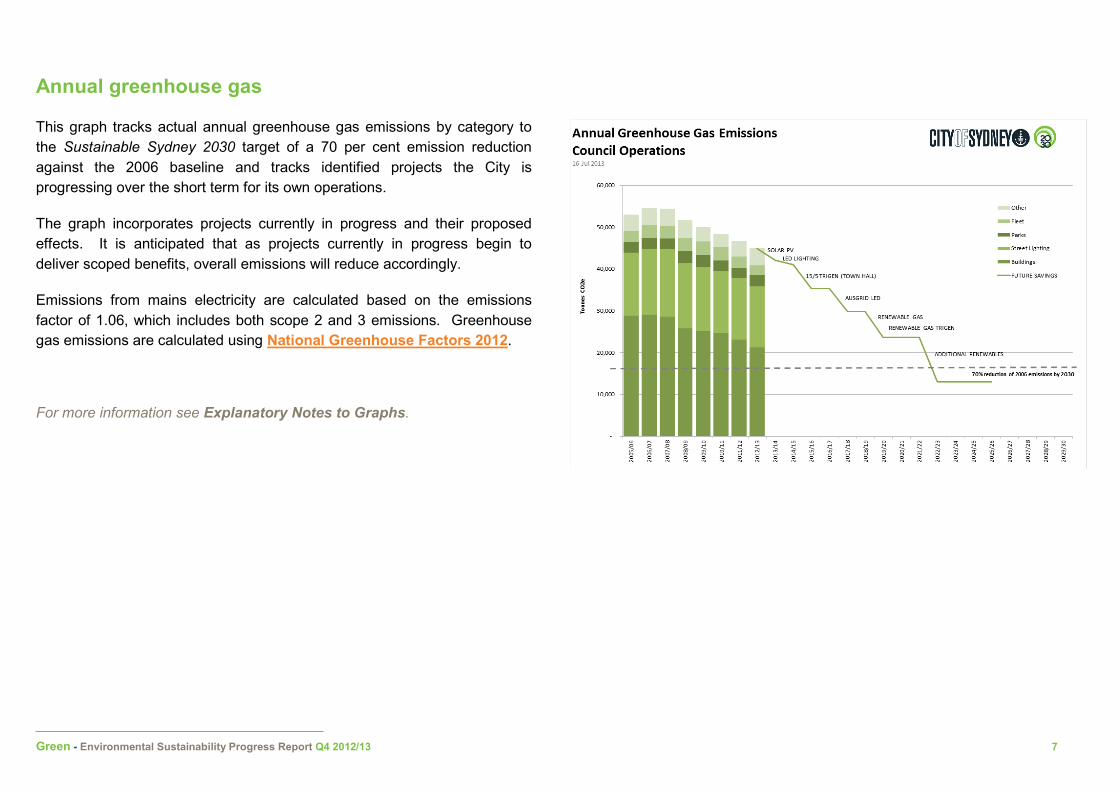
Annual greenhouse gas
This graph tracks actual annual greenhouse gas emissions by category to the Sustainable Sydney 2030 target of a 70 per cent emission reduction against the 2006 baseline and tracks identified projects the City is progressing over the short term for its own operations.
The graph incorporates projects currently in progress and their proposed effects. It is anticipated that as projects currently in progress begin to deliver scoped benefits, overall emissions will reduce accordingly.
Emissions from mains electricity are calculated based on the emissions factor of 1.06, which includes both scope 2 and 3 emissions. Greenhouse gas emissions are calculated using National Greenhouse Factors 2012.
For more information see Explanatory Notes to Graphs.
Green - Environmental Sustainability Progress Report Q4 2012/13 8
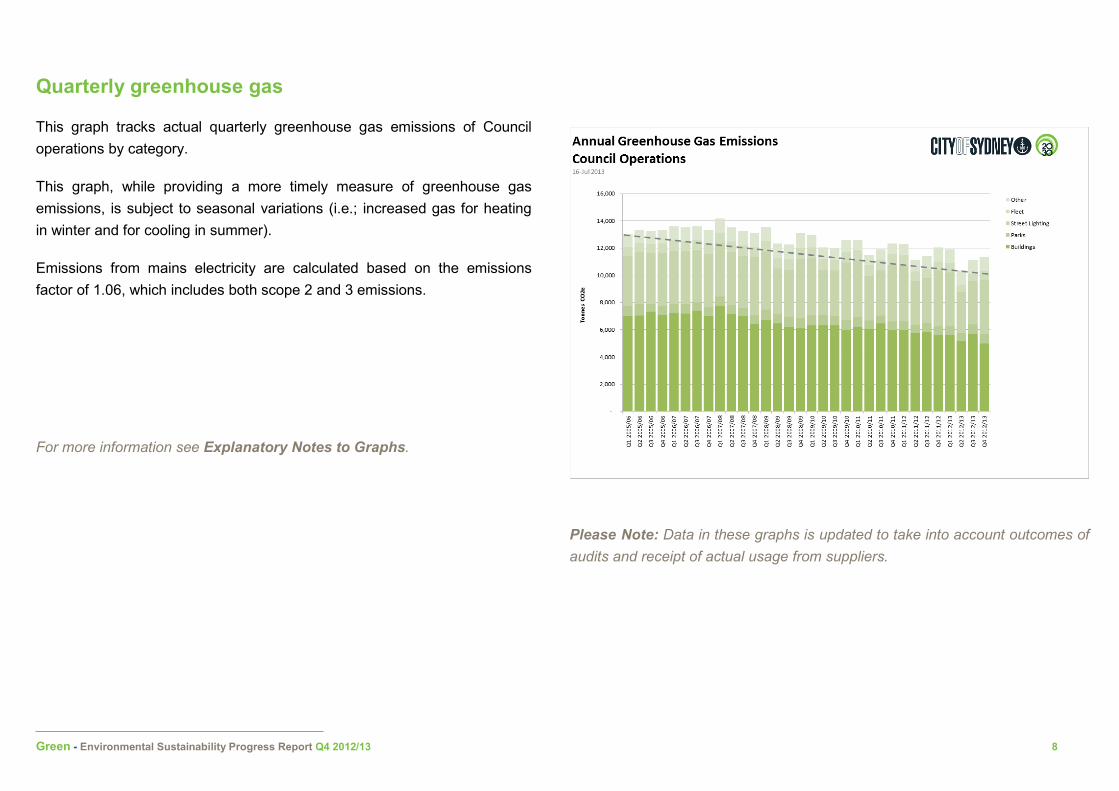
Quarterly greenhouse gas
This graph tracks actual quarterly greenhouse gas emissions of Council operations by category.
This graph, while providing a more timely measure of greenhouse gas emissions, is subject to seasonal variations (i.e.; increased gas for heating in winter and for cooling in summer).
Emissions from mains electricity are calculated based on the emissions factor of 1.06, which includes both scope 2 and 3 emissions.
For more information see Explanatory Notes to Graphs.
Please Note: Data in these graphs is updated to take into account outcomes of audits and receipt of actual usage from suppliers.
Green - Environmental Sustainability Progress Report Q4 2012/13 9
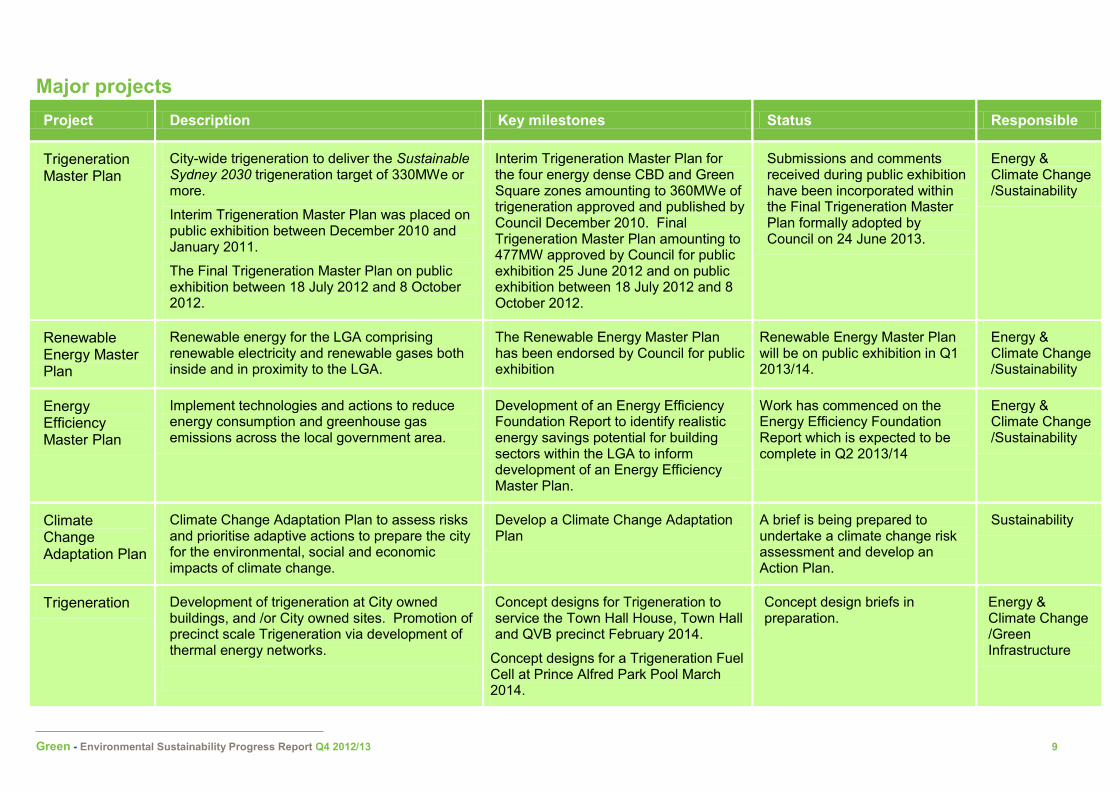
Major projects
Project Description Key milestones Status Responsible
Trigeneration Master Plan
City-wide trigeneration to deliver the Sustainable Sydney 2030 trigeneration target of 330MWe or more.
Interim Trigeneration Master Plan was placed on public exhibition between December 2010 and January 2011.
The Final Trigeneration Master Plan on public exhibition between 18 July 2012 and 8 October 2012.
Interim Trigeneration Master Plan for the four energy dense CBD and Green Square zones amounting to 360MWe of trigeneration approved and published by Council December 2010. Final Trigeneration Master Plan amounting to 477MW approved by Council for public exhibition 25 June 2012 and on public exhibition between 18 July 2012 and 8 October 2012.
Submissions and comments received during public exhibition have been incorporated within the Final Trigeneration Master Plan formally adopted by Council on 24 June 2013.
Energy & Climate Change /Sustainability
Renewable Energy Master Plan
Renewable energy for the LGA comprising renewable electricity and renewable gases both inside and in proximity to the LGA.
The Renewable Energy Master Plan has been endorsed by Council for public exhibition
Renewable Energy Master Plan will be on public exhibition in Q1 2013/14.
Energy & Climate Change /Sustainability
Energy Efficiency Master Plan
Implement technologies and actions to reduce energy consumption and greenhouse gas emissions across the local government area.
Development of an Energy Efficiency Foundation Report to identify realistic energy savings potential for building sectors within the LGA to inform development of an Energy Efficiency Master Plan.
Work has commenced on the Energy Efficiency Foundation Report which is expected to be complete in Q2 2013/14
Energy & Climate Change /Sustainability
Climate Change Adaptation Plan
Climate Change Adaptation Plan to assess risks and prioritise adaptive actions to prepare the city for the environmental, social and economic impacts of climate change.
Develop a Climate Change Adaptation Plan
A brief is being prepared to undertake a climate change risk assessment and develop an Action Plan.
Sustainability
Trigeneration Development of trigeneration at City owned buildings, and /or City owned sites. Promotion of precinct scale Trigeneration via development of thermal energy networks.
Concept designs for Trigeneration to service the Town Hall House, Town Hall and QVB precinct February 2014.
Concept designs for a Trigeneration Fuel Cell at Prince Alfred Park Pool March 2014.
Concept design briefs in preparation.
Energy & Climate Change /Green Infrastructure
Green - Environmental Sustainability Progress Report Q4 2012/13 10
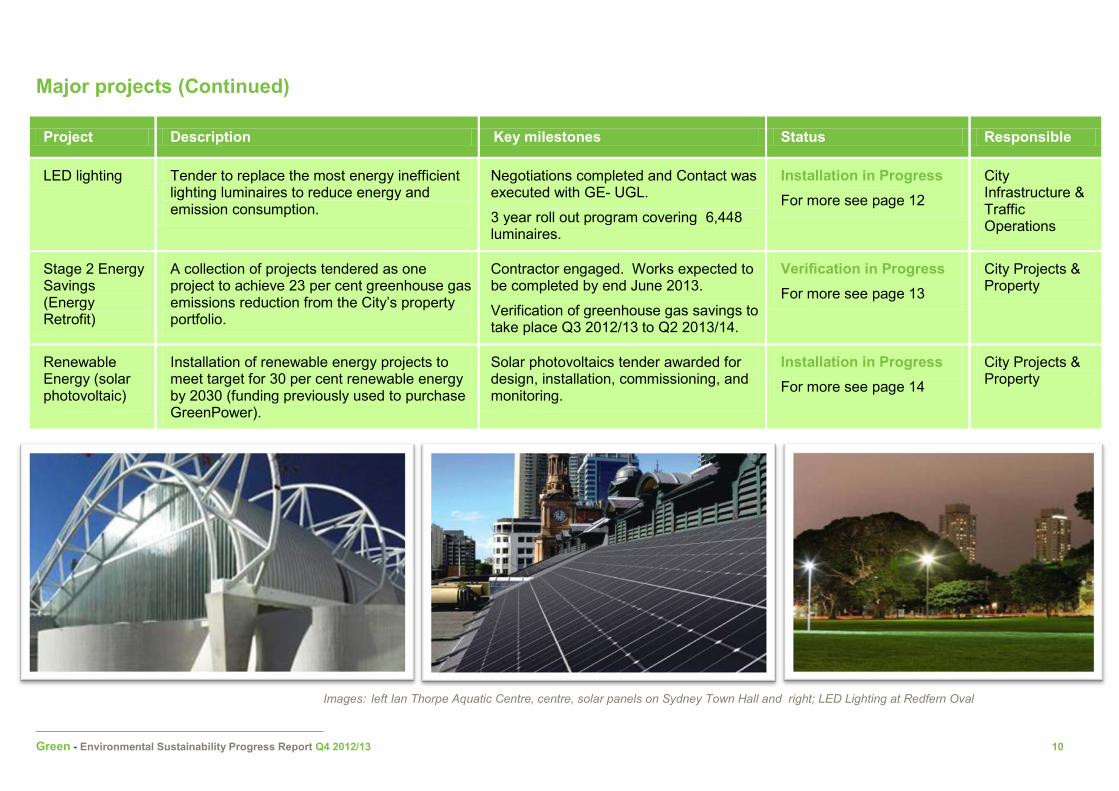
Major projects (Continued)
Project Description Key milestones Status Responsible
LED lighting Tender to replace the most energy inefficient lighting luminaires to reduce energy and emission consumption.
Negotiations completed and Contact was executed with GE- UGL.
3 year roll out program covering 6,448 luminaires.
Installation in Progress For more see page 12
City Infrastructure & Traffic Operations
Stage 2 Energy Savings (Energy Retrofit)
A collection of projects tendered as one project to achieve 23 per cent greenhouse gas emissions reduction from the City’s property portfolio.
Contractor engaged. Works expected to be completed by end June 2013.
Verification of greenhouse gas savings to take place Q3 2012/13 to Q2 2013/14.
Verification in Progress For more see page 13
City Projects & Property
Renewable Energy (solar photovoltaic)
Installation of renewable energy projects to meet target for 30 per cent renewable energy by 2030 (funding previously used to purchase GreenPower).
Solar photovoltaics tender awarded for design, installation, commissioning, and monitoring.
Installation in Progress For more see page 14
City Projects & Property
Images: left Ian Thorpe Aquatic Centre, centre, solar panels on Sydney Town Hall and right; LED Lighting at Redfern Oval
Green - Environmental Sustainability Progress Report Q4 2012/13 11
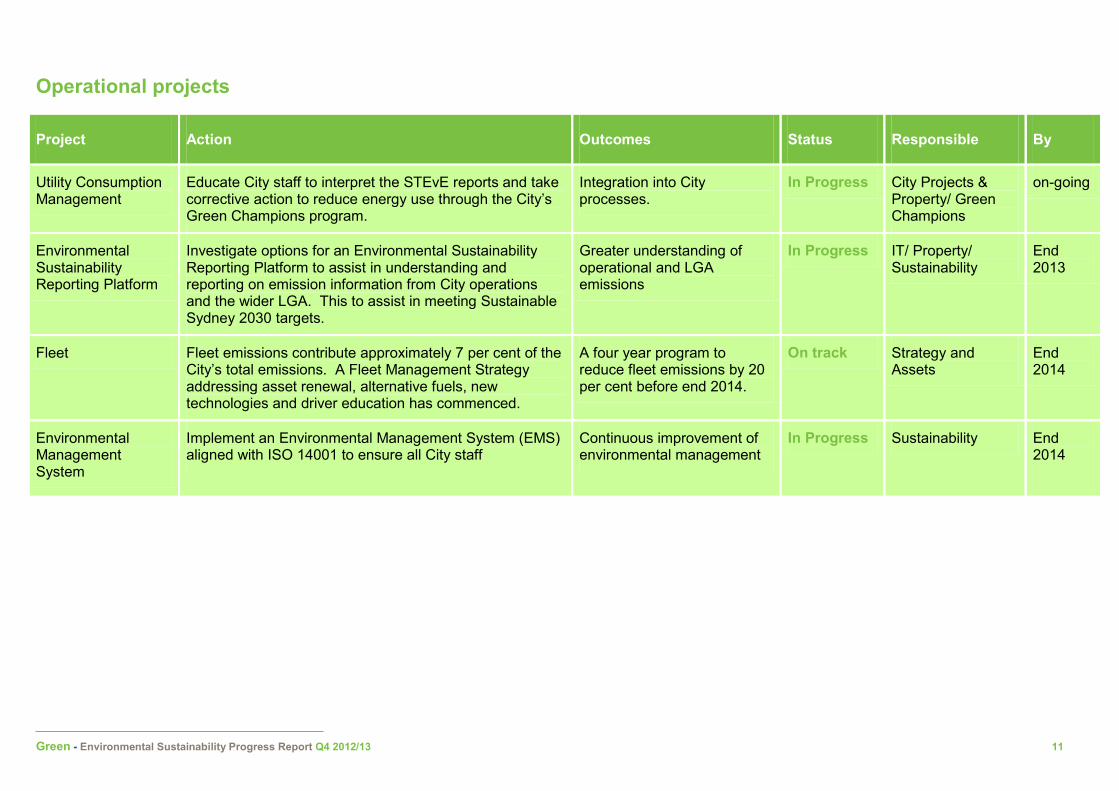
Operational projects
Project Action Outcomes Status Responsible By
Utility Consumption Management
Educate City staff to interpret the STEvE reports and take corrective action to reduce energy use through the City’s Green Champions program.
Integration into City processes.
In Progress City Projects & Property/ Green Champions
on-going
Environmental Sustainability Reporting Platform
Investigate options for an Environmental Sustainability Reporting Platform to assist in understanding and reporting on emission information from City operations and the wider LGA. This to assist in meeting Sustainable Sydney 2030 targets.
Greater understanding of operational and LGA emissions
In Progress IT/ Property/ Sustainability
End 2013
Fleet Fleet emissions contribute approximately 7 per cent of the City’s total emissions. A Fleet Management Strategy addressing asset renewal, alternative fuels, new technologies and driver education has commenced.
A four year program to reduce fleet emissions by 20 per cent before end 2014.
On track Strategy and Assets
End 2014
Environmental Management System
Implement an Environmental Management System (EMS) aligned with ISO 14001 to ensure all City staff
Continuous improvement of environmental management
In Progress Sustainability End 2014
Green - Environmental Sustainability Progress Report Q4 2012/13 12
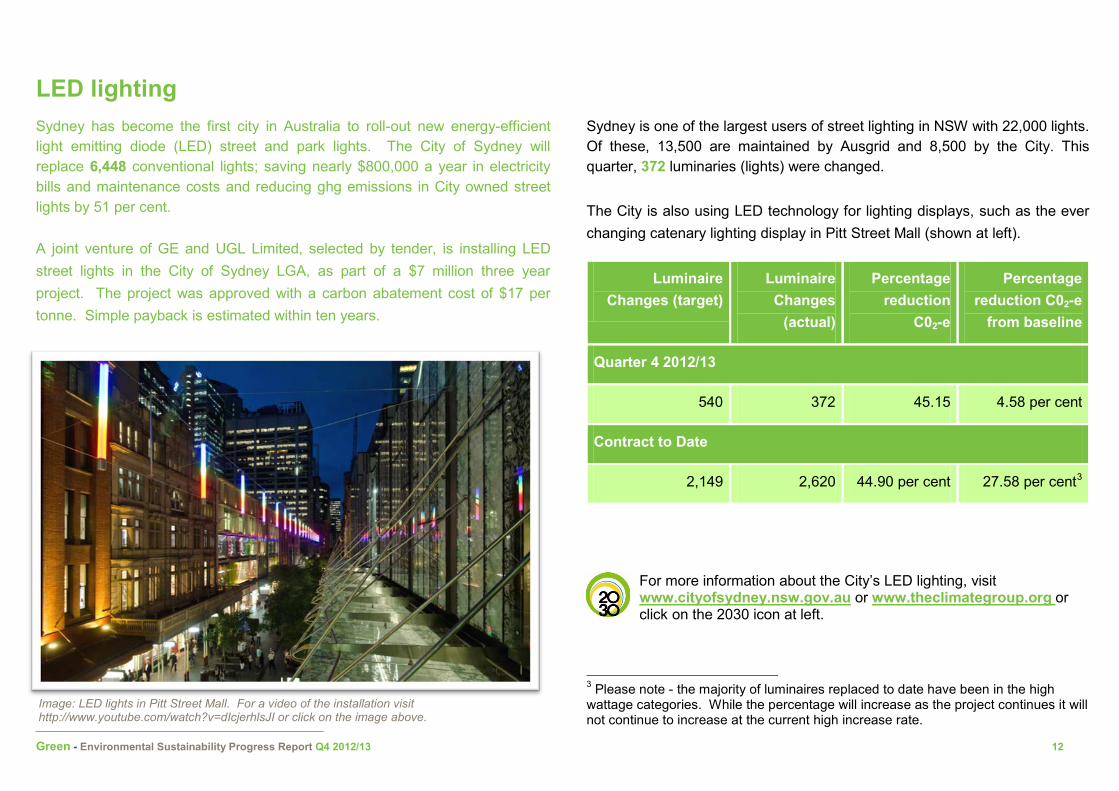
LED lighting Sydney has become the first city in Australia to roll-out new energy-efficient light emitting diode (LED) street and park lights. The City of Sydney will replace 6,448 conventional lights; saving nearly $800,000 a year in electricity bills and maintenance costs and reducing ghg emissions in City owned street lights by 51 per cent.
A joint venture of GE and UGL Limited, selected by tender, is installing LED street lights in the City of Sydney LGA, as part of a $7 million three year project. The project was approved with a carbon abatement cost of $17 per tonne. Simple payback is estimated within ten years.
Sydney is one of the largest users of street lighting in NSW with 22,000 lights. Of these, 13,500 are maintained by Ausgrid and 8,500 by the City. This quarter, 372 luminaries (lights) were changed.
The City is also using LED technology for lighting displays, such as the ever changing catenary lighting display in Pitt Street Mall (shown at left).
Luminaire Changes (target)
Luminaire Changes
(actual)
Percentage reduction
C02-e
Percentage reduction C02-e
from baseline
Quarter 4 2012/13
540 372 45.15 4.58 per cent
Contract to Date
2,149 2,620 44.90 per cent 27.58 per cent3
For more information about the City’s LED lighting, visit www.cityofsydney.nsw.gov.au or www.theclimategroup.org or click on the 2030 icon at left.
3 Please note - the majority of luminaires replaced to date have been in the high wattage categories. While the percentage will increase as the project continues it will not continue to increase at the current high increase rate.
Image: LED lights in Pitt Street Mall. For a video of the installation visit http://www.youtube.com/watch?v=dIcjerhlsJI or click on the image above.
Green - Environmental Sustainability Progress Report Q4 2012/13 13
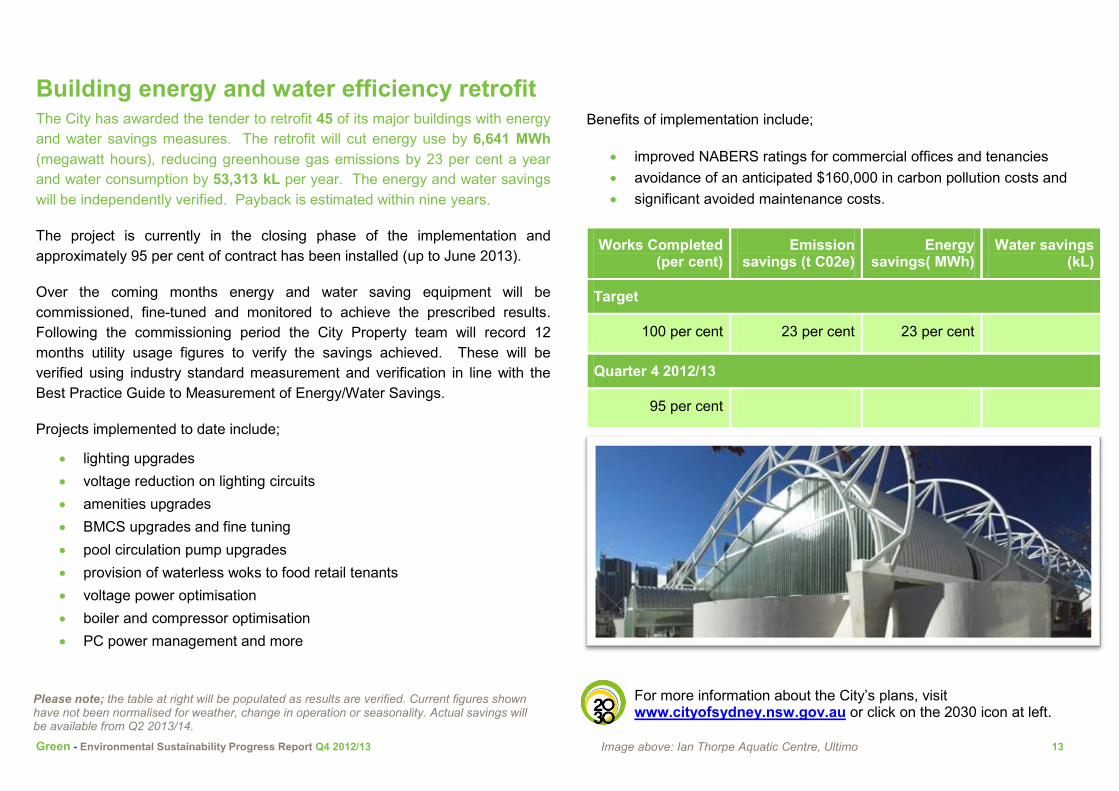
Building energy and water efficiency retrofit The City has awarded the tender to retrofit 45 of its major buildings with energy and water savings measures. The retrofit will cut energy use by 6,641 MWh (megawatt hours), reducing greenhouse gas emissions by 23 per cent a year and water consumption by 53,313 kL per year. The energy and water savings will be independently verified. Payback is estimated within nine years.
The project is currently in the closing phase of the implementation and approximately 95 per cent of contract has been installed (up to June 2013).
Over the coming months energy and water saving equipment will be commissioned, fine-tuned and monitored to achieve the prescribed results. Following the commissioning period the City Property team will record 12 months utility usage figures to verify the savings achieved. These will be verified using industry standard measurement and verification in line with the Best Practice Guide to Measurement of Energy/Water Savings.
Projects implemented to date include;
• lighting upgrades • voltage reduction on lighting circuits • amenities upgrades • BMCS upgrades and fine tuning • pool circulation pump upgrades • provision of waterless woks to food retail tenants • voltage power optimisation • boiler and compressor optimisation • PC power management and more
Benefits of implementation include;
• improved NABERS ratings for commercial offices and tenancies • avoidance of an anticipated $160,000 in carbon pollution costs and • significant avoided maintenance costs.
Works Completed (per cent)
Emission savings (t C02e)
Energy savings( MWh)
Water savings (kL)
Target
100 per cent 23 per cent 23 per cent
Quarter 4 2012/13
95 per cent
For more information about the City’s plans, visit www.cityofsydney.nsw.gov.au or click on the 2030 icon at left.
Please note; the table at right will be populated as results are verified. Current figures shown have not been normalised for weather, change in operation or seasonality. Actual savings will be available from Q2 2013/14.
Green - Environmental Sustainability Progress Report Q4 2012/13 14
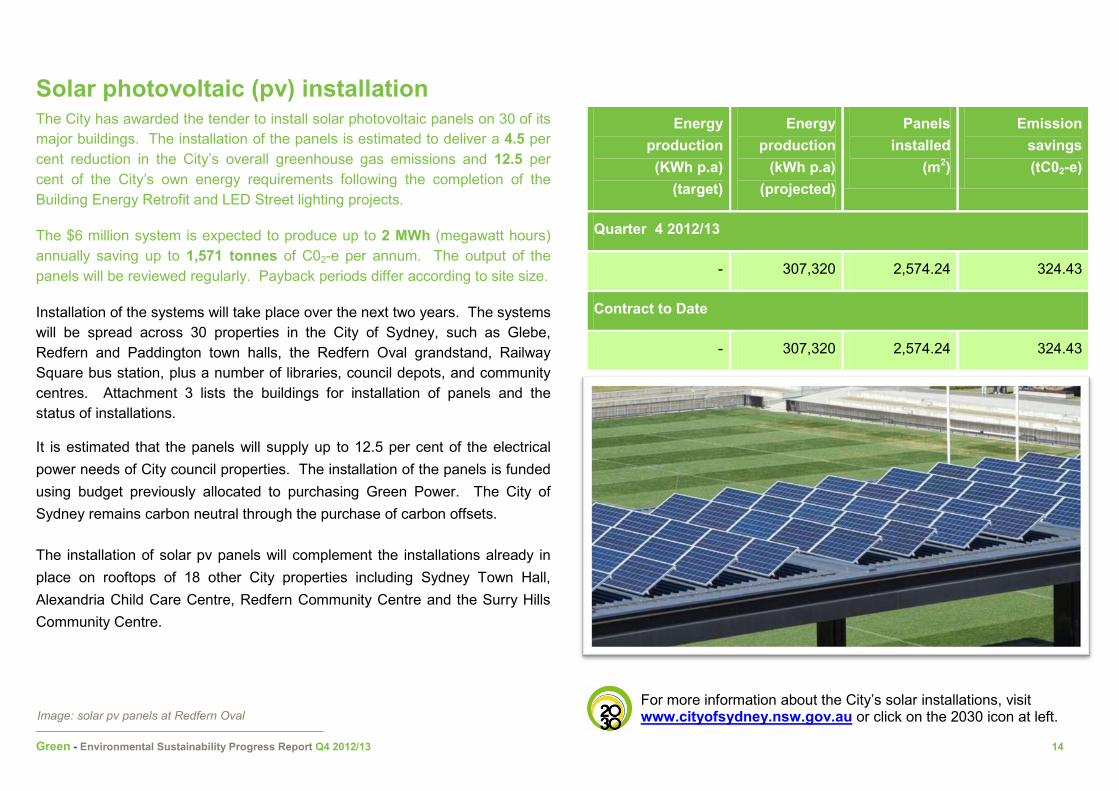
Solar photovoltaic (pv) installation
The City has awarded the tender to install solar photovoltaic panels on 30 of its major buildings. The installation of the panels is estimated to deliver a 4.5 per cent reduction in the City’s overall greenhouse gas emissions and 12.5 per cent of the City’s own energy requirements following the completion of the Building Energy Retrofit and LED Street lighting projects.
The $6 million system is expected to produce up to 2 MWh (megawatt hours) annually saving up to 1,571 tonnes of C02-e per annum. The output of the panels will be reviewed regularly. Payback periods differ according to site size.
Installation of the systems will take place over the next two years. The systems will be spread across 30 properties in the City of Sydney, such as Glebe, Redfern and Paddington town halls, the Redfern Oval grandstand, Railway Square bus station, plus a number of libraries, council depots, and community centres. Attachment 3 lists the buildings for installation of panels and the status of installations.
It is estimated that the panels will supply up to 12.5 per cent of the electrical power needs of City council properties. The installation of the panels is funded using budget previously allocated to purchasing Green Power. The City of Sydney remains carbon neutral through the purchase of carbon offsets.
The installation of solar pv panels will complement the installations already in place on rooftops of 18 other City properties including Sydney Town Hall, Alexandria Child Care Centre, Redfern Community Centre and the Surry Hills Community Centre.
Energy production (KWh p.a)
(target)
Energy production
(kWh p.a) (projected)
Panels installed
(m2)
Emission savings (tC02-e)
Quarter 4 2012/13
- 307,320 2,574.24 324.43
Contract to Date
- 307,320 2,574.24 324.43
For more information about the City’s solar installations, visit www.cityofsydney.nsw.gov.au or click on the 2030 icon at left. Image: solar pv panels at Redfern Oval
Green - Environmental Sustainability Progress Report Q4 2012/13 15
Fleet emissions Vehicles
Our four year target to reduce light and heavy vehicle emissions by 20 per cent before 2014 is on track and Q4 emissions were again below target. The City’s fleet emitted a total of 2,304 tonnes CO2 during 2012/13 against a target of 3,042 tonnes.
In recognition of the City’s receipt of the Australasian Fleet Management Association - Environment Award 2012, a number of invitations have been received to present papers at regional and national conferences. This is a great leadership opportunity for the City.
Parks, footpaths and roads are now serviced by diesel-electric hybrid trucks that emit up to 30 per cent less CO2. A further 12 hybrid trucks were ordered in Q4, with another 20 due for purchase next year.
All new diesel trucks bought by the City now meet the stringent Euro 5 engine standards which aim to reduce fuel consumption and emissions.
The City now uses sustainable biofuels in many of our diesel trucks. These combine diesel with recycled cooking oil and animal fat. A total of 206,603 litres of B50 sustainable bio-diesel was used during Q4.
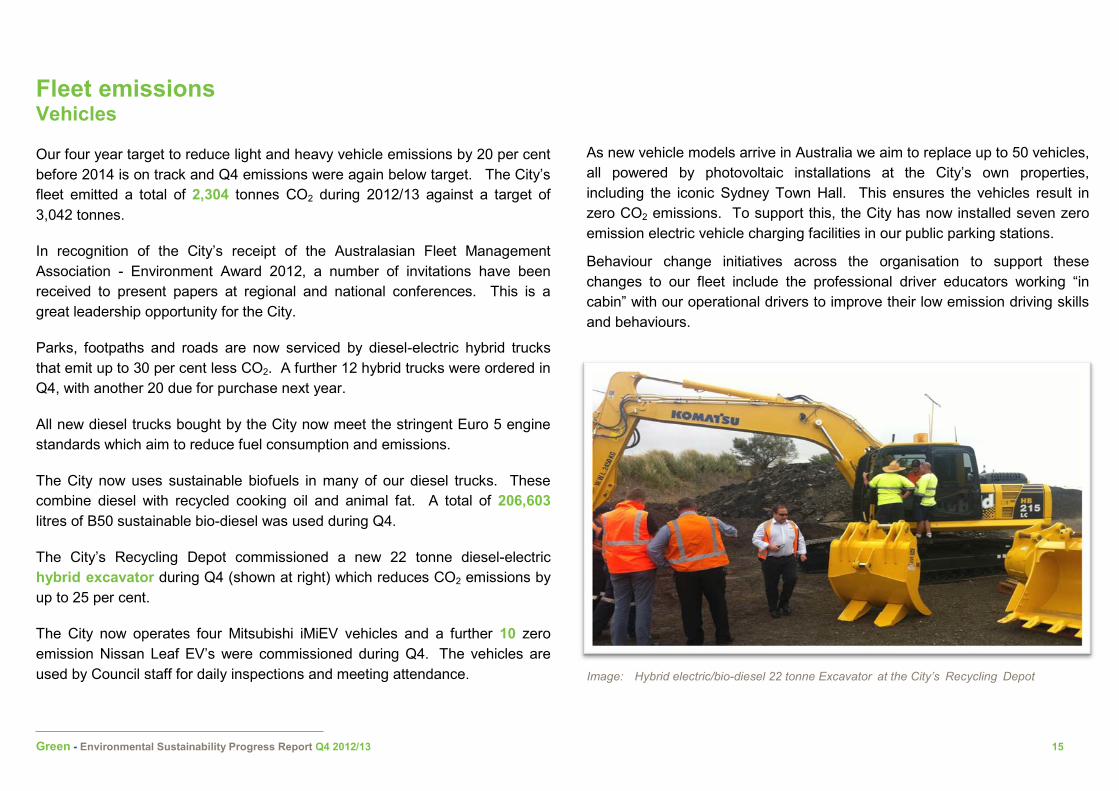
The City’s Recycling Depot commissioned a new 22 tonne diesel-electric hybrid excavator during Q4 (shown at right) which reduces CO2 emissions by up to 25 per cent.
The City now operates four Mitsubishi iMiEV vehicles and a further 10 zero emission Nissan Leaf EV’s were commissioned during Q4. The vehicles are used by Council staff for daily inspections and meeting attendance.
As new vehicle models arrive in Australia we aim to replace up to 50 vehicles, all powered by photovoltaic installations at the City’s own properties, including the iconic Sydney Town Hall. This ensures the vehicles result in zero CO2 emissions. To support this, the City has now installed seven zero emission electric vehicle charging facilities in our public parking stations.
Behaviour change initiatives across the organisation to support these changes to our fleet include the professional driver educators working “in cabin” with our operational drivers to improve their low emission driving skills and behaviours.
Image: Hybrid electric/bio-diesel 22 tonne Excavator at the City’s Recycling Depot
Green - Environmental Sustainability Progress Report Q4 2012/13 16
Staff travel plans City staff members are encouraged to walk or use public transport wherever possible when travelling around town to meetings, site visits and between City venues.
The City of Sydney Green Champions are assisting with an organisation wide project to help staff plan their travel using a simple Transport Hierarchy;
1. Active Transport (walking or cycling using the City’s own bike fleet)
2. Public Transport (buses and trains)
3. Drive Green (the City’s own fleet of low and zero emissions vehicles)
To support the Transport Hierarchy, we have established a pushbike fleet for use by staff in preference to walking or using fleet cars and taxis where longer distances are involved. There is a range of bikes suited to various operational requirements, including a cargo bike, some electric assist bikes and bikes with additional carrying capacity. Having electric vehicles as part of our fleet as well ensures that longer distances can still be travelled with zero local emissions. Staff members wanting to use the fleet are given detailed training and provided with appropriate personal protective equipment.
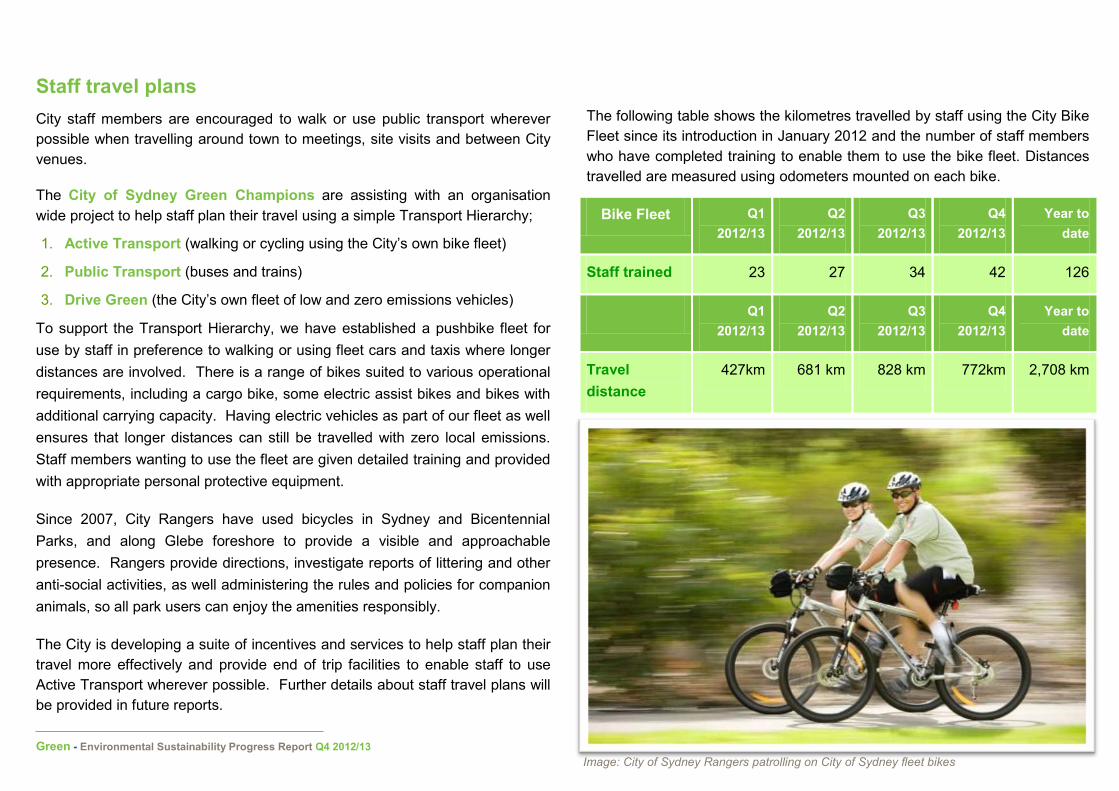
Since 2007, City Rangers have used bicycles in Sydney and Bicentennial Parks, and along Glebe foreshore to provide a visible and approachable presence. Rangers provide directions, investigate reports of littering and other anti-social activities, as well administering the rules and policies for companion animals, so all park users can enjoy the amenities responsibly.
The City is developing a suite of incentives and services to help staff plan their travel more effectively and provide end of trip facilities to enable staff to use Active Transport wherever possible. Further details about staff travel plans will be provided in future reports.
The following table shows the kilometres travelled by staff using the City Bike Fleet since its introduction in January 2012 and the number of staff members who have completed training to enable them to use the bike fleet. Distances travelled are measured using odometers mounted on each bike.
Bike Fleet Q1 2012/13
Q2 2012/13
Q3 2012/13
Q4 2012/13
Year to date
Staff trained 23 27 34 42 126
Q1 2012/13
Q2 2012/13
Q3 2012/13
Q4 2012/13
Year to date
Travel distance
427km 681 km 828 km 772km 2,708 km
Image: City of Sydney Rangers patrolling on City of Sydney fleet bikes
Green - Environmental Sustainability Progress Report Q4 2012/13 17
Water
Decentralised Water Master Plan The 2003–2010 droughts brought home the impacts of taking water for granted. The recent floods have also reminded us that Australia’s historic drought and flood cycles are predicted to become more intense with climate change.
The drought led to water restrictions and a growth in individual recycled water systems as Sydney tried to adapt to unpredictable and dramatic weather cycles. However, there was no integrated city wide strategy to mitigate or adapt to these events. It is imperative the city’s water supply is sustainable, drought-proofed and utilised to adapt to climate change.
The city has the oldest water supply and sewage infrastructure in Australia, and now is the time to rethink how we deliver the city’s drinking and non-drinking water supplies for the 21st century. In response, the City of Sydney is working to reduce water demand, implement sustainable water supply sources and improve stormwater quality.
Currently, we only drink two per cent of the drinking quality water we pump to our city. Even taking other drinking quality water demand uses into account, such as catering, showering and bathing, drinking water requirements accounts for no more than half our water consumption. The other 50 per cent is for nondrinking water uses such as toilet flushing, air conditioning cooling towers and irrigation of our parks and gardens.
To cope with the anticipated rise in population, growth in urban development, ageing infrastructure and drought associated with climate variability, it is critical that we reduce our reliance on mains water supply for non-drinking purposes. We can do this by improving water efficiency in buildings and our parks and gardens and by having a local recycled water source independent of and complimentary to the centralised mains water supply.
A consortium of consultants that includes GHD, the Institute for Sustainable Futures and P3iC have developed a draft Decentralised Water Master Plan (DWMP) for the City of Sydney. The draft report was placed on public exhibition in September 2012.
The master plan has identified actions and investments the City of Sydney can make to reduce potable water imported from the dams, increase the use of recycled water for non-potable use, and improve the quality of stormwater discharged to Sydney Harbour and Cooks River as climate change adaptation measures. This will make our city more self-sufficient and able to address climate change issues such as the urban heat island effect. It will also free up drinking water supply capacity, particularly in times of drought.
The Decentralised Water Master Plan provides a blueprint for:
1. Reducing 10 per cent of mains water demand (from 2006 levels) within the City of Sydney by 2030 through water efficiency measures
2. Reducing 25 per cent of mains water demand within the City of Sydney’s own buildings and operations by 2030
3. Replacing 10 per cent of 2030 mains water demand within the City of Sydney with recycled water by 2030 and lobbying NSW and federal governments to fund wastewater recycling projects to achieve 30 per cent water recycling across the City of Sydney to achieve the national wastewater recycling target for metropolitan cities
4. Reducing 50 per cent of sediments and suspended solids and 15 per cent of nutrients currently discharged into the waterways from stormwater run-off generated within the City of Sydney by 2030.
Green - Environmental Sustainability Progress Report Q4 2012/13 18
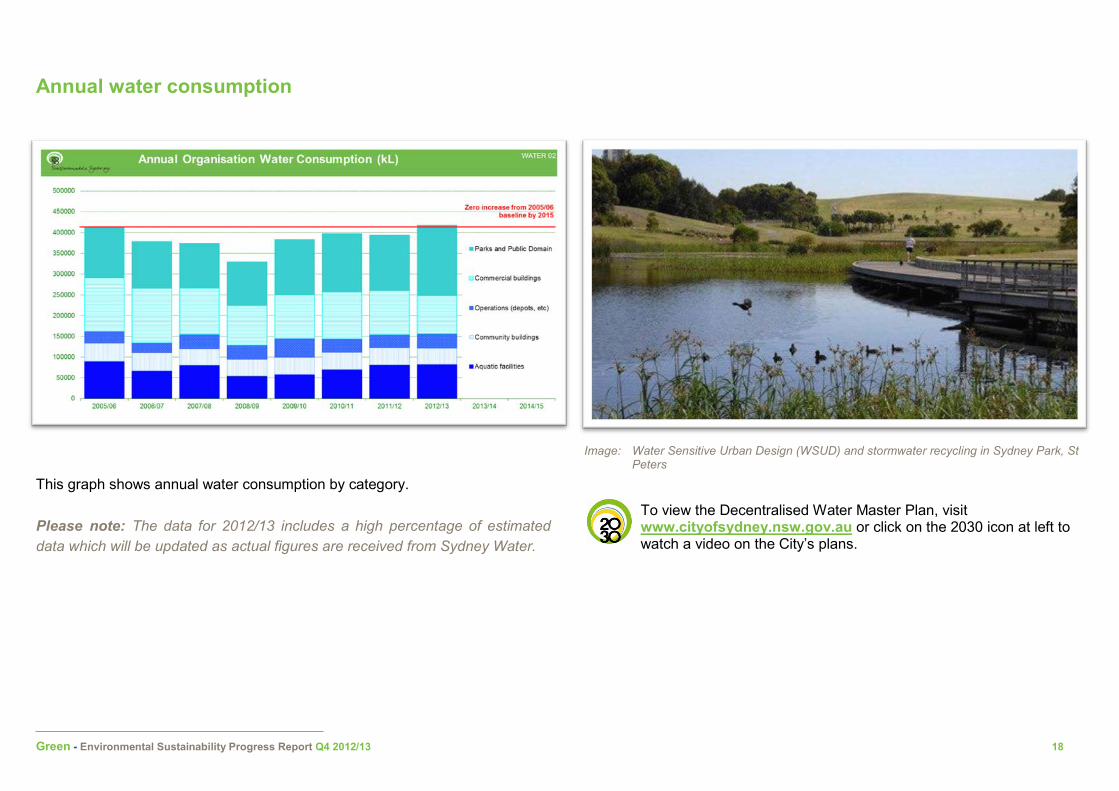
Annual water consumption This graph shows annual water consumption by category.
Please note: The data for 2012/13 includes a high percentage of estimated data which will be updated as actual figures are received from Sydney Water.
To view the Decentralised Water Master Plan, visit www.cityofsydney.nsw.gov.au or click on the 2030 icon at left to watch a video on the City’s plans.
Image: Water Sensitive Urban Design (WSUD) and stormwater recycling in Sydney Park, St Peters
Green - Environmental Sustainability Progress Report Q4 2012/13 19
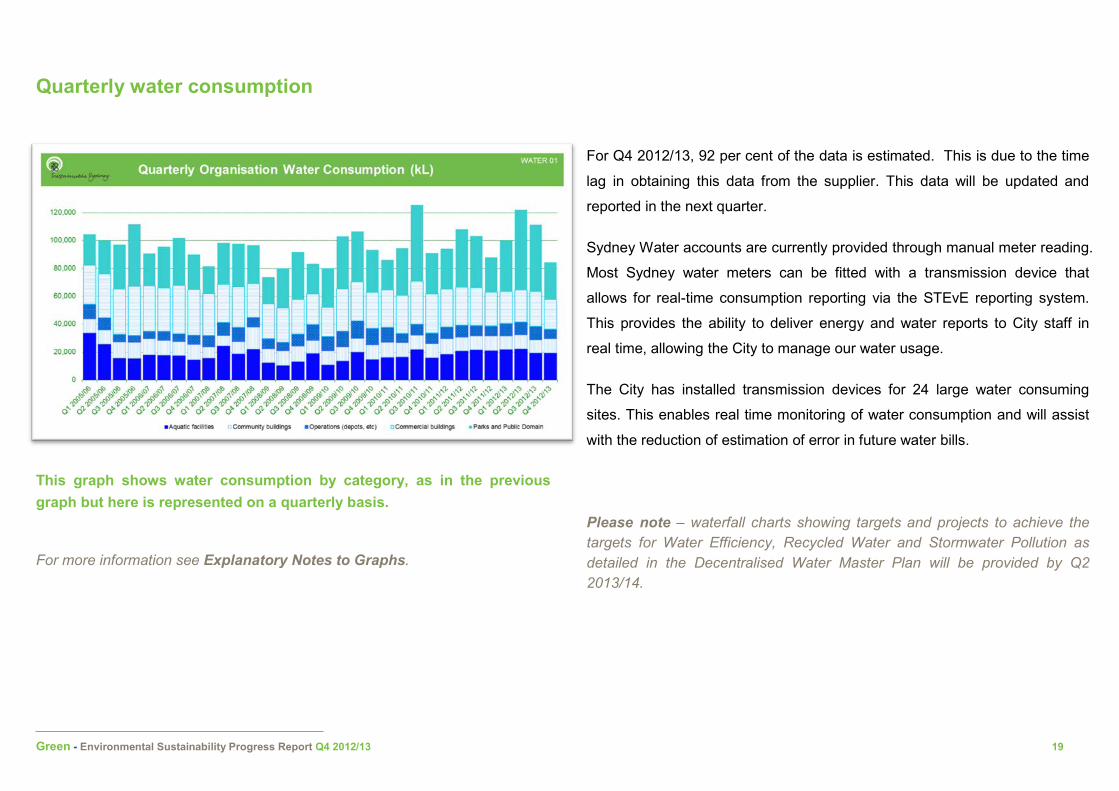
Quarterly water consumption
This graph shows water consumption by category, as in the previous graph but here is represented on a quarterly basis.
For more information see Explanatory Notes to Graphs.
For Q4 2012/13, 92 per cent of the data is estimated. This is due to the time
lag in obtaining this data from the supplier. This data will be updated and
reported in the next quarter.
Sydney Water accounts are currently provided through manual meter reading.
Most Sydney water meters can be fitted with a transmission device that
allows for real-time consumption reporting via the STEvE reporting system.
This provides the ability to deliver energy and water reports to City staff in
real time, allowing the City to manage our water usage.
The City has installed transmission devices for 24 large water consuming
sites. This enables real time monitoring of water consumption and will assist
with the reduction of estimation of error in future water bills.
Please note – waterfall charts showing targets and projects to achieve the targets for Water Efficiency, Recycled Water and Stormwater Pollution as detailed in the Decentralised Water Master Plan will be provided by Q2 2013/14.
Green - Environmental Sustainability Progress Report Q4 2012/13 20
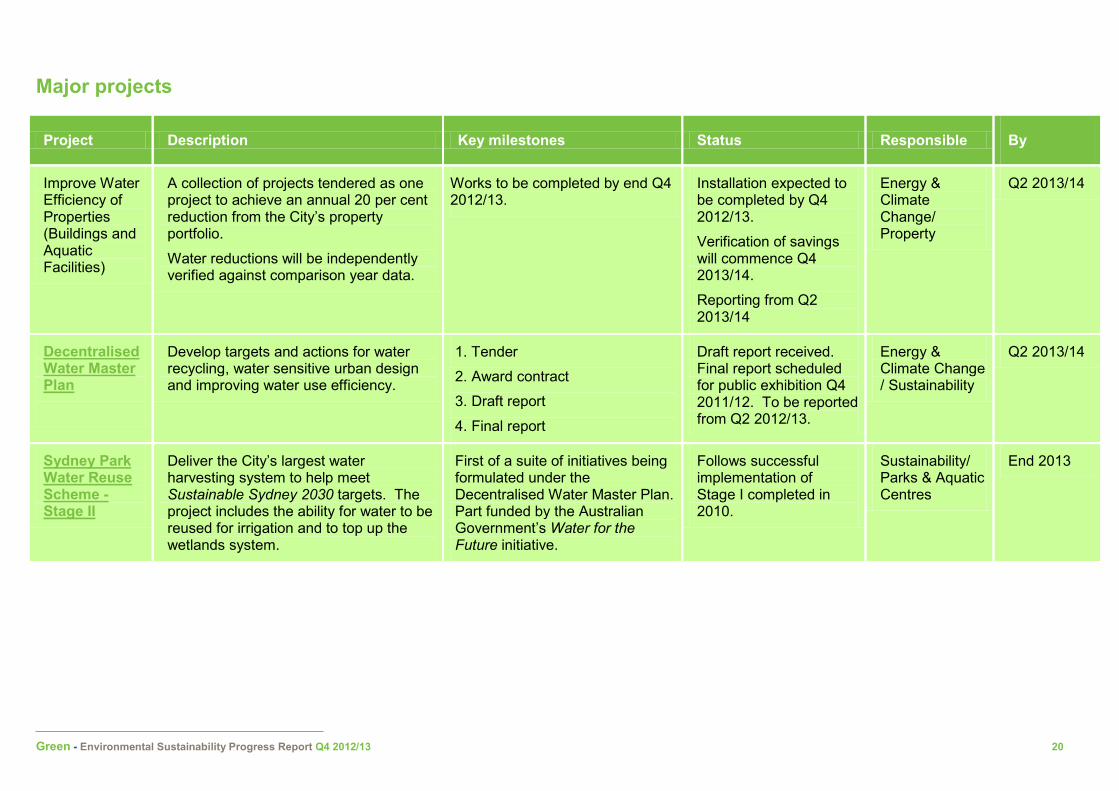
Major projects
Project Description Key milestones Status Responsible By
Improve Water Efficiency of Properties (Buildings and Aquatic Facilities)
A collection of projects tendered as one project to achieve an annual 20 per cent reduction from the City’s property portfolio.
Water reductions will be independently verified against comparison year data.
Works to be completed by end Q4 2012/13.
Installation expected to be completed by Q4 2012/13.
Verification of savings will commence Q4 2013/14.
Reporting from Q2 2013/14
Energy & Climate Change/ Property
Q2 2013/14
Decentralised Water Master Plan
Develop targets and actions for water recycling, water sensitive urban design and improving water use efficiency.
1. Tender
2. Award contract
3. Draft report
4. Final report
Draft report received. Final report scheduled for public exhibition Q4 2011/12. To be reported from Q2 2012/13.
Energy & Climate Change / Sustainability
Q2 2013/14
Sydney Park Water Reuse Scheme - Stage II
Deliver the City’s largest water harvesting system to help meet Sustainable Sydney 2030 targets. The project includes the ability for water to be reused for irrigation and to top up the wetlands system.
First of a suite of initiatives being formulated under the Decentralised Water Master Plan. Part funded by the Australian Government’s Water for the Future initiative.
Follows successful implementation of Stage I completed in 2010.
Green - Environmental Sustainability Progress Report Q4 2012/13 21
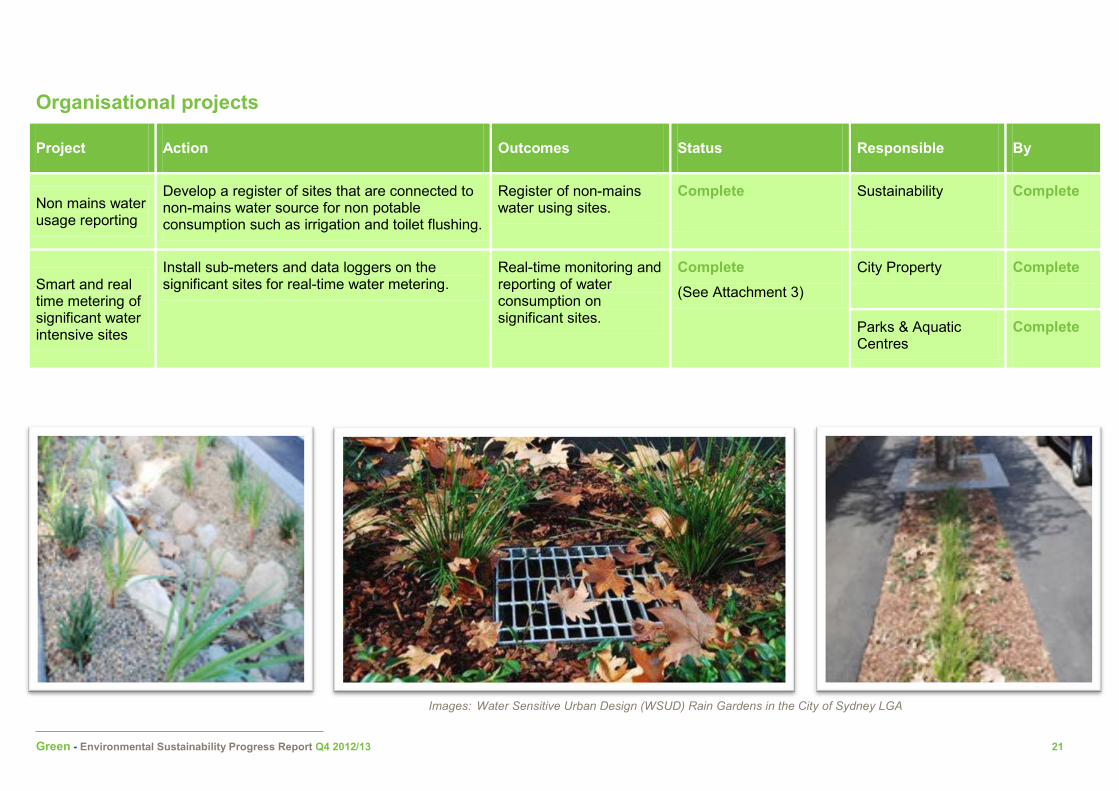
Organisational projects
Project Action Outcomes Status Responsible By
Non mains water usage reporting
Develop a register of sites that are connected to non-mains water source for non potable consumption such as irrigation and toilet flushing.
Register of non-mains water using sites.
Complete
Sustainability
Complete
Smart and real time metering of significant water intensive sites
Install sub-meters and data loggers on the significant sites for real-time water metering.
Real-time monitoring and reporting of water consumption on significant sites.
Complete (See Attachment 3)
City Property Complete
Parks & Aquatic Centres
Complete
Images: Water Sensitive Urban Design (WSUD) Rain Gardens in the City of Sydney LGA
Green - Environmental Sustainability Progress Report Q4 2012/13 22
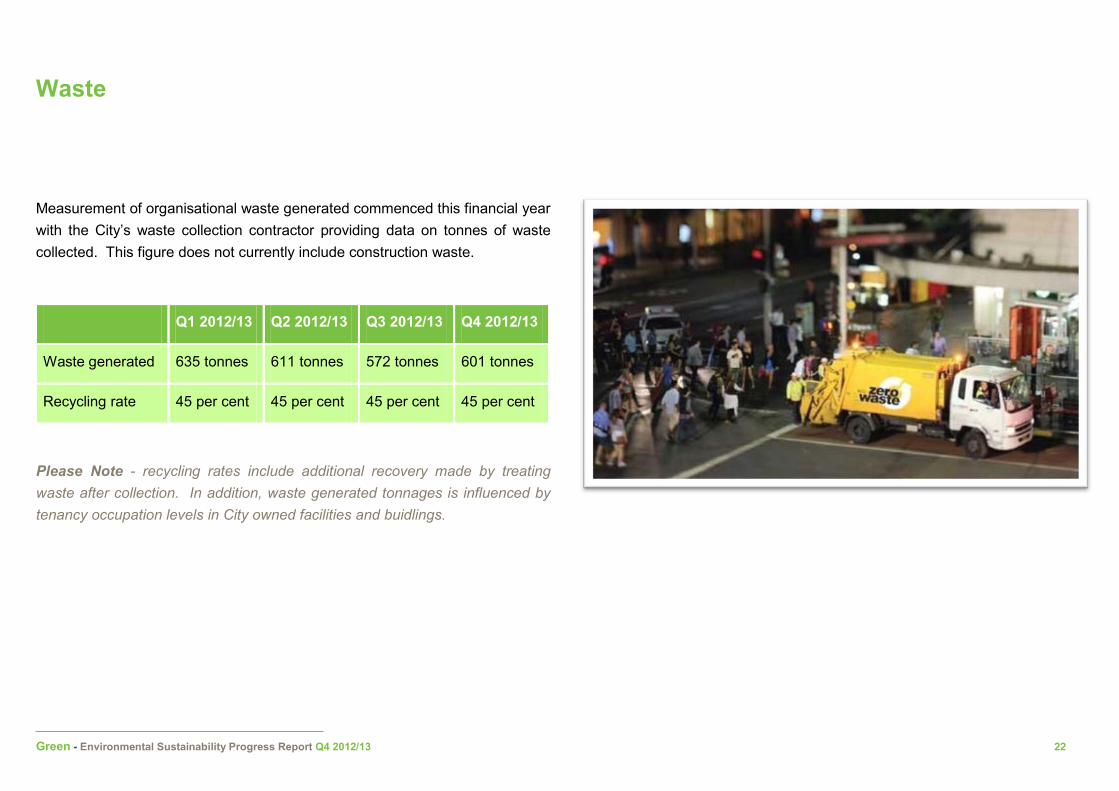
Waste
Measurement of organisational waste generated commenced this financial year with the City’s waste collection contractor providing data on tonnes of waste collected. This figure does not currently include construction waste.
Recycling rate 45 per cent 45 per cent 45 per cent 45 per cent
Please Note - recycling rates include additional recovery made by treating waste after collection. In addition, waste generated tonnages is influenced by tenancy occupation levels in City owned facilities and buidlings.
Green - Environmental Sustainability Progress Report Q4 2012/13 23
Sustainable procurement The City of Sydney is committed to doing business with ethical and socially responsible suppliers. We recognise that by practicing sustainable procurement we can significantly reduce our environmental impact, encourage the development of more sustainable and ethical goods and services and deliver other economic and social benefits for the community.
The City sees our suppliers as partners in our sustainability program. We take great care in selecting the companies who supply us with products and services, and expect each of them to operate to internationally, nationally and locally recognised standards and appropriate codes of practice.
The City is committed to working with our suppliers to find greener, more cost effective products for use in our many projects including; the construction of roads and community buildings, in Public Domain Landscaping and Parks (page 29), supply of luminaires for our LED Lighting (page 12), new technologies used as part of our Building Energy & Water Efficiency Retrofits (page 13) for use at our many Events (page 24) and by our administrative staff.
The Eora Journey is a significant part of the Sustainable Sydney 2030 vision. Economic development for our Aboriginal and Torres Strait Islander community is an essential component of this. The City is committed to supporting Aboriginal and Torres Strait Islander business suppliers and our work has been acknowledged by Supply Nation, a membership body dedicated to growing diversity within the supply chain.
Supply Nation’s goal is to connect Australian corporate and government organisations with Indigenous business suppliers who are already achieving success or have the potential to develop into vibrant, vital businesses.
Supply Nation is funded by the Australian Government Department of Education, Employment and Workplace Relations (DEEWR).
An analysis of our supply chain commenced in Q4 2012/13 with results anticipated early in 2013/14. This analysis will provide a number of recommendations to improve suppler performance and awareness. The focus is on working with suppliers to achieve environmental, social and financial improvements in our supply chain.
We are implementing changes across the organisation, many with the assistance of the City of Sydney Green Champions, to ensure our procurement processes follow Best Practice. We give our staff training to help them make sustainably sound procurement choices and have a range of Policies and Guidelines available to help them make informed choices and ensure that the City is “showing by doing”. A cross organisational Sustainable Procurement Working Group has been established by Procurement and Sustainability staff to investigate ways to make continuous improvements to our processes and to share innovations and learnings.
Green - Environmental Sustainability Progress Report Q4 2012/13 24
Sustainable event management The City runs many events each year to celebrate the diverse cultural, sporting and recreational aspects of Sydney. These include both small events and larger events such as Sydney New Year’s Eve and Chinese New Year.
We recognise the importance of a balanced approach to event management which takes into account the city's economy, ecology, society and culture. Our goal is to reduce the impact of events we manage and approve on the environment. The City’s Sustainable Event Management Policy and Guidelines encourage, and in some cases require, that events run by the City:
• minimise waste generation
• maximise recycling
• minimise energy consumption
• maximise use of renewable energy
• minimise water consumption
• conserve bio-diversity
• minimise impacts on climate change and
• promote principles of sustainability.
Event organisers are asked to make sure; there are no petrol generators on floats, that food stalls provide recycled cutlery and containers, that waste is recycled at all events and waste products from food stalls is disposed of safely.
All major events run by the City of Sydney include a Sustainable Sydney 2030 project, many of which are related to environmental sustainability. For example, at the 2011 Christmas Village concerts, some Christmas decorations were powered by bicycle.
Our Events team do all they can to incorporate environmental considerations into the events we run, including using LED lighting, sustainable fuels in generators and waterless urinals where possible.
We have a range of Policies and Guidelines available to help our staff make informed choices and ensure that the City is “showing by doing”. To that end, a cross organisational Sustainable Events Management Working Group has been established by Events and Sustainability staff to investigate ways to make continuous improvements to our processes and to share innovations and learnings.
The working group is also investigating aligning the existing Sustainable Event Management Guidelines with the new International Standard ISO:20121 for Sustainable Events Management.
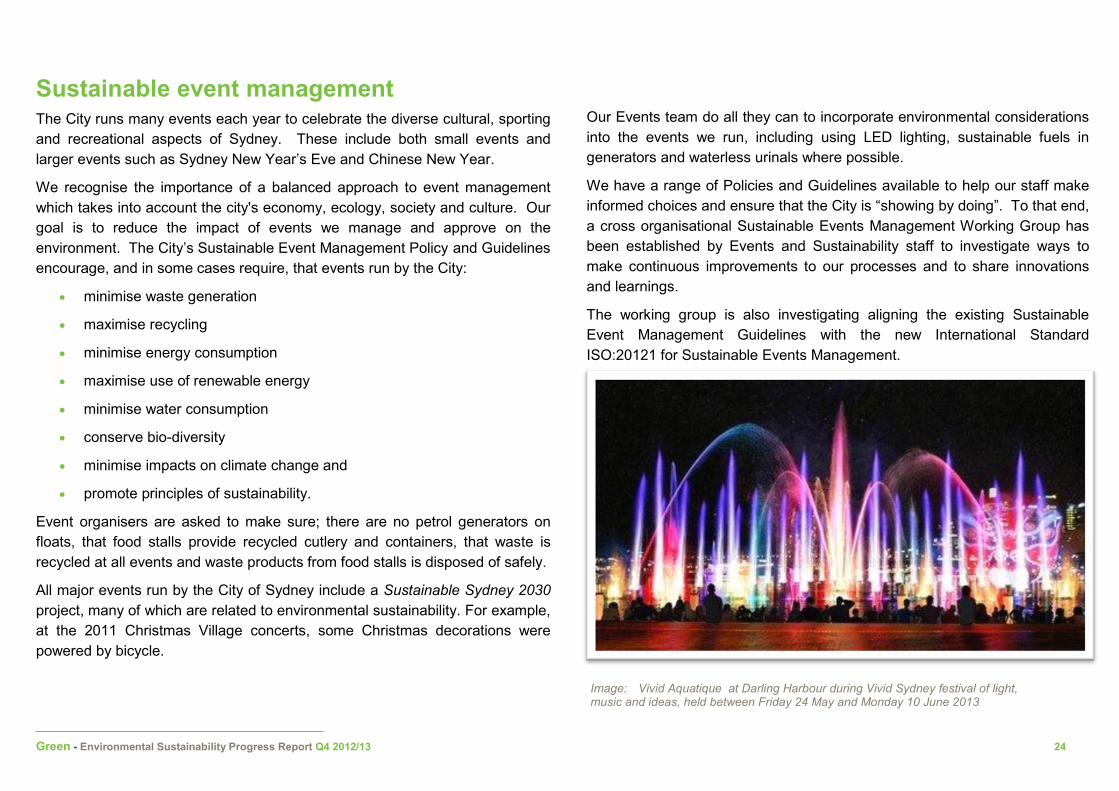
Image: Vivid Aquatique at Darling Harbour during Vivid Sydney festival of light, music and ideas, held between Friday 24 May and Monday 10 June 2013
Green - Environmental Sustainability Progress Report Q4 2012/13 25
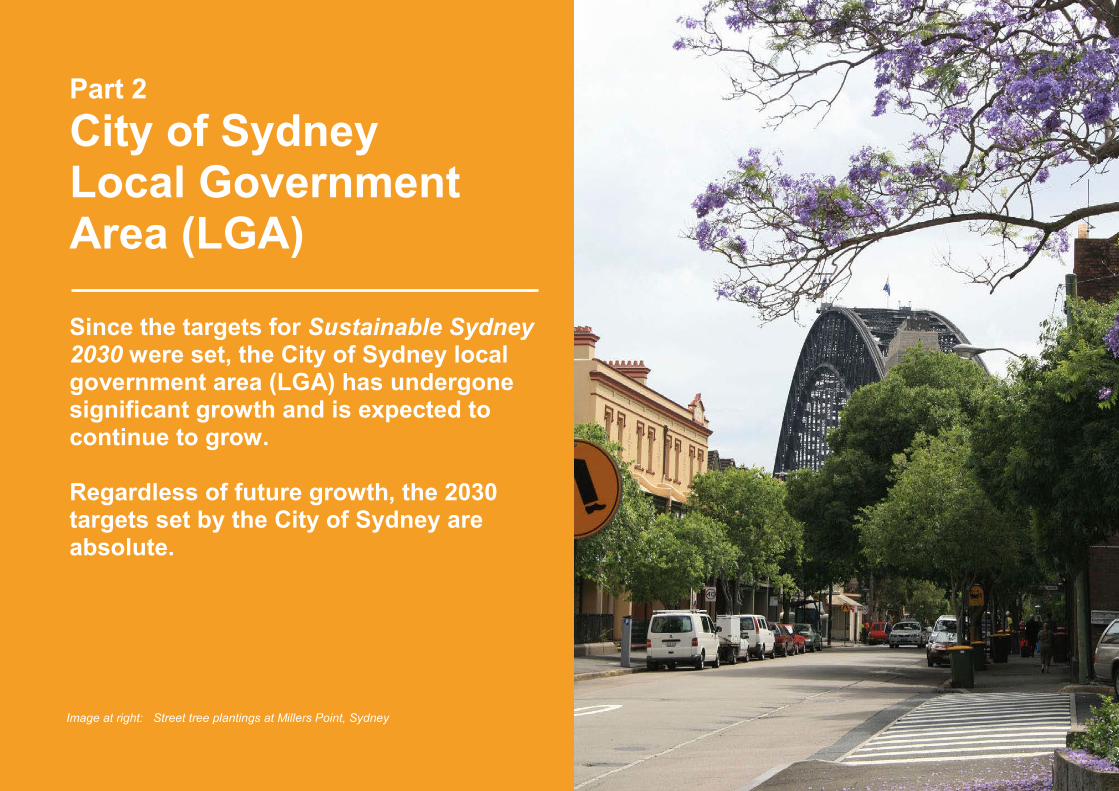
Part 2 City of Sydney Local Government Area (LGA) Since the targets for Sustainable Sydney 2030 were set, the City of Sydney local government area (LGA) has undergone significant growth and is expected to continue to grow. Regardless of future growth, the 2030 targets set by the City of Sydney are absolute. Image at right: Street tree plantings at Millers Point, Sydney
Green - Environmental Sustainability Progress Report Q4 2012/13 26
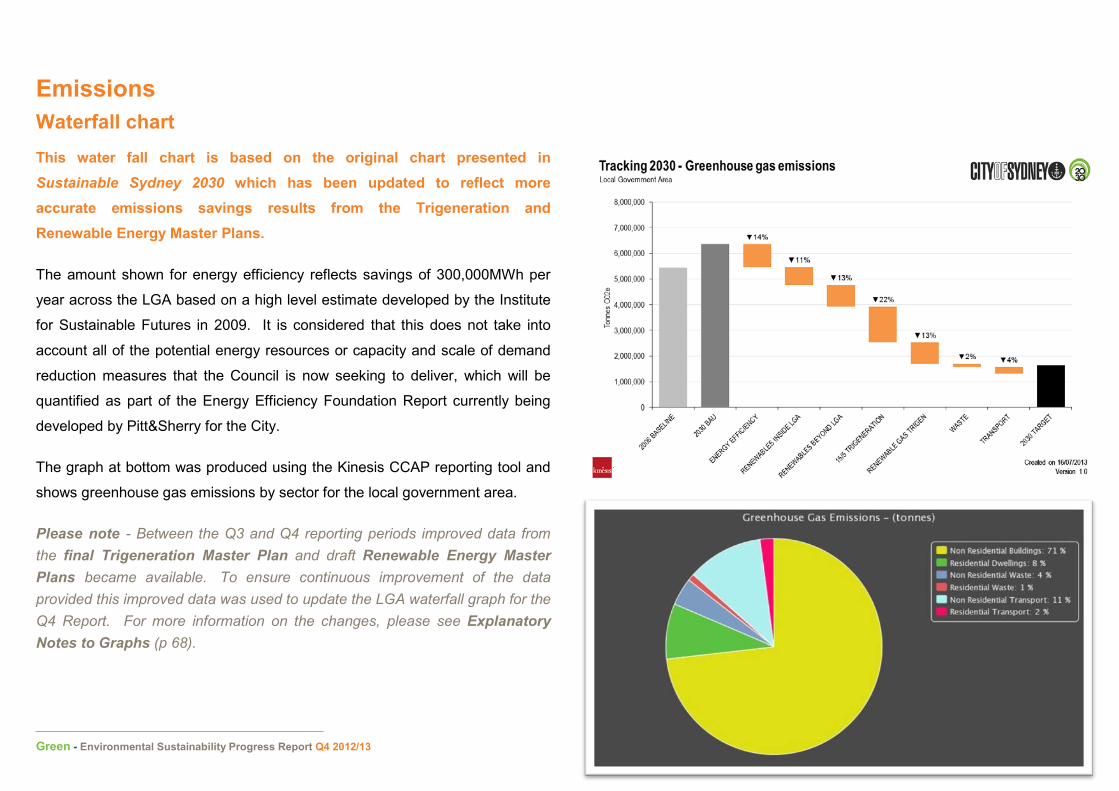
Emissions Waterfall chart This water fall chart is based on the original chart presented in Sustainable Sydney 2030 which has been updated to reflect more accurate emissions savings results from the Trigeneration and Renewable Energy Master Plans.
The amount shown for energy efficiency reflects savings of 300,000MWh per
year across the LGA based on a high level estimate developed by the Institute
for Sustainable Futures in 2009. It is considered that this does not take into
account all of the potential energy resources or capacity and scale of demand
reduction measures that the Council is now seeking to deliver, which will be
quantified as part of the Energy Efficiency Foundation Report currently being
developed by Pitt&Sherry for the City.
The graph at bottom was produced using the Kinesis CCAP reporting tool and
shows greenhouse gas emissions by sector for the local government area.
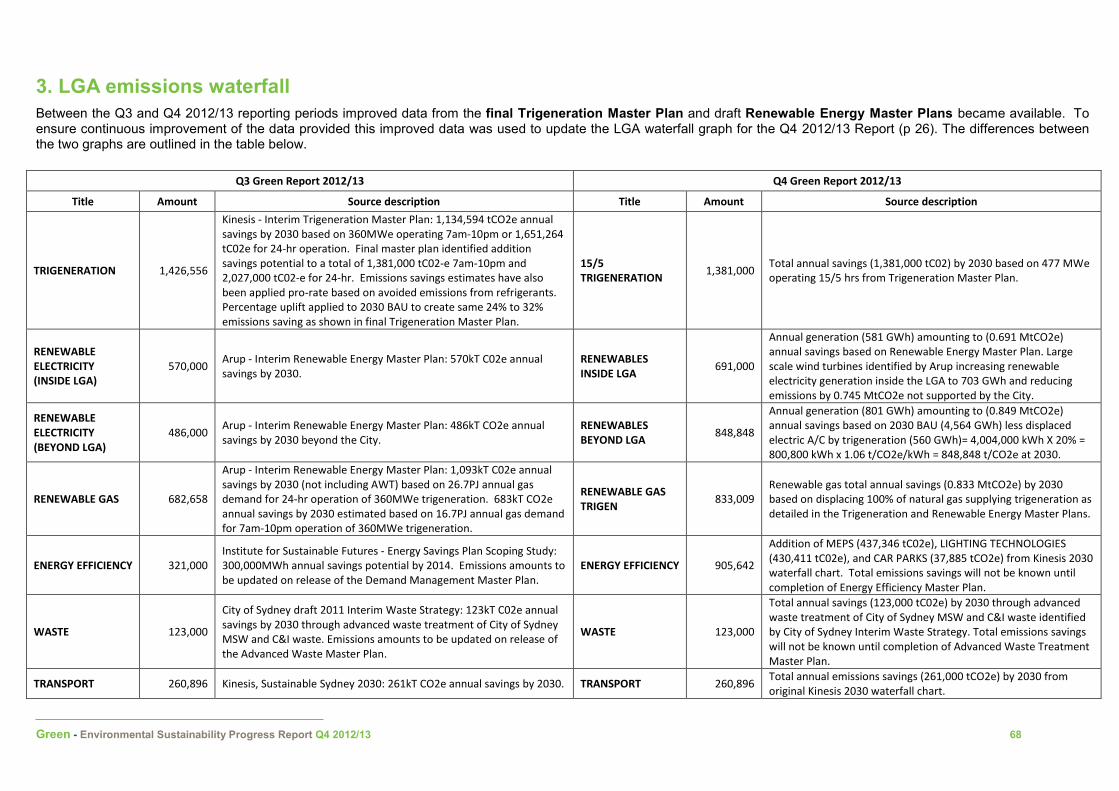
Please note - Between the Q3 and Q4 reporting periods improved data from the final Trigeneration Master Plan and draft Renewable Energy Master Plans became available. To ensure continuous improvement of the data provided this improved data was used to update the LGA waterfall graph for the Q4 Report. For more information on the changes, please see Explanatory Notes to Graphs (p 68).
Green - Environmental Sustainability Progress Report Q4 2012/13 27
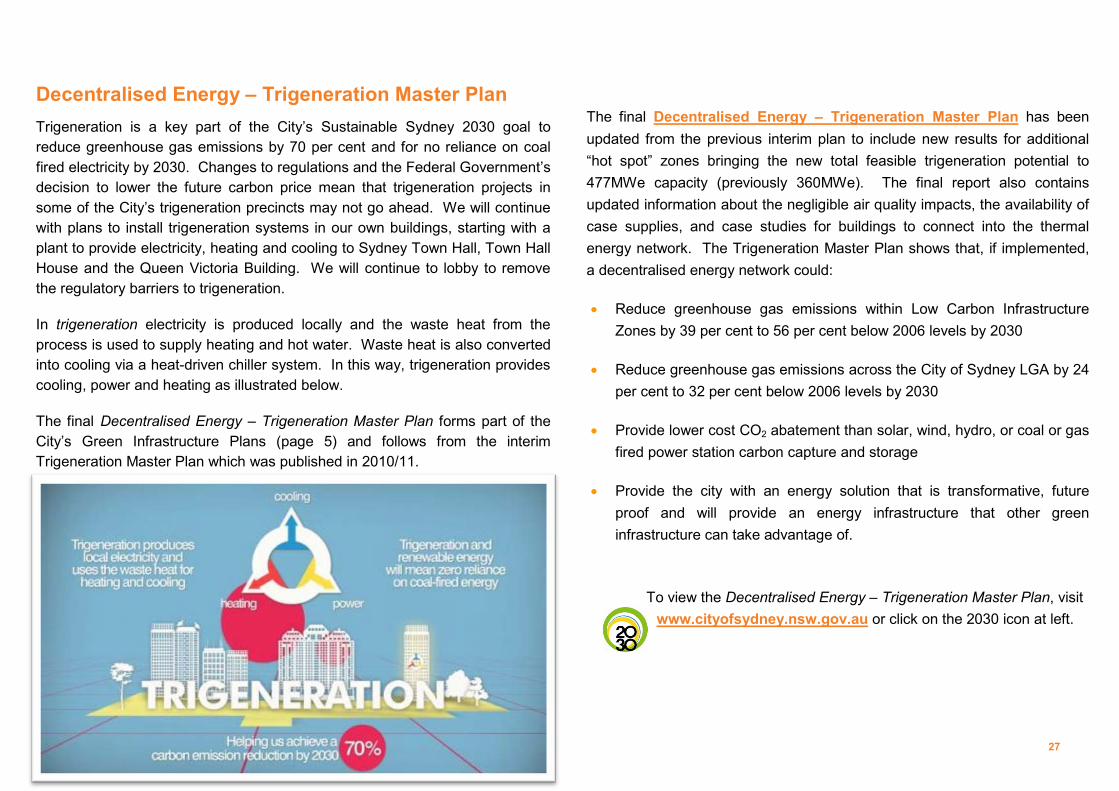
Decentralised Energy – Trigeneration Master Plan Trigeneration is a key part of the City’s Sustainable Sydney 2030 goal to reduce greenhouse gas emissions by 70 per cent and for no reliance on coal fired electricity by 2030. Changes to regulations and the Federal Government’s decision to lower the future carbon price mean that trigeneration projects in some of the City’s trigeneration precincts may not go ahead. We will continue with plans to install trigeneration systems in our own buildings, starting with a plant to provide electricity, heating and cooling to Sydney Town Hall, Town Hall House and the Queen Victoria Building. We will continue to lobby to remove the regulatory barriers to trigeneration.
In trigeneration electricity is produced locally and the waste heat from the process is used to supply heating and hot water. Waste heat is also converted into cooling via a heat-driven chiller system. In this way, trigeneration provides cooling, power and heating as illustrated below.
The final Decentralised Energy – Trigeneration Master Plan forms part of the City’s Green Infrastructure Plans (page 5) and follows from the interim Trigeneration Master Plan which was published in 2010/11.
The final Decentralised Energy – Trigeneration Master Plan has been updated from the previous interim plan to include new results for additional “hot spot” zones bringing the new total feasible trigeneration potential to 477MWe capacity (previously 360MWe). The final report also contains updated information about the negligible air quality impacts, the availability of case supplies, and case studies for buildings to connect into the thermal energy network. The Trigeneration Master Plan shows that, if implemented, a decentralised energy network could:
• Reduce greenhouse gas emissions within Low Carbon Infrastructure Zones by 39 per cent to 56 per cent below 2006 levels by 2030
• Reduce greenhouse gas emissions across the City of Sydney LGA by 24 per cent to 32 per cent below 2006 levels by 2030
• Provide lower cost CO2 abatement than solar, wind, hydro, or coal or gas fired power station carbon capture and storage
• Provide the city with an energy solution that is transformative, future proof and will provide an energy infrastructure that other green infrastructure can take advantage of.
To view the Decentralised Energy – Trigeneration Master Plan, visit www.cityofsydney.nsw.gov.au or click on the 2030 icon at left.
Green - Environmental Sustainability Progress Report Q4 2012/13 29
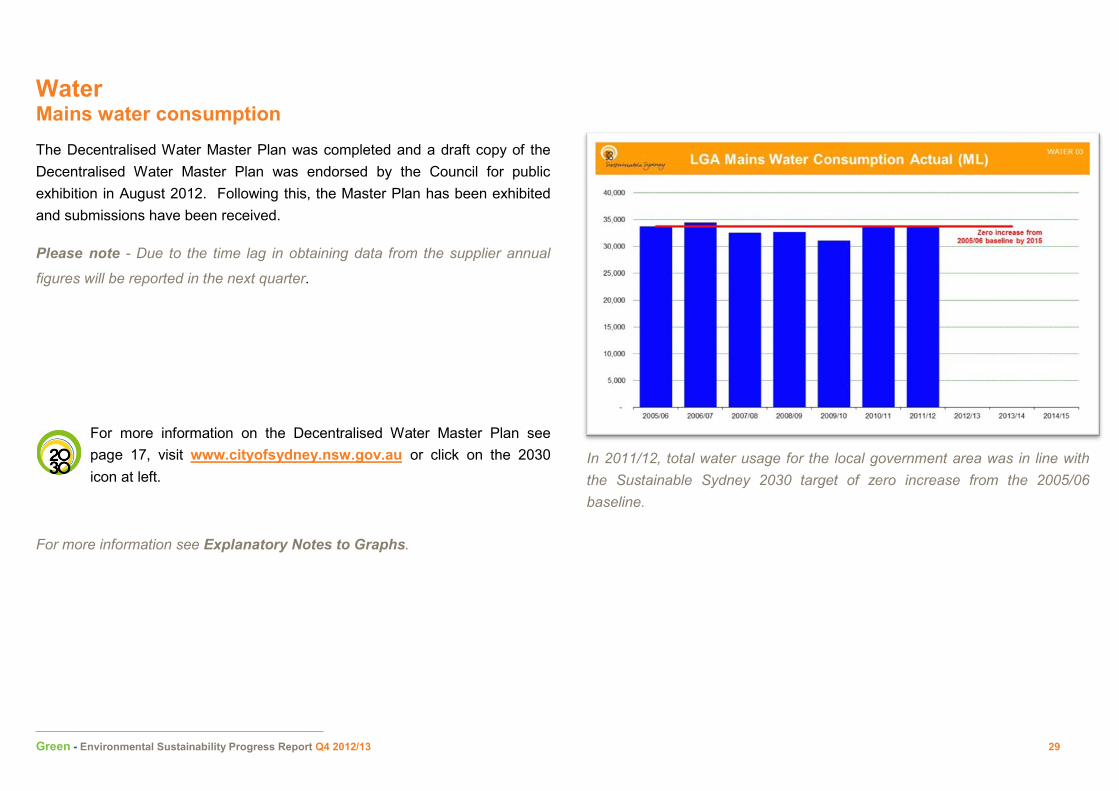
Water Mains water consumption The Decentralised Water Master Plan was completed and a draft copy of the Decentralised Water Master Plan was endorsed by the Council for public exhibition in August 2012. Following this, the Master Plan has been exhibited and submissions have been received.
Please note - Due to the time lag in obtaining data from the supplier annual
figures will be reported in the next quarter.
For more information on the Decentralised Water Master Plan see page 17, visit www.cityofsydney.nsw.gov.au or click on the 2030 icon at left.
For more information see Explanatory Notes to Graphs.
In 2011/12, total water usage for the local government area was in line with the Sustainable Sydney 2030 target of zero increase from the 2005/06 baseline.
Green - Environmental Sustainability Progress Report Q4 2012/13 30
Waste
Highlights this quarter
This quarter the City achieved a Resource Recovery Recycling Rate of 65.17
per cent, with an annual average of 64 per cent.
At the City’s electronic waste (e-waste) drop off events this quarter, 491
residents dropped off 15.56 tonnes of electronic waste for recycling. This
brings the annual total to 2,162 residents and 72.23 tonnes of e-waste.
This quarter the City’s Draft Waste Policy was endorsed for public exhibition.
The policy provides residents and businesses with clear and concise
information about the City’s waste services, and about their responsibilities.
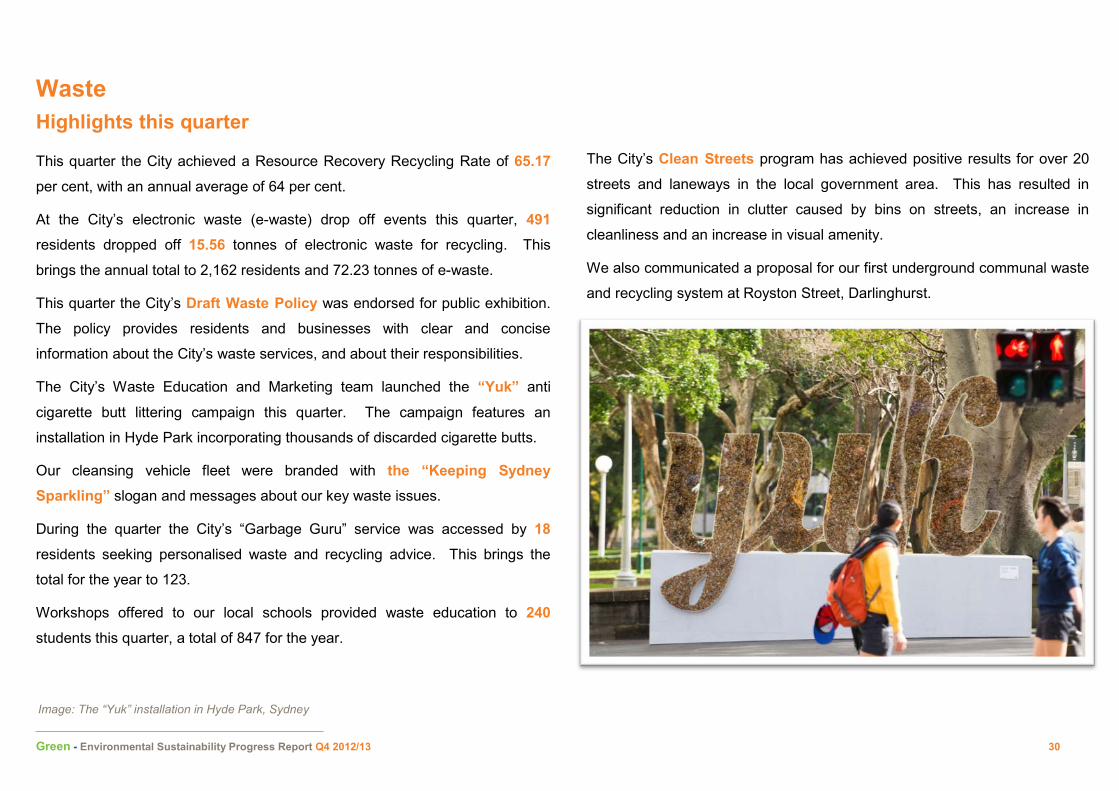
The City’s Waste Education and Marketing team launched the “Yuk” anti
cigarette butt littering campaign this quarter. The campaign features an
installation in Hyde Park incorporating thousands of discarded cigarette butts.
Our cleansing vehicle fleet were branded with the “Keeping Sydney Sparkling” slogan and messages about our key waste issues.
During the quarter the City’s “Garbage Guru” service was accessed by 18
residents seeking personalised waste and recycling advice. This brings the
total for the year to 123.
Workshops offered to our local schools provided waste education to 240
students this quarter, a total of 847 for the year.
The City’s Clean Streets program has achieved positive results for over 20
streets and laneways in the local government area. This has resulted in
significant reduction in clutter caused by bins on streets, an increase in
cleanliness and an increase in visual amenity.
We also communicated a proposal for our first underground communal waste
and recycling system at Royston Street, Darlinghurst.
Image: The “Yuk” installation in Hyde Park, Sydney
Green - Environmental Sustainability Progress Report Q4 2012/13 31
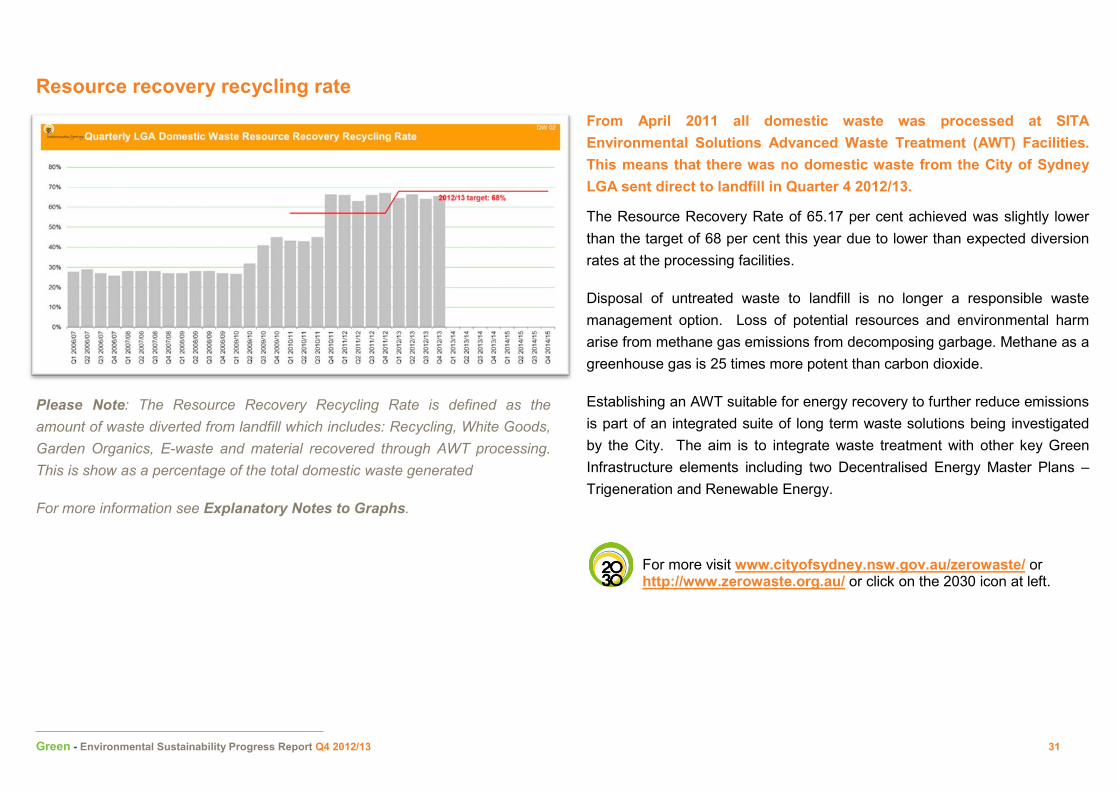
Resource recovery recycling rate
Please Note: The Resource Recovery Recycling Rate is defined as the amount of waste diverted from landfill which includes: Recycling, White Goods, Garden Organics, E-waste and material recovered through AWT processing. This is show as a percentage of the total domestic waste generated
For more information see Explanatory Notes to Graphs.
From April 2011 all domestic waste was processed at SITA Environmental Solutions Advanced Waste Treatment (AWT) Facilities. This means that there was no domestic waste from the City of Sydney LGA sent direct to landfill in Quarter 4 2012/13.
The Resource Recovery Rate of 65.17 per cent achieved was slightly lower than the target of 68 per cent this year due to lower than expected diversion rates at the processing facilities.
Disposal of untreated waste to landfill is no longer a responsible waste management option. Loss of potential resources and environmental harm arise from methane gas emissions from decomposing garbage. Methane as a greenhouse gas is 25 times more potent than carbon dioxide.
Establishing an AWT suitable for energy recovery to further reduce emissions is part of an integrated suite of long term waste solutions being investigated by the City. The aim is to integrate waste treatment with other key Green Infrastructure elements including two Decentralised Energy Master Plans – Trigeneration and Renewable Energy.
For more visit www.cityofsydney.nsw.gov.au/zerowaste/ or http://www.zerowaste.org.au/ or click on the 2030 icon at left.
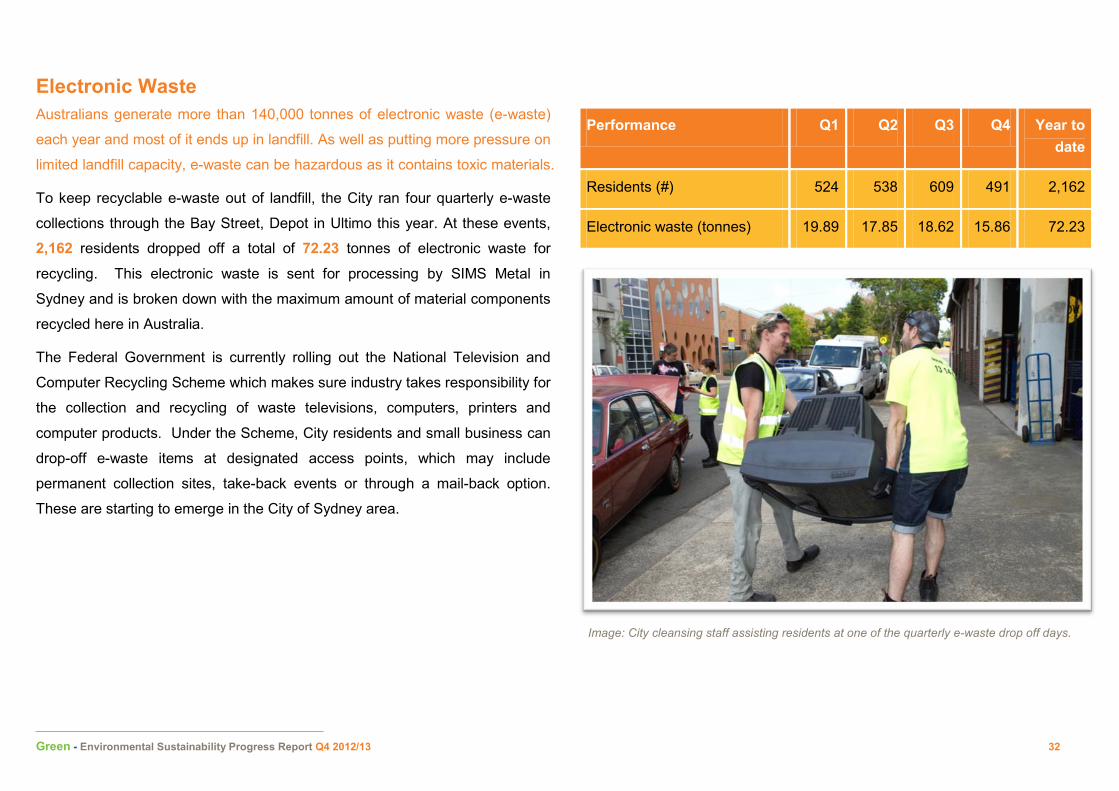
Image: City cleansing staff assisting residents at one of the quarterly e-waste drop off days.
Green - Environmental Sustainability Progress Report Q4 2012/13 33
Waste strategy development
Draft Waste Policy
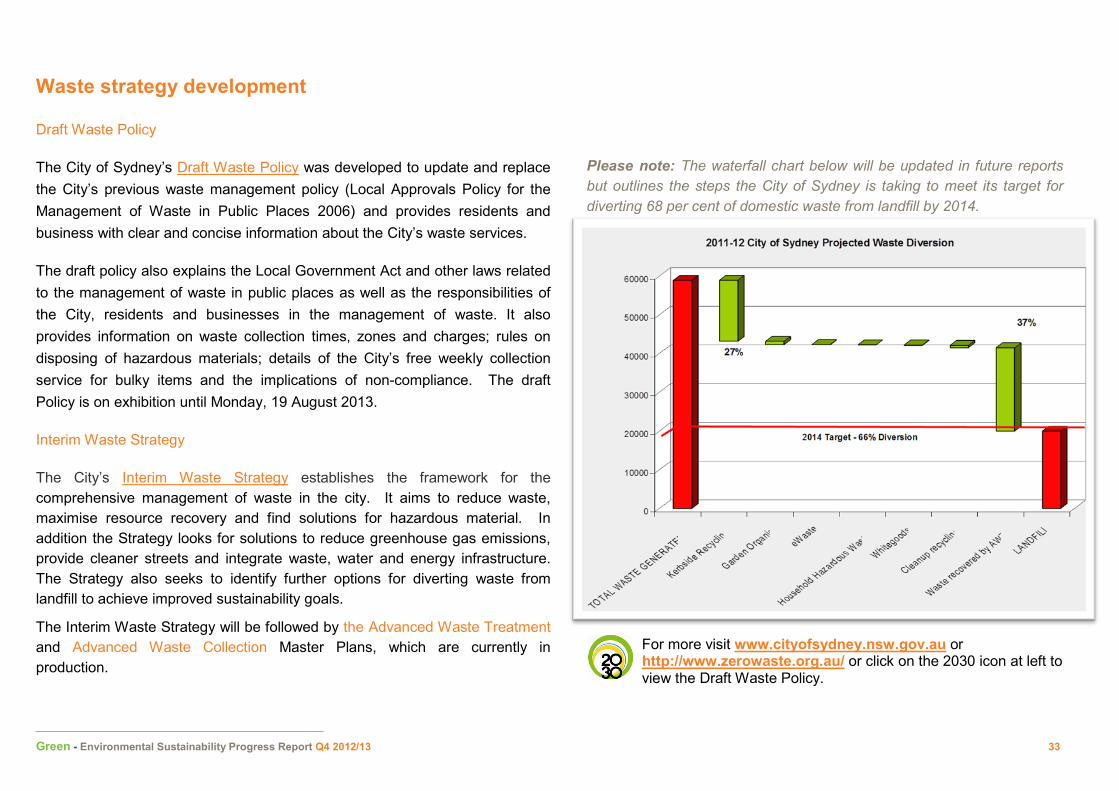
The City of Sydney’s Draft Waste Policy was developed to update and replace the City’s previous waste management policy (Local Approvals Policy for the Management of Waste in Public Places 2006) and provides residents and business with clear and concise information about the City’s waste services.
The draft policy also explains the Local Government Act and other laws related to the management of waste in public places as well as the responsibilities of the City, residents and businesses in the management of waste. It also provides information on waste collection times, zones and charges; rules on disposing of hazardous materials; details of the City’s free weekly collection service for bulky items and the implications of non-compliance. The draft Policy is on exhibition until Monday, 19 August 2013.
Interim Waste Strategy
The City’s Interim Waste Strategy establishes the framework for the comprehensive management of waste in the city. It aims to reduce waste, maximise resource recovery and find solutions for hazardous material. In addition the Strategy looks for solutions to reduce greenhouse gas emissions, provide cleaner streets and integrate waste, water and energy infrastructure. The Strategy also seeks to identify further options for diverting waste from landfill to achieve improved sustainability goals.
The Interim Waste Strategy will be followed by the Advanced Waste Treatment and Advanced Waste Collection Master Plans, which are currently in production.
Please note: The waterfall chart below will be updated in future reports but outlines the steps the City of Sydney is taking to meet its target for diverting 68 per cent of domestic waste from landfill by 2014.
For more visit www.cityofsydney.nsw.gov.au or http://www.zerowaste.org.au/ or click on the 2030 icon at left to view the Draft Waste Policy.
Green - Environmental Sustainability Progress Report Q4 2012/13 34
Clean streets program
The City’s Clean Streets program aims to improve cleanliness of the City’s
streets and laneways, reduce clutter and to increase pride of place for the
community. There are dozens of laneways across the City that pose consistent
challenges to these objectives including bins being stored on the street
permanently, illegal dumping, litter and graffiti.
This year the Clean Streets program has achieved positive results for over 20
streets and laneways, including significant reduction in clutter, increase in
cleanliness and visual amenity.
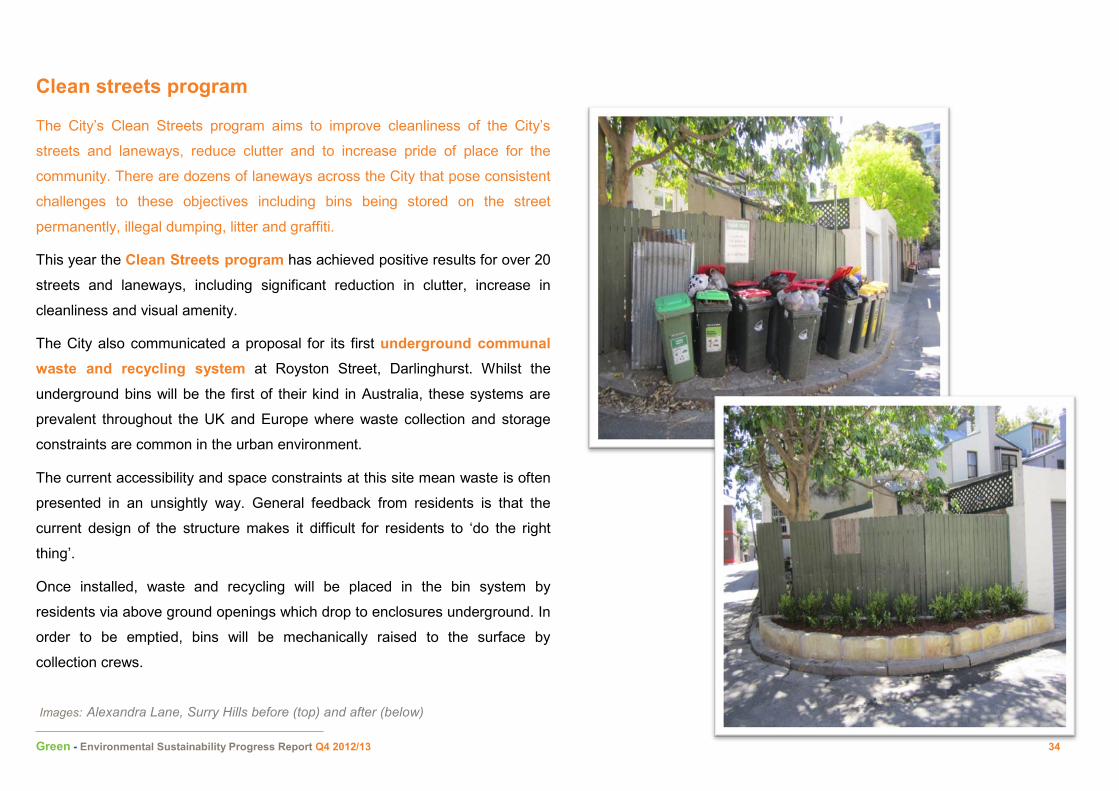
The City also communicated a proposal for its first underground communal waste and recycling system at Royston Street, Darlinghurst. Whilst the
underground bins will be the first of their kind in Australia, these systems are
prevalent throughout the UK and Europe where waste collection and storage
constraints are common in the urban environment.
The current accessibility and space constraints at this site mean waste is often
presented in an unsightly way. General feedback from residents is that the
current design of the structure makes it difficult for residents to ‘do the right
thing’.
Once installed, waste and recycling will be placed in the bin system by
residents via above ground openings which drop to enclosures underground. In
order to be emptied, bins will be mechanically raised to the surface by
collection crews.
Images: Alexandra Lane, Surry Hills before (top) and after (below)
Green - Environmental Sustainability Progress Report Q4 2012/13 35
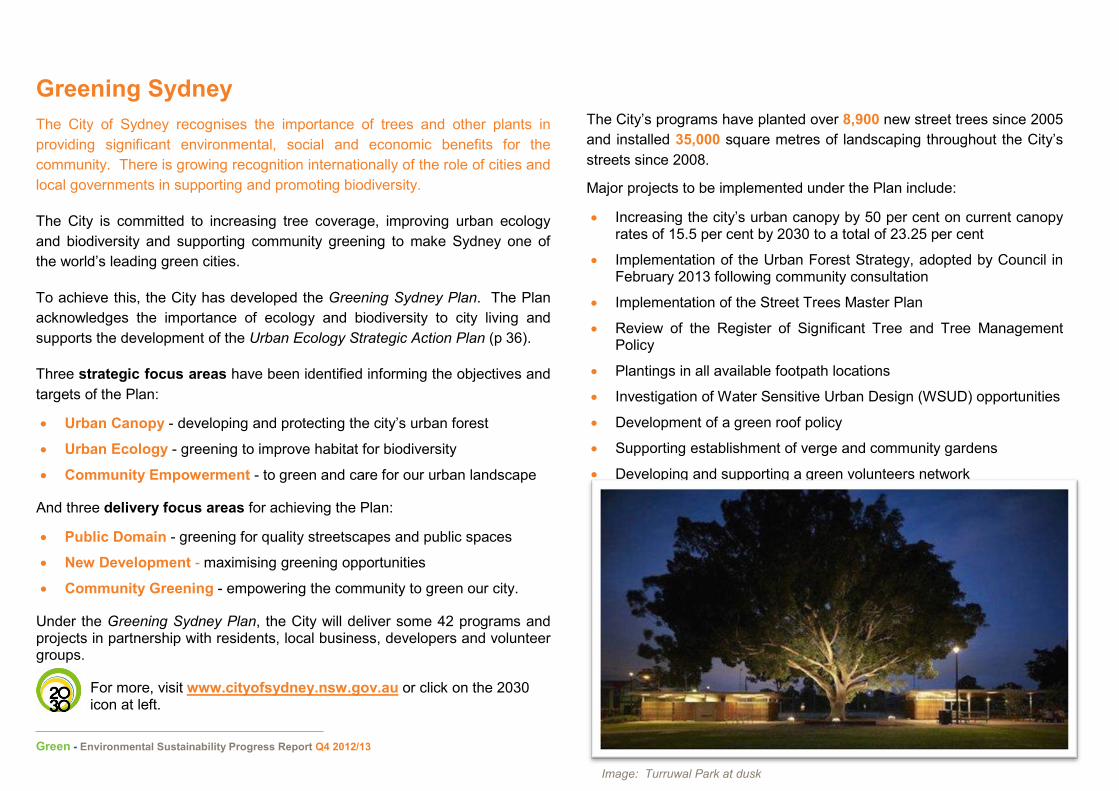
Greening Sydney The City of Sydney recognises the importance of trees and other plants in providing significant environmental, social and economic benefits for the community. There is growing recognition internationally of the role of cities and local governments in supporting and promoting biodiversity.
The City is committed to increasing tree coverage, improving urban ecology and biodiversity and supporting community greening to make Sydney one of the world’s leading green cities.
To achieve this, the City has developed the Greening Sydney Plan. The Plan acknowledges the importance of ecology and biodiversity to city living and supports the development of the Urban Ecology Strategic Action Plan (p 36).
Three strategic focus areas have been identified informing the objectives and targets of the Plan:
• Urban Canopy - developing and protecting the city’s urban forest
• Urban Ecology - greening to improve habitat for biodiversity
• Community Empowerment - to green and care for our urban landscape
And three delivery focus areas for achieving the Plan:
• Public Domain - greening for quality streetscapes and public spaces
• New Development - maximising greening opportunities
• Community Greening - empowering the community to green our city.
Under the Greening Sydney Plan, the City will deliver some 42 programs and projects in partnership with residents, local business, developers and volunteer groups.
For more, visit www.cityofsydney.nsw.gov.au or click on the 2030 icon at left.
The City’s programs have planted over 8,900 new street trees since 2005 and installed 35,000 square metres of landscaping throughout the City’s streets since 2008.
Major projects to be implemented under the Plan include:
• Increasing the city’s urban canopy by 50 per cent on current canopy rates of 15.5 per cent by 2030 to a total of 23.25 per cent
• Implementation of the Urban Forest Strategy, adopted by Council in February 2013 following community consultation
• Implementation of the Street Trees Master Plan
• Review of the Register of Significant Tree and Tree Management Policy
• Plantings in all available footpath locations
• Investigation of Water Sensitive Urban Design (WSUD) opportunities
• Development of a green roof policy
• Supporting establishment of verge and community gardens
• Developing and supporting a green volunteers network
Green - Environmental Sustainability Progress Report Q4 2012/13 36
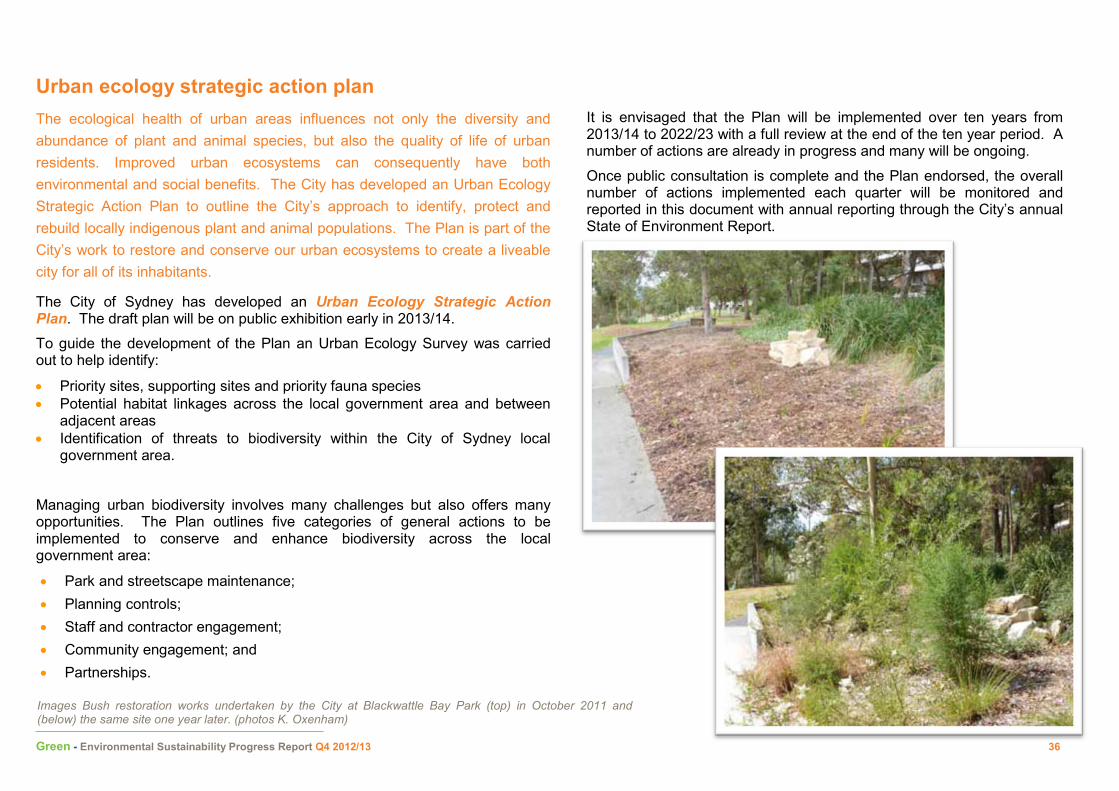
Urban ecology strategic action plan The ecological health of urban areas influences not only the diversity and abundance of plant and animal species, but also the quality of life of urban residents. Improved urban ecosystems can consequently have both environmental and social benefits. The City has developed an Urban Ecology Strategic Action Plan to outline the City’s approach to identify, protect and rebuild locally indigenous plant and animal populations. The Plan is part of the City’s work to restore and conserve our urban ecosystems to create a liveable city for all of its inhabitants.
The City of Sydney has developed an Urban Ecology Strategic Action Plan. The draft plan will be on public exhibition early in 2013/14.
To guide the development of the Plan an Urban Ecology Survey was carried out to help identify:
• Priority sites, supporting sites and priority fauna species • Potential habitat linkages across the local government area and between
adjacent areas • Identification of threats to biodiversity within the City of Sydney local
government area.
Managing urban biodiversity involves many challenges but also offers many opportunities. The Plan outlines five categories of general actions to be implemented to conserve and enhance biodiversity across the local government area:
• Park and streetscape maintenance; • Planning controls; • Staff and contractor engagement; • Community engagement; and • Partnerships.
It is envisaged that the Plan will be implemented over ten years from 2013/14 to 2022/23 with a full review at the end of the ten year period. A number of actions are already in progress and many will be ongoing.
Once public consultation is complete and the Plan endorsed, the overall number of actions implemented each quarter will be monitored and reported in this document with annual reporting through the City’s annual State of Environment Report.
Images Bush restoration works undertaken by the City at Blackwattle Bay Park (top) in October 2011 and (below) the same site one year later. (photos K. Oxenham)
Green - Environmental Sustainability Progress Report Q4 2012/13 37
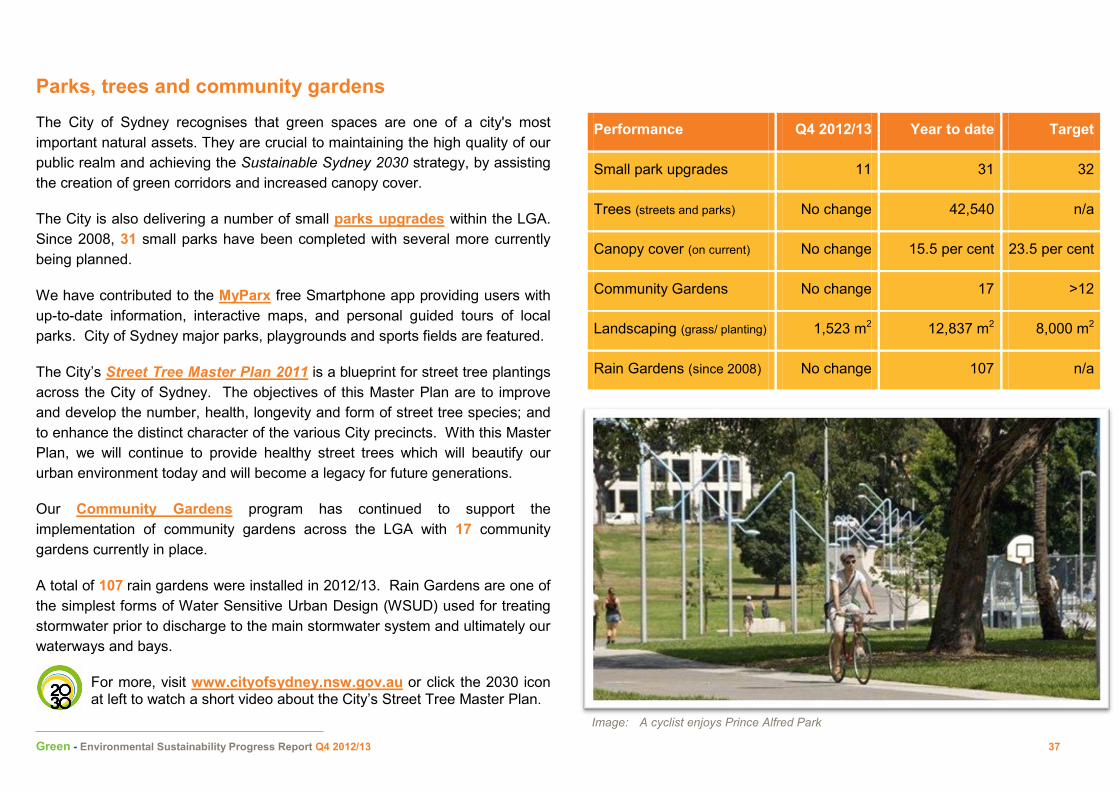
Parks, trees and community gardens The City of Sydney recognises that green spaces are one of a city's most important natural assets. They are crucial to maintaining the high quality of our public realm and achieving the Sustainable Sydney 2030 strategy, by assisting the creation of green corridors and increased canopy cover.
The City is also delivering a number of small parks upgrades within the LGA. Since 2008, 31 small parks have been completed with several more currently being planned.
We have contributed to the MyParx free Smartphone app providing users with up-to-date information, interactive maps, and personal guided tours of local parks. City of Sydney major parks, playgrounds and sports fields are featured.
The City’s Street Tree Master Plan 2011 is a blueprint for street tree plantings across the City of Sydney. The objectives of this Master Plan are to improve and develop the number, health, longevity and form of street tree species; and to enhance the distinct character of the various City precincts. With this Master Plan, we will continue to provide healthy street trees which will beautify our urban environment today and will become a legacy for future generations.
Our Community Gardens program has continued to support the implementation of community gardens across the LGA with 17 community gardens currently in place.
A total of 107 rain gardens were installed in 2012/13. Rain Gardens are one of the simplest forms of Water Sensitive Urban Design (WSUD) used for treating stormwater prior to discharge to the main stormwater system and ultimately our waterways and bays.
For more, visit www.cityofsydney.nsw.gov.au or click the 2030 icon at left to watch a short video about the City’s Street Tree Master Plan.
Performance Q4 2012/13 Year to date Target
Small park upgrades 11 31 32
Trees (streets and parks) No change 42,540 n/a
Canopy cover (on current) No change 15.5 per cent 23.5 per cent
Green - Environmental Sustainability Progress Report Q4 2012/13 38
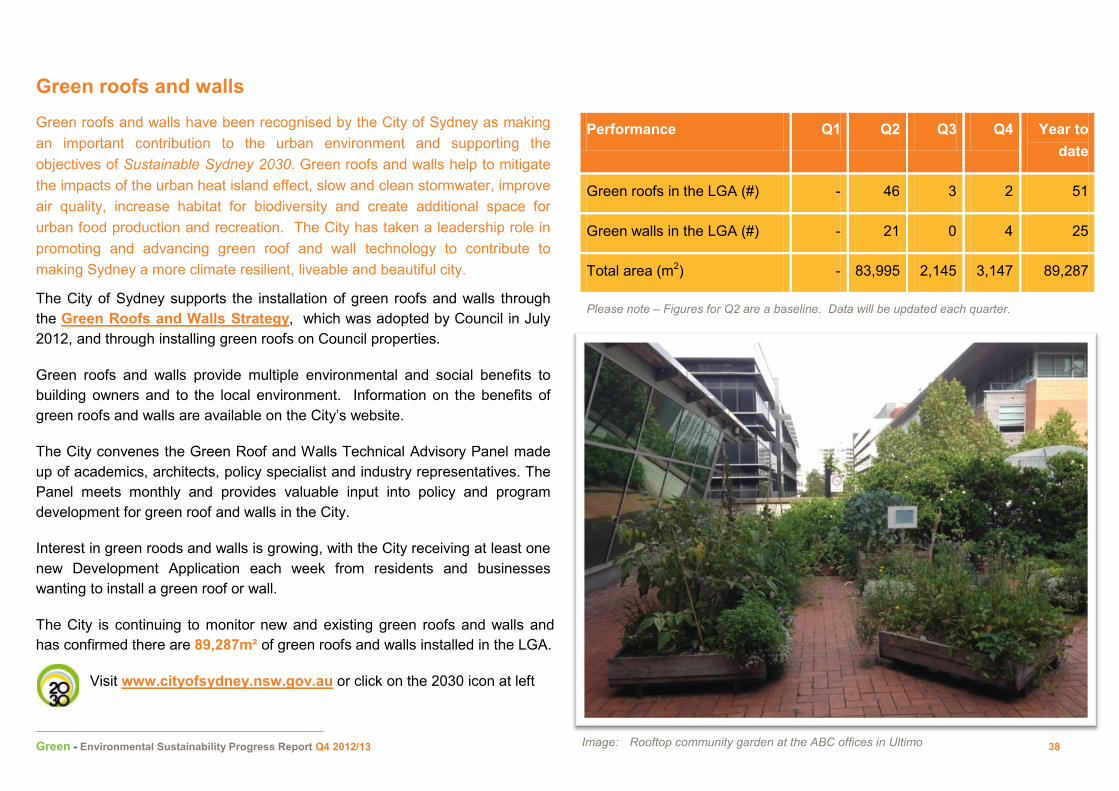
Green roofs and walls Green roofs and walls have been recognised by the City of Sydney as making an important contribution to the urban environment and supporting the objectives of Sustainable Sydney 2030. Green roofs and walls help to mitigate the impacts of the urban heat island effect, slow and clean stormwater, improve air quality, increase habitat for biodiversity and create additional space for urban food production and recreation. The City has taken a leadership role in promoting and advancing green roof and wall technology to contribute to making Sydney a more climate resilient, liveable and beautiful city.
The City of Sydney supports the installation of green roofs and walls through the Green Roofs and Walls Strategy, which was adopted by Council in July 2012, and through installing green roofs on Council properties.
Green roofs and walls provide multiple environmental and social benefits to building owners and to the local environment. Information on the benefits of green roofs and walls are available on the City’s website.
The City convenes the Green Roof and Walls Technical Advisory Panel made up of academics, architects, policy specialist and industry representatives. The Panel meets monthly and provides valuable input into policy and program development for green roof and walls in the City.
Interest in green roods and walls is growing, with the City receiving at least one new Development Application each week from residents and businesses wanting to install a green roof or wall.
The City is continuing to monitor new and existing green roofs and walls and has confirmed there are 89,287m² of green roofs and walls installed in the LGA.
Visit www.cityofsydney.nsw.gov.au or click on the 2030 icon at left
Performance Q1 Q2 Q3 Q4 Year to date
Green roofs in the LGA (#) - 46 3 2 51
Green walls in the LGA (#) - 21 0 4 25
Total area (m2) - 83,995 2,145 3,147 89,287
Please note – Figures for Q2 are a baseline. Data will be updated each quarter.
Image: Rooftop community garden at the ABC offices in Ultimo
Green - Environmental Sustainability Progress Report Q4 2012/13 39
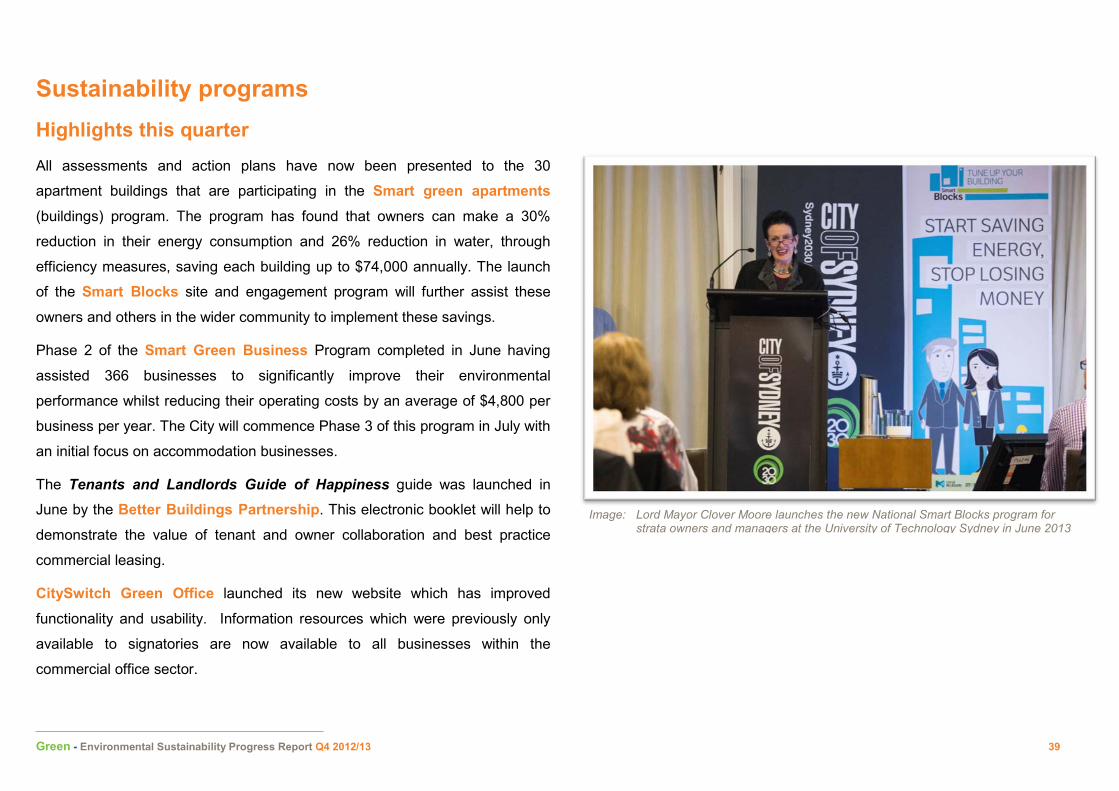
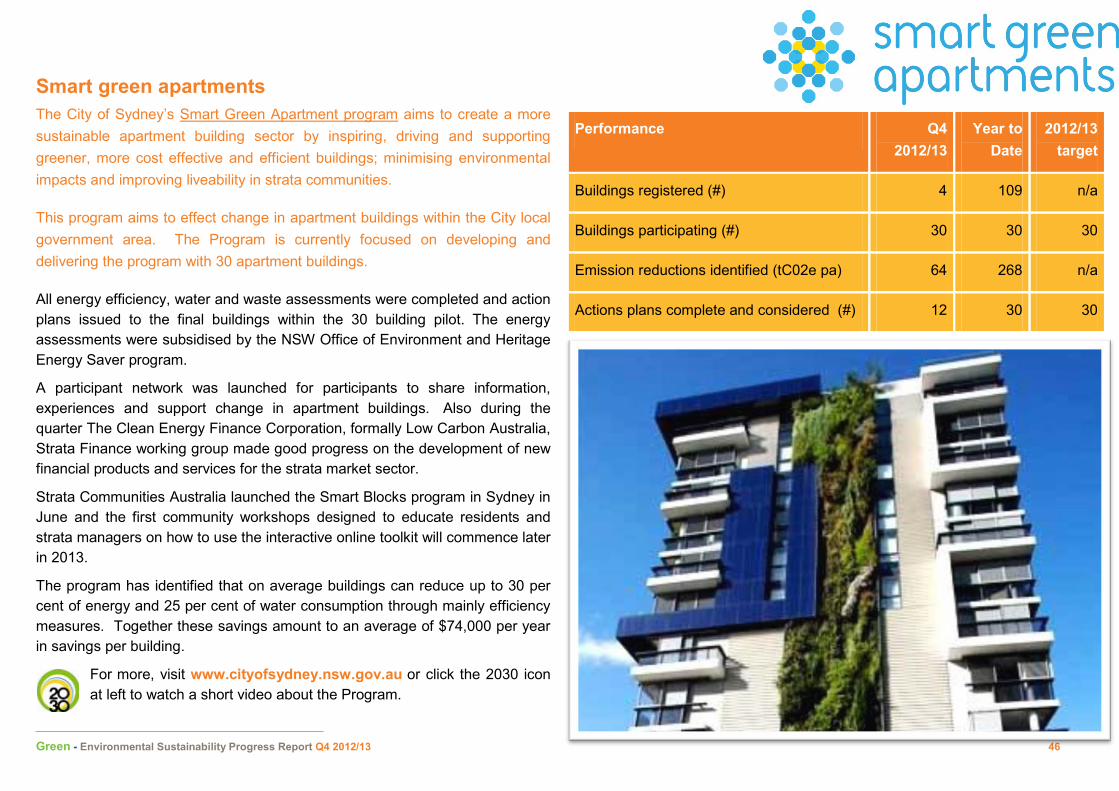
Sustainability programs Highlights this quarter All assessments and action plans have now been presented to the 30
apartment buildings that are participating in the Smart green apartments
(buildings) program. The program has found that owners can make a 30%
reduction in their energy consumption and 26% reduction in water, through
efficiency measures, saving each building up to $74,000 annually. The launch
of the Smart Blocks site and engagement program will further assist these
owners and others in the wider community to implement these savings.
Phase 2 of the Smart Green Business Program completed in June having
assisted 366 businesses to significantly improve their environmental
performance whilst reducing their operating costs by an average of $4,800 per
business per year. The City will commence Phase 3 of this program in July with
an initial focus on accommodation businesses.
The Tenants and Landlords Guide of Happiness guide was launched in
June by the Better Buildings Partnership. This electronic booklet will help to
demonstrate the value of tenant and owner collaboration and best practice
commercial leasing.
CitySwitch Green Office launched its new website which has improved
functionality and usability. Information resources which were previously only
available to signatories are now available to all businesses within the
commercial office sector.
Image: Lord Mayor Clover Moore launches the new National Smart Blocks program for strata owners and managers at the University of Technology Sydney in June 2013
Green - Environmental Sustainability Progress Report Q4 2012/13 40
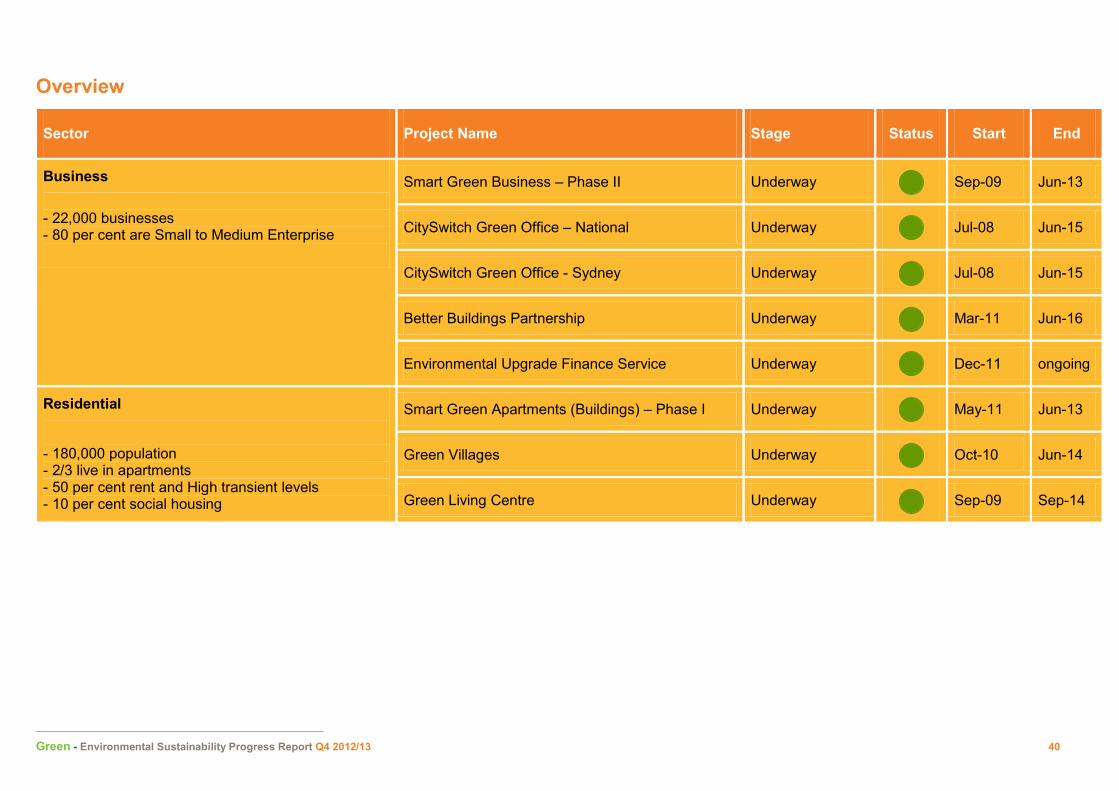
Overview
Sector Project Name Stage Status Start End
Business - 22,000 businesses - 80 per cent are Small to Medium Enterprise
Smart Green Business – Phase II Underway Sep-09 Jun-13
CitySwitch Green Office – National Underway Jul-08 Jun-15
CitySwitch Green Office - Sydney Underway Jul-08 Jun-15
Environmental Upgrade Finance Service Underway Dec-11 ongoing
Residential
- 180,000 population - 2/3 live in apartments - 50 per cent rent and High transient levels - 10 per cent social housing
Smart Green Apartments (Buildings) – Phase I Underway May-11 Jun-13
Green Villages Underway Oct-10 Jun-14
Green Living Centre Underway Sep-09 Sep-14
Green - Environmental Sustainability Progress Report Q4 2012/13 41
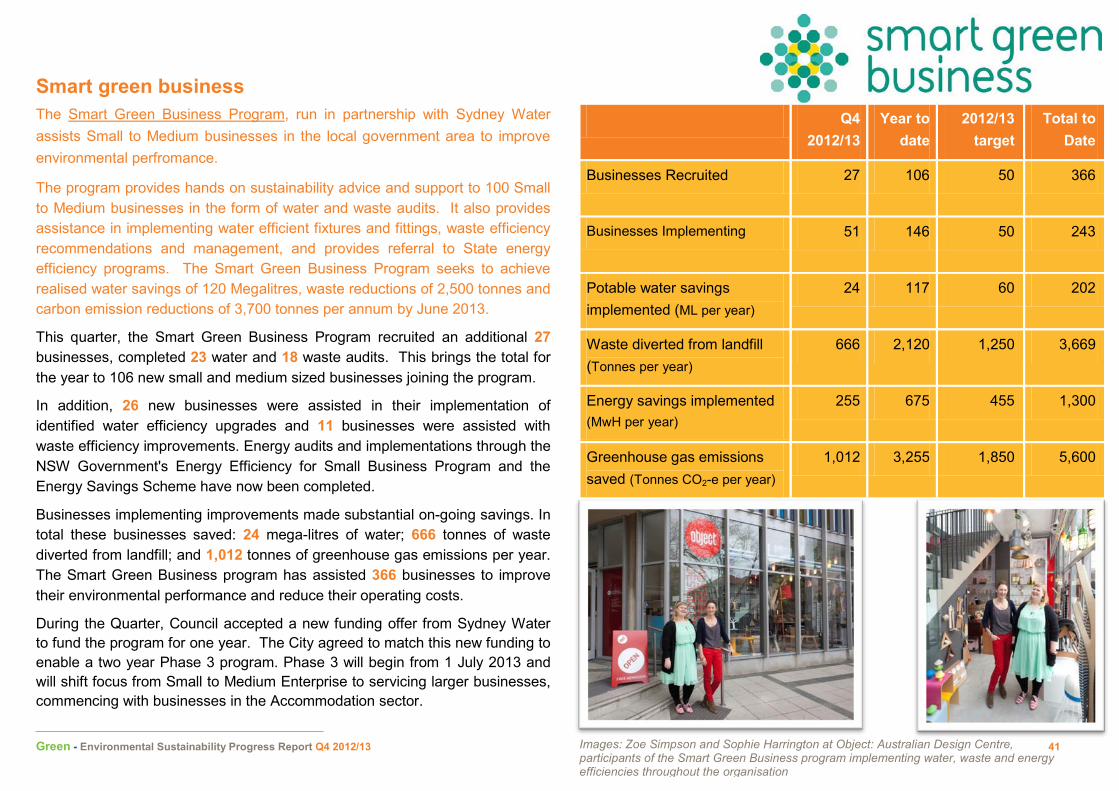
Smart green business The Smart Green Business Program, run in partnership with Sydney Water assists Small to Medium businesses in the local government area to improve environmental perfromance.
The program provides hands on sustainability advice and support to 100 Small to Medium businesses in the form of water and waste audits. It also provides assistance in implementing water efficient fixtures and fittings, waste efficiency recommendations and management, and provides referral to State energy efficiency programs. The Smart Green Business Program seeks to achieve realised water savings of 120 Megalitres, waste reductions of 2,500 tonnes and carbon emission reductions of 3,700 tonnes per annum by June 2013.
This quarter, the Smart Green Business Program recruited an additional 27 businesses, completed 23 water and 18 waste audits. This brings the total for the year to 106 new small and medium sized businesses joining the program.
In addition, 26 new businesses were assisted in their implementation of identified water efficiency upgrades and 11 businesses were assisted with waste efficiency improvements. Energy audits and implementations through the NSW Government's Energy Efficiency for Small Business Program and the Energy Savings Scheme have now been completed.
Businesses implementing improvements made substantial on-going savings. In total these businesses saved: 24 mega-litres of water; 666 tonnes of waste diverted from landfill; and 1,012 tonnes of greenhouse gas emissions per year. The Smart Green Business program has assisted 366 businesses to improve their environmental performance and reduce their operating costs.
During the Quarter, Council accepted a new funding offer from Sydney Water to fund the program for one year. The City agreed to match this new funding to enable a two year Phase 3 program. Phase 3 will begin from 1 July 2013 and will shift focus from Small to Medium Enterprise to servicing larger businesses, commencing with businesses in the Accommodation sector.
Q4 2012/13
Year to date
2012/13 target
Total to Date
Businesses Recruited 27 106 50 366
Businesses Implementing 51 146 50 243
Potable water savings implemented (ML per year)
24 117 60 202
Waste diverted from landfill (Tonnes per year)
666 2,120 1,250 3,669
Energy savings implemented (MwH per year)
255 675 455 1,300
Greenhouse gas emissions saved (Tonnes CO2-e per year)
1,012 3,255 1,850 5,600
Images: Zoe Simpson and Sophie Harrington at Object: Australian Design Centre, participants of the Smart Green Business program implementing water, waste and energy efficiencies throughout the organisation
Green - Environmental Sustainability Progress Report Q4 2012/13 42
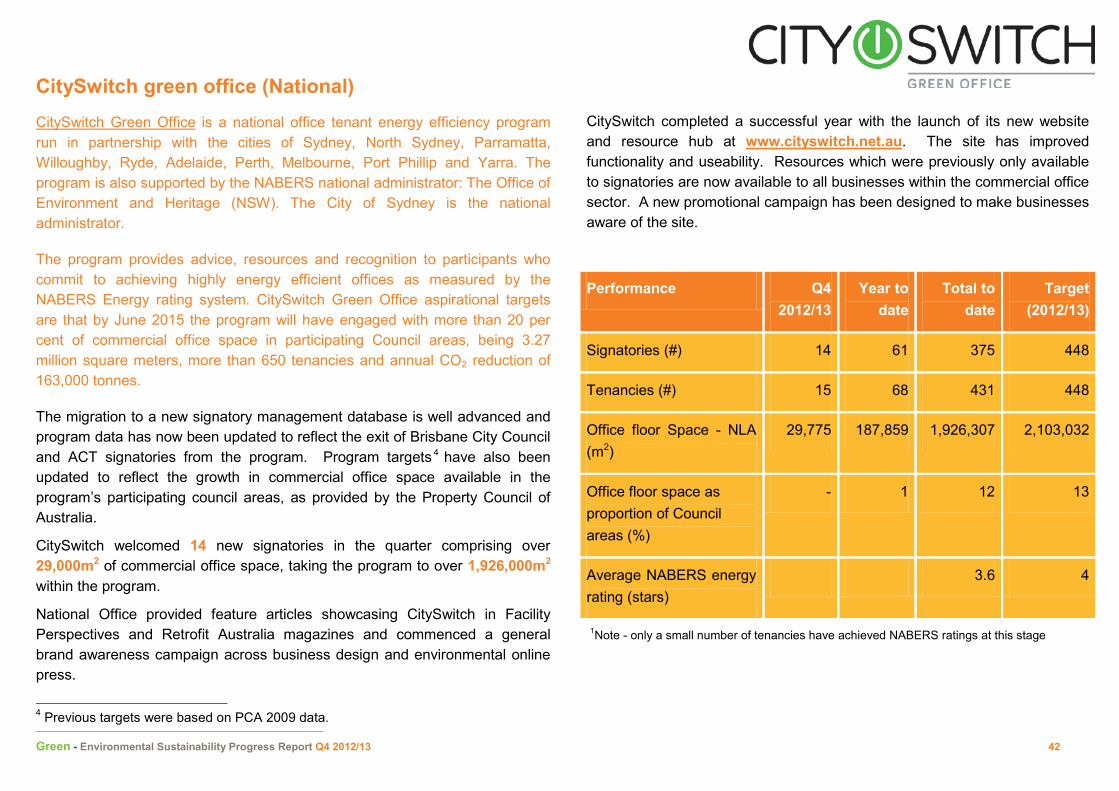
CitySwitch green office (National) CitySwitch Green Office is a national office tenant energy efficiency program run in partnership with the cities of Sydney, North Sydney, Parramatta, Willoughby, Ryde, Adelaide, Perth, Melbourne, Port Phillip and Yarra. The program is also supported by the NABERS national administrator: The Office of Environment and Heritage (NSW). The City of Sydney is the national administrator.
The program provides advice, resources and recognition to participants who commit to achieving highly energy efficient offices as measured by the NABERS Energy rating system. CitySwitch Green Office aspirational targets are that by June 2015 the program will have engaged with more than 20 per cent of commercial office space in participating Council areas, being 3.27 million square meters, more than 650 tenancies and annual CO2 reduction of 163,000 tonnes.
The migration to a new signatory management database is well advanced and program data has now been updated to reflect the exit of Brisbane City Council and ACT signatories from the program. Program targets 4 have also been updated to reflect the growth in commercial office space available in the program’s participating council areas, as provided by the Property Council of Australia.
CitySwitch welcomed 14 new signatories in the quarter comprising over 29,000m2 of commercial office space, taking the program to over 1,926,000m2 within the program.
National Office provided feature articles showcasing CitySwitch in Facility Perspectives and Retrofit Australia magazines and commenced a general brand awareness campaign across business design and environmental online press.
4 Previous targets were based on PCA 2009 data.
CitySwitch completed a successful year with the launch of its new website and resource hub at www.cityswitch.net.au. The site has improved functionality and useability. Resources which were previously only available to signatories are now available to all businesses within the commercial office sector. A new promotional campaign has been designed to make businesses aware of the site.
Performance Q4 2012/13
Year to date
Total to date
Target (2012/13)
Signatories (#) 14 61 375 448
Tenancies (#) 15 68 431 448
Office floor Space - NLA (m2)
29,775 187,859 1,926,307 2,103,032
Office floor space as proportion of Council areas (%)
- 1 12 13
Average NABERS energy rating (stars)
3.6 4
1Note - only a small number of tenancies have achieved NABERS ratings at this stage
Green - Environmental Sustainability Progress Report Q4 2012/13 43
CitySwitch green office (Sydney)
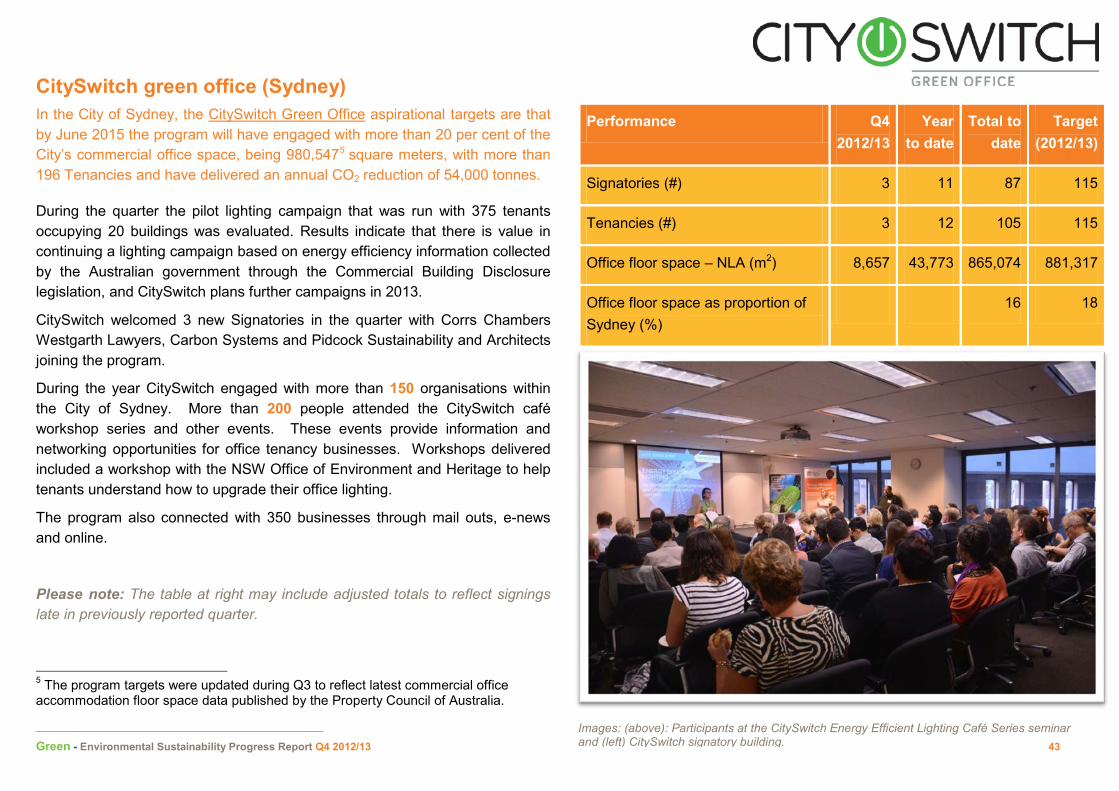
In the City of Sydney, the CitySwitch Green Office aspirational targets are that by June 2015 the program will have engaged with more than 20 per cent of the City’s commercial office space, being 980,5475 square meters, with more than 196 Tenancies and have delivered an annual CO2 reduction of 54,000 tonnes.
During the quarter the pilot lighting campaign that was run with 375 tenants occupying 20 buildings was evaluated. Results indicate that there is value in continuing a lighting campaign based on energy efficiency information collected by the Australian government through the Commercial Building Disclosure legislation, and CitySwitch plans further campaigns in 2013.
CitySwitch welcomed 3 new Signatories in the quarter with Corrs Chambers Westgarth Lawyers, Carbon Systems and Pidcock Sustainability and Architects joining the program.
During the year CitySwitch engaged with more than 150 organisations within the City of Sydney. More than 200 people attended the CitySwitch café workshop series and other events. These events provide information and networking opportunities for office tenancy businesses. Workshops delivered included a workshop with the NSW Office of Environment and Heritage to help tenants understand how to upgrade their office lighting.
The program also connected with 350 businesses through mail outs, e-news and online.
Please note: The table at right may include adjusted totals to reflect signings late in previously reported quarter.
5 The program targets were updated during Q3 to reflect latest commercial office accommodation floor space data published by the Property Council of Australia.
Performance Q4 2012/13
Year to date
Total to date
Target (2012/13)
Signatories (#) 3 11 87 115
Tenancies (#) 3 12 105 115
Office floor space – NLA (m2) 8,657 43,773 865,074 881,317
Office floor space as proportion of Sydney (%)
16 18
Images: (above): Participants at the CitySwitch Energy Efficient Lighting Café Series seminar and (left) CitySwitch signatory building.
Green - Environmental Sustainability Progress Report Q4 2012/13 44
Better Buildings Partnership The Better Buildings Partnership (BBP) is a collaborative partnership with Sydney’s leading commercial building owners.
The Partnership will support the implementation of the City’s green infrastructure plan, be an important role in developing and advocating for solutions to key issues and barriers facing building owners and help improve the environmental performance in the commercial building sector, which is responsible for approximately 50 per cent of local government area emissions.
The Partnership is directed by a Leadership Panel, consisting of the Sustainability Managers of the Foundation Members, and will deliver solutions as defined in an annual work plan.
The primary effort of the program in this quarter has been to finalise the development of the metrics database. This database is now operational and work is progressing to set interim targets for the partnership ready for endorsement by the Partners' senior executives at a dinner with the Lord Mayor in August.
The building owner 'Connection Guidelines to Prepare a Building for Recycled Water Source' have been published and a publication explaining to tenants the business case for choosing high-performing buildings has been completed.
A number of other document have also been finalised, ready for endorsement with the key stakeholders prior to publishing. These provide information related to: Planning, compliance and the building code of Australia energy efficiency regulations - Section J; Leasing Agents; And sample green lease clauses.
Throughout the year the Better Buildings Partnership has been working with the industry stakeholders who influence the delivery of improved environmental performance within the commercial sector. The focus has been on helping them address the barriers they face.
Performance Q4 2012/13 Year to date Total to date
Commercial office building floor space participating in Sydney CBD (%)
54 54 50
Members -
# Founding
# Ordinary
# Associate
No new
No new
1 new
No new
No new
4 new
14 Founding
2 Ordinary
7 Associate
NABERS energy rating 4.1 4.1 -
For more information, visit www.sydneybetterbuildings.com.au or click on the icon at left for a series of videos about best practice leasing from the Better Buildings Partnership
Green - Environmental Sustainability Progress Report Q4 2012/13 45
Environmental upgrade finance The City’s environmental upgrade finance is part of the NSW Government’s recently introduced Environmental Upgrade Agreements (EUA), which allows councils to enter into agreements with property owners and finance providers in order to fund works aimed at improving the energy, water or environmental efficiency of their building. Under this scheme, a finance provider provides funds to a building owner for an environmental improvement project, with the funding repaid over time via Council charges on the land.
Environmental upgrade finance also allows the cost of an upgrade to be shared with the tenant. Under the agreement, a building owner may pass on part of the cost of the upgrade to the tenant providing the amount does not exceed the financial saving that the tenant will benefit from as a result of the upgrade. This means that tenants can enjoy the benefits of an environmental upgrade in the short-term and operating cost savings in the long-term.
The City is currently negotiating its second EUA for the upgrade of an existing commercial office building in the CBD. Negotiations also continued during the quarter on two other potential EUAs for upgrades to existing buildings in the LGA. The City is also working closely with the NSW Office of Environment and Heritage on potential EUA projects resulting from audits completed through the Energy Saver program.
During the quarter the City continued negotiations with a number of building owners seeking to conclude environmental upgrade agreements. A review of upgrade opportunities arising from NSW Office of Environment and Heritage led energy programs within the City area was also commenced.
An Expression of Interest was distributed to owners of non-investment grade commercial office buildings seeking their interest in a pilot engagement program to test environmental change strategies that will resonate with this building sector.
Performance Q4 2012/13
Year to date Total to date
Number of EUAs signed - 1 1
Estimated emission reductions from signed EUAs (tonnes p.a)
- 7,600 7,600
For more information, visit www.cityofsydney.nsw.gov.au or click on the 2030 icon at left to watch a short video about EUAs.
Image: Outside the Brewery Yard Building at Central Park where the trigeneration plant is located: Chairman, Low Carbon Australia Martijn Wilder, Frasers Property CEO Guy Pahor, ANZ, Global Head of Commercial Property, Eddie Law , City of Sydney Lord Mayor Clover Moore, Sekisui House General Manager Atsuhide Segushi, Niall McCarthy director of Eureka Funds Management
Green - Environmental Sustainability Progress Report Q4 2012/13 46
Smart green apartments The City of Sydney’s Smart Green Apartment program aims to create a more sustainable apartment building sector by inspiring, driving and supporting greener, more cost effective and efficient buildings; minimising environmental impacts and improving liveability in strata communities.
This program aims to effect change in apartment buildings within the City local government area. The Program is currently focused on developing and delivering the program with 30 apartment buildings.
All energy efficiency, water and waste assessments were completed and action plans issued to the final buildings within the 30 building pilot. The energy assessments were subsidised by the NSW Office of Environment and Heritage Energy Saver program.
A participant network was launched for participants to share information, experiences and support change in apartment buildings. Also during the quarter The Clean Energy Finance Corporation, formally Low Carbon Australia, Strata Finance working group made good progress on the development of new financial products and services for the strata market sector.
Strata Communities Australia launched the Smart Blocks program in Sydney in June and the first community workshops designed to educate residents and strata managers on how to use the interactive online toolkit will commence later in 2013.
The program has identified that on average buildings can reduce up to 30 per cent of energy and 25 per cent of water consumption through mainly efficiency measures. Together these savings amount to an average of $74,000 per year in savings per building.
For more, visit www.cityofsydney.nsw.gov.au or click the 2030 icon at left to watch a short video about the Program.
Green - Environmental Sustainability Progress Report Q4 2012/13 47
Green villages program The Green Villages Program works to drive, build and celebrate sustainable villages through the development of local sustainability programs, events and resources. Participants are encouraged to develop and drive their own local community projects supported through the Environment Grants Program.
Highlights of the quarter included:
• Grant recipient the Alternative Technology Association ran Speed Date a Sustainable Designer in June, with 160 ‘dates’ with 20 sustainability experts, architects, building designers and interior designers. Participants were delighted with the advice they received on how to make their renovations ‘greener’.
• Twenty five nature lovers braved the pouring rain to learn how to attract native biodiversity to their gardens. They learnt how to build a frog pond and all went home with some native seedlings to get their native gardens started.
• The completion of a series
of four workshops run in partnership with the Ultimo Community Centre. Almost 100 people joined us to learn how to manage pests in their garden naturally or how to clean without chemicals.
• A trio of workshops were held in Green Square teaching residents how to create edible gardens in small spaces, compost and worm farm, and manage bugs in their gardens naturally.
• Green Villages partnered with Grow It Local to promote urban farming in the City. This engagement campaign included innovative outdoor panels growing herbs and chillies in everyday items promoting the idea that anyone can grow their own food, no matter where they live.
Performance Q4 2012/13 Year to date
2012/13 target
Workshops and forums (#) 11 34 37
Participants (#) 359 1,333 1,675
Participants implementing (%)* 91 87.67 80
Green Villages unique visitors (#) 15,738 39,868 -
e-news subscribers (#) 13,029 26,109 -
e-news open rate (%) 25 25 -
*Implementation rate for participants attending workshops January – March 2013
For more, visit www.greenvillages.com.au , www.thegoodhood.com.au or www.growitlocal.com.au or click on the icon at left for a series of Green Villages videos.
Green - Environmental Sustainability Progress Report Q4 2012/13 48
Green living centre The Green Living Centre is a sustainability place based ‘drop-in’ information and education hub located on King St, Newtown. Formally known as The Watershed the Green Living Centre is a partnership between the City of Sydney and Marrickville Councils aiming to inspire, enable and connect local communities to reduce their environmental footprint.
The Green Living Centre is open to the public Tuesday – Saturday. Visitors can: find out about free workshops, browse the library for information and inspiration, borrow a cargo bike and take the kids for a ride, find out about local sustainable services and initiatives, buy some worms, or simply chat to staff about practical ideas for every day sustainable living.
The Green Living Centre: growing a culture of environmental sustainability within the urban community.
Events at the Green Living Centre this quarter included:
• No Dig Gardening • Worm Farming • Garden Maintenance with Newtown Community Garden • Successful Container Gardening
The Green Living Centre has just undergone a renovation to the shop front and office. A new ramp and door has made the shop more accessible for mobility challenged visitors, and interior changes have updated the look and feel, organised information and allowed workshops to be run with more ease. The shop front showcases a number of ways to do a sustainable fit out, with a LED lighting display and extensive use of sustainable materials.
Our commercial worm farm trial has been a success with over half a tonne of food waste from two local businesses removed from landfill and composted onsite at the Green Living Centre. The trial indicates that the system requires little maintenance and is free from many issues of other urban composting schemes. This suggests the system may be suitable for use in apartment buildings. The Green Living Centre and City of Sydney will explore a trial in apartments in next financial year.
Performance Q4 2012/13 Year to date 2012/13 target
Workshops and events 12 71 65
Participants 138 1,448 1,200
Image: the newly renovated Green Living Centre shop front in King Street, Newtown
Green - Environmental Sustainability Progress Report Q4 2012/13 49
Environmental grants Environmental Grants provide funding for not-for-profit groups that provide an environmental benefit to our city villages. Grants have been awarded to start community gardens, sponsor exhibitions on sustainable living and begin urban renewal projects.
Grant submissions are accepted twice a year and community information sessions are held before application closing dates.
A total of sixteen Environmental Grant projects are currently being managed. This includes eight round one 2012 grants, six round two 2012 grants and one out of round grant that was approved at the March 2013 Council meeting. All projects are underway and will be completed by December 2013. The out of round grant is for the Boomerang Alliance’s Kick a Can for Recycling event in support of a national container deposit scheme.
The 2013 round one grants closed on 2 April with thirteen applications received. Grants currently being managed by the City are:
• Australian Climate Coolers; Women Power • Conservation Volunteers Australia; Breathing Green Health into Moore Park • Eastside Radio; East Side Ride • Green Renters; Green Renting Expo • Mission Australia; Common Ground Community Garden • Sydney Sustainable Markets; Pop-Up Education Area • University of Technology, Sydney; Feasibility study on reusable food
container scheme for takeaway food in the CBD area • Youth Off The Streets; Trashed • Alternative Technology Association: Speed Date a Sustainable Designer • Garage Sale Trail: Grow It Local • Hobo Gro & Curb Collective: Living Sustainably Workshop Series
• Matthew Talbot Homeless Services & St Vincent de Paul Society: Pedal Power
• The Nature Conservation Council of NSW: Growing Edible Food in Small Spaces
• Youth Off the Streets: Palletable
Q4 2012/13 Year to date 2012/13 target
Projects funded (#) 0 16 n/a
For more information, visit www.greenvillages.com.au or click on the 2030 icon at left.
Green - Environmental Sustainability Progress Report Q4 2012/13 50
Waste avoidance programs
The City’s Sustainability Programs team ensures that waste avoidance is
incorporated into all programs we offer our community. This can take the form
of; specific Green Village workshops, support for City sponsored events and
strategies and studies.
During the quarter one compost and worm farming workshop was held through
the Green Villages program and 32 residents attended with 24 participants
given either a free worm farm or compost bin.
All buildings participating in the Smart Green Apartment program have now
received a waste reduction action plan.
The CitySwitch on-line site now contains waste related information and
CitySwitch program managers from around the country were briefed on this in
May.
A summary of the City's Reuse Study was presented at the Coffs Harbour
Waste 2013 conference.
During the year ending June 2013 the City delivered education and events
designed to reduce waste being produced and to increase the amount of waste
that is reused rather than disposed of. The majority of this work is delivered to
residents and businesses through the existing sustainability programs.
The Green Villages program delivered 12 workshops on worm farming and
composting, upcycling and collaborative consumption; The Smart Green
Business program assisted businesses to reduce their waste by 79 tonnes per
annum and produced a best practice guide for waste reduction; The Better
Buildings Partnership hosted a 'Waste from Fit-out' symposium and started
an engagement with the industry on how to reduce fit-out waste; and the
Smart Green Apartments program delivered waste avoidance action plans to
its 30 participating apartment buildings.
In addition during the year a reuse capacity and capability study was
completed and recommended actions started. A Time Out guide on the
sharing economy was developed which will be published in August.
The Bower's reuse referral service received 337 calls from City of Sydney
residents asking for advice on how they can reuse their waste materials, and
reported a total of 788 cubic meters of material diverted from landfill.
Image: Residents attend a composting workshop
Green - Environmental Sustainability Progress Report Q4 2012/13 51
Attachments The following attachments provide further information about planned data capture, KPI development and explanations to graphs. Image: plantings at City of Sydney Community Garden
Green - Environmental Sustainability Progress Report Q4 2012/13 52
1. Planned data capture City of Sydney (internal) Local Government Area (LGA)
Current Status Forward Plan Current Status Forward Plan
Greenhouse gas emissions from electricity
Reporting underway from STEvE.
Electricity currently is reported quarterly in arrears. Data provided by Ausgrid and checked against sub-metering, which is being installed at significant energy consuming sites.
Allocate consumption to relevant organisation business units through the Environmental Management System currently being implemented.
Electricity to be monitored in real time for ~ 90 per cent of sites. Remaining ~10 per cent of sites are to be estimated with actual data updated quarterly in arrears.
Reported through the Kinesis CCAP reporting tool which includes data from the electricity and gas networks and other sources.
Continue to monitor and report.
Greenhouse gas emissions from natural gas
Gas is not currently monitored in real time for all sites. Real time meters have been installed at Cook & Phillip Park Pool and the Ian Thorpe Aquatic Centre.
For all other sites, gas data is reported quarterly in arrears. Additionally gas account data (usage) may be estimated by AGL in cases where they cannot read meters.
Install real time gas metering as part of the Building Energy and Water Efficiency Retrofit at the following sites by Q2 2012/13.
• Town Hall House • ITAC • 343 George Street • Customs House
Reporting on these sites will be included as soon as accurate data is available. Anticipated by mid2013/14.
As above As above.
Green - Environmental Sustainability Progress Report Q4 2012/13 53
City of Sydney (organisation) City of Sydney LGA
Current Status Forward Plan Current Status Forward Plan
Greenhouse gas emissions from other sources
Emissions sources including flights, taxis, contractor fuel, onsite fuel usage, events and refrigerants were added to STEvE in Q2 2011/12. The City's flight and taxi information is reported quarterly and remaining emissions annually. These emissions do not form a large proportion of the City's total emissions.
In place. Refinements to this process to continue from Q2 2011/12.
As above
As above.
Installed co/tri generation and renewable energy
The City does not have co/tri generation installed to date, but has a record of installed solar power capacity and estimated annual output.
Install sub-metering to all new co/tri generation (dependent on site) and renewable energy to ensure it is reported and counted toward 25 per cent renewable energy target by 2020. This has been included within specifications for City sites.
Develop a system to report on low carbon gas fired electricity and zero carbon thermal energy which will replace coal fired electricity by 2013/14. Data provision by Cogent Energy has been included in the Trigeneration Heads of Agreement.
Information about renewable energy installations is available through the Clean Energy Regulator. A third-party solar map is also being developed through ARENA funding which is expected to be available in Q2 2013/14.
Currently there is no mechanism in place for tracking installed co and trigeneration systems.
Click here to view a map developed by City of Sydney.
Develop a system to report on cogeneration, trigeneration and renewable energy.
Green - Environmental Sustainability Progress Report Q4 2012/13 54
City of Sydney (organisation) City of Sydney LGA
Current Status Forward Plan Current Status Forward Plan
Water
Currently reporting mains water consumption by category quarterly in arrears through STEvE.
Currently able to report mains consumption through STEvE via Sydney Water.
Not currently reporting non-mains water consumption.
Further details to be defined as part of the Decentralised Water Master Plan
Reporting mains water consumption annually only. No existing process for accurately capturing and reporting non-mains water consumption.
Data for mains water usage available annually only.
Further details to be defined as part of the Decentralised Water Master Plan.
Waste Limited organisational waste reporting available. Current reporting does not include recycling rates.
Further options for refining organisation waste reporting being investigated with the waste contractor in 2012/13.
LGA waste data available and reported in the Corporate Plan.
Further sustainability reporting by category has been setup in Performance Planning for quarterly reporting.
Sustainability Program - reporting outcomes
The Green Champions Program currently reports predominantly qualitative data.
From Q4 2011/12 the Green Champions program will utilise enhanced STEvE reporting to enable reporting of quantitative results following implementation of initiatives.
The reporting of qualitative data will also continue.
Key Performance Measures have been defined for the programs and are being progressively implemented within this sustainability report.
A standard reporting framework has been adopted across the sustainability programs, which has been designed taking key elements from the Outcomes Hierarchy and Results Based Accountability methodologies.
For more information see the Sustainability Programs Data Dictionary appended to this report.
Surveys of 1800 residents, workers and SME business have valuable insights for sustainability action. The segmentation model developed will be used as a key input into the evaluation of the Sustainability Programs.
Further work on developing data to support all performance measures will be implemented over 2013/14
The scope and format for program reporting will continue to be assessed in-line with the review of City reporting requirements.
The ability to set sector by sector environmental targets will be assessed when sustainability master planning work is complete.
Green - Environmental Sustainability Progress Report Q4 2012/13 55
2. Glossary of terms
Source Description
2010/11Carbon Inventory Internal database developed by the Sustainability Unit summarising annual greenhouse gas emissions from all City of Sydney assets and activities (buildings, street lighting, parks & other) resulting from consumption of electricity, gas and fuel and other sources.
City of Sydney Environmental Management Plan 2007
The City of Sydney Environmental Management Plan establishes the City's environmental vision, goals, targets and actions for the next ten years and beyond. It addresses the themes of energy emissions, water, waste, plants and animals.
Performance Planning Performance Planning (PP) is a TechnologyOne product that stores measures, projects and targets. Data can be imported or manually entered depending on the source. Managers are responsible for ensuring accuracy of the data. PP also contains Corporate Plan KPI's and projects.
STEvE (System for Tracking EVerything Environmental)
STEvE (the System for Tracking EVerything Environmental) is a Utilities Information Monitoring System that records energy usage by directly extracting consumption data from relevant authorities (Ausgrid, Sydney Gas and Sydney Water), and applies appropriate conversion factors to determine GREENHOUSE GAS emissions.
The benefit of STEvE is that is has access to real time usage through direct interface with the appropriate energy supply authorities. This allows for real time monitoring and reporting of energy consumption. Currently only electricity is being reported in real time, with approximately 90% of usage recorded via smart meters - the remaining 10% of usage is estimated based on historical data, and updated with actual data quarterly in arrears. Gas and water consumption are currently reported quarterly in arrears.
Potable water Water that is of drinking water quality for use in bathrooms, kitchens and for consumption
Non potable water Water that is not of drinking water quality. Uses include laundry, gardening, car washing, cooling towers and so on. Recycled water is for non potable use.
National Greenhouse Accounts (NGA) Factors. June 2009
Published by the Department of Climate Change "The National Greenhouse Accounts (NGA) Factors” has been prepared by the Australian Government and is designed for use by companies and individuals to estimate greenhouse gas emissions for reporting under various government programs and for their own purpose.
Green - Environmental Sustainability Progress Report Q4 2012/13 56
Source Description
Scope 1 GREENHOUSE GAS emissions6
Emissions directly occurring "from sources that are owned or controlled by the institution, including: on-campus stationary combustion of fossil fuels; mobile combustion of fossil fuels by institution owned/controlled vehicles; and "fugitive" emissions. Fugitive emissions result from intentional or unintentional releases of greenhouse gases, including the leakage of hydro fluorocarbons from refrigeration and air conditioning equipment."
Scope 2 GREENHOUSE GAS emissions
Indirect emissions generated in the production of electricity consumed by the institution. Scope 2 emissions physically occur at the facility where electricity is generated.
Scope 3 GREENHOUSE GAS emissions
All the other indirect emissions that are "a consequence of the activities of the institution, but occur from sources not owned or controlled by the institution" such as commuting, air travel for university activities, waste disposal; embodied emissions from extraction, production, and transportation of purchased goods; outsourced activities; contractor owned- vehicles; and line loss from electricity transmission and distribution"
State of the Environment Report
City of Sydney publication detailing the city and Local Government Area’s environmental landscape and strategic approaches and initiatives to managing energy and emissions; sustainable transport; water; waste; plants and animals, land and noise.
Sustainable Sydney 2030 City of Sydney publication that sets the 2030 vision for the city aligned to the strategic priorities of Green, Global & Connected. Sets the direction, defines at the road map and articulates the step changes required to achieving a more sustainable future.
6 Source for Scope 1, 2 and 3 GHG Emissions: The Greenhouse Gas Protocol (2004) Published by: World Business Council for Sustainable Development, World Resource Institute
Green - Environmental Sustainability Progress Report Q4 2012/13 57
3. Planned installation of solar
Location Status
1 343 George Street
2 Abraham Mott Gymnasium
3 Abraham Mott Hall Solar hot water installed
4 Alexandria Park toilets and change rooms Solar pv installed
5 Alexandria Town Hall Solar pv installed
6 Alexandria Child Care Centre Solar hot water installed
7 Andrew Boy Charlton Pool
8 Bay Street Depot
9 Bourke Street Depot Solar hot water installed
10 Cook & Phillip Park Aquatic Centre
11 Epsom Road Depot
12 Erskineville Town Hall Solar pv installed
13 Glebe Town Hall Solar pv installed
14 Haymarket Library
15 Jane Evans Day Centre Solar hot water installed
16 Juanita Nelson Community Centre Solar hot water installed
17 King George V Recreation Centre Solar hot water installed
18 Kings Cross Neighbourhood Service Centre and Library Solar hot water installed
Green - Environmental Sustainability Progress Report Q4 2012/13 58
Location Status
19 PACT Theatre
20 Paddington Town Hall Solar pv installed
21 Pine Street Create Arts Centre Solar pv installed
22 Pyrmont Community Centre Solar hot water installed
23 Railway Square Interchange
24 Redfern Community Centre Solar pv and hot water installed
25 Redfern Oval Grandstand Solar pv installed
26 Redfern Town Hall Solar pv installed
27 Rosebery Child Care Centre Solar hot water installed
28 State Emergency Service Facility Solar pv and hot water installed
29 Sydney Park CARES facility Solar pv installed
30 Sydney Park Pavilion Solar pv installed
31 Sydney Park toilets
32 Sydney Town Hall Phase I Solar pv installed
33 Sydney Town Hall Phase II
34 Tote Building
35 Ultimo Community Centre Solar hot water installed
36 Victoria Park pool
37 Waterloo Library Solar pv installed
Green - Environmental Sustainability Progress Report Q4 2012/13 59
Please note – 2012 demographic information will be available from Q2 2012/13 once updates from the Australian Bureau of Statistics are received.
7 The data has been recast from the 2006 Census. Up to 08/09 is ABS ERP data, 09/10 is City of Sydney projection as ERP unavailable 8 06/07 FES Census - count of workers, estimates for other years 9 City of Sydney estimate - tourist visitors, students, business visitors, shoppers 10 Tourism NSW data
Green - Environmental Sustainability Progress Report Q4 2012/13 60
5. Definition of organisational key performance indicators
KPI Name KPI Description Data source Business Unit Calculation Unit of
Measure Target 2010/11 Frequency Additional info
Statement of what the KPI is actually measuring
Where do we obtain and record this data? Principal owner Measure, numerator,
denominator percentage / number / etc
monthly/ quarterly/ annual
i.e. What does the KPI include / exclude? Comments on history.
Organisation Greenhouse gas emissions
Greenhouse gas emissions derived from all City of Sydney assets: buildings, parks, street lighting, fleet, events, taxis, flights and other minor sources.
Compiled by adding multiple data sources separately for: - Buildings - Parks - Street Lighting - Fleet - Other
Sustainability Combination of Greenhouse gas emissions from gas, electricity and fuel consumption for the following categories (detailed separately) - Buildings - Parks - Street Lighting - Fleet
- Other
Tonnes CO2 Sustainable Sydney 2030 Targets apply
Annual / quarterly
Includes greenhouse gas emissions from electricity, gas and fleet fuel usage across all City of Sydney assets
Organisation Water Consumption
Quarterly water consumption of CoS sites including:
• Parks and public domain
• Commercial • Operations • Community • Aquatic facilities
STEvE (collected through smart meters, meter readings and estimates)
Property Combination of water consumption from CoS sites including:
• Parks and public domain
• Commercial • Operations • Community • Aquatic facilities
ML Zero increase from 2005/06 baseline by
2015
Annual / Quarterly
Some estimation is included in quarterly reports and updated in the following quarter.
Green - Environmental Sustainability Progress Report Q4 2012/13 61
KPI Name KPI Description Data source Business Unit Calculation Unit of
Measure Target 2010/11 Frequency Additional info
LGA Mains Water Consumption
Annual water consumption of the LGA
Sydney Water City Strategy - MegaLitres (ML)
Zero increase from 2005/06 baseline by
2015
Annual Sydney Water sends total LGA water consumption to Council at the end of financial year. Quarterly consumption information is not available.
LGA Domestic Waste
Domestic waste for the LGA broken down to :
• Kerbside recycling
• Waste delivered to AWT
• Waste to landfill
• Other
Unit records – (domestic Waste master)
City Operations
Combination of major types of domestic waste for the LGA:
• Kerbside recycling
• Waste delivered to AWT
• Waste to landfill
• Other (inc hazardous & e- waste, whitegoods, garden organics and household cleanup material).
Tonnes This feeds into the
resource recovery rate
target
Quarterly
LGA Domestic Waste Resource Recovery Rate
Amount of waste diverted from landfill including: Recycling, White Goods, Garden Organics, E-waste and material recovered through AWT processing. Shown as a percentage of the total domestic waste generated.
Processing/disposal facilities (where the waste is received)
City Operations
[Waste Diverted from Landfill ] / [Total Waste]
Percentage 2011/12 target is 57%
Target by 2014 is 66%
Quarterly
Green - Environmental Sustainability Progress Report Q4 2012/13 62
6. Definition of sustainability programs key performance indicators
Program Name KPI Name KPI Description Data source/Calculation Reported Unit of Measure Target
Statement of what the KPI is actually measuring
Where do we obtain and record this data?/ How is it calculated percentage / number /
etc
City Switch (National)
Signatories Number of signatories in program Currently reported Number 700
Tenancies Number of tenancies associated with signatories in program Currently reported Number 700
Net lettable area Square meters of office floor space (net lettable area) in the program Currently reported Square meters (m2) 3.4 million m2
Net lettable area
Percentage of commercial office floor space (net lettable area) in program as percentage of total office floor space in LGA
(NLA (m2) in program/NLA (m2) total in LGA)*100 Currently reported Percentage 20 per cent
Average NABERS Rating Average NABERS rating of all tenancies in program Currently reported Stars 4.5 Stars
City Switch (Sydney)
Signatories Number of signatories in program Currently reported Number 187
Tenancies Number of tenancies associated with signatories in program Currently reported Number 187
Net lettable area Square meters of office floor space (net lettable area) in the program Currently reported Square meters (m2) 986,944
Net lettable area
Percentage of commercial office floor space (net lettable area) in program as percentage of total office floor space in LGA
(NLA (m2) in program/NLA (m2) total in LGA)*100 Currently reported Percentage 20 per cent
Average NABERS Rating Average NABERS rating of all tenancies in program WIP - update when
data available Stars 4.5 Stars
Green - Environmental Sustainability Progress Report Q4 2012/13 63
Program Name KPI Name KPI Description Data source/Calculation Reported Unit of Measure Target
Smart Green Business
Businesses recruited Number of businesses recruited to the program Currently reported Number >100
Businesses implementing
Number of businesses who have implemented (or are implementing) identified initiatives (water, waste and energy)
Currently reported Number
Water – cumulative savings implemented
Potable water consumption reduced through Smart Green Business projects
Currently reported Megalitres (ML) 120,450ML
Waste – cumulative diversion implemented
Waste diverted from landfill through Smart Green Business projects
Currently reported Tonnes (t) 2,500t
Energy – cumulative savings implemented
Energy consumption reduced through Smart Green Business projects
Currently reported MwH 900MwH
Co2 - cumulative emissions saved Cumulative Greenhouse Gas Emissions reduced through Smart Green Business projects
Currently reported Tonnes CO2 equivalent (tC02-e) 3,700 tC02-e
Green Village Program
Workshops Number of workshops provided # of workshops/forums held Currently reported Number 36
Participants Number of participants attending workshops
# of participants across all Green Villages workshops/forums
Currently reported Number 1756
Participant implementation Participants implementing improved practices/skills learned in workshops
# participants implementing new actions since attending a workshop / # participants attending workshops * 100
In development Number
Green - Environmental Sustainability Progress Report Q4 2012/13 64
Program Name KPI Name KPI Description Data source/Calculation Reported Unit of Measure Target
Environmental Grants Awards/Projects funded Number of grant applications awarded/projects funded
# projects funded in twelve month period Currently reported Number
Green Living Centre
Engagements Total number of workshops, fora, face-to-face engagements etc # of workshops held Currently reported Number 65
Participants Number of participants involved in engagements
# of participants across all workshops Currently reported Number 1200
Smart Green Apartments
Buildings registered Number of buildings which have registered interest in the program Currently reported Number
Base building energy reduction Average greenhouse gas emission reduction identified per building assessed
Currently reported Per cent
Action Plans Actions complete and considered (presentations done) Currently reported Number
Better Buildings Partnership
Total net lettable area Percentage total net lettable area involved in the program Currently reported Per cent 50 per cent
Members Number of members (including founding, joining, associate) Currently reported Number not less than
14
Environmental Upgrade Finance
EUAs signed Number of EU template agreements signed (non-residential, non-strata)
In progress Number 10
Emission reductions Estimated annual GHG reductions from upgrade projects that have signed an EUA
In progress Tonnes CO2 equivalent (tC02-e) pa
Green - Environmental Sustainability Progress Report Q4 2012/13 65
7. Green village program quarterly workshop detail
Green Village Workshops – Quarter 4 2012/13 Venue Date Attendees
What’s Eating My Basil? Natural Pest Management Ultimo Community Centre 7 April 55
Green Up Your Life: Home Surry Hills Neighbourhood Centre 11 April 15
Demystifying Renewables Redfern Town Hall 15 April 26
Green Up Your Life: Plate Surry Hills Neighbourhood Centre 18 April 54
Green Up Your Life: Work Surry Hills Neighbourhood Centre 16 May 27
Neighbourhood: Grow Your Own Urban Canopy The Grounds, Alexandria 18 May 10
Spotless: Natural Cleaning Ultimo Community Centre 23 May 40
Seed to Plate: Edible Gardens in Small Spaces Green Square School 25 May 35
Composting and Worm Farming Green Square School 25 May 32
Biodiversity: Fostering Local Wildlife Surry Hills Neighbourhood Centre 27 May 25
What’s Eating My Basil? Natural Pest Management Green Square School 22 June 40
Total Q4 2012/13 11 workshops 359
Green - Environmental Sustainability Progress Report Q4 2012/13 66
Explanatory notes to graphs 1. Organisation emissions waterfall and annual Changes to Q4 2012/13 waterfall graph The waterfall graph (p6) was simplified in Q4 2012/13 to more effectively show the total contribution of each project against the original 2006 baseline against which the City’s original 2030 target was set. 2006 Baseline - The 2005/06 data is used as the baseline against which the City’s emissions targets are set and has undergone verification to a "reasonable" level by external auditors. Independent verification of the baseline year gives the City an absolute emissions target in tonnes CO2-e. Portfolio change - Shows major portfolio changes the City has undergone since the targets for Sustainable Sydney 2030 were set. Irrespective of changes, the City's emissions targets are absolute. New accounts include:343 George Street, Ian Thorpe Aquatic Centre, Redfern Oval Grandstand, Surry Hills Community Centre, the Tote Building and Waterloo Depot. Allowance is also made for Mountain Street to come online soon. Closed accounts include Domain Parking Station and Lawson Square.
2030 Target to reduce 2006 emissions by 70 per cent by 2030.
LED Lighting and Energy Efficiency Retrofit projects – Previously some of the savings of this project were included in the “savings achieved” section. This made it difficult to see the contribution of this project to the overall council reduction. To continuously improve the quality of the data presentation the chart was changed in Q4 2012/13 to show the total project contributions more clearly.
Energy and Water Retrofit now complete by Origin (Ecosave) which required 23 per cent reduction of buildings 2006 greenhouse gas emissions. Project to save 6,641 MWh of electricity annually. LED Lighting contract with GE/UGL to replace 6,448 lights owned by the City contracted to save 2,101MWh per year.
Solar pv – Based on Solgen tender 1,933 tCO2e annual emissions savings for Yingli panels. No change in Q4 2012/13.
Renewable gas – this amount has been newly quantified in Q4 2012/13 based on the savings if the City replaced current usage with gas from renewable sources as outlined in the Renewable Energy Master Plan. Assumes 2012 gas usage levels in buildings. Does not make allowance for future acquisitions or disposals to property portfolio
15/5 Trigen – new savings based on preliminary assumptions for the Town Hall precinct trigeneration project. The previous trigeneration amounts were based on the Cogent agreement and have, therefore, been removed.
Ausgrid – Approximate estimate based on 2,816 tC02e savings from the City's upgrade of 6,448 lamps (approx 0.412 MWh or 0.437 tC02e per lamp per year) applied to 12,400 Ausgrid lights by 2030. No change in Q4 2012/13.
Renewables – An improved method for determining our 2030 electricity demand has been used. This has, therefore, meant an improvement in the methodology used to determine the amount of renewable electricity required to meet the City’s target for 30 per cent of electricity to come from renewable sources
Renewables inside LGA - Additional renewable electricity required to City's target based on forecast demand after the efficiency and PV projects above are implemented. Same proportion of within LGA generation (16.7 per cent) as identified for the broader LGA within Renewable Energy Master Plan applied to Council operations.
Renewables beyond LGA Additional renewable electricity required to City's target based on forecast demand after the efficiency and PV projects above are implemented. Same proportion of outside LGA generation (20 per cent) as per the Federal 20 per cent RET applied to Council operations..
Fleet - Target to reduce 2009 fleet emissions by 20% by 2014.
These waterfall charts will be updated as projects near completion or as tenders provide data which enables update of assumptions made.
Green - Environmental Sustainability Progress Report Q4 2012/13 67
2. Quarterly and annual organisation GHG emissions Quarterly results can be attributed to a number of influences:
• Seasonality of property data. Q1 has traditionally represented the highest quarter of electricity consumption for the financial year.
• Seasonality of street lighting data. Previous years (pre 2009/10) have contained street lighting data that was smoothed to account for billing cycles. Post 2009/10 actual street lighting data was available and consequently seasonal influences are reflected in the results, i.e. longer operating hours in the winter months
• Additional property assets. The addition of a number of properties has magnified the impact of seasonal high electricity consumption
We would anticipate a continued downward trend to be reflected in future quarter’s results.
Buildings, parks and street lighting - sourced from STEvE (the System for Tracking EVerything Environmental).
Fleet - Sourced directly from Fleet Services (converted from Shell fuel consumption data).
Other GHG - Sourced from most recent Carbon Inventory. All data annual and averaged across quarters for reporting purposes.
Currently the City’s solar photovoltaic (PV) installations are being separately metered to enable reporting of electricity generation. Energy generated at each site offsets that site’s mains electricity requirements.
Green - Environmental Sustainability Progress Report Q4 2012/13 68
3. LGA emissions waterfall Between the Q3 and Q4 2012/13 reporting periods improved data from the final Trigeneration Master Plan and draft Renewable Energy Master Plans became available. To ensure continuous improvement of the data provided this improved data was used to update the LGA waterfall graph for the Q4 2012/13 Report (p 26). The differences between the two graphs are outlined in the table below.
Q3 Green Report 2012/13 Q4 Green Report 2012/13
Title Amount Source description Title Amount Source description
TRIGENERATION 1,426,556
Kinesis - Interim Trigeneration Master Plan: 1,134,594 tCO2e annual savings by 2030 based on 360MWe operating 7am-10pm or 1,651,264 tC02e for 24-hr operation. Final master plan identified addition savings potential to a total of 1,381,000 tC02-e 7am-10pm and 2,027,000 tC02-e for 24-hr. Emissions savings estimates have also been applied pro-rate based on avoided emissions from refrigerants. Percentage uplift applied to 2030 BAU to create same 24% to 32% emissions saving as shown in final Trigeneration Master Plan.
15/5 TRIGENERATION 1,381,000 Total annual savings (1,381,000 tC02) by 2030 based on 477 MWe
operating 15/5 hrs from Trigeneration Master Plan.
RENEWABLE ELECTRICITY (INSIDE LGA)
570,000 Arup - Interim Renewable Energy Master Plan: 570kT C02e annual savings by 2030.
RENEWABLES INSIDE LGA 691,000
Annual generation (581 GWh) amounting to (0.691 MtCO2e) annual savings based on Renewable Energy Master Plan. Large scale wind turbines identified by Arup increasing renewable electricity generation inside the LGA to 703 GWh and reducing emissions by 0.745 MtCO2e not supported by the City.
RENEWABLE ELECTRICITY (BEYOND LGA)
486,000 Arup - Interim Renewable Energy Master Plan: 486kT CO2e annual savings by 2030 beyond the City.
RENEWABLES BEYOND LGA 848,848
Annual generation (801 GWh) amounting to (0.849 MtCO2e) annual savings based on 2030 BAU (4,564 GWh) less displaced electric A/C by trigeneration (560 GWh)= 4,004,000 kWh X 20% = 800,800 kWh x 1.06 t/CO2e/kWh = 848,848 t/CO2e at 2030.
RENEWABLE GAS 682,658
Arup - Interim Renewable Energy Master Plan: 1,093kT C02e annual savings by 2030 (not including AWT) based on 26.7PJ annual gas demand for 24-hr operation of 360MWe trigeneration. 683kT CO2e annual savings by 2030 estimated based on 16.7PJ annual gas demand for 7am-10pm operation of 360MWe trigeneration.
RENEWABLE GAS TRIGEN 833,009
Renewable gas total annual savings (0.833 MtCO2e) by 2030 based on displacing 100% of natural gas supplying trigeneration as detailed in the Trigeneration and Renewable Energy Master Plans.
ENERGY EFFICIENCY 321,000 Institute for Sustainable Futures - Energy Savings Plan Scoping Study: 300,000MWh annual savings potential by 2014. Emissions amounts to be updated on release of the Demand Management Master Plan.
ENERGY EFFICIENCY 905,642
Addition of MEPS (437,346 tC02e), LIGHTING TECHNOLOGIES (430,411 tC02e), and CAR PARKS (37,885 tCO2e) from Kinesis 2030 waterfall chart. Total emissions savings will not be known until completion of Energy Efficiency Master Plan.
WASTE 123,000
City of Sydney draft 2011 Interim Waste Strategy: 123kT C02e annual savings by 2030 through advanced waste treatment of City of Sydney MSW and C&I waste. Emissions amounts to be updated on release of the Advanced Waste Master Plan.
WASTE 123,000
Total annual savings (123,000 tC02e) by 2030 through advanced waste treatment of City of Sydney MSW and C&I waste identified by City of Sydney Interim Waste Strategy. Total emissions savings will not be known until completion of Advanced Waste Treatment Master Plan.
TRANSPORT 260,896 Kinesis, Sustainable Sydney 2030: 261kT CO2e annual savings by 2030. TRANSPORT 260,896 Total annual emissions savings (261,000 tCO2e) by 2030 from original Kinesis 2030 waterfall chart.
Green - Environmental Sustainability Progress Report Q4 2012/13 69
4. Water Graphs Annual organisation water initiatives All data - sourced directly from Sydney Water and contained within and reported from the STEvE system.
All data - measured quarterly in arrears. This is a consequence of the nature of water measurement and the need to read meters.
Classification of data - When there is more than 1 user of a meter, the system (STEvE) allocates that meter to the highest water user. The classification of properties may change over time and category total may vary, although total consumption will remain unchanged.
Cook and Philip Park Aquatic Centre is measured as a pool for the purposes of reporting, though there is some small park usage included in the water data.
Prince Alfred Park Pool is currently offline for the approved redevelopment of the park and facilities. It is expected to be included again in reporting from Q1 2012/13.
Quarterly Organisation Water Initiatives
All data - sourced directly from Sydney Water and contained within and reported from the STEvE system.
All data - measured quarterly in arrears. This is a consequence of the nature of water measurement and the need to read meters.
Classification of data - When there is more than 1 user of a meter, the system (STEvE) allocates that meter to the highest water user. The classification of properties may change over time and category total may vary, although total consumption will remain unchanged.
All water graphs Aquatic Facility - Comprises the City’s pools being Victoria Park Pool, Andrew Boy Charlton Pool, Cook and Phillip Park Aquatic Centre, Ian Thorpe Aquatic Centre and Prince Alfred Park Pool (under construction).
Community - Includes childcare centres, libraries, community centres and town halls.
Operations (depots, etc) - Includes depots and workshops
Commercial - Includes income producing buildings, such as Customs House, parking stations and retail shops. It also includes properties acquired for strategic purposes that do not fall into the above categories.
Parks and Public Domain - Includes parks, reserves, playgrounds, street closures, garden beds and nature strips. Also included are water features that are in the public domain.
Exceptions - Consistent with the City’s greenhouse gas reporting principles, only sites where the City has ‘operational control’ are included. For example properties where a whole building is leased and the tenant has full building operations and maintenance obligations, such as the Queen Victoria Building and the Capitol Theatre.
Note - A number of City buildings are used for multiple purposes – for example Customs House is used for office and retail, along with library and exhibition uses. In allocating each property to one of the above categories, the dominate water user was the determinate factor. Over time the categorisation of a property may change depending on the use.
LGA Mains Water Initiatives Annual All data - sourced directly from Sydney Water.
All data - measured annually in arrears. This is a consequence of the nature of water measurement and the need to read meters.