Page 1
City of Tallahassee
Fiscal Year 2010 Approved Budget - Fund Proforma Summary
001 General Fund
The General Fund supports many of the core city services. These services include police, parks and recreation,
traffic management, road maintenance, housing initiatives, economic development, land use and environmental
regulation, and animal services. The general government also provides an operating subsidy to StarMetro, the
city’s transit system. and contributes tax increment transfers to the Downtown and Frenchtown community
redevelopment agencies.
The General Fund appropriation for fiscal year 2010 is $133,791,015 which is an increase of $613,778 compared
to the approved fiscal year 2009 budget. The primary factor for this slightly higher budget is due to the increase
in the millage rate from 3.2115 mills in FY09 to 3.7000 mills in FY10. The City Commission made the decision
to set the tentative millage rate at 3.7000 mills for FY10 because of the 8.3% reduction in property values from
FY09 to FY10 and to re-establish the millage rate at the FY04 level. In FY04, the City Commission increased
the millage rate from 3.2000 mills to 3.7000 mills to pay for $85 million in capital projects through debt service,
of which $50 million was dedicated to neighborhood infrastructure. The Leon County Property Appraiser has
already noticed the city that FY11 property values will likely decrease another 3%. The result is that projected
general fund budgets in FY11 - FY14 all reflect deficits. Another major issue impacting the deficits in FY11 and
beyond is the significant increase in pension costs, which begin in FY11.
To adjust for these impacts, the fiscal year 2010 budget reflects the following personnel restructuring, program
elimination or reduction, and fee increases:
• Eliminating 52 positions (net) across nearly every department in the general fund.
• Eliminating non-union employee raises.
• Funding $1,524,000 in General Government Capital Project Account (GG/CPA) with a portion of the funding
coming from the 2004 Bond Series debt reserve, which exceeds the bond requirements by $824,000.
• Increasing the General Fund contribution to the StarMetro Fund by $245,078.
• Implementation of a one-day furlough in FY10 for non-union employees making at least $50,000, which results
in a savings of $61,539.
• Increasing vehicle replacement funding by 12.5% in FY10, to begin the process of aligning funding with actual
replacements.
• Implementation of a red light camera program, which is projected to generate $800,000 in revenue for FY10.
• The State of Florida has reduced the State Revenue Sharing amount by $689,356 in FY10 from the approved
FY09 budget.
• The State of Florida has reduced the Half Cent Sales Tax amount by $1,233,219 in FY10 from the approved
FY09 budget.
• Police union personnel will receive an average raise of 5.5%, per the bargaining unit agreement.
• Increasing the general fund contingency by $150,000.
• Reduced the vacancy factor from 3% in FY09 to 1% in FY10.
• Added $600,000 in Other Post Employment Benefit (OPEB) funding in FY10 – FY14, with $400,000 coming
from the Deficiencies Fund in FY10.
• Added $250,000 in additional parking revenue in FY10 – FY14.
• Added the COPS grant funding of $303,575 in FY10, FY11 and FY12.
• Converting two existing city-observed holidays to floating personal days will result in overtime savings.
• Transfer to the Deficiencies Fund of $1.9 million to begin replenishing the fund balance that has been drawn
down below policy level in prior years.
Fund Pro FormasFiscal Year 2010
F-1
Page 2
City of Tallahassee
Fiscal Year 2010 Approved Budget - Fund Proforma Summary
001 General Fund
BudgetBudget Budget Budget BudgetFY 2010 FY 2011 FY 2012 FY 2013 FY 2014
Actual EstimateFY 2009FY 2008
Expenditures
74,868,349 79,252,072 81,549,745 83,912,749 86,393,963 75,887,614 76,901,259Personnel Services
11,119,740 11,349,988 11,383,502 11,408,522 11,476,452 7,138,372 7,411,367Operating
2,376,698 2,226,698 2,226,698 2,226,698 2,226,698 2,232,957 2,330,734Other Services & Charges
244,100 244,100 244,100 244,100 244,100 247,799 175,323Capital Outlay
17,661,644 17,939,870 18,434,326 18,941,222 19,467,048 19,038,558 17,002,738Allocated Accounts
5,231,547 5,332,914 5,431,882 5,538,752 5,538,752 5,241,781 4,457,136Utilities and Other Expenses
11,432,786 9,876,391 10,905,556 11,117,516 12,123,675 12,460,384 11,551,836Transfers
8,939,019 9,729,889 10,045,499 10,363,301 10,719,880 10,042,625 8,315,522Contributions to Operations
1,917,132 294,350 303,200 312,300 321,650 0 0Year End Adjustments
BudgetBudget Budget Budget BudgetFY 2010 FY 2011 FY 2012 FY 2013 FY 2014
Actual EstimateFY 2009FY 2008
Revenues
57,142,750 56,456,811 57,325,245 58,257,598 59,185,956 55,734,969 54,869,743Taxes & Franchise Fees
2,780,157 2,788,993 2,798,036 2,807,188 2,814,590 3,277,806 2,694,653Licenses & Permits
13,624,720 13,884,268 14,148,801 14,115,052 14,378,754 15,551,474 14,196,020Intergovernmental Revenue
8,869,709 9,050,970 9,217,770 9,410,242 9,443,532 6,893,664 7,746,435Charges for Services
1,463,500 1,483,300 1,503,200 1,524,200 1,545,200 1,271,752 1,194,811Fines & Forfeitures
12,615,200 12,715,852 13,094,958 13,425,303 13,429,913 12,630,408 13,604,308Other Revenues
37,294,979 37,399,627 37,239,471 37,617,949 38,153,425 36,930,018 34,699,679Other Sources
133,791,015
133,791,015
Fund Total Expenditure
Fund Total Revenue
0Fund Balance
138,951,370 137,157,532 135,327,481 133,779,821 129,005,649 132,290,091
148,512,218 144,065,160 140,524,508 136,246,272 128,145,915 132,290,090
0 859,734 -2,466,451 -5,197,027 -6,907,628 -9,560,848
FY 2008BudgetBudget Budget Budget Budget
FY 2010 FY 2011 FY 2012 FY 2013 FY 2014Actual Estimate
FY 2009Fund Summary
Fund Expenditures
Expenditure projections are developed by eight major categories. Historically, personnel costs represent the
fund’s largest direct expenditure and account for a significant percentage of the Allocated Accounts category.
The next largest expenditure category is Transfers, which includes the general government capital projects
account and debt service.
The Personnel Services category, budgeted at $74.9 million, supports the 1,056.71 FTE positions that
implement general government services and programs. During FY09, city staff met with the City Commission
on three separate occasions (January 28th, April 15th and June 18th) to discuss mid-year FY09 adjustments
and planning for the FY10 budget. The result was that several mid-year FY09 expenditure reductions were
approved by the City Commission that also lower costs in FY10. For the FY10 budget, fifty seven positions
have been eliminated, while five positions have been added.
Salary enhancements for general government employees were approved at 0%, while Police union employees
were approved at an average increase of 5.5%, per the collective bargaining agreement. Negotiations between
management and the Fire union will continue into FY10, regarding FY10 raises for Fire union personnel. Other
adjustments to personnel expenses included cost sharing of the increase in health care premiums between the
city and employees, salary updates, position changes, and intradepartmental transfers. A lay-off compensation
package provides up to six weeks of salary benefits and payment of three months health insurance for
employees whose positions will be eliminated.
Operating expenditures are generally held at the fiscal year 2009 appropriation levels. Exceptions are made for
contractual service agreements with escalation clauses. One significant increase is the addition of $600,000 to
fully fund a liability for other post employee benefits as required under GASB No. 45. As part of the FY10
budget process to reduce costs, departments made reductions throughout several accounts in this category,
Fund Pro FormasFiscal Year 2010
F-2
Page 3
City of Tallahassee
Fiscal Year 2010 Approved Budget - Fund Proforma Summary
001 General Fund
including advertising, cleaning and laundry, reproduction, office supplies and travel and training.
In the Other Services and Charges category, donations to outside agencies were reduced by 20% for FY10, with
the exception of social services. Funding for the contingency account is $150,000 over the FY09 level.
Following the annual review of non-collectible accounts, funding for bad debt is equal to last year’s appropriation.
The Capital Outlay category provides funding for fixed assets that have a value of $750 or more and have a
useful life of more than one year. Typical expenditures include the purchase of new vehicles, heavy equipment,
and computers not covered in the Fleet and Information Systems and Services (ISS) allocations. In fiscal year
2010, the major expenses are related to replacement equipment for park maintenance.
Allocated accounts budget for internal services that are driven primarily by personnel expenditures. In keeping
with the overall reduction of expenses in FY10, positions are being eliminated in nearly all of the allocated
departments. In fact, the warehouse function is being re-organized and shifted from the Purchasing unit to the
Electric department in FY10. This reorganization will result in three positions being eliminated and $274,237
being reduced from the Purchasing unit budget in FY10.
Utilities and Other Expenses category costs for fiscal year 2010 include rate studies approved March 26, 2008,
which include phased-in increases from April of 2008 through FY10 for sewer services at rates of 15%, 14% and
14%. A water rate increase of 12.9% was implemented effective January 1, 2009, and will be increased by an
additional 11% in FY11. The average residential customer natural gas bill increased by $2.50 on April 1, 2008,
and will be increased by $1.10 on October 1, 2009. The electric fuel/purchased power charge rate will decrease
from $0.07605 per kwh to $0.06470 per kwh effective October 1, 2009.
Transfers include debt service, cash financing of capital projects, and services offered by Public Works to
external governmental agencies. FY10 debt service, budgeted at $9,099,439, is based on debt for bonds issued
through 2009 and loans from internal sources. Based on the capital improvement plan, new debt is anticipated
in FY11. Cash financing for capital projects, the GG/CPA transfer, is budgeted at $1,524,000 in FY10, which is
significantly more than the $720,000 budgeted in FY09. Public Works anticipates performing services
amounting to $308,847 for external agencies in fiscal year 2010.
Contributions to Operations include coverage of an operating deficit in the StarMetro fund and pass-through of
tax increment funds to the Frenchtown and Downtown Community Redevelopment Agencies (CRA). The
operating deficit for StarMetro is projected at $7,925,134, while the tax increment for the Frenchtown and
Downtown CRA's is $656,551 and $357,334, respectively.
Property taxes represent the largest source of General Fund revenues. Over the last two years, the State of
Florida through either the Legislature or by referendum has reduced the amount of ad valorem revenue that local
governments can generate through millage rate adoption. For FY10, the market forces are further correcting
what the State has artifically corrected in the previous two years. The City of Tallahassee is experiencing an
8.3% reduction in property values, based on the July 1st certification provided by the Leon County Property
Appraiser. The City Commission set the tentative millage rate at 3.7000 mills on July 1st, which will generate
an additional $1.7 million in revenue in FY10, and required a two-thirds vote to adopt on September 23, 2009.
The City-owned utilities make contributions to the General Fund from their operations. The electric contribution
is set at an amount comparable to 8.3 mills of kilowatt hour (kWh) retail sales. The contribution levels for water
and sewer are based on a percentage of the prior three-year average of gross system revenues from each utility.
The percentage is set at 20% for water and 4.5% for sewer. The solid waste contribution also is calculated at
0.75% of the prior three-year average of system revenues. The contribution from gas is not related to sales and
is set at a fixed rate of $2,323,000, which is the same amount as FY09. Currently, Stormwater does not make
a contribution.
Fund Revenues
Fund Pro FormasFiscal Year 2010
F-3
Page 4
City of Tallahassee
Fiscal Year 2010 Approved Budget - Fund Proforma Summary
001 General Fund
Intergovernmental revenue is budgeted at $13,624,720, which is 13% below fiscal year 2009 adopted revenues.
State revenue sharing and Florida 1/2 cent sales tax are down from FY09 by $616,824 and $1,102,498
respectively. The reduction is attributed to a statewide decline in the housing industry, dwindling repair and
replacement cost from hurricanes, and an economic recession. Federal grant proceeds are essentially the
same as fiscal year 2009, although some additional grant revenue is expected under the stimulus bill.
Specifically, the city was notified of a COPS grant award, which will provide $910,725 over FY10 - FY12, to
retain five police officer positions. As a result of Leon County's decision to eliminate the county business tax for
FY10, revenue to the city from this source is also eliminated ($147,620).
Revenues from licenses and permits are comprised of occupational licenses and land use environmental fees
(LUES). The land use and environmental fees are down significantly from FY09 due to the ongoing housing and
economic recession. Growth Management LUES programs also are supplemented by a transfer from the
Stormwater Fund, which supports two positions in that section.
Charges for Services capture those revenues that are generated by specific activities such as recreation
program fees, contractual police services, planning fees, parking, animal services, public works programs, and
interlocal agreements with Leon County. The interlocal agreements with the county support operations of the
Tallahassee-Leon County Planning Department, the Animal Services Center, and parks and recreation
programs.
Revenues of approximately $12.6 million are projected from miscellaneous, non-operating sources. These
include interest on city investments, applied expenses for the wages of city employees whose work is primarily
related to capital projects, overhead allocations from other funds, lease of land, rental of buildings, and a new
red light camera revenue of $800,000 annually.
Fines and forfeitures account for approximately $1.5 million of the general fund. This category has experienced
little growth in the last several years primarily due to implementation of Article V, which changed the distribution
formula and reduced the percentage of traffic fines received by municipalities from the state. However, the city
traffic violation fees were increased by $7 in FY08, which is used to partially fund school crossing guards.
There are two significant revenue charts on the next page. The first chart, Property Taxes, details the impact of
both legislative and voter approved actions in FY08 and FY09 respectively, resulting in declines. In FY10, the
City Commission increased the ad valorem tax rate to 3.7 mills, from 3.2115 mills in FY09. This is a 15%
increase in the millage rate, but only a 5% increase in revenue since property values declined by an average of
8.3%. A further reduction of 3% is projected in FY11, before returning to a more predictable growth pattern for
FY12 – FY14.
The second chart, State of Florida Revenues, details the impact of the economic recession on state revenues to
the city, from FY08 – FY10. The first line on the chart, Florida ½ cent sales tax, declines from $9.6 million in
FY08 to the FY10 budgeted amount of $8.3 million, which is nearly a 14% reduction. In comparing the FY08
State of Florida revenue sharing, the second line on the chart, of $4.8 million to the FY10 budgeted amount of
$4.1 million, a 15% reduction is detailed over two years. Both revenue sources are predicted to return to a more
normal pattern of growth in FY11 – FY14.
Fund Pro FormasFiscal Year 2010
F-4
Page 5
City of Tallahassee
Fiscal Year 2010 Approved Budget - Fund Proforma Summary
001 General Fund
Capital Projects Operating Budget Impacts
There are no specific operating impacts from capital projects detailed in FY10; however, many general
government capital projects will require future maintenance of sidewalks, guardrails, pavement, landscape, and
stormwater facilities.
Fund Pro FormasFiscal Year 2010
F-5
Page 6
City of Tallahassee
Fiscal Year 2010 Approved Budget - Fund Proforma Account Summary
001 General Fund
BudgetBudget Budget Budget Budget
FY 2010 FY 2011 FY 2012 FY 2014
Actual Estimate
FY 2009FY 2008
Expenditures Adopted
FY 2009 FY 2013
53,535,351 55,630,326 53,251,697 54,324,489 55,407,477 57,059,910 58,761,891Salaries 54,113,385
-2,917,183 -2,853,048 -2,496,582 -2,494,319 -2,489,759 -2,493,439 -2,493,439Capitalized Wages -2,950,894
0 11,188 944,005 1,078,359 1,650,840 1,700,347 1,751,390Salary Enhancements 1,955,557
4,032,690 3,626,686 3,470,691 3,472,823 3,474,977 3,477,153 3,515,543Temporary Wages 3,627,364
3,640,301 3,082,075 3,073,547 3,073,545 3,073,545 3,073,545 3,073,545Overtime 3,283,001
-393,607 -377,396 -291,528 -293,628 -295,728 -295,728 -295,728Capitalized Overtime -312,061
800,146 799,155 769,916 773,036 769,916 769,916 769,916Other Salary Items 893,780
51,185 63,076 95,721 95,721 95,721 95,721 95,721Unemployment Compensation 143,163
6,032,820 6,083,477 5,900,059 8,648,084 8,903,348 9,166,285 9,437,295Pension- Current 6,082,530
2,634,609 2,478,154 2,413,592 2,457,827 2,530,583 2,605,535 2,682,902Pension- MAP 2,543,152
3,449 751 0 0 0 0 0Social Security 33,066
754,966 764,458 627,434 639,314 658,297 677,854 698,003Mandatory Medicare 645,481
5,762,598 5,690,779 5,737,019 6,041,499 6,344,641 6,664,150 7,000,249Health Benefits 5,979,840
412,978 421,608 434,257 447,285 447,285 447,285 447,285Health Benefits-Retirees 421,609
1,537,311 1,480,155 1,463,307 1,460,839 1,460,839 1,460,839 1,460,839Flex Benefits 1,584,790
0 0 -463,247 -472,802 -482,237 -496,624 -511,449Vacancy factor of 1.0% -1,216,001
0 0 -61,539 0 0 0 0Furlough savings 0
0 -185 0 0 0 0 0Three Percent Freeze 0
74,868,349 79,252,072 81,549,745 83,912,749 86,393,963 75,887,614 76,901,259Personnel Services 76,827,762
112,691 93,155 144,230 144,230 144,230 144,230 144,230Advertising 163,465
171,065 171,199 187,777 187,777 187,777 187,777 187,777Cleaning & Laundry 201,383
82,233 129,414 152,794 152,844 152,894 152,894 152,894Reproduction 205,854
117,795 112,741 762,641 763,344 764,402 764,459 764,859Unclassified Professional Svcs 242,708
223 0 0 0 0 0 0System Dispatch Services 0
170 405 0 0 0 0 0System Collection 0
89,764 96,045 162,866 162,866 162,866 162,866 162,866Building Repairs 169,580
242,786 236,734 308,258 308,258 308,258 308,258 308,258Equipment Repairs 315,776
64,492 37,893 21,288 21,288 21,288 21,288 21,288Medical Services 28,288
0 0 21,000 21,000 21,000 21,000 21,000Educational Services 21,000
335 0 0 0 0 0 0Engineering Services 500
250 0 0 0 0 0 0Contract Engineering Svcs 0
154,770 162,460 162,460 167,334 172,354 177,525 182,851Legal Services 173,068
348 0 0 0 0 0 0Construction Services 0
2,499,206 2,873,896 4,160,602 4,352,979 4,373,831 4,389,385 4,405,206Unclassified Contract Svcs 4,195,351
87,820 68,232 113,163 113,433 113,433 113,433 113,433Computer Software 151,390
39 170 0 0 0 0 0Environmental Contractual 0
217,486 218,212 218,162 218,162 218,162 218,162 218,162Garage Employee Parking 218,162
0 250 0 0 0 0 0Utilities- Electric 0
276,947 194,861 187,629 187,629 187,629 187,629 187,629Telephone 168,502
127,293 135,898 138,867 138,867 138,867 138,867 138,867Chem-Med-Lab 136,472
46,358 41,050 38,037 38,037 38,037 38,037 38,037Food 46,128
2,607 3,792 8,593 8,593 8,593 8,593 8,593Gasoline 12,695
887 958 1,200 1,200 1,200 1,200 1,200Oil & Lubricants 1,200
19,919 20,992 25,363 25,363 25,363 25,363 25,363Postage 30,463
286,038 250,719 286,114 286,114 286,114 286,114 286,114Office Supplies 328,499
230,749 223,513 257,130 257,130 257,130 257,130 257,130Uniforms & Clothing 260,096
1,258,828 1,334,862 2,015,822 2,025,822 2,025,822 2,025,822 2,064,630Unclassified Supplies 2,093,168
4,772 833 710 710 710 710 710Non-Capitalized Furniture 710
12,375 0 15,139 15,139 15,139 15,139 15,139Vehicle- Non-Garage 15,139
45,471 39,670 69,761 69,761 69,761 69,761 69,761Building Supplies 69,761
50 0 0 0 0 0 0Safety Materials & Supplies 0
214,885 157,750 307,181 307,181 307,181 307,181 307,181Travel & Training 359,062
53,790 57,481 77,850 94,793 94,793 94,793 94,793Journals & Books 93,413
148,644 150,579 143,446 146,005 148,411 148,411 151,611Memberships 156,979
196 7,856 8,670 8,670 8,670 8,670 8,670Certificates & Licenses 5,200
148,705 194,664 614,628 616,034 619,049 622,155 625,353Rent Expense- Bldg & Ops 570,749
142,170 143,341 153,744 153,744 153,744 153,744 153,744Rent Expense- Land 147,601
159,747 139,119 154,935 154,935 154,935 154,935 154,935Rent Expense- Machines 155,596
116,473 117,367 199,680 200,746 201,859 202,991 204,168Unclassified Charges 235,406
0 -4,744 0 0 0 0 0Freeze of operating expenditures -246,068
11,119,740 11,349,988 11,383,502 11,408,522 11,476,452 7,138,372 7,411,367Operating 10,727,296
Fund Pro FormasFiscal Year 2010
F-6
Page 7
City of Tallahassee
Fiscal Year 2010 Approved Budget - Fund Proforma Account Summary
001 General Fund
BudgetBudget Budget Budget Budget
FY 2010 FY 2011 FY 2012 FY 2014
Actual Estimate
FY 2009FY 2008
Expenditures Adopted
FY 2009 FY 2013
2,137,957 2,235,734 2,081,698 2,081,698 2,081,698 2,081,698 2,081,698Donations 2,308,148
95,000 95,000 95,000 95,000 95,000 95,000 95,000Bad Debt Expense 95,000
0 0 200,000 50,000 50,000 50,000 50,000City Contingency 50,000
2,376,698 2,226,698 2,226,698 2,226,698 2,226,698 2,232,957 2,330,734Other Services & Charges 2,453,148
2,791 0 10,000 10,000 10,000 10,000 10,000Office Equipment 10,000
34,569 0 0 0 0 0 0Vehicle Equipment 0
210,439 175,323 234,100 234,100 234,100 234,100 234,100Unclassified Equipment 234,100
244,100 244,100 244,100 244,100 244,100 247,799 175,323Capital Outlay 244,100
1,670,597 1,711,330 1,605,082 1,605,082 1,653,238 1,702,835 1,753,928Human Resource Expense 1,895,717
1,188,527 1,098,990 1,229,691 1,229,691 1,266,583 1,304,582 1,343,716Accounting Expense 1,149,870
720,241 570,486 463,273 463,273 477,171 491,486 506,231Purchasing Expense 570,464
6,013,730 6,175,244 6,388,107 6,388,107 6,579,750 6,777,143 6,980,457Information Systems Expense 6,881,721
3,051,356 1,961,861 2,031,661 2,031,661 2,092,611 2,155,389 2,220,051Risk Management Expense 1,961,856
468,549 472,040 387,313 387,313 399,359 409,376 423,413Radio Communications Expense 472,042
671,138 1,042,734 845,430 845,430 870,793 896,917 923,824Revenue Collection Expense 1,085,300
394,758 150,924 147,728 147,728 152,160 156,725 161,427Utility Services Expense 150,923
0 48,057 44,250 44,250 45,578 46,945 48,353Environmental 48,058
4,035,521 1,760,650 2,134,742 2,134,742 2,198,784 2,264,748 2,332,690Vehicle Garage Expense 1,859,876
0 975,332 1,190,211 1,190,211 1,225,917 1,262,695 1,300,576Vehicle Fuel 1,984,448
824,141 1,035,090 1,194,156 1,472,382 1,472,382 1,472,382 1,472,382Vehicle Replacement 1,054,913
17,661,644 17,939,870 18,434,326 18,941,222 19,467,048 19,038,558 17,002,738Allocated Accounts 19,115,188
102,284 102,158 115,614 116,855 116,855 116,855 116,855Utilities - Sewer 101,984
184,760 157,619 156,908 157,007 157,007 157,007 157,007Utilities - Sanitation 138,767
134,640 134,080 141,811 146,274 146,274 146,274 146,274Utilities - Stormwater 119,626
178,941 221,911 224,422 225,676 225,676 225,676 225,676Utilities - Gas 192,892
196,023 200,140 208,756 211,616 211,616 211,616 211,616Utilities - Water 179,359
4,312,994 3,537,239 4,275,669 4,367,119 4,466,087 4,572,957 4,572,957Utilities - Electric 3,774,784
54,711 56,916 64,901 64,901 64,901 64,901 64,901Utilities - Fire Services 65,063
77,427 47,073 43,466 43,466 43,466 43,466 43,466COGS - Other 36,924
5,231,547 5,332,914 5,431,882 5,538,752 5,538,752 5,241,781 4,457,136Utilities and Other Expenses 4,609,399
10,280,449 9,364,161 9,099,439 9,067,044 10,596,209 10,808,169 11,814,328Debt Service Transfer 9,259,161
2,179,935 2,187,675 2,333,347 809,347 309,347 309,347 309,347Inter-Fund Transfer 1,041,172
11,432,786 9,876,391 10,905,556 11,117,516 12,123,675 12,460,384 11,551,836Transfers 10,300,333
8,724,241 6,797,938 7,925,134 8,746,421 9,047,279 9,350,108 9,686,423Contribution to StarMetro Fund 7,680,056
170,844 289,533 0 0 0 0 0Contribution to Golf Course 0
695,619 768,447 656,551 636,854 646,407 656,103 669,225Contribution to CRA Frenchtown 720,474
451,921 459,604 357,334 346,614 351,813 357,090 364,232Contribution to CRA Downtown 479,940
0 0 0 0 0 0 0Transfer to MPO Fund 19,541
8,939,019 9,729,889 10,045,499 10,363,301 10,719,880 10,042,625 8,315,522Contributions to Operations 8,900,011
0 0 1,917,132 294,350 303,200 312,300 321,650Transfer to Deficiencies Fd 0
1,917,132 294,350 303,200 312,300 321,650 0 0Year End Adjustments 0
Fund Pro FormasFiscal Year 2010
F-7
Page 8
City of Tallahassee
Fiscal Year 2010 Approved Budget - Fund Proforma Account Summary
001 General Fund
BudgetBudget Budget Budget Budget
FY 2010 FY 2011 FY 2012 FY 2014
Actual Estimate
FY 2009FY 2008
Revenues Adopted
FY 2009 FY 2013
33,592,119 32,691,638 34,734,179 33,692,154 34,197,536 34,710,499 35,404,709Ad Valorem Property Tax 33,734,988
10,302,685 10,302,686 10,405,712 10,561,798 10,720,225 10,934,629 11,153,322Electricity Tax 11,456,500
1,450,684 1,450,684 1,500,000 1,515,000 1,530,150 1,545,452 1,560,907Water Tax 1,762,454
951,233 968,715 987,121 1,006,369 1,027,201 1,049,697 1,049,697Gas Tax 968,715
13,829 3,845 3,500 3,500 3,500 3,500 3,500Fuel Oil Tax 3,500
283,871 311,628 284,445 288,711 293,041 293,041 293,041Propane Tax 276,100
9,140,547 9,140,547 9,227,793 9,389,279 9,553,592 9,720,780 9,720,780Communication 9,069,084
57,142,750 56,456,811 57,325,245 58,257,598 59,185,956 55,734,969 54,869,743Taxes & Franchise Fees 57,271,341
1,824,516 1,804,446 1,920,000 1,920,000 1,920,000 1,920,000 1,920,000Occupational Licenses 1,920,000
7,438 8,525 7,400 7,400 7,400 7,400 7,400Taxi Cab Permits 7,400
13,788 12,326 16,500 16,500 16,500 16,500 16,500Loading Zone Permits 16,500
830,707 573,188 500,000 505,000 510,050 515,150 520,302Environmental Permits 725,000
1,902 190 0 0 0 0 0Contractor Licensing- Growth 0
330,472 161,078 163,620 165,256 166,909 168,578 170,264Land Use Fees- Growth Mngmt 294,308
76,091 32,922 84,730 86,383 88,171 89,996 89,996Environmental Analysis I 83,150
31,549 23,252 30,000 30,000 30,000 30,000 30,000Environmental Analysis II 30,000
157,471 73,641 54,707 55,254 55,806 56,364 56,928Concurrency Fees 227,495
3,290 5,085 3,200 3,200 3,200 3,200 3,200Environmental Variance Funds 3,200
584 0 0 0 0 0 0Bid Non Fbc Fees 0
2,780,157 2,788,993 2,798,036 2,807,188 2,814,590 3,277,806 2,694,653Licenses & Permits 3,307,053
0 0 303,575 303,575 303,575 0 0U.S. Department of Justice 0
382,091 606,783 420,500 429,410 438,410 447,599 447,599HUD- Community Dvlpmnt Block 406,783
37,453 114,355 117,925 120,071 122,142 124,249 124,249HUD- Home Program 114,355
160,477 122,800 122,800 122,800 122,800 122,800 122,800FL Housing Fin Agncy SHIP 122,800
500 300 300 300 300 300 300Southwood Golfcart Ord. Reg. Ree 300
4,873,314 4,209,129 4,112,866 4,195,123 4,279,026 4,364,606 4,451,898State of FL Revenue Sharing 4,802,222
53,484 67,000 67,000 67,000 67,000 67,000 67,000Mobile Hm License City Share 67,000
125,856 125,000 112,000 112,000 112,000 112,000 112,000Beverage License 112,000
9,658,033 8,714,157 8,311,731 8,477,966 8,647,525 8,820,475 8,996,885Florida 1/2 Cent Sales Tax 9,544,950
125,711 145,085 0 0 0 0 0City Share County Occ. Licen 145,085
134,555 91,411 56,023 56,023 56,023 56,023 56,023Payment in Lieu of Taxes 56,023
13,624,720 13,884,268 14,148,801 14,115,052 14,378,754 15,551,474 14,196,020Intergovernmental Revenue 15,371,518
Fund Pro FormasFiscal Year 2010
F-8
Page 9
City of Tallahassee
Fiscal Year 2010 Approved Budget - Fund Proforma Account Summary
001 General Fund
BudgetBudget Budget Budget Budget
FY 2010 FY 2011 FY 2012 FY 2014
Actual Estimate
FY 2009FY 2008
Revenues Adopted
FY 2009 FY 2013
10,906 10,906 28,000 28,000 28,000 28,000 28,000Planning Fees- Rezoning 28,000
69,621 150,516 72,236 74,403 76,635 78,934 81,302Co Share of Co Employees 150,516
689,263 726,103 813,622 838,031 863,172 889,063 915,739Co Contrib w/o Co Empl 726,103
22,111 30,284 33,759 33,759 33,759 33,759 33,759Leon Co Rent and O&M 30,284
20 40,000 85,000 85,000 85,000 85,000 85,000Police Protection 100,000
66,350 130,650 126,700 130,500 134,400 138,450 142,600Police Sec FSU/FAMU Football 116,250
11,160 7,817 8,400 8,400 8,400 8,400 8,400Police - Fingerprint Fees 25,000
1,350 2,000 2,000 2,000 2,000 2,000 2,000Other Miscellaneous Revenue 2,000
0 309,150 210,938 210,938 210,938 210,938 210,938Sale of Cemetery Lots 309,150
265,386 275,000 275,000 275,000 275,000 275,000 275,000Parking Meter Receipts 275,000
32,948 101,078 390,000 390,000 390,000 390,000 390,000Parking Lot Proceeds 390,000
703,048 694,700 864,400 864,400 864,400 864,400 864,400DIA Garage Revenue 694,700
354,222 354,222 548,651 556,913 565,336 573,923 573,923Capital Commons Garage 477,552
18,017 9,000 9,000 9,000 9,000 9,000 9,000Lot Mowing & Clearing 9,000
2,000 79,500 0 0 0 0 0Install New Signals-Developer 0
62,955 63,164 64,151 65,184 66,237 67,307 67,307Traffic Signal Control Maint 63,164
488,057 494,817 494,817 494,817 494,817 494,817 494,817FDOT ROW Maintenance Contrac 494,817
52,968 52,968 52,968 52,968 52,968 52,968 52,968Concurrency Counts - PW 52,968
6,576 17,500 17,500 17,500 17,500 17,500 17,500FSU Traffic Service - PW 17,500
7,524 7,740 7,956 8,172 8,424 8,424 8,424FSU-Maint of Traffic Signals 7,740
233,928 248,362 238,000 245,000 252,200 259,612 259,612FDOT-Maint of Traffic Signal 231,000
2,508 2,580 2,652 2,724 2,809 2,897 2,897Gadsden Cty-Maint of Traff S 2,580
128 0 0 0 0 0 0Animal Shelter Operations 0
109,590 102,693 142,956 146,332 150,166 154,100 154,100Animal Shelter- Adoptions 138,955
7,472 7,536 3,708 3,781 3,859 3,839 3,839Animal Shelter- ARV 3,639
4,528 5,000 5,000 5,000 5,000 5,000 5,000Animal Shelter- Bite Boardin 5,000
17,435 16,978 17,301 17,638 18,003 18,376 18,376Animal Shelter- Board 16,978
12,000 0 0 0 0 0 0Animal Shelter- Forfeited De 0
26,650 26,790 12,469 12,712 12,975 13,243 13,243Animal Shelter- City Impound 12,236
3,447 3,072 27,500 27,500 27,500 27,500 27,500Animal Shelter- Miscellaneou 29,825
19,605 22,875 15,887 16,197 16,533 16,876 16,876Animal Shelter- County Board 15,591
0 0 5,000 5,000 5,000 5,000 5,000Animal Shelter- Co Ticket 5,000
424,047 466,963 480,972 495,401 510,263 525,571 525,571Cnty Animal Services Contract 466,963
1,302 3,500 3,500 3,500 3,500 3,500 3,500Animal Shelter-Vet Fees Repaid 3,500
-617 3,600 3,600 3,600 3,600 3,600 3,600Animal Shelter - Altering Fees 3,600
4,220 4,080 600 600 600 600 600Out of County Drop Off 600
56,663 52,554 24,000 25,000 26,000 27,040 27,040Internal Vet Services 23,000
1,107,874 1,150,000 1,506,343 1,546,977 1,568,677 1,611,469 1,611,469Miscellaneous Recreation Fee 1,323,475
39,129 50,105 39,870 40,648 41,489 42,347 42,347Park Concessions 39,127
78,597 78,895 84,031 86,152 88,328 91,011 91,011Oven Park Rental 78,895
53,928 32,535 47,897 49,107 50,348 51,622 51,622Brokaw McDougal House 45,000
76,205 75,599 80,681 82,714 84,799 86,939 86,939Soccer Field Rental 75,599
-616 5,000 5,131 5,265 5,403 5,545 5,545Misc Rec Fees-Enterprise Proj. 5,000
106,944 110,000 126,349 129,539 132,812 136,172 136,172Gaither Green Fees 118,669
8,946 10,457 13,798 14,146 14,504 14,870 14,870Gaither Pro Shop Revenues 12,950
8,022 9,789 12,735 13,058 13,389 13,729 13,729Gaither Concessions 12,000
63,070 65,000 81,065 83,114 85,217 87,375 87,375Gaither Golf Cart Fees 76,229
77 0 0 0 0 0 0Hilaman Improvement Surcharg 0
99 0 0 0 0 0 0Gaither Improvement Surcharg 0
92 0 0 0 0 0 0Hilaman Golf Cart Fees 0
291,316 334,729 349,556 358,556 367,556 377,556 377,556Swimming Pool Revenues 334,729
-33 0 0 0 0 0 0Area Tallahassee Aquatic Clu 0
4,695 27,667 0 0 0 0 0Online registrations-misc. P&R 0
875,700 912,917 951,716 992,164 1,034,331 1,078,290 1,078,290County Contrib - Parks and R 912,917
23,414 21,587 21,961 22,516 23,085 23,670 23,670Special Events 20,645
53,843 50,000 43,815 44,922 46,059 47,226 47,226Annual Fees 41,212
2,396 3,252 3,447 3,535 3,624 3,716 3,812Monthly Fees 3,252
93,388 111,345 123,562 126,193 128,893 131,663 131,663Tennis Daily Fees 97,871
22,255 22,000 70,372 72,553 74,552 75,652 75,652Special Programs 66,342
6,444 7,962 8,451 8,665 8,884 9,110 9,110Pro Shop Contract 7,962
89,435 44,415 153,973 158,399 162,957 167,652 167,652Lessons Contract 143,222
1,432 1,400 1,497 1,534 1,573 1,613 1,613Restaurant Contract 1,400
6,632 7,805 18,995 19,478 19,974 20,483 20,483Other Parks & Rec Revenues 17,975
11,831 12,127 12,873 13,199 13,533 13,877 13,877Racquet Daily Fees 12,127
8,423 8,098 8,610 8,828 9,051 9,280 9,280Aerobics Daily Fees 8,098
50,567 50,000 1,905 1,905 1,905 1,905 1,905Tennis Clinic Revenue 0
14,766 0 556 556 556 556 556Tennis Camps 0
Fund Pro FormasFiscal Year 2010
F-9
Page 10
City of Tallahassee
Fiscal Year 2010 Approved Budget - Fund Proforma Account Summary
001 General Fund
BudgetBudget Budget Budget Budget
FY 2010 FY 2011 FY 2012 FY 2014
Actual Estimate
FY 2009FY 2008
Revenues Adopted
FY 2009 FY 2013
4,230 4,989 159 159 159 159 159Tennis Facility Revenue 0
3,134 3,035 118 118 118 118 118Other Rentals - BM, Rentals, etc. 0
0 29 0 0 0 0 0Other Non-Taxable Rentals 0
40 0 0 0 0 0 0GeoLearning 0
0 12,000 12,000 12,000 12,000 12,000 12,000Pre-employment testing fees 23,000
8,869,709 9,050,970 9,217,770 9,410,242 9,443,532 6,893,664 7,746,435Charges for Services 8,405,907
829,433 641,841 800,000 816,000 832,000 849,000 866,000Traffic Fines 1,038,000
417,033 390,957 450,000 450,000 450,000 450,000 450,000Parking Violations 500,000
11,685 13,000 13,000 13,000 13,000 13,000 13,000Police False Alarm 13,000
0 0 10,500 10,500 10,500 10,500 10,500NCS Collection Agency Remit 10,500
13,601 149,013 190,000 193,800 197,700 201,700 205,700Traffic Violation Surcharge 0
1,463,500 1,483,300 1,503,200 1,524,200 1,545,200 1,271,752 1,194,811Fines & Forfeitures 1,561,500
778,968 500,000 450,000 500,000 500,000 500,000 500,000Interest 600,000
64,481 70,078 84,093 100,912 120,095 145,314 145,314Lincoln Center Rent 70,078
896 2,400 2,880 3,456 4,147 4,977 4,977Lease of Land 2,400
2,434 9,359 11,231 13,477 16,172 19,407 19,407Smith-Williams Center Rent 9,359
662,724 624,482 638,250 638,250 689,938 695,138 695,138Rental of Land & Buildings 624,482
303,605 220,469 212,668 212,668 212,668 212,668 212,668Renaissance O & M - County 220,469
927,256 0 0 0 0 0 0Sale of Land 0
128,460 186,790 100,000 100,000 100,000 100,000 100,000Sale of Surplus 100,000
121 0 0 0 0 0 0Animal Service Ctr Donation 0
810,431 2,852,187 1,693,602 1,428,642 1,428,642 1,409,712 1,409,712Other Miscellaneous Revenue 1,975,608
1,053 1,200 1,200 1,200 1,200 1,200 1,200Cobra Payments 1,200
0 139,949 140,628 144,847 149,192 153,668 158,278Growth Mgmnt from Stormwater 139,949
6,609,570 6,683,462 6,883,966 7,090,485 7,303,199 7,522,296 7,522,296Overhead Allocation 6,683,462
2,340,410 2,313,932 2,396,682 2,481,915 2,569,705 2,660,923 2,660,923Capitalized Overhead 2,313,932
12,615,200 12,715,852 13,094,958 13,425,303 13,429,913 12,630,408 13,604,308Other Revenues 12,740,939
0 26,086 26,767 27,570 28,397 29,249 29,249Transfer From Other Funds 26,086
42,205 0 0 0 0 0 0Transfer from Spec Proj Fund 0
50,000 50,000 50,000 50,000 50,000 50,000 50,000Transfer from LEF Fund State 50,000
100,000 125,000 125,000 125,000 125,000 125,000 125,000Transfer from Second Dollar 125,000
30,000 30,000 30,000 30,000 30,000 30,000 30,000Transfer from LEF Fund - Fed 30,000
0 0 285,800 294,350 303,200 312,300 321,650Transfer from Fire Fund 0
204,260 704,260 704,260 204,260 204,260 204,260 204,260Transfer From Gas Tax Constr 204,260
0 0 824,000 0 0 0 0Transfer from Future Cap Bonds 0
135,834 319,300 319,300 319,300 319,300 319,300 319,300Transfer From Stormwater Fun 638,600
3,140,991 0 400,000 200,000 0 0 0Transfer From Deficiencies Fd 0
0 21,000 21,000 21,000 21,000 21,000 21,000Rickards Scholarship Fund 21,000
22,893,832 22,637,230 22,361,081 23,177,202 22,451,500 22,238,439 22,160,170Contribution From Electric Fd 22,637,230
2,323,000 2,323,000 2,323,000 2,323,000 2,323,000 2,323,000 2,323,000Contribution From Gas Fund 2,323,000
5,811,993 6,012,465 6,678,846 7,072,918 7,545,661 7,899,372 8,333,568Contribution From Water Fund 6,012,465
2,059,262 2,299,866 2,981,251 3,378,943 3,653,392 3,874,502 4,044,701Contribution From Sewer Fund 2,299,866
138,641 151,472 164,674 176,084 184,761 191,527 191,527Contrib from Solid Waste Fun 151,472
37,294,979 37,399,627 37,239,471 37,617,949 38,153,425 36,930,018 34,699,679Other Sources 34,518,979
133,791,015
133,791,015Fund Total ExpenditureFund Total Revenue
0Fund Balance
138,951,370 137,157,532 135,327,481 133,779,821 129,005,649 132,290,091
148,512,218 144,065,160 140,524,508 136,246,272 128,145,915 132,290,090
0 859,734 -2,466,451 -5,197,027 -6,907,628 -9,560,848
BudgetBudget Budget Budget BudgetActual EstimateFund Summary
133,177,237
133,177,237
0
Adopted
FY 2008 FY 2010 FY 2011 FY 2012 FY 2013 FY 2014FY 2009FY 2009
Fund Pro FormasFiscal Year 2010
F-10
Page 11
City of Tallahassee
Fiscal Year 2010 Approved Budget - Fund Proforma Summary
115 Donations Operating Fund
This fund accounts for charitable donations given to the city to support programs provided by the Police
Department's Canine program and the Economic and Community Development Department's Change for Change
program.
BudgetBudget Budget Budget BudgetFY 2010 FY 2011 FY 2012 FY 2013 FY 2014
Actual EstimateFY 2009FY 2008
Expenditures
47,994 47,994 47,994 47,994 47,994 29,810 46,694Operating
0 0 0 0 0 0 4,000Transfers
0 0 0 0 0 72,801 43,346Year End Adjustments
BudgetBudget Budget Budget BudgetFY 2010 FY 2011 FY 2012 FY 2013 FY 2014
Actual EstimateFY 2009FY 2008
Revenues
47,994 47,994 47,994 47,994 47,994 102,611 94,040Other Revenues
47,994
47,994
Fund Total Expenditure
Fund Total Revenue
0Fund Balance
47,994 47,994 47,994 47,994 94,040 102,611
47,994 47,994 47,994 47,994 94,040 102,611
0 0 0 0 0 0
FY 2008BudgetBudget Budget Budget Budget
FY 2010 FY 2011 FY 2012 FY 2013 FY 2014Actual Estimate
FY 2009Fund Summary
Fund Expenditures
Fund expenditures support miscellaneous costs associated with the programs identified.
Fiscal year 2010 charitable donations support the Change for Change program in the Economic and Community
Development Department ($46,494), and the following programs in the Tallahassee Police Department: Child
Safety Seat ($500); Victim Advocates ($500); and the Canine program $3,000).
Fund Revenues
Capital Projects Operating Budget Impacts
This fund has no capital projects in fiscal year 2010.
Fund Pro FormasFiscal Year 2010
F-11
Page 12
City of Tallahassee
Fiscal Year 2010 Approved Budget - Fund Proforma Account Summary
115 Donations Operating Fund
BudgetBudget Budget Budget Budget
FY 2010 FY 2011 FY 2012 FY 2014
Actual Estimate
FY 2009FY 2008
Expenditures Adopted
FY 2009 FY 2013
30,338 0 0 0 0 0 0Unclassified Contract Svcs 0
0 0 1,300 1,300 1,300 1,300 1,300Unclassified Supplies 4,000
-528 46,694 46,694 46,694 46,694 46,694 46,694Unclassified Charges 46,694
47,994 47,994 47,994 47,994 47,994 29,810 46,694Operating 50,694
0 4,000 0 0 0 0 0Inter-Fund Transfer 0
0 0 0 0 0 0 4,000Transfers 0
72,801 43,346 0 0 0 0 0Transfer to Fund Balance 0
0 0 0 0 0 72,801 43,346Year End Adjustments 0
BudgetBudget Budget Budget Budget
FY 2010 FY 2011 FY 2012 FY 2014
Actual Estimate
FY 2009FY 2008
Revenues Adopted
FY 2009 FY 2013
5,799 3,585 0 0 0 0 0Interest 0
170 500 500 500 500 500 500Child Safety Seat Donations 500
4,175 0 0 0 0 0 0Dare Donations 0
500 0 500 500 500 500 500Victim Advocates 500
2,000 0 300 300 300 300 300Canine Donations 3,000
13,982 27,006 0 0 0 0 0Animal Service Ctr Donation 0
250 0 0 0 0 0 0Donations-Comm Renaissance P 0
60,589 62,949 46,694 46,694 46,694 46,694 46,694Change For Change Donations 46,694
4,505 0 0 0 0 0 0FL Neigh. Conf. 08 Donations 0
10,640 0 0 0 0 0 0Trans from Fund Bal - Encumb 0
47,994 47,994 47,994 47,994 47,994 102,611 94,040Other Revenues 50,694
47,994
47,994Fund Total ExpenditureFund Total Revenue
0Fund Balance
47,994 47,994 47,994 47,994 94,040 102,611
47,994 47,994 47,994 47,994 94,040 102,611
0 0 0 0 0 0
BudgetBudget Budget Budget BudgetActual EstimateFund Summary
50,694
50,694
0
Adopted
FY 2008 FY 2010 FY 2011 FY 2012 FY 2013 FY 2014FY 2009FY 2009
Fund Pro FormasFiscal Year 2010
F-12
Page 13
City of Tallahassee
Fiscal Year 2010 Approved Budget - Fund Proforma Summary
120 Building Inspection Fund
During the 2005 Florida Legislative session, a law was passed that states that all fees, fines or investment
earnings related to the collection and enforcement of the state’s building code must be used solely for
implementing and enforcing the Florida Building Code. Local governments must use recognized management,
accounting, and oversight practices to ensure that these fees, fines, and investment earnings are maintained
and allocated or used solely for the purposes of building code enforcement activities.
To comply with the law, a separate enterprise fund was established during fiscal year 2006 to account for all
activities related to the enforcement of the city’s building inspection regulations. Fiscal year 2007 was the first
full year of operation for this fund. The Building Inspection Fund is balanced for all five years with no loan from
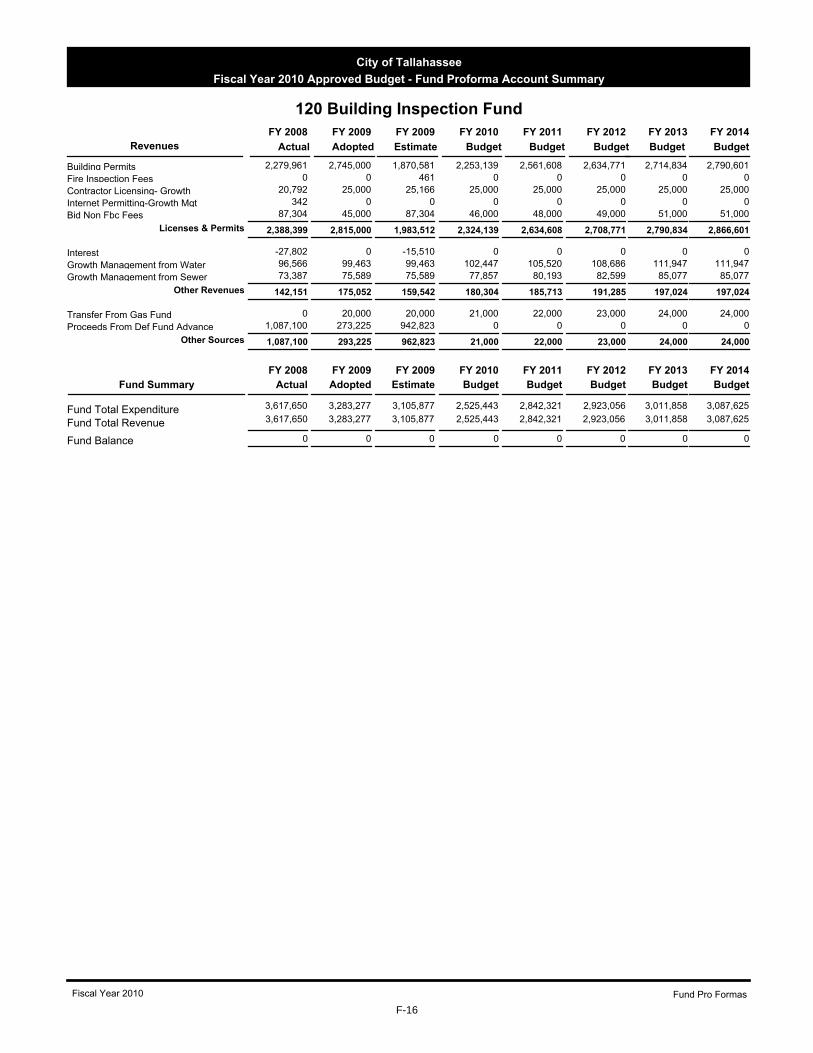
the Deficiencies Fund. The total budget for fiscal year 2010 is $2,525,443 representing a decrease of $757,834,
or 23%, from the approved 2009 budget.
BudgetBudget Budget Budget BudgetFY 2010 FY 2011 FY 2012 FY 2013 FY 2014
Actual EstimateFY 2009FY 2008
Expenditures
1,686,173 1,995,357 2,056,334 2,119,170 2,184,069 2,551,975 2,155,840Personnel Services
118,236 118,236 118,236 118,236 118,236 32,141 21,738Operating
533,458 542,086 558,349 574,973 582,798 803,894 656,238Allocated Accounts
53,409 72,849 73,042 79,009 80,228 229,640 272,061Transfers
134,167 113,793 117,095 120,470 122,294 0 0Year End Adjustments
BudgetBudget Budget Budget BudgetFY 2010 FY 2011 FY 2012 FY 2013 FY 2014
Actual EstimateFY 2009FY 2008
Revenues
2,324,139 2,634,608 2,708,771 2,790,834 2,866,601 2,388,399 1,983,512Licenses & Permits
180,304 185,713 191,285 197,024 197,024 142,151 159,542Other Revenues
21,000 22,000 23,000 24,000 24,000 1,087,100 962,823Other Sources
2,525,443
2,525,443
Fund Total Expenditure
Fund Total Revenue
0Fund Balance
3,087,625 3,011,858 2,923,056 2,842,321 3,105,877 3,617,650
3,087,625 3,011,858 2,923,056 2,842,321 3,105,877 3,617,650
0 0 0 0 0 0
FY 2008BudgetBudget Budget Budget Budget
FY 2010 FY 2011 FY 2012 FY 2013 FY 2014Actual Estimate
FY 2009Fund Summary
Fund Expenditures
Expenditures in the fiscal year 2010-2014 proforma include:
Assumptions for personnel services are as follows: salaries for general employees are adjusted for a 0% merit
salary enhancement in FY10; general employee pension rates are 9.08% based on an actuarial study; matched
annuity pension plan rates are 7.15% based on an actuarial study; the health care rate is set at actual cost per
employee or at the family rate for vacant positions; and in departments with more than fifty employees, a 1.0%
vacancy factor is applied to salaries and benefits.
Allocated accounts are decreased by approximately 42% for fiscal year 2010, by 0% for fiscal years 2011 and
increased by 3% for fiscal year 2012 through 2014. Indirect costs are based upon the city's cost allocation
plan. Debt service expense is based upon square foot of space occupied at the Renaissance Building.
The non-building code function of code enforcement was transferred to the General Fund.
Fund revenues from licenses and permits total $2.3 million and are derived from three major sources, building
permit fees, contractor licensing, and non-FL building code fees. This is a reduction of $491,861 from FY09
budgeted revenues due to economic conditions. Additional revenues in the amount of $180,304 have been
budgeted as payments from both the water and sewer utilities for fiscal year 2010 and are estimated to increase
by 3% annually for the out years.
Fund Revenues
Fund Pro FormasFiscal Year 2010
F-13
Page 14
City of Tallahassee
Fiscal Year 2010 Approved Budget - Fund Proforma Summary
120 Building Inspection Fund
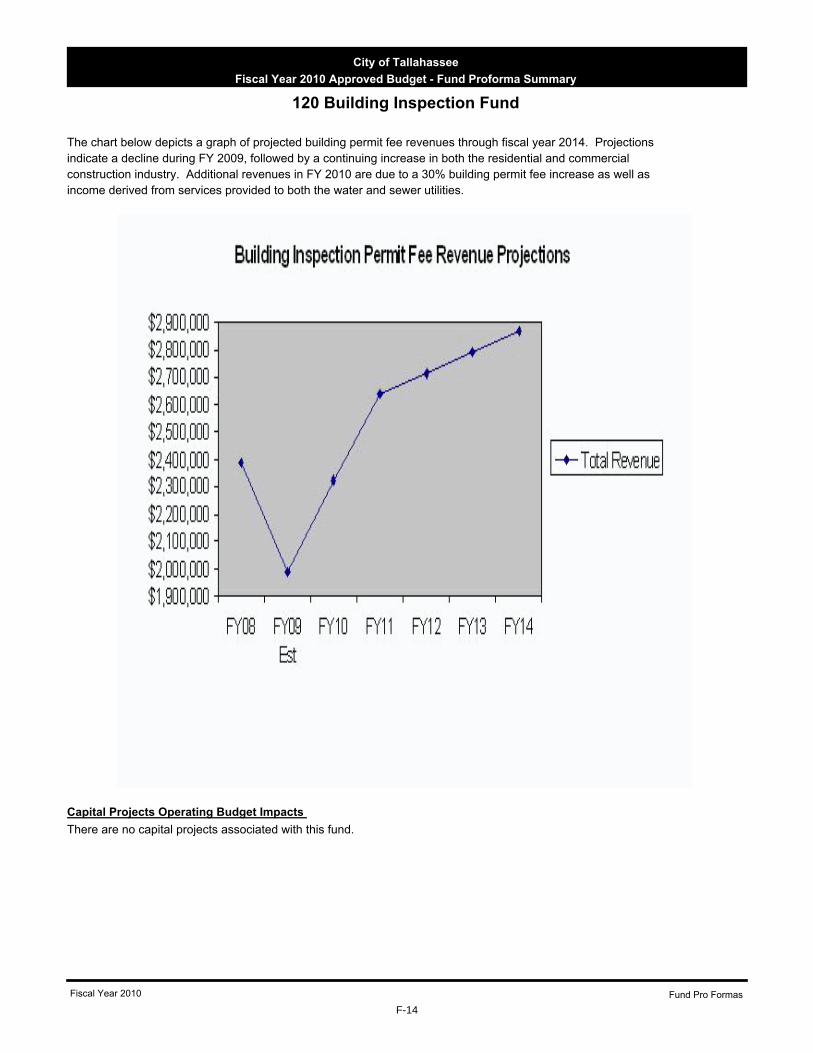
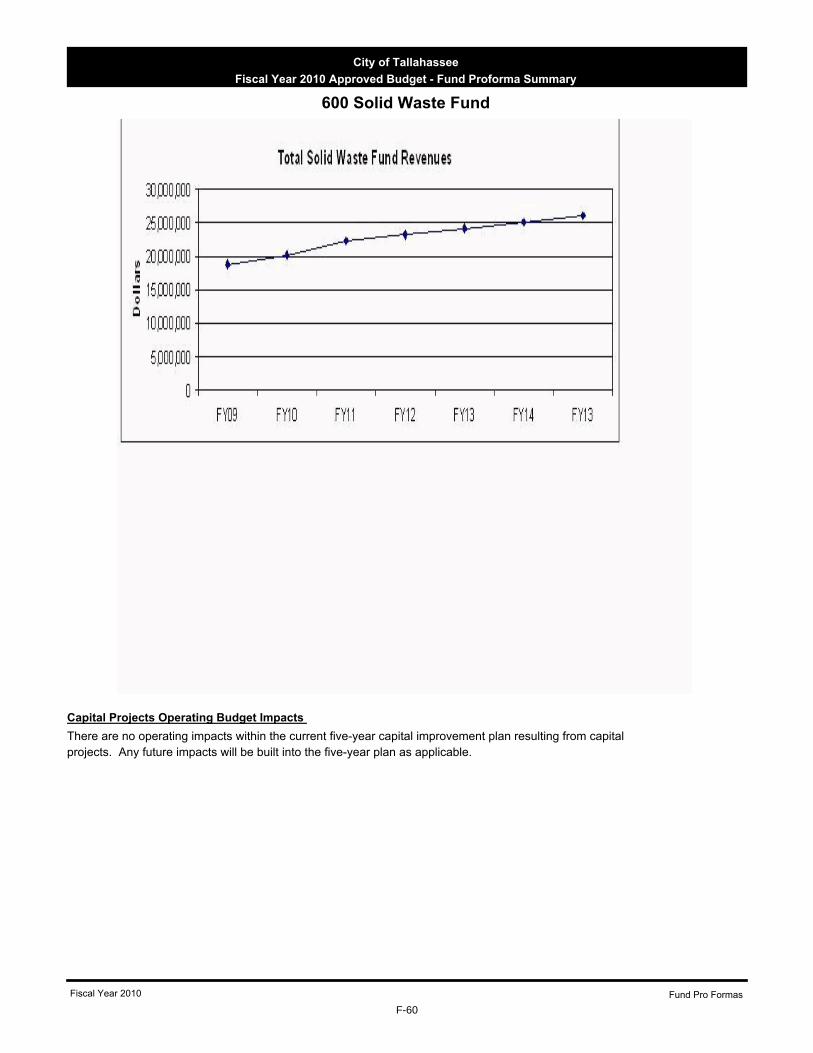
The chart below depicts a graph of projected building permit fee revenues through fiscal year 2014. Projections
indicate a decline during FY 2009, followed by a continuing increase in both the residential and commercial
construction industry. Additional revenues in FY 2010 are due to a 30% building permit fee increase as well as
income derived from services provided to both the water and sewer utilities.
Capital Projects Operating Budget Impacts
There are no capital projects associated with this fund.
Fund Pro FormasFiscal Year 2010
F-14
Page 15
City of Tallahassee
Fiscal Year 2010 Approved Budget - Fund Proforma Account Summary
120 Building Inspection Fund
BudgetBudget Budget Budget Budget
FY 2010 FY 2011 FY 2012 FY 2014
Actual Estimate
FY 2009FY 2008
Expenditures Adopted
FY 2009 FY 2013
1,825,629 1,574,313 1,272,580 1,437,903 1,466,662 1,510,662 1,555,980Salaries 1,724,079
0 0 0 28,759 43,998 45,320 46,679Salary Enhancements 54,534
31,513 40,372 0 0 0 0 0Temporary Wages 0
17,963 4,500 4,160 4,160 4,160 4,160 4,160Overtime 13,000
15,960 13,960 13,960 13,960 13,960 13,960 13,960Other Salary Items 13,960
169,072 145,237 115,691 176,920 182,223 187,683 193,309Pension- Current 157,699
138,206 114,539 91,101 104,979 108,125 111,364 114,704Pension- MAP 124,111
26,307 23,194 17,033 19,819 20,413 21,028 21,657Mandatory Medicare 24,372
205,087 174,540 135,379 164,664 172,888 181,528 190,608Health Benefits 137,809
41,563 0 0 0 0 0 0Health Benefits-Retirees 0
80,676 65,185 51,487 58,572 58,572 58,572 58,572Flex Benefits 61,932
0 0 -12,726 -14,379 -14,667 -15,107 -15,560Vacancy factor of 1.0% -51,722
0 0 -2,492 0 0 0 0Furlough savings 0
1,686,173 1,995,357 2,056,334 2,119,170 2,184,069 2,551,975 2,155,840Personnel Services 2,259,774
73 0 2,000 2,000 2,000 2,000 2,000Advertising 3,183
6,414 4,888 6,130 6,130 6,130 6,130 6,130Cleaning & Laundry 6,130
0 115 0 0 0 0 0Unclassified Professional Svcs 0
9,059 1,801 2,601 2,601 2,601 2,601 2,601Unclassified Contract Svcs 2,601
-757 -430 0 0 0 0 0Telephone 0
6,157 6,402 6,157 6,157 6,157 6,157 6,157Office Supplies 10,052
2,738 4,071 2,738 2,738 2,738 2,738 2,738Unclassified Supplies 4,874
5,949 406 5,800 5,800 5,800 5,800 5,800Travel & Training 9,344
516 2,826 516 516 516 516 516Journals & Books 3,271
1,992 1,659 1,685 1,685 1,685 1,685 1,685Memberships 1,635
0 0 90,609 90,609 90,609 90,609 90,609Rent Expense- Bldg & Ops 85,904
118,236 118,236 118,236 118,236 118,236 32,141 21,738Operating 126,994
41,242 45,869 26,861 26,861 27,667 28,497 29,352Human Resource Expense 45,869
14,157 12,916 16,618 16,618 17,117 17,631 18,160Accounting Expense 12,916
1,849 1,980 2,964 2,964 3,053 3,145 3,239Purchasing Expense 1,980
227,022 247,925 135,577 135,577 139,644 143,834 148,149Information Systems Expense 247,925
11,451 4,971 12,506 12,506 12,881 13,268 13,666Risk Management Expense 4,971
1,090 0 0 0 0 0 0Radio Communications Expense 0
9,051 5,515 5,090 5,090 5,243 5,400 5,562Revenue Collection Expense 5,515
91,413 37,609 26,436 26,436 27,229 28,046 28,887Vehicle Garage Expense 50,047
0 20,219 19,795 19,795 20,389 21,001 21,631Vehicle Fuel 61,895
16,884 3,864 3,980 4,099 4,222 4,222 4,222Vehicle Replacement 3,864
389,735 275,370 283,631 292,140 300,904 309,931 309,931Indirect Costs 275,370
533,458 542,086 558,349 574,973 582,798 803,894 656,238Allocated Accounts 710,352
119,276 186,157 53,409 72,849 73,042 79,009 80,228Debt Service Transfer 186,157
110,364 85,904 0 0 0 0 0Inter-Fund Transfer 0
53,409 72,849 73,042 79,009 80,228 229,640 272,061Transfers 186,157
0 0 134,167 113,793 117,095 120,470 122,294Transfer to Deficiencies Fd 0
134,167 113,793 117,095 120,470 122,294 0 0Year End Adjustments 0
Fund Pro FormasFiscal Year 2010
F-15
Page 16
City of Tallahassee
Fiscal Year 2010 Approved Budget - Fund Proforma Account Summary
120 Building Inspection Fund
BudgetBudget Budget Budget Budget
FY 2010 FY 2011 FY 2012 FY 2014
Actual Estimate
FY 2009FY 2008
Revenues Adopted
FY 2009 FY 2013
2,279,961 1,870,581 2,253,139 2,561,608 2,634,771 2,714,834 2,790,601Building Permits 2,745,000
0 461 0 0 0 0 0Fire Inspection Fees 0
20,792 25,166 25,000 25,000 25,000 25,000 25,000Contractor Licensing- Growth 25,000
342 0 0 0 0 0 0Internet Permitting-Growth Mgt 0
87,304 87,304 46,000 48,000 49,000 51,000 51,000Bid Non Fbc Fees 45,000
2,324,139 2,634,608 2,708,771 2,790,834 2,866,601 2,388,399 1,983,512Licenses & Permits 2,815,000
-27,802 -15,510 0 0 0 0 0Interest 0
96,566 99,463 102,447 105,520 108,686 111,947 111,947Growth Management from Water 99,463
73,387 75,589 77,857 80,193 82,599 85,077 85,077Growth Management from Sewer 75,589
180,304 185,713 191,285 197,024 197,024 142,151 159,542Other Revenues 175,052
0 20,000 21,000 22,000 23,000 24,000 24,000Transfer From Gas Fund 20,000
1,087,100 942,823 0 0 0 0 0Proceeds From Def Fund Advance 273,225
21,000 22,000 23,000 24,000 24,000 1,087,100 962,823Other Sources 293,225
2,525,443
2,525,443Fund Total ExpenditureFund Total Revenue
0Fund Balance
3,087,625 3,011,858 2,923,056 2,842,321 3,105,877 3,617,650
3,087,625 3,011,858 2,923,056 2,842,321 3,105,877 3,617,650
0 0 0 0 0 0
BudgetBudget Budget Budget BudgetActual EstimateFund Summary
3,283,277
3,283,277
0
Adopted
FY 2008 FY 2010 FY 2011 FY 2012 FY 2013 FY 2014FY 2009FY 2009
Fund Pro FormasFiscal Year 2010
F-16
Page 17
City of Tallahassee
Fiscal Year 2010 Approved Budget - Fund Proforma Summary
130 Fire Services Fund
The Fire Fund supports fire suppression, hazardous material response, urban search and rescue, technical
rescue, vehicle extraction, emergency medical care, fire safety code compliance review and enforcement, and
varied public education services. The Fire Department serves a population projected at 276,900 persons in fiscal
year 2010, who reside in an area that covers 671 square miles.
The fire services fee was established by an ordinance adopted by the city commission with an effective date of
October 1, 1999. Leon County officials opted not to implement the fee for county residents, but, rather, to
continue its payment for fire services via the interlocal agreement between the two governments.
The city commission approved new rates for all residential, commercial, industrial, and governmental entities
within the corporate city limits effective July 1, 2005. Also in 2005, the city and Leon County entered into
another agreement whereby the county pays for the department's provision of advanced life support (ALS)
services in the unincorporated areas of the county. The agreement supports the salary and benefits of 35
paramedic certified firefighters and one administrative person.
Both the fire services and ALS agreements, which expired in September 2009, were renegotiated and approved
by the city and county commissions. Implementation of the new agreements are effective October 1, 2009,
along with a countywide fire services fee which a consultant study projects will generate revenues of slightly
more than $31.1 million in fiscal year 2010. Projected revenues and revised expenditures emanating from the
study are included in all years of the proforma.
BudgetBudget Budget Budget BudgetFY 2010 FY 2011 FY 2012 FY 2013 FY 2014
Actual EstimateFY 2009FY 2008
Expenditures
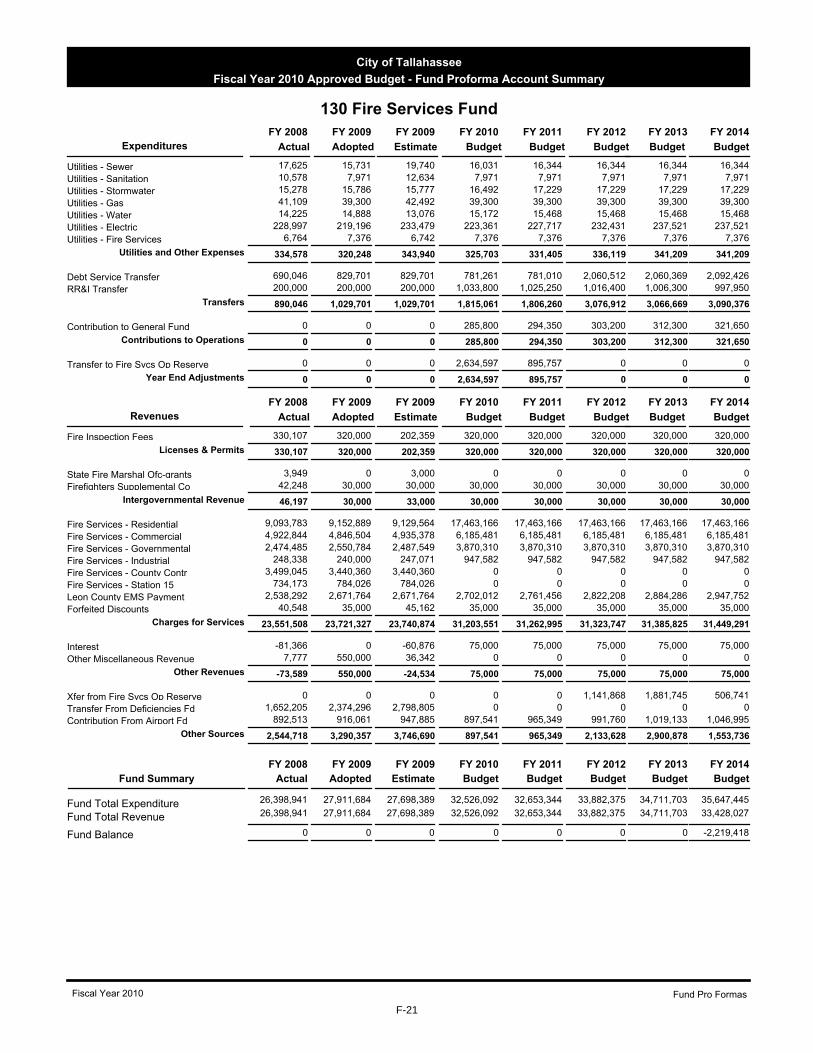
20,117,257 22,333,815 23,019,252 23,712,516 24,429,384 19,543,009 20,148,019Personnel Services
1,121,064 1,117,073 1,120,058 1,113,154 1,156,958 823,553 978,508Operating
30,856 30,856 30,856 30,856 30,856 30,856 30,856Other Services & Charges
610,400 110,400 110,400 110,400 110,400 103,794 10,059Capital Outlay
5,585,354 5,733,428 5,885,578 6,024,599 6,166,612 4,673,105 5,157,306Allocated Accounts
325,703 331,405 336,119 341,209 341,209 334,578 343,940Utilities and Other Expenses
1,815,061 1,806,260 3,076,912 3,066,669 3,090,376 890,046 1,029,701Transfers
285,800 294,350 303,200 312,300 321,650 0 0Contributions to Operations
2,634,597 895,757 0 0 0 0 0Year End Adjustments
BudgetBudget Budget Budget BudgetFY 2010 FY 2011 FY 2012 FY 2013 FY 2014
Actual EstimateFY 2009FY 2008
Revenues
320,000 320,000 320,000 320,000 320,000 330,107 202,359Licenses & Permits
30,000 30,000 30,000 30,000 30,000 46,197 33,000Intergovernmental Revenue
31,203,551 31,262,995 31,323,747 31,385,825 31,449,291 23,551,508 23,740,874Charges for Services
75,000 75,000 75,000 75,000 75,000-73,589 -24,534Other Revenues
897,541 965,349 2,133,628 2,900,878 1,553,736 2,544,718 3,746,690Other Sources
32,526,092
32,526,092
Fund Total Expenditure
Fund Total Revenue
0Fund Balance
33,428,027 34,711,703 33,882,375 32,653,344 27,698,389 26,398,941
35,647,445 34,711,703 33,882,375 32,653,344 27,698,389 26,398,941
0 0 0 0 0 -2,219,418
FY 2008BudgetBudget Budget Budget Budget
FY 2010 FY 2011 FY 2012 FY 2013 FY 2014Actual Estimate
FY 2009Fund Summary
Fund Expenditures
Expenditures shown in fiscal year 2010 and beyond reflect elimination of an executive secretary position
($48,765), addition of three firefighters effective January 1, 2010 ($133,231), and seven on April 1, 2010
($223,008). An additional eight firefighters are budgeted at the beginning of fiscal year 2011 at a projected cost
of $487,719. All 18 positions are part of a functional consolidation of fire rescue services countywide. They will
be located in stations 10-14, and are expected to provide improved response and safety for personnel
Fund Pro FormasFiscal Year 2010
F-17
Page 18
City of Tallahassee
Fiscal Year 2010 Approved Budget - Fund Proforma Summary
130 Fire Services Fund
responding from those stations.
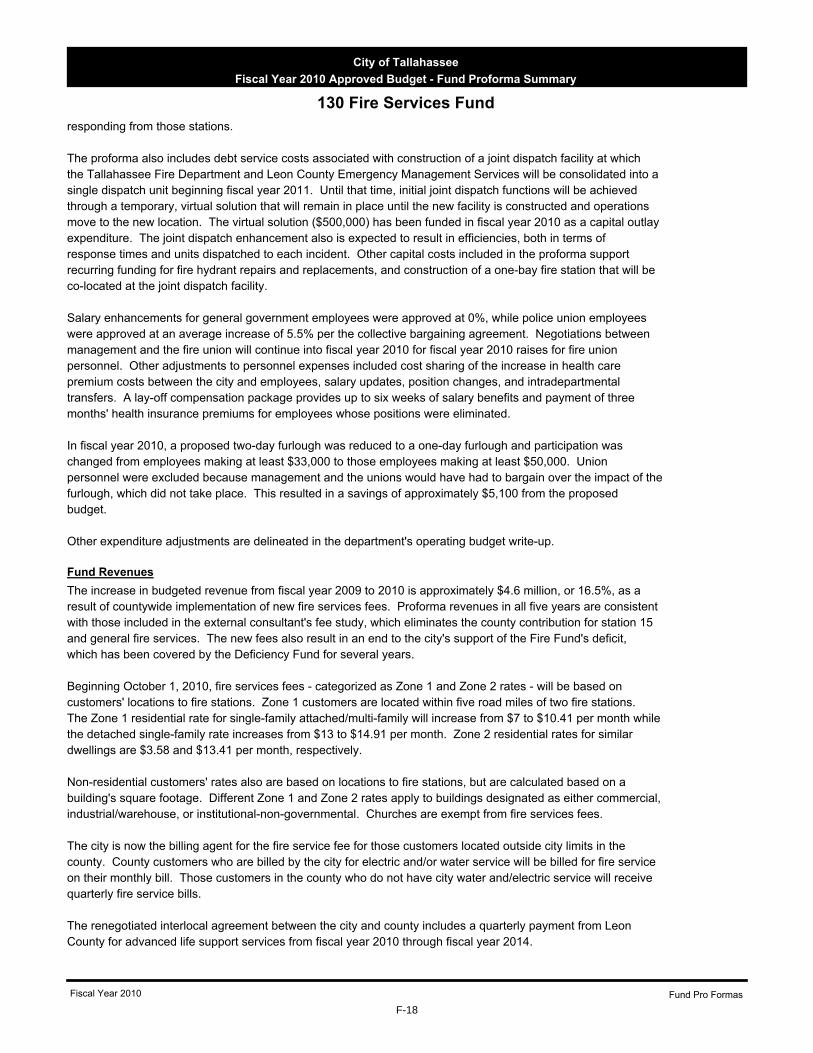
The proforma also includes debt service costs associated with construction of a joint dispatch facility at which
the Tallahassee Fire Department and Leon County Emergency Management Services will be consolidated into a
single dispatch unit beginning fiscal year 2011. Until that time, initial joint dispatch functions will be achieved
through a temporary, virtual solution that will remain in place until the new facility is constructed and operations
move to the new location. The virtual solution ($500,000) has been funded in fiscal year 2010 as a capital outlay
expenditure. The joint dispatch enhancement also is expected to result in efficiencies, both in terms of
response times and units dispatched to each incident. Other capital costs included in the proforma support
recurring funding for fire hydrant repairs and replacements, and construction of a one-bay fire station that will be
co-located at the joint dispatch facility.
Salary enhancements for general government employees were approved at 0%, while police union employees
were approved at an average increase of 5.5% per the collective bargaining agreement. Negotiations between
management and the fire union will continue into fiscal year 2010 for fiscal year 2010 raises for fire union
personnel. Other adjustments to personnel expenses included cost sharing of the increase in health care
premium costs between the city and employees, salary updates, position changes, and intradepartmental
transfers. A lay-off compensation package provides up to six weeks of salary benefits and payment of three
months' health insurance premiums for employees whose positions were eliminated.
In fiscal year 2010, a proposed two-day furlough was reduced to a one-day furlough and participation was
changed from employees making at least $33,000 to those employees making at least $50,000. Union
personnel were excluded because management and the unions would have had to bargain over the impact of the
furlough, which did not take place. This resulted in a savings of approximately $5,100 from the proposed
budget.
Other expenditure adjustments are delineated in the department's operating budget write-up.
The increase in budgeted revenue from fiscal year 2009 to 2010 is approximately $4.6 million, or 16.5%, as a
result of countywide implementation of new fire services fees. Proforma revenues in all five years are consistent
with those included in the external consultant's fee study, which eliminates the county contribution for station 15
and general fire services. The new fees also result in an end to the city's support of the Fire Fund's deficit,
which has been covered by the Deficiency Fund for several years.
Beginning October 1, 2010, fire services fees - categorized as Zone 1 and Zone 2 rates - will be based on
customers' locations to fire stations. Zone 1 customers are located within five road miles of two fire stations.
The Zone 1 residential rate for single-family attached/multi-family will increase from $7 to $10.41 per month while
the detached single-family rate increases from $13 to $14.91 per month. Zone 2 residential rates for similar
dwellings are $3.58 and $13.41 per month, respectively.
Non-residential customers' rates also are based on locations to fire stations, but are calculated based on a
building's square footage. Different Zone 1 and Zone 2 rates apply to buildings designated as either commercial,
industrial/warehouse, or institutional-non-governmental. Churches are exempt from fire services fees.
The city is now the billing agent for the fire service fee for those customers located outside city limits in the
county. County customers who are billed by the city for electric and/or water service will be billed for fire service
on their monthly bill. Those customers in the county who do not have city water and/electric service will receive
quarterly fire service bills.
The renegotiated interlocal agreement between the city and county includes a quarterly payment from Leon
County for advanced life support services from fiscal year 2010 through fiscal year 2014.
Fund Revenues
Fund Pro FormasFiscal Year 2010
F-18
Page 19
City of Tallahassee
Fiscal Year 2010 Approved Budget - Fund Proforma Summary
130 Fire Services Fund
The motor vehicle assessment fee, implemented in fiscal year 2009 to capture costs associated with motor
vehicle accidents when fire units must respond and take action at the scene, has been rescinded. The Florida
Legislature, during its 2009 session, passed legislation that prohibited imposition of the fee, resulting in a
reduction of $566,500 from the Fire Fund's revenue base in fiscal year 2010.
The Fire Fund generates surpluses in fiscal years 2010 and 2011; however, deficits begin in fiscal year 2012 and
continue through fiscal year 2014. Transfers from the fund’s operating reserve wholly cover deficits in fiscal
years 2012 and 2013, but are insufficient to cover all of fiscal year 2014's shortfall. The result is a negative fund
position of approximately $2.2 million in fiscal year 2014.
Capital Projects Operating Budget Impacts
The salary and partial benefits of one staff person are funded from the Facilities Management and Maintenance
project. No operating impacts are associated with other projects in the department's capital improvement plan.
Fund Pro FormasFiscal Year 2010
F-19
Page 20
City of Tallahassee
Fiscal Year 2010 Approved Budget - Fund Proforma Account Summary
130 Fire Services Fund
BudgetBudget Budget Budget Budget
FY 2010 FY 2011 FY 2012 FY 2014
Actual Estimate
FY 2009FY 2008
Expenditures Adopted
FY 2009 FY 2013
13,788,825 14,425,838 13,547,916 13,961,488 14,240,703 14,667,907 15,107,908Salaries 13,111,172
-30,368 -35,136 -34,908 -35,887 -36,895 -37,935 -37,935Capitalized Wages -33,957
0 0 0 309,055 472,855 487,063 501,630Salary Enhancements 605,984
0 0 806,312 822,234 829,012 839,421 850,142Firefighter Holiday Pay 869,220
19,184 17,273 0 0 0 0 0Temporary Wages 7,500
1,072,014 700,000 700,000 734,847 771,893 810,049 849,350Overtime 403,907
-11,914 0 0 0 0 0 0Capitalized Overtime 0
290,745 306,389 347,754 366,346 366,346 366,346 366,346Other Salary Items 325,914
2,140,783 2,496,156 2,363,909 3,590,214 3,698,250 3,806,608 3,918,241Pension- Current 2,315,273
56,635 40,491 89,935 91,683 94,359 97,115 99,948Pension- MAP 40,361
147,914 156,154 136,327 145,521 149,875 154,247 158,784Mandatory Medicare 138,242
1,464,960 1,391,533 1,506,959 1,692,436 1,776,976 1,865,817 1,959,092Health Benefits 1,552,635
509,058 563,850 563,850 563,850 563,850 563,850 563,850Health Benefits-Retirees 563,850
95,174 85,471 92,028 92,028 92,028 92,028 92,028Flex Benefits 98,724
0 0 -2,825 0 0 0 0Furlough savings 0
20,117,257 22,333,815 23,019,252 23,712,516 24,429,384 19,543,009 20,148,019Personnel Services 19,998,825
0 0 0 0 0 0 36,900Contractual Services 0
530 615 1,615 1,615 1,615 1,615 1,615Advertising 1,615
12,287 13,001 14,000 14,000 14,000 14,000 14,000Cleaning & Laundry 14,000
3,141 5,112 5,612 5,612 5,612 5,612 5,612Reproduction 5,612
0 0 24,990 24,990 24,990 24,990 24,990Unclassified Professional Svcs 24,990
206 0 0 0 0 0 0System Collection 0
24,161 42,647 42,647 42,647 42,647 42,647 42,647Equipment Repairs 42,647
53,791 67,233 67,060 67,060 67,060 67,060 67,060Medical Services 67,060
278,065 339,582 390,659 390,730 390,803 390,803 390,803Unclassified Contract Svcs 390,591
8,660 3,185 3,185 3,185 3,185 3,185 3,185Computer Software 3,185
26,597 20,531 26,231 26,231 26,231 26,231 26,231Telephone 26,231
58,026 53,491 56,289 56,289 56,289 56,289 56,289Chem-Med-Lab 56,289
628 611 611 611 611 611 611Food 611
74 160 329 329 329 329 329Gasoline 160
20 0 0 0 0 0 0Oil & Lubricants 0
16,964 20,437 20,938 20,938 20,938 20,938 20,938Office Supplies 20,938
120,957 122,295 167,115 164,051 170,955 164,051 170,955Uniforms & Clothing 127,795
118,555 134,826 145,814 144,816 140,824 140,824 140,824Unclassified Supplies 140,824
-579 0 0 0 0 0 0Vehicle- Non-Garage 0
21,959 72,626 70,812 70,812 70,812 70,812 70,812Travel & Training 72,627
11,019 14,093 15,093 15,093 15,093 15,093 15,093Journals & Books 15,093
2,433 2,980 2,980 2,980 2,980 2,980 2,980Memberships 2,980
1,808 200 200 200 200 200 200Certificates & Licenses 200
10,438 12,383 12,384 12,384 12,384 12,384 12,384Rent Expense- Machines 12,384
53,810 52,500 52,500 52,500 52,500 52,500 52,500Unclassified Charges 52,500
1,121,064 1,117,073 1,120,058 1,113,154 1,156,958 823,553 978,508Operating 1,078,332
30,856 30,856 30,856 30,856 30,856 30,856 30,856Bad Debt Expense 30,856
30,856 30,856 30,856 30,856 30,856 30,856 30,856Other Services & Charges 30,856
1,698 0 0 0 0 0 0Computer Equipment 0
102,096 10,059 610,400 110,400 110,400 110,400 110,400Unclassified Equipment 110,400
610,400 110,400 110,400 110,400 110,400 103,794 10,059Capital Outlay 110,400
398,002 424,538 392,273 392,273 404,042 416,164 428,650Human Resource Expense 424,538
114,884 112,398 127,167 127,167 130,983 134,913 138,960Accounting Expense 112,398
29,156 31,066 39,926 39,926 41,124 42,358 43,628Purchasing Expense 31,066
1,090,064 1,682,149 1,401,197 1,401,197 1,443,233 1,486,530 1,531,126Information Systems Expense 1,682,149
277,525 231,661 268,324 268,324 276,374 284,665 293,205Risk Management Expense 231,661
119,135 121,586 99,762 99,762 102,785 105,807 108,833Radio Communications Expense 121,586
63,449 63,716 62,696 62,696 64,577 66,514 68,510Revenue Collection Expense 63,716
812,905 575,368 1,150,000 1,152,324 1,186,894 1,222,500 1,259,175Utility Services Expense 575,368
877,454 714,524 676,890 676,890 697,197 718,113 739,656Vehicle Garage Expense 737,454
0 157,585 180,793 180,793 186,217 191,803 197,557Vehicle Fuel 320,671
369,318 473,467 600,000 728,160 730,120 732,138 734,217Vehicle Replacement 473,467
521,214 569,248 586,326 603,916 622,033 623,095 623,095Indirect Costs 569,248
5,585,354 5,733,428 5,885,578 6,024,599 6,166,612 4,673,105 5,157,306Allocated Accounts 5,343,322
Fund Pro FormasFiscal Year 2010
F-20
Page 21
City of Tallahassee
Fiscal Year 2010 Approved Budget - Fund Proforma Account Summary
130 Fire Services Fund
BudgetBudget Budget Budget Budget
FY 2010 FY 2011 FY 2012 FY 2014
Actual Estimate
FY 2009FY 2008
Expenditures Adopted
FY 2009 FY 2013
17,625 19,740 16,031 16,344 16,344 16,344 16,344Utilities - Sewer 15,731
10,578 12,634 7,971 7,971 7,971 7,971 7,971Utilities - Sanitation 7,971
15,278 15,777 16,492 17,229 17,229 17,229 17,229Utilities - Stormwater 15,786
41,109 42,492 39,300 39,300 39,300 39,300 39,300Utilities - Gas 39,300
14,225 13,076 15,172 15,468 15,468 15,468 15,468Utilities - Water 14,888
228,997 233,479 223,361 227,717 232,431 237,521 237,521Utilities - Electric 219,196
6,764 6,742 7,376 7,376 7,376 7,376 7,376Utilities - Fire Services 7,376
325,703 331,405 336,119 341,209 341,209 334,578 343,940Utilities and Other Expenses 320,248
690,046 829,701 781,261 781,010 2,060,512 2,060,369 2,092,426Debt Service Transfer 829,701
200,000 200,000 1,033,800 1,025,250 1,016,400 1,006,300 997,950RR&I Transfer 200,000
1,815,061 1,806,260 3,076,912 3,066,669 3,090,376 890,046 1,029,701Transfers 1,029,701
0 0 285,800 294,350 303,200 312,300 321,650Contribution to General Fund 0
285,800 294,350 303,200 312,300 321,650 0 0Contributions to Operations 0
0 0 2,634,597 895,757 0 0 0Transfer to Fire Svcs Op Reserve 0
2,634,597 895,757 0 0 0 0 0Year End Adjustments 0
BudgetBudget Budget Budget Budget
FY 2010 FY 2011 FY 2012 FY 2014
Actual Estimate
FY 2009FY 2008
Revenues Adopted
FY 2009 FY 2013
330,107 202,359 320,000 320,000 320,000 320,000 320,000Fire Inspection Fees 320,000
320,000 320,000 320,000 320,000 320,000 330,107 202,359Licenses & Permits 320,000
3,949 3,000 0 0 0 0 0State Fire Marshal Ofc-grants 0
42,248 30,000 30,000 30,000 30,000 30,000 30,000Firefighters Supplemental Co 30,000
30,000 30,000 30,000 30,000 30,000 46,197 33,000Intergovernmental Revenue 30,000
9,093,783 9,129,564 17,463,166 17,463,166 17,463,166 17,463,166 17,463,166Fire Services - Residential 9,152,889
4,922,844 4,935,378 6,185,481 6,185,481 6,185,481 6,185,481 6,185,481Fire Services - Commercial 4,846,504
2,474,485 2,487,549 3,870,310 3,870,310 3,870,310 3,870,310 3,870,310Fire Services - Governmental 2,550,784
248,338 247,071 947,582 947,582 947,582 947,582 947,582Fire Services - Industrial 240,000
3,499,045 3,440,360 0 0 0 0 0Fire Services - County Contr 3,440,360
734,173 784,026 0 0 0 0 0Fire Services - Station 15 784,026
2,538,292 2,671,764 2,702,012 2,761,456 2,822,208 2,884,286 2,947,752Leon County EMS Payment 2,671,764
40,548 45,162 35,000 35,000 35,000 35,000 35,000Forfeited Discounts 35,000
31,203,551 31,262,995 31,323,747 31,385,825 31,449,291 23,551,508 23,740,874Charges for Services 23,721,327
-81,366 -60,876 75,000 75,000 75,000 75,000 75,000Interest 0
7,777 36,342 0 0 0 0 0Other Miscellaneous Revenue 550,000
75,000 75,000 75,000 75,000 75,000-73,589 -24,534Other Revenues 550,000
0 0 0 0 1,141,868 1,881,745 506,741Xfer from Fire Svcs Op Reserve 0
1,652,205 2,798,805 0 0 0 0 0Transfer From Deficiencies Fd 2,374,296
892,513 947,885 897,541 965,349 991,760 1,019,133 1,046,995Contribution From Airport Fd 916,061
897,541 965,349 2,133,628 2,900,878 1,553,736 2,544,718 3,746,690Other Sources 3,290,357
32,526,092
32,526,092Fund Total ExpenditureFund Total Revenue
0Fund Balance
33,428,027 34,711,703 33,882,375 32,653,344 27,698,389 26,398,941
35,647,445 34,711,703 33,882,375 32,653,344 27,698,389 26,398,941
0 0 0 0 0 -2,219,418
BudgetBudget Budget Budget BudgetActual EstimateFund Summary
27,911,684
27,911,684
0
Adopted
FY 2008 FY 2010 FY 2011 FY 2012 FY 2013 FY 2014FY 2009FY 2009
Fund Pro FormasFiscal Year 2010
F-21
Page 22
City of Tallahassee
Fiscal Year 2010 Approved Budget - Fund Proforma Summary
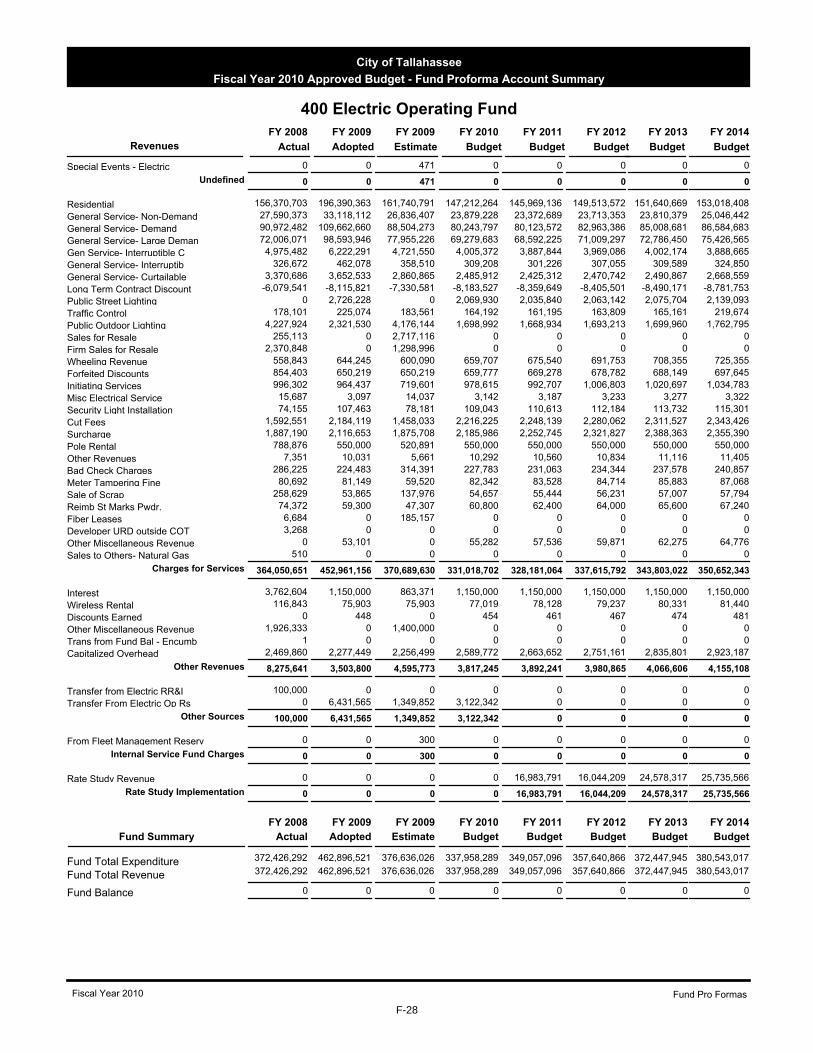
400 Electric Operating Fund
The Electric Utility Department continues to focus on providing high quality, reliable electric service at a
competitive cost that results in an appropriate financial return to the general government. The city's enterprise
fund owns, operates and maintains an electric generation, transmission, and distribution system that supplies
electric power and energy to homes and businesses in a service area of approximately 221 square miles, 99,945
total system customers, and 114,930 service points as of the end of fiscal year 2009. Electric generation,
transmission, and distribution facilities are located within Leon and Wakulla counties.
For the fiscal year ending September 30, 2008, the utility sold 2,694,106 megawatt hours (MWh) of electric
energy to 100,600 ultimate customers and received operating revenues of nearly $344.9 million. By contrast,
sales as of September 30, 2009 totaled 2,662,634 MWh to 99,937 ultimate customers that generated revenue of
approximately $353.6 million.
The electric system operates three generating systems. The Sam O. Purdom Plant, located in St. Marks,
Florida and the Arvah B. Hopkins plant are fossil-fueled generating stations that contain combined cycle steam
and combustion turbine electric generating facilities. The system also includes the C. H. Corn Hydroelectric
Station, located on Lake Talquin. All three generating systems have a total summer season net generating
capacity of 805 megawatts. The corresponding winter net peak installed generating capacity is 876 megawatts.
The transmission network forms a loop that extends around and through the city limits. Bulk power primary
distribution substations, located at various sites, transform power from the transmission voltage of 115 kilovolts
(kV) to the distribution network voltage of 12.47 kV. Transmission, distribution and generation facilities are
monitored and controlled remotely from the Electric Control Center via microwave system and communication
lines network.
The Electric Department provides the engineering and design of electric substations, high voltage transmission
lines and the distribution system facilities to provide service for customers every year. The department also
provides engineering and project management for the relocation of distribution circuits for many city, county and
state road construction projects.
The Electric Fund's fiscal year 2010 operating expenditures total approximately $337.9 million and the capital
budget is nearly $48.1 million. The utility's five-year capital improvement program totals $346.6 million.
Revenues in excess of expenditures, when available, are distributed to the electric rate stabilization reserve.
Budgeted expenditures exceed budgeted revenues in fiscal year 2010, requiring a transfer of approximately $3.1
million from the rate stabilization reserve to balance the fund. Fiscal years 2011 through 2014 are balanced by
additional revenue projected to be generated from rate increases.
Fund Pro FormasFiscal Year 2010
F-22
Page 23
City of Tallahassee
Fiscal Year 2010 Approved Budget - Fund Proforma Summary
400 Electric Operating Fund
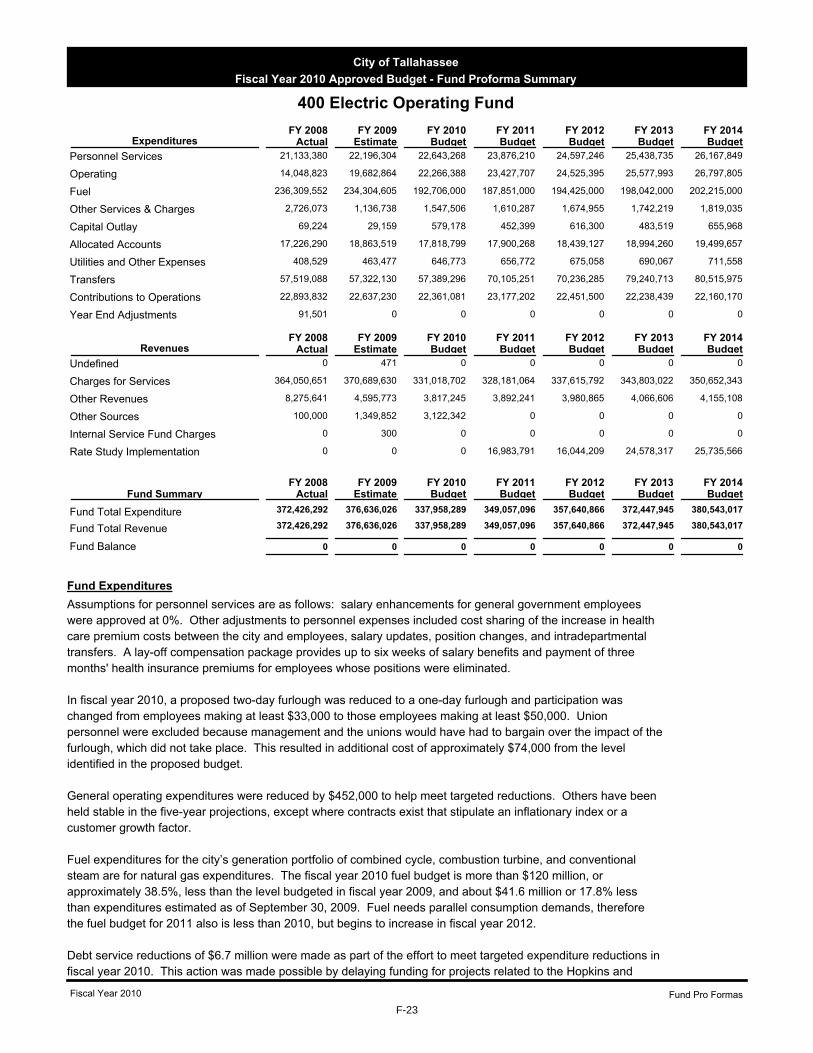
BudgetBudget Budget Budget BudgetFY 2010 FY 2011 FY 2012 FY 2013 FY 2014
Actual EstimateFY 2009FY 2008
Expenditures
22,643,268 23,876,210 24,597,246 25,438,735 26,167,849 21,133,380 22,196,304Personnel Services
22,266,388 23,427,707 24,525,395 25,577,993 26,797,805 14,048,823 19,682,864Operating
192,706,000 187,851,000 194,425,000 198,042,000 202,215,000 236,309,552 234,304,605Fuel
1,547,506 1,610,287 1,674,955 1,742,219 1,819,035 2,726,073 1,136,738Other Services & Charges
579,178 452,399 616,300 483,519 655,968 69,224 29,159Capital Outlay
17,818,799 17,900,268 18,439,127 18,994,260 19,499,657 17,226,290 18,863,519Allocated Accounts
646,773 656,772 675,058 690,067 711,558 408,529 463,477Utilities and Other Expenses
57,389,296 70,105,251 70,236,285 79,240,713 80,515,975 57,519,088 57,322,130Transfers
22,361,081 23,177,202 22,451,500 22,238,439 22,160,170 22,893,832 22,637,230Contributions to Operations
0 0 0 0 0 91,501 0Year End Adjustments
BudgetBudget Budget Budget BudgetFY 2010 FY 2011 FY 2012 FY 2013 FY 2014
Actual EstimateFY 2009FY 2008
Revenues
0 0 0 0 0 0 471Undefined
331,018,702 328,181,064 337,615,792 343,803,022 350,652,343 364,050,651 370,689,630Charges for Services
3,817,245 3,892,241 3,980,865 4,066,606 4,155,108 8,275,641 4,595,773Other Revenues
3,122,342 0 0 0 0 100,000 1,349,852Other Sources
0 0 0 0 0 0 300Internal Service Fund Charges
0 16,983,791 16,044,209 24,578,317 25,735,566 0 0Rate Study Implementation
337,958,289
337,958,289
Fund Total Expenditure
Fund Total Revenue
0Fund Balance
380,543,017 372,447,945 357,640,866 349,057,096 376,636,026 372,426,292
380,543,017 372,447,945 357,640,866 349,057,096 376,636,026 372,426,292
0 0 0 0 0 0
FY 2008BudgetBudget Budget Budget Budget
FY 2010 FY 2011 FY 2012 FY 2013 FY 2014Actual Estimate
FY 2009Fund Summary
Fund Expenditures
Assumptions for personnel services are as follows: salary enhancements for general government employees
were approved at 0%. Other adjustments to personnel expenses included cost sharing of the increase in health
care premium costs between the city and employees, salary updates, position changes, and intradepartmental
transfers. A lay-off compensation package provides up to six weeks of salary benefits and payment of three
months' health insurance premiums for employees whose positions were eliminated.
In fiscal year 2010, a proposed two-day furlough was reduced to a one-day furlough and participation was
changed from employees making at least $33,000 to those employees making at least $50,000. Union
personnel were excluded because management and the unions would have had to bargain over the impact of the
furlough, which did not take place. This resulted in additional cost of approximately $74,000 from the level
identified in the proposed budget.
General operating expenditures were reduced by $452,000 to help meet targeted reductions. Others have been
held stable in the five-year projections, except where contracts exist that stipulate an inflationary index or a
customer growth factor.
Fuel expenditures for the city’s generation portfolio of combined cycle, combustion turbine, and conventional
steam are for natural gas expenditures. The fiscal year 2010 fuel budget is more than $120 million, or
approximately 38.5%, less than the level budgeted in fiscal year 2009, and about $41.6 million or 17.8% less
than expenditures estimated as of September 30, 2009. Fuel needs parallel consumption demands, therefore
the fuel budget for 2011 also is less than 2010, but begins to increase in fiscal year 2012.
Debt service reductions of $6.7 million were made as part of the effort to meet targeted expenditure reductions in
fiscal year 2010. This action was made possible by delaying funding for projects related to the Hopkins and
Fund Pro FormasFiscal Year 2010
F-23
Page 24
City of Tallahassee
Fiscal Year 2010 Approved Budget - Fund Proforma Summary
400 Electric Operating Fund
Purdom facilities and those that support power engineering, transmission/distribution operations, and the
demand side management program to future fiscal years. Debt service expenditures for fiscal years 2010 –
2014 fluctuate between approximately $35.5 million and $50.5 million.
The balance of system improvements are accomplished by cash funding projects through year-end transfers to
the renewal, replacement, and improvement fund (RR&I). Electric’s RR&I fund, which was reduced by $4.3
million in fiscal year 2010 to meet targeted reductions, gradually increases from $21.8 million in fiscal year 2010
to $30 million in fiscal year 2014.
The electric fund transfer to the general fund is an amount not to exceed 8.3 mills per kilowatt-hours (kWh) of
retail sales. The kWh is determined based on the most recently completed fiscal year actual experience. For
fiscal year 2010, the $22.3 million transfer is based on sales generated as of the end of fiscal year 2008, which
is lower than had been projected in fiscal year 2009 for 2010. This is due to lower 2008 sales to ultimate
customers than projected.
Other expenditure adjustments are delineated in the department's operating budget write-up.
The proforma estimates all customer revenue classes will be lower in fiscal year 2010 than both fiscal years
2008 and 2009 as a result of declining consumption. September 2008 total sales to ultimate customers were
2,694,106 MWh, which is contrasted by sales of 2,662,634 MWh through September 2009. Revenues projected
for 2010 and 2011 indicate a continued decline in consumption from 2009 levels, with an upswing projected
beginning fiscal year 2012 and increasing through 2014. These trends are reflected graphically on the Electric
Operating Fund chart of the most significant revenues at the end of this section. Annual revenue projections
through 2014 are less than actual revenue generated in fiscal year 2008.
Rate increases of 3.1%, 7.4% and 10.6% were implemented in fiscal years 2006 through 2008 to address
shortfalls in revenue requirements. The City commission has approved automatic increases in base rates to
cover costs the electric utility incurs for construction and maintenance, and to reflect the city’s cost for fuel and
purchased power. However, the fuel recovery fee will decrease from $0.07605 to $0.06470 per kWh effective
October 1, 2009. This will result in a decrease in the typical 1,000 kWh residential electric cost of
approximately eight percent.
As shown in the proforma, current rate revenue is insufficient to support projected expenditures each fiscal year.
A transfer of $3.1 million from the rate stabilization reserve addresses the shortfall in fiscal year 2010. Shortfalls
projected in fiscal years 2011 through 2014 are supported by additional rate revenue that ranges from $16 million
to $25.7 million.
Revenue derived from various fees and charges for services such as street lighting, cut fees, surcharges, and
pole rentals parallel those of other revenue categories. Interest income is based on estimated balances on
bonds, RR&I fund balances, and sinking fund accruals. Other revenues have been assigned to the respective
specific category and therefore are reflected at zero.
Fund Revenues
Fund Pro FormasFiscal Year 2010
F-24
Page 25
City of Tallahassee
Fiscal Year 2010 Approved Budget - Fund Proforma Summary
400 Electric Operating Fund
Capital Projects Operating Budget Impacts
There is no operating impact estimated within the current five-year capital improvement plan and future impacts
will be built into the five-year plan as applicable.
Fund Pro FormasFiscal Year 2010
F-25
Page 26
City of Tallahassee
Fiscal Year 2010 Approved Budget - Fund Proforma Account Summary
400 Electric Operating Fund
BudgetBudget Budget Budget Budget
FY 2010 FY 2011 FY 2012 FY 2014
Actual Estimate
FY 2009FY 2008
Expenditures Adopted
FY 2009 FY 2013
16,878,013 17,381,971 17,953,595 17,953,595 18,311,990 18,860,304 19,425,067Salaries 17,340,943
-3,500,159 -3,061,736 -3,583,555 -3,685,830 -3,806,647 -3,923,620 -4,044,370Capitalized Wages -3,090,162
0 0 0 358,395 548,301 564,774 581,711Salary Enhancements 547,981
154,668 300,000 231,889 236,896 242,053 247,129 249,048Temporary Wages 332,136
2,745,935 1,973,743 2,296,378 2,365,903 2,437,514 2,674,533 2,745,952Overtime 1,974,142
-959,254 -374,770 -461,846 -475,308 -489,176 -575,295 -592,082Capitalized Overtime -541,834
21,274 28,351 19,367 163,377 165,383 167,450 167,450Other Salary Items 169,195
1,556,175 1,463,302 1,631,954 2,208,908 2,275,004 2,343,064 2,413,149Pension- Current 1,628,456
1,462,248 1,297,625 1,285,060 1,310,723 1,349,902 1,390,284 1,431,896Pension- MAP 1,280,619
224,962 212,249 188,163 191,933 197,641 203,568 209,640Mandatory Medicare 186,901
1,625,328 1,482,824 1,718,530 1,804,523 1,894,656 1,989,361 2,088,852Health Benefits 1,664,019
366,418 983,304 1,012,804 1,037,044 1,068,156 1,100,198 1,100,198Health Benefits-Retirees 983,304
557,772 509,441 585,588 585,588 585,588 585,588 585,588Flex Benefits 587,388
0 0 -179,537 -179,537 -183,119 -188,603 -194,250Vacancy factor of 1.0% -520,227
0 0 -55,122 0 0 0 0Furlough savings 0
22,643,268 23,876,210 24,597,246 25,438,735 26,167,849 21,133,380 22,196,304Personnel Services 22,542,861
32,320 0 32,104 33,169 34,265 35,484 37,176Advertising 31,526
16,347 16,073 147,279 150,809 155,306 161,172 165,677Cleaning & Laundry 138,153
7,796 15,249 15,620 16,193 16,785 18,726 19,302Reproduction 11,493
190,767 550,000 933,519 984,342 1,024,843 1,066,968 1,105,868Unclassified Professional Svcs 921,596
12 0 0 0 0 0 0System Collection 0
6,432 24,033 120,090 117,056 121,658 126,444 130,294Building Repairs 105,778
4,119,936 7,437,091 8,872,720 9,506,230 10,100,633 10,626,059 11,387,570Equipment Repairs 7,965,975
2,250 1,000 0 0 0 0 0Engineering Services 0
8,110 0 25,021 26,035 27,080 28,168 29,013Contract Engineering Svcs 23,655
35,000 120,000 236,517 246,096 255,964 266,226 278,396Legal Services 225,809
16,392 1,770 65,903 68,577 71,331 74,196 77,594Construction Services 63,321
4,905,182 6,698,535 6,785,841 7,071,191 7,355,457 7,674,747 7,956,105Unclassified Contract Svcs 6,919,047
12,464 48,068 4,740 4,901 5,067 5,238 5,337Computer Software 1,672
183,196 334,547 397,079 405,892 419,513 433,624 441,003Environmental Contractual 229,410
65,111 35,011 58,117 60,588 63,132 65,791 64,033Telephone 55,649
511,210 341,218 470,476 494,094 518,838 537,248 553,385Chem-Med-Lab 451,272
5,062 8,323 5,741 5,974 6,215 6,465 6,761Food 10,513
1,034 60 9,018 9,289 9,568 9,952 10,251Gasoline 8,755
890 0 0 0 0 0 0Oil & Lubricants 0
6,836 5,915 9,816 10,055 10,300 10,689 11,011Postage 7,349
56,629 53,193 64,747 67,122 69,563 72,237 74,509Office Supplies 61,757
21,844 9,182 30,611 31,881 33,203 34,581 36,016Uniforms & Clothing 58,591
3,204,001 3,381,774 3,356,151 3,482,196 3,578,509 3,662,779 3,741,904Unclassified Supplies 3,502,498
850 0 0 0 0 0 0Non-Capitalized Furniture 0
1,656,185 2,238,986 0 0 0 0 0Vehicle- Non-Garage 0
9,831 3,325 0 0 0 0 0Building Supplies 0
101,300 64,835 81,858 82,949 85,159 87,784 90,187Safety Materials & Supplies 76,409
-1,639,642 -2,185,824 0 0 0 0 0Veh-Non Garage Expense Offset 0
101,227 80,053 166,489 172,821 179,337 186,193 185,883Travel & Training 162,082
7,508 7,069 10,171 10,482 10,803 11,137 11,531Journals & Books 7,370
299,182 237,028 289,941 290,232 290,533 290,845 291,073Memberships 242,277
310 367 0 0 0 0 0Certificates & Licenses 0
4,548 140 0 0 0 0 0Rent Expense- Land 0
92,489 125,376 16,073 16,569 17,081 17,609 18,137Rent Expense- Machines 7,416
6,218 30,467 60,746 62,964 65,252 67,631 69,789Unclassified Charges 54,265
22,266,388 23,427,707 24,525,395 25,577,993 26,797,805 14,048,823 19,682,864Operating 21,343,638
197,300,443 224,255,134 167,773,000 164,595,000 171,413,000 174,909,000 177,604,000Fossil Fuel Electric 300,314,000
35,328,910 5,535,550 9,133,000 8,456,000 8,212,000 8,333,000 8,811,000Purchased Power 7,413,000
2,121,350 3,733,678 5,000,000 5,000,000 5,000,000 5,000,000 5,000,000Purchased Power Capacity 5,000,000
1,131,455 0 0 0 0 0 0Purch Pwr Cap- Others/City 0
218,185 180,788 0 0 0 0 0Transmission Expense- CR3 0
206,557 597,389 800,000 800,000 800,000 800,000 800,000Transmission Exp- CH Corn 800,000
2,652 2,066 0 0 0 0 0Transmiss Use-Others/City 0
0 0 10,000,000 9,000,000 9,000,000 9,000,000 10,000,000Fuel/Purchased Power-Forecast Margin
0
192,706,000 187,851,000 194,425,000 198,042,000 202,215,000 236,309,552 234,304,605Fuel 313,527,000
Fund Pro FormasFiscal Year 2010
F-26
Page 27
City of Tallahassee
Fiscal Year 2010 Approved Budget - Fund Proforma Account Summary
400 Electric Operating Fund
BudgetBudget Budget Budget Budget
FY 2010 FY 2011 FY 2012 FY 2014
Actual Estimate
FY 2009FY 2008
Expenditures Adopted
FY 2009 FY 2013
28,109 58,000 62,258 64,784 67,386 70,092 72,685Assessments & Fees 59,819
745,146 442,667 822,558 855,928 890,301 926,054 968,481Interest on Deposits 790,333
1,888,022 508,071 528,787 550,240 572,337 595,321 622,595Bad Debt Expense 508,071
64,795 128,000 133,903 139,335 144,931 150,752 155,274Environmental Assessments& 128,657
1,547,506 1,610,287 1,674,955 1,742,219 1,819,035 2,726,073 1,136,738Other Services & Charges 1,486,880
1,176 0 0 0 0 0 0Office Equipment 41,042
643 471 0 0 0 0 0Computer Equipment 2,700
36,193 2,175 344,000 207,462 361,200 217,835 379,260Vehicle Equipment 197,583
31,212 26,513 235,178 244,937 255,100 265,684 276,708Unclassified Equipment 398,076
579,178 452,399 616,300 483,519 655,968 69,224 29,159Capital Outlay 639,401
304,561 331,906 300,673 300,673 309,693 318,984 328,553Human Resource Expense 331,906
740,403 801,549 709,827 709,827 731,122 753,056 775,648Accounting Expense 801,549
840,898 1,070,251 846,217 846,217 871,604 897,752 924,684Purchasing Expense 1,070,251
1,950,275 1,779,558 1,635,113 1,635,113 1,684,166 1,734,691 1,786,732Information Systems Expense 1,779,558
3,291,612 4,921,307 4,033,912 4,033,912 4,154,929 4,279,577 4,407,965Risk Management Expense 4,921,307
78,091 80,462 66,019 66,019 68,019 70,019 72,022Radio Communications Expense 80,462
871,195 760,396 798,570 798,570 822,527 847,203 872,619Revenue Collection Expense 760,396
5,050,722 4,401,884 4,740,860 4,740,860 4,883,086 5,029,579 5,180,466Utility Services Expense 4,401,884
0 970,116 788,972 788,972 812,641 837,020 862,131Environmental 970,116
451,534 335,004 342,221 342,221 349,362 356,717 364,293Energy Services 335,004
1,243,364 700,000 718,149 718,149 739,693 761,884 784,741Vehicle Garage Expense 754,084
0 237,954 286,138 286,138 294,722 303,564 312,671Vehicle Fuel 523,480
385,374 445,801 463,977 482,802 502,243 522,435 545,355Vehicle Replacement 445,801
2,018,261 2,027,331 2,088,151 2,150,795 2,215,319 2,281,778 2,281,778Indirect Costs 2,027,331
17,818,799 17,900,268 18,439,127 18,994,260 19,499,657 17,226,290 18,863,519Allocated Accounts 19,203,129
31,468 19,031 19,481 20,065 20,667 21,287 21,925Utilities - Sewer 18,206
135,072 188,724 354,950 359,608 364,478 369,605 380,887Utilities - Sanitation 350,978
10,024 10,494 10,346 10,764 11,200 11,653 12,127Utilities - Stormwater 10,237
8,232 12,568 35,750 37,196 38,706 40,272 41,906Utilities - Gas 35,375
14,552 11,727 24,879 27,615 28,445 29,298 30,177Utilities - Water 24,879
207,488 219,241 197,488 197,487 207,362 213,582 219,989Utilities - Electric 205,716
1,693 1,692 3,879 4,037 4,200 4,370 4,547Utilities - Fire Services 3,839
646,773 656,772 675,058 690,067 711,558 408,529 463,477Utilities and Other Expenses 649,230
35,607,420 35,420,925 35,528,646 42,820,251 42,905,085 50,511,013 50,506,945Debt Service Transfer 39,006,505
21,876,000 21,860,647 21,860,650 27,285,000 27,331,200 28,729,700 30,009,030RR&I Transfer 21,860,647
35,668 40,558 0 0 0 0 0Inter-Fund Transfer 0
57,389,296 70,105,251 70,236,285 79,240,713 80,515,975 57,519,088 57,322,130Transfers 60,867,152
22,893,832 22,637,230 22,361,081 23,177,202 22,451,500 22,238,439 22,160,170Contribution to General Fund 22,637,230
22,361,081 23,177,202 22,451,500 22,238,439 22,160,170 22,893,832 22,637,230Contributions to Operations 22,637,230
91,501 0 0 0 0 0 0Transfer to Rate Stabiliz 0
0 0 0 0 0 91,501 0Year End Adjustments 0
Fund Pro FormasFiscal Year 2010
F-27
Page 28
City of Tallahassee
Fiscal Year 2010 Approved Budget - Fund Proforma Account Summary
400 Electric Operating Fund
BudgetBudget Budget Budget Budget
FY 2010 FY 2011 FY 2012 FY 2014
Actual Estimate
FY 2009FY 2008
Revenues Adopted
FY 2009 FY 2013
0 471 0 0 0 0 0Special Events - Electric 0
0 0 0 0 0 0 471Undefined 0
156,370,703 161,740,791 147,212,264 145,969,136 149,513,572 151,640,669 153,018,408Residential 196,390,363
27,590,373 26,836,407 23,879,228 23,372,689 23,713,353 23,810,379 25,046,442General Service- Non-Demand 33,118,112
90,972,482 88,504,273 80,243,797 80,123,572 82,963,386 85,008,681 86,584,683General Service- Demand 109,662,660
72,006,071 77,955,226 69,279,683 68,592,225 71,009,297 72,786,450 75,426,565General Service- Large Deman 98,593,946
4,975,482 4,721,550 4,005,372 3,887,844 3,969,086 4,002,174 3,888,665Gen Service- Interruptible C 6,222,291
326,672 358,510 309,208 301,226 307,055 309,589 324,850General Service- Interruptib 462,078
3,370,686 2,860,865 2,485,912 2,425,312 2,470,742 2,490,867 2,668,559General Service- Curtailable 3,652,533
-6,079,541 -7,330,581 -8,183,527 -8,359,649 -8,405,501 -8,490,171 -8,781,753Long Term Contract Discount -8,115,821
0 0 2,069,930 2,035,840 2,063,142 2,075,704 2,139,093Public Street Lighting 2,726,228
178,101 183,561 164,192 161,195 163,809 165,161 219,674Traffic Control 225,074
4,227,924 4,176,144 1,698,992 1,668,934 1,693,213 1,699,960 1,762,795Public Outdoor Lighting 2,321,530
255,113 2,717,116 0 0 0 0 0Sales for Resale 0
2,370,848 1,298,996 0 0 0 0 0Firm Sales for Resale 0
558,843 600,090 659,707 675,540 691,753 708,355 725,355Wheeling Revenue 644,245
854,403 650,219 659,777 669,278 678,782 688,149 697,645Forfeited Discounts 650,219
996,302 719,601 978,615 992,707 1,006,803 1,020,697 1,034,783Initiating Services 964,437
15,687 14,037 3,142 3,187 3,233 3,277 3,322Misc Electrical Service 3,097
74,155 78,181 109,043 110,613 112,184 113,732 115,301Security Light Installation 107,463
1,592,551 1,458,033 2,216,225 2,248,139 2,280,062 2,311,527 2,343,426Cut Fees 2,184,119
1,887,190 1,875,708 2,185,986 2,252,745 2,321,827 2,388,363 2,355,390Surcharge 2,116,653
788,876 520,891 550,000 550,000 550,000 550,000 550,000Pole Rental 550,000
7,351 5,661 10,292 10,560 10,834 11,116 11,405Other Revenues 10,031
286,225 314,391 227,783 231,063 234,344 237,578 240,857Bad Check Charges 224,483
80,692 59,520 82,342 83,528 84,714 85,883 87,068Meter Tampering Fine 81,149
258,629 137,976 54,657 55,444 56,231 57,007 57,794Sale of Scrap 53,865
74,372 47,307 60,800 62,400 64,000 65,600 67,240Reimb St Marks Pwdr. 59,300
6,684 185,157 0 0 0 0 0Fiber Leases 0
3,268 0 0 0 0 0 0Developer URD outside COT 0
0 0 55,282 57,536 59,871 62,275 64,776Other Miscellaneous Revenue 53,101
510 0 0 0 0 0 0Sales to Others- Natural Gas 0
331,018,702 328,181,064 337,615,792 343,803,022 350,652,343 364,050,651 370,689,630Charges for Services 452,961,156
3,762,604 863,371 1,150,000 1,150,000 1,150,000 1,150,000 1,150,000Interest 1,150,000
116,843 75,903 77,019 78,128 79,237 80,331 81,440Wireless Rental 75,903
0 0 454 461 467 474 481Discounts Earned 448
1,926,333 1,400,000 0 0 0 0 0Other Miscellaneous Revenue 0
1 0 0 0 0 0 0Trans from Fund Bal - Encumb 0
2,469,860 2,256,499 2,589,772 2,663,652 2,751,161 2,835,801 2,923,187Capitalized Overhead 2,277,449
3,817,245 3,892,241 3,980,865 4,066,606 4,155,108 8,275,641 4,595,773Other Revenues 3,503,800
100,000 0 0 0 0 0 0Transfer from Electric RR&I 0
0 1,349,852 3,122,342 0 0 0 0Transfer From Electric Op Rs 6,431,565
3,122,342 0 0 0 0 100,000 1,349,852Other Sources 6,431,565
0 300 0 0 0 0 0From Fleet Management Reserv 0
0 0 0 0 0 0 300Internal Service Fund Charges 0
0 0 0 16,983,791 16,044,209 24,578,317 25,735,566Rate Study Revenue 0
0 16,983,791 16,044,209 24,578,317 25,735,566 0 0Rate Study Implementation 0
337,958,289
337,958,289Fund Total ExpenditureFund Total Revenue
0Fund Balance
380,543,017 372,447,945 357,640,866 349,057,096 376,636,026 372,426,292
380,543,017 372,447,945 357,640,866 349,057,096 376,636,026 372,426,292
0 0 0 0 0 0
BudgetBudget Budget Budget BudgetActual EstimateFund Summary
462,896,521
462,896,521
0
Adopted
FY 2008 FY 2010 FY 2011 FY 2012 FY 2013 FY 2014FY 2009FY 2009
Fund Pro FormasFiscal Year 2010
F-28
Page 29
City of Tallahassee
Fiscal Year 2010 Approved Budget - Fund Proforma Summary
430 Gas Operating Fund
The City of Tallahassee has owned, operated, and managed a natural gas distribution system since 1956. The
number of active service points, which include locations where gas can be consumed if there were a meter and
active utility customers as of March 31, 2009, is 25,326. The majority of available service points (94%) are for
residential accounts.
Gas utility customers include four types, the majority being residential (94%), commercial (6%) and small
interruptible and contract customers, which account for the balance. The department continues to provide
interruptible services to several commercial customers in addition to special and flexible contract customers.
Under special contracts, the utility is permitted to lower its margin in order to compete in terms of cost with
alternative fuels. This type of contract allows the Gas Utility to respond to changing market conditions where
customer acquisition or retention is economically feasible. Customers are required to submit documentation
supporting the quantity, quality, availability, and cost of alternative fuels.
Rate indicators for the fund continue to show declining system growth, mild heating degree-day deficiencies,
rising fuel expenses, moderate local and national economic growth, and rising cost of goods and services.
Average residential customer natural gas bills increased by $2.50 on April 1, 2008 and will increase by $1.10 on
October 1, 2009.
The Gas Fund accounts for the assets, operations, maintenance, and operating financial transactions of the
city-owned gas system and is currently balanced for all five years. The department's approved budget is both
realistic and moderately in line with the fund's five-year financial plan.
The 2009 fiscal year budget reflects expenditures in the amount of $37.9 million, representing a decrease of
$9.38 million from the 2009 approved budget. This is primarily due to the decrease in estimated fuel expenses.
In FY 2010, the fuel budget is $23.3 million versus fiscal year 2009 fuel forecast of $29.1 million. These
estimates are based on the New York Mercantile Exchange (NYMEX) natural gas closing price as of April 30,
2009.
The major source of revenues for the gas fund is metered sales that represent approximately 95% of the
operating revenues. Remaining revenue is generated from service initiations, fees and charges, a surcharge, and
non-operating sources such as system charge and interest earnings.
The city's finance policy regarding the funding level for capital expenditures from operating revenues was
changed for all the utilities during fiscal year 2006. The new policy provides for phasing-in additional funding for
capital expenditures equal to annual depreciation expenses. The target amount for FY 2010 includes $1.8
million, with an annual increase of $100,000 for the next three years. The amount for FY 2010 was reduced
because of lower revenue projections.
The capital improvement program for fiscal year 2010 is being funded with available cash balances in the amount
of $1.59 million, $1.08 million in bonds, and a little under a half million dollars ($489,540) is being transferred
from the fund's repair, replacement, and improvement fund. For fiscal year 2010, the Gas Utility capital budget
is $3,211,400. Over the five-year period from FY 2010-FY 2014, funding for gas improvements total $5,493,850.
Fund Pro FormasFiscal Year 2010
F-29
Page 30
City of Tallahassee
Fiscal Year 2010 Approved Budget - Fund Proforma Summary
430 Gas Operating Fund
BudgetBudget Budget Budget BudgetFY 2010 FY 2011 FY 2012 FY 2013 FY 2014
Actual EstimateFY 2009FY 2008
Expenditures
2,008,539 2,102,457 2,167,420 2,234,607 2,300,872 2,125,222 2,176,804Personnel Services
881,780 890,342 899,116 908,108 917,323 446,010 876,666Operating
23,341,143 21,731,245 22,866,568 23,369,692 23,369,692 23,195,533 25,705,200Fuel
82,411 82,411 82,411 82,411 82,411 82,091 80,034Other Services & Charges
2,240,928 2,263,381 2,326,387 2,391,282 2,449,450 2,564,616 2,476,553Allocated Accounts
62,096 62,639 63,227 63,862 63,862 59,465 59,955Utilities and Other Expenses
4,211,988 5,816,730 6,667,275 6,602,773 6,610,655 5,958,876 5,212,761Transfers
2,323,000 2,323,000 2,323,000 2,323,000 2,323,000 2,323,000 2,323,000Contributions to Operations
1,603,576 2,394,715 1,205,666 1,592,110 2,430,665 0 1,800,485Year End Adjustments
BudgetBudget Budget Budget BudgetFY 2010 FY 2011 FY 2012 FY 2013 FY 2014
Actual EstimateFY 2009FY 2008
Revenues
36,119,702 37,018,446 37,939,626 38,888,960 39,861,280 34,588,982 39,949,699Charges for Services
635,759 648,474 661,444 678,885 686,650 431,397 761,759Other Revenues
0 0 0 0 0 1,734,434 0Other Sources
36,755,461
36,755,461
Fund Total Expenditure
Fund Total Revenue
0Fund Balance
40,547,930 39,567,845 38,601,070 37,666,920 40,711,458 36,754,813
40,547,930 39,567,845 38,601,070 37,666,920 40,711,458 36,754,813
0 0 0 0 0 0
FY 2008BudgetBudget Budget Budget Budget
FY 2010 FY 2011 FY 2012 FY 2013 FY 2014Actual Estimate
FY 2009Fund Summary
Fund Expenditures
Operating and Maintenance expenditures have decreased due to cost reductions and efficiencies identified by
the department. Additional reductions of five percent in the department's funding for temporary wages and
overtime were directed by the City Commission at their January 2009 budget workshop to address projected
deficits during the fiscal year. The commission also directed that unexpended capital outlay funding in
departments be eliminated.
No capital outlay funds have been budgeted for the entire five-year plan.
An analysis for uncollectible accounts receivable was completed as of September 30, 2005. Based upon the
review performed, the allowance balances for the Gas Fund are at a reasonable level. Bad debt continues to be
held at a constant $65,000 for the five-year period.
The utility's contribution to the General Fund is established in accordance with the financial policy and is
proposed at $2,323,000 for the five-year period.
In FY 2010, a two-day furlough for non-union employees making at least $33,000 annually is proposed, resulting
in financial savings to the city.
The following service level changes were approved for fiscal year 2010 budget.
Salary enhancements for general government employees were approved at 0%, while Police union employees
were approved at an average increase of 5.5%, per the collective bargaining agreement. Negotiations between
management and the Fire union will continue into FY10, regarding FY10 raises for Fire union personnel. Other
adjustments to personnel expenses included cost sharing of the increase in health care premiums between the
city and employees, salary updates, position changes, and intradepartmental transfers. A lay-off compensation
package provides up to six weeks of salary benefits and payment of three months health insurance for
employees whose positions will be eliminated.
Fund Pro FormasFiscal Year 2010
F-30
Page 31
City of Tallahassee
Fiscal Year 2010 Approved Budget - Fund Proforma Summary
430 Gas Operating Fund
A one day furlough for those employees making at least $50,000 is included. Fiscal Impact: $7,789.
A reduction of 2.5% was made to the travel and training budget. Fiscal Impact: ($732).
A reduction of $18,000 in the citywide training budget, resulted in a reduction to the Human Resources
allocation. Fiscal Impact: ($210).
See the City Commission action section in the Underground Utilities Department for additional changes to the
FY10 approved budget.
Residential growth is forecast to increase by approximately 2% annually. Commercial, and interruptible growth
is also forecast to increase by 2% annually. Other miscellaneous revenues are projected to increase by 1.5%
annually.
Fund Revenues
Fund Pro FormasFiscal Year 2010
F-31
Page 32
City of Tallahassee
Fiscal Year 2010 Approved Budget - Fund Proforma Summary
430 Gas Operating Fund
Capital Projects Operating Budget Impacts
There are no operating impacts within the current five-year capital improvement plan and future impacts will be
built into the five-year plan as applicable.
Fund Pro FormasFiscal Year 2010
F-32
Page 33
City of Tallahassee
Fiscal Year 2010 Approved Budget - Fund Proforma Account Summary
430 Gas Operating Fund
BudgetBudget Budget Budget Budget
FY 2010 FY 2011 FY 2012 FY 2014
Actual Estimate
FY 2009FY 2008
Expenditures Adopted
FY 2009 FY 2013
1,726,976 1,750,504 1,543,522 1,543,522 1,574,394 1,621,624 1,670,274Salaries 1,808,263
-324,732 -365,455 -327,876 -334,434 -341,122 -347,944 -354,903Capitalized Wages -407,571
0 0 0 30,872 47,232 48,647 50,109Salary Enhancements 57,140
11,008 12,951 63,065 64,326 65,613 66,925 68,263Temporary Wages 14,500
78,225 89,660 89,000 89,000 89,000 89,000 89,000Overtime 91,675
-8,883 -3,463 0 0 0 0 0Capitalized Overtime 0
8,267 8,780 2,079 2,079 2,079 2,079 2,079Other Salary Items 9,034
160,550 161,029 140,336 189,967 195,652 201,516 207,559Pension- Current 170,196
136,825 129,172 110,509 112,716 116,095 119,575 123,155Pension- MAP 134,022
19,977 20,520 15,863 16,178 16,663 17,163 17,673Mandatory Medicare 20,191
200,747 200,348 201,070 211,131 221,677 232,757 244,398Health Benefits 210,873
40,484 95,419 98,281 101,229 104,266 107,394 107,394Health Benefits-Retirees 95,419
75,777 77,339 75,871 75,871 75,871 75,871 75,871Flex Benefits 81,420
0 0 0 0 0 0 0Vacancy factor of 1.0% -54,248
0 0 -3,181 0 0 0 0Furlough savings 0
2,008,539 2,102,457 2,167,420 2,234,607 2,300,872 2,125,222 2,176,804Personnel Services 2,230,914
1,000 5,824 5,824 5,970 6,119 6,272 6,429Advertising 5,824
8,464 9,929 9,440 9,676 9,918 10,166 10,420Cleaning & Laundry 9,929
828 1,466 1,465 1,502 1,539 1,578 1,617Reproduction 1,466
91,676 91,650 107,500 110,188 112,943 115,767 118,661Unclassified Professional Svcs 130,500
111,300 111,300 111,300 111,300 111,300 111,300 111,300System Dispatch Services 111,300
316 2,188 2,188 2,243 2,299 2,356 2,415Building Repairs 2,188
1,449 7,220 7,220 7,379 7,542 7,709 7,880Equipment Repairs 7,220
23,085 23,147 26,560 27,724 28,917 30,140 31,393Unclassified Contract Svcs 77,157
19,034 17,921 17,920 18,368 18,827 19,298 19,780Telephone 17,921
905 407 0 0 0 0 0Chem-Med-Lab 407
1,516 1,050 1,050 1,077 1,104 1,131 1,159Food 1,050
181 1,402 1,472 1,472 1,472 1,472 1,472Gasoline 1,402
294 1,087 1,087 1,114 1,142 1,171 1,200Postage 1,087
5,299 5,700 5,700 5,843 5,989 6,139 6,292Office Supplies 5,700
5,246 6,228 6,228 6,384 6,545 6,709 6,877Uniforms & Clothing 6,228
69,139 61,336 53,336 54,670 56,037 57,438 58,874Unclassified Supplies 71,336
0 12,022 0 0 0 0 0Non-Capitalized Furniture 0
24,004 21,274 28,542 29,274 30,025 30,793 31,582Travel & Training 21,274
1,308 1,543 1,543 1,543 1,543 1,543 1,543Journals & Books 1,543
71,521 39,975 39,975 40,974 41,998 43,048 44,124Memberships 39,975
0 5,000 5,000 5,000 5,000 5,000 5,000Certificates & Licenses 5,000
45 0 0 0 0 0 0Rent Expense- Bldg & Ops 0
9,399 8,997 8,430 8,641 8,857 9,078 9,305Rent Expense- Machines 8,997
0 440,000 440,000 440,000 440,000 440,000 440,000Unclassified Charges 440,000
881,780 890,342 899,116 908,108 917,323 446,010 876,666Operating 967,504
23,195,533 25,705,200 23,341,143 21,731,245 22,866,568 23,369,692 23,369,692COGS- Natural Gas 29,130,507
23,341,143 21,731,245 22,866,568 23,369,692 23,369,692 23,195,533 25,705,200Fuel 29,130,507
17,091 15,034 17,411 17,411 17,411 17,411 17,411Interest on Deposits 17,411
65,000 65,000 65,000 65,000 65,000 65,000 65,000Bad Debt Expense 65,000
82,411 82,411 82,411 82,411 82,411 82,091 80,034Other Services & Charges 82,411
45,191 49,704 41,912 41,912 43,170 44,466 45,800Human Resource Expense 49,704
62,460 54,728 63,867 63,867 65,783 67,756 69,789Accounting Expense 54,728
51,978 35,148 27,073 27,073 27,885 28,722 29,583Purchasing Expense 35,148
325,522 260,074 261,145 261,145 268,979 277,049 285,360Information Systems Expense 260,074
64,455 36,143 40,075 40,075 41,277 42,516 43,791Risk Management Expense 36,143
10,170 10,013 8,216 8,216 8,216 8,216 9,243Radio Communications Expense 10,013
86,911 82,856 86,242 86,242 88,829 91,494 94,239Revenue Collection Expense 82,856
1,025,470 986,469 870,181 870,181 896,286 923,175 950,870Utility Services Expense 986,469
0 83,550 43,070 43,070 44,362 45,693 47,064Environmental 83,550
396,563 268,003 274,143 274,143 279,856 285,740 291,798Energy Services 268,003
221,972 222,000 119,865 119,865 123,461 127,165 130,980Vehicle Garage Expense 83,704
0 49,712 51,582 51,582 53,129 54,723 56,365Vehicle Fuel 99,425
39,715 50,915 57,702 71,279 71,279 71,279 71,279Vehicle Replacement 50,915
234,210 287,238 295,855 304,731 313,873 323,289 323,289Indirect Costs 287,238
2,240,928 2,263,381 2,326,387 2,391,282 2,449,450 2,564,616 2,476,553Allocated Accounts 2,387,970
Fund Pro FormasFiscal Year 2010
F-33
Page 34
City of Tallahassee
Fiscal Year 2010 Approved Budget - Fund Proforma Account Summary
430 Gas Operating Fund
BudgetBudget Budget Budget Budget
FY 2010 FY 2011 FY 2012 FY 2014
Actual Estimate
FY 2009FY 2008
Expenditures Adopted
FY 2009 FY 2013
27,139 26,627 28,235 28,235 28,235 28,235 28,235Utilities - Sanitation 28,235
2,425 2,463 2,425 2,425 2,425 2,425 2,425Utilities - Stormwater 2,425
1,740 1,808 2,178 2,178 2,178 2,178 2,178Utilities - Gas 2,178
425 421 445 445 445 445 445Utilities - Water 445
26,783 27,683 27,860 28,403 28,991 29,626 29,626Utilities - Electric 27,341
953 953 953 953 953 953 953Utilities - Fire Services 953
62,096 62,639 63,227 63,862 63,862 59,465 59,955Utilities and Other Expenses 61,577
3,229,544 3,296,761 3,838,930 3,897,407 3,845,681 3,763,325 3,753,780Debt Service Transfer 3,296,761
2,284,046 1,916,000 0 1,536,483 2,428,800 2,436,500 2,446,850RR&I Transfer 1,916,000
445,286 0 373,058 382,840 392,794 402,948 410,025Inter-Fund Transfer 0
4,211,988 5,816,730 6,667,275 6,602,773 6,610,655 5,958,876 5,212,761Transfers 5,212,761
2,323,000 2,323,000 2,323,000 2,323,000 2,323,000 2,323,000 2,323,000Contribution to General Fund 2,323,000
2,323,000 2,323,000 2,323,000 2,323,000 2,323,000 2,323,000 2,323,000Contributions to Operations 2,323,000
0 1,800,485 1,603,576 2,394,715 1,205,666 1,592,110 2,430,665Transfer to RR&I 4,952,417
1,603,576 2,394,715 1,205,666 1,592,110 2,430,665 0 1,800,485Year End Adjustments 4,952,417
BudgetBudget Budget Budget Budget
FY 2010 FY 2011 FY 2012 FY 2014
Actual Estimate
FY 2009FY 2008
Revenues Adopted
FY 2009 FY 2013
12,022,750 13,882,983 13,549,674 13,888,416 14,235,626 14,591,517 14,956,035Residential 17,995,139
10,347,445 12,900,874 10,848,709 11,119,927 11,397,925 11,682,873 11,974,945Non-Residential 14,276,473
2,001,563 2,715,661 1,830,904 1,876,677 1,923,594 1,971,683 2,020,975Interruptible 2,715,661
9,831,046 10,013,395 9,482,976 9,720,050 9,963,052 10,212,128 10,467,431Flexible Contract Interrupti 11,055,515
90,754 134,903 135,475 136,049 136,625 142,363 148,343Forfeited Discounts 134,903
115,811 146,262 88,616 89,883 91,168 92,472 93,794Initiating Services 146,262
7,975 13,967 8,518 8,640 8,764 8,889 9,016Tapping Fees 13,967
41,924 36,625 37,150 37,682 38,222 38,769 38,769Cut Fees 36,625
122,594 103,994 117,800 120,745 123,764 126,858 130,029Surcharge 103,994
900 0 17,720 18,163 18,617 19,082 19,559Gas Pilot Lighting 0
6,222 1,035 2,160 2,214 2,269 2,326 2,384Other Miscellaneous Revenue 1,035
36,119,702 37,018,446 37,939,626 38,888,960 39,861,280 34,588,982 39,949,699Charges for Services 46,479,574
185,266 185,000 269,915 275,313 280,820 290,649 290,649Interest 264,623
2 332,791 0 0 0 0 0Other Miscellaneous Revenue 332,791
20,657 0 0 0 0 0 0Trans from Fund Bal - Encumb 0
225,472 243,968 365,844 373,161 380,624 388,236 396,001Capitalized Overhead 272,073
635,759 648,474 661,444 678,885 686,650 431,397 761,759Other Revenues 869,487
1,734,434 0 0 0 0 0 0Transfer from Gas RR&I Fund 0
0 0 0 0 0 1,734,434 0Other Sources 0
36,755,461
36,755,461Fund Total ExpenditureFund Total Revenue
0Fund Balance
40,547,930 39,567,845 38,601,070 37,666,920 40,711,458 36,754,813
40,547,930 39,567,845 38,601,070 37,666,920 40,711,458 36,754,813
0 0 0 0 0 0
BudgetBudget Budget Budget BudgetActual EstimateFund Summary
47,349,061
47,349,061
0
Adopted
FY 2008 FY 2010 FY 2011 FY 2012 FY 2013 FY 2014FY 2009FY 2009
Fund Pro FormasFiscal Year 2010
F-34
Page 35
City of Tallahassee
Fiscal Year 2010 Approved Budget - Fund Proforma Summary
460 Water Operating Fund
The Water Division delivers potable water from pumping stations to city residents as well as to adjacent
communities. The division owns, operates, and maintains a water production and distribution system that
services Tallahassee and portions of Leon and Wakulla counties. As of March 2009, water infrastructure
includes 28 deep wells, eight elevated water storage tanks, and approximately 1,199 miles of water main.
Approximately 4.5 billion gallons of water have been sold to 75,100 customers.
The water capital improvement plan (CIP) for fiscal years 2010-14 chiefly entails projects to maintain, replace,
and upgrade water system infrastructure, including water supply wells, storage tanks, and distribution facilities.
An update to the master water plan was implemented in fiscal year 2008 to determine system expansion
requirements in response to the city-county franchise agreement, and $2 million is included annually in the
5-year CIP to fund specific expansion projects that are identified.
BudgetBudget Budget Budget BudgetFY 2010 FY 2011 FY 2012 FY 2013 FY 2014
Actual EstimateFY 2009FY 2008
Expenditures
4,554,723 4,779,617 4,934,923 5,095,799 5,255,065 3,811,114 4,344,473Personnel Services
641,171 652,382 663,891 675,705 684,469 3,102,527 2,782,323Operating
497,500 497,500 497,500 497,500 497,500 680,762 528,171Other Services & Charges
0 0 0 0 0 167,120 3,696Capital Outlay
5,311,879 5,390,347 5,542,386 5,678,442 5,819,857 5,904,560 5,338,130Allocated Accounts
2,392,075 2,438,761 2,489,049 2,543,352 2,543,352 2,343,329 2,336,650Utilities and Other Expenses
9,067,404 10,532,109 10,968,792 11,047,869 11,120,663 5,175,009 5,684,058Transfers
6,678,846 7,072,918 7,545,661 7,899,372 8,333,568 5,811,993 6,012,465Contributions to Operations
678,404 2,342,149 2,488,429 2,561,706 2,582,597 0 0Year End Adjustments
BudgetBudget Budget Budget BudgetFY 2010 FY 2011 FY 2012 FY 2013 FY 2014
Actual EstimateFY 2009FY 2008
Revenues
25,534,365 29,302,788 30,608,307 31,353,337 32,116,695 22,845,202 22,949,228Charges for Services
2,758,023 2,848,091 2,941,927 3,039,741 3,092,002 2,322,038 2,083,475Other Revenues
745,716 751,389 757,108 763,002 767,871 1,829,174 1,997,263Other Sources
783,898 803,515 823,289 843,665 860,503 0 0Internal Service Fund Charges
29,822,002
29,822,002
Fund Total Expenditure
Fund Total Revenue
0Fund Balance
36,837,071 35,999,745 35,130,631 33,705,783 27,029,966 26,996,414
36,837,071 35,999,745 35,130,631 33,705,783 27,029,966 26,996,414
0 0 0 0 0 0
FY 2008BudgetBudget Budget Budget Budget
FY 2010 FY 2011 FY 2012 FY 2013 FY 2014Actual Estimate
FY 2009Fund Summary
Fund Expenditures
The most significant expenditure increases above those budgeted in fiscal year 2009 are attributable to debt
service expenses.
Other expenditure changes assume:
The rate studies approved March 26, 2008, recommended phased in increases from April of 2008 to FY 2010 for
sewer services at rates of 15%, 14% and 14%. A water rate increase of 12.9% was implemented effective
January 1, 2009, and by an additional 11% in FY 2011.
Funding for cash-financed repairs, replacements, and improvements (RR&I) are based on anticipated levels of
activity in the capital improvement plan.
The proforma presumes implementation of customer rates at levels sufficient to support revenue requirements as
shown in all years of the proforma in accordance with the 2008 rate study.
Fund Pro FormasFiscal Year 2010
F-35
Page 36
City of Tallahassee
Fiscal Year 2010 Approved Budget - Fund Proforma Summary
460 Water Operating Fund
Operating and Maintenance expenditures have decreased due to cost reductions and efficiencies identified by
the department. Additional reductions of five percent in the department's funding for temporary wages and
overtime were directed by the City Commission at their January 2009 budget workshop to address projected
deficits during the fiscal year. The commission also directed that unexpended capital outlay funding in
departments be eliminated.
The fund’s contribution to the General Fund is equivalent to twenty percent of gross water revenues less
surcharge revenue, averaged over a three-year period, plus surcharge revenue.
Funding for System Planning Services and Potable Water Monitoring have been reclassified as Inter Fund
Transfers.
The following service level changes were approved as proposed for the Water Department's fiscal year 2010
budget.
Salary enhancements for general government employees were approved at 0%. Other adjustments to personnel
expenses included cost sharing of the increase in health care premiums between the city and employees,
salary updates, position changes, and intradepartmental transfers. A lay-off compensation package provides up
to six weeks of salary benefits and payment of three months health insurance for employees whose positions
will be eliminated.
A one day furlough for employees making $50,000 is included. Fiscal Impact: $16,161.
A reduction of 2.5% was made to the travel and training budget. Fiscal Impact: ($287).
A reduction of $18,000 in the citywide training budget, resulted in a reduction to the Human Resources
allocation. Fiscal Impact: ($530).
See the City Commission action section additional changes to the FY10 approved budget.
Water system revenues include water sales, development fees, various water service fees, and other
miscellaneous fees.
Revenue growth is a result of increases in both customer usage and rates. The 2010 projection reflects
increases in metered water sales from increased revenues related to the rate increase approved in fiscal year
2008 effective January 1, 2009. Rates are anticipated to increase by 11% in FY 2011.
Fund Revenues
Fund Pro FormasFiscal Year 2010
F-36
Page 37
City of Tallahassee
Fiscal Year 2010 Approved Budget - Fund Proforma Summary
460 Water Operating Fund
Capital Projects Operating Budget Impacts
No fiscal year 2010 projects have additional operating impacts.
Fund Pro FormasFiscal Year 2010
F-37
Page 38
City of Tallahassee
Fiscal Year 2010 Approved Budget - Fund Proforma Account Summary
460 Water Operating Fund
BudgetBudget Budget Budget Budget
FY 2010 FY 2011 FY 2012 FY 2014
Actual Estimate
FY 2009FY 2008
Expenditures Adopted
FY 2009 FY 2013
3,293,470 3,732,684 3,927,204 3,927,204 4,005,747 4,125,921 4,249,700Salaries 3,941,356
-1,077,400 -1,232,303 -1,375,000 -1,402,500 -1,430,550 -1,459,161 -1,488,344Capitalized Wages -1,095,000
0 0 0 78,543 120,171 123,779 127,490Salary Enhancements 124,548
45,491 49,517 173,275 174,245 175,234 176,243 177,272Temporary Wages 52,000
351,497 367,593 320,557 321,971 323,420 324,906 326,429Overtime 409,957
-173,423 -191,934 -191,500 -192,125 -192,766 -193,423 -194,096Capitalized Overtime -234,704
7,630 15,668 21,829 22,138 22,454 22,778 23,110Other Salary Items 19,980
301,170 350,346 357,456 483,834 498,314 513,230 528,593Pension- Current 372,993
273,494 284,598 281,474 287,088 295,677 304,533 313,654Pension- MAP 294,779
43,461 43,774 41,492 42,317 43,577 44,888 46,223Mandatory Medicare 44,116
485,247 501,133 568,822 597,285 627,119 658,465 691,394Health Benefits 587,839
75,995 217,041 223,552 230,258 237,167 244,281 244,281Health Benefits-Retirees 217,041
184,482 206,356 209,359 209,359 209,359 209,359 209,359Flex Benefits 218,544
0 0 0 0 0 0 0Vacancy factor of 1.0% -118,240
0 0 -3,797 0 0 0 0Furlough savings 0
4,554,723 4,779,617 4,934,923 5,095,799 5,255,065 3,811,114 4,344,473Personnel Services 4,835,209
0 0 15,200 15,200 15,200 15,200 15,200Advertising 15,200
16,594 16,251 25,252 25,791 26,344 26,910 27,490Cleaning & Laundry 22,572
2,090 4,110 4,110 4,206 4,305 4,406 4,510Reproduction 4,110
8,663 600 0 0 0 0 0Unclassified Professional Svcs 0
971,923 791,577 0 0 0 0 0System Planning Services 1,001,567
96,566 99,463 102,447 105,520 108,686 111,947 111,947System Collection 99,463
2,396 5,110 5,110 5,238 5,369 5,503 5,641Building Repairs 5,110
9,115 12,378 24,696 25,301 25,921 26,557 27,209Equipment Repairs 24,696
29 0 0 0 0 0 0Medical Services 0
650 0 0 0 0 0 0Educational Services 0
76,386 92,264 86,816 88,085 89,387 90,721 92,088Unclassified Contract Svcs 133,866
17,286 15,300 15,300 15,300 15,300 15,300 15,300Computer Software 15,300
0 13,580 13,580 13,580 13,580 13,580 13,580Environmental Contractual 13,580
1,552,114 1,369,194 0 0 0 0 0Potable Water Monitoring 1,585,920
18,183 23,744 23,744 24,263 24,794 25,339 25,898Telephone 23,744
82,051 56,018 56,018 57,418 58,853 60,326 61,834Chem-Med-Lab 56,018
2,741 1,929 1,929 1,957 1,985 2,014 2,044Food 1,929
83 682 682 699 716 734 752Gasoline 682
777 0 0 0 0 0 0Oil & Lubricants 0
107 0 0 0 0 0 0Postage 0
12,018 12,016 12,016 12,241 12,472 12,708 12,951Office Supplies 12,016
20,924 33,748 40,602 41,417 42,254 43,111 43,989Uniforms & Clothing 40,602
150,037 146,290 117,580 118,657 119,761 120,893 122,053Unclassified Supplies 292,580
6,281 0 0 0 0 0 0Non-Capitalized Furniture 0
101 600 0 0 0 0 0Building Supplies 600
1,993 3,140 3,140 3,206 3,274 3,343 3,414Safety Materials & Supplies 3,140
23,460 0 0 0 0 0 0Other 0
6,244 11,507 11,220 11,440 11,666 11,898 12,133Travel & Training 11,507
279 2,182 2,182 2,224 2,266 2,310 2,356Journals & Books 2,182
9,850 13,828 13,828 13,913 14,000 14,089 14,180Memberships 13,828
1,364 25,375 25,375 26,007 26,655 27,319 27,999Certificates & Licenses 25,375
0 24,937 25,344 25,344 25,344 25,344 25,344Rent Expense- Bldg & Ops 24,937
10,882 5,000 5,000 5,125 5,253 5,384 5,519Rent Expense- Machines 5,000
1,340 1,500 10,000 10,250 10,506 10,769 11,038Unclassified Charges 10,000
641,171 652,382 663,891 675,705 684,469 3,102,527 2,782,323Operating 3,445,524
61,521 58,742 70,000 70,000 70,000 70,000 70,000Interest on Deposits 70,000
140,000 140,000 140,000 140,000 140,000 140,000 140,000Bad Debt Expense 140,000
479,241 327,762 285,000 285,000 285,000 285,000 285,000Line Extensions 475,000
0 1,667 2,500 2,500 2,500 2,500 2,500Environmental Assessments& 2,500
497,500 497,500 497,500 497,500 497,500 680,762 528,171Other Services & Charges 687,500
46,712 3,696 0 0 0 0 0Computer Equipment 62,500
120,408 0 0 0 0 0 0Unclassified Equipment 120,500
0 0 0 0 0 167,120 3,696Capital Outlay 183,000
Fund Pro FormasFiscal Year 2010
F-38
Page 39
City of Tallahassee
Fiscal Year 2010 Approved Budget - Fund Proforma Account Summary
460 Water Operating Fund
BudgetBudget Budget Budget Budget
FY 2010 FY 2011 FY 2012 FY 2014
Actual Estimate
FY 2009FY 2008
Expenditures Adopted
FY 2009 FY 2013
113,115 119,634 105,978 105,978 109,157 112,432 115,805Human Resource Expense 119,634
127,100 128,199 139,789 139,789 143,983 148,302 152,751Accounting Expense 128,199
151,556 182,996 132,802 132,802 136,786 140,890 145,116Purchasing Expense 182,996
605,040 352,986 461,140 461,140 474,974 489,223 503,900Information Systems Expense 352,986
502,674 333,105 250,736 250,736 258,258 266,006 273,986Risk Management Expense 333,105
29,057 28,609 23,474 23,474 24,495 24,495 25,516Radio Communications Expense 28,609
65,074 67,670 63,210 63,210 65,106 67,059 69,071Revenue Collection Expense 67,670
2,514,961 2,370,753 2,170,859 2,170,859 2,235,985 2,303,065 2,372,157Utility Services Expense 2,370,753
0 68,079 194,256 194,256 200,084 206,086 212,269Environmental 68,079
42,260 53,601 54,316 54,316 55,459 56,636 57,848Energy Services 53,601
999,969 580,714 580,822 580,822 598,247 616,194 634,680Vehicle Garage Expense 580,714
0 238,532 273,478 273,478 281,682 290,133 298,837Vehicle Fuel 477,064
176,469 226,234 256,391 316,720 316,720 316,720 316,720Vehicle Replacement 226,234
577,284 587,018 604,628 622,767 641,450 641,201 641,201Indirect Costs 587,018
5,311,879 5,390,347 5,542,386 5,678,442 5,819,857 5,904,560 5,338,130Allocated Accounts 5,576,662
0 0 2,350 2,350 2,350 2,350 2,350Utilities - Sanitation 2,350
4,522 4,727 4,935 5,155 5,155 5,155 5,155Utilities - Stormwater 4,724
5,153 3,206 1,300 1,300 1,300 1,300 1,300Utilities - Water 1,300
2,332,985 2,328,084 2,382,875 2,429,341 2,479,629 2,533,932 2,533,932Utilities - Electric 2,338,444
669 633 615 615 615 615 615Utilities - Fire Services 615
2,392,075 2,438,761 2,489,049 2,543,352 2,543,352 2,343,329 2,336,650Utilities and Other Expenses 2,347,433
2,137,111 2,334,058 3,527,721 4,364,084 4,371,726 4,370,959 4,370,270Debt Service Transfer 2,334,058
3,000,000 3,350,000 3,200,000 3,750,000 4,100,000 4,100,000 4,100,000RR&I Transfer 3,350,000
37,898 0 2,339,683 2,418,025 2,497,066 2,576,910 2,650,393Inter-Fund Transfer 0
9,067,404 10,532,109 10,968,792 11,047,869 11,120,663 5,175,009 5,684,058Transfers 5,684,058
5,811,993 6,012,465 6,678,846 7,072,918 7,545,661 7,899,372 8,333,568Contribution to General Fund 6,012,465
6,678,846 7,072,918 7,545,661 7,899,372 8,333,568 5,811,993 6,012,465Contributions to Operations 6,012,465
0 0 678,404 2,342,149 2,488,429 2,561,706 2,582,597Transfer to RR&I 1,454,121
678,404 2,342,149 2,488,429 2,561,706 2,582,597 0 0Year End Adjustments 1,454,121
Fund Pro FormasFiscal Year 2010
F-39
Page 40
City of Tallahassee
Fiscal Year 2010 Approved Budget - Fund Proforma Account Summary
460 Water Operating Fund
BudgetBudget Budget Budget Budget
FY 2010 FY 2011 FY 2012 FY 2014
Actual Estimate
FY 2009FY 2008
Revenues Adopted
FY 2009 FY 2013
7,476 0 2,724 2,792 2,862 2,934 3,007Meter Tampering Fine 0
12,109,314 12,315,654 14,054,944 15,592,609 16,583,305 16,997,888 17,422,835Residential 14,010,965
7,440,356 7,922,789 8,786,242 9,737,328 9,979,740 10,229,234 10,484,965Commercial 8,322,789
96,358 89,266 90,873 92,509 94,078 95,674 97,300Forfeited Discounts 89,266
500,095 437,816 426,943 609,168 616,282 627,375 638,668Initiating Services 587,816
885,516 442,428 506,014 1,339,375 1,363,484 1,388,027 1,413,011Tapping Fees 1,292,428
137,855 146,203 151,661 203,330 206,990 210,716 214,509Cut Fees 196,203
1,300,821 1,300,800 1,105,343 1,267,332 1,296,351 1,328,760 1,361,979Surcharge 1,176,311
65,996 62,772 242,636 278,195 284,565 291,679 298,971Surcharge- Outside Leon Co 212,772
52,500 52,500 0 0 0 0 0Hydrant Rental 52,500
136,128 25,450 25,900 26,000 26,200 26,400 26,600Other Revenues 25,450
55,650 55,650 55,650 55,650 55,650 55,650 55,650System Dispatch Services 55,650
37,448 16,900 4,435 17,500 17,800 18,000 18,200Developer-Installed Line Ins 16,900
1,700 0 0 0 0 0 0Meter Relocation Fees 0
17,988 1,000 1,000 1,000 1,000 1,000 1,000Other Miscellaneous Revenue 1,000
0 80,000 80,000 80,000 80,000 80,000 80,000Laboratory Sample Test Fees 80,000
0 0 0 0 0 0 0System Planning 1,000,903
25,534,365 29,302,788 30,608,307 31,353,337 32,116,695 22,845,202 22,949,228Charges for Services 27,120,953
566,166 263,750 854,450 897,150 942,050 989,297 989,297Interest 813,750
505,885 391,782 411,638 432,220 453,831 476,523 500,349Wireless Rental 391,782
175,560 0 0 0 0 0 0Other Miscellaneous Revenue 0
46,600 47,456 0 0 0 0 0Trans from Fund Bal - Encumb 0
1,025,856 1,380,487 1,491,935 1,518,721 1,546,046 1,573,921 1,602,356Capitalized Overhead 1,380,487
1,970 0 0 0 0 0 0Transfer from Water 95 CUS DS Fund 0
2,758,023 2,848,091 2,941,927 3,039,741 3,092,002 2,322,038 2,083,475Other Revenues 2,586,019
0 0 153,706 157,552 161,429 165,425 168,726Transfer From Gas Fund 0
1,310,174 1,478,263 0 0 0 0 0Transfer From Water RR&I 0
519,000 519,000 519,000 519,000 519,000 519,000 519,000Transfer From Water System C 519,000
0 0 73,010 74,837 76,679 78,577 80,145Transfer From Stormwater Fun 0
745,716 751,389 757,108 763,002 767,871 1,829,174 1,997,263Other Sources 519,000
0 0 783,898 803,515 823,289 843,665 860,503From Sewer Fund 0
783,898 803,515 823,289 843,665 860,503 0 0Internal Service Fund Charges 0
29,822,002
29,822,002Fund Total ExpenditureFund Total Revenue
0Fund Balance
36,837,071 35,999,745 35,130,631 33,705,783 27,029,966 26,996,414
36,837,071 35,999,745 35,130,631 33,705,783 27,029,966 26,996,414
0 0 0 0 0 0
BudgetBudget Budget Budget BudgetActual EstimateFund Summary
30,225,972
30,225,972
0
Adopted
FY 2008 FY 2010 FY 2011 FY 2012 FY 2013 FY 2014FY 2009FY 2009
Fund Pro FormasFiscal Year 2010
F-40
Page 41
City of Tallahassee
Fiscal Year 2010 Approved Budget - Fund Proforma Summary
500 Sewer Operating Fund
The sanitary sewer collection system is comprised of approximately 675 miles of gravity pipe and is connected
to over 15,000 manholes. Over 85 pumping stations use approximately 100 miles of force main to support the
gravity system. The sanitary sewer collection system is projected to serve approximately 63,977 customers in
fiscal year 2010.
The system transports raw sewage from homes and businesses in Tallahassee to the Thomas P. Smith (TPS)
Water Reclamation Facility. The Thomas P. Smith facility can treat 27.5 million gallons per day and is capable
of handling peak flows up to 55 million gallons per day.
Due to the damage caused in August 2008 from Tropical Storm Fay to a major sewer line, operation of the Lake
Bradford Plant has been required in FY09 and FY10.
The paramount challenge facing the fund during the next five to six years is implementation of the advanced
wastewater treatment (AWT) improvements at the TPS treatment facilities. The estimated total capital cost is
$228 million. AWT improvements are required by the settlement agreement reached in December 2006 with the
petitioners who objected to renewal of the city’s operating permits. AWT facilities will produce treated
wastewater that meets quality standards for public access reuse, which the TRRF project addresses.
The sewer system also requires significant capital investment to address replacement and rehabilitation of aging
infrastructure and system expansion to provide central sewer service to meet growth in both the city and the
unincorporated area.
BudgetBudget Budget Budget BudgetFY 2010 FY 2011 FY 2012 FY 2013 FY 2014
Actual EstimateFY 2009FY 2008
Expenditures
11,719,259 12,274,445 12,664,819 13,068,270 13,470,909 11,188,095 11,407,231Personnel Services
3,489,995 3,580,727 3,667,092 3,761,481 3,849,202 3,196,364 3,341,660Operating
682,500 682,500 682,500 682,500 682,500 1,014,380 783,012Other Services & Charges
0 0 0 0 0 188,624 24,533Capital Outlay
5,913,939 6,023,114 6,198,480 6,344,297 6,496,284 5,596,448 5,876,427Allocated Accounts
4,637,741 4,783,494 4,862,677 4,942,842 4,942,906 4,445,385 4,704,411Utilities and Other Expenses
23,381,189 29,394,048 30,430,682 30,449,952 30,465,766 17,055,517 19,733,884Transfers
2,981,251 3,378,943 3,653,392 3,874,502 4,044,701 2,059,262 2,299,866Contributions to Operations
3,995,785 3,490,887 2,699,856 3,285,426 4,011,652 0 31,448Year End Adjustments
BudgetBudget Budget Budget BudgetFY 2010 FY 2011 FY 2012 FY 2013 FY 2014
Actual EstimateFY 2009FY 2008
Revenues
49,035,641 55,698,777 56,811,697 58,220,878 59,668,810 40,480,682 44,376,951Charges for Services
2,671,991 2,723,885 2,770,026 2,817,231 2,839,252-680,824 1,525,521Other Revenues
2,754,344 2,767,471 2,780,709 2,794,251 2,805,465 4,944,218 2,300,000Other Sources
2,339,683 2,418,025 2,497,066 2,576,910 2,650,393 0 0Internal Service Fund Charges
56,801,659
56,801,659
Fund Total Expenditure
Fund Total Revenue
0Fund Balance
67,963,920 66,409,270 64,859,498 63,608,158 48,202,472 44,744,076
67,963,920 66,409,270 64,859,498 63,608,158 48,202,472 44,744,076
0 0 0 0 0 0
FY 2008BudgetBudget Budget Budget Budget
FY 2010 FY 2011 FY 2012 FY 2013 FY 2014Actual Estimate
FY 2009Fund Summary
Fund Expenditures
The fund’s expenditures continue to be driven by debt service and operations and maintenance costs associated
with capital infrastructure improvements, some of which are discussed above.
Other factors affecting expenditures for FY 2010 assume:
Fund Pro FormasFiscal Year 2010
F-41
Page 42
City of Tallahassee
Fiscal Year 2010 Approved Budget - Fund Proforma Summary
500 Sewer Operating Fund
Additionally, the future liability for other post employee benefits (retiree health care) is budgeted according to an
actuarial study estimating the current expense and future benefit needs.
Operating and Maintenance expenditures have decreased due to cost reductions and efficiencies identified by
the department. Additional reductions of five percent in the department's funding for temporary wages and
overtime were directed by the City Commission at their January 2009 budget workshop to address projected
deficits during the fiscal year. The commission also directed that unexpended capital outlay funding in
departments be eliminated.
The following service level changes were approved as proposed for the Sewer Department's fiscal year 2010
budget. See the City Commission action section additional changes to the FY10 approved budget.
Salary enhancements for general government employees were approved at 0%. Adjustments to personnel
expenses included cost sharing of the increase in health care premiums between the city and employees,
salary updates, position changes, and intradepartmental transfers. A lay-off compensation package provides up
to six weeks of salary benefits and payment of three months health insurance for employees whose positions
will be eliminated.
A one day furlough for employees making at least $50,000 is included. Fiscal Impact: $38,379.
A reduction of 2.5% was made to the travel and training budget. Fiscal Impact: ($828).
A reduction of $18,000 in the citywide training budget, resulted in a reduction to the Human Resources
allocation. Fiscal Impact: ($1,012).
The rate studies approved March 26, 2008, recommended phased in increases from April of 2008 to FY 2010 for
sewer services at rates of 15%, 14% and 14%.
Wastewater system revenues include monthly sewer service charges, which are based on water consumption
rates, development fees, the sale of effluent and other miscellaneous fees. The system is expected to generate
revenue of approximately $49 million in fiscal year 2010.
Revenue growth is driven, in large part, by the cost of capital infrastructure associated with advanced
wastewater treatment requirements of the settlement agreement, which, in turn, requires higher rates.
Fund Revenues
Fund Pro FormasFiscal Year 2010
F-42
Page 43
City of Tallahassee
Fiscal Year 2010 Approved Budget - Fund Proforma Summary
500 Sewer Operating Fund
Capital Projects Operating Budget Impacts
TPS headworks improvements are necessary to meet state permitting requirements, particularly for the
reduction of nitrogen. Design will be completed in 2009 and early work packages such as storage pond
construction and demolition of existing facilities will also commence in 2009.
Operating expenses related to TPS headworks improvements ($10,000 annually for additional chemical and
utility expenses) are included in the proforma.
Fund Pro FormasFiscal Year 2010
F-43
Page 44
City of Tallahassee
Fiscal Year 2010 Approved Budget - Fund Proforma Account Summary
500 Sewer Operating Fund
BudgetBudget Budget Budget Budget
FY 2010 FY 2011 FY 2012 FY 2014
Actual Estimate
FY 2009FY 2008
Expenditures Adopted
FY 2009 FY 2013
8,444,438 8,235,601 9,216,485 9,216,485 9,400,813 9,682,841 9,973,321Salaries 8,486,711
-846,737 -647,592 -1,586,293 -1,605,214 -1,624,515 -1,644,205 -1,664,290Capitalized Wages -585,189
0 0 -37,659 146,516 244,049 252,350 261,077Salary Enhancements 230,416
11,603 17,101 51,809 52,845 53,901 54,979 56,079Temporary Wages 21,388
708,981 660,262 684,397 686,446 688,546 690,699 692,905Overtime 684,359
-249,860 -136,825 -135,853 -139,020 -141,048 -143,127 -145,258Capitalized Overtime -135,416
7,800 23,223 23,768 21,608 21,608 21,608 21,608Other Salary Items 31,685
772,408 763,828 838,177 1,134,538 1,168,520 1,203,525 1,239,576Pension- Current 795,652
683,638 615,052 656,624 669,700 689,760 710,431 731,814Pension- MAP 623,247
101,139 93,102 99,060 101,007 104,020 107,135 110,404Mandatory Medicare 93,180
985,494 968,469 1,064,842 1,118,132 1,173,979 1,232,651 1,294,290Health Benefits 1,156,554
183,646 436,658 449,643 463,018 476,802 490,999 490,999Health Benefits-Retirees 436,658
385,545 378,352 408,384 408,384 408,384 408,384 408,384Flex Benefits 393,387
0 0 0 0 0 0 0Vacancy factor of 1.0% -254,601
0 0 -14,125 0 0 0 0Furlough savings 0
11,719,259 12,274,445 12,664,819 13,068,270 13,470,909 11,188,095 11,407,231Personnel Services 11,978,031
1,086 0 35,750 35,769 35,788 35,808 35,828Advertising 35,750
31,842 39,159 39,654 40,647 41,666 42,709 43,780Cleaning & Laundry 39,159
2,755 8,691 6,321 6,481 6,644 6,810 6,981Reproduction 8,691
16,193 200 200 205 210 215 220Unclassified Professional Svcs 200
73,387 75,589 77,857 80,193 82,599 85,077 85,077System Collection 75,589
22,389 27,398 26,401 27,062 27,740 28,435 29,148Building Repairs 27,398
133,253 137,696 153,050 157,877 162,827 167,900 173,097Equipment Repairs 246,550
189 3,022 3,022 3,099 3,178 3,258 3,340Medical Services 3,022
0 3,800 0 0 0 0 0Engineering Services 3,800
34,358 0 0 0 0 0 0Legal Services 0
713,683 713,485 741,341 761,271 781,696 801,936 822,673Unclassified Contract Svcs 842,244
19,968 15,513 21,075 21,602 22,141 22,694 23,261Computer Software 30,325
1,000 0 1,940 1,989 2,039 2,090 2,142Environmental Contractual 15,520
31,767 31,835 34,019 34,821 35,642 36,484 37,350Telephone 31,889
1,148,775 1,243,898 1,303,898 1,336,497 1,369,909 1,404,157 1,439,256Chem-Med-Lab 1,243,898
6,162 2,990 2,990 3,040 3,091 3,143 3,197Food 2,990
71 0 0 0 0 0 0Gasoline 0
3,074 7,000 6,000 6,150 6,304 6,462 6,624Oil & Lubricants 7,000
1,318 2,926 2,926 2,999 3,074 3,152 3,232Postage 2,926
43,966 39,862 45,262 46,270 47,304 48,360 49,444Office Supplies 39,862
32,141 42,246 41,167 42,200 43,258 44,339 45,448Uniforms & Clothing 40,246
721,522 742,230 750,225 768,831 787,903 807,451 827,487Unclassified Supplies 742,230
14,414 1,274 5,400 5,535 5,673 5,815 5,960Non-Capitalized Furniture 1,274
1,700 0 0 0 0 0 0Vehicle- Non-Garage 0
1,849 6,639 9,400 9,635 9,876 10,122 10,375Building Supplies 6,639
12,339 16,110 11,460 11,747 12,041 12,342 12,651Safety Materials & Supplies 16,110
58,650 0 0 0 0 0 0Other 0
34,056 33,128 32,300 33,057 33,832 34,626 35,441Travel & Training 33,128
3,233 4,595 8,095 8,290 8,489 8,693 8,903Journals & Books 4,595
16,560 36,078 36,128 36,408 36,695 36,987 37,285Memberships 36,078
2,413 32,220 29,045 33,014 30,441 34,365 31,908Certificates & Licenses 32,220
0 46,332 25,350 25,350 25,350 25,350 25,350Rent Expense- Bldg & Ops 46,332
10,885 17,744 29,019 29,720 30,440 31,177 31,932Rent Expense- Machines 17,744
1,368 10,000 10,700 10,968 11,242 11,524 11,812Unclassified Charges 10,700
3,489,995 3,580,727 3,667,092 3,761,481 3,849,202 3,196,364 3,341,660Operating 3,644,109
200,000 200,000 200,000 200,000 200,000 200,000 200,000Bad Debt Expense 200,000
814,380 581,345 480,000 480,000 480,000 480,000 480,000Line Extensions 800,000
0 1,667 2,500 2,500 2,500 2,500 2,500Environmental Assessments& 2,500
682,500 682,500 682,500 682,500 682,500 1,014,380 783,012Other Services & Charges 1,002,500
7,419 0 0 0 0 0 0Office Equipment 0
29,866 0 0 0 0 0 0Computer Equipment 10,000
45 0 0 0 0 0 0Vehicle Equipment 0
151,295 24,533 0 0 0 0 0Unclassified Equipment 137,400
0 0 0 0 0 188,624 24,533Capital Outlay 147,400
Fund Pro FormasFiscal Year 2010
F-44
Page 45
City of Tallahassee
Fiscal Year 2010 Approved Budget - Fund Proforma Account Summary
500 Sewer Operating Fund
BudgetBudget Budget Budget Budget
FY 2010 FY 2011 FY 2012 FY 2014
Actual Estimate
FY 2009FY 2008
Expenditures Adopted
FY 2009 FY 2013
206,928 220,873 202,370 202,370 208,441 214,694 221,135Human Resource Expense 220,873
268,573 265,427 319,938 319,938 329,536 339,422 349,605Accounting Expense 265,427
185,921 175,650 178,362 178,362 183,713 189,224 194,901Purchasing Expense 175,650
602,213 794,171 726,070 726,070 747,852 770,288 793,396Information Systems Expense 794,171
610,647 628,192 668,989 668,989 689,059 709,730 731,022Risk Management Expense 628,192
43,949 43,270 35,504 35,504 36,519 37,534 38,547Radio Communications Expense 43,270
89,938 86,522 94,685 94,685 97,526 100,451 103,465Revenue Collection Expense 86,522
1,729,669 1,558,288 1,497,470 1,497,470 1,542,394 1,588,666 1,636,326Utility Services Expense 1,558,288
0 275,408 218,741 218,741 225,303 232,062 239,024Environmental 275,408
829,423 545,083 598,919 598,919 616,887 635,393 654,455Vehicle Garage Expense 544,660
0 214,043 238,000 238,000 245,140 252,494 260,069Vehicle Fuel 428,086
255,083 326,260 369,354 455,563 463,952 463,952 463,952Vehicle Replacement 326,260
774,104 743,240 765,537 788,503 812,159 810,386 810,386Indirect Costs 743,240
5,913,939 6,023,114 6,198,480 6,344,297 6,496,284 5,596,448 5,876,427Allocated Accounts 6,090,047
3,288 7,395 7,395 7,694 7,848 7,848 7,848Utilities - Sewer 7,395
590,917 398,195 383,825 387,963 390,051 390,090 390,130Utilities - Sanitation 383,925
30,560 30,159 31,938 34,088 34,274 34,274 34,274Utilities - Stormwater 29,926
238,611 729,067 536,600 540,600 542,600 542,600 542,600Utilities - Gas 731,000
126,317 74,448 83,322 84,401 84,974 84,998 85,022Utilities - Water 75,322
3,449,595 3,458,053 3,587,348 3,721,425 3,795,602 3,875,704 3,875,704Utilities - Electric 3,462,348
6,097 7,094 7,313 7,323 7,328 7,328 7,328Utilities - Fire Services 7,313
4,637,741 4,783,494 4,862,677 4,942,842 4,942,906 4,445,385 4,704,411Utilities and Other Expenses 4,697,229
11,797,364 12,687,552 13,597,291 18,590,533 18,607,393 18,606,287 18,605,263Debt Service Transfer 12,687,552
5,200,000 7,000,000 9,000,000 10,000,000 11,000,000 11,000,000 11,000,000RR&I Transfer 7,000,000
58,153 46,332 783,898 803,515 823,289 843,665 860,503Inter-Fund Transfer 0
23,381,189 29,394,048 30,430,682 30,449,952 30,465,766 17,055,517 19,733,884Transfers 19,687,552
2,059,262 2,299,866 2,981,251 3,378,943 3,653,392 3,874,502 4,044,701Contribution to General Fund 2,299,866
2,981,251 3,378,943 3,653,392 3,874,502 4,044,701 2,059,262 2,299,866Contributions to Operations 2,299,866
0 31,448 3,995,785 3,490,887 2,699,856 3,285,426 4,011,652Transfer to RR&I 2,240,442
3,995,785 3,490,887 2,699,856 3,285,426 4,011,652 0 31,448Year End Adjustments 2,240,442
Fund Pro FormasFiscal Year 2010
F-45
Page 46
City of Tallahassee
Fiscal Year 2010 Approved Budget - Fund Proforma Account Summary
500 Sewer Operating Fund
BudgetBudget Budget Budget Budget
FY 2010 FY 2011 FY 2012 FY 2014
Actual Estimate
FY 2009FY 2008
Revenues Adopted
FY 2009 FY 2013
281 0 0 0 0 0 0Other Revenues 0
20,850,031 24,088,531 26,380,007 31,069,949 31,717,348 32,510,282 33,323,039Residential 25,140,130
14,607,780 16,505,004 20,646,930 22,434,327 22,862,956 23,434,530 24,020,393Commercial 18,181,377
178,713 130,193 132,537 134,922 137,351 139,823 142,340Forfeited Discounts 130,193
260,635 71,982 134,357 136,776 139,238 141,744 144,295Tapping Fees 131,982
329,970 381,937 490,612 499,443 508,433 517,585 530,525Digester Fees 481,937
710,520 710,520 976,808 1,094,945 1,115,384 1,143,269 1,171,851Surcharge 925,260
662,130 25,959 26,426 26,902 27,386 27,879 28,381Other Revenues 25,959
178,764 94,750 94,750 94,750 94,750 94,750 94,750Laboratory Sample Test Fees 94,750
1,552,114 1,369,194 0 0 0 0 0Potable Water Monitoring 1,591,196
55,650 55,650 55,650 55,650 55,650 55,650 55,650System Dispatch Services 55,650
3,298 3,054 3,451 3,513 3,576 3,665 3,757Strong Waste Surcharge 3,054
971,923 791,577 0 0 0 0 0System Planning 1,001,567
80,924 82,000 27,513 81,000 83,025 85,101 87,229Developer-Installed Line Ins 132,000
2,768 0 0 0 0 0 0Demo Sewer Fees 0
35,182 66,600 66,600 66,600 66,600 66,600 66,600Other Miscellaneous Revenue 66,600
49,035,641 55,698,777 56,811,697 58,220,878 59,668,810 40,480,682 44,376,951Charges for Services 47,961,655
-1,937,241 750,000 965,000 995,000 1,020,000 1,045,628 1,045,628Interest 750,000
45 0 0 0 0 0 0Discounts Earned 0
146,588 66,210 0 0 0 0 0Other Miscellaneous Revenue 66,210
331,254 0 0 0 0 0 0Trans from Fund Bal - Encumb 0
778,531 709,311 1,706,991 1,728,885 1,750,026 1,771,603 1,793,624Capitalized Overhead 709,311
2,671,991 2,723,885 2,770,026 2,817,231 2,839,252-680,824 1,525,521Other Revenues 1,525,521
0 0 219,352 225,288 231,365 237,523 241,299Transfer From Gas Fund 0
2,634,599 0 0 0 0 0 0Transfer from Sewer RR&I Fd 0
2,300,000 2,300,000 2,300,000 2,300,000 2,300,000 2,300,000 2,300,000Transfer From Sewer System C 2,300,000
9,619 0 0 0 0 0 0Trans Frm Sewer 1995 Cusrb 0
0 0 234,992 242,183 249,344 256,728 264,166Transfer From Stormwater Fun 0
2,754,344 2,767,471 2,780,709 2,794,251 2,805,465 4,944,218 2,300,000Other Sources 2,300,000
0 0 2,339,683 2,418,025 2,497,066 2,576,910 2,650,393From Water Fund 0
2,339,683 2,418,025 2,497,066 2,576,910 2,650,393 0 0Internal Service Fund Charges 0
56,801,659
56,801,659Fund Total ExpenditureFund Total Revenue
0Fund Balance
67,963,920 66,409,270 64,859,498 63,608,158 48,202,472 44,744,076
67,963,920 66,409,270 64,859,498 63,608,158 48,202,472 44,744,076
0 0 0 0 0 0
BudgetBudget Budget Budget BudgetActual EstimateFund Summary
51,787,176
51,787,176
0
Adopted
FY 2008 FY 2010 FY 2011 FY 2012 FY 2013 FY 2014FY 2009FY 2009
Fund Pro FormasFiscal Year 2010
F-46
Page 47
City of Tallahassee
Fiscal Year 2010 Approved Budget - Fund Proforma Summary
540 Airport Operating Fund
Tallahassee Regional Airport is owned and managed by the City of Tallahassee and occupies nearly 2,750 acres
within the city limits. The Aviation Fund includes the commercial passenger facility; a general aviation terminal;
fire and police units; and administrative, operations, and maintenance staff. The fund’s operating budget
consists of routine expenditures associated with management of an airport such as personnel services,
contractual obligations, and operations and maintenance expenditures. The capital improvement program
includes all projects related to airfields, terminal buildings, access roadways, and parking lots. The Aviation
Fund is self-supporting and does not receive a subsidy from, nor make a transfer to, the General Fund. The
Tallahassee Regional Airport is a user-based facility, and residents who do not use the airport do not contribute
to the costs of its operations.
The fiscal year 2010–2014 capital improvement program totals more than $52.3 million. The Aviation
Department anticipates receiving over $28 million in federal assistance over the next five years, mainly for
runway and taxiway improvements, terminal improvements, and security enhancements in the terminal and
around the airfield perimeter. Funding of nearly $6 million also is anticipated from the Florida Department of
Transportation to help fund these and other improvements. The department also will rely on its own resources to
finance airport improvements, including $16.6 million in airport (mainly passenger facility charge and repair,
replacement and improvement) funds, and $0.6 million in private investments.
Excess revenues that remain in the fund, after all allowable expenditures have been accounted for, are
distributed to prepaid fee credit and airport system capital accounts. The prepaid fee credit is used by airlines
to reduce airport rental rates and fund capital improvements. The airport system capital account, which is the
city’s portion of surplus operating funds, helps support the department’s capital improvement program.
BudgetBudget Budget Budget BudgetFY 2010 FY 2011 FY 2012 FY 2013 FY 2014
Actual EstimateFY 2009FY 2008
Expenditures
4,403,141 4,632,385 4,769,438 4,910,686 5,050,727 4,285,517 4,363,900Personnel Services
1,488,852 1,488,852 1,488,852 1,488,852 1,488,852 1,422,275 1,233,053Operating
30,000 30,000 30,000 30,000 30,000 30,000 30,000Other Services & Charges
1,536,328 1,553,770 1,599,767 1,646,083 1,683,304 1,589,285 1,734,725Allocated Accounts
1,264,649 1,296,956 1,310,872 1,325,900 1,325,900 1,050,361 1,298,883Utilities and Other Expenses
1,295,672 1,296,773 1,302,595 1,307,190 345,194 1,347,825 1,296,756Transfers
897,541 965,349 991,760 1,019,133 1,046,995 892,513 919,434Contributions to Operations
1,442,660 1,247,325 1,200,381 991,988 1,809,576 2,313,964 1,206,440Year End Adjustments
BudgetBudget Budget Budget BudgetFY 2010 FY 2011 FY 2012 FY 2013 FY 2014
Actual EstimateFY 2009FY 2008
Revenues
12,254,843 12,407,410 12,589,665 12,615,832 12,676,548 12,711,903 11,979,114Charges for Services
104,000 104,000 104,000 104,000 104,000 219,837 104,077Other Revenues
12,358,843
12,358,843
Fund Total Expenditure
Fund Total Revenue
0Fund Balance
12,780,548 12,719,832 12,693,665 12,511,410 12,083,191 12,931,740
12,780,548 12,719,832 12,693,665 12,511,410 12,083,191 12,931,740
0 0 0 0 0 0
FY 2008BudgetBudget Budget Budget Budget
FY 2010 FY 2011 FY 2012 FY 2013 FY 2014Actual Estimate
FY 2009Fund Summary
Fund Expenditures
Expenditures in the fiscal year 2010-14 proforma assume:
Assumptions for personnel services are as follows: salaries for general employees are adjusted for a 0% merit
salary enhancement in FY10; general employee pension rates are 9.08% based on an actuarial study; matched
annuity pension plan rates are 7.15% based on an actuarial study; the health care rate is set at actual cost per
employee or at the family rate for vacant positions; and in departments with more than fifty employees, a 1.0%
vacancy factor is applied to salaries and benefits.
Fund Pro FormasFiscal Year 2010
F-47
Page 48
City of Tallahassee
Fiscal Year 2010 Approved Budget - Fund Proforma Summary
540 Airport Operating Fund
Bad debt expenditures remain constant based on projections provided by the Accounting Services Division.
Capital outlay items stand on their merits each fiscal year based on need and justification. Debt service
expense is based upon the projected level of debt required each year to support facility enhancements and other
infrastructure improvements.
A number of various expenditures have increased by annual changes in the consumer price index or customer
growth, as appropriate. Expenditure account increases were also driven by changes in existing contractual
agreements.
Airline rental rates, usage charges, and revenue derived from the lease of airport land and buildings to airlines,
rental car agencies, and other commercial enterprises have been projected to remain constant. Other revenue
sources show slight increases due to anticipated passenger growth and changes in the consumer price index,
as appropriate.
For FY 2010, scheduled landing fees are projected to realize a 4.3% increase from FY 2009. Mild increases in
private and commercial aircraft using the airport facility have been projected; therefore, more revenues are
anticipated.
Revenues from rental car concessions are budgeted to remain constant. These revenues are driven by
contractual agreements with rental car vendors.
Terminal space allocations are anticipated to fluctuate occasionally. Revenue will fluctuate as carriers move in
and out of the Tallahassee market, as the carrier mix (signatory or non-signatory) changes, and as terminal
rates are adjusted annually. FY 2009 projects slightly lower revenues than last fiscal year due to carriers
down-grading services. Fiscal years 2010 through 2014 are anticipated to improve as the Aviation Department
is working diligently with air service providers to expand services in our market, and access additional hubs.
The chart below depicts a graph of projected parking lot concessions, rental car concessions, terminal
rental-airlines and passenger security charge revenues through fiscal year 2014. The decline in parking lot
concession revenue is due to reduction in operator costs of $400,000 under the current parking lot management
agreement and declining trends in passenger traffic. Terminal rental amounts are based on carriers and space
occupied at the beginning of the fiscal year. Revenue fluctuates as carriers move in and out of the Tallahassee
market, as the carrier mix (signatory or non-signatory) changes, and as terminal rates are adjusted annually.
Fiscal years 2010 through 2014 are anticipated to improve as the Aviation Department is working diligently with
air service providers to expand services in TLH market, and access additional hubs.
Fund Revenues
Fund Pro FormasFiscal Year 2010
F-48
Page 49
City of Tallahassee
Fiscal Year 2010 Approved Budget - Fund Proforma Summary
540 Airport Operating Fund
Capital Projects Operating Budget Impacts
There is no operating impact within the current five-year capital improvement plan and future impacts will be built
into the five-year plan as applicable.
Fund Pro FormasFiscal Year 2010
F-49
Page 50
City of Tallahassee
Fiscal Year 2010 Approved Budget - Fund Proforma Account Summary
540 Airport Operating Fund
BudgetBudget Budget Budget Budget
FY 2010 FY 2011 FY 2012 FY 2014
Actual Estimate
FY 2009FY 2008
Expenditures Adopted
FY 2009 FY 2013
3,036,972 3,068,159 3,048,535 3,088,046 3,149,705 3,244,052 3,341,222Salaries 3,081,011
-143,806 -168,000 -170,025 -170,025 -170,025 -170,025 -170,025Capitalized Wages -123,825
0 0 39,511 61,656 94,341 97,172 100,086Salary Enhancements 108,436
119,312 139,371 157,871 157,871 157,871 157,871 157,871Temporary Wages 170,371
173,301 165,863 180,797 180,797 180,797 180,797 180,797Overtime 198,628
-802 0 0 0 0 0 0Capitalized Overtime 0
34,007 32,046 30,348 30,348 30,348 30,348 30,348Other Salary Items 33,288
329,958 317,745 317,519 454,816 468,311 482,223 496,537Pension- Current 331,440
176,398 163,252 166,039 169,338 174,381 179,575 184,929Pension- MAP 166,227
39,751 36,124 32,579 33,229 34,218 35,236 36,293Mandatory Medicare 34,352
348,979 330,574 349,008 366,474 384,778 404,008 424,212Health Benefits 342,985
64,736 172,910 178,077 183,411 188,906 194,565 194,565Health Benefits-Retirees 172,910
106,711 105,856 107,304 107,304 107,304 107,304 107,304Flex Benefits 108,972
0 0 -30,484 -30,880 -31,497 -32,440 -33,412Vacancy factor of 1.0% -75,652
0 0 -3,938 0 0 0 0Furlough savings 0
4,403,141 4,632,385 4,769,438 4,910,686 5,050,727 4,285,517 4,363,900Personnel Services 4,549,143
2,890 17,894 17,394 17,394 17,394 17,394 17,394Advertising 17,394
3,845 7,100 12,100 12,100 12,100 12,100 12,100Cleaning & Laundry 12,100
1,646 7,130 8,130 8,130 8,130 8,130 8,130Reproduction 8,130
305,356 247,377 269,627 269,627 269,627 269,627 269,627Unclassified Professional Svcs 369,627
2,271 0 0 0 0 0 0System Planning Services 0
89,397 76,000 93,000 93,000 93,000 93,000 93,000Building Repairs 93,000
164,087 207,684 238,411 238,411 238,411 238,411 238,411Equipment Repairs 238,411
348 0 0 0 0 0 0Educational Services 0
4,485 0 25,000 25,000 25,000 25,000 25,000Legal Services 25,000
7,875 2,500 500 500 500 500 500Construction Services 500
392,584 338,894 454,500 454,500 454,500 454,500 454,500Unclassified Contract Svcs 454,500
3,153 139 0 0 0 0 0Computer Software 0
18,313 10,225 8,320 8,320 8,320 8,320 8,320Telephone 8,320
4,433 0 700 700 700 700 700Chem-Med-Lab 700
5,652 6,579 6,290 6,290 6,290 6,290 6,290Food 6,290
2,979 5,000 27,407 27,407 27,407 27,407 27,407Gasoline 27,407
60 2,000 3,259 3,259 3,259 3,259 3,259Oil & Lubricants 3,259
1,690 3,944 4,744 4,744 4,744 4,744 4,744Postage 4,744
26,617 21,450 21,352 21,352 21,352 21,352 21,352Office Supplies 21,352
23,844 20,498 18,498 18,498 18,498 18,498 18,498Uniforms & Clothing 18,498
168,368 120,522 134,119 134,119 134,119 134,119 134,119Unclassified Supplies 134,119
914 0 0 0 0 0 0Non-Capitalized Furniture 0
8,968 0 0 0 0 0 0Vehicle- Non-Garage 0
120,377 70,000 70,000 70,000 70,000 70,000 70,000Building Supplies 70,000
654 1,000 2,000 2,000 2,000 2,000 2,000Safety Materials & Supplies 2,000
20,206 17,597 15,402 15,402 15,402 15,402 15,402Travel & Training 15,797
617 3,250 3,655 3,655 3,655 3,655 3,655Journals & Books 3,660
26,578 27,570 27,920 27,920 27,920 27,920 27,920Memberships 27,920
1,721 8,200 10,336 10,336 10,336 10,336 10,336Certificates & Licenses 10,336
9,306 10,500 16,188 16,188 16,188 16,188 16,188Rent Expense- Machines 16,188
3,040 0 0 0 0 0 0Unclassified Charges 0
1,488,852 1,488,852 1,488,852 1,488,852 1,488,852 1,422,275 1,233,053Operating 1,589,252
30,000 30,000 30,000 30,000 30,000 30,000 30,000Bad Debt Expense 30,000
30,000 30,000 30,000 30,000 30,000 30,000 30,000Other Services & Charges 30,000
76,704 80,508 72,057 72,057 74,220 76,446 78,741Human Resource Expense 80,508
90,809 88,088 103,712 103,712 106,824 110,028 113,328Accounting Expense 88,088
86,008 57,970 52,769 52,769 54,352 55,983 57,662Purchasing Expense 57,970
397,409 435,321 360,246 360,246 371,053 382,185 393,651Information Systems Expense 435,321
286,833 462,362 412,719 412,719 425,101 437,854 450,989Risk Management Expense 462,362
25,425 25,032 20,539 20,539 21,566 21,566 22,593Radio Communications Expense 25,032
33,296 40,354 36,773 36,773 37,876 39,012 40,183Revenue Collection Expense 40,354
198,347 121,388 71,853 71,853 74,009 76,229 78,516Vehicle Garage Expense 124,291
0 58,848 27,068 27,068 27,880 28,716 29,578Vehicle Fuel 95,457
18,847 23,874 27,383 34,289 34,289 34,289 34,289Vehicle Replacement 24,162
375,606 340,980 351,209 361,745 372,597 383,775 383,775Indirect Costs 340,980
1,536,328 1,553,770 1,599,767 1,646,083 1,683,304 1,589,285 1,734,725Allocated Accounts 1,774,525
Fund Pro FormasFiscal Year 2010
F-50
Page 51
City of Tallahassee
Fiscal Year 2010 Approved Budget - Fund Proforma Account Summary
540 Airport Operating Fund
BudgetBudget Budget Budget Budget
FY 2010 FY 2011 FY 2012 FY 2014
Actual Estimate
FY 2009FY 2008
Expenditures Adopted
FY 2009 FY 2013
32,530 38,704 39,439 40,208 40,208 40,208 40,208Utilities - Sewer 38,704
33,404 45,500 45,500 45,500 45,500 45,500 45,500Utilities - Sanitation 45,500
253,351 380,442 398,247 416,049 416,049 416,049 416,049Utilities - Stormwater 380,442
47,714 69,000 69,000 69,000 69,000 69,000 69,000Utilities - Gas 69,000
23,765 32,000 44,992 45,869 45,869 45,869 45,869Utilities - Water 44,153
653,832 727,473 659,437 672,296 686,212 701,240 701,240Utilities - Electric 647,141
5,764 5,764 8,034 8,034 8,034 8,034 8,034Utilities - Fire Services 7,508
1,264,649 1,296,956 1,310,872 1,325,900 1,325,900 1,050,361 1,298,883Utilities and Other Expenses 1,232,448
1,300,721 1,296,756 1,295,672 1,296,773 1,302,595 1,307,190 345,194Debt Service Transfer 1,296,756
47,104 0 0 0 0 0 0Reserve Transfer 0
1,295,672 1,296,773 1,302,595 1,307,190 345,194 1,347,825 1,296,756Transfers 1,296,756
892,513 919,434 897,541 965,349 991,760 1,019,133 1,046,995Contribution to Fire Services 919,434
897,541 965,349 991,760 1,019,133 1,046,995 892,513 919,434Contributions to Operations 919,434
1,142,274 482,576 577,063 498,930 480,153 396,795 723,831Transfer to RR&I 652,322
1,171,690 723,864 865,597 748,395 720,228 595,193 1,085,745Transfer to Airline Prepd Crd 952,940
1,442,660 1,247,325 1,200,381 991,988 1,809,576 2,313,964 1,206,440Year End Adjustments 1,605,262
Fund Pro FormasFiscal Year 2010
F-51
Page 52
City of Tallahassee
Fiscal Year 2010 Approved Budget - Fund Proforma Account Summary
540 Airport Operating Fund
BudgetBudget Budget Budget Budget
FY 2010 FY 2011 FY 2012 FY 2014
Actual Estimate
FY 2009FY 2008
Revenues Adopted
FY 2009 FY 2013
1,108,198 910,881 1,166,560 1,156,260 1,166,156 1,171,047 1,191,436Scheduled Landing Fees 1,117,570
152,084 150,785 138,786 139,024 139,270 139,523 139,783Non-Scheduled Landing Fees 160,000
0 15,000 23,600 23,600 23,600 23,600 23,600Airport Applic/Permit Fee 15,000
102,542 80,204 86,636 86,636 86,636 86,636 86,636Apron Fees 100,354
111,080 85,520 80,118 80,118 80,118 80,118 80,118Tenant Equipment Charges 104,660
1,695,076 1,715,224 1,729,601 1,729,601 1,729,601 1,729,601 1,729,601Rental Car Concessions 1,772,754
120,204 120,631 117,000 117,000 117,000 117,000 117,000Restaurant Concessions 130,000
0 15,000 14,450 14,450 14,450 14,450 14,450Ground Transportation 15,000
6,617 5,285 4,900 4,900 4,900 4,900 4,900Video Game Room 10,500
63,758 21,000 17,622 17,622 17,622 17,622 17,622Badging (Security ID) 21,250
2,850,388 2,400,000 2,400,000 2,400,000 2,400,000 2,400,000 2,400,000Parking Lot Concessions 3,000,000
39,159 26,000 35,525 36,591 37,688 38,819 39,984Advertising Concessions 42,300
53,976 40,540 22,070 24,434 24,434 24,434 24,434Gift Shop 60,000
175,924 156,495 154,000 154,000 154,000 154,000 154,000Off-Airport Car Rental 154,000
1,324,820 1,348,480 1,306,647 1,416,157 1,459,915 1,880,686 1,923,732Passenger Security Charge 1,194,511
11,133 6,580 6,358 6,358 6,358 6,358 6,358Parking Tickets 12,500
6,480 16,570 3,145 3,145 3,145 3,145 3,145MBE Concessions 23,250
302 48 196 196 196 196 196Telephone Receipts 0
258,395 200,000 300,000 300,000 300,000 300,000 300,000Fixed Base Operator Concessi 300,000
408,216 408,216 408,216 408,216 408,216 0 0TSA Security 408,216
8,011 5,180 2,693 2,693 2,693 2,693 2,693ATM Concession 8,000
38,640 38,640 39,509 46,288 48,451 49,541 49,904T-Hangar Rental 38,640
75,654 98,526 98,526 101,482 101,482 101,482 104,527Old Terminal Rental 98,526
313,000 313,000 313,000 313,000 313,000 313,000 313,000FAA Building 313,000
68,922 55,951 50,327 50,327 51,094 51,094 51,094New Cargo Building 70,433
1,958,176 1,877,316 2,296,053 2,237,646 2,294,225 2,318,792 2,420,343New Terminal Rental 2,021,877
183,327 183,327 191,792 197,545 203,472 209,576 215,863FAA Weather Bureau 174,704
24,187 0 0 0 0 0 0Old Cargo Building Rental 0
191,416 181,670 207,046 207,798 208,550 211,731 212,288Terminal Rental - Other 191,385
338,299 349,191 387,067 409,893 538,956 541,474 546,963Land Lease Commercial 363,213
5,935 4,000 0 0 0 0 0Other Miscellaneous Revenue 4,200
0 0 53,400 53,400 53,400 53,400 53,400Parking Lot Proceeds 0
1,017,984 1,149,854 600,000 669,030 601,037 570,914 449,478Prepaid Fee Credit Contrib 1,002,760
12,254,843 12,407,410 12,589,665 12,615,832 12,676,548 12,711,903 11,979,114Charges for Services 12,928,603
137,974 104,077 104,000 104,000 104,000 104,000 104,000Interest 68,217
140 0 0 0 0 0 0Sale of Surplus 0
33 0 0 0 0 0 0Other Miscellaneous Revenue 0
81,691 0 0 0 0 0 0Trans from Fund Bal - Encumb 0
104,000 104,000 104,000 104,000 104,000 219,837 104,077Other Revenues 68,217
12,358,843
12,358,843Fund Total ExpenditureFund Total Revenue
0Fund Balance
12,780,548 12,719,832 12,693,665 12,511,410 12,083,191 12,931,740
12,780,548 12,719,832 12,693,665 12,511,410 12,083,191 12,931,740
0 0 0 0 0 0
BudgetBudget Budget Budget BudgetActual EstimateFund Summary
12,996,820
12,996,820
0
Adopted
FY 2008 FY 2010 FY 2011 FY 2012 FY 2013 FY 2014FY 2009FY 2009
Fund Pro FormasFiscal Year 2010
F-52
Page 53
City of Tallahassee
Fiscal Year 2010 Approved Budget - Fund Proforma Summary
580 StarMetro Operating Fund
The City has operated StarMetro (formerly TalTran), a public transit system, since December 1973. The
system, which operates as an enterprise fund, provides fixed route services, special transportation under
provisions of the Americans with Disabilities Act (ADA), serves as the Community Transportation Coordinator
(CTC) for Leon County, and provides a variety of contract/charter services.
StarMetro's operating fund is balanced for all five years. The approved budget for fiscal year 2010 totals
$15,951,612 and represents an increase of $308,800 or 1.97% from the 2009 approved budget. The majority of
the increase is a direct result of increasing the temporary wages and overtime budgets to match actual
expenses. Historically, fund expenses exceed revenues and a contribution from the General Fund subsidizes
the transit system. The planned contribution from the General Fund for FY10 is $7,925,134, an increase of
$245,078 from the adopted FY09 budget. The General Fund contribution represents 49.7% of the transit
system's operating expenses.
BudgetBudget Budget Budget BudgetFY 2010 FY 2011 FY 2012 FY 2013 FY 2014
Actual EstimateFY 2009FY 2008
Expenditures
9,102,124 9,453,352 9,704,224 9,963,407 10,230,047 8,706,613 8,863,722Personnel Services
3,256,572 3,256,572 3,256,572 3,256,572 3,256,572 3,271,278 3,097,432Operating
2,000 2,000 2,000 2,000 2,000 2,000 2,000Other Services & Charges
1,912,809 1,986,386 2,036,393 2,073,000 2,109,633 2,001,125 1,877,550Allocated Accounts
1,667,336 1,715,625 1,764,048 1,814,006 1,863,670 2,468,938 1,499,463Utilities and Other Expenses
10,771 10,760 14,250 14,248 14,250 22,507 10,834Transfers
BudgetBudget Budget Budget BudgetFY 2010 FY 2011 FY 2012 FY 2013 FY 2014
Actual EstimateFY 2009FY 2008
Revenues
1,986,609 1,582,609 1,582,609 1,582,609 1,582,609 1,594,730 2,509,472Intergovernmental Revenue
6,039,869 6,095,665 6,147,599 6,190,516 6,207,140 6,069,976 6,043,591Charges for Services
0 0 0 0 0 83,514 0Other Revenues
7,925,134 8,746,421 9,047,279 9,350,108 9,686,423 8,724,241 6,797,938Other Sources
15,951,612
15,951,612
Fund Total Expenditure
Fund Total Revenue
0Fund Balance
17,476,172 17,123,233 16,777,487 16,424,695 15,351,001 16,472,461
17,476,172 17,123,233 16,777,487 16,424,695 15,351,001 16,472,461
0 0 0 0 0 0
FY 2008BudgetBudget Budget Budget Budget
FY 2010 FY 2011 FY 2012 FY 2013 FY 2014Actual Estimate
FY 2009Fund Summary
Fund Expenditures
The following are expenditure assumptions for StarMetro's fund:
Assumptions for personnel services are as follows: salaries for general employees are adjusted for a 0% merit
salary enhancement in FY10; general employee pension rates are 9.08% based on an actuarial study; matched
annuity pension plan rates are 7.15% based on an actuarial study; the health care rate is set at actual cost per
employee or at the family rate for vacant positions.
The temporary wages and overtime accounts have been increased by over $1 million in FY10 to properly budget
for the actual costs incurred over the last several years.
The unclassified contractual services amount has been increased by $200,000 to account for increases in
contractual relationships with the city's community transportation coordinators.
Allocated accounts, which primarily are driven by personnel costs, are increasing by 2.27% in FY10 and
remaining constant in FY11. Beginning in FY12, allocated accounts will increase by 3% annually. The one
exception is the vehicle replacement account, which will increase by 13% in FY10 and 23% in FY11. Bad debt
expenses remain constant based on projections provided by the Accounting Services Division. No capital
Fund Pro FormasFiscal Year 2010
F-53
Page 54
City of Tallahassee
Fiscal Year 2010 Approved Budget - Fund Proforma Summary
580 StarMetro Operating Fund
outlay funds have been budgeted over the five-year plan.
StarMetro's fuel budget has been adjusted downward to reflect the hedging contract that Energy Services
entered into to purchase 80% of StarMetro's diesel fuel through FY10.
The following are revenue assumptions over the next five years:
Approved FY10 operating revenues, excluding the General Fund contribution, are estimated at $8.0 million, or
approximately 50.3% of StarMetro revenue. StarMetro's FY10 operating revenues exceed the FY09 budgeted
revenues by $63,722 due to additional Section 5307 revenue being awarded on April 30, 2009. This Section
5307 award recognizes an additional $404,000 in the FY10 budget, which can be used for operating purposes.
The Federal Transit Administration (FTA) also awarded StarMetro an additional $808,988 in Section 5307
funding in FY09, which can be used for operating purposes as well. This is an exception granted by FTA for
Transportation Managment Areas (TMA) that exceed 200,000 in population. Normally, TMA's receive only
capital funding through the Section 5307 award.
The university contracts (Florida A & M, Florida State and Tallahassee Community College) continue to be a
consistent source of revenue, representing $2.7 million in FY10, or 33.5% of StarMetro's operating revenue. All
three contracts were presented to and approved by the City Commission in May and June of 2009.
State grant funding is based upon projections prepared by the Florida Department of Transportation (FDOT).
FDOT is planning to award StarMetro $951,809 in FY10 for operating assistance.
All other operating revenues are projected to increase by 2% over the five-year proforma.
Fund Revenues
Fund Pro FormasFiscal Year 2010
F-54
Page 55
City of Tallahassee
Fiscal Year 2010 Approved Budget - Fund Proforma Summary
580 StarMetro Operating Fund
Capital Projects Operating Budget Impacts
There is no operating impact within the current five-year capital improvement plan and future impacts will be built
into the five-year plan as applicable.
Fund Pro FormasFiscal Year 2010
F-55
Page 56
City of Tallahassee
Fiscal Year 2010 Approved Budget - Fund Proforma Account Summary
580 StarMetro Operating Fund
BudgetBudget Budget Budget Budget
FY 2010 FY 2011 FY 2012 FY 2014
Actual Estimate
FY 2009FY 2008
Expenditures Adopted
FY 2009 FY 2013
5,225,752 5,384,319 5,685,692 5,685,692 5,799,403 5,973,386 6,152,591Salaries 5,469,285
0 0 0 113,711 173,993 179,202 184,568Salary Enhancements 172,829
411,521 557,012 471,780 471,780 471,780 471,780 471,780Temporary Wages 62,349
811,718 760,107 752,779 753,367 753,367 753,367 753,367Overtime 239,341
34,150 37,209 53,104 53,104 53,104 53,104 53,104Other Salary Items 53,358
492,788 497,424 520,025 703,805 724,775 746,364 768,604Pension- Current 514,068
460,595 442,906 409,493 417,625 430,059 442,875 456,054Pension- MAP 404,823
85,148 88,722 68,442 69,813 71,891 74,016 76,218Mandatory Medicare 69,120
735,339 732,226 767,668 806,093 846,350 888,636 933,084Health Benefits 844,221
120,597 38,812 36,899 38,006 39,146 40,321 40,321Health Benefits-Retirees 35,826
329,006 324,985 340,356 340,356 340,356 340,356 340,356Flex Benefits 342,792
0 0 -4,114 0 0 0 0Furlough savings 0
9,102,124 9,453,352 9,704,224 9,963,407 10,230,047 8,706,613 8,863,722Personnel Services 8,208,012
42,702 10,483 32,000 32,000 32,000 32,000 32,000Advertising 32,000
36,261 42,453 33,834 33,834 33,834 33,834 33,834Cleaning & Laundry 33,834
89,387 81,624 207,939 207,939 207,939 207,939 207,939Reproduction 207,939
57,801 33,237 4,000 4,000 4,000 4,000 4,000Unclassified Professional Svcs 14,000
38,291 22,935 25,000 25,000 25,000 25,000 25,000Building Repairs 25,000
9,055 10,350 8,125 8,125 8,125 8,125 8,125Equipment Repairs 8,125
6,143 4,569 5,000 5,000 5,000 5,000 5,000Construction Services 5,000
2,053,698 1,917,561 2,035,375 2,035,375 2,035,375 2,035,375 2,035,375Unclassified Contract Svcs 1,999,053
4,644 9,603 0 0 0 0 0Computer Software 0
9,800 24,126 15,000 15,000 15,000 15,000 15,000Environmental Contractual 15,000
12,868 10,702 11,736 11,736 11,736 11,736 11,736Telephone 11,736
0 35,000 0 0 0 0 0Chem-Med-Lab 0
4,989 5,624 2,000 2,000 2,000 2,000 2,000Food 2,000
404 951 0 0 0 0 0Gasoline 0
103,812 78,226 55,000 55,000 55,000 55,000 55,000Oil & Lubricants 55,000
3,458 443 4,200 4,200 4,200 4,200 4,200Postage 4,200
14,726 9,859 15,000 15,000 15,000 15,000 15,000Office Supplies 15,000
32,146 95,241 41,700 41,700 41,700 41,700 41,700Uniforms & Clothing 41,700
93,326 67,520 74,200 74,200 74,200 74,200 74,200Unclassified Supplies 72,000
14,054 2,419 0 0 0 0 0Non-Capitalized Furniture 0
543,430 554,910 590,466 590,466 590,466 590,466 590,466Vehicle- Non-Garage 590,466
30,572 28,086 30,000 30,000 30,000 30,000 30,000Building Supplies 30,000
21 0 0 0 0 0 0Safety Materials & Supplies 0
20,290 17,322 22,097 22,097 22,097 22,097 22,097Travel & Training 22,664
845 312 300 300 300 300 300Journals & Books 300
27,607 19,444 29,500 29,500 29,500 29,500 29,500Memberships 20,000
267 0 0 0 0 0 0Certificates & Licenses 0
1,608 1,206 1,400 1,400 1,400 1,400 1,400Rent Expense- Bldg & Ops 1,400
13,063 11,802 11,700 11,700 11,700 11,700 11,700Rent Expense- Machines 11,700
6,012 1,424 1,000 1,000 1,000 1,000 1,000Unclassified Charges 1,200
3,256,572 3,256,572 3,256,572 3,256,572 3,256,572 3,271,278 3,097,432Operating 3,219,317
2,000 2,000 2,000 2,000 2,000 2,000 2,000Bad Debt Expense 2,000
2,000 2,000 2,000 2,000 2,000 2,000 2,000Other Services & Charges 2,000
192,970 207,231 194,636 194,636 200,475 206,489 212,684Human Resource Expense 207,230
94,666 83,928 103,050 103,050 106,142 109,326 112,606Accounting Expense 83,929
46,344 74,640 46,025 46,025 47,406 48,828 50,293Purchasing Expense 74,640
458,957 499,509 434,644 434,644 447,683 461,114 474,947Information Systems Expense 499,508
556,184 216,342 312,501 312,501 321,876 331,532 341,478Risk Management Expense 216,342
52,666 55,428 45,480 45,480 46,490 48,512 49,521Radio Communications Expense 55,429
22,304 28,326 27,787 27,787 28,621 29,479 30,364Revenue Collection Expense 28,326
8,136 7,926 637 637 656 676 696Vehicle Garage Expense 1,760
171,436 219,780 249,076 307,684 307,684 307,684 307,684Vehicle Replacement 219,780
397,462 484,440 498,973 513,942 529,360 529,360 529,360Indirect Costs 484,440
1,912,809 1,986,386 2,036,393 2,073,000 2,109,633 2,001,125 1,877,550Allocated Accounts 1,871,384
Fund Pro FormasFiscal Year 2010
F-56
Page 57
City of Tallahassee
Fiscal Year 2010 Approved Budget - Fund Proforma Account Summary
580 StarMetro Operating Fund
BudgetBudget Budget Budget Budget
FY 2010 FY 2011 FY 2012 FY 2014
Actual Estimate
FY 2009FY 2008
Expenditures Adopted
FY 2009 FY 2013
16,259 16,014 11,191 11,409 11,409 11,409 11,409Utilities - Sewer 10,983
8,174 11,998 7,432 7,432 7,432 7,432 7,432Utilities - Sanitation 7,432
18,689 18,258 23,693 24,692 24,692 24,692 24,692Utilities - Stormwater 22,679
14,500 30,084 26,052 26,052 26,052 26,052 26,052Utilities - Gas 26,052
6,111 5,044 6,806 6,940 6,940 6,940 6,940Utilities - Water 6,680
86,943 84,477 76,333 77,821 79,431 81,171 81,171Utilities - Electric 74,910
819 660 829 829 829 829 829Utilities - Fire Services 829
2,317,444 1,332,928 1,515,000 1,560,450 1,607,263 1,655,481 1,705,145Gasoline -StarMetro 2,181,700
1,667,336 1,715,625 1,764,048 1,814,006 1,863,670 2,468,938 1,499,463Utilities and Other Expenses 2,331,265
10,837 10,834 10,771 10,760 14,250 14,248 14,250Debt Service Transfer 10,834
11,670 0 0 0 0 0 0Inter-Fund Transfer 0
10,771 10,760 14,250 14,248 14,250 22,507 10,834Transfers 10,834
BudgetBudget Budget Budget Budget
FY 2010 FY 2011 FY 2012 FY 2014
Actual Estimate
FY 2009FY 2008
Revenues Adopted
FY 2009 FY 2013
500,800 1,309,788 904,800 500,800 500,800 500,800 500,800Federal Transit Adm- Operatn 500,800
130,000 130,000 130,000 130,000 130,000 130,000 130,000Federal Transit Adm- Planning 130,000
963,930 1,069,684 951,809 951,809 951,809 951,809 951,809FDOT Operating Assistance 1,069,684
1,986,609 1,582,609 1,582,609 1,582,609 1,582,609 1,594,730 2,509,472Intergovernmental Revenue 1,700,484
330 0 0 0 0 0 0Surcharge- Outside Leon Co 0
132,483 127,286 137,515 141,641 145,980 150,267 150,267Seven Day Unlimited Pass 133,510
77,320 76,125 87,519 91,020 94,659 94,659 94,659Dial A Ride 84,153
1,812,036 1,738,711 1,595,848 1,595,848 1,595,848 1,595,848 1,595,848CTC Revenue 1,738,711
14,993 6,300 35,000 35,000 35,000 35,000 35,000Charter Service Revenue 35,000
148,794 136,466 169,475 174,559 179,796 185,190 185,190Monthly Pass Revenue 164,539
78,122 0 0 0 0 0 0FSU Fare Free Contract 0
237,209 184,563 0 0 0 0 0FAMU Fare Free Contract 100,000
1,788,989 2,038,434 2,027,378 2,027,378 2,027,378 2,027,378 2,027,378FSU Contract 2,109,344
423,270 360,989 507,085 522,298 537,966 554,105 570,729FAMU Contract 456,104
40,386 34,000 44,000 44,000 44,000 44,000 44,000Spirit Express Special Cash 44,000
765,391 779,566 808,345 824,855 841,520 858,617 858,617Regular Fare Cash 792,330
160,275 147,979 133,586 133,586 133,586 133,586 133,586Fuel Tax Rebate 133,586
2,159 2,000 1,000 1,000 1,000 1,000 1,000Special Wheels Passes 1,000
74,788 81,771 117,259 120,776 124,399 124,399 124,399One Day Unlimited Pass 114,958
33,529 29,031 33,178 33,178 33,178 33,178 33,178Seven Day Reduced Unlimited 33,178
8,456 6,530 0 0 0 0 0Reduced Fare Cash 0
43,060 74,229 66,420 69,077 71,840 71,840 71,840Ten Ride Dial A Ride Card 65,118
66,442 44,760 103,763 108,951 108,951 108,951 108,951Bus Advertising Revenue 98,822
132,398 137,919 152,498 152,498 152,498 152,498 152,498TCC Fare Free Zone 137,919
19,372 28,318 15,000 15,000 15,000 15,000 15,000Other Miscellaneous Revenue 15,000
10,178 8,614 5,000 5,000 5,000 5,000 5,000Parking Lot Proceeds 5,000
6,039,869 6,095,665 6,147,599 6,190,516 6,207,140 6,069,976 6,043,591Charges for Services 6,262,272
44 0 0 0 0 0 0Other Miscellaneous Revenue 0
83,470 0 0 0 0 0 0Trans from Fund Bal - Encumb 0
0 0 0 0 0 83,514 0Other Revenues 0
8,724,241 6,797,938 7,925,134 8,746,421 9,047,279 9,350,108 9,686,423Contribution From General Fund 7,680,056
7,925,134 8,746,421 9,047,279 9,350,108 9,686,423 8,724,241 6,797,938Other Sources 7,680,056
15,951,612
15,951,612Fund Total ExpenditureFund Total Revenue
0Fund Balance
17,476,172 17,123,233 16,777,487 16,424,695 15,351,001 16,472,461
17,476,172 17,123,233 16,777,487 16,424,695 15,351,001 16,472,461
0 0 0 0 0 0
BudgetBudget Budget Budget BudgetActual EstimateFund Summary
15,642,812
15,642,812
0
Adopted
FY 2008 FY 2010 FY 2011 FY 2012 FY 2013 FY 2014FY 2009FY 2009
Fund Pro FormasFiscal Year 2010
F-57
Page 58
City of Tallahassee
Fiscal Year 2010 Approved Budget - Fund Proforma Summary
600 Solid Waste Fund
The city provides solid waste collection and disposal for more than 62,525 residential customers, 15,863
commercial customers, and 330 commercial recycling accounts. City resources are used to collect garbage,
trash and recyclables from approximately half of the residential customers while the remaining customers
receive garbage and trash service from a private contractor hired by the city.
Currently, the City is under a seven-year contract, ending in 2011, with Waste Pro of Florida, Inc. to provide
residential solid waste services in the contracted area of the city.
The Solid Waste Fund is operated on a full cost recovery basis. All operational costs and associated revenues
are accounted for within the fund. Any year-end surplus realized by the fund is transferred to the rate
stabilization reserve and may be appropriated in future years to defray operating cost increases.
BudgetBudget Budget Budget BudgetFY 2010 FY 2011 FY 2012 FY 2013 FY 2014
Actual EstimateFY 2009FY 2008
Expenditures
5,218,417 5,430,863 5,583,857 5,741,743 5,898,719 4,895,668 5,147,143Personnel Services
5,293,135 5,386,510 5,591,753 5,729,876 5,730,361 4,918,441 4,994,670Operating
145,000 145,000 145,000 145,000 145,000 145,000 145,000Other Services & Charges
74,885 74,885 74,885 74,885 74,885 110,137 163,927Capital Outlay
4,338,626 4,458,921 4,570,415 4,685,217 4,802,878 4,460,660 4,623,080Allocated Accounts
6,332,353 6,470,912 6,613,002 6,759,388 6,909,398 5,512,076 6,421,543Utilities and Other Expenses
0 0 0 0 0 0 12,000Transfers
164,674 176,084 184,761 191,527 191,527 138,641 151,472Contributions to Operations
339,523 0 0 0 0 657,471 547,709Year End Adjustments
BudgetBudget Budget Budget BudgetFY 2010 FY 2011 FY 2012 FY 2013 FY 2014
Actual EstimateFY 2009FY 2008
Revenues
21,840,955 22,059,334 22,279,975 22,502,817 22,727,888 19,738,141 21,462,828Charges for Services
65,658 66,314 66,977 67,648 68,324 765,295 741,629Other Revenues
0 17,527 416,721 757,171 956,556 334,658 0Other Sources
0 0 0 0 0 0 2,087Internal Service Fund Charges
21,906,613
21,906,613
Fund Total Expenditure
Fund Total Revenue
0Fund Balance
23,752,768 23,327,636 22,763,673 22,143,175 22,206,544 20,838,094
23,752,768 23,327,636 22,763,673 22,143,175 22,206,544 20,838,094
0 0 0 0 0 0
FY 2008BudgetBudget Budget Budget Budget
FY 2010 FY 2011 FY 2012 FY 2013 FY 2014Actual Estimate
FY 2009Fund Summary
Fund Expenditures
The following service level changes were approved as proposed for the Solid Waste Department's fiscal year
2010 budget.
A total of six positions, currently vacant, are proposed for elimination from the department. Fiscal Impact:
($245,856.) Two Mechanic positions have also been transferred to the Fleet department.
The future liability for other post employee benefits (retiree health care) is budgeted according to an actuarial
study estimating the current expense and future benefit needs.
The contribution to the general fund is set in accordance with the city’s financing policy. This requires solid
waste to transfer ¾ of 1% (.0075) of the prior three-year average of gross revenues.
Salary enhancements for general government employees were approved at 0%. Adjustments to personnel
expenses included cost sharing of the increase in health care premiums between the city and employees,
Fund Pro FormasFiscal Year 2010
F-58
Page 59
City of Tallahassee
Fiscal Year 2010 Approved Budget - Fund Proforma Summary
600 Solid Waste Fund
salary updates, position changes, and intradepartmental transfers. A lay-off compensation package provides up
to six weeks of salary benefits and payment of three months health insurance for employees whose positions
will be eliminated.
A one day furlough for employees making $50,000 is included. Fiscal Impact: $11,171.
A reduction of 2.5% was made to the travel and training budget. Fiscal Impact: ($150).
A reduction of $18,000 in the citywide training budget, resulted in a reduction to the Human Resources
allocation. Fiscal Impact: ($513).
See the City Commission action section additional changes to the FY10 approved budget.
Projections of future revenue increases during fiscal years 2010 through 2014 assume continued residential and
commercial customer growth. The Solid Waste Fund reflects revenue increases beginning in fiscal year 2009
and continuing through the out years. This increase will be generated by a 16% rate increase for commercial
customers, along with an increase in residential garbage fees for additional container usage. For the out years,
an annual consumer price index (CPI) adjustment to offset CPI increases in landfill tipping fees and contractual
fees paid to Waste Pro is applied. The commercial rates will continue be analyzed to determine what
adjustments, if any, are appropriate for future years based on the costs to provide services. Preliminary data
from comparable local providers show that the city’s commercial rates have not kept pace with current market
rates.
Fund Revenues
Fund Pro FormasFiscal Year 2010
F-59
Page 60
City of Tallahassee
Fiscal Year 2010 Approved Budget - Fund Proforma Summary
600 Solid Waste Fund
Capital Projects Operating Budget Impacts
There are no operating impacts within the current five-year capital improvement plan resulting from capital
projects. Any future impacts will be built into the five-year plan as applicable.
Fund Pro FormasFiscal Year 2010
F-60
Page 61
City of Tallahassee
Fiscal Year 2010 Approved Budget - Fund Proforma Account Summary
600 Solid Waste Fund
BudgetBudget Budget Budget Budget
FY 2010 FY 2011 FY 2012 FY 2014
Actual Estimate
FY 2009FY 2008
Expenditures Adopted
FY 2009 FY 2013
3,024,790 3,279,261 3,148,028 3,148,327 3,211,091 3,307,116 3,406,013Salaries 3,294,456
0 0 68,950 131,714 164,980 167,853 170,825Salary Enhancements 172,753
73,389 37,913 37,730 37,730 37,730 37,730 37,730Temporary Wages 45,998
436,281 289,079 348,876 348,908 348,941 348,975 349,010Overtime 271,639
10,980 11,438 11,421 11,421 11,421 11,421 11,421Other Salary Items 12,045
284,194 300,327 315,299 422,253 434,497 447,107 460,101Pension- Current 321,327
265,525 269,503 286,028 290,771 298,036 305,517 313,232Pension- MAP 290,843
36,798 36,444 37,350 38,022 39,039 40,079 41,163Mandatory Medicare 38,430
510,277 544,423 619,883 649,504 680,549 713,167 747,435Health Benefits 587,471
72,608 192,386 198,048 203,876 209,862 216,028 216,028Health Benefits-Retirees 192,389
180,827 186,369 179,820 179,820 179,820 179,820 179,820Flex Benefits 197,832
0 0 -31,480 -31,483 -32,109 -33,070 -34,059Vacancy factor of 1.0% -98,832
0 0 -1,536 0 0 0 0Furlough savings 0
5,218,417 5,430,863 5,583,857 5,741,743 5,898,719 4,895,668 5,147,143Personnel Services 5,326,351
53,262 105,940 115,999 62,273 116,000 116,000 116,000Advertising 115,940
17,669 22,245 18,381 18,543 18,710 18,882 19,059Cleaning & Laundry 22,245
184 800 800 800 800 800 800Reproduction 800
5,081 20,000 20,000 20,000 20,000 20,000 20,000Building Repairs 20,000
19,469 22,420 22,420 22,420 22,420 22,420 22,420Equipment Repairs 22,420
4,716,343 4,706,824 4,981,560 5,128,218 5,279,276 5,416,928 5,416,928Unclassified Contract Svcs 4,806,824
0 0 1,000 1,000 1,000 1,000 1,000Environmental Contractual 1,000
8,698 6,600 6,600 6,600 6,600 6,600 6,600Telephone 6,600
7,570 6,280 6,780 6,893 7,010 7,130 7,254Chem-Med-Lab 6,280
238 0 0 0 0 0 0Food 0
16,161 14,339 14,339 14,339 14,339 14,339 14,339Office Supplies 14,339
13,187 23,021 18,678 18,846 19,020 19,199 19,383Uniforms & Clothing 23,021
39,196 35,900 57,179 57,179 57,179 57,179 57,179Unclassified Supplies 74,150
5,125 6,000 5,850 5,850 5,850 5,850 5,850Travel & Training 6,000
2,459 1,588 1,588 1,588 1,588 1,588 1,588Journals & Books 1,588
1,027 1,461 1,461 1,461 1,461 1,461 1,461Memberships 1,461
10,572 11,252 10,500 10,500 10,500 10,500 10,500Rent Expense- Machines 11,252
2,200 10,000 10,000 10,000 10,000 10,000 10,000Unclassified Charges 10,000
5,293,135 5,386,510 5,591,753 5,729,876 5,730,361 4,918,441 4,994,670Operating 5,143,920
145,000 145,000 145,000 145,000 145,000 145,000 145,000Bad Debt Expense 145,000
145,000 145,000 145,000 145,000 145,000 145,000 145,000Other Services & Charges 145,000
110,137 163,927 74,885 74,885 74,885 74,885 74,885Unclassified Equipment 163,927
74,885 74,885 74,885 74,885 74,885 110,137 163,927Capital Outlay 163,927
119,758 122,505 102,703 102,703 105,784 108,956 112,226Human Resource Expense 122,505
66,475 117,741 69,869 69,869 71,967 74,124 76,350Accounting Expense 117,741
27,627 19,797 15,301 15,301 15,760 16,233 16,720Purchasing Expense 19,797
171,285 273,920 173,060 173,060 178,252 183,599 189,107Information Systems Expense 273,920
372,447 183,210 208,300 208,300 214,549 220,985 227,615Risk Management Expense 183,210
35,595 35,045 28,755 28,755 29,782 30,809 31,835Radio Communications Expense 35,045
49,645 54,526 54,006 54,006 55,626 57,295 59,014Revenue Collection Expense 54,526
892,525 823,359 823,892 823,892 848,609 874,067 900,289Utility Services Expense 823,359
0 107,065 127,144 127,144 130,958 134,887 138,934Environmental 107,065
12,125 13,400 13,762 13,762 14,048 14,342 14,645Energy Services 13,400
1,950,851 1,474,229 1,473,037 1,473,037 1,517,228 1,562,745 1,609,627Vehicle Garage Expense 1,474,229
0 522,950 607,733 607,733 625,965 644,744 664,086Vehicle Fuel 1,045,938
405,050 490,762 244,956 353,368 353,368 353,368 353,368Vehicle Replacement 490,762
357,276 384,571 396,108 407,991 408,519 409,062 409,062Indirect Costs 384,571
4,338,626 4,458,921 4,570,415 4,685,217 4,802,878 4,460,660 4,623,080Allocated Accounts 5,146,068
4,195 10,380 10,577 10,783 10,783 10,783 10,783Utilities - Sewer 10,380
5,462,859 6,363,746 6,273,333 6,410,614 6,552,013 6,697,654 6,847,664Utilities - Sanitation 6,366,429
6,988 7,715 8,060 8,420 8,420 8,420 8,420Utilities - Stormwater 7,715
4,653 3,000 3,000 3,000 3,000 3,000 3,000Utilities - Gas 3,000
1,127 3,729 3,800 3,874 3,874 3,874 3,874Utilities - Water 3,729
31,632 32,109 32,719 33,357 34,048 34,793 34,793Utilities - Electric 32,109
623 864 864 864 864 864 864Utilities - Fire Services 864
6,332,353 6,470,912 6,613,002 6,759,388 6,909,398 5,512,076 6,421,543Utilities and Other Expenses 6,424,226
Fund Pro FormasFiscal Year 2010
F-61
Page 62
City of Tallahassee
Fiscal Year 2010 Approved Budget - Fund Proforma Account Summary
600 Solid Waste Fund
BudgetBudget Budget Budget Budget
FY 2010 FY 2011 FY 2012 FY 2014
Actual Estimate
FY 2009FY 2008
Expenditures Adopted
FY 2009 FY 2013
0 12,000 0 0 0 0 0Inter-Fund Transfer 0
0 0 0 0 0 0 12,000Transfers 0
138,641 151,472 164,674 176,084 184,761 191,527 191,527Contribution to General Fund 151,472
164,674 176,084 184,761 191,527 191,527 138,641 151,472Contributions to Operations 151,472
657,471 547,709 339,523 0 0 0 0Transfer to Rate Stabiliz 0
339,523 0 0 0 0 657,471 547,709Year End Adjustments 0
BudgetBudget Budget Budget Budget
FY 2010 FY 2011 FY 2012 FY 2014
Actual Estimate
FY 2009FY 2008
Revenues Adopted
FY 2009 FY 2013
73,391 77,375 75,799 76,557 77,323 78,096 78,877Two Day Residential Roll-Out 72,883
10,179 7,729 10,179 10,281 10,384 10,488 10,593Resid Solid Waste Misc Fees 19,452
8,541,622 8,897,458 8,991,526 9,081,441 9,172,256 9,263,978 9,356,618Residential Garbage Fees 8,877,780
107,944 94,228 121,142 122,353 123,577 124,813 126,061Comm Solid Waste Misc Fees 83,641
71,563 80,837 80,728 81,535 82,350 83,174 84,006Solid Waste Late Payment Chg 83,106
410,632 451,092 458,116 462,697 467,324 471,997 476,717Commerical Sanitation Fees-9 432,010
5,248,024 5,805,742 5,884,708 5,943,555 6,002,991 6,063,020 6,123,650Comm Garbage Fees- Forktaine 6,118,273
181,035 177,538 181,035 182,845 184,674 186,521 188,386Comm Sanitation Rearload Fee 198,596
2,593,312 2,591,913 2,793,312 2,821,245 2,849,458 2,877,952 2,906,731Comm Garbage Fees- Roll-Off 2,982,929
49,975 97,809 98,340 99,323 100,317 101,320 102,333Comm Sanitation Fees- Compac 108,032
1,327,119 2,489,746 2,569,420 2,595,114 2,621,065 2,647,276 2,673,749Comm Sanitation- Multi-Famil 2,481,960
91,585 90,152 74,170 74,955 75,749 76,550 77,359Commercial Trash Collection 166,390
132,480 71,076 132,480 133,733 135,070 136,421 137,785Comm Roll-Off Special Servic 138,824
241,650 5,133 0 0 0 0 0Recycling Fees 0
657,251 525,000 370,000 373,700 377,437 381,211 385,023Sale of Recyclables 528,129
378 0 0 0 0 0 0Other Miscellaneous Revenue 630
21,840,955 22,059,334 22,279,975 22,502,817 22,727,888 19,738,141 21,462,828Charges for Services 22,292,635
80,338 59,429 60,022 60,622 61,228 61,841 62,459Interest 95,000
5,636 699 5,636 5,692 5,749 5,807 5,865Other Miscellaneous Revenue 800
679,320 681,501 0 0 0 0 0Trans from Fund Bal - Encumb 0
65,658 66,314 66,977 67,648 68,324 765,295 741,629Other Revenues 95,800
334,658 0 0 17,527 416,721 757,171 956,556Xfer from Solid Waste Reserve 112,529
0 17,527 416,721 757,171 956,556 334,658 0Other Sources 112,529
0 2,087 0 0 0 0 0From Fleet Management Reserv 0
0 0 0 0 0 0 2,087Internal Service Fund Charges 0
21,906,613
21,906,613Fund Total ExpenditureFund Total Revenue
0Fund Balance
23,752,768 23,327,636 22,763,673 22,143,175 22,206,544 20,838,094
23,752,768 23,327,636 22,763,673 22,143,175 22,206,544 20,838,094
0 0 0 0 0 0
BudgetBudget Budget Budget BudgetActual EstimateFund Summary
22,500,964
22,500,964
0
Adopted
FY 2008 FY 2010 FY 2011 FY 2012 FY 2013 FY 2014FY 2009FY 2009
Fund Pro FormasFiscal Year 2010
F-62
Page 63
City of Tallahassee
Fiscal Year 2010 Approved Budget - Fund Proforma Summary
605 Stormwater Fund
The city operates a stormwater utility with a customer base of roughly 77,625 residential customers and 6,600
non-residential customers. Non-residential customers generate more than half of fund revenues. The fund is
comprised of three units - Management, Maintenance, and Street Sweeping, the latter two are housed in the
Public Works Department, with Management in Underground Utilities. The Management unit is responsible for a
number of activities, including administration of the stormwater utility, development of rates, construction of
utility infrastructure, and meeting federal and state environmental requirements. The Maintenance unit is located
within the Streets and Drainage maintenance division and is responsible for maintenance of stormwater drains
and city-owned stormwater ponds. The third unit is the Street Sweeping unit and is responsible for keeping all
city streets clean of trash and debris.
Stormwater service is provided on a full cost recovery basis with associated revenues and expenditures
accounted for within the Stormwater Fund. Rates are based on an equivalent residential unit (ERU), the base for
each residential unit. Commercial rates are established in multiples of the ERU, with the actual amount
dependent on the impervious area at the customer's physical location.
The City Commission approved an ordinance change on March 9, 2005 to increase the stormwater fee by $.34
per ERU for five years to implement the stormwater pollution reduction program (SPRP), beginning in fiscal year
2006. SPRP is designed to reduce pollution in stormwater runoff, with the ultimate goal of preserving the water
quality in community lakes.
In fiscal year 2007, the existing street sweeping crew was shifted from the General Fund to the Stormwater
Fund. Based on a survey conducted by the city's Streets and Drainage division, a large number of
municipalities within the State of Florida use their Stormwater Fund to fully or partially fund street sweeping
operations. This trend is directly related to the National Pollution Discharge Elimination System (NPDES)
permit program, which controls water pollution by regulating point sources that discharge pollutants. Each
program utilizes current revenues to fund operating expenditures and a combination of current revenues and
stormwater repair, replacement, and improvement funding to finance on-going major and minor capital
improvements.
BudgetBudget Budget Budget BudgetFY 2010 FY 2011 FY 2012 FY 2013 FY 2014
Actual EstimateFY 2009FY 2008
Expenditures
5,104,370 5,329,794 5,489,204 5,653,677 5,825,080 4,662,269 4,743,283Personnel Services
541,686 576,961 580,527 584,182 587,930 303,002 395,899Operating
60,000 60,000 60,000 60,000 60,000 60,000 60,000Other Services & Charges
54,110 46,110 46,110 46,110 46,110 40,183 0Capital Outlay
2,849,112 2,913,809 2,994,535 3,077,685 3,139,028 2,752,712 2,824,788Allocated Accounts
163,825 163,825 163,825 163,825 163,825 154,229 168,200Utilities and Other Expenses
340,542 349,529 369,077 378,351 387,363 2,635,896 6,505,698Transfers
463,201 467,585 472,108 472,108 472,108 135,834 458,949Contributions to Operations
6,344,816 6,014,659 5,746,886 5,564,632 5,397,817 4,216,224 737,455Year End Adjustments
BudgetBudget Budget Budget BudgetFY 2010 FY 2011 FY 2012 FY 2013 FY 2014
Actual EstimateFY 2009FY 2008
Revenues
15,921,662 15,922,272 15,922,272 16,000,570 16,079,261 14,794,689 15,894,272Charges for Services
0 0 0 0 0 165,660 0Other Revenues
15,921,662
15,921,662
Fund Total Expenditure
Fund Total Revenue
0Fund Balance
16,079,261 16,000,570 15,922,272 15,922,272 15,894,272 14,960,350
16,079,261 16,000,570 15,922,272 15,922,272 15,894,272 14,960,349
0 0 0 0 0 0
FY 2008BudgetBudget Budget Budget Budget
FY 2010 FY 2011 FY 2012 FY 2013 FY 2014Actual Estimate
FY 2009Fund Summary
Fund Pro FormasFiscal Year 2010
F-63
Page 64
City of Tallahassee
Fiscal Year 2010 Approved Budget - Fund Proforma Summary
605 Stormwater Fund
Fund Expenditures
The following service level changes were approved as proposed for the Stormwater Department's fiscal year 2010
budget.
Additional reductions of five percent in the department's funding for temporary wages and overtime were directed
by the City Commission at their January 2009 budget workshop to address projected deficits during the fiscal
year. The commission also directed that unexpended capital outlay funding in departments be eliminated.
The transfer to the General Fund to support two stormwater operating technicians located in the Growth
Management Department, increases 3.0% annually in fiscal years 2010 through 2014.
Salary enhancements for general government employees were approved at 0%. Adjustments to personnel
expenses included cost sharing of the increase in health care premiums between the city and employees,
salary updates, position changes, and intradepartmental transfers. A lay-off compensation package provides up
to six weeks of salary benefits and payment of three months health insurance for employees whose positions
will be eliminated.
A one day furlough for employees making at least $50,000 is included. Union personnel were excluded
because management and the union would have to bargain over the impact of the furlough and this did not take
place. Fiscal Impact: $14,197.
A reduction of 2.5% was made to the travel and training budget. Fiscal Impact: ($224).
A reduction of $18,000 in the citywide training budget, resulted in a reduction to the Human Resources
allocation. Fiscal Impact: ($461).
See the City Commission action section additional changes to the FY10 approved budget.
Estimated revenues in the Stormwater Fund are based on projected residential and commercial fees. On March
9, 2005, the City Commission approved a phased increase in the residential stormwater fee to fund the
Stormwater Pollution Reduction Program (SPRP). This change increases the amount that residential
customers pay by $0.34 equivalent residential unit (ERU) per month, which is roughly $4.00 per year. Tenets of
the city’s financing policy allow annual adjustments equivalent to the consumer price index (CPI) for the prior
year. Projections incorporating consumer price index adjustments are based on data provided by the Governor's
Office of Planning and Budgeting. The city has decided not to pursue the CPI increase in FY 2010.
Contract payments from the Florida Department of Transportation (FDOT) and Leon County to perform contract
work and sweep all city curbs and gutter roadways are included in fiscal year 2010.
Fund Revenues
Fund Pro FormasFiscal Year 2010
F-64
Page 65
City of Tallahassee
Fiscal Year 2010 Approved Budget - Fund Proforma Summary
605 Stormwater Fund
Capital Projects Operating Budget Impacts
There are several flood mitigation projects, which will have minor operating impacts when completed. Other
capital projects such as the Total Maximum Daily Load (TMDL) and Stormwater Pollution Reduction Program
(SPRP) will potentially have a significant impact on the operating budget in future years, but will be identified as
the individual projects near completion.
Fund Pro FormasFiscal Year 2010
F-65
Page 66
City of Tallahassee
Fiscal Year 2010 Approved Budget - Fund Proforma Account Summary
605 Stormwater Fund
BudgetBudget Budget Budget Budget
FY 2010 FY 2011 FY 2012 FY 2014
Actual Estimate
FY 2009FY 2008
Expenditures Adopted
FY 2009 FY 2013
3,498,949 3,671,267 3,676,286 3,676,286 3,749,777 3,862,212 3,978,026Salaries 3,667,405
-210,785 -469,310 -212,789 -219,045 -225,488 -232,125 -232,125Capitalized Wages -581,437
0 0 0 73,491 112,442 115,816 119,290Salary Enhancements 115,841
32,501 62,551 72,069 74,231 76,458 78,752 78,752Temporary Wages 75,862
64,178 20,504 65,420 65,420 65,420 65,420 65,420Overtime 65,610
-44,143 -11,716 -11,505 -11,505 -11,505 -11,505 -11,505Capitalized Overtime -11,505
1,560 1,520 1,560 1,560 1,560 1,560 1,560Other Salary Items 1,560
323,659 325,962 333,953 452,034 465,590 479,540 493,913Pension- Current 343,494
268,153 259,356 262,967 268,218 276,256 284,538 293,063Pension- MAP 270,489
44,252 45,771 47,223 48,164 49,611 51,098 52,624Mandatory Medicare 47,566
434,578 443,470 490,908 515,475 541,221 568,270 596,690Health Benefits 490,393
77,184 293,658 222,228 225,004 227,864 230,809 230,809Health Benefits-Retirees 219,532
172,183 100,250 183,588 183,588 183,588 183,588 183,588Flex Benefits 185,556
0 0 -23,127 -23,127 -23,590 -24,296 -25,025Vacancy factor of 1.0% -110,023
0 0 -4,411 0 0 0 0Furlough savings 0
5,104,370 5,329,794 5,489,204 5,653,677 5,825,080 4,662,269 4,743,283Personnel Services 4,780,343
825 2,873 2,873 2,945 3,019 3,094 3,171Advertising 2,873
19,303 19,084 19,084 19,084 19,084 19,084 19,084Cleaning & Laundry 19,084
439 800 800 820 841 862 884Reproduction 800
0 0 7,269 7,269 7,269 7,269 7,269Building Repairs 7,269
27,858 19,205 23,780 24,056 24,338 24,627 24,924Equipment Repairs 25,860
129,853 169,014 257,193 290,022 291,004 292,011 293,043Unclassified Contract Svcs 242,073
18,051 15,600 18,600 18,750 18,904 19,062 19,224Computer Software 17,600
0 57 0 0 0 0 0Utilities- Electric 0
21,484 8,754 15,560 15,685 15,813 15,944 16,079Telephone 8,754
0 28,153 37,537 38,475 39,437 40,423 41,434Chem-Med-Lab 37,537
149 440 440 451 462 474 486Food 440
93 0 0 0 0 0 0Postage 0
11,416 9,683 11,454 11,713 11,978 12,250 12,529Office Supplies 9,383
9,660 9,800 14,500 14,500 14,500 14,500 14,500Uniforms & Clothing 14,500
45,974 50,647 61,954 62,199 62,450 62,707 62,970Unclassified Supplies 69,244
524 0 0 0 0 0 0Non-Capitalized Furniture 0
7,643 6,723 8,617 8,827 9,042 9,263 9,489Travel & Training 8,838
627 1,500 1,613 1,651 1,689 1,728 1,768Journals & Books 1,613
2,910 4,981 4,706 4,808 4,913 5,020 5,130Memberships 4,281
0 150 1,725 1,725 1,725 1,725 1,725Certificates & Licenses 0
0 45,153 50,165 50,165 50,165 50,165 50,165Rent Expense- Bldg & Ops 45,153
6,195 3,282 3,816 3,816 3,894 3,974 4,056Rent Expense- Machines 3,132
541,686 576,961 580,527 584,182 587,930 303,002 395,899Operating 518,434
60,000 60,000 60,000 60,000 60,000 60,000 60,000Bad Debt Expense 60,000
60,000 60,000 60,000 60,000 60,000 60,000 60,000Other Services & Charges 60,000
0 0 8,000 0 0 0 0Computer Equipment 0
40,183 0 46,110 46,110 46,110 46,110 46,110Unclassified Equipment 46,110
54,110 46,110 46,110 46,110 46,110 40,183 0Capital Outlay 46,110
94,810 102,394 92,237 92,237 95,004 97,855 100,791Human Resource Expense 102,399
50,269 33,769 52,314 52,314 53,883 55,500 57,165Accounting Expense 43,767
30,120 29,042 49,553 49,553 51,040 52,571 54,148Purchasing Expense 29,044
214,313 321,556 279,139 279,139 287,513 296,139 305,023Information Systems Expense 323,555
0 75,998 102,294 102,294 105,363 108,524 111,779Risk Management Expense 76,001
5,085 5,009 0 0 0 0 0Radio Communications Expense 5,007
35,458 42,264 43,238 43,238 44,535 45,871 47,247Revenue Collection Expense 42,264
812,086 574,867 544,546 544,546 560,882 577,708 595,039Utility Services Expense 574,867
719,553 583,397 588,201 588,201 605,847 624,022 642,743Vehicle Garage Expense 583,397
0 177,557 175,840 175,840 181,115 186,549 192,145Vehicle Fuel 303,241
124,196 159,219 180,443 222,901 222,901 222,901 222,901Vehicle Replacement 159,219
666,822 719,716 741,307 763,546 786,452 810,046 810,046Indirect Costs 719,716
2,849,112 2,913,809 2,994,535 3,077,685 3,139,028 2,752,712 2,824,788Allocated Accounts 2,962,477
Fund Pro FormasFiscal Year 2010
F-66
Page 67
City of Tallahassee
Fiscal Year 2010 Approved Budget - Fund Proforma Account Summary
605 Stormwater Fund
BudgetBudget Budget Budget Budget
FY 2010 FY 2011 FY 2012 FY 2014
Actual Estimate
FY 2009FY 2008
Expenditures Adopted
FY 2009 FY 2013
5,646 3,675 930 930 930 930 930Utilities - Sewer 930
144,435 161,359 161,359 161,359 161,359 161,359 161,359Utilities - Sanitation 161,359
4,149 2,536 1,536 1,536 1,536 1,536 1,536Utilities - Water 1,536
0 630 0 0 0 0 0Utilities - Electric 0
163,825 163,825 163,825 163,825 163,825 154,229 168,200Utilities and Other Expenses 163,825
26,109 32,698 32,540 32,509 43,054 43,046 43,052Debt Service Transfer 32,698
2,609,787 6,473,000 308,002 317,020 326,023 335,305 344,311Inter-Fund Transfer 6,473,000
340,542 349,529 369,077 378,351 387,363 2,635,896 6,505,698Transfers 6,505,698
135,834 458,949 463,201 467,585 472,108 472,108 472,108Contribution to General Fund 458,949
463,201 467,585 472,108 472,108 472,108 135,834 458,949Contributions to Operations 458,949
4,216,224 737,455 6,344,816 6,014,659 5,746,886 5,564,632 5,397,817Transfer to RR&I 445,936
6,344,816 6,014,659 5,746,886 5,564,632 5,397,817 4,216,224 737,455Year End Adjustments 445,936
BudgetBudget Budget Budget Budget
FY 2010 FY 2011 FY 2012 FY 2014
Actual Estimate
FY 2009FY 2008
Revenues Adopted
FY 2009 FY 2013
6,698,864 7,198,923 7,214,641 7,214,641 7,214,641 7,250,714 7,286,968Residential Stormwater 7,198,923
7,862,945 8,434,820 8,445,153 8,445,153 8,445,153 8,487,378 8,529,815Commercial Stormwater 8,434,820
40,288 29,941 31,280 31,890 31,890 31,890 31,890Forfeited Discounts 29,941
156,879 177,906 177,906 177,906 177,906 177,906 177,906FDOT ROW Maintenance Contrac 177,906
35,714 52,682 52,682 52,682 52,682 52,682 52,682Leon County Street Sweeping 100,182
15,921,662 15,922,272 15,922,272 16,000,570 16,079,261 14,794,689 15,894,272Charges for Services 15,941,772
71,611 0 0 0 0 0 0Interest 0
70,690 0 0 0 0 0 0Trans from Fund Bal - Encumb 0
23,359 0 0 0 0 0 0Capitalized Overhead 0
0 0 0 0 0 165,660 0Other Revenues 0
15,921,662
15,921,662Fund Total ExpenditureFund Total Revenue
0Fund Balance
16,079,261 16,000,570 15,922,272 15,922,272 15,894,272 14,960,350
16,079,261 16,000,570 15,922,272 15,922,272 15,894,272 14,960,349
0 0 0 0 0 0
BudgetBudget Budget Budget BudgetActual EstimateFund Summary
15,941,772
15,941,772
0
Adopted
FY 2008 FY 2010 FY 2011 FY 2012 FY 2013 FY 2014FY 2009FY 2009
Fund Pro FormasFiscal Year 2010
F-67
Page 68
City of Tallahassee
Fiscal Year 2010 Approved Budget - Fund Proforma Summary
615 Golf Course Fund
The Tallahassee Parks, Recreation & Neighborhood Affairs Department manages the Golf Course Fund. The
fund accounts for the assets, operation, and maintenance of an 18-hole, city-owned golf course at Hilaman Park.
The City of Tallahassee also owns a smaller 9-hole course known as the Jake Gaither Golf Course. Prior to
October 1998, the Gaither Course was included in the Golf Course Fund. This course currently is treated as a
recreational program with revenues and expenses budgeted in the General Fund.
Based on the findings of a 1998 internal audit, certain aspects of Hilaman’s financial operation were modified to
allow the course to operate as a private venture rather than as a municipal enterprise. In FY99, the Golf Fund
was exempted from city allocated costs (accounting, read-bill-collect, purchasing, etc.) with the exception of
garage and indirect charges that were based on a percentage of revenues. As a result of the city’s fee study for
the FY 2006 indirect costs, the methodology formerly used to determine the indirect costs for the Golf Fund was
discontinued. Indirect costs for the Golf Fund are based on a fee study conducted in fiscal year 2006 and
include an annual three percent increase.
BudgetBudget Budget Budget BudgetFY 2010 FY 2011 FY 2012 FY 2013 FY 2014
Actual EstimateFY 2009FY 2008
Expenditures
505,406 519,029 528,307 537,881 547,773 593,155 651,659Personnel Services
165,266 171,166 174,118 185,878 195,568 157,173 199,580Operating
0 0 0 0 0 20,000 28,000Capital Outlay
58,031 59,295 60,931 62,008 63,113 107,344 40,078Allocated Accounts
224,200 230,184 237,794 243,349 251,442 206,671 203,166Utilities and Other Expenses
17,552 17,535 23,223 23,219 23,222 59,099 87,282Transfers
1,010 682 717 751 791 0 0Year End Adjustments
BudgetBudget Budget Budget BudgetFY 2010 FY 2011 FY 2012 FY 2013 FY 2014
Actual EstimateFY 2009FY 2008
Revenues
966,465 992,891 1,020,090 1,048,086 1,076,909 873,154 902,245Charges for Services
5,000 5,000 5,000 5,000 5,000 18,833 22,485Other Revenues
0 0 0 0 0 251,456 285,035Other Sources
971,465
971,465
Fund Total Expenditure
Fund Total Revenue
0Fund Balance
1,081,909 1,053,086 1,025,090 997,891 1,209,765 1,143,443
1,081,909 1,053,086 1,025,090 997,891 1,209,765 1,143,442
0 0 0 0 0 0
FY 2008BudgetBudget Budget Budget Budget
FY 2010 FY 2011 FY 2012 FY 2013 FY 2014Actual Estimate
FY 2009Fund Summary
Fund Expenditures
•Other adjustments to personnel expenses included cost sharing of the increase in health care premiums
between the city and employees, salary updates, position changes, and intradepartmental transfers. A lay-off
compensation package provides up to six weeks of salary benefits and payment of three months health
insurance for employees whose positions will be eliminated.
•A one day furlough for employees making at least $50,000 is included. Fiscal Impact: $804.
•A reduction of 2.5% was made to the travel and training budget. Fiscal Impact: ($25).
•The overall approved budget for the Golf Course Fund's expenses in FY10 total $971,465, which is $171,077
less than the FY09 adopted budget.
•Historically, capital outlay is budgeted annually at $20,000; however, no funding is budgeted for FY10
•The debt service transfer for Hilaman is currently budgeted for $17,552 in FY10.
•Adjustments made to the Golf Course Fund approved by the City Commission resulted in a reduction of
$125,069 in expenses, which included the elimination of 4 full-time employees.
•Revenue projections from fees and user charges for the Golf Course Fund for FY09 total $902,245 in
comparison to $873,154 from FY08 Actual revenue.
Fund Revenues
Fund Pro FormasFiscal Year 2010
F-68
Page 69
City of Tallahassee
Fiscal Year 2010 Approved Budget - Fund Proforma Summary
615 Golf Course Fund
•The budget for the Golf Course Fund revenues, from fees and user charges, for FY10 total $966,465 in
comparison to the adopted FY09 budget of $1,139,213. This is a decrease of $172,748 in revenue. The two
major revenue accounts for the Golf Fund are the Hilaman Green Fees and the Hilaman Golf Cart Fees.
Revenue estimates for Green Fees are $347,307 for FY09. This is a decrease of $12,701 from the FY08 Actual.
The approved revenue for the FY10 budget is $360,008, which is $60,551 less than the FY09 adopted budget.
Revenue estimates for Golf Cart Fees are $268,464 for FY09, which is $6,071 less than the FY08 Actual. The
approved revenue for the FY10 budget is $285,000. This is a decrease of $76,219 from the FY09 adopted
budget.
•Increased revenue projections approved by the City Commission to the Golf Course Fund resulted in an
additional $83,142 revenue for FY10.
•Historically, a transfer from the general fund covers any operating deficit in the Golf Course Fund. For FY09, it
is projected that approximately $285,035 will be needed from the general fund to cover the expenses. However,
the City Commission approved no additional general fund subsidy for the Golf Course Fund in FY10 and beyond.
The revenue and expenses are expected to break even in FY10.
Fund Pro FormasFiscal Year 2010
F-69
Page 70
City of Tallahassee
Fiscal Year 2010 Approved Budget - Fund Proforma Summary
615 Golf Course Fund
Capital Projects Operating Budget Impacts
There is no operating impact within the current five-year capital improvement plan and future impacts will be built
into the five-year plan as applicable.
Fund Pro FormasFiscal Year 2010
F-70
Page 71
City of Tallahassee
Fiscal Year 2010 Approved Budget - Fund Proforma Account Summary
615 Golf Course Fund
BudgetBudget Budget Budget Budget
FY 2010 FY 2011 FY 2012 FY 2014
Actual Estimate
FY 2009FY 2008
Expenditures Adopted
FY 2009 FY 2013
327,335 389,670 209,086 209,086 213,267 219,664 226,256Salaries 335,324
0 0 0 4,181 6,398 6,589 6,787Salary Enhancements 10,595
107,872 112,212 218,945 218,945 218,945 218,945 218,945Temporary Wages 132,997
3,510 5,652 721 721 721 721 721Overtime 2,236
1,560 1,447 1,045 1,045 1,045 1,045 1,045Other Salary Items 1,045
35,951 35,211 19,080 25,825 26,594 27,390 28,207Pension- Current 31,505
29,357 28,037 15,024 15,325 15,780 16,253 16,737Pension- MAP 24,808
7,014 7,771 3,095 3,156 3,250 3,343 3,442Mandatory Medicare 5,078
53,788 53,578 30,594 32,125 33,729 35,416 37,185Health Benefits 37,785
7,340 0 0 0 0 0 0Health Benefits-Retirees 0
19,428 18,081 10,711 10,711 10,711 10,711 10,711Flex Benefits 18,435
0 0 -2,091 -2,091 -2,133 -2,196 -2,263Vacancy factor of 1.0% -10,060
0 0 -804 0 0 0 0Furlough savings 0
505,406 519,029 528,307 537,881 547,773 593,155 651,659Personnel Services 589,748
5,995 6,000 7,500 7,500 7,500 7,500 7,500Advertising 4,000
2,532 2,412 2,400 2,460 2,522 2,585 2,649Cleaning & Laundry 3,279
1,586 3,524 3,500 3,500 3,500 3,500 3,500Reproduction 3,524
500 1,400 2,500 2,500 2,500 2,500 2,500Unclassified Professional Svcs 12,900
2,034 0 0 0 0 0 0System Collection 0
2,896 2,448 5,000 5,125 5,253 5,384 5,519Building Repairs 5,200
29,462 39,880 20,000 20,500 21,013 21,538 22,076Equipment Repairs 23,900
11,342 3,440 6,000 6,150 6,304 6,461 6,623Unclassified Contract Svcs 3,535
13,518 21,316 25,000 25,625 26,266 26,922 27,595Chem-Med-Lab 31,368
97 17 0 0 0 0 0Food 0
0 0 0 0 0 0 0Gasoline 3,960
0 663 0 0 0 0 0Oil & Lubricants 0
310 0 0 0 0 0 0Postage 0
2,945 3,518 1,500 1,538 1,576 1,615 1,656Office Supplies 2,870
791 700 3,500 3,588 3,677 3,769 3,863Uniforms & Clothing 2,562
60,027 98,480 59,991 63,595 64,193 73,546 80,763Unclassified Supplies 61,219
0 0 0 0 0 0 0Vehicle- Non-Garage 49,000
503 472 975 1,000 1,026 1,052 1,079Travel & Training 912
195 0 200 205 210 215 221Journals & Books 75
1,480 1,000 1,200 1,230 1,261 1,292 1,325Memberships 1,510
336 1,564 1,000 1,025 1,051 1,077 1,104Rent Expense- Machines 1,988
20,623 12,746 25,000 25,625 26,266 26,922 27,595Unclassified Charges 22,199
165,266 171,166 174,118 185,878 195,568 157,173 199,580Operating 234,001
20,000 28,000 0 0 0 0 0Unclassified Equipment 20,000
0 0 0 0 0 20,000 28,000Capital Outlay 20,000
3,183 0 11,260 11,260 11,598 11,946 12,304Revenue Collection Expense 0
34,344 4,308 10,000 10,250 10,506 10,769 11,038Vehicle Garage Expense 0
0 14,554 10,000 10,250 10,506 10,769 11,038Vehicle Fuel 0
2,130 2,731 7,731 7,924 8,122 8,325 8,534Vehicle Replacement 2,731
67,688 18,485 19,040 19,611 20,199 20,199 20,199Indirect Costs 18,485
58,031 59,295 60,931 62,008 63,113 107,344 40,078Allocated Accounts 21,216
3,300 5,347 3,531 3,778 3,873 1,630 1,630Utilities - Sewer 1,569
4,043 3,957 3,983 4,083 4,185 4,289 4,396Utilities - Sanitation 4,056
17,308 18,098 16,904 17,327 17,760 18,204 18,659Utilities - Stormwater 18,136
2,227 2,466 2,204 2,259 2,316 2,373 2,433Utilities - Water 3,127
60,857 65,050 61,798 61,798 63,342 64,926 66,549Utilities - Electric 104,552
1,455 1,455 1,819 1,819 1,819 1,819 1,819Utilities - Fire Services 1,737
117,481 106,793 133,961 139,120 144,499 150,108 155,956COGS - Other 105,000
224,200 230,184 237,794 243,349 251,442 206,671 203,166Utilities and Other Expenses 238,177
38,191 17,347 17,552 17,535 23,223 23,219 23,222Debt Service Transfer 17,347
20,000 20,000 0 0 0 0 0RR&I Transfer 20,000
908 49,935 0 0 0 0 0Inter-Fund Transfer 0
17,552 17,535 23,223 23,219 23,222 59,099 87,282Transfers 37,347
0 0 1,010 682 717 751 791Transfer to RR&I 2,053
1,010 682 717 751 791 0 0Year End Adjustments 2,053
Fund Pro FormasFiscal Year 2010
F-71
Page 72
City of Tallahassee
Fiscal Year 2010 Approved Budget - Fund Proforma Account Summary
615 Golf Course Fund
BudgetBudget Budget Budget Budget
FY 2010 FY 2011 FY 2012 FY 2014
Actual Estimate
FY 2009FY 2008
Revenues Adopted
FY 2009 FY 2013
75,435 68,060 90,522 95,048 99,801 104,791 110,030Park Concessions 89,423
566 0 0 0 0 0 0Brokaw McDougal House 0
1,140 0 0 0 0 0 0Misc Rec Fees-Enterprise Proj. 0
4,154 76,908 0 0 0 0 0Hilaman Improvement Surcharg 71,000
38 0 0 0 0 0 0Forest Meadows Improv Surcharge 0
12,943 11,407 12,943 13,267 13,598 13,938 14,287Hilaman Gift Certificate Sal 11,288
-10,726 -9,226 -10,000 -10,250 -10,506 -10,769 -11,038Hilaman Gift Cert. Redeemed 0
360,008 347,307 360,008 369,009 378,234 387,690 397,382Hilaman Green Fees 420,559
24,887 25,887 99,100 101,578 104,117 106,720 109,388Hilaman Annual Golf Fees 39,295
274,535 268,464 285,000 292,125 299,428 306,914 314,587Hilaman Golf Cart Fees 361,219
43,302 35,414 34,128 34,981 35,856 36,752 37,671Hilaman Driving Range Fee 28,603
21,745 9,746 17,835 18,281 18,738 19,206 19,687Hilaman Other Revenues 14,862
64,108 64,308 76,929 78,852 80,824 82,844 84,915Hilaman Pro Shop Sales 101,727
763 314 0 0 0 0 0Hilaman Non-Golf Activity Fee 1,237
0 3,656 0 0 0 0 0Hilaman Restaurant Rental 0
255 0 0 0 0 0 0Other Parks & Rec Revenues 0
966,465 992,891 1,020,090 1,048,086 1,076,909 873,154 902,245Charges for Services 1,139,213
0 0 5,000 5,000 5,000 5,000 5,000Interest 3,329
18,833 22,485 0 0 0 0 0Trans from Fund Bal - Encumb 0
5,000 5,000 5,000 5,000 5,000 18,833 22,485Other Revenues 3,329
80,618 0 0 0 0 0 0TransfromGolfCourseRR&I Fund 0
170,838 285,035 0 0 0 0 0Contribution From General Fund 0
0 0 0 0 0 251,456 285,035Other Sources 0
971,465
971,465Fund Total ExpenditureFund Total Revenue
0Fund Balance
1,081,909 1,053,086 1,025,090 997,891 1,209,765 1,143,443
1,081,909 1,053,086 1,025,090 997,891 1,209,765 1,143,442
0 0 0 0 0 0
BudgetBudget Budget Budget BudgetActual EstimateFund Summary
1,142,542
1,142,542
0
Adopted
FY 2008 FY 2010 FY 2011 FY 2012 FY 2013 FY 2014FY 2009FY 2009
Fund Pro FormasFiscal Year 2010
F-72
Page 73
City of Tallahassee
Fiscal Year 2010 Approved Budget - Fund Proforma Summary
840 Cemetery Fund
The five city owned and maintained cemeteries are Old City Cemetery, which has historic significance dating
back to the late 1820s, Oakland, Roselawn, Greenwood, and Southside. The cemeteries consist of 133 acres;
however, the remaining inventory of grave space available for sale is very limited. Currently, Southside is the
only location with available space. There are approximately 330 burials per year.
The Cemetery Perpetual Care Trust was established in 1985 to provide for long-term maintenance. Funding for
the trust was $100,000 over a five-year period. Appropriations were provided by an initial lump sum from fiscal
year 1986 surplus year-end revenues.
A perpetual maintenance fee of $40 per space, collected at the time of plot sale, was implemented in fiscal year
1987 to help reduce the long-term cost of the cemetery program. Effective October 1, 2008, the fee was
increased to $93.75 per space. Until 1997, revenues collected from the sale of grave spaces accrued to the
General Fund. These revenues, along with interest earnings, began accruing to the Cemetery Fund in 1997, and
are the source of funding for cemetery maintenance operations in perpetuity. Effective October 1, 2008, revenue
from sale of grave spaces, $937.50 per space, accrues to the General Fund.
BudgetBudget Budget Budget BudgetFY 2010 FY 2011 FY 2012 FY 2013 FY 2014
Actual EstimateFY 2009FY 2008
Expenditures
206,068 214,082 219,774 225,651 231,478 151,831 228,117Personnel Services
158,280 158,280 158,280 158,280 158,280 145,276 153,850Operating
75,405 77,263 79,433 81,669 82,961 40,223 103,562Allocated Accounts
18,425 18,566 18,707 18,858 18,858 21,771 21,019Utilities and Other Expenses
26,767 27,570 28,397 29,249 29,249 0 26,086Contributions to Operations
BudgetBudget Budget Budget BudgetFY 2010 FY 2011 FY 2012 FY 2013 FY 2014
Actual EstimateFY 2009FY 2008
Revenues
21,094 21,094 21,094 21,094 21,094 87,241 28,659Charges for Services
148,546 147,426 147,341 147,274 147,212 271,861 139,963Other Revenues
315,305 327,241 336,156 345,339 352,520 0 364,012Other Sources
484,945
484,945
Fund Total Expenditure
Fund Total Revenue
0Fund Balance
520,826 513,707 504,591 495,761 532,634 359,101
520,826 513,707 504,591 495,761 532,634 359,101
1 0 0 0 0 0
FY 2008BudgetBudget Budget Budget Budget
FY 2010 FY 2011 FY 2012 FY 2013 FY 2014Actual Estimate
FY 2009Fund Summary
Fund Expenditures
The following assumption was used to forecast Cemetery Fund expenses:
Assumptions for personnel services are as follows: salaries for general employees are adjusted for a 0% merit
salary enhancement in FY10; general employee pension rates are 9.08% based on an actuarial study; matched
annuity pension plan rates are 7.15% based on an actuarial study; the health care rate is set at actual cost per
employee or at the family rate for vacant positions; and in departments with more than fifty employees, a 1.0%
vacancy factor is applied to salaries and benefits.
Revenue projections for fiscal year 2010 are based on actual sales in fiscal year 2009 through March 2009 (219
spaces - $19,908 including perpetual fees and recording costs). There are approximately 1,600 grave spaces
available for sale at Southside Cemetery and there are approximately 225 grave spaces sold per year.
Declining inventory, pending development of additional cemetery space, has created a dependence on the
Perpetual Care Trust beginning in fiscal year 2008 and will continue into future years.
Fund Revenues
Fund Pro FormasFiscal Year 2010
F-73
Page 74
City of Tallahassee
Fiscal Year 2010 Approved Budget - Fund Proforma Summary
840 Cemetery Fund
Capital Projects Operating Budget Impacts
There is no operating impact within the current five-year capital improvement plan and future impacts will be built
into the five-year plan as applicable.
Fund Pro FormasFiscal Year 2010
F-74
Page 75
City of Tallahassee
Fiscal Year 2010 Approved Budget - Fund Proforma Account Summary
840 Cemetery Fund
BudgetBudget Budget Budget Budget
FY 2010 FY 2011 FY 2012 FY 2014
Actual Estimate
FY 2009FY 2008
Expenditures Adopted
FY 2009 FY 2013
94,566 132,377 127,275 127,275 129,821 133,715 137,727Salaries 121,649
0 0 562 3,125 4,491 4,625 4,746Salary Enhancements 4,389
17,184 31,670 20,427 20,427 20,427 20,427 20,427Temporary Wages 0
1,501 3,982 6,114 6,114 6,114 6,114 6,114Overtime 6,223
9,652 11,395 11,557 15,644 16,113 16,595 17,094Pension- Current 11,395
8,515 9,612 9,100 9,282 9,560 9,847 10,142Pension- MAP 8,973
1,147 1,428 1,087 1,109 1,142 1,176 1,212Mandatory Medicare 1,060
10,895 22,627 14,916 15,663 16,445 17,266 18,130Health Benefits 19,320
2,168 6,854 7,059 7,271 7,489 7,714 7,714Health Benefits-Retirees 6,854
6,205 8,172 8,172 8,172 8,172 8,172 8,172Flex Benefits 8,172
0 0 -201 0 0 0 0Furlough savings 0
206,068 214,082 219,774 225,651 231,478 151,831 228,117Personnel Services 188,035
1,050 1,200 1,200 1,200 1,200 1,200 1,200Cleaning & Laundry 1,200
5 0 0 0 0 0 0Reproduction 0
525 550 550 550 550 550 550Equipment Repairs 550
137,293 143,400 143,400 143,400 143,400 143,400 143,400Unclassified Contract Svcs 143,400
1,484 1,400 1,663 1,663 1,663 1,663 1,663Telephone 1,663
199 200 350 350 350 350 350Office Supplies 350
390 600 600 600 600 600 600Uniforms & Clothing 600
4,105 6,000 10,017 10,017 10,017 10,017 10,017Unclassified Supplies 10,017
225 500 500 500 500 500 500Building Supplies 500
158,280 158,280 158,280 158,280 158,280 145,276 153,850Operating 158,280
3,181 3,705 3,781 3,781 3,894 4,011 4,131Human Resource Expense 3,705
5,918 5,757 6,876 6,876 7,082 7,294 7,513Accounting Expense 5,757
3,788 2,352 6,600 6,600 6,798 7,002 7,212Purchasing Expense 2,352
5,053 8,584 7,315 7,315 7,534 7,760 7,993Information Systems Expense 8,584
0 1,156 2,067 2,067 2,129 2,193 2,259Risk Management Expense 1,156
849 830 725 725 747 769 792Revenue Collection Expense 830
18,705 43,448 9,848 9,848 10,143 10,448 10,761Vehicle Garage Expense 2,329
0 4,282 3,381 3,381 3,482 3,587 3,695Vehicle Fuel 7,136
2,730 3,499 3,965 4,898 4,898 4,898 4,898Vehicle Replacement 3,499
0 29,949 30,847 31,772 32,725 33,707 33,707Indirect Costs 29,949
75,405 77,263 79,433 81,669 82,961 40,223 103,562Allocated Accounts 65,297
1,396 1,000 1,000 1,000 1,000 1,000 1,000Utilities - Sanitation 1,000
2,595 2,714 0 0 0 0 0Utilities - Stormwater 0
11,172 10,764 10,760 10,771 10,771 10,771 10,771Utilities - Water 10,764
6,607 6,541 6,665 6,795 6,936 7,087 7,087Utilities - Electric 6,541
18,425 18,566 18,707 18,858 18,858 21,771 21,019Utilities and Other Expenses 18,305
0 26,086 26,767 27,570 28,397 29,249 29,249Contribution to General Fund 26,086
26,767 27,570 28,397 29,249 29,249 0 26,086Contributions to Operations 26,086
Fund Pro FormasFiscal Year 2010
F-75
Page 76
City of Tallahassee
Fiscal Year 2010 Approved Budget - Fund Proforma Account Summary
840 Cemetery Fund
BudgetBudget Budget Budget Budget
FY 2010 FY 2011 FY 2012 FY 2014
Actual Estimate
FY 2009FY 2008
Revenues Adopted
FY 2009 FY 2013
78,361 0 0 0 0 0 0Sale of Cemetery Lots 0
8,880 28,659 21,094 21,094 21,094 21,094 21,094Perpetual Maintenance Fee 28,659
21,094 21,094 21,094 21,094 21,094 87,241 28,659Charges for Services 28,659
249,116 139,963 148,546 147,426 147,341 147,274 147,212Interest 292,000
22,745 0 0 0 0 0 0Trans from Fund Bal - Encumb 0
148,546 147,426 147,341 147,274 147,212 271,861 139,963Other Revenues 292,000
0 364,012 315,305 327,241 336,156 345,339 352,520Transfer - Cemetary Perp Trust 135,344
315,305 327,241 336,156 345,339 352,520 0 364,012Other Sources 135,344
484,945
484,945Fund Total ExpenditureFund Total Revenue
0Fund Balance
520,826 513,707 504,591 495,761 532,634 359,101
520,826 513,707 504,591 495,761 532,634 359,101
1 0 0 0 0 0
BudgetBudget Budget Budget BudgetActual EstimateFund Summary
456,003
456,003
0
Adopted
FY 2008 FY 2010 FY 2011 FY 2012 FY 2013 FY 2014FY 2009FY 2009
Fund Pro FormasFiscal Year 2010
F-76
Page 77
City of Tallahassee
Fiscal Year 2010 Approved Budget - Fund Proforma Summary
850 Downtown Improvement Authority Op Fund
The Tallahassee Downtown Improvement Authority (TDIA) governing board is composed of eleven members. The
Mayor appoints eight citizen members with the concurrence of the City Commission. An appointed member
must be an owner of real property within the downtown taxing district and pay ad valorem taxes. There are also
three ex-officio members including a City Commissioner, County Commissioner, and the Director of the
Tallahassee-Leon County Planning Department.
The TDIA boundaries include a 24-block area bounded by Tennessee, Pensacola, Gadsden, and Bronough
Streets. The TDIA has statutory powers “to guide the coordinated, balanced development of the district,
promote the general welfare of the area, preserve aesthetic values, prevent congestion, improve traffic, provide
pedestrian safety, and provide a way of life which combines the conveniences and the amenities of modern living
with the traditions and pleasures of the past".
A one mill ad valorem levy may be assessed to the properties within the district. Since the inception of the
Authority, the board has made a one mill levy annually, which is the maximum allowed by statutory authority.
Although TDIA bylaws provide that the operating budget be submitted to the City Commission for approval, the
governing board has exclusive control of the funds received from ad valorem tax and any other funds it may
receive such as grants and donations.
BudgetBudget Budget Budget BudgetFY 2010 FY 2011 FY 2012 FY 2013 FY 2014
Actual EstimateFY 2009FY 2008
Expenditures
157,426 164,226 169,030 173,985 179,100 154,965 163,233Personnel Services
123,908 123,924 123,924 123,924 123,924 69,024 115,124Operating
2,000 2,000 2,000 2,000 2,000 0 4,500Capital Outlay
71,900 71,900 71,900 71,900 71,900 0 92,636Transfers
BudgetBudget Budget Budget BudgetFY 2010 FY 2011 FY 2012 FY 2013 FY 2014
Actual EstimateFY 2009FY 2008
Revenues
181,450 176,006 178,646 181,326 184,952 198,039 203,560Taxes & Franchise Fees
5,284 5,284 5,284 5,284 5,284 0 4,983Intergovernmental Revenue
71,500 71,500 71,500 71,500 71,500 0 72,500Charges for Services
97,000 109,260 111,424 113,699 115,188 188,744 94,450Other Revenues
355,234
355,234
Fund Total Expenditure
Fund Total Revenue
0Fund Balance
376,924 371,809 366,854 362,050 375,493 386,783
376,924 371,809 366,854 362,050 375,493 223,990
162,794 0 0 0 0 0
FY 2008BudgetBudget Budget Budget Budget
FY 2010 FY 2011 FY 2012 FY 2013 FY 2014Actual Estimate
FY 2009Fund Summary
Fund Expenditures
Overall, FY10 budgeted expenses are $20,000 lower than FY09. The result is that personnel expenses are
slightly lower due to a reduction in the Director's salary. Unclassified Contractual Services have increased
slightly in FY10 for constituent services, while funding for operating projects has declined slightly in FY10.
In FY09, TDIA implemented or was active in the following programs and projects:
Development
• Assisted property owners and businesses through advocacy, information, and representation.
Marketing/Promotion
• Distributed the Downtown Public Parking Guide.
Maintenance
• Continued the weekly Saturday alternative service work program for litter clean up and maintenance of public
Fund Pro FormasFiscal Year 2010
F-77
Page 78
City of Tallahassee
Fiscal Year 2010 Approved Budget - Fund Proforma Summary
850 Downtown Improvement Authority Op Fund
areas downtown, in conjunction with the City’s Solid Waste Department.
Administration
• Worked with the City staff to revise and implement the new City Vendor and Street Closure policy.
Program Objectives for FY2010
The TDIA will continue efforts to promote and market downtown as a place for commerce and entertainment.
This includes advocacy for office, retail, hospitality, and residential development. The DIA will continue to
support and develop events that encourage commerce downtown.
The TDIA’s FY10 ad valorem receipts will be lower than compared to FY09 because property values fell an
average of 8.3%. Property values are anticipated to decline an additional 3% in FY11, which will result in lower
ad valorem revenue in FY11.
Fund Revenues
Capital Projects Operating Budget Impacts
There is no impact on the operating budget resulting from capital projects.
Fund Pro FormasFiscal Year 2010
F-78
Page 79
City of Tallahassee
Fiscal Year 2010 Approved Budget - Fund Proforma Account Summary
850 Downtown Improvement Authority Op Fund
BudgetBudget Budget Budget Budget
FY 2010 FY 2011 FY 2012 FY 2014
Actual Estimate
FY 2009FY 2008
Expenditures Adopted
FY 2009 FY 2013
119,865 119,725 119,128 119,128 121,511 125,156 128,911Salaries 119,725
0 3,783 0 2,383 3,645 3,754 3,867Salary Enhancements 3,783
0 6,320 5,555 5,555 5,555 5,555 5,555Other Salary Items 6,320
10,687 11,215 10,817 14,642 15,081 15,534 15,999Pension- Current 11,215
8,648 8,831 8,518 8,688 8,949 9,217 9,494Pension- MAP 8,831
1,687 1,791 1,728 1,762 1,815 1,869 1,926Mandatory Medicare 1,791
7,608 7,632 7,744 8,132 8,538 8,964 9,412Health Benefits 7,632
2,534 0 0 0 0 0 0Health Benefits-Retirees 0
3,936 3,936 3,936 3,936 3,936 3,936 3,936Flex Benefits 3,936
157,426 164,226 169,030 173,985 179,100 154,965 163,233Personnel Services 163,233
56,490 77,174 90,258 90,274 90,274 90,274 90,274Unclassified Contract Svcs 77,174
3,524 4,500 4,500 4,500 4,500 4,500 4,500Telephone 4,500
30 0 0 0 0 0 0Chem-Med-Lab 0
131 0 0 0 0 0 0Food 0
109 500 400 400 400 400 400Postage 500
930 3,500 3,100 3,100 3,100 3,100 3,100Office Supplies 3,500
2,160 3,000 3,000 3,000 3,000 3,000 3,000Travel & Training 3,000
440 450 450 450 450 450 450Journals & Books 450
1,210 2,000 2,200 2,200 2,200 2,200 2,200Memberships 2,000
4,000 24,000 20,000 20,000 20,000 20,000 20,000Rent Expense- Bldg & Ops 24,000
123,908 123,924 123,924 123,924 123,924 69,024 115,124Operating 115,124
0 4,500 2,000 2,000 2,000 2,000 2,000Office Equipment 4,500
2,000 2,000 2,000 2,000 2,000 0 4,500Capital Outlay 4,500
0 92,636 71,900 71,900 71,900 71,900 71,900Inter-Fund Transfer 92,636
71,900 71,900 71,900 71,900 71,900 0 92,636Transfers 92,636
BudgetBudget Budget Budget Budget
FY 2010 FY 2011 FY 2012 FY 2014
Actual Estimate
FY 2009FY 2008
Revenues Adopted
FY 2009 FY 2013
198,039 203,560 181,450 176,006 178,646 181,326 184,952Ad Valorem Property Tax 203,560
181,450 176,006 178,646 181,326 184,952 198,039 203,560Taxes & Franchise Fees 203,560
0 4,983 5,284 5,284 5,284 5,284 5,284Payment in Lieu of Taxes 4,983
5,284 5,284 5,284 5,284 5,284 0 4,983Intergovernmental Revenue 4,983
0 72,500 71,500 71,500 71,500 71,500 71,500Marketplace 72,500
71,500 71,500 71,500 71,500 71,500 0 72,500Charges for Services 72,500
10,736 8,500 5,000 5,000 5,000 5,000 5,000Interest 8,500
101,809 30,950 20,000 20,000 20,000 20,000 20,000Other Miscellaneous Revenue 30,950
1,200 0 0 0 0 0 0Cardiac Science Defibrilators 0
75,000 55,000 72,000 84,260 86,424 88,699 90,188Trsfr Unappr FB 55,000
97,000 109,260 111,424 113,699 115,188 188,744 94,450Other Revenues 94,450
355,234
355,234Fund Total ExpenditureFund Total Revenue
0Fund Balance
376,924 371,809 366,854 362,050 375,493 386,783
376,924 371,809 366,854 362,050 375,493 223,990
162,794 0 0 0 0 0
BudgetBudget Budget Budget BudgetActual EstimateFund Summary
375,493
375,493
0
Adopted
FY 2008 FY 2010 FY 2011 FY 2012 FY 2013 FY 2014FY 2009FY 2009
Fund Pro FormasFiscal Year 2010
F-79