CITY OF THORNTON CITY MANAGER’S OFFICE 5/27/20 A G E N D A Planning Session https://thorntonco.zoom.us/j/95414207400 June 2, 2020 5:45 p.m. I. CALL TO ORDER, REVIEW OF AGENDA, AND STAFF COMMENTS II. BRIEFINGS A. COVID-19 Update (Estimated 30 Minutes) B. Financial Auditor’s Report for 2019 (Estimated 30 Minutes) III. COUNCIL DISCUSSION IV. BRIEFINGS CONTINUED C. Executive Session pursuant to C.R.S. 24-6-402(4)(b) and (e), conferences with an attorney for the local public body for the purposes of receiving legal advice on special legal questions and determining positions relative to matters that are subject to negotiations, developing strategy for negotiations, and instructing negotiators regarding the Northglenn Waste Water Treatment Plant (Estimated 30 Minutes) D. Executive Session pursuant to C.R.S. 24-6-402(4)(b) and (e), conferences with an attorney for the local public body for the purposes of receiving legal advice on special legal questions and determining positions relative to matters that are subject to negotiations, developing strategy for negotiations, and instructing negotiators regarding the Thornton Shopping Center (Estimated 90 Minutes)
Transcript
CITY OF THORNTON CITY MANAGER’S OFFICE
5/27/20
A G E N D A Planning Session
https://thorntonco.zoom.us/j/95414207400 June 2, 2020
5:45 p.m.
I. CALL TO ORDER, REVIEW OF AGENDA, AND STAFF COMMENTS
II. BRIEFINGS
A. COVID-19 Update (Estimated 30 Minutes)
B. Financial Auditor’s Report for 2019 (Estimated 30 Minutes)
III. COUNCIL DISCUSSION
IV. BRIEFINGS CONTINUED
C. Executive Session pursuant to C.R.S. 24-6-402(4)(b) and (e), conferences with an attorney for the local public body for the purposes of receiving legal advice on special legal questions and determining positions relative to matters that are subject to negotiations, developing strategy for negotiations, and instructing negotiators regarding the Northglenn Waste Water Treatment Plant (Estimated 30 Minutes)
D. Executive Session pursuant to C.R.S. 24-6-402(4)(b) and (e), conferences
with an attorney for the local public body for the purposes of receiving legal advice on special legal questions and determining positions relative to matters that are subject to negotiations, developing strategy for negotiations, and instructing negotiators regarding the Thornton Shopping Center (Estimated 90 Minutes)
Recommended by: Kevin S. Woods KW Approved by: Kevin S. Woods KW Ordinance previously introduced by:
Presenter(s): Kevin Woods, City Manager
SYNOPSIS: Staff will provide City Council with updates on the COVID-19 pandemic. RECOMMENDATION: This item is for informational purposes only. BUDGET/STAFF IMPLICATIONS: None. ALTERNATIVES: This item is for informational purposes only. BACKGROUND (ANALYSIS/NEXT STEPS/HISTORY): (includes previous City Council action)
• State Modeling Data• “Living with COVID-19” Campaign• Alternate Care Facilities Status• Safer at Home and in the Vast, Great
Outdoors
Incident Overview
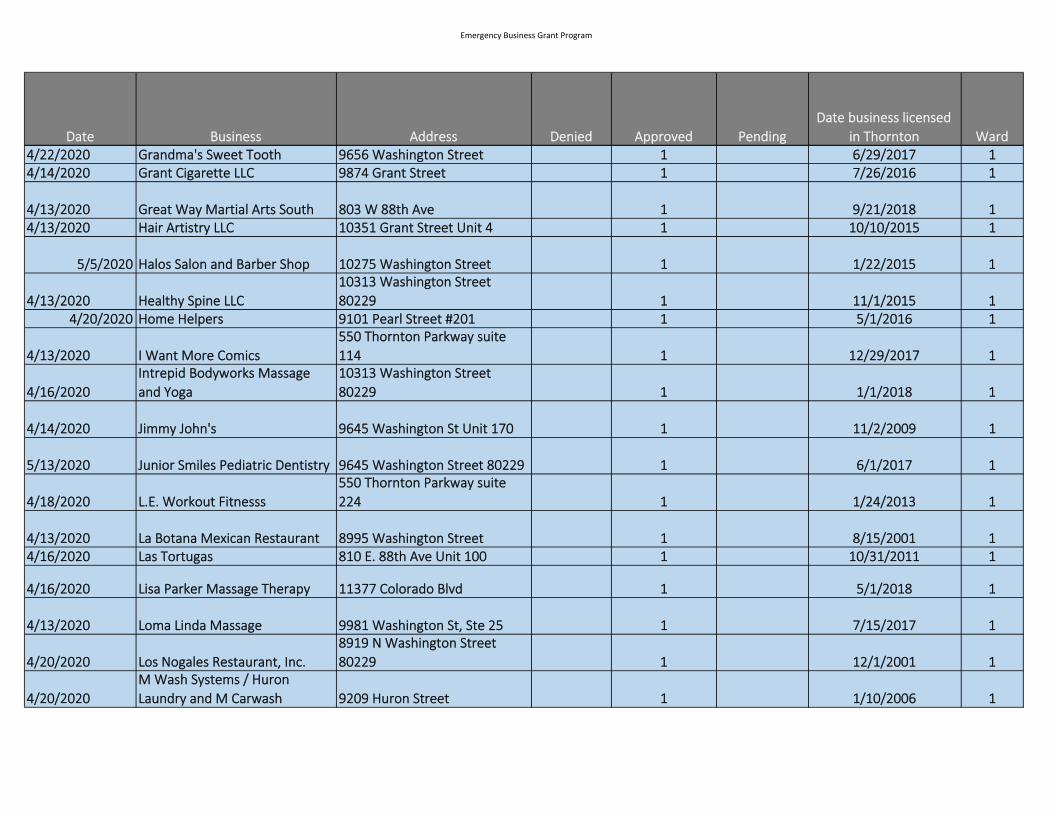
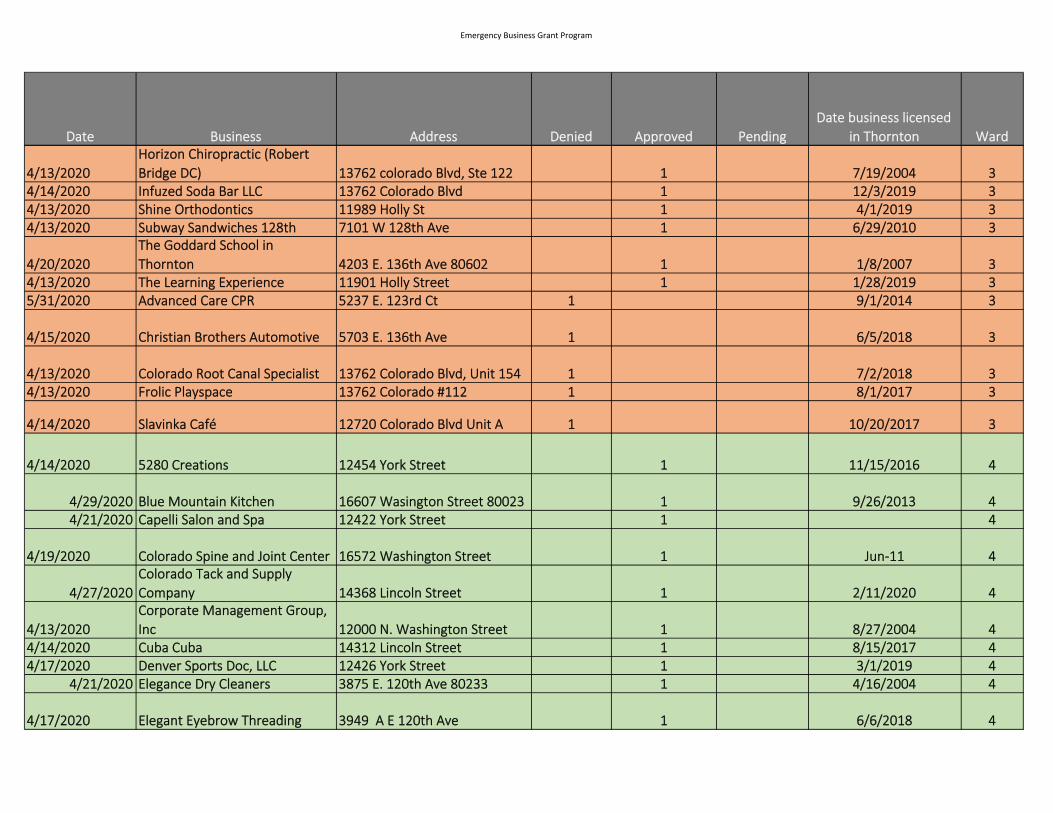
Emergency Business Grant Program
161 Applications– Approved: 114– Under Evaluation: 16– Denied: 31
Funding Update
– Awarded: $881,128 of $1,500,000– Pending Requests: $152,664– Remaining: $466,208
107
64
15
11
5
19
0 20 40 60 80 100 120
Rent
Utilities
Insurance
Payroll
Inventory
Other
Use of Funds
Emergency Business Grant Program
Date Business Address Denied Approved PendingDate business licensed
in Thornton Ward4/15/2020 303 Escape 8805 Fox Drive suite 100 1 11/7/2019 1
4/13/2020 A TBU Massage Spa & Salon 10329 Washington St 1 1/1/2016 14/14/2020 Barron Family Dental 10305 Washington street 1 12/1/2016 1
4/13/2020 Best In Sight Eye Care Center101 W. 84th Ave Suite 240 80260 1 1/29/2014 1
4/21/2020 Blue Bird Café 885 Thornton Parkway 1 12/26/2019 15/12/2020 Botas Mexican Wear 8915 N Washington Street 1 4/29/2008 1
4/17/2020 Bridal Boutique and Creation 8933 Washington St #1 1 7/31/2017 1
4/15/2020 Busy Beez Crafts & Ceramics 8512 Pearl Street 1 11/1/2018 1
4/16/2020 Champion Boxing 8520 N. Washington Street 1 4/3/2013 1
4/14/2020Divinas Hair Studio/Tania's Beauty Salon 8917 N Washington St 1 4/1/2014 1
5/13/2020 Divine Beauty By Alicia 81 W 84th Ave Ste 210 1 2/16/2018 14/15/2020 Dovi Enterprise LLC 8941 Washington Street 1 3/2/2016 14/13/2020 Eclipse Event Center 720 W. 84th Ave 1 5/1/2018 14/20/2020 Eco Express Car Wash 8431 Grant Street 1 1/25/2017 15/11/2020 El Coco Pirata ‐ Thornton 8595 Pearl Street Unit A 1 1/17/2020 1
4/13/2020 Eternity ENT / E Broidery 8933 Washington St #2b 1 3/6/2018 1
4/14/2020 Fantastic Sam's Cut and Color 9890 Grant Street 1 3/13/2015 14/14/2020 GIS Tru Services 8621 Washington St 1 1/2/2008 1
Emergency Business Grant Program
Date Business Address Denied Approved PendingDate business licensed
in Thornton Ward4/22/2020 Grandma's Sweet Tooth 9656 Washington Street 1 6/29/2017 14/14/2020 Grant Cigarette LLC 9874 Grant Street 1 7/26/2016 1
4/13/2020 Great Way Martial Arts South 803 W 88th Ave 1 9/21/2018 14/13/2020 Hair Artistry LLC 10351 Grant Street Unit 4 1 10/10/2015 1
5/5/2020 Halos Salon and Barber Shop 10275 Washington Street 1 1/22/2015 1
4/13/2020 Healthy Spine LLC10313 Washington Street 80229 1 11/1/2015 1
4/20/2020 Home Helpers 9101 Pearl Street #201 1 5/1/2016 1
4/13/2020 I Want More Comics550 Thornton Parkway suite 114 1 12/29/2017 1
4/16/2020Intrepid Bodyworks Massage and Yoga
10313 Washington Street 80229 1 1/1/2018 1
4/14/2020 Jimmy John's 9645 Washington St Unit 170 1 11/2/2009 1
5/13/2020 Junior Smiles Pediatric Dentistry 9645 Washington Street 80229 1 6/1/2017 1
4/13/2020 Loma Linda Massage 9981 Washington St, Ste 25 1 7/15/2017 1
4/20/2020 Los Nogales Restaurant, Inc. 8919 N Washington Street 80229 1 12/1/2001 1
4/20/2020M Wash Systems / Huron Laundry and M Carwash 9209 Huron Street 1 1/10/2006 1
Emergency Business Grant Program
Date Business Address Denied Approved PendingDate business licensed
in Thornton Ward
4/13/2020 Mile Hi Ink Tattoo 10351 Grant Street Unit 10 1 3/27/2015 1
5/6/2020 Pete's Café 9170 Washington Street 80229 1 6/4/2013 1
4/13/2020 Pho 4 Mua Restaurant LLC 9866 Grant St 1 4/3/2006 14/14/2020 Plan Bee 8550 Pearl Street 1 1/30/2019 14/29/2020 Planet T's 10205 Wasington Street 1 8/8/2013 1
4/22/2020 Platinum Bridal20 W. 84th Ave Suite 200 80260 1 3/13/2018 1
4/13/2020 Rabbit Heating & Air LLC9150 Washington St, Unit A 80229 1 4/17/2009 1
4/20/2020 Renegade Burrito 10005 Grant Steet 1 3/10/2020 1
4/20/2020 Salon Venecia 550E. Thornton Pkwy #212 1 1/1/2018 14/29/2020 Scudder Press Inc 565 Russell Blvd 80229 1 1/13/2009 1
4/13/2020 Smile High Dental Care 10311 Washington Street 1 10/31/2015 15/5/2020 Sport Clips 9645 Washington Street 1 8/1/2016 1
4/16/2020 Spring Tailor 8625 Washington Street 1 1/10/2020 14/15/2020 Subway Sandwiches Huron 9213 Huron Street 1 5/1/2013 14/13/2020 T Nails 10351 Grant Street Unit 1 2/27/2019 14/13/2020 TCBY Frozen Yogurt 9645 Washington St, Ste 140 1 5/2/2013 1
4/13/2020 Thornton Quiznos / JYH LLC 8426 Pearl Street 1 8/20/2012 1
4/15/2020Trusted Accounting and Services 8710 Grant Street ste 100 1 7/1/2015 1
4/13/2020 Ultimate Beauty Supply 9156 Washington Street 1 1/31/2020 14/15/2020 Venezia Aranda's Jewelry 9171 Washington Street 1 12/15/2017 14/13/2020 5280 Laser Aesthetics 10307 Washington Street 1 2/28/2020 1
5/9/2020 Annabella's Alteration 20 W 84th Ave 1 1/1/2014 1
Emergency Business Grant Program
Date Business Address Denied Approved PendingDate business licensed
in Thornton Ward
4/17/2020 Artistry Aesthetics10307 Washington Street 80229 1 1/1/2020 1
5/19/2020 Avantika Grocery 10351 Grant St Unit 6 1 8/20/2019 15/8/2020 Classy Nails and Spa 879 Thornton Parkway 1 9/29/2017 1
4/13/2020Premier Spine and Pain Specialist 9351 Grant Street #490 80229 1 11/9/2018 1
4/14/2020 A Cake Occasion 3901 E. 112th Unit C 1 11/1/1993 2
4/29/2020 Best Plaza Cleaners 3884 E. 120th Ave 80233 1 1/30/2017 24/30/2020 Elvis Nails 3754 E, 104th Ave 1 1/13/1999 24/23/2020 Extra Point Bar & Grill 4050 E 100th Ave 1 4/14/1997 2
4/17/2020 Elegant Eyebrow Threading 3949 A E 120th Ave 1 6/6/2018 4
Emergency Business Grant Program
Date Business Address Denied Approved PendingDate business licensed
in Thornton Ward4/17/2018 Foxy Nails and Spa 16590 Washington Street 1 9/18/2019 4
4/30/2020 Haute Yoga16631 Washington Street 80023 1 7/22/2019 4
4/14/2020 Hearthside Dentistry 16578 Washington Street 1 9/15/2013 44/13/2020 Hobby Nails LLC 16679 N Washington St 1 6/16/2017 44/14/2020 Integral Physical Therapy 2900E. 136th ste 210 1 3/12/2019 4
4/20/2020J N J Comic Books and Games LLC 3929 A E 120th Ave 1 2/15/2018 4
4/14/2020 Joe Palookas Sports and Spirits 3923 E. 120th Ave 1 2/16/2015 44/13/2020 La Fogata III 16600 Washington St 1 4/27/2008 45/13/2020 Lash & Company 16677 Washington Street 1 8/13/2015 44/20/2020 Nail Center 2683 E. 120th Ave Unit B4 1 11/28/2016 45/7/2020 Papa Mazzottis 2252 Lake Ave 80241 1 9/26/2011 4
4/28/2020 Peak Martial Arts 2300 E 120th Ave Ste 112 1 4/29/2019 44/13/2020 Polished Nails Salon 14372 Lincoln Street 1 4/10/2017 4
4/17/2020 Rosa Mexican Kitchen 14322 Lincoln Street 80023 1 6/24/2020 44/26/2020 Izakaya 13801 Grant Street 1 5/29/2019 44/14/2020 Satire Brewing Company 12136 Grant Circle 1 1/2/2018 44/15/2020 Snappy Nails 3877 E 120th Ave 1 10/15/2001 44/13/2020 Sock 'Em 13801 Grant St, Set 802 1 11/15/2019 44/13/2020 Subway Sandwiches 120th 3929 B E. 120th Ave 1 5/20/2015 4
4/13/2020
y yDenver North Hotel / Colorado Visionaries 12101 N. Grant Street 1 5/1/2018 4
4/14/2020Tangles Salon & Spa / Kramer Co 3863 E 120th Ave 1 7/5/2014 4
4/13/2020The Summit Entertainment Thornton 580 E. 144th Ave 80023 1 7/30/2018 4
4/17/2020 Top Dawg 13801 Grant St, Set501 1 9/30/2018 4
Emergency Business Grant Program
Date Business Address Denied Approved PendingDate business licensed
in Thornton Ward
4/20/2020 Trendz Hair Studio 13762 Colorado Blvd 1 12/30/2014 4
4/15/2020Urban Eatery and Daylight Donuts 14352 Lincoln Street 1 11/9/2018 4
4/17/2020Dance Space Performing Arts Academy 16669 Washington Street 1 12/12/2017 4
4/14/2020 Impact Heating and Cooling 12295 Pennsylvania Street 8B 1 1/1/2015 4
4/13/2020 One Crafty Giraffe LLC 3991 E 120th Ave 80233 1 10/2/2019 4
4/13/2020 Teal Taco 12189 Pennsylvania Street 1 2/28/2017 4
4/15/2020 XLVII's Bakery 12189 Pennsylvania Street Unit 12183 1 8/1/2018 4
4/21/2020 Your Pie 14342 Lincoln Street 1 1/30/2017 4
Emergency Business Grant Program
Date Business Address Denied Approved PendingDate business licensed
in Thornton Ward
4/17/2020 Zar Designs LLC 3094 E. 143rd Place 1 5/7/2004 4
PLANNING SESSION COMMUNICATION Meeting Date:
June 2, 2020
Agenda Item:
Agenda Location:
N/A Goal(s):
Legal Review:
N/A ___ 1st Reading ___ 2nd Reading
Subject: Presentation of Coronavirus Aid, Relief, and Economic Security Act Community Task Force Recommendation
Recommended by: Seve Ghose SG Approved by: Kevin S. Woods KW Ordinance previously introduced by:
____________________ Presenter(s): Jaylin Stotler, Community Connections Manager
SYNOPSIS: Thornton was named the recipient of $11.7 million in funds by Adams County, as a result of the Coronavirus Aid, Relief, and Economic Security Act (CARES Act). Thornton’s Community Connections division was charged with identifying the priority needs of the community due to the public health emergency of COVID-19, and with developing a CARES Act Community Task Force (Task Force) to review nonprofit requests for funding and to make a funding recommendation. Priority community needs were identified as food, housing/shelter, mental health, and subsistence payments. The CARES Act Community Task Force seeks to award $1 million to assist nonprofits in serving those impacted by the COVID-19 pandemic. As Task Force recommendations are made, they will be brought forward to Council, therefore Council can expect phases of recommendations until the $1 million has been spent. RECOMMENDATION: The Task Force recommends the following organizations for funding:
Organization Name Recommended Amount FOOD Adams County Emergency Food Bank $10,000 Amazing Grace Community Church $15,000 Food Bank of the Rockies $10,000 Good Shepherd Presbyterian Church $10,000 Growing Home $10,000 Immaculate Heart of Mary $5,000 Neighbor Outreach of Colorado $15,000 Northglenn Christian Church $5,000 Senior Hub (Food Bank, Material Aid, and Market Nights) $10,000 Thornton Community Food Bank $15,000
PLANNING SESSION COMMUNICATION PAGE 2
Thrive Church $10,000 Westminster Presbyterian Church $5,000 Project Angel Heart $15,468 Healthy Farmer’s Market $17,418 Total for Food $152,886 BUDGET/STAFF IMPLICATIONS: $1 million of the $11.7 million received from Adams County has been earmarked to serve nonprofits in responding to community needs during COVID-19. ALTERNATIVES: 1. Direct the Task Force to allocate funds as recommended. 2. Direct the Task Force to make changes to the recommended funding amounts as directed by
Council. BACKGROUND (ANALYSIS/NEXT STEPS/HISTORY): (includes previous City Council action) Food Banks: Overview of Need Based on data collected from food banks, the Task Force found that in response to COVID-19 food banks in the surrounding area are responding to increased need and, as such, require additional food and supplies. Funds will be used exclusively for food, food storage, hygiene supplies, protective personal equipment, and cleaning supplies. Food Banks: Funding Calculation Staff recommended tiered funding amounts of $5,000, $10,000, and $15,000. These amounts were selected with considerations of food bank survey results, the 2020 Thornton Assistance Funds (TAF) awards for the food category, and interviews with food bank representatives during COVID-response that solicited information about anticipated financial need to sustain the food bank through the end of 2020. The calculation to determine the recommended amount for each food bank is based on data from each food bank. The Task Force received 12 survey responses from a total of 15 (Neighbor Outreach of Colorado represents two locations) food banks in the surrounding area. The Task Force asked the number of overall clients served, the number of Thornton residents served, and from that data the percentage of Thornton residents served was determined. The Task Force also asked the food banks about their level of need and assigned points to those food banks which are located within Thornton. Project Angel Heart: Overview of Need Project Angel Heart delivers meals to critically ill children and families so that they can practice physical distancing and stay safer at home during the COVID-19 pandemic. The Home-Delivered
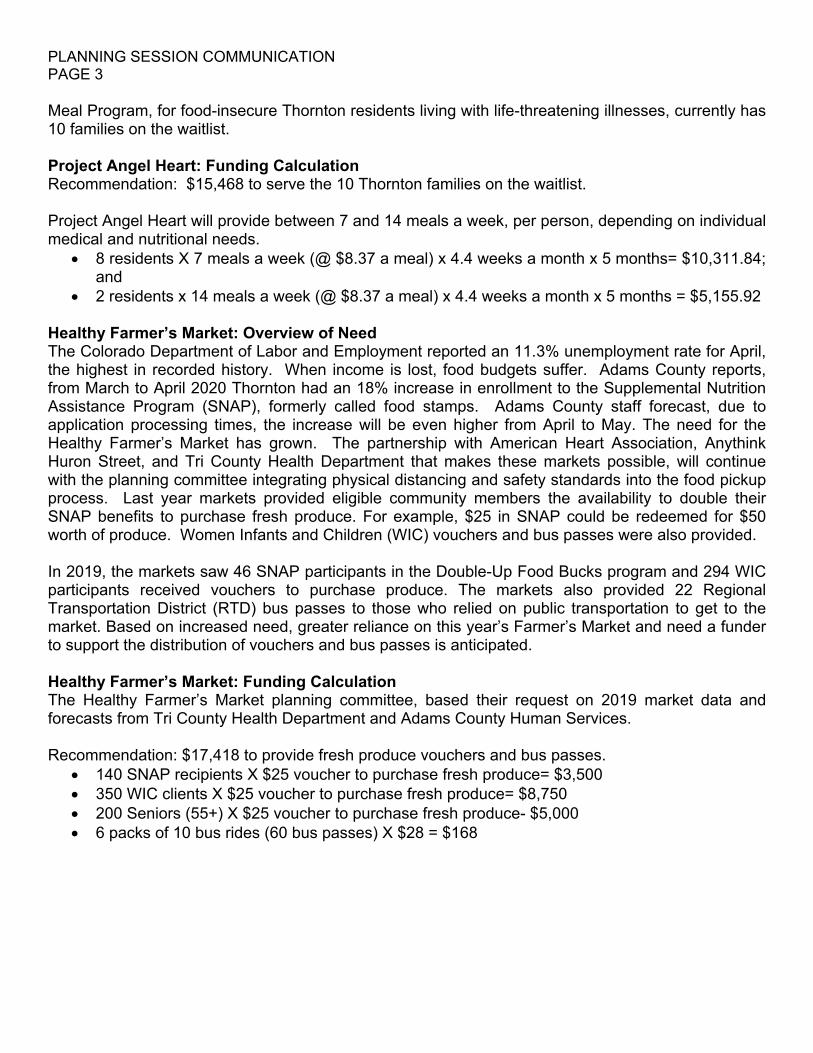
PLANNING SESSION COMMUNICATION PAGE 3
Meal Program, for food-insecure Thornton residents living with life-threatening illnesses, currently has 10 families on the waitlist. Project Angel Heart: Funding Calculation Recommendation: $15,468 to serve the 10 Thornton families on the waitlist. Project Angel Heart will provide between 7 and 14 meals a week, per person, depending on individual medical and nutritional needs.
8 residents X 7 meals a week (@ $8.37 a meal) x 4.4 weeks a month x 5 months= $10,311.84; and
2 residents x 14 meals a week (@ $8.37 a meal) x 4.4 weeks a month x 5 months = $5,155.92 Healthy Farmer’s Market: Overview of Need The Colorado Department of Labor and Employment reported an 11.3% unemployment rate for April, the highest in recorded history. When income is lost, food budgets suffer. Adams County reports, from March to April 2020 Thornton had an 18% increase in enrollment to the Supplemental Nutrition Assistance Program (SNAP), formerly called food stamps. Adams County staff forecast, due to application processing times, the increase will be even higher from April to May. The need for the Healthy Farmer’s Market has grown. The partnership with American Heart Association, Anythink Huron Street, and Tri County Health Department that makes these markets possible, will continue with the planning committee integrating physical distancing and safety standards into the food pickup process. Last year markets provided eligible community members the availability to double their SNAP benefits to purchase fresh produce. For example, $25 in SNAP could be redeemed for $50 worth of produce. Women Infants and Children (WIC) vouchers and bus passes were also provided. In 2019, the markets saw 46 SNAP participants in the Double-Up Food Bucks program and 294 WIC participants received vouchers to purchase produce. The markets also provided 22 Regional Transportation District (RTD) bus passes to those who relied on public transportation to get to the market. Based on increased need, greater reliance on this year’s Farmer’s Market and need a funder to support the distribution of vouchers and bus passes is anticipated. Healthy Farmer’s Market: Funding Calculation The Healthy Farmer’s Market planning committee, based their request on 2019 market data and forecasts from Tri County Health Department and Adams County Human Services. Recommendation: $17,418 to provide fresh produce vouchers and bus passes.
140 SNAP recipients X $25 voucher to purchase fresh produce= $3,500 350 WIC clients X $25 voucher to purchase fresh produce= $8,750 200 Seniors (55+) X $25 voucher to purchase fresh produce- $5,000 6 packs of 10 bus rides (60 bus passes) X $28 = $168
CARES ActCommunity Support Programs
Food Bank Recommendation
Project Angel Heart Recommendation
• Meal delivery service to children & families with life threatening illness
• $15,468 for 5 months of meals• 8 residents X 7 meals = $10,311.84• 2 residents x 14 meals = $5,155.92
PLANNING SESSION COMMUNICATION Meeting Date:
June 2, 2020 Agenda Item:
B Agenda Location:
N/A Goal(s):
Legal Review:
N/A ___ 1st Reading ___ 2nd Reading
Subject: Financial Auditor’s Report for 2019
Recommended by: Kim Newhart KN Approved by: Kevin S. Woods KW Ordinance previously introduced by:
__________________
Presenter(s): Kevin Smith, CPA, Partner with RSM Craig Boonstra, Controller Kim Newhart, Interim Finance Director
SYNOPSIS: The City’s independent auditors, RSM US LLP, will present their audit report of the City’s financial statements for the year ended December 31, 2019, the Single Audit (report on federal financial awards) and the annual report on the review of advances, expense reports, and purchasing card activity for the Mayor, Mayor Pro Tem, Councilmembers, City Attorney, City Manager, Presiding Municipal Court Judge, and all Department Directors. RECOMMENDATION: Staff recommends acceptance of the reports. BUDGET/STAFF IMPLICATIONS: None. ALTERNATIVES: None.
BACKGROUND (ANALYSIS/NEXT STEPS/HISTORY): (includes previous City Council action) RSM US LLP, external auditor to the City, was engaged to perform the 2019 audit. Kevin Smith, CPA, has been both the primary contact and the lead partner on the City’s audit. The City’s audited financial statements are used by governmental agencies – Federal, State, and County in decisions related to awarding grant funds. The audited financial statements are also reviewed by credit agencies (Moody’s, Standard & Poor’s, and Fitch) when determining the rating on initial debt issues and annually for periodic monitoring of outstanding debt issues. The Comprehensive Annual Financial Report (CAFR) is posted on the City’s website and provided to the State of Colorado by or before June 30th each year, as required by law.
CITY OF THORNTON, COLORADOReport of the External AuditorYear ending December 31, 2019
Data portrayed in the attached graphic presentations were derived from the City’s comprehensive annual financial report which was audited by RSM US LLP, whose report thereon is dated May 20, 2020. The data presented should be read in conjunction with the City’s comprehensive annual financial report.
• Internal Control Over Financial Reporting− No material weaknesses over financial reporting reported− Significant deficiency reported for an audit adjusting entry in the TDA North
capital projects fund – payment to developer recorded in fiscal year 2020 instead of 2019.
− No instances of noncompliance reported over state compliance requirements impacting the financial statements
• Single Audit− 1 major program tested: Department of Homeland Security – Disaster Public
Assistance Grants− These grants accounted for $3.6 million of the $6.4 million of federal grant
expenditures− Unmodified (clean) opinion on the major program− No instances of noncompliance reported− No significant deficiencies or material weaknesses in internal control over
Unmodified “Clean” Opinion Over the Financial Statements; highest level of assurance that can be received from external audit
New accounting standards adopted – GASB Statement No. 83 on Asset Retirement Obligations (ARO) – liability reported by the City but no material impact to the financial statements
Management Judgments and Significant Accounting Estimates
Two adjusting journal entries required as a result of audit procedures – no material impact to the financial statements
No disagreements with management or difficulties encountered in performing the audit
Financial Condition of the City as of December 31, 2019
• Credit rating is one measure of financial health and used as a tool for potential investors; the better a credit rating, the lower interest costs will be− Water Bonds rated AA by S&P and Aa2 by Moody’s− Certificates of participation rated AA- by S&P and Aa3 by
Moody’s− Urban renewal bonds rated A+ by S&P
• Fund balance and other fiscal policies set by Council to ensure the City is financially sustainable – General fund to maintain a minimum reserve of 17% of current year budget
• As of December 31, 2019, total fund balance of the General fund was 37.6% of budgeted expenditures
• Received GFOA Certificate of Achievement for Excellence in Financial Reporting for 34th consecutive year
This document contains general information, may be based on authorities that are subject to change, and is not a substitute for professional advice or services. This document does not constitute audit, tax, consulting, business, financial, investment, legal or other professional advice, and you should consult a qualified professional advisor before taking any action based on the information herein. RSM US LLP, its affiliates and related entities are not responsible for any loss resulting from or relating to reliance on this document by any person. Internal Revenue Service rules require us to inform you that this communication may be deemed a solicitation to provide tax services. This communication is being sent to individuals who have subscribed to receive it or who we believe would have an interest in the topics discussed.
RSM US LLP is a limited liability partnership and the U.S. member firm of RSM International, a global network of independent audit, tax and consulting firms. The member firms of RSM International collaborate to provide services to global clients, but are separate and distinct legal entities that cannot obligate each other. Each member firm is responsible only for its own acts and omissions, and not those of any other party. Visit rsmus.com/aboutus for more information regarding RSM US LLP and RSM International.
RSM, the RSM logo and the power of being understood are registered trademarks of RSM International Association.
City of Thornton, Colorado Comprehensive Annual Financial Report
For the fiscal year ended December 31, 2019
Prepared by the Finance Department
City of Thornton, Colorado Table of Contents
Introductory Section Page Letter of Transmittal v City Officials x Organizational Chart xi Certificate of Achievement for Excellence in Financial Reporting xii Financial Section Report of Independent Certified Public Accountants 1 Management’s Discussion & Analysis 3 Basic Financial Statements Government-wide Financial Statements Statement of Net Position 12 Statement of Activities 13 Fund Financial Statements Balance Sheet - Governmental Funds 16 Reconciliation of the Balance Sheet of Governmental Funds to the Statement of Net Position 17 Statement of Revenues, Expenditures, and Changes in Fund Balances – Governmental Funds 18 Reconciliation of the Statement of Revenues, Expenditures, and Changes in Fund Balances of Governmental Funds to the Statement of Activities 19 Statement of Net Position – Proprietary Funds 20 Statement of Revenues, Expenses, and Changes in Net Position – Proprietary Funds 22 Statement of Cash Flows – Proprietary Funds 24 Notes to Financial Statements 26 Required Supplementary Information Schedule of Revenues, Expenditures, and Changes in Fund Balance – Budget and Actual – General Fund – Non US GAAP Basis 64 Schedule of Proportionate Share of the Net Pension Liability Statewide Defined Benefit Plan 65 Schedule of Pension Contributions Statewide Defined Benefit Plan 66 Schedule of Proportionate Share of the Net Pension Liability Statewide Hybrid Plan 67 Schedule of Pension Contributions Statewide Hybrid Plan 68 Schedule of Proportionate Share of Net Pension Liability Old Hire Plan Thornton Fire 69 Schedule of Pension Contributions Old Hire Plan Thornton Fire 70 Schedule of Changes in Total OPEB and Related Ratios 71 Combining Statements and Budgetary Schedules Fund Descriptions – Major Governmental Funds 74 Governmental Capital Fund Schedule of Revenues, Expenditures, and Changes in Fund Balance – Budget and Actual 75 Thornton Development Authority North Capital Fund Schedule of Revenues, Expenditures, and Changes in Fund Balance – Budget and Actual 76 Fund Descriptions – Non-Major Governmental Funds 77 Combining Balance Sheet – Non-Major Governmental Funds 78 Combining Statement of Revenues, Expenditures, and Changes in Fund Balances – Non-Major Governmental Funds 82 Thornton Arts, Sciences, and Humanities Council Fund (TASHCO) Schedule of Revenues, Expenditures, and Changes in Fund Balance – Budget and Actual 85 Cash in Lieu Fund Schedule of Revenues, Expenditures, and Changes in Fund Balance – Budget and Actual 86
i
City of Thornton, Colorado
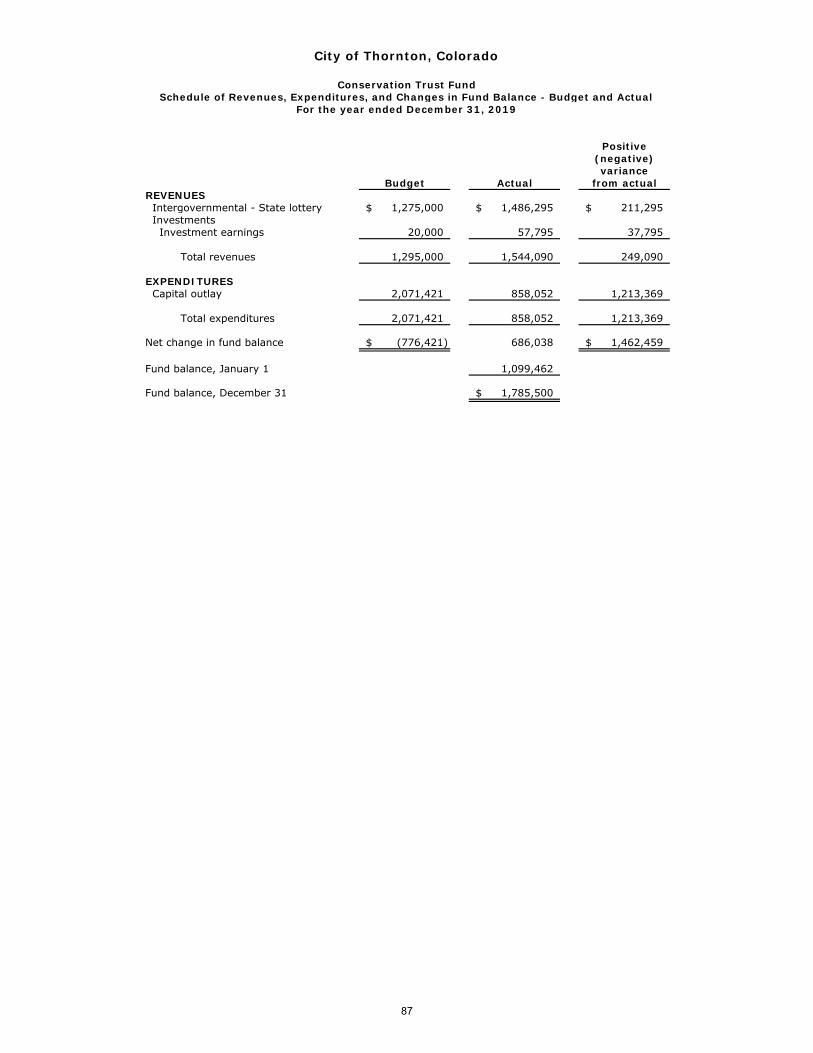
Table of Contents (Continued) Financial Section (Continued) Page Combining Statements and Budgetary Schedules (Continued) Conservation Trust Fund Schedule of Revenues, Expenditures, and Changes in Fund Balance – Budget and Actual 87 Parks Fund Schedule of Revenues, Expenditures, and Changes in Fund Balance – Budget and Actual 88 Open Space Fund Schedule of Revenues, Expenditures, and Changes in Fund Balance – Budget and Actual 89 Parks and Open Space Fund Schedule of Revenues, Expenditures, and Changes in Fund Balance – Budget and Actual 90 Adams County Open Space Sales Tax Fund Schedule of Revenues, Expenditures, and Changes in Fund Balance – Budget and Actual 91 Adams County Road & Bridge Sales Tax Fund Schedule of Revenues, Expenditures, and Changes in Fund Balance – Budget and Actual 92 136th Avenue General Improvement District Tax Fund Schedule of Revenues, Expenditures, and Changes in Fund Balance – Budget and Actual 93 E911 Authority Fund Schedule of Revenues, Expenditures, and Changes in Fund Balance – Budget and Actual 94 Thornton Development Authority South Capital Fund Schedule of Revenues, Expenditures, and Changes in Fund Balance – Budget and Actual 95 Thornton Development Authority 144th Capital Fund Schedule of Revenues, Expenditures, and Changes in Fund Balance – Budget and Actual 96 Fund Descriptions – Major Enterprise Funds 97 Water Fund Schedule of Revenues, Expenses, and Changes in Net Position – Budget and Actual – Non US GAAP Basis 98 Sewer Fund Schedule of Revenues, Expenses, and Changes in Net Position – Budget and Actual – Non US GAAP Basis 99 Stormwater Fund Schedule of Revenues, Expenses, and Changes in Net Position – Budget and Actual – Non US GAAP Basis 100
Fund Descriptions – Non-Major Enterprise Funds 101
Sanitation Fund Schedule of Revenues, Expenses, and Changes in Net Position – Budget and Actual – Non US GAAP Basis 102 Fund Descriptions – Internal Service Funds 103 Combining Statement of Net Position – Internal Service Funds 104 Combining Statement of Revenues, Expenses, and Changes in Net Position – Internal Service Funds 105 Combining Statement of Cash Flows – Internal Service Funds 106 Risk Management Fund Schedule of Revenues, Expenses, and Changes in Net Position – Budget and Actual – Non US GAAP Basis 108
Other Schedules
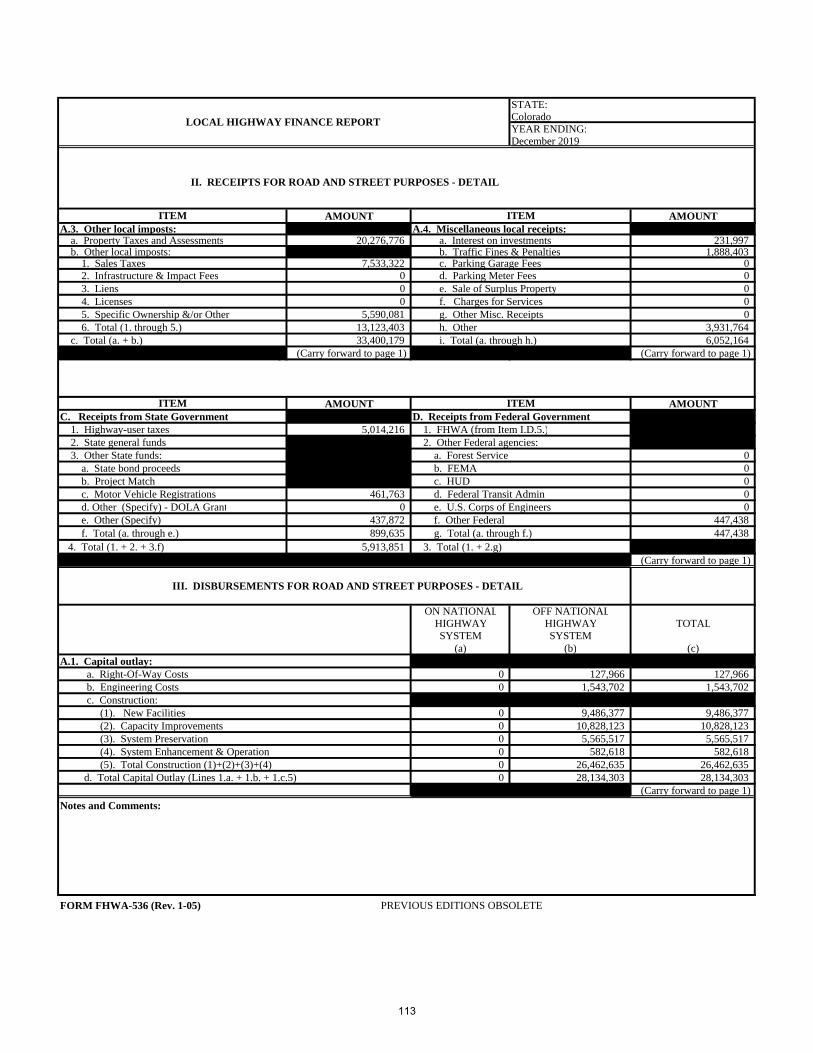
Schedule of Investments 110 Local Highway Finance Report 112
ii
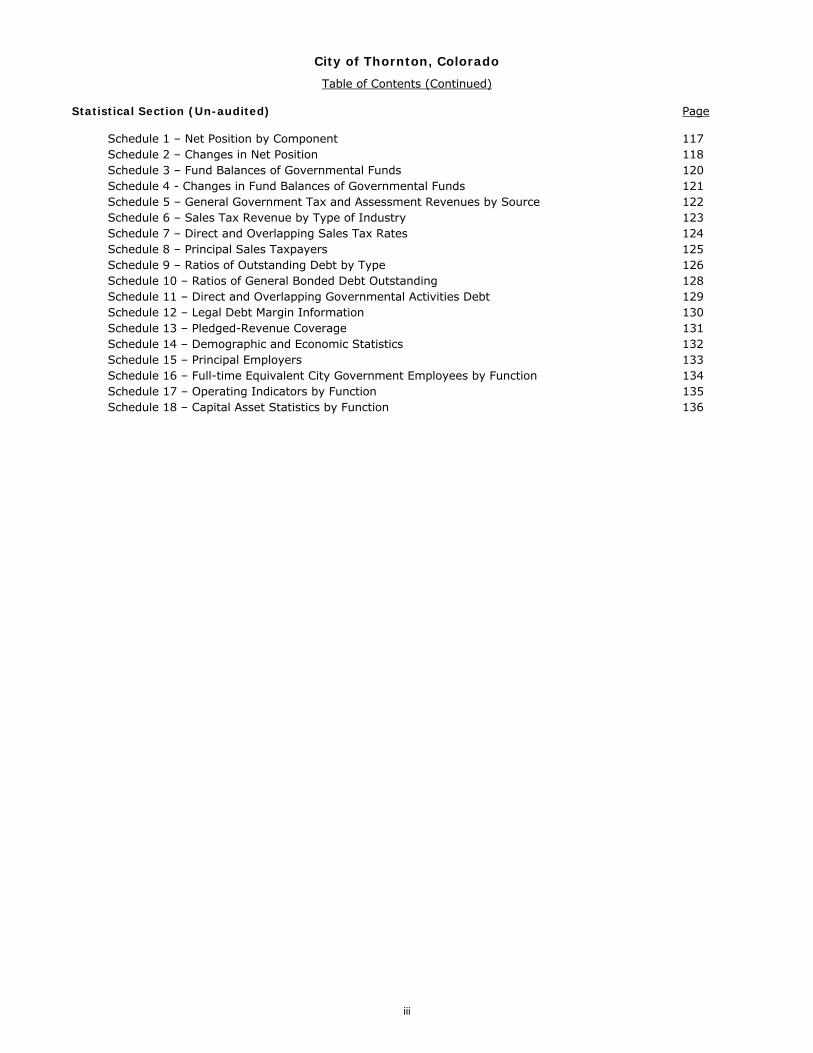
City of Thornton, Colorado
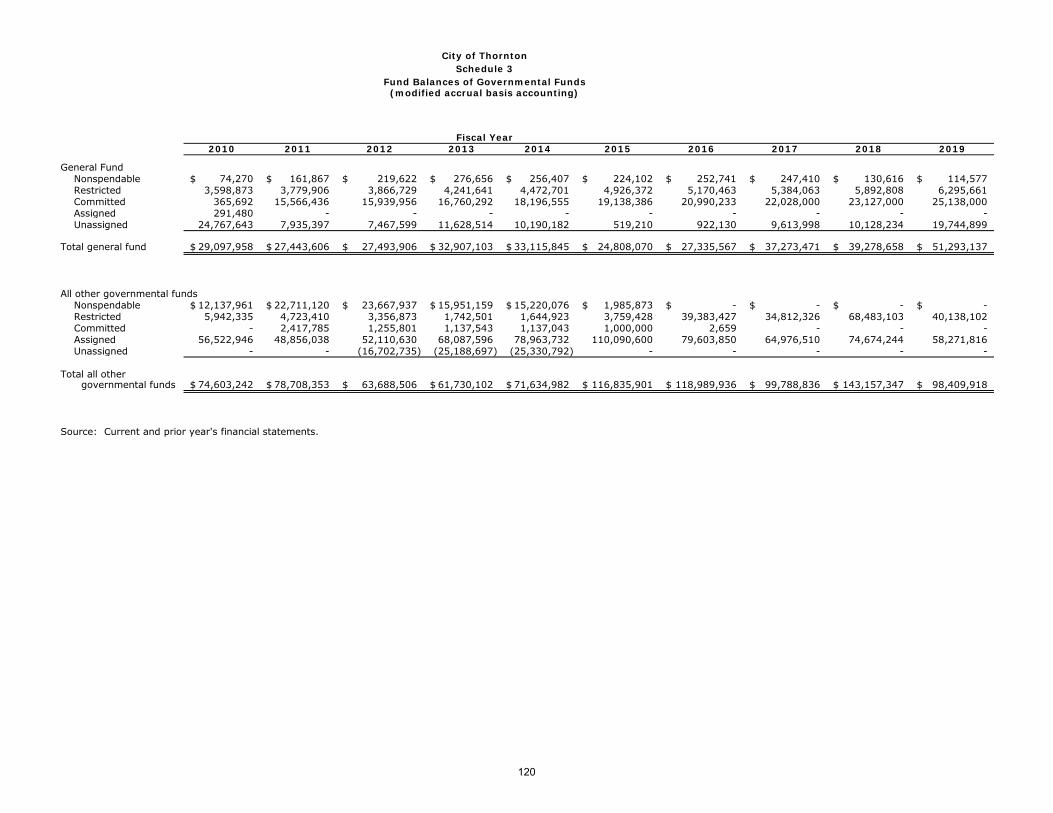
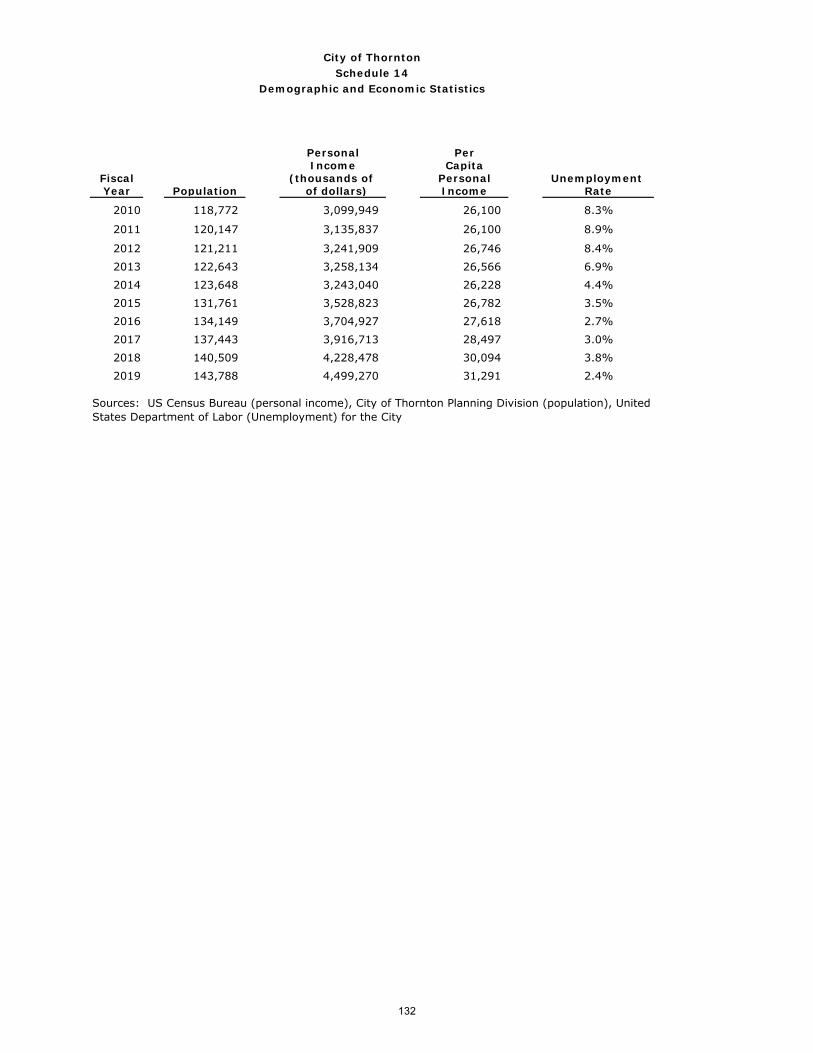
Table of Contents (Continued) Statistical Section (Un-audited) Page Schedule 1 – Net Position by Component 117 Schedule 2 – Changes in Net Position 118 Schedule 3 – Fund Balances of Governmental Funds 120 Schedule 4 - Changes in Fund Balances of Governmental Funds 121 Schedule 5 – General Government Tax and Assessment Revenues by Source 122 Schedule 6 – Sales Tax Revenue by Type of Industry 123 Schedule 7 – Direct and Overlapping Sales Tax Rates 124 Schedule 8 – Principal Sales Taxpayers 125 Schedule 9 – Ratios of Outstanding Debt by Type 126 Schedule 10 – Ratios of General Bonded Debt Outstanding 128 Schedule 11 – Direct and Overlapping Governmental Activities Debt 129 Schedule 12 – Legal Debt Margin Information 130 Schedule 13 – Pledged-Revenue Coverage 131 Schedule 14 – Demographic and Economic Statistics 132 Schedule 15 – Principal Employers 133 Schedule 16 – Full-time Equivalent City Government Employees by Function 134 Schedule 17 – Operating Indicators by Function 135 Schedule 18 – Capital Asset Statistics by Function 136
iii
This Page Left Intentionally Blank
iv
Civic Center City Manager’s Office 9500 Civic Center Drive 303-538-7200Thornton, Colorado 80229-4326 FAX 303-538-7562
www.cityofthornton.net
May 21, 2020
To the Honorable Mayor, City Council and Citizens of the City of Thornton:
We are pleased to submit the Comprehensive Annual Financial Report (CAFR) of the City of Thornton (the City) for the year ended December 31, 2019. This report was prepared by the City’s Finance Department and consists of management’s representations concerning the finances of the City. Consequently, management assumes full responsibility for the completeness and reliability of all the information contained in this report.
To provide a reasonable basis for these representations, management of the City has established a comprehensive internal control framework that is designed to both protect the government’s assets from loss, theft, or misuse and to compile sufficient reliable information for the preparation of the City’s financial statements in conformity with accounting principles generally accepted in the United States of America (US GAAP). Because the cost of internal controls should not outweigh their benefits, the City’s comprehensive framework of internal controls has been designed to provide reasonable, rather than absolute, assurance that the financial statements will be free from material misstatement. As management, we assert that, to the best of our knowledge and belief, this financial report is complete and reliable in all material respects.
The City’s financial statements have been audited by RSM US LLP, a firm of licensed certified public accountants. The goal of the independent audit was to provide reasonable assurance that the financial statements of the City for the year ended December 31, 2019, are free of material misstatement. The independent audit involved performing procedures to obtain audit evidence about the amounts and disclosures in the financial statements, evaluating the appropriateness of the accounting policies used and the reasonableness of the significant accounting estimates made by management as well as evaluating the overall presentation of the financial statements. The independent auditor concluded, based upon the audit evidence obtained, that there was a sufficient and appropriate basis for rendering an unmodified opinion that the City’s financial statements for the year ended December 31, 2019, are fairly presented in conformity with US GAAP. The independent auditors’ report is presented as the first component of the financial section of this report.
The independent audit of the financial statements of the City was part of a broader, federally mandated “Single Audit” designed to meet the special needs of federal agencies that provide significant grant funds to the City. The standards governing Single Audit engagements require the independent auditor to report not only on the fair presentation of the financial statements, but also on the audited government’s internal controls and compliance with legal requirements, with special emphasis on internal controls especially as they relate to the administration of federal awards. These reports are available in the City’s separately issued Single Audit Report.
US GAAP requires that management provide a narrative introduction, overview, and analysis to accompany the basic financial statements in the form of Management’s Discussion and Analysis (MD&A). This letter of transmittal is designed to complement the MD&A and should be read in conjunction with it. The City’s MD&A can be found immediately following the independent auditor’s report.
Profile of the Government
The City incorporated in 1956 and became a Home-Rule City in 1967. Thornton operates under a council-manager form of government. The City Manager, the City Attorney and the Presiding Municipal Judge are appointed by City Council. Thornton employs approximately 1,058 full-time employees. The City is a full-service municipality providing police and fire protection, ambulance services, infrastructure construction and maintenance, city planning and development, recreational facilities and services and operates the Thorncreek Golf Course. In addition, the City provides water, sanitary sewer, stormwater, and solid waste collection all of which are reported as enterprise operations.
The City is located in Adams County in the northeast Denver Metropolitan area and encompasses 38 square miles. It is a suburban community of 143,788 residents with a retail-oriented business sector and some light industrial businesses.
v
Major Initiatives
In response to the growing needs of the community, City Council initiated, continued, and completed multiple projects and programs during 2019 including the following:
Construction began in 2019 on the new Fire Station 1, located at Thornton Parkway and YorkStreet. This new station will provide better access to a major arterial road, providing fasterresponse times to emergencies and will also house Fire administration. Completion of thisfacility is expected late 2020.
Design of the Police Training Facility kicked off in 2019. This facility, located at Riverdale Roadand Colorado Boulevard, will include an area to practice defensive tactics, a training classroom,a low-speed driving track, a shoot house, and an area for canine training.
Work continued on implementation of the Community Facilities Plan, including largetransportation projects throughout the City. These projects, including widening along 112th
Avenue and 144th Avenue, add capacity to existing roads and improve connectivity inpreparation for the arrival of the Regional Transportation District N line.
Opened the Trail Winds Recreation Center, located at the Trail Winds Park and Open Spacecomplex at 136th Avenue and Holly Street, in late 2019. Trail Winds is the City’s second full-service recreation center and includes an indoor aquatics area, gymnasium, and fitness area,among other amenities.
Work continued on the City’s long-term water supply project, the Thornton Water Project. 2019activities included permitting, land acquisition, and the design of multiple pipeline segments.The project, when completed in 2025, will bring water from northern Colorado into Thornton inorder to provide a reliable supply of water for current and future residents and businesses.
Made significant progress on the replacement of the Thornton Water Treatment Plant at theintersection of Thornton Parkway and Washington Street. Construction began in 2018 withplans for the new water treatment plant to be up and running in 2020.
Construction began on the Active Adult Center, which is scheduled to open mid-2020. The newActive Adult Center will be located on the southwest corner of 112th Avenue and ColoradoBoulevard and will host a variety of classes, events, and services, as well as provide affordableweekday lunches for active adults and their guests.
Factors Affecting Financial Condition
The information presented in the financial statements is perhaps best understood when it is considered from the broader perspective of the specific environment within which the City operates.
Local Economy
The pace of new development within the City moderated in 2019. The City issued 744 single family permits (attached and detached) for residential construction with an estimated value of $241 million. The City issued 16 commercial building permits with an estimated value of $61.9 million. The commercial landscape of the I-25 corridor through the City continues to change with the addition of Johnny’s Italian Steakhouse, Top Golf; and Floor and Decor. The City delivered on its vision of a healthy and high quality of life for citizens through the opening of the Riverwalk Ball Fields and the Trail Winds Recreation Center.
vi
Local Economy (Continued)
Sales tax collections in 2019, the largest single revenue stream received by the general government, totaled $79.3 million, an increase of 15.5% over 2018.
Property values increased 22.4% from 2018, totaling $1.6 billion in assessed value for 2019. The property taxes associated with this assessed valuation will be collected in 2020.
vii
Long Term Financial Planning The City’s financial policies related to fund balances and cash reserves are set by Council. The Council conducts periodic reviews of the fund balance policy and revises as needed to ensure Thornton is financially sustainable and able to meet established service levels, and to ensure the City is following recommended best practices in the government finance industry. The General Fund reserve is 17% of the current year budget. Utilization of this reserve requires a two-thirds affirmative vote of Council. In the event that a cash reserve is utilized or the level falls below the amount set forth by policy, the City Council will approve a plan within two years of such event to restore levels to the required amount. In addition to the General Fund, the City maintains financial policies (related to fund balances and cash reserves) for the utility enterprise funds (including Water, Sewer, Stormwater and Sanitation), and the Risk Fund (self-insurance fund).
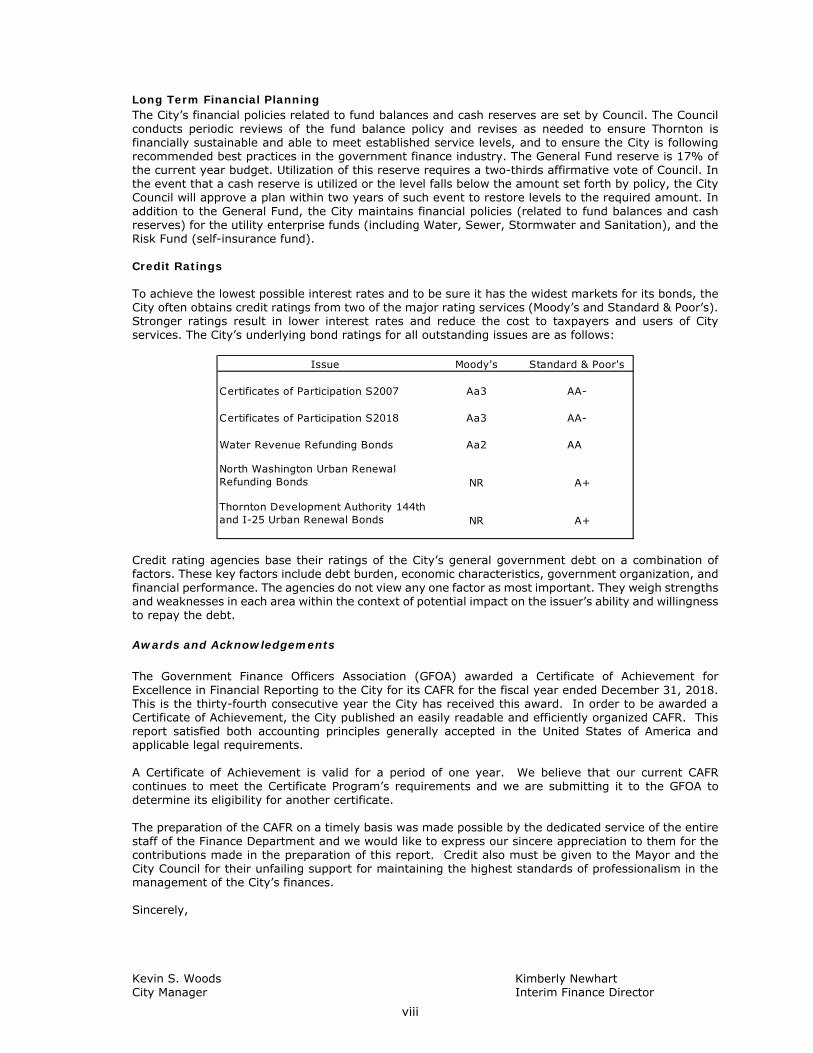
Credit Ratings
To achieve the lowest possible interest rates and to be sure it has the widest markets for its bonds, the City often obtains credit ratings from two of the major rating services (Moody’s and Standard & Poor’s). Stronger ratings result in lower interest rates and reduce the cost to taxpayers and users of City services. The City’s underlying bond ratings for all outstanding issues are as follows:
Credit rating agencies base their ratings of the City’s general government debt on a combination of factors. These key factors include debt burden, economic characteristics, government organization, and financial performance. The agencies do not view any one factor as most important. They weigh strengths and weaknesses in each area within the context of potential impact on the issuer’s ability and willingness to repay the debt.
Awards and Acknowledgements
The Government Finance Officers Association (GFOA) awarded a Certificate of Achievement for Excellence in Financial Reporting to the City for its CAFR for the fiscal year ended December 31, 2018. This is the thirty-fourth consecutive year the City has received this award. In order to be awarded a Certificate of Achievement, the City published an easily readable and efficiently organized CAFR. This report satisfied both accounting principles generally accepted in the United States of America and applicable legal requirements.
A Certificate of Achievement is valid for a period of one year. We believe that our current CAFR continues to meet the Certificate Program’s requirements and we are submitting it to the GFOA to determine its eligibility for another certificate.
The preparation of the CAFR on a timely basis was made possible by the dedicated service of the entire staff of the Finance Department and we would like to express our sincere appreciation to them for the contributions made in the preparation of this report. Credit also must be given to the Mayor and the City Council for their unfailing support for maintaining the highest standards of professionalism in the management of the City’s finances.
Sincerely,
Kevin S. Woods Kimberly NewhartCity Manager Interim Finance Director
Issue Moody's Standard & Poor's
Certificates of Participation S2007 Aa3 AA-
Certificates of Participation S2018 Aa3 AA-
Water Revenue Refunding Bonds Aa2 AA
North Washington Urban Renewal Refunding Bonds NR A+
Thornton Development Authority 144th and I-25 Urban Renewal Bonds NR A+
viii
This Page Left Intentionally Blank
ix
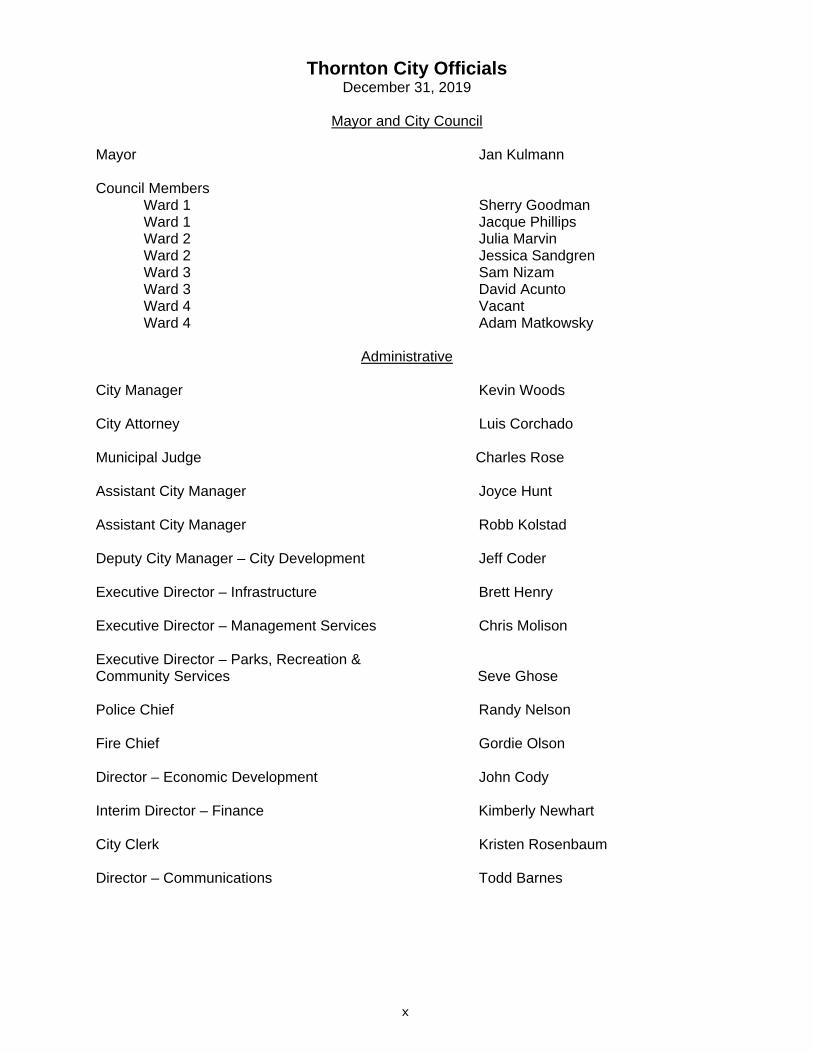
Thornton City Officials December 31, 2019
Mayor and City Council
Mayor Jan Kulmann
Council Members Ward 1 Sherry Goodman Ward 1 Jacque Phillips Ward 2 Julia Marvin Ward 2 Jessica Sandgren Ward 3 Sam Nizam Ward 3 David Acunto Ward 4 Vacant Ward 4 Adam Matkowsky
Administrative
City Manager Kevin Woods
City Attorney Luis Corchado
Municipal Judge Charles Rose
Assistant City Manager Joyce Hunt
Assistant City Manager Robb Kolstad
Deputy City Manager – City Development Jeff Coder
Executive Director – Infrastructure Brett Henry
Executive Director – Management Services Chris Molison
Executive Director – Parks, Recreation & Community Services Seve Ghose
Police Chief Randy Nelson
Fire Chief Gordie Olson
Director – Economic Development John Cody
Interim Director – Finance Kimberly Newhart
City Clerk Kristen Rosenbaum
Director – Communications Todd Barnes
x
Thornton Residents
Mayor and City Council
City Attorney City Manager
Police Community Services
Fire Infrastructure
Management Services
City Development
City Manager's Office
Economic Development
Finance
Municipal Judge
Boards and Commissions
City of Thornton Organization Chart
xi
xii
1
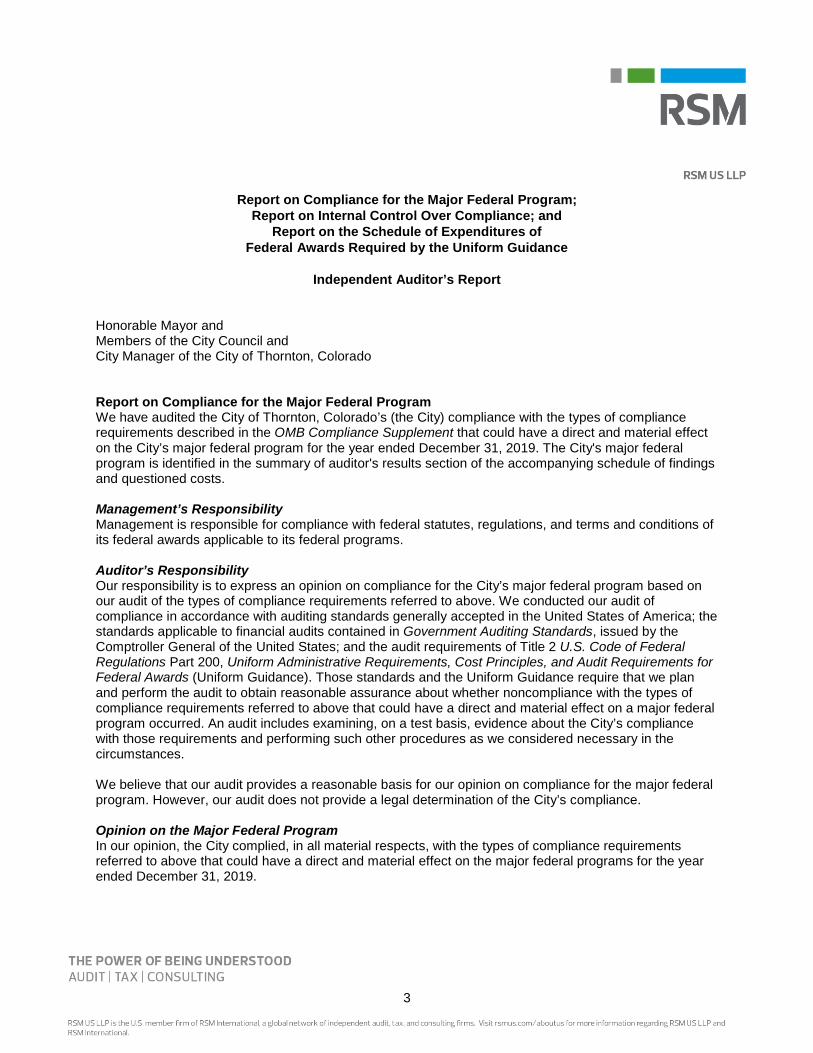
Independent Auditor's Report
Honorable Mayor and Members of the City Council City of Thornton, Colorado
Report on the Financial Statements We have audited the accompanying financial statements of the governmental activities, the business-type activities, each major fund, and the aggregate remaining fund information of the City of Thornton, Colorado (the City) as of and for the year ended December 31, 2019, and the related notes to the financial statements, which collectively comprise the City’s basic financial statements as listed in the table of contents.
Management’s Responsibility for the Financial Statements Management is responsible for the preparation and fair presentation of these financial statements in accordance with accounting principles generally accepted in the United States of America; this includes the design, implementation and maintenance of internal control relevant to the preparation and fair presentation of financial statements that are free from material misstatement, whether due to fraud or error.
Auditor’s Responsibility Our responsibility is to express opinions on these financial statements based on our audit. We conducted our audit in accordance with auditing standards generally accepted in the United States of America and the standards applicable to financial audits contained in Government Auditing Standards, issued by the Comptroller General of the United States. Those standards require that we plan and perform the audit to obtain reasonable assurance about whether the financial statements are free from material misstatement.
An audit involves performing procedures to obtain audit evidence about the amounts and disclosures in the financial statements. The procedures selected depend on the auditor’s judgment, including the assessment of the risks of material misstatement of the financial statements, whether due to fraud or error. In making those risk assessments, the auditor considers internal control relevant to the City’s preparation and fair presentation of the financial statements in order to design audit procedures that are appropriate in the circumstances, but not for the purpose of expressing an opinion on the effectiveness of the City’s internal control. Accordingly, we express no such opinion. An audit also includes evaluating the appropriateness of accounting policies used and the reasonableness of significant accounting estimates made by management, as well as evaluating the overall presentation of the financial statements.
We believe that the audit evidence we have obtained is sufficient and appropriate to provide a basis for our audit opinions.
Opinions In our opinion, the financial statements referred to above present fairly, in all material respects, the respective financial position of the governmental activities, the business-type activities, each major fund, and the aggregate remaining fund information of the City as of December 31, 2019, and the respective changes in financial position and, where applicable, cash flows thereof for the year then ended in accordance with accounting principles generally accepted in the United States of America.
2
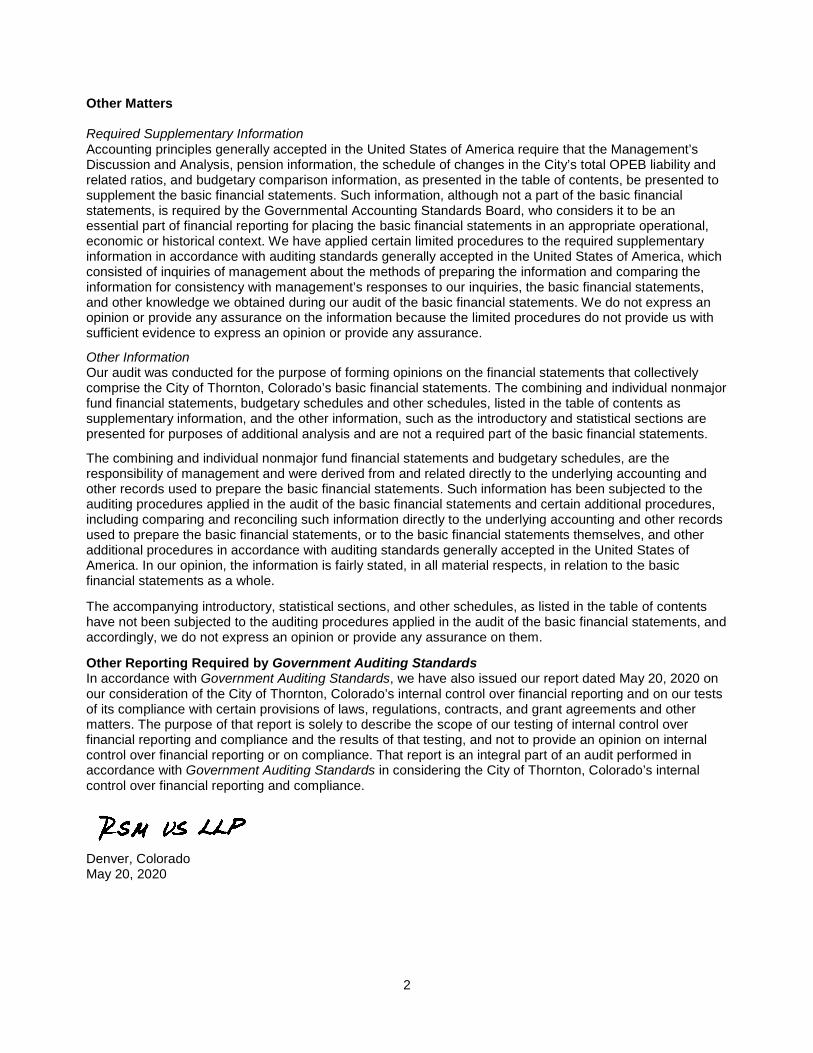
Other Matters Required Supplementary Information Accounting principles generally accepted in the United States of America require that the Management’s Discussion and Analysis, pension information, the schedule of changes in the City’s total OPEB liability and related ratios, and budgetary comparison information, as presented in the table of contents, be presented to supplement the basic financial statements. Such information, although not a part of the basic financial statements, is required by the Governmental Accounting Standards Board, who considers it to be an essential part of financial reporting for placing the basic financial statements in an appropriate operational, economic or historical context. We have applied certain limited procedures to the required supplementary information in accordance with auditing standards generally accepted in the United States of America, which consisted of inquiries of management about the methods of preparing the information and comparing the information for consistency with management’s responses to our inquiries, the basic financial statements, and other knowledge we obtained during our audit of the basic financial statements. We do not express an opinion or provide any assurance on the information because the limited procedures do not provide us with sufficient evidence to express an opinion or provide any assurance.
Other Information Our audit was conducted for the purpose of forming opinions on the financial statements that collectively comprise the City of Thornton, Colorado’s basic financial statements. The combining and individual nonmajor fund financial statements, budgetary schedules and other schedules, listed in the table of contents as supplementary information, and the other information, such as the introductory and statistical sections are presented for purposes of additional analysis and are not a required part of the basic financial statements.
The combining and individual nonmajor fund financial statements and budgetary schedules, are the responsibility of management and were derived from and related directly to the underlying accounting and other records used to prepare the basic financial statements. Such information has been subjected to the auditing procedures applied in the audit of the basic financial statements and certain additional procedures, including comparing and reconciling such information directly to the underlying accounting and other records used to prepare the basic financial statements, or to the basic financial statements themselves, and other additional procedures in accordance with auditing standards generally accepted in the United States of America. In our opinion, the information is fairly stated, in all material respects, in relation to the basic financial statements as a whole. The accompanying introductory, statistical sections, and other schedules, as listed in the table of contents have not been subjected to the auditing procedures applied in the audit of the basic financial statements, and accordingly, we do not express an opinion or provide any assurance on them. Other Reporting Required by Government Auditing Standards In accordance with Government Auditing Standards, we have also issued our report dated May 20, 2020 on our consideration of the City of Thornton, Colorado’s internal control over financial reporting and on our tests of its compliance with certain provisions of laws, regulations, contracts, and grant agreements and other matters. The purpose of that report is solely to describe the scope of our testing of internal control over financial reporting and compliance and the results of that testing, and not to provide an opinion on internal control over financial reporting or on compliance. That report is an integral part of an audit performed in accordance with Government Auditing Standards in considering the City of Thornton, Colorado’s internal control over financial reporting and compliance.
Denver, Colorado May 20, 2020
City of Thornton, Colorado Management’s Discussion and Analysis
December 31, 2019 As management of the City of Thornton (“the City”), we offer readers of the City’s financial statements this narrative overview and analysis of the financial activities of the City for the fiscal year ended December 31, 2019. We encourage readers to consider the information presented here in conjunction with additional information that we have furnished in our letter of transmittal at the front of this report, and the City’s financial statements that follow this section. Financial Highlights The City’s assets and deferred outflows of resources exceeded its liabilities and deferred inflows of resources at
the close of the most recent fiscal year by $1,338,126,618. This total is divided between Governmental Activities of $435,669,727 and Business-type Activities of $902,456,891.
The City’s total net position increased by $92,987,845. This total is divided between a decrease in Governmental Activities of $8,076,296 and an increase in Business-type Activities of $101,064,141.
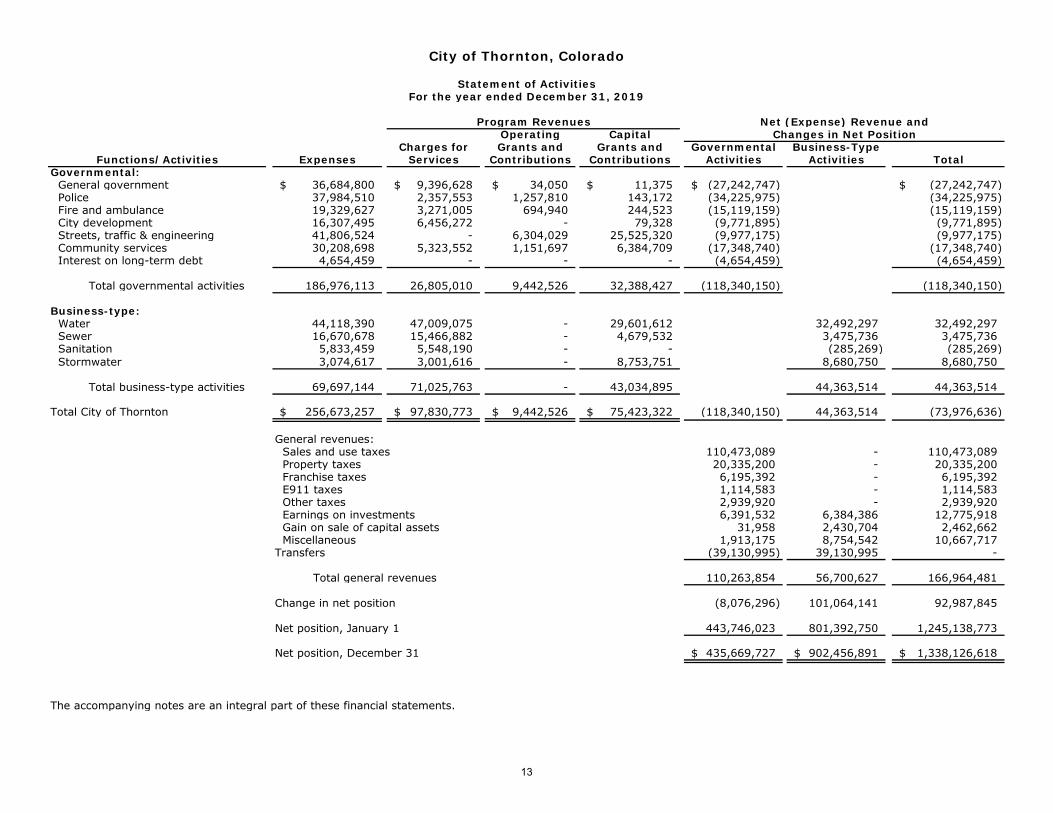
The City’s Governmental Activities show revenues of $218,030,812. The largest revenue source is sales and use taxes ($110,473,089) followed by capital grants and contributions ($32,388,427) and charges for services ($26,805,010). Charges for services consists of license, permits and inspection fees ($6,478,463, 24.2%), the administrative fee charged to the enterprise funds ($8,232,306 30.7%), recreation and related charges ($5,322,912, 19.9%), ambulance charges ($3,174,936, 11.8%), fines and forfeitures ($2,230,512, 8.3%), and other miscellaneous charges ($1,365,881, 5.1%). The Governmental expenses were $226,107,108. More details are provided in the Government-wide Financial Analysis section.
The City’s Business-type Activities show revenues of $170,761,285 the largest revenue source is charges for services ($71,025,763) followed by capital grants and contributions ($43,034,895). Capital grants and contributions consists of payments for connections to the City’s water and sewer systems ($20,492,203, 47.6%), infrastructure donated to the City by developers ($18,852,316, 43.8%) and grants ($3,690,376, 8.6%). The Business-type expenses were $69,697,144. More details are provided in the Government-wide Financial Analysis section.
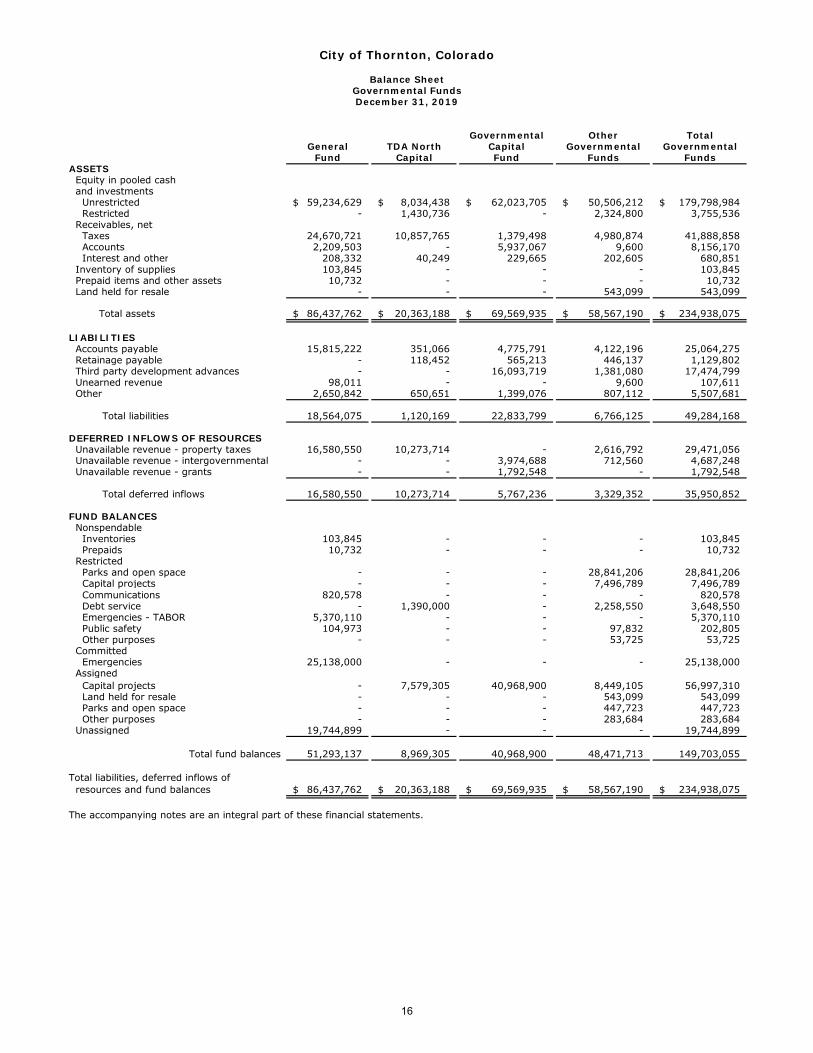
The total fund balance for the General Fund increased by $12,014,479, (30.6%) from prior year. City Council policy requires the General Fund to maintain a total fund balance at an amount equal to 17% of the current year budget, and TABOR reserve per State Statute. At the end of the current fiscal year, total fund balance was $51,293,137, or 37.6% of General Fund budgeted expenditures.
Overview of the Financial Statements This discussion and analysis is intended to serve as an introduction to the City’s basic financial statements. The City’s basic financial statements comprise three components: 1) government-wide financial statements, 2) fund financial statements, and 3) notes to the financial statements. This report also contains other supplementary information in addition to the basic financial statements themselves. Government-wide financial statements. The government-wide financial statements are designed to provide readers with a broad view of the City’s finances, in a manner similar to a private-sector business. The statement of net position presents information on all of the City’s assets and deferred outflows of resources and liabilities and deferred inflows of resources, with the difference reported as net position. Over time, increases or decreases in net position may serve as a useful indicator of whether the financial position of the City is improving or deteriorating. The statement of activities presents information showing how the government’s net position changed during the most recent fiscal year. All changes in net position are reported as soon as the underlying event giving rise to the change occurs, regardless of the timing of related cash flows. Thus, revenues and expenses are reported in this statement for some items that will only result in cash flows in future fiscal periods (e.g., uncollected taxes and earned but unused vacation leave). Both of the government-wide financial statements distinguish functions of the City that are principally supported by taxes and intergovernmental revenues (governmental activities) from other functions that are intended to recover all or a significant portion of their costs through user fees and charges (business-type activities). The governmental activities of the City include general government, police, fire, city development, streets traffic and engineering, and community services. The business-type activities of the City include water, sewer, sanitation, and stormwater. The government-wide financial statements can be found on pages 12-13 of this report. 3
City of Thornton, Colorado Management’s Discussion and Analysis
December 31, 2019 Fund financial statements. A fund is a grouping of related accounts that is used to maintain control over resources that have been segregated for specific activities or objectives. The City, like other state and local governments, uses fund accounting to ensure and demonstrate compliance with finance-related legal requirements. All of the funds of the City can be divided into three categories: governmental funds, proprietary funds, and fiduciary funds. Governmental funds. Governmental funds are used to account for essentially the same functions reported as governmental activities in the government-wide financial statements. However, unlike the government-wide financial statements, governmental fund financial statements focus on near-term inflows and outflows of spendable resources, as well as on balances of spendable resources available at the end of the fiscal year. Such information may be useful in evaluating a government’s near-term financing requirements. Because the focus of governmental funds is narrower than that of the government-wide financial statements, it is useful to compare the information presented for governmental funds with similar information presented for governmental activities in the government-wide financial statements. By doing so, readers may better understand the long-term impact of the government’s near-term financing decisions. Both the governmental fund balance sheet and the governmental fund statement of revenues, expenditures, and changes in fund balances provide a reconciliation to facilitate this comparison between governmental funds and governmental activities. The City maintained 15 individual governmental funds in 2019, of which 3 are considered major funds: the General Fund, the Governmental Capital Fund, and the Thornton Development Authority North Capital Fund. Information for these three funds is presented separately in the governmental fund balance sheet and in the governmental fund statement of revenues, expenditures, and changes in fund balances. The remaining 12 funds are combined into a single aggregated presentation. Individual fund data for each of these non-major governmental funds is provided in the form of combining statements elsewhere in this report. The City adopts an annual appropriated budget for its General Fund. A budgetary comparison statement has been provided for the General Fund to demonstrate compliance with this budget, which can be found on page 64 of this report. The basic governmental fund financial statements can be found on pages 16-19 of this report. Proprietary funds. The City maintained two different types of proprietary funds: enterprise and internal service. Enterprise funds are used to report the same functions presented as business-type activities in the government-wide financial statements. The City uses enterprise funds to account for Water, Sewer, Sanitation, and Stormwater. Internal service funds are an accounting device used to accumulate and allocate costs internally among the City’s various functions. The City uses one internal service fund: Risk Management to account for the costs related to a comprehensive program to manage the City’s property, liability, work related injury risk, dental and vision. Because Risk Management predominately benefits governmental rather than business-type functions, it has been included within governmental activities in the government-wide financial statements. Proprietary funds provide the same type of information as the government-wide financial statements, only in more detail. The proprietary fund financial statements provide separate information for the Water, Sewer, Sanitation, and Stormwater Funds. The Water, Sewer and Stormwater Funds are considered to be major funds of the City. Individual fund data for the internal service fund is provided in the form of combining statements elsewhere in this report. The basic proprietary fund financial statements can be found on pages 20-25 of this report. Notes to the financial statements. The notes provide additional information that is essential to a full understanding of the data provided in the government-wide and fund financial statements. The notes to the financial statements can be found on pages 26-60 of this report.Other information. In addition to the basic financial statements and accompanying notes, this report also presents certain supplementary information. The combining statements referred to earlier in connection with non-major governmental funds and proprietary funds are presented immediately following the basic financial statements. Combining statements and budgetary schedules can be found on pages 73-112 of this report. The Schedule of Investments and Local Highway Finance Report can be found in other schedules on pages 114-117 of this report. Government-wide Financial Analysis As noted earlier, net position may serve over time as a useful indicator of a government’s financial position. Assets exceeded liabilities by $1,338,126,618 at the close of the most recent fiscal year (see Table 1).
4
City of Thornton, Colorado Management’s Discussion and Analysis
December 31, 2019 Government-wide Financial Analysis (Continued) By far the largest portion of the City’s net position (74.8%) reflects its net investment in capital assets (e.g., land, buildings, machinery, and equipment), less any related debt used to acquire those assets to provide services to citizens; consequently, these assets are not available for future spending. Although the City’s investment in its capital assets is reported net of related debt, it should be noted that the resources needed to repay this debt must be provided from other sources, since the capital assets themselves cannot be used to liquidate these liabilities. An additional portion of the City’s net position (2.8%) represents resources that are subject to external restrictions on how they may be used. The remaining balance of unrestricted net position ($299,037,864) may be used to meet the government’s ongoing obligations to citizens and creditors. At the end of the current fiscal year, the City is able to report positive balances of net position, both for the government as a whole, as well as for its separate governmental and business-type activities.
Total net position 435,669,727$ 443,746,023$ 902,456,891$ 801,392,750$ 1,338,126,618$ 1,245,138,773$
Table 1Net Position
As of December 31,
The government’s net position increased by $92,987,845 during the current fiscal year. This increase is primarily due to revenues exceeding expenses (188.9%) for business-type activities, which are explained below. Governmental activities. Below is information regarding Governmental activities (see Table 2). Governmental activities decreased the City’s net position by $8,076,296. The primary factor to this decrease was
a one-time transfer of $39,130,995 in capital assets, net of depreciation, out of the general fund to establish the stormwater fund.
Governmental revenues increased by $21,129,590, (10.7%) from 2018, this increase is primarily related to charges for services and capital grants and contributions. Charges for services ($6,471,565), primarily driven by the first full year of operations for Thorncreek Golf Course after renovations; capital grants and contributions ($6,497,738), and investment earnings ($3,196,014) represent the largest increases for a total of $16,165,317. Overall the City experienced growth or was flat in all program and general revenue categories for a strong 2019.
Governmental expenses increased by $22,807,473 (13.9%) from 2018. The majority of this increase was related to the internal service funds; Information Technology, Reprographics, and Maintenance Services ($7,650,946; 685,440; 5,287,159) reporting in the general fund beginning 2019. These increases were offset by a decrease in Police expenditures of ($3,110,540) primarily related to a change in assumptions and the allocation of pension income ($3,367,866).
5
City of Thornton, Colorado Management’s Discussion and Analysis
Total expenses 186,976,113 164,168,640 69,697,144 65,514,015 256,673,257 229,682,655
Increase in net position before transfers 31,054,699 32,732,582 61,933,146 51,770,300 92,987,845 84,502,882
Transfers (39,130,995) - 39,130,995 - - -
Increase (decrease) in net position (8,076,296) 32,732,582 101,064,141 51,770,300 92,987,845 84,502,882
Net position, Jan 1 443,746,023 411,013,441 801,392,750 749,622,450 1,245,138,773 1,160,635,891
Net position, Dec 31 435,669,727$ 443,746,023$ 902,456,891$ 801,392,750$ 1,338,126,618$ 1,245,138,773$
6
City of Thornton, Colorado Management’s Discussion and Analysis
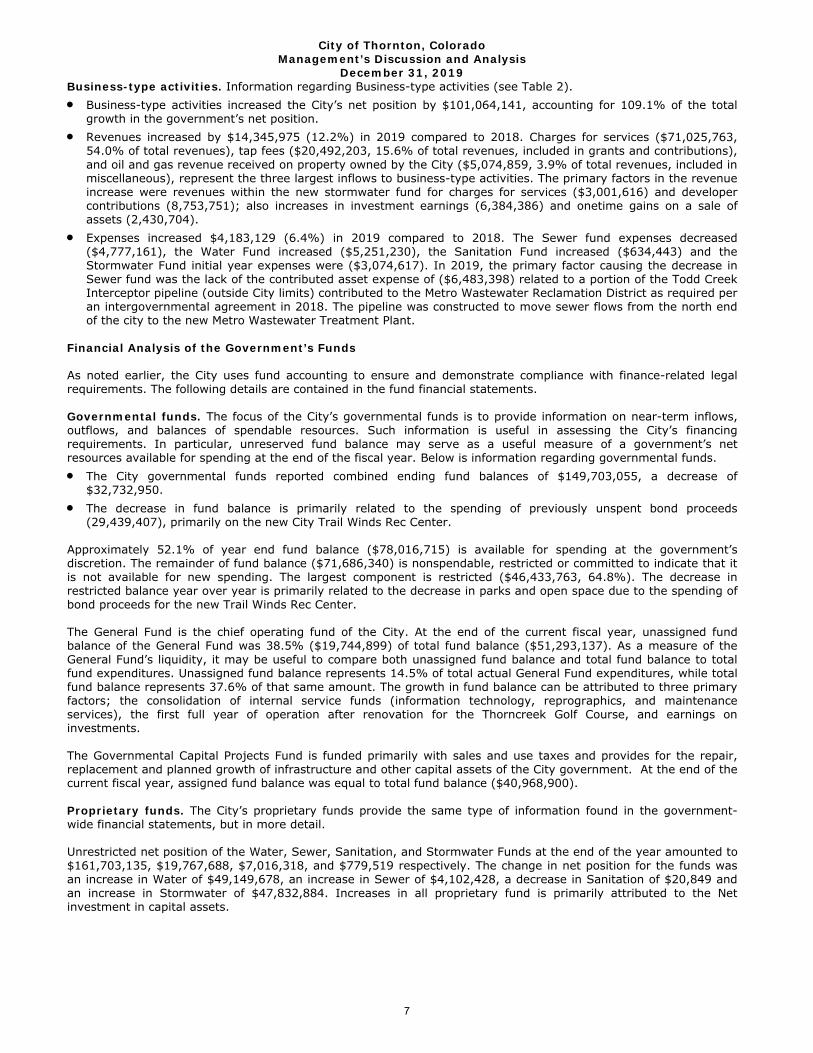
December 31, 2019 Business-type activities. Information regarding Business-type activities (see Table 2). Business-type activities increased the City’s net position by $101,064,141, accounting for 109.1% of the total
growth in the government’s net position. Revenues increased by $14,345,975 (12.2%) in 2019 compared to 2018. Charges for services ($71,025,763,
54.0% of total revenues), tap fees ($20,492,203, 15.6% of total revenues, included in grants and contributions), and oil and gas revenue received on property owned by the City ($5,074,859, 3.9% of total revenues, included in miscellaneous), represent the three largest inflows to business-type activities. The primary factors in the revenue increase were revenues within the new stormwater fund for charges for services ($3,001,616) and developer contributions (8,753,751); also increases in investment earnings (6,384,386) and onetime gains on a sale of assets (2,430,704).
Expenses increased $4,183,129 (6.4%) in 2019 compared to 2018. The Sewer fund expenses decreased ($4,777,161), the Water Fund increased ($5,251,230), the Sanitation Fund increased ($634,443) and the Stormwater Fund initial year expenses were ($3,074,617). In 2019, the primary factor causing the decrease in Sewer fund was the lack of the contributed asset expense of ($6,483,398) related to a portion of the Todd Creek Interceptor pipeline (outside City limits) contributed to the Metro Wastewater Reclamation District as required per an intergovernmental agreement in 2018. The pipeline was constructed to move sewer flows from the north end of the city to the new Metro Wastewater Treatment Plant.
Financial Analysis of the Government’s Funds As noted earlier, the City uses fund accounting to ensure and demonstrate compliance with finance-related legal requirements. The following details are contained in the fund financial statements. Governmental funds. The focus of the City’s governmental funds is to provide information on near-term inflows, outflows, and balances of spendable resources. Such information is useful in assessing the City’s financing requirements. In particular, unreserved fund balance may serve as a useful measure of a government’s net resources available for spending at the end of the fiscal year. Below is information regarding governmental funds. The City governmental funds reported combined ending fund balances of $149,703,055, a decrease of
$32,732,950. The decrease in fund balance is primarily related to the spending of previously unspent bond proceeds
(29,439,407), primarily on the new City Trail Winds Rec Center. Approximately 52.1% of year end fund balance ($78,016,715) is available for spending at the government’s discretion. The remainder of fund balance ($71,686,340) is nonspendable, restricted or committed to indicate that it is not available for new spending. The largest component is restricted ($46,433,763, 64.8%). The decrease in restricted balance year over year is primarily related to the decrease in parks and open space due to the spending of bond proceeds for the new Trail Winds Rec Center. The General Fund is the chief operating fund of the City. At the end of the current fiscal year, unassigned fund balance of the General Fund was 38.5% ($19,744,899) of total fund balance ($51,293,137). As a measure of the General Fund’s liquidity, it may be useful to compare both unassigned fund balance and total fund balance to total fund expenditures. Unassigned fund balance represents 14.5% of total actual General Fund expenditures, while total fund balance represents 37.6% of that same amount. The growth in fund balance can be attributed to three primary factors; the consolidation of internal service funds (information technology, reprographics, and maintenance services), the first full year of operation after renovation for the Thorncreek Golf Course, and earnings on investments. The Governmental Capital Projects Fund is funded primarily with sales and use taxes and provides for the repair, replacement and planned growth of infrastructure and other capital assets of the City government. At the end of the current fiscal year, assigned fund balance was equal to total fund balance ($40,968,900). Proprietary funds. The City’s proprietary funds provide the same type of information found in the government-wide financial statements, but in more detail. Unrestricted net position of the Water, Sewer, Sanitation, and Stormwater Funds at the end of the year amounted to $161,703,135, $19,767,688, $7,016,318, and $779,519 respectively. The change in net position for the funds was an increase in Water of $49,149,678, an increase in Sewer of $4,102,428, a decrease in Sanitation of $20,849 and an increase in Stormwater of $47,832,884. Increases in all proprietary fund is primarily attributed to the Net investment in capital assets. 7
City of Thornton, Colorado Management’s Discussion and Analysis
December 31, 2019 General Fund Budgetary Highlights Combined revenues (General Fund and Governmental Capital Fund) were greater than budgetary estimates and General Fund expenditures were less than appropriations. The majority of governmental sales and use tax, 86.9% ($96,040,191) is available for General Fund operations and capital projects. In 2019, the City utilized sales and use tax revenue as needed in the General Fund, the remainder of this available revenue was accumulated in the Governmental Capital Fund to prepare for planned improvements and expansion of infrastructure and community facilities. General Fund expenditures were under budget by $700,025 in 2019 primarily related to lower than anticipated spending on salaries and related benefits for the new Trail Winds Recreation Center. Capital Asset and Debt Administration Capital assets. The City’s investment in capital assets for its governmental and business-type activities as of December 31, 2019 amounts to $1,148,642,941 (net of accumulated depreciation). This investment in capital assets includes land and water rights, building and improvements, leisure areas and improvements, general equipment, and infrastructure (see Table 3). Major capital asset events during the current fiscal year included the following:
Governmental capital assets increased in the current year by $12,597,839 net of accumulated depreciation. The majority of this increase was related to the new Trail Winds Recreation Center ($41,263,247) that opened in November 2019, located at 136th and Holly Street. This is a state of the art recreation facilities with aquatics area that will provide service to the northern areas of the community. The City also added ($18,751,240) of contributed capital related to development. The governmental capital assets were decreased by a transfer of assets, net of depreciation, $39,130,995 out of the general fund to the stormwater fund. Spending in 2019 that was carried in construction in progress was related to the new Active Adult Center (5,945,788), Fire Station #1 ($2,640,495), the City’s replacement of the existing Fire Station #1, and the widening of two major arteries through the City ($8,684,481), the widening of 112th Ave and 136th and Holly St. intersection.
Proprietary capital assets increased by $102,392,097 net of accumulated depreciation. The majority of the increase was related to costs associated with the Thornton Water Treatment Plant replacement project ($39,532,496) and the transfer of assets from general fund to stormwater (39,130,995). Construction began on the new water treatment plant to replace the Thornton Treatment Plant, which is more than 55 years old and nearing its useful life. The stormwater fund was opened in 2019 for the purpose of tracking and managing the infrastructure moving storm water safely through the City.
Additional information on the City’s capital assets can be found in note E on pages 36-37 of this report.
Land, water and land rights 49,968,248$ 49,338,858$ 203,738,894$ 202,213,365$ 253,707,142$ 251,552,223$
Source of supply - - 128,513,466 129,250,941 128,513,466 129,250,941
Water treatment plant - - 56,000,939 55,383,974 56,000,939 55,383,974
Collection, transmission, & distribution - - 245,630,355 191,017,896 245,630,355 191,017,896
Streets, traffic, and engineering 140,209,807 168,220,951 - - 140,209,807 168,220,951
Buildings, structures and improvements 108,558,910 66,790,230 14,593,216 13,936,310 123,152,126 80,726,540
Leisure areas and improvements 50,184,782 41,723,725 - - 50,184,782 41,723,725
General equipment 22,167,586 23,320,780 7,231,146 6,562,585 29,398,732 29,883,365
Construction in progress 27,087,642 36,184,592 94,757,950 49,708,799 121,845,592 85,893,391
Total 398,176,975$ 385,579,136$ 750,465,966$ 648,073,870$ 1,148,642,941$ 1,033,653,006$
8
City of Thornton, Colorado Management’s Discussion and Analysis
December 31, 2019 Long-term debt. At the end of the current fiscal year, the City had total debt outstanding of $141,375,000 (see Table 4). The City’s debt represents certificates of participation of $72,960,000 and revenue bonds of $68,415,000. The revenue bonds outstanding are comprised of three issues: $10,360,000 related to the Thornton Development Authority Tax Increment Revenue Refunding Bonds, Series 2015, serviced by 50% of the property tax increment and 50% of the general sales tax collected within the boundaries of that urban renewal plan area, $25,025,000 related to the Thornton Development Authority Tax Increment Revenue Bonds, Series 2015B, serviced by 100% of the property tax increment and general sales tax generated from the annually determined pledged sales tax rate, both net of other obligations, collected within the boundaries of that plan area, and $33,030,000 related to Water Enterprise Revenue Refunding Bonds supported by a pledge of charges for services of the Water Fund.
The City’s total debt decreased by $7,670,000 (5.1%) during the current fiscal year due to debt service payments throughout the year.
In 2019, the Standard & Poor’s rating on the Water Enterprise Revenue Refunding Bonds, Series 2013, was AA; on the Certificates of Participation S2007 and S2018 was AA-, and on the Tax Increment Bonds, Series 2015 and 2015B, was A+. In 2019, Moody’s rated the Water Revenue Refunding Bonds Series 2013, Aa2, and the Certificates of Participation, Aa3. The Tax Increment Bonds, Series 2015 and 2015B were not rated by Moody’s.
Table 4Outstanding Debt (Revenue Bonds and Certificates of Participation)
Certificates of participation 72,960,000 77,480,000 - - 72,960,000 77,480,000
Total 108,345,000$ 114,455,000$ 33,030,000$ 34,590,000$ 141,375,000$ 149,045,000$
Additional information on the City’s long-term debt activity can be found on pages 38-42 of this report.
Economic Factors and Next Year’s Budgets and Rates The December 31, 2019 unemployment rate for the City was 2.4%, which is lower than last year. The City has
the same unemployment rate as the state, is lower than the county’s (Adams) rate of 2.5%, and lower than thenational rate of 3.5%.
The national inflation rate increased in 2019 to 2.57% from 2.4% in 2018. The Consumer Price Index for theDenver area decreased in 2019 to 2.67% from 2.7% in 2018.
In 2019, the City’s occupancy rate is approximately 90.9% for retail space, 88.4% for office space and 86.6% forindustrial space.
The City’s population has increased by 3,279 people. The City’s yield on cash and investments increased slightly to 2.29% in 2019. The current projection for 2020’s
rate is 1.25%. The City invests available funds with safety as the primary goal.
All of these factors were considered in preparing the City’s budget for the 2020 fiscal year.
Ending unassigned fund balance in the General Fund was $19,744,899. Anticipated revenues and the use of this fund balance are expected to be adequate to fund necessary governmental operations and to keep the fund balance in harmony with the City Council’s fund balance policy.
Requests for Information
This financial report is designed to provide a general overview of the City’s finances for all those with an interest in the government’s finances. Questions concerning any of the information provided in this report or requests for additional financial information should be addressed to the City Treasurer, City of Thornton, 9500 Civic Center Drive, Thornton, CO 80229 or visit the City’s website at www.thorntonco.gov.
9
This Page Left Intentionally Blank
10
11
Governmental Business-typeActivities Activities Total
ASSETS Equity in pooled cash and investments 185,066,650$ 183,675,033$ 368,741,683$ Receivables, net Taxes 41,888,858 - 41,888,858 Accounts 8,335,312 10,050,622 18,385,934 Interest and other 700,664 809,703 1,510,367 Inventory of supplies 103,845 - 103,845 Prepaids and other assets 10,732 102,756 113,488 Land held for resale 543,099 142,379 685,478 Restricted assets Equity in pooled cash and investments 3,755,536 3,097,247 6,852,783 Net pension asset 1,178,999 - 1,178,999 Capital assets Land, water rights, and construction in progress 77,055,890 427,010,310 504,066,200 Depreciable buildings, property, and equipment, net 321,121,085 323,455,656 644,576,741
Total assets 639,760,670 948,343,706 1,588,104,376
DEFERRED OUTFLOWS OF RESOURCES Deferred charge on refunding - 1,719,728 1,719,728 Deferred outflow related to ARO 358,882 45,000 403,882 Deferred outflow related to OPEB 797,995 130,678 928,673 Deferred outflow related to pension 18,806,536 - 18,806,536
Total deferred outflows of resources 19,963,413 1,895,406 21,858,819
LIABILITIES Accounts payable 25,251,599 5,521,092 30,772,691 Retainage payable 1,129,802 3,534,045 4,663,847 Accrued interest payable 397,976 102,854 500,830 Third party development advances 17,474,799 - 17,474,799 Unearned revenue 107,611 126,470 234,081 Other 5,507,681 184,915 5,692,596 Noncurrent liabilities Due within one year 11,135,756 2,016,440 13,152,196 Due in more than one year Due in more than one year - other 115,966,657 35,624,734 151,591,391 Due in more than one year - Total OPEB liability 3,849,677 630,515 4,480,192 Due in more than one year - Net pension liability 8,172,824 - 8,172,824
Total liabilities 188,994,382 47,741,065 236,735,447
DEFERRED INFLOWS OF RESOURCES Deferred revenue - property tax 29,471,056 - 29,471,056 Deferred gain on refunding 34,192 - 34,192 Deferred inflows related to OPEB 251,234 41,156 292,390 Deferred inflows related to pensions 5,303,492 - 5,303,492
Total deferred inflows of resources 35,059,974 41,156 35,101,130
NET POSITION Net investment in capital assets 288,245,136 713,190,231 1,001,435,367 Restricted for Capital projects 7,496,789 - 7,496,789 Communications 820,578 - 820,578 Emergencies 5,370,110 - 5,370,110 Net pension asset 1,178,999 - 1,178,999 Parks and open space 22,430,381 - 22,430,381 Public safety 202,805 - 202,805 Other purposes 153,725 - 153,725 Unrestricted 109,771,204 189,266,660 299,037,864
Total net position 435,669,727$ 902,456,891$ 1,338,126,618$
The accompanying notes are an integral part of these financial statements.
City of Thornton, Colorado
Statement of Net PositionDecember 31, 2019
12
Operating CapitalCharges for Grants and Grants and Governmental Business-Type
Functions/Activities Expenses Services Contributions Contributions Activities Activities TotalGovernmental: General government 36,684,800$ 9,396,628$ 34,050$ 11,375$ (27,242,747)$ (27,242,747)$ Police 37,984,510 2,357,553 1,257,810 143,172 (34,225,975) (34,225,975) Fire and ambulance 19,329,627 3,271,005 694,940 244,523 (15,119,159) (15,119,159) City development 16,307,495 6,456,272 - 79,328 (9,771,895) (9,771,895) Streets, traffic & engineering 41,806,524 - 6,304,029 25,525,320 (9,977,175) (9,977,175) Community services 30,208,698 5,323,552 1,151,697 6,384,709 (17,348,740) (17,348,740) Interest on long-term debt 4,654,459 - - - (4,654,459) (4,654,459)
Total governmental activities 186,976,113 26,805,010 9,442,526 32,388,427 (118,340,150) (118,340,150)
Total business-type activities 69,697,144 71,025,763 - 43,034,895 44,363,514 44,363,514
Total City of Thornton 256,673,257$ 97,830,773$ 9,442,526$ 75,423,322$ (118,340,150) 44,363,514 (73,976,636)
General revenues: Sales and use taxes 110,473,089 - 110,473,089 Property taxes 20,335,200 - 20,335,200 Franchise taxes 6,195,392 - 6,195,392 E911 taxes 1,114,583 - 1,114,583 Other taxes 2,939,920 - 2,939,920 Earnings on investments 6,391,532 6,384,386 12,775,918 Gain on sale of capital assets 31,958 2,430,704 2,462,662 Miscellaneous 1,913,175 8,754,542 10,667,717 Transfers (39,130,995) 39,130,995 -
Total general revenues 110,263,854 56,700,627 166,964,481
Change in net position (8,076,296) 101,064,141 92,987,845
Net position, January 1 443,746,023 801,392,750 1,245,138,773
Net position, December 31 435,669,727$ 902,456,891$ 1,338,126,618$
The accompanying notes are an integral part of these financial statements.
Changes in Net Position
City of Thornton, Colorado
Statement of ActivitiesFor the year ended December 31, 2019
Program Revenues Net (Expense) Revenue and
13
This Page Left Intentionally Blank
14
15
City of Thornton, Colorado
Balance SheetGovernmental FundsDecember 31, 2019
Governmental Other TotalGeneral TDA North Capital Governmental Governmental
Fund Capital Fund Funds FundsASSETS Equity in pooled cash and investments Unrestricted 59,234,629$ 8,034,438$ 62,023,705$ 50,506,212$ 179,798,984$ Restricted - 1,430,736 - 2,324,800 3,755,536 Receivables, net Taxes 24,670,721 10,857,765 1,379,498 4,980,874 41,888,858 Accounts 2,209,503 - 5,937,067 9,600 8,156,170 Interest and other 208,332 40,249 229,665 202,605 680,851 Inventory of supplies 103,845 - - - 103,845 Prepaid items and other assets 10,732 - - - 10,732 Land held for resale - - - 543,099 543,099
Total assets 86,437,762$ 20,363,188$ 69,569,935$ 58,567,190$ 234,938,075$
LIABILITIES Accounts payable 15,815,222 351,066 4,775,791 4,122,196 25,064,275 Retainage payable - 118,452 565,213 446,137 1,129,802 Third party development advances - - 16,093,719 1,381,080 17,474,799 Unearned revenue 98,011 - - 9,600 107,611 Other 2,650,842 650,651 1,399,076 807,112 5,507,681
Total liabilities 18,564,075 1,120,169 22,833,799 6,766,125 49,284,168
Total deferred inflows 16,580,550 10,273,714 5,767,236 3,329,352 35,950,852
FUND BALANCES Nonspendable Inventories 103,845 - - - 103,845 Prepaids 10,732 - - - 10,732 Restricted Parks and open space - - - 28,841,206 28,841,206 Capital projects - - - 7,496,789 7,496,789 Communications 820,578 - - - 820,578 Debt service - 1,390,000 - 2,258,550 3,648,550 Emergencies - TABOR 5,370,110 - - - 5,370,110 Public safety 104,973 - - 97,832 202,805 Other purposes - - - 53,725 53,725 Committed Emergencies 25,138,000 - - - 25,138,000 Assigned Capital projects - 7,579,305 40,968,900 8,449,105 56,997,310 Land held for resale - - - 543,099 543,099 Parks and open space - - - 447,723 447,723 Other purposes - - - 283,684 283,684 Unassigned 19,744,899 - - - 19,744,899
Total fund balances 51,293,137 8,969,305 40,968,900 48,471,713 149,703,055
Total liabilities, deferred inflows of resources and fund balances 86,437,762$ 20,363,188$ 69,569,935$ 58,567,190$ 234,938,075$
The accompanying notes are an integral part of these financial statements.
16
City of Thornton, Colorado
Reconciliation of the Balance Sheet of Governmental Fundsto the Statement of Net Position
December 31, 2019
Total fund balances for governmental funds (page 16) 149,703,055$
Amounts reported for governmental activities in the statement of net position are different because:
Capital assets used in governmental activities are not financial resources and therefore are not reported in the funds. Those assets consist of: Land and land rights 49,968,248 Construction in progress 27,087,642 Streets, Traffic & Engineering, net of $235,016,751 accumulated depreciation 140,209,807 Buildings and improvements, net of $34,505,230 accumulated depreciation 108,558,910 Leisure areas & improvements, net of $48,146,441 accumulated depreciation 50,184,782 General equipment, net of $32,346,331 accumulated depreciation 22,167,586 Total capital assets 398,176,975
Net Pension Asset 1,178,999
Internal service funds are used by the City to account for the financing of goods or services provided by one department or agency to other departments or agencies. The assets and liabilities of the internal service funds are included in the governmental activities in the statement of net position. 352,766
Governmental funds report the effect of deferred charges on refunding debt when it is first issued, whereas these amounts are amortized over the life of the bonds in the government wide financial statements (34,192)
Long-term liabilities applicable to the City's governmental activities are not due and payable in the current period and accordingly are not reported as fund liabilities. Interest on long-term debt is not accrued in governmental funds, but rather is recognized as an expenditure when due. All liabilities - both current and long-term are reported in the statement of net position Balances at December 31, 2019 are: Accrued interest on bonds and certificates of participation (397,976) Bonds payable, net of unamortized premium (37,812,728) Obligation under certificates of participation (76,932,351) Obligation under capitalized leases (433,591) Total OPEB liability (3,831,888) Compensated absences (6,587,750) Net pension liability (8,172,824) Asset retirement obligation (425,000) Total long-term liabilities (134,594,108)
Deferred outflows related to asset retirement obligation 358,882
Deferred inflows related to unearned revenues are applicable to future periods and, therefore, are not reported in the funds: Deferred inflows related to intergovernmental 4,687,248 Deferred inflows related to grants 1,792,548
6,479,796
Deferred outflows and inflows of resources related to pensions and OPEB are applicable to future periods and, therefore, are not reported in the funds: Deferred outflows relating to OPEB 794,502 Deferred outflows relating to pensions 18,806,536 Deferred inflows relating to OPEB (249,992) Deferred inflows relating to pensions (5,303,492) Total deferred items 14,047,554
Total net position governmental activities (page 12) 435,669,727$
17
City of Thornton, Colorado
Statement of Revenues, Expenditures, and Changes in Fund BalancesGovernmental Funds
For the year ended December 31, 2019
Governmental Other TotalGeneral TDA North Capital Governmental Governmental
Fund Capital Fund Funds FundsREVENUES Taxes Sales and use 81,489,666$ 5,523,172$ 14,550,525$ 8,909,726$ 110,473,089$ Property 13,517,289 4,589,770 - 2,228,141 20,335,200 Franchise 6,195,392 - - - 6,195,392 E911 - - - 1,114,583 1,114,583 Other 2,935,501 - - 4,419 2,939,920 Licenses and permits 6,478,463 - - - 6,478,463 Intergovernmental 7,773,681 - 3,926,394 6,290,278 17,990,353 Governmental grants 1,545,248 - 1,718,022 642,164 3,905,434 Charges for services 17,452,032 - - - 17,452,032 Fines and forfeitures 2,230,512 - - - 2,230,512 Lease - - 175,701 - 175,701 Investment earnings 1,910,793 385,568 2,089,622 2,005,549 6,391,532 Miscellaneous 886,474 79,318 383,685 139,360 1,488,837
Total revenues 142,415,051 10,577,828 22,843,949 21,334,220 197,171,048
EXPENDITURES Current General government 32,344,427 - - - 32,344,427 Police 37,937,011 - - - 37,937,011 Fire and ambulance 19,750,199 - - - 19,750,199 City development 9,347,955 - - - 9,347,955 Streets, traffic and engineering 11,850,137 - 2,464,805 807,112 15,122,054 Community services 21,926,289 - - 91,117 22,017,406 Capital outlay 3,227,589 14,304,786 24,695,185 40,865,867 83,093,427 Debt service Principal retirement 114,346 920,000 3,282,467 1,907,534 6,224,347 Interest and bond fees 19,268 490,763 1,268,419 3,511,482 5,289,932
Total expenditures 136,517,221 15,715,549 31,710,876 47,183,112 231,126,758
Excess (deficiency) of revenues over (under) expenditures 5,897,830 (5,137,721) (8,866,927) (25,848,892) (33,955,710)
OTHER FINANCING SOURCES (USES) Transfers in 6,042,991 - 1,269,538 34,765 7,347,294 Transfers out (34,765) (4,049,241) - (2,229,541) (6,313,547) Sale of general capital assets 108,423 - 80,590 - 189,013
Total other financingsources (uses) 6,116,649 (4,049,241) 1,350,128 (2,194,776) 1,222,760
Net change in fund balances 12,014,479 (9,186,962) (7,516,799) (28,043,668) (32,732,950)
Fund balances, January 1 39,278,658 18,156,267 48,485,699 76,515,381 182,436,005
Fund balances, December 31 51,293,137$ 8,969,305$ 40,968,900$ 48,471,713$ 149,703,055$
The accompanying notes are an integral part of these financial statements.
18
Reconciliation of the Statement of Revenues, Expenditures, and Changes inFund Balances of Governmental Funds to the Statement of Activities
For the year ended December 31, 2019
Net change in fund balances - total governmental funds (page 18) (32,732,950)$
Amounts reported for governmental activities in the statement of activities are different because:
Governmental funds report capital outlays as expenditures. However, in the statement of activities the cost of those assets is allocated over their estimated useful lives and reported as depreciation expense. This is the amount by which capitalized capital outlays ($53,702,252) less work in progress deletions ($809,179), exceeded depreciation ($21,977,742) in the current period. 30,915,331
The net effect of various miscellaneous transactions involving capital assets is to decrease net position (contributions of $18,751,240 plus the gain of $31,958 less the revenue recognized at the fund level of $189,013 on the sale of capital assets, plus ISF $2,219,317 less $39,130,995 for assets, net of depreciation, transfered to the Stormwater fund). (18,317,493)
Repayment of bond and lease principal is reported as an expenditure in the governmental funds. However, the repayment reduces long-term liabilities on the Statement of Net Position, so this transaction has no effect on net position. Repayments: To bond holders 1,590,000 To Capital Asset Finance Corporation for certificates of participation 4,520,000 Obligation under capitalized leases 114,346 Net adjustment 6,224,346
The issuance of long-term debt provides current financial resources to governmental funds, while the repayment of the principal of long-term debt consumes the current financial resources of of governmental funds. Neither transaction, however, has any effect on net position. Also, governmental funds report the effect of premiums, discounts, and similar items when the debt is first issued, whereas these amounts are deferred and amortized in the Statement of Activities. This amount is the net effect of these difference in the treatment of long-term debt and related items. 372,859
Under the modified accrual basis of accounting used in the governmental funds, expenditures are not recognized for transactions that are not normally paid with expendable available financial resources. In the Statement of Activities, however, which is presented on the accrual basis, expenses and liabilities are reported regardless of when financial resources are available. In addition, interest on long-term debt is not recognized under the modified accrual basis of until due, rather than as it accrues. This adjustment combines the net changes: Adjustment to compensated absences (457,210) Accrued interest on bonds 262,614 Asset Retirment Obligation Expense (66,118) Combined adjustment (260,714)
Under the modified accrual basis of accounting used in the governmental funds, revenues are recognized when measurable and available. In the Statement of Activities, which is presented on the accrual basis, revenues are reported when earned regardless of availability. Intergovernmental revenues 338,904 Grant revenues 1,580,603 Combined adjustment 1,919,507
Other postemployment benefits and pension expenses were reported in the Government-Wide Statement of Activities, but they did not require the use of current financial resources. Therefore, the increase or decrease in the other postemployment benefit liability and the net pension liabilities were not reported as an expenditure or (credit) in the government funds. Other Postemployment benefit expenses (249,187) Pension Income 5,049,043
Internal Service Funds are used by the City to account for the financing of goods or services provided by one department or agency to other departments or agencies. The net revenues of the internal service funds are reported with governmental activities. (2,466,009) Internal Service Funds Transfer of 2018 Net Posistion to collapse Information Technology,
1,468,971 Reprographics and Maintence Services $2,502,717, less transfer out to General Fund ($1,033,746)
Change in net position governmental activities (page 13) (8,076,296)$
City of Thornton, Colorado
19
City of Thornton, Colorado
Statement of Net PositionProprietary Funds
December 31, 2019
Business-type Activities GovernmentalActivities
Other InternalEnterprise Service
Water Sewer Stormwater Funds Total Risk FundASSETSCurrent assets Equity in pooled cash and investments - unrestricted 155,284,870$ 20,034,998$ 912,543$ 7,442,622$ 183,675,033$ 5,267,666$ Equity in pooled cash and investments - restricted 3,097,247 - - - 3,097,247 - Receivables, net Accounts 7,898,150 1,636,324 93,641 422,507 10,050,622 179,142 Interest and other 602,326 75,065 3,003 26,868 707,262 19,813 Prepaids and other assets 102,756 - - - 102,756 - Land held for resale 142,379 - - - 142,379 -
Total current assets 167,127,728 21,746,387 1,009,187 7,891,997 197,775,299 5,466,621
Noncurrent assets Loan receivable, net of current portion 102,441 - - - 102,441 - Capital assets Land and water rights 203,411,247 327,647 - - 203,738,894 - Source of supply 128,513,466 - - - 128,513,466 - Water treatment plant 86,097,745 - - - 86,097,745 - Collection, transmission, and distribution 232,011,894 93,430,438 63,595,652 389,037,984 - Transportation equipment 1,890,320 1,320,252 1,340,781 4,657,784 9,209,137 - General equipment 9,240,443 1,407,679 835,849 598,646 12,082,617 - Buildings and improvements 21,730,438 2,428,376 - 684,752 24,843,566 - Less accumulated depreciation (129,091,495) (47,031,492) (18,913,753) (2,778,653) (197,815,393) - Construction in progress 93,019,797 1,542,547 195,606 - 94,757,950 -
Total noncurrent assets 646,926,296 53,425,447 47,054,135 3,162,529 750,568,407 -
Total assets 814,054,024 75,171,834 48,063,322 11,054,526 948,343,706 5,466,621
DEFERRED OUTFLOWS OF RESOURCES Deferred outflow related to OPEB 80,294 17,542 12,114 20,728 130,678 3,493 Deferred outflow related to ARO 45,000 - - - 45,000 - Deferred charge on refunding 1,719,728 - - - 1,719,728 -
Total deferred outflows of resources 1,845,022 17,542 12,114 20,728 1,895,406 3,493
The accompanying notes are an integral part of these financial statements.
Total operating expenses 42,877,399 16,670,678 3,074,617 5,833,459 68,456,153 6,496,040
Operating income (loss) 4,250,778 (1,201,795) (73,001) (262,891) 2,713,091 (160,583)
NONOPERATING REVENUES (EXPENSES) Gain (loss) on sale (disposal) of capital assets 2,477,056 (46,000) - (352) 2,430,704 - Interest income 5,450,162 670,691 21,139 242,394 6,384,386 177,291 Interest and bond amortization expense (1,240,991) - - - (1,240,991) - Miscellaneous, net 8,611,061 - - - 8,611,061 20,000
Total nonoperating revenues 15,297,288 624,691 21,139 242,042 16,185,160 197,291
Income (loss) before capital contributions and transfers 19,548,066 (577,104) (51,862) (20,849) 18,898,251 36,708
Grants and capital contributions 29,601,612 4,679,532 47,884,746 - 82,165,890 - Transfers out - - - - - (2,502,717)
Change in net position 49,149,678 4,102,428 47,832,884 (20,849) 101,064,141 (2,466,009)
Net position, January 1 722,160,892 69,032,162 - 10,199,696 801,392,750 2,818,775
Net position, December 31 771,310,570$ 73,134,590$ 47,832,884$ 10,178,847$ 902,456,891$ 352,766$
The accompanying notes are an integral part of these financial statements.
Enterprise Funds
22
This Page Left Intentionally Blank
23
City of Thornton, Colorado
Statement of Cash FlowsProprietary Funds
For the year ended December 31, 2019
Business-type Activities GovernmentalActivities
Other InternalEnterprise Service
Water Sewer Stormwater Funds Total Risk FundCASH FLOWS FROM OPERATING ACTIVITIES Receipts from customers and others 50,495,597$ 15,488,482$ 2,907,975$ 5,574,087$ 74,466,141$ -$ Receipts from interfund services - - - - - 6,353,757 Payments to suppliers (23,481,816) (12,630,481) (1,038,781) (2,574,071) (39,725,149) (5,447,456) Payments to employees (9,983,926) (1,160,687) (779,181) (2,071,860) (13,995,654) (598,917) Net cash provided by operating activities 17,029,855 1,697,314 1,090,013 928,156 20,745,338 307,384
CASH FLOWS FROM NONCAPITAL FINANCING ACTIVITIES Grant 27,705 - - - 27,705 - Receipts from nonoperating leases 5,158,668 - - - 5,158,668 - Net cash provided by (used in) noncapital financing activities 5,186,373 - - - 5,186,373 (889,344)
CASH FLOWS FROM CAPITAL AND RELATED FINANCING ACTIVITIES Purchases and construction of capital assets (54,010,930) (1,920,304) (195,606) (483,838) (56,610,678) - Proceeds from sale of capital assets 3,244,472 1,556 - - 3,246,028 - Principal paid on bonds and other obligations (1,560,000) - - - (1,560,000) - Interest and fees paid on capital debt (1,296,919) - - - (1,296,919) - Capital contributions 18,964,003 1,528,200 - - 20,492,203 - Net cash used in capital and related financing activities (34,659,374) (390,548) (195,606) (483,838) (35,729,366) -
CASH FLOWS FROM INVESTING ACTIVITIES Proceeds from sale of investments 133,250,964 14,927,540 143,103 5,563,452 153,885,059 3,964,877 Purchases of investments (138,942,570) (17,579,823) (815,391) (6,523,125) (163,860,909) (4,631,419) Interest on investments 5,314,174 648,340 18,136 235,257 6,215,907 171,478 Net cash used in investing activities (377,432) (2,003,943) (654,152) (724,416) (3,759,943) (495,064)
Net decrease in cash and cash equivalents (12,820,578) (697,177) 240,255 (280,098) (13,557,598) (1,077,024)
Cash and cash equivalents 40,963,930$ 5,182,957$ 240,255$ 1,923,248$ 48,310,390$ 1,365,365$ Investments 117,418,187 14,852,041 672,288 5,519,374 138,461,890 3,902,301 Total cash and investments 158,382,117$ 20,034,998$ 912,543$ 7,442,622$ 186,772,280$ 5,267,666$
Equity in pooled cash and investments 155,284,870$ 20,034,998$ 912,543$ 7,442,622$ 183,675,033$ 5,267,666$ Restricted cash and investments 3,097,247 - - - 3,097,247 -
Total cash and investments 158,382,117$ 20,034,998$ 912,543$ 7,442,622$ 186,772,280$ 5,267,666$
The accompanying notes are an integral part of these financial statements.
Enterprise Funds
24
Business-type Activities GovernmentalActivities
Other InternalEnterprise Service
Water Sewer Stormwater Funds Total Risk FundRECONCILIATION OF OPERATING INCOME TO NET CASH PROVIDED BY OPERATING ACTIVITIES
Operating income (loss) 4,250,778$ (1,201,795)$ (73,001)$ (262,891)$ 2,713,091$ (160,583)$
Adjustments to reconcile operating income to net cash provided by operating activities:
Depreciation expense 7,378,989 2,296,863 1,026,217 671,211 11,373,280 - Miscellaneous receipts 3,575,039 - - - 3,575,039 20,000 Other expenses (5,000) - - - (5,000) - Change in assets and liabilities: Decrease (increase) in accounts receivable, net (216,426) 19,600 (93,641) 3,520 (286,947) (1,700) Decrease in loans receivable 17,596 - - - 17,596 - (Increase) in other assets (102,756) - - - (102,756) - (Increase) in deferred outflows of resources Other (45,000) - - - (45,000) - Decrease in deferred outflows of resources OPEB Related 23,523 2,288 (12,114) 6,101 19,798 1,173 Increase (decrease) in accounts payable 2,022,460 591,379 110,694 506,822 3,231,355 (14,015) Increase in OPEB 3,450 336 57,701 895 62,382 172 Increase (decrease) in other liabilities 125,686 (12,359) 70,455 (175) 183,607 461,823 (Decrease) in unearned revenue (8,789) - - - (8,789) - Increase in deferred inflows of resources OPEB Related 10,305 1,002 3,702 2,673 17,682 514
Net cash provided by operating activities 17,029,855$ 1,697,314$ 1,090,013$ 928,156$ 20,745,338$ 307,384$
NON-CASH INVESTING, CAPITAL AND FINANCING ACTIVITIES:Investing Activities Increase in the fair value of investments 1,821,659$ 209,040$ 2,663$ 77,156$ 2,110,518$ 55,409$ Financing Activities Bond amortization premiums 50,728 - - - 50,728 - Capital Activities Loss on disposal of capital assets (767,416) (47,556) - (352) (815,324) - Water, sewer, and stormwater lines contributed by developers 6,947,233 3,151,332 8,753,751 - 18,852,316 - Contributed capital from governmental funds - - 39,130,995 - 39,130,995 -
Enterprise Funds
25
City of Thornton, Colorado NOTES TO FINANCIAL STATEMENTS
December 31, 2019
NOTE A - SUMMARY OF SIGNIFICANT ACCOUNTING POLICIES The City of Thornton, Colorado (“the City”) was incorporated May 26, 1956. The citizenry voted to become a home rule city in 1967 under the provisions of Article XX of the Constitution of the State of Colorado. The City operates under a Council-Manager form of government and provides the following services, as authorized by its charter: public safety (police, fire, and ambulance), highways and streets, public improvements, water, sewer, sanitation and storm water, culture and recreation, debt service and general administrative services, including financial, planning and zoning, and municipal court services. The accounting policies of the City conform to accounting principles generally accepted in the United States of America as applicable to governments in accordance with those promulgated by the Governmental Accounting Standards Board (GASB). The following is a summary of the more significant policies: 1. Reporting Entity The City follows the Governmental Accounting Standards Board (GASB) accounting pronouncements, which provide
guidance for determining which governmental activities, organizations, and functions should be included within the financial reporting entity. GASB pronouncements set forth the financial accountability of a governmental organizations elected governing body as the basic criterion for including a possible component governmental organization in a primary government’s legal entity. Financial accountability includes but is not limited to, appointment of a voting majority of the organizations governing body, ability to impose its will on the organization, and potential for the organization to provide specific financial benefits or burdens and fiscal dependency. On September 25, 2018, the City Council approved an ordinance authorizing the organization of the RII-DII Business Improvement District (BID). RII DII BID is a separate legal entity pursuant to state statute for the purpose of constructing and financing of public improvements in the District. RII DII BID is located within the North Washington Urban Renewal Area at 148th avenue and Washington Street on approximately 75 acres. The City determined that RII-DII BID meets the definition of a discretely presented component unit for the following reasons: the City's ability to appoint RII-DII BID’s governing authority and approve the budget and its revisions. Management believes RII DII BID’s operational and financial relationship with the City is immaterial and is not included within the reporting entity. The City does not have any responsibilities to fund RII-DII BID’s operating deficiencies or deficits.
Complete financial statements for the RII-DII BID can be obtained from: Bow River Capital, Attn: RII DII BID, 205 Detroit Street, Suite 800, Denver, CO 80206.
As required by generally accepted accounting principles (GAAP), these financial statements present the City (the
primary government) and its component units. The component units discussed below are included in the City’s reporting entity because of the significance of their operational or financial relationships with the City. These component units are so intertwined with the City that they are, in substance, the same as the City and, therefore, are blended and reported as if they were part of the City. None of the component units listed below report their financial statements independent from the City.
The management of the City has operational responsibility for each of the following component units, and therefore,
they are included within the reporting entity (in blended presentation): Thornton Development Authority (TDA) - The TDA, an Urban Renewal Authority organized pursuant to Part 1, Article
25, Title 31 of the Colorado Revised Statutes, was established to finance the design and construction of the Thornton Parkway highway interchange, as well as various other improvements within the TDA's boundaries. The City Council is the TDA's governing board. The debt of the TDA is disclosed as tax increment bonds, but is not a general obligation of the City (primary government). There are three urban renewal areas within the City, the South Capital Fund, the North Capital Fund, and the 144th Capital Fund. For ease of financial management, separate funds were established for the improvements in each geographical area.
Thornton Arts, Sciences, and Humanities Council, Inc. (TASHCO) - TASHCO, a legally separate, nonprofit
corporation, was established to expand the Cultural Arts and Scientific program offerings within the City of Thornton. TASHCO is funded by a local grant, donations, ticket sales, and contribution from the General Fund. In 2007, the City Council appointed an advisory board consisting of citizens to serve as liaison for the City Council to the community at large to ensure programming services are meeting the needs and desires of the public. The City Council is the governing board of the TASHCO and approves the annual budget, making all substantive decisions regarding the operations of the TASHCO.
26
City of Thornton, Colorado NOTES TO FINANCIAL STATEMENTS
December 31, 2019
NOTE A – SUMMARY OF SIGNIFICANT ACCOUNTING POLICIES (CONTINUED) 1. Reporting Entity (Continued) 136th Avenue General Improvement District (GID) – 136th Avenue GID was established to account for the collection
of assessment revenues to be used exclusively for the purpose of constructing an interchange at 136th Avenue and Interstate 25. The City Council is the GID’s governing board.
E911 Authority Fund – This fund was established to account for E911 surcharges received from telecommunications
companies doing business within the City to pay for a portion of the costs authorized by State statute for the City to provide emergency telephone service. The City Council is the E911’s governing board.
2. Basis of Presentation Government-wide Statements: The statement of net position and the statement of activities display information
about the primary government (the City). These statements include the financial activities of the overall government.. Eliminations have been made to minimize the double-counting of internal activities. These statements distinguish between the governmental and business-type activities of the City. Governmental activities generally are financed through taxes, intergovernmental revenues, and other nonexchange transactions. Business-type activities are financed in whole or in part by fees charged to external parties. Separate financial statements are provided for governmental and proprietary funds.
The statement of activities presents comparisons between direct expenses and program revenues for the different
business-type activities of the City and for each function of the City’s governmental activities. Direct expenses are those that are specifically associated with a program or function and, therefore, are clearly identifiable to a particular function. Indirect expense allocations that have been made in the funds have been reversed for the statement of activities. Program revenues include (a) charges to customers who purchase, use, or directly benefit from goods, services, or privileges provided by a given program and (b) grants and contributions that are restricted to meeting the operational or capital requirements of a particular program. Revenues that are not classified as program revenues, including all taxes, are presented as general revenues.
Fund Financial Statements: The fund financial statements provide information about the City’s funds, including its
blended component units. Separate statements are provided for governmental and proprietary funds. The emphasis of fund financial statements is on major governmental and enterprise funds, each displayed in a separate column. All remaining governmental and enterprise funds are aggregated and reported as non-major funds.
The City reports the following major governmental funds:
General Fund. This is the City’s primary operating fund. It accounts for all financial resources of the general government, except those required to be accounted for in another fund. Governmental Capital Fund. This fund accounts for capital improvement projects financed by current resources (investment income, sales and use tax), as well as by restricted grant and intergovernmental revenues, developer contributions, and bond proceeds. Thornton Development Authority North Washington Fund (TDA North) (Component Unit). To account for debt services and capital improvement projects within the Authority boundaries financed by current resources (property tax, sales tax, investment income) and by bond proceeds. The debt service payments are for the following bond issue: $13,900,000 Thornton Development Authority Tax Increment Revenue Refunding (North Washington Street Urban Corridor), Series 2015 – financed by sales and property tax incremental increases within the boundaries of the North Washington Urban Renewal Area. The bonds are due in semi-annual payments until maturity in 2028.
The City reports the following major enterprise funds: Water Utility Fund. This fund accounts for the provision of water services to residents of the City and some residents of unincorporated Adams County. Sewer Utility Fund. This fund accounts for the provision of sewer services to residents of the City and some residents of unincorporated Adams County. Stormwater Fund. This fund accounts for the provision of stormwater services to residents of the City and some residents of unincorporated Adams County.
27
City of Thornton, Colorado NOTES TO FINANCIAL STATEMENTS
December 31, 2019
NOTE A – SUMMARY OF SIGNIFICANT ACCOUNTING POLICIES (CONTINUED) 2. Basis of Presentation (Continued)
Fund types that do not meet the criteria of major funds have been summarized and presented as other governmental funds and other enterprise funds within the fund financial statements as appropriate.
Additionally, the City reports the following fund type:
Internal Service Funds. This fund accounts for the costs related to providing the departments of the City with a comprehensive program to manage its property, liability, and work-related injury risk. The previous internal service funds; computer support for all information technology; copying and mailing; and building maintenance, fleet administration, repairs and custodial services; were closed January 1, 2019 and are reported in the General Fund.
3. Measurement Focus, Basis of Accounting Government-wide and Proprietary Fund Financial Statements. The government-wide and proprietary fund financial
statements are reported using the economic resources measurement focus and the accrual basis of accounting. Revenues are recorded when earned and expenses are recorded at the time liabilities are incurred, regardless of when the related cash flows take place. Nonexchange transactions, in which the City gives (or receives) value without directly receiving (or giving) equal value in exchange, include property taxes and grants. Property taxes are recognized as revenues in the year for which they are levied. Grants and similar items are recognized as revenue as soon as all eligibility requirements imposed by the provider have been satisfied.
Amounts reported as program revenues include 1) charges to customers for goods, services, or privileges provided,
2) operating grants and contributions, and 3) capital grants and contributions, including special assessments. Internally dedicated resources are reported as general revenues rather than as program revenues. Likewise, general revenues include all taxes.
Governmental Fund Financial Statements. Governmental funds are reported using the current financial resources
measurement focus and the modified accrual basis of accounting. Under this method, revenues are recognized when measurable and available. The City considers all revenues reported in the governmental funds to be available if the revenues are collected within sixty days after year end, with the exception of sales tax, for which revenues collected and held by vendors at year end on behalf of the City is recognized as revenue if collected within thirty days after year end, and property taxes, for which revenues collected within thirty days after year end are recognized.
Those revenues susceptible to accrual are property, franchise, cigarette, sales and some use taxes, interest revenue,
and charges for services. Fines and forfeitures, licenses and permits, and building use tax revenues are not susceptible to accrual because generally they are not measurable until received in cash. Expenditure-driven grants are recognized as revenue when the qualifying expenditures have been incurred and all other grant requirements have been met. All other revenue items are considered to be measurable and available only when cash is received by the City.
Expenditures are recorded when the related fund liability is incurred. Principal and interest on long-term debt are recorded as fund liabilities when due or when amounts have been accumulated in the fund for payments to be made early in the following year. Capital asset acquisitions are reported as expenditures in governmental funds. Proceeds of long-term debt reported as other financing sources.
When both restricted and unrestricted resources are available for use, it is the City’s policy to use restricted resources
first, then unrestricted resources as they are needed. Proprietary funds distinguish operating revenues and expenses from non-operating items. Operating revenues and
expenses generally result from providing services and producing and delivering goods in connection with a proprietary fund’s principal ongoing operations. The principal operating revenues of the enterprise funds and internal service fund are charges to customers for sales or services. Operating expenses for enterprise funds and internal service fund include the cost of sales and services, administrative expenses, and depreciation on capital assets. All revenues and expenses not meeting this definition are reported as non-operating revenues and expenses. Miscellaneous nonoperating revenue consists primarily of lease and royalty revenue.
28
City of Thornton, Colorado
NOTES TO FINANCIAL STATEMENTS December 31, 2019
NOTE A – SUMMARY OF SIGNIFICANT ACCOUNTING POLICIES (CONTINUED)
3. Measurement Focus, Basis of Accounting (Continued)
As a general rule, the effect of interfund activity has been eliminated from the government-wide financial statements.Exceptions to this rule are the charges between the City’s utility functions and various other functions, as well as anadministrative fee charged by the General government activity to the other activities. Elimination of these chargeswould distort the costs and program revenues reported for the various functions.
4. Budgets and Budgetary Accounting
The City Council follows these procedures in establishing the budgetary data reflected in the financial statements:
a. The City Manager submits to the Mayor and the City Council a proposed budget for the fiscal year commencingthe following January 1. The budget includes proposed expenditures of all funds and the means of financingthem.
b. A public hearing is conducted to obtain taxpayer comments.
c. Prior to the end of the fiscal year, the budget for the next fiscal year is legally adopted through passage of aresolution. An appropriation ordinance, based on the adopted budget, is enacted on or before the last day ofDecember.
d. The City Manager is authorized to transfer budgeted amounts between departments within any fund; however,any revisions that alter the total appropriations of any fund must be approved by the City Council.
e. The level on which expenditures may not legally exceed appropriations is the legally adopted annual operatingbudget for each fund in total. All appropriations for operating budgets lapse at year end.
f. Budgets for governmental funds are adopted on a basis consistent with accounting principles generally acceptedin the United States of America. Annual budgets are legally adopted for most governmental funds. In anygiven year, an individual fund may not be budgeted if expenditures for the year are not anticipated. In 2019,all governmental funds had legally adopted annual budgets. Notes 4g. and 4h. explain funds with budgets thatare on a non-GAAP basis. Note 4i. explains budgetary practices for capital project funds/accounts.
g. Budgets for governmental capital projects funds are adopted on a basis consistent with accounting principlesgenerally accepted in the United States of America, except that the City includes the capital outlay costs forpurchases of land intended for resale and excludes subsequent gains or losses on the resale of the land. Inaddition, the City excludes gain or loss on disposal of capital assets, acquisition of capital leases, any balancestransferred due to closure of a fund and miscellaneous non-cash adjustments.
h. Budgets for proprietary funds are adopted on a basis consistent with accounting principles generally acceptedin the United States of America, except that the City excludes depreciation, amortization, gain or loss ondisposal of capital assets, and incurred but not reported claims and includes debt service principal and interestpayments and capital outlay. In addition, any balances transferred due to closure of a fund and miscellaneousnon-cash adjustments are not budgeted. Budget to Actual schedules for each proprietary fund can be found inthe Combining & Individual Statements & Schedules section.
i. The City adopts a multi-year appropriation for certain capital projects, identified as long term in nature, whereunexpended funds will not automatically lapse at year end, but remain appropriated until project completion.Unspent and unencumbered appropriations for those projects that are short term in nature (annual) willcontinue to lapse at year end.
29
City of Thornton, Colorado
NOTES TO FINANCIAL STATEMENTS December 31, 2019
NOTE A – SUMMARY OF SIGNIFICANT ACCOUNTING POLICIES (CONTINUED)
4. Budgets and Budgetary Accounting (Continued)
j. The City Council may legally amend the budget by ordinance or resolution once it has been approved. Budgetedamounts, including all amendments, are shown as adopted by the City Council.
In 2019, eight budget amendments were approved by ordinance or resolution. The effect of these amendmentswas an overall increase in appropriations of $29,017,286, broken down by fund type as follows:
5. Investments
Investments in securities are carried at fair value or amortized cost as applicable. Unrealized gains resulting fromincreases in fair value between January 1 and December 31 are recognized as a component of interest income;unrealized losses resulting from decreases in fair value reduce interest income. Realized gains or losses on securitiesincluded in the investment portfolio are recognized only when the related security is sold prior to the stated maturity.Certain investments may be restricted for debt service, capital or pledge commitments.
6. Receivables and Payables
Activity between funds that are representative of lending/borrowing arrangements outstanding at the end of thefiscal year are referred to as either “due to/from other funds” (i.e., the current portion of interfund loans) or“advances to/from other funds” (i.e., the non-current portion of interfund loans). All other outstanding balancesbetween funds are reported as “due to/from other funds.” Any residual balances outstanding between thegovernmental activities and business-type activities are reported in the government-wide financial statements as“internal balances.”
7. Inventories
Inventories are valued at weighted average cost. Inventory in the General Fund consists of fuel held forconsumption. In the General Fund cost of inventory is recorded as expenditures when consumed, rather than whenpurchased. The General Fund reserve for inventory, included in nonspendable inventories, is equal to the amount ofinventory on hand to indicate that a portion of the General Fund fund balance is not available for future expenditures.
8. Construction Advances
Third party development advances for construction represent the deposits made by developers for specificimprovements to be made either by a developer or the City at a future date. If the developer completes theimprovement, then the deposit is returned to the developer upon satisfactory completion. If the City completes theimprovement, then the deposit is used towards the cost of the improvement. The City recognizes revenue for thesedeposits when it is determined that the City, and not a developer, will incur the costs of the improvements, and thedeposit will not be returned to the developer.
9. Capital Assets
Capital assets, which include property, plant, equipment, water rights, and infrastructure assets (e.g. roads, bridges,and similar items) are reported in the applicable governmental or business-type activities columns in thegovernment-wide financial statements and the proprietary financial statements. The government defines capitalassets as assets with an initial, individual cost of more than $5,000 and an estimated useful life in excess of oneyear. Property, plant and equipment purchased or acquired is carried at historical cost or estimated historical cost.Donated capital assets, donated works of art, historical treasures, and similar assets and capital assets received ina service concession arrangement are recorded at acquisition value. Contributed capital assets are recorded at theiracquisition value on the date received. General infrastructure assets are valued based on estimated original cost.The cost of normal maintenance and repairs that do not add to the value of the asset or materially extend an asset’slife are not capitalized.
General Fund 1,180,865$ Special Revenue Funds 2,697,556Capital Pojects Funds 18,743,276Enterprise Funds 6,395,589
29,017,286$
30
City of Thornton, Colorado
NOTES TO FINANCIAL STATEMENTS December 31, 2019
NOTE A – SUMMARY OF SIGNIFICANT ACCOUNTING POLICIES (CONTINUED)
9. Capital Assets (Continued)
GASB 51 Accounting and Financial Reporting for Intangible Assets requires that all intangible assets be classified ascapital assets and recognized in the statement of net position. The term depreciation includes amortization ofintangible assets.
Land, water rights, source of supply assets related to tributary water rights and permanent easements are capitalizedand not depreciated. Temporary easements are capitalized and depreciated over the appropriate period. All othercapital assets are depreciated using the straight-line method over the following estimated useful lives:
10. Compensated Absences
Eligible City employees earn vacation leave at a variable rate, dependent on years of service, and sick leave at therate of 8 hours per month. Vacation and sick leave accumulate on a monthly basis and are fully vested when earned.Accumulated vacation leave cannot exceed 240 hours at the end of the year and any excess cannot be carriedforward to the next year unless pre-authorized by the City Manager. For employees hired before January 1, 1995,all sick leave earned prior to December 31, 2002 is compensable. After 20 years of service or at age 62 and 10years of service, 100% of the unused sick leave over 384 hours plus accumulated vacation leave are paid upontermination, retirement or death. The liability for compensated absences reported in the government-wide andproprietary fund statements consists of unpaid, accumulated vacation and sick leave balances, as described above.Compensated absences are liquidated by the respective fund where the liability was originally accrued.
11. Long-Term Obligations
In the government-wide financial statements and the proprietary fund financial statements, long-term debt andother long-term obligations are reported as liabilities in the applicable governmental activities, business-typeactivities, or proprietary fund type statement of net position. Bond premiums and discounts are deferred andamortized over the life of the bonds using a method that approximates the effective interest method. Bonds payableare reported net of the applicable bond premium or discount.
In the governmental fund financial statements, funds recognize bond premiums and discounts during the currentperiod. The face amount of debt issued is reported as other financing sources. Premiums received on debt issuancesare reported as other financing sources while discounts on debt issuances are reported as other financing uses.
GASB 49 addresses accounting and financial reporting for pollution remediation obligations. The ThorntonDevelopment Authority, a component unit of the City, owns property which falls under voluntary remediation andhad a plan with the State to actively treat subsurface contamination. The total amount spent as of year end 2010on remediation was $1,437,056. In 2010, the City received approval from the State to stop remediation and moveto monitoring only. The City has spent a total of $291,142 as of year-end 2019 for monitoring.
12. Fund Equity
In the fund financial statements, fund equity of the City’s governmental funds are classified as nonspendable,restricted, committed, assigned, or unassigned. A governmental fund may or may not have all five components offund balance. The five classifications describe the relative strength of the spending constraints.
Nonspendable fund balances indicate amounts that cannot be spent either due to form (for example inventories orprepaids) or due to legal or contractual requirements. Restricted fund balances indicate amounts constrained for aspecific purpose by external parties, constitutional provision or enabling legislation. Committed fund balancesindicate amounts constrained for a specific purpose by a government using its highest level of decision-makingauthority (ordinance). It would require an ordinance by the City Council to remove or change the constraints placedon the resources. Assigned fund balance is established by City Council by resolution and as intended for specificpurpose (such as the purchase of capital assets, construction, debt service, etc.). Unassigned fund balances indicateamounts in the general fund that are not classified as nonspendable, restricted, committed, or assigned. The generalfund is the only fund that would report a positive amount in unassigned fund balance.
Asset Class Estimated useful life
Infrastructure 5-75 years
Buildings, Structures and improvements 10-50 years
Leisure Areas and improvements 5-50 years
Collection, transmission, and distribution 7-50 years
Equipment 2-30 years
31
City of Thornton, Colorado NOTES TO FINANCIAL STATEMENTS
December 31, 2019
NOTE A – SUMMARY OF SIGNIFICANT ACCOUNTING POLICIES (CONTINUED) 12. Fund Equity (Continued) When expenditures are incurred for purposes for which both restricted and unrestricted amounts are available,
restricted amounts are deemed to be used first. When expenditures are incurred for purposes for which amounts in any of the unrestricted fund balance classifications could be used, committed amounts are considered to be reduced first, followed by assigned amounts and then by unassigned amounts.
City Council establishes (and modifies or rescinds) fund balance commitments by passage of an ordinance. In the general fund, 17% of the current year budget is committed for emergencies and utilization requires a two-thirds affirmative vote of the Council. Examples of emergencies that may lead to utilization of the reserve include economic stabilization due to an unforeseen loss of a key sales tax vendor, a catastrophic event or natural disaster. A key sales tax vendor is a vendor that generates more than one million per year in sales tax revenue for the City. An example of a catastrophic event or natural disaster would be a tornado requiring extensive operational or capital costs. Funds are not intended to be used to adjust for revenue variances due to cycles of the economy.
13. Net Position In the Government-wide and proprietary fund financial statements, equity is displayed in three components as
follows: Net Investment in Capital Assets – Consist of capital assets, net of accumulated depreciation, less the outstanding
balances of any bonds, notes, or other borrowings that are attributable to the acquisition, construction, or improvements of those assets. Net investment in capital assets excludes unspent bond and loan proceeds. As of December 31, 2019, the City had unspent bond proceeds of $6,410,825 in the Parks and Open Space Fund.
Restricted – Consists of amounts constrained for a specific purpose by external parties, constitutional provision or
enabling legislation. Unrestricted – Consist of amounts that do not meet the definition of “restricted” or “net investment in capital assets”. When both restricted and unrestricted resources are available for use, it is the City’s policy to use restricted resources
first, and then unrestricted resources as they are needed. 14. Interfund Transactions Interfund services provided and used are accounted for as revenues, expenditures or expenses. Transactions that
constitute reimbursements to a fund for expenditures/expenses initially made from it that are properly applicable to another fund, are recorded as expenditures/expenses in the reimbursing fund and as reductions of expenditures/expenses in the fund that is reimbursed. All other interfund transactions are reported as transfers.
15. Statement of Cash Flows For purposes of the statement of cash flows, the City considers all highly liquid investments (including restricted
assets) with a maturity of three months or less when purchased to be cash equivalents. 16. Contraband Forfeitures In accordance with the Colorado Contraband Forfeiture Act (C.R.S. 16-13-501 to 511) and the Controlled Substances
Act (21 USC 881(e)(3)), forfeitures from the seizure of contraband are used for the specific purpose of law enforcement activities. These funds are included in the City's General Fund.
17. Use of Estimates The preparation of financial statements in conformity with accounting principles generally accepted in the United
States of America requires management to make estimates and assumptions that affect the reported amounts in the financial statements and accompanying notes. Actual results could differ from those estimates.
18. Sales Tax
As a home rule city, Thornton collects its own sales taxes. Within the general government, the ten largest retailers remit approximately 42% of the sales tax collected.
32
City of Thornton, Colorado
NOTES TO FINANCIAL STATEMENTS December 31, 2019
NOTE A – SUMMARY OF SIGNIFICANT ACCOUNTING POLICIES (CONTINUED)
19. Deferred Outflows and Deferred Inflows of Resources
In addition to assets, the statement of net position has a separate section for deferred outflows of resources.Deferred outflows represent a consumption of net position that applies to future period(s) and so are not recognizedas an expense/expenditure in the current year, but will be in a future year. The City has items that qualify forreporting in this category relating to changes in asset retirement obligation liability, other post-employment benefitsliability, changes in net pension liability and deferred charges on a bond refunding reported in the statement of netposition.
In addition to liabilities, the statement of net position and the balance sheet of the governmental funds has aseparate section for deferred inflows of resources. Deferred inflows represent an acquisition of net position thatapplies to a future period(s) and so are not recognized as revenue in the current year, but will be in a future year.The City has items that qualify for reporting in this category relating to property taxes, deferred charges on bondrefunding, changes in other post-employment benefits liability, and changes in net pension liability reported in thestatement of net position. At the governmental fund level deferred inflows of resources are reported for unavailablerevenue in connection with receivables not considered to be available under modified accrual basis of accounting.
20. Implementation of New GASB Statements
Beginning in fiscal year 2019, the City implemented the following statements issued by the Governmental AccountingStandards Board (GASB):
GASB Statement No. 83, Certain Asset Retirement Obligations – this statement addresses accounting and financialreporting for certain asset retirement obligations (AROs). An ARO is a legally enforceable liability associated withthe retirement of a tangible capital asset. After the review of current assets it was determined that the City hadassets with retirement obligations that fall under the aforementioned statement. The Statement gave guidancefor restating prior period balances, based on the immateriality of the liabilities on the government-wide and fundfinancial statements it was decided not to restate beginning balances for net position or fund balance. Thecumulative effect of this statement has been recorded as of December 31, 2019. The details of the City’s assetretirement obligations can be found in Note G.3 Long-term Debt - Other Obligations.
GASB Statement No. 88, Certain Disclosure Related to Debt, including Direct Borrowings and Direct Placements –The primary objective of this Statement is to improve the information that is disclosed in notes to governmentfinancial statements related to debt, including direct borrowings and direct placements. The City currently has nodirect borrowing or direct placement debt, all other disclosures are included in the notes to the financial statements.
GASB Statement No. 90, Majority Equity Interests an amendment of GASB Statements No.14 and No.61 – thisstatement establishes that ownership of a majority equity interest in a legally separate organization results in thegovernment being financially accountable for the legally separate organization and, therefore, the governmentshould report that organization as a component unit. This GASB did not require a change to reporting of current orprior periods.
21. Future Accounting Pronouncements
This report does not incorporate GASB Statement No. 84, Fiduciary Activities, GASB 87, Leases, and GASBStatement No. 91 Conduit Debt Obligations. The City will adopt and implement these statements at the requiredtime. The City’s management has not yet determined the effect the statements will have on the City’s financialstatements.
22. Jointly Governed Organization
Woman Creek Reservoir Authority (the Authority). The City participates as an equal partner with the Cities ofNorthglenn and Westminster in the operation of the Woman Creek Reservoir Authority. It has no financial interestin the Authority. The Authority began operation in 1996 with funding from a grant by the federal government'sEnvironmental Protection Agency. The grant's purpose was to supply sufficient funds to mitigate and/or clean upany hazardous effects to the water supply of the three cities from the previous production of nuclear weapons atthe Rocky Flats facility located near the Woman Creek Reservoir. The Authority contracted with the Church DitchWater Authority to provide maintenance and monitoring services for the reservoir. Copies of the Woman CreekReservoir Authority's financial statements may be obtained from the City of Thornton.
33
City of Thornton, Colorado NOTES TO FINANCIAL STATEMENTS
December 31, 2019
NOTE B – STEWARDSHIP, COMPLIANCE, AND ACCOUNTABILITY 1. Compliance with Finance-Related Legal and Contractual Provisions
The City believes it has no material violations of finance-related legal and contractual provisions. NOTE C - DEPOSITS AND INVESTMENTS 1. Equity in Pooled Cash and Investments Except when required by trust agreements, the operating cash in each fund is pooled and cash in excess of operating
requirements is invested. 2. Deposits The Colorado Public Deposit Protection Act (PDPA) requires that all units of local government deposit cash in eligible
public depositories, with eligibility determined by state regulators. Amounts on deposit in excess of federal insurance levels must be collateralized. The eligible collateral is determined by the PDPA. PDPA allows the institution to create a single collateral pool for all public funds. The pool is to be maintained by another institution or held in trust for all the uninsured public deposits as a group. The market value of the collateral must be at least equal to 102% of the uninsured deposits. At December 31, 2019, the City’s deposits had a carrying amount of $4,062,266 and a bank balance of $5,204,730. Of the bank balance, $1,127,669 was covered by federal depository insurance. The remainder of the bank balance, $4,077,061, was uninsured and collateralized with securities held by the pledging financial institution and covered by eligible collateral as determined by the PDPA.
3. Investments The City’s Charter allows investment in one or more of the securities permitted by the statutes of Colorado for the
investment of state funds or municipal funds, bonds payable out of the revenues of any service or facility furnished by the City, or in general obligation bonds of the City. The City’s internal investment policy further restricts investments to the following securities: United States Treasury, Government Sponsored Enterprises, State & Local Government taxable general or revenue obligations, Corporate Bonds and Commercial Paper, Local Government Investment Pools, Money Market Mutual Funds, Repurchase Agreements, Reverse Repurchase Agreements, Securities Lending Agreements, and Deposits in State or Nationally Chartered Depository Institutions. Additional investment and deposit disclosures for credit risk, interest rate risk, and foreign currency risk, as required by GASB Statement No. 40, Deposit and Investment Risk Disclosures, are included in the notes below. At December 31, 2019, the City had the following investments and maturities:
Unrealized gains or losses resulting from changes in the fair value of the investment portfolio are recognized as increases to or reductions from interest income in the financial statements. The only time a realized gain or loss is recognized on investment transactions is when they are sold prior to their stated maturity. Present cash flow needs of the City are being met without premature liquidation of investments. The City generally holds investments until maturity and redeems them at par. The City has no unfunded commitments related to these investments and there are no withdrawal restrictions. Fair value is the price that would be received to sell an asset or paid to transfer a liability in an orderly transaction between market participants at the measurement date. Fair value measurements must maximize the use of observable inputs and minimize the use of unobservable inputs. There is a hierarchy of three levels of inputs that may be used to measure fair value:
Level 1: Quoted prices (unadjusted) in active markets for an identical asset or liability that a government can access at the measurement date
Investment Type Fair Value < 1 Year 2-3 Years 4-5 Years
U.S. Government Treasuries 38,150,821$ 15,010,547$ 23,140,274$ -$
U.S. Government Agencies 193,815,981 52,029,082 84,315,904 57,470,995
Certificate of Deposit 3,482,857 - 1,234,354 2,248,503
Local Gov't Investment Pools 69,365,666 69,365,666 - -
Total 371,532,200$ 153,056,287$ 148,413,604$ 70,062,309$
34
City of Thornton, Colorado
NOTES TO FINANCIAL STATEMENTS December 31, 2019
NOTE C - DEPOSITS AND INVESTMENTS (CONTINUED)
3. Investments (Continued)
Level 2: Inputs other than quoted prices included in Level 1, that are observable for an asset or liability, either directly or indirectly. Level 2 inputs include quoted prices for similar assets or liabilities, quoted prices for identical or similar assets or liabilities in markets that are not active, or other inputs that are observable or can be corroborated by observable market data for substantially the full-term of the assets or liabilities
Level 3: Unobservable inputs for an asset or liability
There have been no significant changes in the valuation techniques during the year ended December 31, 2019. Where quoted market prices are available in an active market, securities are classified within Level 1 of the valuation hierarchy. If quoted prices are not available, then fair values are estimated using quoted prices of securities with similar characteristics or independent asset pricing services and pricing models, the inputs of which are market-based or independently sourced market parameters, including but not limited to, yield curves, interest rates, volatilities, prepayments, defaults, cumulative loss projections and cash flows. Such securities are classified in Level 2 of the valuation hierarchy. In certain cases where Level 1 or Level 2 inputs are not available, securities are classified within Level 3 of the hierarchy. At December 31, 2019, U.S. Government Treasuries, Corporate Securities and U.S. Government Agencies, are classified within Level 1 hierarchy. Participant balances in the Local government pools Colorado Surplus Asset Fund Trust (CSAFE) and the Colorado Local Government Liquid Asset Trust (Colotrust) are stated at net asset value. The underlying securities in CSAFE are measured at amortized cost and are so close to fair value when measured at amortized cost that they are generally equivalent. Securities in Colotrust, other than agreements, are valued at the most recent market bid price as obtained from one or more market makers for such securities, repurchase agreements are recorded at cost, which approximates fair value.
Interest Rate Risk – The City’s internal investment policy is designed to reduce interest rate risk. The maximum duration of the portfolio is limited to 4.0 years. At December 31, 2019, the weighted-average maturity of the City’s portfolio was 20.7 months.
Credit Risk – The City minimizes credit risk, the risk of loss due to the failure of the security issuers or banker, by diversifying the investment portfolio so that potential losses on individual securities are minimized and by limiting investments to specified credit ratings. Per the City’s Investment Policy, at the time of purchase, a security must be rated AA- or Aa3 or better by Standard & Poor’s or Moody’s respectively. If a security is downgraded after the date of purchase, the City may continue to hold the security provided the Investment Officer acts as a Prudent Investor; disclosing and managing the risks associated with the security. As of December 31, 2019, the City’s investment in U.S. Treasuries, FHLB, FFCB, FNMA, FHLMC, and Corporates (excluding US Bank) were all rated AA- or better by Standard & Poor’s and Aa3 or better by Moody’s. As of December 31, 2019, the City’s investment in US Bank was rated AA- by Standard & Poor’s and A1 by Moody’s.
Custodial Credit Risk – Custodial credit risk is the risk that in the event of the failure of the counterparty, the City will not be able to recover the value of its investments that are in the possession of an outside party. At December 31, 2019, no investments were held by a counterparty, and all investments were registered in the City’s name.
Concentration of Credit Risk – The City’s internal investment policy limits the amount the City may invest in one issuer except for U.S. Treasuries, which are unlimited because they are backed by the full faith and credit of the U.S. Government. No more than 5% of the portfolio may be invested in a single corporation and no more than 30% may be invested in a single government sponsored enterprise. As of December 31, 2019, the City’s investment in U.S. Treasuries were 10.3%, FHLB were 8.1%, FFCB was 17.6%, FNMA was 12.7%, FHLMC was 14.1%, FCCB was 17.6%, and Corporate Bonds were 18.0%. The City’s investment in Local Government Investment Pools are excluded form this disclosure requirement.
Local Government Investment Pools – As of December 31, 2019, the City had $53,463,499 invested in Colotrust and $15,902,167 invested in CSAFE. These investment vehicles were established for local government entities in Colorado to pool surplus resources; it is overseen by the Colorado Securities Commissioner and governed by CRS 24-75-701. A designated custodial bank provides safekeeping and depository services. The custodian’s internalrecords identify the investments owned by the participating governments. Both pools operate similarly to a moneymarket fund and each share is equal to $1.00 in value. Colotrust and CSAFE are rated AAAm by Standard & Poor’s.
35
City of Thornton, Colorado
NOTES TO FINANCIAL STATEMENTS December 31, 2019
NOTE D - PROPERTY TAXES AND RECEIVABLES
Property taxes are collected on behalf of the City by Adams County and then remitted to the City. The property tax is levied and certified in December of the year prior to the year the taxes are collected on all taxable property in the City. Property taxes become an enforceable lien on January 1 of each year. Secured property taxes are due in two equal installments, on February 28 and June 15, and are delinquent after these dates, respectively. The entire balance may be paid on April 30 without penalty. Property taxes levied are recorded as deferred inflows in the year levied, as they are not due until the following year. Property tax revenue is recognized in the subsequent tax year.
For governmental receivables, available means when due or past due and receivable within the current period, and collected within the current period or expected to be collected soon thereafter to be used to pay liabilities of the current period, generally within thirty days.
Ambulance receivables and revenues are reported net of contractual allowances and uncollectible amounts. As of December 31, 2019, total accounts receivable were $1,396,824 with an allowance for bad debt of $295,453. Write-offs, which include contractual allowances and uncollectible amounts related to the current period, are $3,722,050.
36
City of Thornton, Colorado
NOTES TO FINANCIAL STATEMENTS December 31, 2019
NOTE E - CAPITAL ASSETS
Capital asset activity for the year ended December 31, 2019 was as follows:
Governmental activities:Capital assets not being depreciated: Land and land rights 49,338,858$ 629,390$ -$ 49,968,248$ Construction in progress 36,184,592 21,391,037 (30,487,987) 27,087,642
Total capital assets not being depreciated 85,523,450 22,020,427 (30,487,987) 77,055,890
Capital assets being depreciated: Streets, traffic, and engineering 408,930,565 21,225,404 (54,929,411) 375,226,558 Buildings and improvements 98,983,861 44,080,279 - 143,064,140 Leisure areas and improvements 86,696,114 12,148,906 (513,797) 98,331,223 General equipment 53,826,790 4,888,903 (4,201,776) 54,513,917
Total capital assets being depreciated 648,437,330 82,343,492 (59,644,984) 671,135,838
Less accumulated depreciation for: Streets, traffic, and engineering 240,709,614 11,112,880 (16,805,743) 235,016,751 Buildings and improvements 32,193,631 2,311,599 - 34,505,230 Leisure areas and improvements 44,972,389 3,634,237 (460,185) 48,146,441 General equipment 30,506,010 4,919,026 (3,078,705) 32,346,331
Total accumulated depreciation 348,381,644 21,977,742 (20,344,633) 350,014,753
Total capital assets being depreciated, net 300,055,686 60,365,750 (39,300,351) 321,121,085
Governmental activity capital assets, net 385,579,136$ 82,386,177$ (69,788,338)$ 398,176,975$
Business-type activities:Capital assets not being depreciated: Land and water rights 202,213,365$ 1,554,235$ (28,707)$ 203,738,893$ Source of supply 129,250,941 - (737,475) 128,513,466 Construction in progress 49,708,799 47,946,466 (2,897,314) 94,757,951
Total capital assets not being depreciated 381,173,105 49,500,701 (3,663,496) 427,010,310
Capital assets being depreciated: Water treatment plant 83,708,473 2,389,272 - 86,097,745 Collection, transmission, and distribution 310,310,919 78,997,583 (270,518) 389,037,984 Transportation equipment 7,697,285 2,245,438 (733,586) 9,209,137 General equipment 11,028,158 1,142,439 (87,980) 12,082,617
Buildings and improvements 23,888,576 1,048,340 (93,350) 24,843,566
Total capital assets being depreciated 436,633,411 85,823,072 (1,185,434) 521,271,049
Less accumulated depreciation for: Water treatment plant 28,324,499 1,772,307 - 30,096,806 Collection, transmission, and distribution 119,293,023 24,384,866 (270,260) 143,407,629 Transportation equipment 3,894,509 1,576,909 (686,404) 4,785,014 General equipment 8,268,349 1,093,520 (86,275) 9,275,594 Buildings and improvements 9,952,266 391,433 (93,349) 10,250,350
Total accumulated depreciation 169,732,646 29,219,035 (1,136,288) 197,815,393
Total capital assets being depreciated, net 266,900,765 56,604,037 (49,146) 323,455,656
Business-type capital assets, net 648,073,870$ 106,104,738$ (3,712,642)$ 750,465,966$
37
City of Thornton, Colorado
NOTES TO FINANCIAL STATEMENTS December 31, 2019
NOTE E - CAPITAL ASSETS (CONTINUED)
During 2019, Internal Service Funds for Information Technology, Reprographics, and Building Maintenance were consolidated into the General Fund. This did not have an impact on net capital assets carried in Governmental activities as the assets for the aforementioned funds have always been reported in the Governmental activities section of the capital assets. While the net capital asset values were not affected by this consolidation, the presentation of depreciation expense by function within the Governmental activities were, and are now being presented as part of the General Government Function.
Government-type activities deletions and transfers includes the transfer of capital assets to Business-type Activities for the creation of the Stormwater Fund in the following categories: Streets, traffic, and engineering with a historical cost of $54,841,911 with accumulated depreciation of $16,482,283 and general equipment with a historical cost of $2,134,841 with accumulated depreciation of $1,046,721. In the Business-type Activities, assets transferred in under the Collection, transmission, and distribution category were increased by $54,841,911 with accumulated depreciation of $16,482,283, transportation equipment increased by $1,298,992 with accumulated depreciation of $601,765, and general equipment increased by $835,849 with accumulated depreciation of $444,956 for the creation of the Stormwater Fund.
Depreciation expense was charged to functions/activities as follows:
NOTE F – INTERFUND RECEIVABLES, PAYABLES, AND TRANSFERS
Transfers are used to (1) move revenues from the fund that statute or budget requires to collect them to the fund that statute or budget requires to expend them, (2) move receipts restricted to debt service from the funds collecting the receipts to the debt service fund as debt service payments become due, (3) to close an existing fund, or (4) to move funds related to a prior year expense error. The composition of transfers at December 31, 2019 is as follows:
In the year ended December 31, 2019, governmental activities made the following one-time transfer:
Governmental activities contributed $39,130,995 in capital assets to the Stormwater Fund to create the fund for financial administration of storm sewer services to residents of the City and some residents of Adams County.
Transfers to close the Internal Service Funds included items not reported at the fund level; assets, OPEB, and compensated absences which are not presented in the table above or in the fund level statements. Reconciling amounts are identified on page 19.
Governmental activities:General government 1,651,163$ Police 2,160,937 Fire 1,081,708 City development 396,870Streets, traffic & engineering 11,929,383 Community services 4,757,681
Total governmental activities depreciation 21,977,742$
Business-type activities:Water 7,378,989$ Sewer 2,296,863 Sanitation 671,211Storm Water 1,026,217
Total business-type activities depreciation 11,373,280$
Transfers out: GeneralGovernmental
CapitalGovernment Non Major Total
General -$ -$ 34,765$ 34,765$ TDA North 2,779,704 1,269,538 - 4,049,242$ Government Non-Major 2,229,541 - - 2,229,541$ Internal Service Funds 1,033,746 - - 1,033,746$
6,042,991$ 1,269,538$ 34,765$ 7,347,294$
Transfers in:
38
City of Thornton, Colorado
NOTES TO FINANCIAL STATEMENTS December 31, 2019
NOTE G - LONG-TERM DEBT
1. Bonds Payable
Bonds payable at December 31, 2019 are comprised of:
There are limitations and restrictions in the various bond indentures. As of December 31, 2019 the City believes it is in compliance with all significant limitations and restrictions.
2. Certificates of Participation
2007 Certificates of Participation - During 2002, the City entered into a Master Lease Purchase Agreement with theCapital Asset Finance Corporation (CAFC), an independent Colorado nonprofit corporation. Under this agreement,the Thornton Finance Authority (TFA) assigned all of its rights and obligations under Certificates of Participation(COPs) issued in 1998 to the CAFC and the CAFC issued 2002 COPs totaling $41,690,000, the proceeds of whichwere used to purchase the City’s Civic Center and the property on which the City’s Justice Center was constructedand to provide funds to construct the Justice Center. The proceeds from the sale of City assets were used by theCity to construct an interchange. The Justice Center is leased back to the City by the CAFC with the lease paymentsmatching the COP payment terms. During 2007, the City entered into an Amended and Restated Master LeasePurchase Agreement with the CAFC and the CAFC issued 2007 COPs totaling $32,820,000, the proceeds of whichwere used to refund the outstanding 1998 COPs maturing on and after December 1, 2009 and the 2002 COPsmaturing on and after December 1, 2013.
Revenue Bonds
33,030,000$
Plus unamortized premium 2,476,418
35,506,418$
Tax Increment Bonds
10,360,000$
25,025,000
Plus unamortized premium 2,427,728
37,812,728$
$39,380,000, April 29, 2013 Water Enterprise Revenue Refunding Bonds, Series 2013,annual installments of $1,620,000 to $2,765,000 through December 1, 2034, interestat 3.00% to 5.00%
At December 31, 2019, deferred charges were $1,719,728 for the Water EnterpriseRevenue Refunding Bonds.
$13,900,000, September 22, 2015 Thornton Development Authority (component unit)Tax Increment Revenue Refunding Bonds, Series 2015, annual installments of$960,000 to $1,365,000 through December 1, 2028, interest at 3.25% to 5.00% (Thisissue will be serviced solely by 50% of the property tax increment and 50% of the salestax collected within the boundaries of the North Washington Street Corridor Area.Although the obligation is reported within the governmental activities, it is not ageneral obligation of the City (primary government). For the year ended December 31,2019, pledged sales and property taxes were $5,056,471, principal and interest paidwere $920,000, and $488,263 respectively.
$27,580,000, December 2, 2015 Thornton Development Authority (component unit) Tax Increment Revenue Bonds, Series 2015B, annual installments of $680,000 to$2,170,000 through December 1, 2037, interest at 3.00% to 5.00% (This issue will beserviced solely by the pledged property tax increment and sales tax collected, net otherobligations, within the boundaries of the East 144th Ave. and I-25 Area. Although theobligation is reported within the governmental activities, it is not a general obligation ofthe City (primary government). For the year ended December 31, 2019, pledged salesand property taxes were $2,326,090, principal and interest paid were $670,000, and$1,139,394 respectively.
At December 31, 2019, the deferred gain was $34,192 for the Tax Increment RevenueRefunding Bonds.
39
City of Thornton, Colorado
NOTES TO FINANCIAL STATEMENTS December 31, 2019
NOTE G - LONG-TERM DEBT (CONTINUED)
2. Certificates of Participation (Continued)
The 2007 Amended and Restated Master Lease Purchase Agreement totaling $32,820,000, is due in annualinstallments of $2,990,000 to $3,230,000 through December 1, 2022 with interest at 4.00% and currently amountsto $9,325,000. The 2007 Amended and Restated Lease Agreement unamortized discount was $48,009 at December31, 2019.
2018 Certificates of Participation - In November 2018, the City entered into a Site and Improvement Lease with USBank, NA as Trustee pursuant to which the City will lease to the Trustee the City Hall and the Margaret W. CarpenterRecreation Center. Simultaneously, the City entered into an annually renewable Lease Purchase Agreement underwhich the City will pay base rentals in order to lease City Hall and the Recreation Center back from the Trustee.
The City issued 2018 Certificates of Participation totaling $65,280,000 evidencing proportionate interests in the baserentals under the Lease Purchase Agreement. The proceeds of the issuance will be used to finance or reimburse theCity for the costs of the new Trail Winds Recreation Center, a new Public Safety Facility and other capitalimprovements. The base rentals are due in annual installments of $1,970,000 to $4,610,000 through November15, 2039 with interest at 4.00% to 5.00% and currently amounts to $63,635,000. The 2018 Lease PurchaseAgreement unamortized premium was $4,020,360 at December 31, 2019.
3. Other Obligations
In 1986, the City entered into a settlement agreement with the Water Supply and Storage Company (“theCompany”), a mutual ditch company. Among the terms and conditions of the settlement, the City agreed to makecertain capital contributions to the Company in the form of direct payments in the years 1987, 1988, and 1989, andcommitted to contribute an additional $5,000,000 toward future mutually beneficial capital projects orimprovements to the system. As of December 31, 2019 the remaining amount owed under this portion of theagreement is $1,170,805. This balance does not accrue interest and is not required to be paid before any specificdate in accordance with the agreement.
In 2019, the implementation of GASB Statement No. 83, Certain Asset Retirement Obligations, resulted inrecording the following liabilities and were outstanding at the end of December 31, 2019:
In the governmental activities, a liability of $425,000 was recognized for obligations related to four underground and two aboveground fuel tanks (capacities ranging from 3,000 to 10,000 gallons), these tanks provide fuel for the City’s vehicles and equipment. The obligation is legally enforceable by a Colorado State Regulation from the Division of Oil and Public Safety for both aboveground and underground storage tanks. The methods and assumptions used to measure liability was based on historical cost for tank abandonment provided by the Fleet Manager. The estimated remaining life of the underground fuel tanks was determined to be 12 years for three of the four tanks, the fourth tank is estimated at 3 months as it is scheduled to be abandoned in 2020. The estimated remaining life of the two aboveground tanks is 18 years. There are no legal funding requirements or assurances, or restricted amounts for the payment of these liabilities.
In the business-type activities, a liability of $50,000 was recognized for an obligation related to a 4,000 gallon underground fuel tank that provides fuel for a backup generator to one of the City’s pump stations. The obligation is legally enforceable by a Colorado State Regulation from the Division of Oil and Public Safety for Storage Tanks. The methods and assumptions used to measure liability was based on a direct quote obtained by the Utilities Manager. The estimated remaining life of the underground fuel tank was determined to be 9 years. There are no legal funding requirements or assurances, or restricted amounts for the payment of this liability.
40
City of Thornton, Colorado NOTES TO FINANCIAL STATEMENTS
December 31, 2019
NOTE G - LONG-TERM DEBT (CONTINUED) 4. Lease Obligations Operating Leases - The City leases a milling machine used for street operations and copiers used by City
departments. In 2019, the City leased additional copiers for the for the expansion of departments. Lease expenses for the year ended December 31, 2019 were $287,850 for governmental activities. Future minimum lease payments are as follows:
Capitalized Lease Obligations - The City has a lease agreement (as lessee) for golf carts in the governmental activities. The golf carts have a carrying value, net of accumulated depreciation, of $330,923 and have a remaining useful life of 4 years. This year, $98,201 was included in depreciation expense. This agreement qualifies as a capital lease for accounting purposes and, therefore, has been recorded at the present value of future minimum lease payments as of the inception date. The City has the option to purchase the equipment at the end of the lease term.
The City also has a lease for reprographics equipment with a remaining useful life of 4 years at a current value, net
of accumulated depreciation, of $83,976. In 2019, the reprographics fund was consolidated into the General Fund and the lease agreement will now be accounted for in the governmental activites. This year, depreciation expense was $24,920. The agreement qualifies as a capital lease for accounting purposes and, therefore, has been recorded at the present value of future minimum lease payments. The lease contains a purchase option at the end of the lease.
Obligations under capital leases at December 31, 2019 are as follows:
Year Ended
December 31, Government
2020 62,536$
2021 16,226
2022 16,226
2023 16,226
2024 12,168
123,382$
Governmental
Year Ended December 31, Activities
2020 133,614$
2021 133,614
2022 185,201
2023 9,931
Total minimum lease payments 462,360
Less: Amount representing interest costs 28,769
Present value of minimum lease payments 433,591$
41
City of Thornton, Colorado NOTES TO FINANCIAL STATEMENTS
December 31, 2019
NOTE G - LONG-TERM DEBT (CONTINUED) 5. Long-Term Obligation Activity Long-term liability activity for the year ended December 31, 2019 was as follows:
6. Debt Service Requirements Debt service requirements on long-term debt at December 31, 2019 are as follows:
Governmental activities, claims and judgments are generally liquidated by the general fund. Compensated absences would be liquidated by the respective fund where the liablity accrued.
City of Thornton, Colorado NOTES TO FINANCIAL STATEMENTS
December 31, 2019
NOTE G - LONG-TERM DEBT (CONTINUED) 7. Revenues Pledged for Debt Service
The City has pledged future water customer revenues, net of specified operating expenses, to repay $39,380,000 in water revenue refunding bonds. Proceeds from the bonds were used for rejuvenation of the water treatment facilities, improving and expanding water storage, and various other projects. The bonds are payable solely from water customer net revenues and are payable through 2034. Annual principal and interest payments on the bonds are expected to require less than 6% of net revenues. The total principal and interest remaining to be paid on the bonds is $42.8 million. For the year ended December 31, 2019 net available revenues were $48,490,128, principal and interest paid were $1,560,000, and $1,296,644, respectively.
NOTE H - UNEARNED REVENUE The General Fund includes unearned revenue of $98,011, which is related to funds received for the dissolution of a metropolitan district and prefunded permit fees. The Open Space Fund has $9,600 for a property lease. The Water Fund has $126,470 for water and farm leases. NOTE I – RETIREMENT PLANS City employees are covered under one of two different retirement plans, depending on occupation and date of hire. Additionally, the City Manager, the City Attorney, and the presiding Municipal Judge are covered under their own separate retirement plans. All plans and plan amendments are approved by City Council as single-employer, defined contribution plans, qualified under IRS guidelines, except the fire and police pension plans, an agent multiple-employer defined benefit plan and a cost sharing multiple-employer defined benefit plan. In early 2017, City Council passed a resolution to reaffiliate with the Fire and Police Pension Association (FPPA), a multiple-employer defined benefit plan. Sworn police and firefighters hired before July 10, 2017 were given the option to remain in the City’s local money purchase plan or reenter FPPA. Sworn police and firefighters hired on or after July 10, 2017 are enrolled in the FPPA Statewide Defined Benefit plan (SWDB). At December 31, 2019, the City reported the following aggregate amounts related to the FPPA plans to which it contributes:
All plans are administered by outside trustees and do not meet the standards of accounting principles generally accepted in the United States of America for inclusion as part of the reporting entity. For purposes of measuring the net pension liability, net pension asset, deferred outflows of resources and deferred inflows of resources related to pensions, and pension expense, information about the fiduciary net position of the City Fire and Police Pension Plans and additions to/deductions from the Fire and Police Pension Plans fiduciary net positon have been determined on the same basis as they are reported by the Fire and Police Pension Association of Colorado (FPPA). For this purpose, benefit payments (including refunds of employee contributions) are recognized when due and payable in accordance with benefit terms. Investments are reported at fair value. A description of each plan and selected financial information follows.
Statement of Net Position and Governmental Statement of Activities Activities
Net pension liabilities 8,172,824$ Net pension asset 1,178,999 Deferred outflows of resources 18,806,536 Deferred inflows of resources 5,303,492 Pension income 5,049,043
43
City of Thornton, Colorado NOTES TO FINANCIAL STATEMENTS
December 31, 2019
NOTE I – RETIREMENT PLANS (CONTINUED) 1. Defined Contribution Money Purchase Plans
a. Regular Employee Money Purchase Plan
Plan Description. The Regular Employee Money Purchase Plan is a single employer defined contribution plan maintained for regular employees. Assets are administered and held by ICMA Retirement Corporation. The plan requires mandatory employee pre-tax contributions to the plan of 6% of base pay. The City also contributes 6.85% of employees’ base pay to the plan. The plan requires employee participation in the plan immediately upon date of hire. Vesting of employer contributions is as follows: 0% in employer contributions for the first 2 years, 30% at 3 years, 40% at 4 years, and 100% at 5 years of service; and forfeited contributions may be used to offset future employer contributions. Benefit terms are established and amended on the authority of City Council. Funding. Employer contributions are funded every pay period by the governmental and proprietary funds. The City's contributions for 2019 were $3,474,597 (which includes the City’s match for voluntary contributions). City employees’ mandatory contributions for 2019 were $2,771,387. The City’s contributions were offset by $232,851 in employee forfeitures.
b. City Manager, City Attorney and presiding Municipal Judge Money Purchase Plan (Contract Employee Plan) Plan Description. The Contract Employee Plan is a single employer defined contribution plan maintained for the City Manager, City Attorney, and presiding Municipal Judge. Assets are administered and held by ICMA Retirement Corporation. Funding. Employer contributions are funded every pay period by the General Fund and the terms of the plan are negotiated periodically as a part of their employment contract. The City and employee contributions for 2019 were $56,377 and $58,530 respectively.
c. Firefighters Money Purchase Plan
Plan Description. The Firefighters Employee Money Purchase Plan is a single employer defined contribution plan maintained for all full-time firefighters hired on or after January 1, 1994 and before July 10, 2017. Firefighters hired before July 10, 2017 were given the option to remain in the City’s local money purchase plan or reenter FPPA. Assets are administered and held by ICMA Retirement Corporation. The plan requires mandatory employee contributions of 8% of base pay. The City’s contribution is also 8% of base pay. Vesting of employees is as follows: 0% in employer contributions for the first 2 years, 30% at 3 years, 40% at 4 years, and 100% at 5 years of service; and forfeited contributions may be used to offset future employer contributions. Benefit terms are established and amended on the authority of City Council.
Funding. Employer contributions are funded every pay period from the General Fund. The City’s contributions for 2019 were $218,471 (which included the City’s match for voluntary contributions). The City firefighters’ mandatory contributions for 2019 were $218,471. The City’s contributions were offset by $61 in employee forfeitures.
d. Police Money Purchase Plan
Plan Description. The Police Money Purchase Plan is a single employer defined contribution plan maintained for all full-time, sworn police officers hired before July 10, 2017. Sworn police hired before July 10, 2017 were given the option to remain in the City’s local money purchase plan or reenter FPPA. Assets are administered and held by ICMA Retirement Corporation. The plan requires mandatory employee contributions of 10% of base pay. The City’s contribution is also 10% of base pay. Vesting of employer contributions is as follows: 0% in employer contributions for the first 2 years, 30% at 3 years, 40% at 4 years, and 100% at 5 years of service; and forfeited contributions may be used to offset future employer contributions. Benefit terms are established and amended on the authority of City Council. Funding. Employer contributions are funded every pay period from the General Fund. The City's contributions for 2019 were $231,735 (which includes the City’s match for voluntary contributions). The City police employees' mandatory contributions for 2019 were $231,735.
44
City of Thornton, Colorado NOTES TO FINANCIAL STATEMENTS
December 31, 2019
NOTE I – RETIREMENT PLANS (CONTINUED) 1. Defined Contribution Money Purchase Plans (Continued)
e. Fire and Police Statewide Money Purchase Plan
Plan Description. The Fire & Police Statewide Money Purchase Plan is a multiple-employer defined contribution pension plan, for full-time and part-time firefighters and police officers, as well as its full-time and part-time administrative employees whose services are auxiliary to fire protection. The plan is administered by the Fire & Police Pension Association of Colorado. The Fire & Police Pension Association of Colorado issues a publicly available financial report that can be obtained at www.fppaco.org. Funding. Contributions to the plan are calculated as a percentage of the member’s base salary, which is specified by state statute. For Firefighter members, the plan requires mandatory employee contributions of 8% of base pay, which is matched by the City. For Police Officer members the plan requires mandatory employee contributions of 10% of base pay, which is matched by the City.
f. Fire and Police Statewide Money Purchase Plan
Employer and member contributions are invested in funds at the discretion of members. Members are always fully vested in their own contributions, and the earnings on those contributions. Vesting in the City’s contributions and earnings on those contributions occurs according to the vesting schedule set by state statute at 20% per year after the first year of service to be 100% vested after 5 years of service. Unvested City contributions and earnings thereon are forfeited upon termination of employment. Such forfeitures are used to cover a portion of the pension plan’s administrative expenses. Any administrative expenses not covered by forfeitures are charged directly to member accounts. Benefit terms are established and amended through collective bargaining agreements between the City of Thornton and the Thornton Firefighters Local Number 2376, International Association of Firefighters and the Fraternal Order of Police, Thornton Lodge 16. Employees are permitted to make contributions to the pension plan, up to applicable Internal Revenue Code limits. Employer contributions are funded every pay period from the General Fund. For the year ended December 31, 2019, City and employee contributions were $34,965 and $34,965, respectively.
2. Fire and Police Pension Plans
a. Fire and Police Pension Old Hire Fire Pension Plan
Plan Description. The City Fire Pension Plan (the Old Hire Plan), a defined benefit pension plan, established in accordance with Colorado law, covers all full-time firefighters hired prior to April 8, 1978. All plan assets held by the City were transferred in January 1986 to FPPA, an agent multiple-employer defined benefit pension plan. The City’s fire department transferred out of the City, into a joint venture fire district in 1994. The fire district dissolved on December 31, 1999, and the fire department rejoined the City on January 1, 2000. The maintenance of total plan assets sufficient to pay the benefits relating to contributions prior to January 1, 1994 was the responsibility of the City while the firefighters were members of the fire district.
Participants are eligible for plan benefits at the age of 50 and after completing twenty years of active service. Plan benefits consist of a monthly pension of up to 70.0% of monthly salary as of the date of retirement. Additional surviving spouse benefits of lesser amounts are also available. In accordance with a 1976 decision by the Colorado Supreme Court, the City must return all individual employee contributions upon termination. FPPA issues a publicly available financial report that includes financial statements for the Old Hire Plan. The FPPA Comprehensive Annual Financial report can be obtained on FPPA’s website at www.fppaco.org. Funding Policy. The Old Hire Plan funding policy provides for periodic City and participant contributions. As required by the plan, Old Hire Plan participants were required to contribute 5.0% of covered payroll and the City was also required to contribute 5.0%. This contribution requirement was not actuarially determined. As of December 31, 2019, there are no active participants and 20 inactive employees or beneficiaries currently receiving benefits. In 2019, there were no contributions made by participants.
Pension Liability. At December 31, 2019, the City reported a net pension liability of $3,325,918 for the Old Hire Plan. The total pension liability is based on an actuarial valuation performed as of January 1, 2019 and a measurement date of December 31, 2018. Standard update procedures were used to roll forward the total pension liability to December 31, 2018.
45
City of Thornton, Colorado NOTES TO FINANCIAL STATEMENTS
December 31, 2019
NOTE I – RETIREMENT PLANS (CONTINUED)
2. Fire and Police Pension Plans (continued) a. Fire and Police Pension Old Hire Fire Pension Plan (continued)
Actuarial Assumptions. The significant actuarial assumptions used to determine contribution rates are as follows:
Actuarial Method Entry Age Normal Inflation 2.5% Salary Increases N/A Single Discount Rate 7.50% Investment Rate of Return 7.50% Retirement Age Any remaining actives are assumed to retire immediately. Mortality Post-retirement: For ages less than 55, RP-2014 Mortality Tables for Blue Collar
Employees. For ages 65 and older, RP-2014 Mortality Tables for Blue Collar Healthy Annuitants. For ages 55 through 64, a blend of the previous tables. All tables are projected with Scale BB. Disabled (pre-1980): RP-2014 Disabled Generational Mortality Table generationally projected with Scale BB with a minimum 3% rate for males and 2% rate for females.
Actuarial determined contribution rates are calculated as of January 1 of even numbered years. The contribution rates have a one-year lag, so the actuarial valuation as of January 1, 2016, determines the contribution amounts for 2017 and 2018.
The long-term expected rate of return on pension plan investments was determined using a building-block method in which best-estimate ranges of expected future real rates of return (expected returns, net of pension plan investment expense and inflation) are developed for each major asset class. These ranges are combined to produce the long-term expected rate of return by weighing the expected future real rates of return by the target asset allocation percentage and by adding expected inflation. Best estimates of arithmetic nominal rates of return for each major asset class included in the Fund's target asset allocation as of December 31, 2018 are summarized in the following table:
Discount Rate. The discount rate used to measure the total pension liability was 7.50%. The projection of cash flows used to determine the discount rate assumed that contributions from participating employers will be made based on the actuarially determined rates based on the Board's funding policy, which establishes the contractually required rates under Colorado statutes. Based on those assumptions, the OH – Defined Benefit Component plan fiduciary net position was projected to be available to make all the projected future benefit payments of current plan members. Therefore, the long-term expected rate of return on pension plan investments was applied to all periods of projected benefit payments to determine the total pension liability.
Long-termTarget Expected
Asset Class Allocation Rate of ReturnGlobal Equity 37.0% 8.0%Equity Long/Short 9.0% 6.5%Private Markets 24.0% 10.0%Fixed Income 15.0% 2.9%Absolute Return 9.0% 5.1%Managed Futures 4.0% 5.4%Cash 2.0% 2.5%Total 100.0%
46
City of Thornton, Colorado NOTES TO FINANCIAL STATEMENTS
December 31, 2019
NOTE I – RETIREMENT PLANS (CONTINUED) 2. Fire and Police Pension Plans (Continued)
a. Fire and Police Pension Old Hire Fire Pension Plan (continued)
Changes in the Net Pension Liability.
Regarding the sensitivity of the net pension liability/(asset) to changes in the Single Discount Rate, the following presents the plan's net pension liability/(asset), calculated using a Single Discount Rate of 7.50%, as well as what the plan's net pension liability/(asset) would be if it were calculated using a Single Discount Rate that is one percent lower or one percent higher:
Pension Plan Fiduciary Net Position. Detailed information about the pension plan’s fiduciary net position is available in the separately issued FPPA financial reports. Pension Income. For the year ended December 31, 2019, the City recognized pension income of $28,232 for the Old Hire Plan. Pension Deferred Outflows/Inflows of Resources. At December 31, 2019, the City reported deferred outflows of resources and deferred inflows of resources related to pensions from the following sources:
Total Plan NetPension Fiduciary PensionLiability Net Position Liability
(a) (b) (a) - (b)
Balances at December 31, 2018 7,521,062$ 4,461,411$ 3,059,651$ Changes for the year: Service cost - - - Interest 535,048 - 535,048 Benefit Changes - - - Differences between expected and actual experience - - - Contributions - employer - 269,653 (269,653) Contributions - employee - - - Net investment income - 7,900 (7,900) Benefit payments, including refunds of employee contributions (788,438) (788,438) - Administrative expense - (8,772) 8,772 Change in assumptions - - - Net changes (253,390) (519,657) 266,267
Balance at December 31, 2019 7,267,672$ 3,941,754$ 3,325,918$
Increase (Decrease)
1% Single Discount Rate 1%Decrease Assumption Increase6.50% 7.50% 8.50%
City's net pension liability 3,888,626$ 3,325,918$ 2,834,553$
Deferred Deferred Outflows of Inflows ofResources Resources
Difference between expected and actual experience -$ -$ Changes of assumptions - - Difference between projected and actual investment earnings 154,050 - City contributions subsequent to the measurement date 337,419 - Total 491,469$ -$
47
City of Thornton, Colorado NOTES TO FINANCIAL STATEMENTS
December 31, 2019
NOTE I – RETIREMENT PLANS (CONTINUED) 2. Fire and Police Pension Plans (Continued)
a. Fire and Police Pension Old Hire Fire Pension Plan (continued)
The $337,419 reported as deferred outflows of resources are related to City contributions subsequent to the measurement date and will be recognized as a reduction of the net pension liability in the year ended December 31, 2019. Other amounts reported as deferred outflows of resources related to the Old Hire plan will be recognized in pension expense as follows:
b. Fire and Police Pension Statewide Defined Benefit Plan
Plan Description. The Statewide Defined Benefit Plan (SWDB) is a cost-sharing multiple-employer defined benefit pension plan covering substantially all full-time employees of participating fire or police departments in Colorado hired on or after April 8, 1978 (New Hires), provided that they are not already covered by a statutorily exempt plan. As of August 5, 2003, the Plan may include clerical and other personnel from fire districts whose services are auxiliary to fire protection. The Plan became effective January 1, 1980. The Plan assets are included in the Fire & Police Members’ Benefit Investment Fund and the Fire & Police Members’ Self-Directed Investment Fund (for Deferred Retirement Option Plan (DROP) assets and Separate Retirement Account assets from eligible retired members). The Plan is administered by the Fire & Police Pension Association of Colorado (FPPA). FPPA issues a publicly available comprehensive annual financial report that can be obtained on FPPA’s website at www.fppaco.org.
The City’s fire department transferred out of the City, into a joint venture fire district in 1994. The fire district dissolved on December 31, 1999, and the fire department rejoined the City on January 1, 2000. The New Hire Plan was not the responsibility of the City while the firefighters were members of the fire district. A member is eligible for a normal retirement pension once the member has completed twenty-five years of credited service and has attained the age of 55. The annual normal retirement benefit is 2% of the average of the member's highest three years' base salary for each year of credited service up to ten years, plus 2.5% for each year of service thereafter. The benefit earned prior to January 1, 2007 for members of affiliated Social Security employers will be reduced by the amount of Social Security income payable to the member annually. Effective January 1, 2007, members currently covered under Social Security will receive half the benefit when compared to the Statewide Defined Benefit Plan. Benefits paid to retired members are evaluated and may be re-determined every October 1. The amount of any increase is based on the Board's discretion and can range from 0% to the higher of 3% or the Consumer Price Index. A member is eligible for an early retirement after completion of 30 years of service or attainment of age 50 with at least five years of credited service. The early retirement benefit equals the normal retirement benefit reduced on an actuarially equivalent basis. Upon termination, an employee may elect to have member contributions, along with 5% as interest, returned as a lump sum distribution. Alternatively, a member with at least five years of accredited service may leave contributions with the Plan and remain eligible for a retirement pension at age 55 equal to 2% of the member's average highest three years' base salary for each year of credited service up to ten years, plus 2.5% for each year of service thereafter.
Funding Policy. The Statewide Defined Benefit Plan (SWDB) sets contribution rates at a level that enables all benefits to be fully funded at the retirement date of all members. Contribution rates for the SWDB plan are set by state statute, and employer contribution rates can only be amended by state statute. The current employer contribution rate is 8% for all firefighters, regardless of hire date, and 8% for all police hired after July 10, 2017. For police hired before July 10, 2017, the statutory required employer contribution is 8%, the City contributes 10% based on an underlying contractual commitment between the City and police. Member contribution rates can be amended by state statute or election of the membership. The current member contribution rate for of the SWDB is 10.5% of base salary. Member contribution rates will increase 0.5% annually through 2022 to a total of 12% of base salary.
Year ending December 31
2020 73,650 2021 19,401 2022 (457) 2023 61,456 Total 154,050$
48
City of Thornton, Colorado NOTES TO FINANCIAL STATEMENTS
December 31, 2019
NOTE I – RETIREMENT PLANS (CONTINUED) 2. Fire and Police Pension Plans (Continued)
b. Fire and Police Pension Statewide Defined Benefit Plan (continued)
Firefighters covered under this plan may elect an optional account known as the “deferred retirement option plan” or “DROP” within five years prior to retirement. The purpose of DROP is to allow an eligible participant to elect, in lieu of immediate termination of employment and receipt of a service retirement benefit, to continue employment for a specified period of time not to exceed five years, coupled with the deferral of actual receipt of retirement benefits until the end of such specified period, at which time employment shall cease. Once a participant elects a DROP, the City is no longer required to match that participant’s contribution. As of December 31, 2019, one active participant in this plan had elected a DROP. The City’s contributions to the Plan for the year ending December 31, 2019 were $2,239,975. Pension Liability. At December 31, 2019, the City reported a liability of $4,846,906 for its proportionate share of the SWDB net pension liability. The total pension liability is based on an actuarial valuation performed as of January 1, 2019 and a measurement date of December 31, 2018. Standard update procedures were used to roll forward the total pension liability to December 31, 2018. The City’s reported liability at December 31, 2019, increased to $4,846,906 from the City’s prior year asset of $1,686,561 because of changes in the SWDB net pension liability and the City’s proportionate share of that liability. The SWDB Plan’s publicly available financial report provides details on the change in the net pension liability. The City’s proportion of the net pension (asset)/liability was based on contributions received and processed by employers that were members of the SWDB plan within the year ended December 31, 2018. The City’s proportion measured as of December 31, 2018, was 3.833744%, which was a increase of 2.661428% from its proportion measured as of December 31, 2017. Pension Expense and Deferred Outflows/Inflows of Resources. For the year ended December 31, 2019, the City recognized a pension income for the SWDB plan of $4,363,999. At December 31, 2019, the City reported deferred outflows of resources and deferred inflows of resources related to pensions from the following sources:
The $2,239,975 reported as deferred outflows of resources related to the SWDB Plan resulting from City contributions subsequent to the measurement date will be recognized as a reduction of the net pension asset in the year ended December 31, 2020. Other amounts reported as deferred outflows of resources and deferred inflows of resources related to the SWDB Plan will be recognized in pension expense as follows:
Deferred Deferred Outflows of Inflows ofResources Resources
Difference between expected and actual experience 6,176,081$ -$ Changes of assumptions 4,694,071 - Difference between projected and actual investment earnings 3,812,837 - Changes in proportion and differences between City contributions and proportionate share of contributions - 4,097,754 City contributions subsequent to the measurement date 2,239,975 - Total 16,922,964$ 4,097,754$
City of Thornton, Colorado NOTES TO FINANCIAL STATEMENTS
December 31, 2019
NOTE I – RETIREMENT PLANS (CONTINUED) 2. Fire and Police Pension Plans (Continued)
b. Fire and Police Pension Statewide Defined Benefit Plan (continued)
Actuarial Assumptions. The actuarial valuations for the Statewide Defined Benefit Plan were used to determine the total pension liability and actuarially determined contributions for the fiscal year ending December 31, 2018. The valuations used the following actuarial assumption and other inputs: Total Pension Liability Actuarial Determined
Contributions Actuarial Valuation Date January 1, 2019 January 1, 2018 Actuarial Method Entry Age Normal Entry Age Normal Amortization Method N/A Level % of Payroll, Open Amortization Period N/A 30 Long-term Investment Rate of Return* 7.0% 7.5% Projected Salary Increases* 4.25% - 11.25% 4.0% - 14.0% Cost of Living Adjustments (COLA) 0.0% 0.0% *Includes Inflation at 2.5% 2.5%
For determining the total pension liability, the post-retirement mortality tables for non-disabled retirees uses the 2006 central rates from RP-2014 Annuitant Mortality Tables projected to 2018 using the MP-2017 projection scales, and the projected prospectively using the ultimate rates of the scale for all years. The pre-retirement off-duty mortality tables are adjusted to 50% of the RP-2014 mortality tables for active employees. The on-duty mortality rate is 0.00015 off-duty mortality tables are adjusted to 50% of the RP-2014 mortality tables for active employees. The on-duty mortality rate is 0.00015.
For determining the actuarial determined contributions, the post-retirement mortality tables for non-disabled retirees is a blend of the Annuitant and Employee RP-2014 generational mortality tables with blue collar adjustment projected with Scale BB. The pre-retirement off-duty mortality tables are adjusted to 55% of the RP-2014 mortality tables for active employees. The on-duty mortality rate is 0.00020. At least every five years the FPPA’s Board of Directors, in accordance with best practices, reviews its economic and demographic actuarial assumptions. At its July 2018 meeting, the Board of Directors reviewed and approved recommended changes to the actuarial assumptions. The recommendations were made by the FPPA’s actuaries, Gabriel, Roeder, Smith & Co., based upon their analysis of past experience and expectations of the future. The assumption changes were effective for actuarial valuations beginning January 1, 2019 and were used in the rollforward calculation of total pension liability as of December 31, 2018. Actuarial assumptions effective for actuarial valuations prior to January 1, 2019 were used in the determination of the actuarially determined contributions as of December 31, 2018. The Actuarial assumptions impact actuarial factors for benefit purposes such as purchases of service credit and other benefits where actuarial factors are used. The long-term expected rate of return on pension plan investments was determined using a building-block method in which best-estimate ranges of expected future real rates of return (expected returns, net of pension plan investment expense and inflation) are developed for each major asset class. These ranges are combined to produce the long-term expected rate of return by weighing the expected future real rates of return by the target asset allocation percentage and by adding expected inflation. Best estimates of arithmetic real rates of return for each major asset class included in the Fund's target asset allocation as of December 31, 2018 are summarized in the following table:
Long-termTarget Expected
Asset Class Allocation Rate of ReturnGlobal Equity 37.0% 8.0%Equity Long/Short 9.0% 6.5%Private Markets 24.0% 10.0%Fixed Income 15.0% 2.9%Absolute Return 9.0% 5.1%Managed Futures 4.0% 5.4%Cash 2.0% 2.5%Total 100.0%
50
City of Thornton, Colorado NOTES TO FINANCIAL STATEMENTS
December 31, 2019
NOTE I - RETIREMENT PLANS (CONTINUED) 2. Fire and Police Pension Plans (Continued)
b. Fire and Police Pension Statewide Defined Benefit Plan (continued)
Discount Rate. The discount rate used to measure the total pension liability was 7.00%. The projection of cash flows used to determine the discount rate assumed that contributions from participating employers will be made based on the actuarially determined rates based on the Board's funding policy, which establishes the contractually required rates under Colorado statutes. Based on those assumptions, the SWDB plan fiduciary net position was projected to be available to make all the projected future benefit payments of current plan members. Therefore, the long-term expected rate of return on pension plan investments was applied to all periods of projected benefit payments to determine the total pension liability. Regarding the sensitivity of the net pension liability/(asset) to changes in the Single Discount Rate, the following presents the plan's net pension liability/(asset), calculated using a Single Discount Rate of 7.00%, as well as what the plan's net pension liability/(asset) would be if it were calculated using a Single Discount Rate that is one percent lower or one percent higher:
Pension Plan Fiduciary Net Position. Detailed information about the pension plan’s fiduciary net position is available in the separately issued SWDB financial report.
c. Fire and Police Pension Statewide Hybrid Plan – Defined Benefit Component
Plan Description. The Statewide Hybrid Plan (SWH) is a cost-sharing multiple-employer defined benefit pension plan offered to Sworn Police and Firefighters hired before July 10, 2017 that chose to reaffiliate with FPPA in 2017. The SWH is comprised of two components: Defined Benefit and Money Purchase. The plan assets associated with the Defined Benefit Component are included in the Fire & Police Members’ Benefit Investment Fund and the Plan assets associated with the Money Purchase Component and Deferred Retirement Option Plan (DROP) assets are included in the Fire & Police Members’ Self-Directed Investment Plan. The plan is administered by the Fire & Police Pension Association of Colorado (FPPA). FPPA issues a publicly available comprehensive annual financial report which can be obtained on FPPA’s website at www.fppaco.org. The SWH Plan document states that any member may retire from further service and become eligible for a normal retirement pension at any time after age 55, if the member has at least 25 years of service. The annual normal pension of the Defined Benefit Component is 1.5% of the average of the member’s highest three years’ base salary for each year of credited service. Benefits paid to retired members of the Defined Benefit Component are evaluated and may be re-determined annually on October 1. The amount of any increase is based on the FPPA Board’s discretion and can range from 0% to 3%. A member is eligible for early retirement within the Defined Benefit Component after completion of 30 years of service or attainment of age 50 with at least five years of credited service. The early retirement benefit equals the normal retirement benefit reduced on an actuarially equivalent basis. Upon termination, a member may elect to have all contributions, along with 5% as interest, returned as a lump sum distribution from the Defined Benefit Component. Alternatively, a member with at least five years of accredited service may leave contributions with the Defined Benefit Component of the Plan and remain eligible for a retirement pension at age 55 equal to 1.5% of the average of the member’s highest three years’ base salary for each year of credited service. Funding Policy. The Plan sets contribution rates at a level that enables all benefits to be fully funded at the retirement date of all members. Contribution rates are determined by the City, however, the plan requires a minimum rate for both employer and members be at least 8% of the member’s base salary. The amount allocated to the Defined Benefit Component is set annually by the FPPA Board of Directors. Excess contributions fund the Money Purchase Component of the Plan. Firefighters have a mandatory 8% member contribution rate and Police Officers have a mandatory 10% contribution rate, both matched equally by the City.
City of Thornton, Colorado NOTES TO FINANCIAL STATEMENTS
December 31, 2019
NOTE I - RETIREMENT PLANS (CONTINUED) 2. Fire and Police Pension Plans (Continued)
c. Fire and Police Pension Statewide Hybrid Plan – Defined Benefit Component (continued)
Within the Money Purchase Component, members are always fully vested in their own contributions, as well as the earnings on those contributions. Vesting in the employer’s contributions within the Money Purchase Component, and earnings on those contributions occurs according to the vesting schedule set by the plan document at 20% per year after the first year of service to be 100% vested after 5 years of service. Employer and member contributions are invested in funds at the discretion of members. Pension Asset. At December 31, 2019, the City reported an asset of $1,178,999 for its proportionate share of the SWH net pension asset. The total pension asset is based on an actuarial valuation performed as of January 1, 2019 and a measurement date of December 31, 2018. The SWH publicly available financial report provides details on the change in the net pension asset. The City’s proportion of the net pension asset was based on contributions received and processed by employers that were members of the SWH plan within the year ended December 31, 2018. The City’s proportion measured as of December 31, 2018, was 8.541335%. Pension Expense and Deferred Outflows/Inflows of Resources. For the year ended December 31, 2019, the City recognized a pension income for the Hybrid Plan of $656,812. At December 31, 2019 the City reported deferred outflows and inflows of resources and deferred outflows and deferred inflows of resources related to pension from the following sources:
The $139,351 reported as a deferred outflow of resources resulting from the City contributions subsequent to the measurement date will be recognized as a reduction of the net pension liability in the year ended December 31, 2020. Other amounts reported as deferred outflows of resources and deferred inflows of resources related to the Hybrid Plan will be recognized in pension expense as follows:
Deferred Deferred Outflows of Inflows ofResources Resources
Difference between expected and actual experience 829,364$ -$ Changes of assumptions 171,645 - Difference between projected and actual investment earnings 251,743 - Changes in proportion and differences between City contributions and proportionate share of contributions - 1,205,738 City contributions subsequent to the measurement date 139,351 - Total 1,392,103$ 1,205,738$
City of Thornton, Colorado NOTES TO FINANCIAL STATEMENTS
December 31, 2019
NOTE I - RETIREMENT PLANS (CONTINUED) 2. Fire and Police Pension Plans (Continued)
c. Fire and Police Pension Statewide Hybrid Plan – Defined Benefit Component (continued)
Actuarial Assumptions. The actuarial valuations for the Statewide Defined Benefit Plan were used to determine the total pension liability and actuarially determined contributions for the fiscal year ending December 31, 2018. The valuations used the following actuarial assumption and other inputs:
Total Pension Liability Actuarial Determined
Contributions Actuarial Valuation Date January 1, 2019 January 1, 2018 Actuarial Method Entry Age Normal Entry Age Normal Amortization Method N/A Level % of Payroll, Open Amortization Period N/A 30 Years Long-term Investment Rate of Return* 7.0% 7.5% Projected Salary Increases* 4.25% - 11.25% 4.0% - 14.0% Cost of Living Adjustments (COLA) 0.0% 0.0% *Includes Inflation at 2.5% 2.5%
For determining the total pension liability, the post-retirement mortality tables for non-disabled retirees uses the 2006 central rates from the RP-2014 Annuitant Mortality Tables projected to 2018 using the MP-2017 projection scales, and the projected prospectively using the ultimate rates of the scale for all years. The pre-retirement off duty mortality tables are adjusted to 50% of the RP-2014 mortality tables for active employees. The on-duty mortality rate is 0.00015. For determining the actuarial determined contributions, the post-retirement moratlity tables for non-disabled retirees is a blend of the Annuitant and Employee RP-2014 generational mortality tables with blue collar adjustment projected with Scale BB. The pre-retirement off-duty mortality tables are adjusted to 55% of the RP-2014 mortality tables for active employees. The on-duty mortality rate is 0.00020. At least every five years the FPPA’s Board of Directors, in accordance with best practices, review its economic and demographic actuarial assumptions. The recommendations were made by the FPPA actuaries, Gabriel, Roeder, Smith & Co., based upon their analysis of past experience and expectations of the fugure. The assumption changes were effective for actuarial valuations beginning January 1, 2019 and were used in the follforward calculation of total pension liability as of December 31, 2018. Actuarial assumptions effective ofr actuarial valuation prior to January 1, 2019 were used the determination of the actuarially determined contributions os of December 31, 2018. The actuarial assumptions impact actuarial factors for benefit purposes such as purchases of service credit and other benefits where actuarial factors are used. The long-term expected rate of return on pension plan investments was determined using a building-block method in which best-estimate ranges of expected future real rates of return (expected returns, net of pension plan investment expense and inflation) are developed for each major asset class. These ranges are combined to produce the long-term expected rate of return by weighing the expected future real rates of return by the target asset allocation percentage and by adding expected inflation (assumed at 2.5%). Best estimates of arithmetic real rates of return for each major asset class included in the Fund's target asset allocation as of December 31, 2018 are summarized in the following table:
Long-termTarget Expected
Asset Class Allocation Rate of ReturnGlobal Equity 37.0% 8.0%Equity Long/Short 9.0% 6.5%Private Markets 24.0% 10.0%Fixed Income 15.0% 2.9%Absolute Return 9.0% 5.1%Managed Futures 4.0% 5.4%Cash 2.0% 2.5%Total 100.0%
53
City of Thornton, Colorado NOTES TO FINANCIAL STATEMENTS
December 31, 2019
NOTE I - RETIREMENT PLANS (CONTINUED) 2. Fire and Police Pension Plans (Continued)
c. Fire and Police Pension Statewide Hybrid Plan – Defined Benefit Component (continued)
Discount Rate. The discount rate used to measure the total pension liability was 7.00%. The projection of cash flows used to determine the discount rate assumed that contributions from participating employers will be made based on the actuarially determined rates based on the Board's funding policy, which establishes the contractually required rates under Colorado statutes. Based on those assumptions, the SWH –Defined Benefit Component plan fiduciary net position was projected to be available to make all the projected future benefit payments of current plan members. Therefore, the long-term expected rate of return on pension plan investments was applied to all periods of projected benefit payments to determine the total pension liability. Regarding the sensitivity of the net pension liability/(asset) to changes in the Single Discount Rate, the following presents the plan's net pension liability/(asset), calculated using a Single Discount Rate of 7.00%, as well as what the plan's net pension liability/(asset) would be if it were calculated using a Single Discount Rate that is one percent lower or one percent higher:
NOTE J - DEFERRED COMPENSATION The City offers all regular City employees a deferred compensation plan created in accordance with Internal Revenue Code Section 457. The plan permits participants to defer a portion of their salary until future years. The general employees’, police, and fire voluntary contributions are made to the 457 plan. Employees can contribute a maximum of $19,000 per year ($25,000 if age 50 or more). The City matches 50% of employee contributions up to a maximum of 1% of base pay for general employees and Police, and up to 2% for Fire. For 2019, the general employees’ voluntary contributions were $1,961,340, the police employees’ voluntary contributions were $833,129 and the fire employees’ voluntary contributions were $564,535 for a total of $3,359,004. Withdrawals must begin at age 70 1/2, or can be made upon termination of employment, death, or unforeseeable emergency. Withdrawals due to unforeseeable emergency may be subject to IRS penalties for early withdrawal. ICMA Retirement Corporation, an independent trustee, administers funds for this plan. The City maintains accounting records. The trustee provides participants with quarterly statements of contributions, withdrawals and earnings. NOTE K – OTHER POSTEMPLOYMENT BENEFITS 1. Defined Benefit Post-Employment Health Care Plan Plan Description. The City of Thornton provides a single‐employer defined benefit post‐employment health care plan that covers eligible retired employees of the City. An employee must be enrolled in the health plan at the time of retirement, and must be at least age 62 with 10 or more years of continuous service or have at least 20 years of continuous service at any age, to be eligible for retiree benefits. There is currently no age cut‐off, but after December 31, 2019 coverage will not be available for retirees age 65 or above or those who are below age 65 and eligible for Medicare. Dependents may also enroll in the plan and their coverage ceases upon the termination of the retiree’s coverage or upon reaching Medicare eligibility or age 65. The medical plan is fully insured. Benefits Provided. The City provides medical, dental and vision benefits for retirees. There are four medical plans insured by CIGNA and two medical plans insured by Kaiser. Two dental plans are offered by Delta Dental. The vision plan is provided by VSP. The retiree benefits are the same as those provided for active employees, with the exception of the Kaiser High Deductible Plan, retirees are not eligible for this plan, however, there is an additional medical plan for retirees over the age of 65 offered through Kaiser.
1% Single Discount Rate 1%Decrease Assumption Increase
6.0% 7.0% 8.0%City's proportionate share of
the net pension liability (asset) (578,111)$ (1,178,999)$ (1,682,742)$
54
City of Thornton, Colorado NOTES TO FINANCIAL STATEMENTS
December 31, 2019
NOTE K – OTHER POSTEMPLOYMENT BENEFITS (CONTINUED) 1. Defined Benefit Post-Employment Health Care Plan (continued) Funding Policy. The City of Thornton establishes and amends contribution requirements. The current funding policy of the City is to pay health insurance premiums as they occur. This arrangement does not qualify as other postemployment benefits (OPEB) plan assets under GASB Statement No. 75 for current GASB reporting.
Contributions. Retirees pay 100% of the total premium. There is an explicit City contribution of 88% of the premium for disabled retirees. There is no explicit City contribution for other retirees. The 2019 monthly premiums for retirees are shown in the table below.
Employees Covered by Benefit Terms. In 2019, there were 945 active and 43 inactive employees covered by the plan.
Total OPEB Liability. The City’s total OPEB liability is $4,480,192 as of December 31, 2019 and was determined by an actuarial valuation as of that date.
Actuarial Methods and Assumptions. The actuarial assumptions used in the valuation represent a reasonable long‐term expectation of future OPEB outcomes. The assumptions are tested with each valuation for ongoing reasonableness and are updated if appropriate.
Change in Total OPEB Liability.
Sensitivity of the Total OPEB Liability to Changes in the Discount Rate. The following table presents the total OPEB liability of the City, as well as what the City’s total OPEB liability would be if it were calculated using a discount rate that is 1‐percentage‐point lower or higher than the current discount rate.
Inflation 3%Salary Increases 3.50%Discount Rate 3.26%Health care cost trend rates 6.4% in 2019 decreasing 0.2% per year to an ultimate rate of 5% for 2026
and later yearsMortality rates RP-2014 Generational Table using MP 2015 projections scale applied on a
gender-specific basisExcise Tax This tax was repealedThe discount rate was based on S&P Municipal Bond 20 Year High Grade Index as of December 31, 2019.
Total OPEB Liability
Balance as of December 31, 2018 4,443,777$ Changes for the year:
Service cost 208,610 Interest 144,867 Change of benefit terms - Difference between expected and actual experience (93,021) Changes in assumptions or other inputs (85,101) Benefit payments (138,940)
Net changes 36,415 Balance as of December 31, 2019 4,480,192$
Total OBEP Liability 5,041,200 $ 4,480,192 $ 3,997,858 $
55
City of Thornton, Colorado NOTES TO FINANCIAL STATEMENTS
December 31, 2019
NOTE K – OTHER POSTEMPLOYMENT BENEFITS (CONTINUED) 1. Defined Benefit Post-Employment Health Care Plan (continued)
Sensitivity of the Total OPEB Liability to Changes in the Healthcare Cost Trend Rates. The following table presents the total OPEB liability of the City, as well as what the City’s total OPEB liability would be if it were calculated using a medical trend rate that is 1‐percentage‐point lower or higher than the current trend rate.
OPEB Expense and Deferred Inflows and Outflows. Changes in the total OPEB liability due to: (1) changes in actuarial assumptions or (2) differences between expected actuarial experience and actual experience are deferred and recognized in the OPEB expense over a closed period equal to the average expected remaining service lives of employees and retirees, starting with the current reporting period. The average remaining service lives as of December 31, 2019 is 5.82 years.
Amounts reported as Deferred Outflows of Resources related to OPEB as of December 31, 2019 will be recognized in OPEB Expense as follows:
Amounts reported as deferred outflows of resources and deferred inflows of resources related to OPEB will be recognized as a future OPEB expense as follows:
2. Retirement Health Savings Plan Additionally, the City offers employees a retirement health savings plan, which is classified as a defined contribution plan. Regular employees, City Officials, Police and Firefighters, become eligible after five years of continuous service, at which time, participation in the plan is mandatory, for 2019 the plan had 1,823 participants. Contributions and plan benefit terms are established and amended on the authority of City Council. Contributions are currently made by the City. The annual contribution is determined each year by City Council, for 2019, the amount contributed was $234,150.
ICMA Retirement Corporation, an independent trustee, administers funds for this plan. The City maintains accounting records. The trustee provides participants with quarterly statements of contributions, withdrawals and earnings.
City of Thornton, Colorado NOTES TO FINANCIAL STATEMENTS
December 31, 2019
NOTE L - RISK MANAGEMENT 1. General Liability Insurance Pool The City is exposed to various risks of loss related to torts; theft of, damage to, and destruction of assets; errors
and omissions; and natural disasters for which the government carries insurance with the Colorado Intergovernmental Risk Sharing Agency (CIRSA). CIRSA is a separate and independent governmental and legal entity. The purposes of CIRSA are to provide members defined liability and property coverage through joint self-insurance, insurance, reinsurance, or any combination thereof, and to assist members to prevent and reduce losses and injuries to municipal property and to persons or property which might result in claims being made against members of CIRSA, or their employees or officers.
All operating funds of the City participate in the program and make payments to the Risk Management Fund based
on actuarial estimates of the amounts needed to pay current-year claims and to establish a reserve for catastrophe losses. The City pays claims up to the self-insured retention. In 2019, the self-insured retention (deductible amount) set by the City was $250,000 per claim. Through CIRSA, the City purchases commercial excess insurance for claims in excess of $250,000. Every year the City hires an independent actuary to calculate incurred but not reported claims (IBNR). The City reserves a liability for property/casualty claims of $1,464,782. There has been no significant reduction in insurance coverage from the prior year. Only one settlement exceeded the City’s self-insurance coverage in the past three years.
57
City of Thornton, Colorado NOTES TO FINANCIAL STATEMENTS
December 31, 2019
NOTE L - RISK MANAGEMENT (CONTINUED) 1. General Liability Insurance Pool (Continued)
The City’s respective share of CIRSA’s member fund balances for the most recently available statements are as follows:
2019 2018 Reserve for unpaid claims, January 1, 898,133$ 1,227,085$ Incurred claims (including IBNRs) 1,551,913 372,416 Claim payments (985,264) (701,368) - Reserve for unpaid claims, December 31, 1,464,782$ 898,133$
Unpaid claims to be paid in 1 year 658,674$ 363,132$
Year* Fund
PC Pool surplus (deficit)
December 31, 2018 **
City of Thornton's contribution
ratio
City of Thornton's share of surplus as of December 31, 2018
1996 Loss Fund 52,027$ 0.000% -$ 1997 Loss Fund 39,942 0.000% - 1998 Loss Fund - 0.000% - 1999 Loss Fund - 0.000% - 2000 Loss Fund - 0.000% - 2001 Loss Fund 3 0.000% - 2002 Loss Fund - 0.000% - 2003 Loss Fund 361,070 0.000% - 2004 Loss Fund 1,354,299 0.768% 10,396 2005 Loss Fund - 0.000% - 2006 Loss Fund 2,672,450 0.349% 9,334 2007 Loss Fund 10,360 0.000% - 2008 Loss Fund 2,493,869 0.000% - 2009 Loss Fund 2,242,905 0.000% - 2010 Loss Fund - 0.000% - 2011 Loss Fund 175,879 0.000% - 2012 Loss Fund 1,722,489 0.000% - 2013 Loss Fund 1,573,411 0.000% - 2014 Loss Fund 2,015,838 0.000% - 2015 Loss Fund 378,075 0.000% - 2016 Loss Fund (36,537) 0.000% - 2017 Loss Fund (1,440,058) 2018 Loss Fund 590,288 ALL Operating fund 5,197,331 0.616% 32,011 ALL Excess fund (1,075,823) 17.623% (189,588) ALL Reserve fund 8,805,001 0.758% 66,730
27,132,819$ (71,117)$
* Years 1982 through 1995 no longer have balances remaining.
** Surpluses or deficits for any year are subject to change for reasons which include: interest earnings or invested amounts for those years and funds, reestimation of losses for those years and funds, and credits or distributions from surplus for those years and funds.
58
City of Thornton, Colorado NOTES TO FINANCIAL STATEMENTS
December 31, 2019
NOTE L - RISK MANAGEMENT (CONTINUED) 1. General Liability Insurance Pool (Continued) Summary of the most recently available financial information for CIRSA (December 31, 2018) is as follows:
2. Workers' Compensation On January 1, 1992, the City established a limited Risk Management program for worker’s compensation. This
program was tailored to meet an annual exposure predicted from ten years of claims history. A risk retention of $550,000 per accident is maintained and funded through the Risk Management Fund, based on an annual estimated claims cost. The City purchases commercial excess insurance for claims in excess of $550,000. Claims administration and medical services are provided through contract and the City's Risk Management Administrator is responsible for overall program management. The State of Colorado has a strict application and annual renewal process that includes funding verification, excess insurance coverage verification, claims data review and provision of a comprehensive loss prevention and control program. The application includes a required surety bond of $801,000 to cover the City's risk retention portion.
All operating funds of the City participate in the program and make payments to the Risk Management Fund based
on actuarial estimates of the amounts needed to pay current year claims and to establish a reserve for catastrophe losses. Every year the City hires an independent actuary to calculate incurred but not reported claims (IBNR). The City reserves a liability for workers' compensation of $3,378,230. There have been no significant reductions in insurance coverage from the prior year. There has been one claim that exceeded the City’s risk retention in the last ten years.
3. Self-Funded Dental Insurance
The City established two self-funded dental programs effective January 1, 2007: Delta EPO and Delta Premier. The purpose of these programs is to pay the dental claims of eligible City employees and their covered dependents. As of January 1, 2007 the City entered into an administrative services only arrangement with Delta Dental of Colorado, whereby the City pays Delta Dental a separate amount for administrative costs and claim servicing fees. The City agrees to provide monthly funding for the payment of claims. At the end of the year, the City retains any money not spent on claims. The City has recorded a liability in this fund totaling $30,000 for open and estimated claims not yet reported at December 31, 2019.
Assets 47,466,852$
Liabilities, including incurred but not reported claims 20,334,033$ Members' fund balance Accumulated members' equity 27,132,819
Total liabilities and fund balance 47,466,852$
Revenues 21,624,230$ Expenses 25,588,893
Net decrease in members' fund balance (3,964,663)$
2019 2018Reserve for unpaid claims, January 1, 3,495,301$ 3,038,197$ Incurred claims (including IBNRs) 2,459,761 2,430,926 Claim payments (2,576,832) (1,973,822)
Reserve for unpaid claims, December 31, 3,378,230$ 3,495,301$
Unpaid claims to be paid in 1 year 1,456,643$ 1,545,079$
59
City of Thornton, Colorado NOTES TO FINANCIAL STATEMENTS
4. Self-Funded Vision Insurance The City established a self-funded vision program effective January 1, 2009: Vision Service Plan. The purpose of this program is to pay the vision claims of eligible City employees and their covered dependents. As of January 1, 2009 the City entered into an administrative services only arrangement with Vision Service Plan, whereby the City pays Vision Service Plan a separate amount for administrative costs and claim servicing fees. The City agrees to provide monthly funding for the payment of claims. At the end of the year, the City retains any money not spent on claims. The City has a recorded liability in this fund totaling $6,000 for open and estimated claims not yet reported at December 31, 2019.
NOTE M - LEGAL RESTRICTION At the November 3, 1992 general election, Colorado voters approved an amendment to the Colorado Constitution commonly known as the Taxpayer's Bill of Rights (TABOR). TABOR was effective December 31, 1992, and its provisions limit government taxes, spending revenues and debt without electoral approval. On November 6, 2001, the City’s voters chose to permit the City to collect, retain and spend the full amount of the City’s past and future taxes and other revenue above the TABOR amendment limitations. TABOR by its terms applies to local governments such as the City but excludes "enterprises," which are defined as (1) a government owned business, (2) authorized to issue its own debt and (3) receives less than 10% of its annual revenue in grants from all state and local governments. The City considers its Water, Sewer, and Sanitation to be "enterprise" funds, and therefore considers them excluded from the terms of TABOR. All other government activities are presumably covered under the limitations of TABOR. TABOR also requires the City to set aside a portion of its spending for an emergency reserve. In 2019, the required reserve of 3% of current year spending, excluding voter approved amounts, federal revenues, bond proceeds, and other restrictions under TABOR, totaled $5,370,110. The City is not allowed to use the emergency reserve to compensate for economic conditions, revenue shortfalls, or salary or benefit increases. NOTE N - COMMITMENTS AND CONTINGENT LIABILITIES 1. Litigation The City is a defendant in various lawsuits, including claims related to activities or employees of the City. The City
maintains a self-funded reserve in the Risk Management fund of $1,464,782 for general liability and $3,378,230 for worker's compensation claims. The City believes that final disposition of matters not covered by insurance will not have a material adverse effect on the City's financial condition.
2019 2018Reserve for unpaid claims, January 1, 20,000$ 86,000$ Incurred claims (including IBNRs) 771,500 702,827 Claim payments (761,500) (768,827)
Reserve for unpaid claims, December 31, 30,000$ 20,000$
Unpaid claims to be paid in 1 year 30,000$ 20,000$
2019 2018Reserve for unpaid claims, January 1, 7,000$ 14,000$ Incurred claims (including IBNRs) 122,276 114,130 Claim payments (123,276) (121,130)
Reserve for unpaid claims, December 31, 6,000$ 7,000$
Unpaid claims to be paid in 1 year 6,000$ 7,000$
60
City of Thornton, Colorado NOTES TO FINANCIAL STATEMENTS
December 31, 2019
NOTE N - COMMITMENTS AND CONTINGENT LIABILITIES (CONTINUED) 2. Contracts The City has $17,902,518 and $12,019,105, in outstanding contracts with various contractors for the Governmental
Capital Fund and all other governmental funds, respectively. The City has $38,647,497, $7,889,359, and $665,367 in outstanding contracts with various contractors for the Water Fund, Sewer Fund, and all other proprietary funds, respectively. The City has a collective bargaining agreement between the City of Thornton and the Thornton Firefighters Local Number 2376, International Association of Firefighters for the line firefighters. The current agreement is for two years and expires January 1, 2021. The City has a collective bargaining agreement between the City of Thornton and the Fraternal Order of Police, Thornton Police Department Colorado Lodge 16, for Police Officers and Police Sergeants. The current agreement is for two years and expires December 31, 2019. Certain City employees have contracts through the fiscal year 2019. Some contracts include severance packages, not exceeding nine months, if the employee is involuntarily terminated.
NOTE O – TAX ABATEMENTS The City of Thornton enters into incentive agreements to encourage economic development and redevelopment, to retain growing businesses, to grow the local economy and to provide quality job opportunities for Thornton residents. Incentive agreements are entirely discretionary and are considered on a case-by-case basis by the City Council. A written agreement is required and no agreement is final without formal action by City Council. All incentive agreements are performance based. Performance based means that before any monies are disbursed the business shall meet or exceed the specific performance measures identified in the Incentive Agreement. Specific performance measures may include: (a) meeting the requirements of the eligibility threshold for jobs and wages; (b) requiring new revenues generated by the business to equal or exceed the total dollar amount of the incentive provided during the period of the incentive agreement by rebate or refund; (c) requiring any rebate or refund to come from the revenues actually generated by that business; or (d) requiring the completion of significant development review process milestones such as successful completion and issuance of a development permit, building permit or certificate of occupancy. Incentive agreements with performance measures tied to jobs and wages contain a recapture provision if the abatement recipient does not maintain the eligibility threshold for the specified period. Incentive packages vary and may include the City agreeing to forego a portion of its sales tax, a direct subsidy for public infrastructure costs or a rebate of sales taxes, use taxes, permit fees, or property taxes. Rebate of sales and use taxes will only be considered for new taxes generated by the business. Unless special circumstances dictate, such rebate will be limited to 50% of the new sales and use taxes generated. The City does not rebate existing sales and uses taxes generated by a business. All incentive agreements are subject to annual appropriations by City Council as required in the Colorado Constitution and the City Charter. In 2019, the City’s expenditures include $5,641,639 in tax abatements. NOTE P – SUBSEQUENT EVENTS On May 5, 2020, the City issued $26,785,000 Certificates of Participation, Series 2020 evidencing proportionate interests in the base rentals under the annually renewable Lease Purchase Agreement. The proceeds of the issuance will be used to finance or reimburse the City for the costs of the new Active Adult Center and improvements to the aquatics facility contained within the Margaret Carpenter Recreation Center. The base rentals are due in annual installments beginning November 15, 2021 of $985,000 to $1,995,000 through November 15, 2038 with interest at 3.00% to 5.00%. The spread of COVID-19, a novel strain of coronavirus, is altering the behavior of businesses and people throughout the United States. Further, financial markets have recently experienced a significant decline attributed to coronavirus concerns. The continued spread of COVID-19 may adversely impact the local, regional and national economies. The extent to which the coronavirus impacts the City’s results will depend on future developments, which are highly uncertain and cannot be predicted. The impact is highly dependent on the breadth and duration of the outbreak and could be affected by other factors that cannot currently be predicted. Accordingly, management cannot presently estimate the overall operational and financial impact to the City, but such an impact could have a material adverse effect on the financial condition of the City.
61
This Page Left Intentionally Blank
62
63
Positive(negative)
Budgeted Amounts variance -Actual actual from
Original Final Amounts finalREVENUES Taxes Sales and use 84,693,306$ 84,693,306$ 81,489,666$ (3,203,640)$ Property 13,301,817 13,301,817 13,517,289 215,472 Franchise 6,259,980 6,259,980 6,195,392 (64,588) Other 3,006,428 3,006,428 2,935,501 (70,927) Licenses and permits 5,473,200 5,473,200 6,478,463 1,005,263 Intergovernmental 6,989,799 6,989,799 7,773,681 783,882 Governmental grants 1,074,690 1,074,690 1,545,248 470,558 Charges for services 15,310,284 16,363,231 17,452,032 1,088,801 Fines and forfeitures 1,970,896 1,970,896 2,230,512 259,616 Investment earnings 600,000 600,000 1,910,793 1,310,793 Miscellaneous 673,984 673,984 886,474 212,490
Total revenues 139,354,384 140,407,331 142,415,051 2,007,720
EXPENDITURES Current General government Legislative 2,491,709 2,491,709 2,527,807 (36,098) City manager 3,116,257 3,116,257 3,264,572 (148,315) General services 21,378,540 21,746,163 21,762,716 (16,553) Miscellaneous 6,856,190 6,856,190 4,787,202 2,068,988 Police 36,068,135 36,590,533 37,911,522 (1,320,989) Fire and ambulance 18,402,068 18,597,911 19,748,541 (1,150,630) City development 9,406,264 9,447,176 9,348,050 99,126 Streets, traffic and engineering 12,351,995 12,351,995 11,850,721 501,274 Community services 22,482,602 22,536,691 21,927,844 608,847 Capital outlay 3,455,578 3,455,578 3,227,589 227,989 Debt service Principal retirement - - 114,346 (114,346) Interest and bond fees - - 19,268 (19,268)
Total expenditures 136,009,338 137,190,203 136,490,178 700,025
Excess of revenues over expenditures 3,345,046 3,217,128 5,924,873 2,707,745
OTHER FINANCING SOURCES (USES) Transfers in 5,029,245 5,029,245 6,042,991 1,013,746 Transfers out (34,765) (34,765) (34,765) - Sales of general capital assets - - 108,423 108,423
Total other financing sources 4,994,480 4,994,480 6,116,649 1,122,169
Excess of revenues and other sources over expenditures and other sources before reconciling items 8,339,526$ 8,211,608$ 12,041,522 3,829,914$
RECONCILIATION TO US GAAP BASIS RHS & sick payout (27,043)
Net change in fund balances 12,014,479
Fund balances, January 1 39,278,658
Fund balances, December 31 51,293,137$
City of Thornton, Colorado
General Fund
For the year ended December 31, 2019
Schedule of Revenues, Expenditures, and Changes in Fund Balance - Budget and Actual - Non US GAAP Basis
64
2015 2016 2017 2018 2019City's proportion of the net pension liability 0.221023% 0.140685% 0.077294% 1.172316% 3.833744%
City's proportionate share of the net pension liability (asset) (249,441)$ (2,478)$ 27,931$ (1,686,561)$ 4,846,906$
City's proportionate share of the net pension liability (asset) as a percentage of covered payroll -321.26% 79.55%
Plan fiduciary net position as a percentage of the total pension liability 138.86% 123.46%
Presented as of the measurement date, December 31, 2017 2018
Schedule of Proportionate Share of the Net Pension Liability Statewide Hybrid Plan (SWH)
City of Thornton, Colorado
There is no information for Fiscal Year 2010 through 2017. Plan was offered to Sworn Police and Firefighters hired before July 10, 2017 that elected to reaffiliate with FPPA in 2017.
Contributions as a percentage of covered payrollFirefighters 8.00% 8.00%
Police reentry 10.00% 10.00%
City of Thornton, Colorado
Schedule of Pension Contributions Statewide Hybrid Plan (SWH)
There is no information for Fiscal Year 2010 through 2017. Plan was offered to Sworn Police and Firefighters hired before July 10, 2017 that elected to reaffiliate with FPPA in 2017.
68
2015 2016 2017 2018 2019
Total Pension Liability Service cost -$ -$ -$ -$ -$ Interest 566,974 549,907 427,182 393,042 538,048 Benefit changes - - - 281,477 - Differences between expected and actual experience - (305,110) - 389,958 - Assumption changes - 2,319,410 312,071 (2,243,221) - Benefit payments, including refunds of employee contributions (806,304) (782,322) (749,075) (788,438) (788,438) Net change in total pension liability (239,330) 1,781,885 (9,822) (1,967,182) (250,390) Total pension liability - beginning 7,955,511 7,716,181 9,498,066 9,488,244 7,521,062 Total pension liability - ending 7,716,181$ 9,498,066$ 9,488,244$ 7,521,062$ 7,270,672$
Plan fiduciary net position Contributions - employer -$ 239,804$ -$ 551,130$ 269,653$ Contributions - employee - - - - - Net investment income 352,452 90,586 220,309 607,804 7,900 Benefit payments, including refunds of employee contributions (806,304) (782,322) (749,075) (788,438) (788,438) Administrative expense (11,060) (9,397) (10,095) (4,259) (8,772) Net change in plan fiduciary net position (464,912) (461,329) (538,861) 366,237 (519,657) Plan fiduciary net position - beginning 5,560,276 5,095,364 4,634,035 4,095,174 4,461,411 Plan fiduciary net position - ending 5,095,364$ 4,634,035$ 4,095,174$ 4,461,411$ 3,941,754$
Net pension liability 2,620,817 4,864,031 5,393,070 3,059,651 3,328,918
Plan fiduciary net position as a percentage of total pension liability 66.03% 48.79% 43.16% 59.32% 54.21%
Covered payroll - - - - -
Net pension liability as a percentage of covered payroll N/A N/A N/A N/A N/A
Information for Fiscal Year 2010 through 2014 is not available.
City of Thornton, Colorado
Schedule of Proportionate Share of the Net Pension Liability Old Hire Plan (Thornton Fire Department)
Contributions in relation to the actuarial determined contribution (1) - 239,804 - 551,130 269,653 337,419 Contribution deficiency (excess) 192,152$ -$ 269,653$ (281,477)$ -$ -$
City's covered payroll -$ -$ -$ -$ -$ -$
Contributions as a percentage of covered payroll N/A N/A N/A N/A N/A N/A
Notes to Schedule
Actuarially determined contribution rates are calculated as of January 1 of even numbered years.
Methods and Assumptions Used to Determine Contribution Rates for current fiscal year:
Actuarial Cost Method Entry Age NormalAmortization Method Level Dollar, Open (2)Remaining Amortization Period 18 Years (2)Asset Valuation Method 5-Year smoothed marketInflation 2.5%Salary Increases N/AInvestment Rate of Return 7.50%Retirement Age Any remaining actives are assumed to retire immediately.Mortality
Other information:
Information for Fiscal Year 2010 through 2013 is not available.
City of Thornton, Colorado
Schedule of Pension Contributions Old Hire Plan (Thornton Fire Department)
(1) Actuarially Determined Contribution is net of employee contributions. Actual contribution is from the employer onlyand does not include employee amounts.
(2) Plans that are heavily weighted with retiree liabilities use an amortization period based on the expected remaininglifetime of the participants.(3) 2017 includes a one time contirbution of $281,477 to pay for unfunded liability that resulted from an increase tomonthly benefits of certain participants.
Post-retirement: For ages less than 55, RP-2014 Mortality Tables for Blue CollarEmployees. For ages 65 and older, RP-2014 Mortality Tables for Blue Collar HealthyAnnuitants. For ages 55 through 64, a blend of the previous tables. All tables areprojected with Scale BB.
Disabled (pre-1980): RP-2014 Disabled Generational Mortality Table generationally projected with Scale BB with a minimum 3% rate for males and 2% rate for females.
70
2018 2019
Total OPEB Liability Service cost 225,863$ 208,610$ Interest 290,800 144,867 Benefit changes (5,134,249) - Differences between expected and actual experience 1,425,291 (93,021) Assumption changes (222,345) (85,101) Benefit payments (130,583) (138,940) Net change in total OPEB liability (3,545,223) 36,415
Total OPEB liability - beginning 7,989,000 4,443,777 Total OPEB liability - ending 4,443,777$ 4,480,192$
Covered-payroll 80,735,374$ 87,662,142$
Total OPEB liability as a percentage of covered payroll 5.50% 5.11%
Notes to Schedule
2019 3.26%2018 3.64%2017 4.00%
Information for Fiscal Year 2010 through 2017 is not available.
Change of benefit terms: There is currently no age cut-off, but after 12/31/2019 coverage will not be available for retirees age 65 or above or those who are below age 65 and eligible for Medicare
Changes of assumptions. Changes of assumption and other inputs reflect the effects of changes in the discount rate each periods. The following are the discount rates used in each period:
City of Thornton, Colorado
Schedule of Changes in Total OPEB and Related Ratios
71
This Page Left Intentionally Blank
72
73
City of Thornton, Colorado Combining Statements and Budgetary Schedules
Fund Descriptions Major Governmental Funds
Capital Projects Funds Capital Projects Funds are used to account for the acquisition and construction of major capital facilities other than those financed by proprietary funds.
Governmental Capital Fund – to account for capital replacement and planned growth infrastructure and other capital assets of the City government, financed by existing and current resources (sales and use taxes).
Thornton Development Authority North Washington Fund (TDA North) (Component Unit) – to account for debt services and capital improvement projects within the Authority boundaries financed by current resources (property tax, sales tax, investment income) and by bond proceeds. The debt service payments are for the following bond issue:
$13,900,000 Thornton Development Authority Tax Increment Revenue Refunding (North Washington Street Urban Corridor), Series 2015A – financed by sales and property tax incremental increases within the boundaries of the North Washington Urban Renewal Area. The bonds are due in semi-annual payments until maturity in 2028.
74
City of Thornton, Colorado
Governmental Capital FundSchedule of Revenues, Expenditures, and Changes in Fund Balance - Budget and Actual
For the year ended December 31, 2019
Positive(negative)variance
Budget Actual from actualREVENUES Taxes - sales and use 10,712,165$ 14,550,525$ 3,838,360$ Intergovernmental 4,630,775 3,926,394 (704,381) Governmental grants 3,071,782 1,718,022 (1,353,760) Lease 175,701 175,701 - Investments Investment earnings 500,000 2,089,622 1,589,622 Miscellaneous Developers' contributions 1,323,064 324,756 (998,308) Other 25,000 58,929 33,929
Total revenues 20,438,487 22,843,949 2,405,462
EXPENDITURES Streets, traffic and engineering 2,354,127 2,464,805 (110,678) Capital outlay 69,138,105 24,695,185 44,442,920 Debt service Principal retirement 3,473,500 3,282,467 191,033 Interest 1,075,906 1,264,610 (188,704) Bond fees 5,000 3,809 1,191
Total expenditures 76,046,638 31,710,876 44,335,762
Deficiency of revenues under expenditures (55,608,151) (8,866,927) 46,741,224
OTHER FINANCING SOURCES Transfers in 1,269,538 1,269,538 - Sales of general capital assets - 80,590 80,590
Total other financing sources 1,269,538 1,350,128 80,590
Net change in fund balance (54,338,613)$ (7,516,799) 46,821,814$
Fund balance, January 1 48,485,699
Fund balance, December 31 40,968,900$
75
City of Thornton, Colorado
Thornton Development Authority North Capital FundSchedule of Revenues, Expenditures, and Changes in Fund Balance - Budget and Actual
For the year ended December 31, 2019
Positive(negative)variance
Budget Actual from actualREVENUES Taxes Sales and use 5,447,611$ 5,523,172$ 75,561$ Property 6,085,318 4,589,770 (1,495,548) Investments Investment earnings 245,000 385,568 140,568 Miscellaneous Developers' contributions - 79,318 79,318 Total revenues 11,777,929 10,577,828 (1,200,101)
EXPENDITURES Capital outlay 22,004,099 14,304,786 7,699,313 Debt service Principal retirement 920,000 920,000 - Interest 488,263 488,263 - Bond fees 3,000 2,500 500
Total expenditures 23,415,362 15,715,549 7,699,813
Deficiency of revenues under expenditures (11,637,433) (5,137,721) 6,499,712
OTHER FINANCING USES Transfers out (4,049,241) (4,049,241) -
Total other financing uses (4,049,241) (4,049,241) -
Net change in fund balance (15,686,674)$ (9,186,962) 6,499,712$
Fund balance, January 1 18,156,267
Fund balance, December 31 8,969,305$
76
City of Thornton, Colorado Combining Statements and Budgetary Schedules
Fund Descriptions Non-Major Governmental Funds
Special Revenue Funds Special Revenue funds are used to account for specific revenues that are legally restricted to expend for particular purposes.
Thornton Arts, Sciences and Humanities Council (TASHCO) Fund (Component Unit) – to account for monies received from grants and program revenues for purposes of cultural enhancements.
Cash in Lieu Fund – to account for monies contributed by land developers in lieu of providing an improvement such as parks or drainage.
Conservation Trust Fund – to account for monies received from the State government for purposes of developing new parks and park improvements.
Parks Fund – to account for one-third of the .25% open space tax to be used exclusively for the purchase and development of parks in the City.
Open Space Fund – to account for one-third of the .25% open space tax to be used exclusively for the purchase and development of open space in the City.
Parks and Open Space Fund – to account for one-third of the .25% open space tax to be used exclusively for the purchase and development of parks and open space in the City, based on the recommendations of the Parks and Open Space Advisory Committee (POSAC).
Adams County Open Space Sales Tax Fund – to account for open space monies from Adams county to be used exclusively for the purchase and development of open space in the City.
Adams County Road and Bridge Sales Tax Fund – to account for road and bridge monies from Adams County to be used exclusively for transportation related projects in the City.
136th Avenue GID Fund (Component Unit) – to account for the collection of assessment revenues to be used exclusively for payment of the construction of the interchange at 136th Avenue and Interstate 25.
E911 Authority Fund (Component Unit) – to account for E911 surcharges received from telecommunication companies doing business within the City. The Authority was established by City Council in 2004, and funds collected are used to pay for a portion of costs authorized by State statute for the City to provide emergency telephone services.
Capital Projects Funds Capital Projects Funds are used to account for the acquisition and construction of major capital facilities other than those financed by proprietary funds.
Thornton Development Authority South Capital Fund (Component Unit) – to account for capital improvement projects within the Authority boundaries financed by existing and current resources (property tax and investment income).
Thornton Development Authority 144th (TDA 144th) (Component Unit) – to account for debt services and capital improvement projects within the Authority boundaries financed by current resources (property tax, sales tax, investment income) and by bond proceeds. The debt service payments are for the following bond issue:
$27,580,000 Thornton Development Authority Tax Increment Revenue Bonds (East 144th Avenue and I-25Project), Series 2015B – financed by sales and property tax incremental increases within the boundaries of the144th Urban Renewal Area. The bonds are due in semi-annual payments until maturity in 2037.
FUND BALANCES Restricted Parks and open space - - 1,785,500 1,028,742 9,907,710 14,118,376 Capital projects - - - - - - Debt service - - - - - - Public safety - - - - - - Other purposes 53,725 - - - - - Assigned Capital projects - - - - - - Land held for resale - - - - - - Parks and open space - 447,723 - - - - Other purposes 283,684 - - - - -
Total fund balances 337,409 447,723 1,785,500 1,028,742 9,907,710 14,118,376
Total liabilities, deferred inflows of resources and fund balances 340,404$ 1,821,768$ 2,030,688$ 1,028,742$ 9,985,910$ 18,140,007$
Special Revenue Funds
78
Adams County Adams County TotalOpen Space Road & Bridge 136th E911 SpecialSales Tax Sales Tax Avenue GID Authority Revenue
Total deferred inflows of resources 802,295 1,709,145 2,511,440 3,329,352
FUND BALANCES Restricted Parks and open space - - - 28,841,206 Capital projects - - - 7,496,789 Debt service - 2,258,550 2,258,550 2,258,550 Public safety - - - 97,832 Other purposes - - - 53,725 Assigned Capital projects 8,415,294 26,256 8,441,550 8,449,105 Land held for resale 543,099 543,099 543,099 Parks and open space - - 447,723 Other purposes - - 283,684
Total fund balances 8,958,393 2,284,806 11,243,199 48,471,713
Total liabilities, deferred inflows of resources and fund balances 9,777,455$ 4,801,063$ 14,578,518$ 58,567,190$
Total revenues 898,073 3,131,547 4,029,620 21,334,220
EXPENDITURES Current Community services - - - 91,117 Streets, traffic and engineering - 807,112 807,112 807,112 Capital outlay 169,117 - 169,117 40,865,867 Debt service Principal retirement - 670,000 670,000 1,907,534 Interest - 1,139,394 1,139,394 3,508,982 Bond fees - 2,500 2,500 2,500
Total expenditures 169,117 2,619,006 2,788,123 47,183,112
Excess (deficiency) of revenues over (under) expenditures before other sources (uses) 728,956 512,541 1,241,497 (25,848,892)
OTHER FINANCING SOURCES (USES) Transfers in - - - 34,765 Transfers out (212,180) (774,761) (986,941) (2,229,541)
Total other financingsources (uses) (212,180) (774,761) (986,941) (2,194,776)
Net change in fund balances 516,776 (262,220) 254,556 (28,043,668)
Fund balances, January 1 8,441,617 2,547,026 10,988,643 76,515,381
Fund balances, December 31 8,958,393$ 2,284,806$ 11,243,199$ 48,471,713$
Capital Funds
84
City of Thornton, Colorado
Thornton Arts, Sciences, and Humanities Council Fund (TASHCO)Schedule of Revenues, Expenditures, and Changes in Fund Balance - Budget and Actual
For the year ended December 31, 2019
Positive(negative)variance
Budget Actual from actualREVENUES Governmental grants 36,600$ 53,725$ 17,125$ Investments Investment earnings 5,000 11,427 6,427 Miscellaneous Other 5,000 2,982 (2,018)
Total revenues 46,600 68,134 21,534
EXPENDITURES Community services 94,406 91,117 3,289
Total expenditures 94,406 91,117 3,289
Deficiency of revenues under expenditures (47,806) (22,983) 24,823
OTHER FINANCING SOURCES Transfer in 34,765 34,765 -
Total other financing sources 34,765 34,765 -
Net change in fund balance (13,041)$ 11,782 24,823$
Fund balance, January 1 325,627
Fund balance, December 31 337,409$
85
City of Thornton, Colorado
Cash in Lieu FundSchedule of Revenues, Expenditures, and Changes in Fund Balance - Budget and Actual
For the year ended December 31, 2019
Positive(negative)variance
Budget Actual from actualREVENUES Investments Investment earnings 15,000$ 61,996$ 46,996$ Miscellaneous Developers' contributions - 69,689 69,689
Total revenues 15,000 131,685 116,685
EXPENDITURES Capital outlay 192,733 62,688 130,045
Total expenditures 192,733 62,688 130,045
Net change in fund balance (177,733)$ 68,997 246,730$
Fund balance, January 1 378,726
Fund balance, December 31 447,723$
86
City of Thornton, Colorado
Conservation Trust FundSchedule of Revenues, Expenditures, and Changes in Fund Balance - Budget and Actual
For the year ended December 31, 2019
Positive(negative)variance
Budget Actual from actualREVENUES Intergovernmental - State lottery 1,275,000$ 1,486,295$ 211,295$ Investments Investment earnings 20,000 57,795 37,795
Total revenues 1,295,000 1,544,090 249,090
EXPENDITURES Capital outlay 2,071,421 858,052 1,213,369
Total expenditures 2,071,421 858,052 1,213,369
Net change in fund balance (776,421)$ 686,038 1,462,459$
Fund balance, January 1 1,099,462
Fund balance, December 31 1,785,500$
87
City of Thornton, Colorado
Parks FundSchedule of Revenues, Expenditures, and Changes in Fund Balance - Budget and Actual
For the year ended December 31, 2019
Positive(negative)variance
Budget Actual from actualREVENUES Investments Investment earnings 25,000$ 37,491$ 12,491$
Total revenues 25,000 37,491 12,491
EXPENDITURES Capital outlay 1,174,926 473,683 701,243
Total expenditures 1,174,926 473,683 701,243
Deficiency of revenues under expenditures (1,149,926) (436,192) 713,734
Net change in fund balance (1,149,926)$ (436,192) 713,734$
Fund balance, January 1 1,464,934
Fund balance, December 31 1,028,742$
88
City of Thornton, Colorado
Open Space FundSchedule of Revenues, Expenditures, and Changes in Fund Balance - Budget and Actual
For the year ended December 31, 2019
Positive(negative)variance
Budget Actual from actualREVENUES Governmental grants 3,730,377$ 75,000$ (3,655,377)$ Investments Investment earnings 100,000 342,688 242,688 Miscellaneous Other - 11,451 11,451
Total revenues 3,830,377 429,139 (3,401,238)
EXPENDITURES Capital outlay 5,111,809 1,280,901 3,830,908
Total expenditures 5,111,809 1,280,901 3,830,908
Deficiency of revenues under expenditures (1,281,432) (851,762) 429,670
Net change in fund balance (1,281,432)$ (851,762) 429,670$
Fund balance, January 1 10,759,472
Fund balance, December 31 9,907,710$
89
City of Thornton, Colorado
Parks and Open Space FundSchedule of Revenues, Expenditures, and Changes in Fund Balance - Budget and Actual
For the year ended December 31, 2019
Positive(negative)variance
Budget Actual from actualREVENUES Taxes - sales and use 7,309,447$ 7,410,634$ 101,187$ Governmental grants 567,428 - (567,428) Investments Investment earnings 596,950 831,882 234,932 Miscellaneous Other - 50,001 50,001
Total revenues 8,473,825 8,292,517 (181,308)
EXPENDITURES Capital outlay 67,330,215 34,232,264 33,097,951 Debt service Principal retirement 3,600,000 1,237,534 2,362,466 Interest - 2,369,588 (2,369,588)
Total expenditures 70,930,215 37,839,386 33,090,829
Deficiency of revenues under expenditures (62,456,390) (29,546,869) 32,909,521
OTHER FINANCING SOURCES Issuance of debt 14,000,000 - (14,000,000)
Total other financing sources 14,000,000 - (14,000,000)
Net change in fund balance (48,456,390)$ (29,546,869) 18,909,521$
Fund balance, January 1 43,665,245
Fund balance, December 31 14,118,376$
90
City of Thornton, Colorado
Adams County Open Space Sales Tax FundSchedule of Revenues, Expenditures, and Changes in Fund Balance - Budget and Actual
For the year ended December 31, 2019
Positive(negative)variance
Budget Actual from actualREVENUES Intergovernmental 1,189,000$ 1,239,375$ 50,375$ Governmental grants 2,176,470 513,439 (1,663,031) Investments Investment earnings 35,000 61,814 26,814 Miscellaneous Other - 5,237 5,237
Total revenues 3,400,470 1,819,865 (1,580,605)
EXPENDITURES Capital outlay 3,661,726 335,393 3,326,333
Total expenditures 3,661,726 335,393 3,326,333
Net change in fund balance (261,256)$ 1,484,472 1,745,728$
Fund balance, January 1 516,406
Fund balance, December 31 2,000,878$
91
City of Thornton, Colorado
Adams County Road and Bridge Sales Tax FundSchedule of Revenues, Expenditures, and Changes in Fund Balance - Budget and Actual
For the year ended December 31, 2019
Positive(negative)variance
Budget Actual from actualREVENUES Intergovernmental 3,250,000$ 3,564,608$ 314,608$ Investments Investment earnings 65,000 231,997 166,997
Total revenues 3,315,000 3,796,605 481,605
EXPENDITURES Capital outlay 9,820,449 3,453,769 6,366,680
Total expenditures 9,820,449 3,453,769 6,366,680
Net change in fund balance (6,505,449)$ 342,836 6,848,285$
Fund balance, January 1 7,153,953
Fund balance, December 31 7,496,789$
92
City of Thornton, Colorado
136th Avenue General Improvement District Tax FundSchedule of Revenues, Expenditures, and Changes in Fund Balance - Budget and Actual
For the year ended December 31, 2019
Positive(negative)variance
Budget Actual from actualREVENUES Taxes Property 62,600$ 58,424$ (4,176)$ Other - 4,419 4,419 Investments Investment earnings - 646 646
Total revenues 62,600 63,489 889
OTHER FINANCING USES Transfers out (62,600) (62,600) -
Total other financing uses (62,600) (62,600) -
Net change in fund balance -$ 889 889$
Fund balance, January 1 6,666
Fund balance, December 31 7,555$
93
City of Thornton, Colorado
E911 Authority FundSchedule of Revenues, Expenditures, and Changes in Fund Balance - Budget and Actual
For the year ended December 31, 2019
Positive(negative)variance
Budget Actual from actualREVENUES Taxes - E911 1,140,000$ 1,114,583$ (25,417)$ Investments Investment earnings - 7,002 7,002
Total revenues 1,140,000 1,121,585 (18,415)
OTHER FINANCING USES Transfers out (1,200,000) (1,180,000) 20,000
Total other financing uses (1,200,000) (1,180,000) 20,000
Net change in fund balance (60,000)$ (58,415) 1,585$
Fund balance, January 1 156,247
Fund balance, December 31 97,832$
94
City of Thornton, Colorado
Thornton Development Authority South Capital FundSchedule of Revenues, Expenditures, and Changes in Fund Balance - Budget and Actual
For the year ended December 31, 2019
Positive(negative)variance
Budget Actual from actualREVENUES Taxes - property 515,000$ 618,733$ 103,733$ Investments Investment earnings 100,000 279,340 179,340
Total revenues 615,000 898,073 283,073
EXPENDITURES
Capital outlay 1,292,844 169,117 1,123,727
Total expenditures 1,292,844 169,117 1,123,727
Excess (deficiency) of revenues over (under) expenditures (677,844) 728,956 1,406,800
OTHER FINANCING USES Transfers out (212,180) (212,180) -
Total other financing uses (212,180) (212,180) -
Net change in fund balance (890,024)$ 516,776 1,406,800$
Fund balance, January 1 8,441,617
Fund balance, December 31 8,958,393$
95
City of Thornton, Colorado
Thornton Development Authority 144th Capital FundSchedule of Revenues, Expenditures, and Changes in Fund Balance - Budget and Actual
For the year ended December 31, 2019
Positive(negative)variance
Budget Actual from actualREVENUES Taxes Sales and use 1,982,162$ 1,499,092$ (483,070)$ Property 1,451,036 1,550,984 99,948 Investments Investment earnings 70,000 81,471 11,471
Total revenues 3,503,198 3,131,547 (371,651)
EXPENDITURES Streets, traffic and engineering 816,878 807,112 9,766 Debt Service Principal Retirement 670,000 670,000 - Interest 1,139,394 1,139,394 - Bond fees 3,000 2,500 500
Total expenditures 2,629,272 2,619,006 10,266
Excess of revenues over expenditures 873,926 512,541 (361,385)
OTHER FINANCING USES Transfers out (774,761) (774,761) -
Total other financing uses (774,761) (774,761) -
Net change in fund balance 99,165$ (262,220) (361,385)$
Net position, January 1 2,547,026
Net position, December 31 2,284,806$
96
City of Thornton, Colorado
Combining Statements and Budgetary Schedules Fund Descriptions
Major Enterprise Funds
Enterprise Funds
Enterprise Funds are used to account for operations that are financed and operated in a manner similar to private business enterprises – where the intent of the City Council is that the costs of providing goods or services to the general public on a continuing basis be financed or recovered primarily through user charges; or where the City Council has decided that periodic determination of net income is appropriate for accountability purposes.
Water Utility Fund – to account for the provision of water services to residents of the City and some residents of Adams County.
Sewer Utility Fund – to account for the provision of sewer services to residents of the City and some residents of Adams County. Stormwater Fund - to account for the provision of storm sewer services to residents of the City and some residents of Adams County.
97
City of Thornton, Colorado
Water FundSchedule of Revenues, Expenses, and Changes in Net Position
Budget and Actual - Non US GAAP BasisFor the year ended December 31, 2019
Positive(negative)variance
Budget Actual from actualOPERATING REVENUES Charges for services pledged for debt 47,228,923$ 47,009,075$ (219,848)$ Miscellaneous revenue 119,000 119,102 102
Total operating revenues 47,347,923 47,128,177 (219,746)
OPERATING EXPENSES Source of supply 8,217,239 8,155,968 61,271 Water treatment 12,004,558 11,445,556 559,002 Collection, transmission, and distribution 3,120,035 3,335,653 (215,618) Other operating expenses 3,549,931 3,338,025 211,906 Administration 9,467,240 9,110,804 356,436
Total operating expenses 36,359,003 35,386,006 972,997
Operating income 10,988,920 11,742,171 753,251
NONOPERATING REVENUES (EXPENSES) Interest income 995,000 5,450,162 4,455,162 Capital outlay (172,415,355) (54,010,930) 118,404,425 Debt service Principal payment (1,500,000) (1,560,000) (60,000) Interest (1,356,644) (1,296,644) 60,000 Bond fees (5,000) (275) 4,725 Miscellaneous revenue 4,095,402 8,616,061 4,520,659
Total nonoperating expenses (170,186,597) (42,801,626) 127,384,971
Loss before capital contributions (159,197,677) (31,059,455) 128,138,222
Grants and capital contributions 23,970,451 22,654,379 (1,316,072)
Deficiency of revenues under expenditures before reconciling items (135,227,226)$ (8,405,076) 126,822,150$
RECONCILIATION TO US GAAP BASIS Miscellaneous non-cash adjustments (administrative) (112,404) Miscellaneous non-cash adjustments (ARO) (5,000) Add back principal payment 1,560,000 Change in accrued interest payable 5,200 Gain on sale of capital assets 2,477,056 Depreciation (7,378,989) Capital asset additions (from the City's capital projects) 54,010,930 Contributed capital assets 6,947,233 Bond deferred premiums amortized 50,728
Total reconciling items 57,554,754
Change in net position 49,149,678
Net position, January 1 722,160,892
Net position, December 31 771,310,570$
98
City of Thornton, Colorado
Sewer FundSchedule of Revenues, Expenses, and Changes in Net Position
Budget and Actual - Non US GAAP BasisFor the year ended December 31, 2019
Positive(negative)variance
Budget Actual from actualOPERATING REVENUES Charges for services 15,277,201$ 15,466,882$ 189,681$ Miscellaneous revenue 2,500 2,001 (499)
Total operating revenues 15,279,701 15,468,883 189,182
OPERATING EXPENSES Collection, transmission, and distribution 1,675,039 1,599,412 75,627 Sewage treatment-Metro Wastewater 10,764,391 10,764,391 - Other operating expenses 239,412 232,151 7,261 Administration 1,786,594 1,786,594 -
Total operating expenses 14,465,436 14,382,548 82,888
Operating income 814,265 1,086,335 272,070
NONOPERATING REVENUES (EXPENSES) Interest income 190,000 670,691 480,691 Capital outlay (17,268,100) (1,920,304) 15,347,796
Total nonoperating expenses (17,078,100) (1,249,613) 15,828,487
Loss before capital contributions and transfers (16,263,835) (163,278) 16,100,557
Capital contributions 1,700,000 1,528,200 (171,800)
Excess (Deficiency) of revenues over (under) expenditures before reconciling items (14,563,835)$ 1,364,922 15,928,757$
RECONCILIATION TO US GAAP BASIS Miscellaneous non-cash adjustments 8,733 Loss on disposal of capital assets (46,000) Depreciation (2,296,863) Capital asset additions (from the City's capital projects) 1,920,304 Contributed capital assets 3,151,332
Total reconciling items 2,737,506
Change in net position 4,102,428
Net position, January 1 69,032,162
Net position, December 31 73,134,590$
99
City of Thornton, Colorado
Stormwater FundSchedule of Revenues, Expenses, and Changes in Net Position
Budget and Actual - Non US GAAP BasisFor the year ended December 31, 2019
Positive(negative)variance
Budget Actual from actualOPERATING REVENUES Charges for services 3,000,000$ 3,001,616$ 1,616$ Total operating revenues 3,000,000 3,001,616 1,616 OPERATING EXPENSES Collection, transmission, and distribution 870,461 875,433 (4,972) Other operating expenses 25,000 275 24,725 Administration 1,052,948 1,052,948 -
Total operating expenses 1,948,409 1,928,656 19,753
Operating income 1,051,591 1,072,960 21,369
NONOPERATING REVENUES (EXPENSES) Interest income - 21,139 21,139 Capital outlay (1,382,180) (195,606) 1,186,574
Total nonoperating expenses (1,382,180) (174,467) 1,207,713
Gain (loss) before capital contributions and transfers (330,589) 898,493 1,229,082
Excess (Deficiency) of revenues over (under) expenditures before reconciling items (330,589)$ 898,493 1,229,082$
RECONCILIATION TO US GAAP BASIS Miscellaneous non-cash adjustments (119,744) Depreciation (1,026,217) Capital asset additions (from the City's capital projects) 195,606 Contributed capital assets 8,753,751 Capital Asset Additions (contributed from governmental activities) 39,130,995
Total reconciling items 46,934,391
Change in net position 47,832,884
Net position, January 1 -
Net position, December 31 47,832,884$
100
City of Thornton, Colorado
Combining Statements and Budgetary SchedulesFund Descriptions
Non-Major Enterprise Funds
Enterprise Funds
Enterprise Funds are used to account for operations that are financed and operated in a manner similar to private business enterprises – where the intent of the City Council is that the costs of providing goods or services to the general public on a continuing basis be financed or recovered primarily through user charges; or where the City Council has decided that periodic determination of net income is appropriate for accountability purposes.
Sanitation Fund – to account for rubbish removal and recycling services provided to City residents.
101
Positive(negative)variance
Budget Actual from actualOPERATING REVENUES Charges for services 5,446,118$ 5,548,190$ 102,072$ Miscellaneous revenue 5,000 22,378 17,378 Total operating revenues 5,451,118 5,570,568 119,450
Total operating expenses 5,080,488 5,152,755 (72,267)
Operating income 370,630 417,813 47,183
NONOPERATING REVENUES (EXPENSES) Interest income 70,000 242,394 172,394 Capital outlay (600,209) (483,839) 116,370
Total nonoperating expenses (530,209) (241,445) 288,764
Income (loss) before transfers (159,579) 176,368 335,947
Excess (Deficiency) of revenues over (under) expenditures before reconciling items (159,579)$ 176,368 335,947$
RECONCILIATION TO US GAAP BASIS Miscellaneous non-cash adjustments (9,493) Loss on disposal of capital assets (352) Depreciation (671,211) Capital asset additions 483,839
Total reconciling items (197,217)
Change in net position (20,849)
Net position, January 1 10,199,696
Net position, December 31 10,178,847$
Budget and Actual - Non US GAAP BasisFor the year ended December 31, 2019
Schedule of Revenues, Expenses, and Changes in Net PositionSanitation Fund
City of Thornton, Colorado
102
City of Thornton, Colorado
Combining Statements and Budgetary SchedulesFund Descriptions
Internal Service Funds
Internal Service Funds
Internal Service Funds are used to account for the financing of goods or services provided by one department or agency to other departments or agencies of the City and to other government units, on a cost reimbursement basis.
Risk Management Fund – to account for the costs related to providing the City with a comprehensive program to manage the City’s property, liability and work related injury risk, and to manage the City’s self-funded dental and vision insurance programs.
Information Technology Fund – to account for computer support and maintenance of all information technology for the City. The City closed the Information Technology Fund on January 1, 2019. Account activity associated with this fund is now reported in the General Fund.
Reprographics Fund – to account for copying, printing and mailing costs for all City departments. The City closed the Reprographics Fund on January 1, 2019. Account activity associated with this fund is now reported in the General Fund.
Maintenance Services Fund – to account for custodial and building maintenance service costs for all City Departments. The City closed the Maintenance Services Fund on January 1, 2019. Account activity associated with this fund is now reported in the General Fund.
103
Internal Risk Information Maintenance Service Funds
Management Technology Reprographics Services TotalASSETSCurrent assets Equity in pooled cash and investments - unrestricted 5,267,666$ -$ -$ -$ 5,267,666$ Receivables, net Accounts 179,142 - - - 179,142 Interest and other 19,813 - - - 19,813
Total current assets 5,466,621 - - - 5,466,621
Total assets 5,466,621 - - - 5,466,621
DEFERRED OUTFLOWS OF RESOURCES Deferred outflow related to OPEB 3,493 - - - 3,493
Total deferred outflows of resources 3,493 - - - 3,493
Total operating revenues 6,335,457 - - - 6,335,457
OPERATING EXPENSES Insurance and related expenses 930,450 - - - 930,450 Claims and reserves for claims 4,907,309 - - - 4,907,309 Administration 658,281 - - - 658,281
Total operating expenses 6,496,040 - - - 6,496,040
Operating loss (160,583) - - - (160,583)
NONOPERATING REVENUES Interest income 177,291 - - - 177,291 Miscellaneous, net 20,000 - - - 20,000
Total nonoperating revenues 197,291 - - - 197,291
Income before transfers 36,708 - - - 36,708
Transfer out - (1,109,281) (61,192) (1,332,244) (2,502,717)
Change in net position 36,708 (1,109,281) (61,192) (1,332,244) (2,466,009)
Net position, January 1 316,058 1,109,281 61,192 1,332,244 2,818,775
Net position, December 31 352,766$ -$ -$ -$ 352,766$
City of Thornton, Colorado
Combining Statement of Revenues, Expenses, and Changes in Net PositionInternal Service Funds
For the year ended December 31, 2019
Internal Service Funds
105
Internal Risk Information Maintenance Service Funds
Management Technology Reprographics Services TotalCASH FLOWS FROM OPERATING ACTIVITIES Receipts from interfund services 6,353,757$ -$ -$ -$ 6,353,757$ Payments to suppliers (5,447,456) - - - (5,447,456) Payments to employees (598,917) - - - (598,917) Net cash provided by operating activities 307,384 - - - 307,384
CASH FLOWS FROM NONCAPITAL FINANCING ACTIVITIESTransfer to other funds - (358,374) (26,536) (504,434) (889,344)
Net cash used in noncapital financing activities - (358,374) (26,536) (504,434) (889,344)
CASH FLOWS FROM INVESTING ACTIVITIES Proceeds from sale of investments 3,964,877 - - - 3,964,877 Purchases of investments (4,631,419) - - - (4,631,419) Interest on investments 171,478 - - - 171,478 Net cash used in investing activities (495,064) - - - (495,064)
Net decrease in cash and cash equivalents (187,680) (358,374) (26,536) (504,434) (1,077,024)
Cash and cash equivalents 1,365,365$ -$ -$ -$ 1,365,365$ Investments 3,902,301 - - - 3,902,301 Total cash and investments 5,267,666$ -$ -$ -$ 5,267,666$
Equity in pooled cash and investments 5,267,666$ -$ -$ -$ 5,267,666$ Restricted cash and investments - - - - -
Total cash and investments 5,267,666$ -$ -$ -$ 5,267,666$
City of Thornton, Colorado
Combining Statement of Cash FlowsInternal Service Funds
For the year ended December 31, 2019
Internal Service Funds
106
Internal Risk Information Maintenance Service Funds
Management Technology Reprographics Services TotalRECONCILIATION OF OPERATING INCOME TO NET CASH PROVIDED BY (USED IN) OPERATING ACTIVITIES
Operating loss (160,583)$ -$ -$ -$ (160,583)$
Adjustments to reconcile operating income to net cash provided by (used in) operating activities:
Miscellaneous receipts 20,000 - - - 20,000
Change in assets and liabilities: Increase in accounts receivable, net (1,700) - - - (1,700) Decrease in deferred outflows of resources OPEB Related 1,173 - - - 1,173 Decrease in accounts payable (14,015) - - - (14,015) Increase in other liabilities 461,823 - - - 461,823 Increase in OPEB 172 - - - 172 Increase in deferred inflows of resources OPEB Related 514 - - - 514
Net cash provided by operating activities 307,384$ -$ -$ -$ 307,384$
NON-CASH INVESTING, CAPITAL AND FINANCING ACTIVITIES:Investing Activities Increase in the fair value of of investments 55,409$ -$ -$ -$ 55,409$
Internal Service Funds
107
City of Thornton, Colorado
Risk Management FundSchedule of Revenues, Expenses, and Changes in Net Position
Budget and Actual - Non US GAAP BasisFor the year ended December 31, 2019
Positive(negative)variance
Budget Actual from actualOPERATING REVENUES Interfund services 6,351,555$ 6,335,457$ (16,098)$ Total operating revenues 6,351,555 6,335,457 (16,098)
OPERATING EXPENSES Insurance and related expenses 1,066,160 930,450 135,710 Claims and reserves for claims 4,524,761 4,524,761 - Administration 638,212 655,035 (16,823)
Total operating expenses 6,229,133 6,110,246 118,887
Excess of revenues over expenditures before reconciling items 122,422$ 422,502 300,080$
RECONCILIATION TO US GAAP BASIS Incurred but not reported adjustment - property casualty (705,060) Incurred but not reported adjustment - worker's compensation 296,960 Incurred but not reported adjustment - dental 18,619 Incurred but not reported adjustment - vision 8,792 OPEB liability adjustment (1,859) Miscellaneous non-cash adjustments (3,246)
Total reconciling items (385,794)
Change in net position 36,708
Net position, January 1, 316,058
Net position, December 31 352,766$
108
109
City of Thornton, ColoradoSchedule of Investments
December 31, 2019
Coupon Maturity Original Fair ParDescription Rate Date Cost Value Value
The public report burden for this information collection is estimated to average 380 hours annually. Form # 350-050-36
City or County:City of Thornton, ColoradoYEAR ENDING :December 2019
This Information From The Records Of: Prepared By: Krista Hoover, AccountantCity of Thornton, Colorado Phone: 303-538-7362
A. Local B. Local C. Receipts from D. Receipts fromMotor-Fuel Motor-Vehicle State Highway- Federal Highway
Taxes Taxes User Taxes Administration1. Total receipts available2. Minus amount used for collection expenses3. Minus amount used for nonhighway purposes4. Minus amount used for mass transit5. Remainder used for highway purposes
AMOUNT AMOUNTA. Receipts from local sources: A. Local highway disbursements: 1. Local highway-user taxes 1. Capital outlay (from page 2) 28,134,303 a. Motor Fuel (from Item I.A.5.) 2. Maintenance: 3,517,980 b. Motor Vehicle (from Item I.B.5.) 3. Road and street services: c. Total (a.+b.) a. Traffic control operations 1,833,089 2. General fund appropriations 0 b. Snow and ice removal 750,605 3. Other local imposts (from page 2) 33,400,179 c. Other 2,244,386 4. Miscellaneous local receipts (from page 2) 6,052,164 d. Total (a. through c.) 4,828,080 5. Transfers from toll facilities 0 4. General administration & miscellaneous 494,310 6. Proceeds of sale of bonds and notes: 5. Highway law enforcement and safety 8,343,734 a. Bonds - Original Issues 0 6. Total (1 through 5) 45,318,407 b. Bonds - Refunding Issues 0 B. Debt service on local obligations: c. Notes 0 1. Bonds: d. Total (a. + b. + c.) 0 a. Interest 129,673 7. Total (1 through 6) 39,452,343 b. Redemption 769,626B. Private Contributions 404,074 c. Total (a. + b.) 899,299C. Receipts from State government 2. Notes: (from page 2) 5,913,851 a. Interest 0D. Receipts from Federal Government b. Redemption 0 (from page 2) 447,438 c. Total (a. + b.) 0E. Total receipts (A.7 + B + C + D) 46,217,706 3. Total (1.c + 2.c) 899,299
C. Payments to State for highways 0D. Payments to toll facilities 0E. Total disbursements (A.6 + B.3 + C + D) 46,217,706
A. Beginning Balance B. Total Receipts C. Total Disbursements D. Ending Balance E. Reconciliation0 46,217,706 46,217,706 0 0
Notes and Comments:
000
FORM FHWA-536 (Rev. 1-05) PREVIOUS EDITIONS OBSOLETE (Next Page)
ITEM ITEM
V. LOCAL ROAD AND STREET FUND BALANCE
(Show all entries at par)IV. LOCAL HIGHWAY DEBT STATUS
LOCAL HIGHWAY FINANCE REPORT
I. DISPOSITION OF HIGHWAY-USER REVENUES AVAILABLE FOR LOCAL GOVERNMENT EXPENDITURE
ITEM
II. RECEIPTS FOR ROAD AND STREET PURPOSES III. DISBURSEMENTS FOR ROAD AND STREET PURPOSES
112
STATE:ColoradoYEAR ENDING:December 2019
AMOUNT AMOUNTA.3. Other local imposts: A.4. Miscellaneous local receipts: a. Property Taxes and Assessments 20,276,776 a. Interest on investments 231,997 b. Other local imposts: b. Traffic Fines & Penalties 1,888,403 1. Sales Taxes 7,533,322 c. Parking Garage Fees 0 2. Infrastructure & Impact Fees 0 d. Parking Meter Fees 0 3. Liens 0 e. Sale of Surplus Property 0 4. Licenses 0 f. Charges for Services 0 5. Specific Ownership &/or Other 5,590,081 g. Other Misc. Receipts 0 6. Total (1. through 5.) 13,123,403 h. Other 3,931,764 c. Total (a. + b.) 33,400,179 i. Total (a. through h.) 6,052,164
(Carry forward to page 1) (Carry forward to page 1)
AMOUNT AMOUNTC. Receipts from State Government D. Receipts from Federal Government 1. Highway-user taxes 5,014,216 1. FHWA (from Item I.D.5.) 0 2. State general funds 2. Other Federal agencies: 3. Other State funds: a. Forest Service 0 a. State bond proceeds b. FEMA 0 b. Project Match c. HUD 0 c. Motor Vehicle Registrations 461,763 d. Federal Transit Admin 0 d. Other (Specify) - DOLA Grant 0 e. U.S. Corps of Engineers 0 e. Other (Specify) 437,872 f. Other Federal 447,438 f. Total (a. through e.) 899,635 g. Total (a. through f.) 447,438 4. Total (1. + 2. + 3.f) 5,913,851 3. Total (1. + 2.g) 447,438
(Carry forward to page 1)
III. DISBURSEMENTS FOR ROAD AND STREET PURPOSES - DETAIL
ON NATIONAL OFF NATIONALHIGHWAY HIGHWAY TOTALSYSTEM SYSTEM
(a) (b) (c)A.1. Capital outlay: a. Right-Of-Way Costs 0 127,966 127,966 b. Engineering Costs 0 1,543,702 1,543,702 c. Construction: (1). New Facilities 0 9,486,377 9,486,377 (2). Capacity Improvements 0 10,828,123 10,828,123 (3). System Preservation 0 5,565,517 5,565,517 (4). System Enhancement & Operation 0 582,618 582,618 (5). Total Construction (1)+(2)+(3)+(4) 0 26,462,635 26,462,635 d. Total Capital Outlay (Lines 1.a. + 1.b. + 1.c.5) 0 28,134,303 28,134,303
(Carry forward to page 1)
Notes and Comments:
FORM FHWA-536 (Rev. 1-05) PREVIOUS EDITIONS OBSOLETE
LOCAL HIGHWAY FINANCE REPORT
II. RECEIPTS FOR ROAD AND STREET PURPOSES - DETAIL
ITEM ITEM
ITEM ITEM
113
This Page Left Intentionally Blank
114
STATISTICAL SECTION
This part of the City of Thornton’s comprehensive annual financial report presents detailed information as a context for understanding what the information in the financial statements, note disclosures, and required supplementary information says about the government’s overall financial health.
Contents Page
Financial Trends 117
These schedules contain trend information to help the reader understand how the government’s financial performance and well-being have changed over time.
Revenue Capacity 122
These schedules contain information to help the reader assess the government’s most significant local revenue source, the sales tax.
Debt Capacity 126
These schedules present information to help the reader assess the affordability of the government’s current levels of outstanding debt and the government’s ability to issue additional debt in the future.
Demographic and Economic Information 132
These schedules offer demographic and economic indicators to help the reader understand the environment within which the government’s financial activities take place.
Schedule of Principal Employers 133
The number of employees per business is confidential therefore the City is providing employee totals by sector.
Operating Information 134
These schedules contain service and infrastructure data to help the reader understand how the information in the government’s financial report relates to the services the government provides and the activities it performs.
Total primary government 14,434,444$ 12,071,645$ 16,990,422$ 5,099,321$ 19,649,679$ 38,861,651$ 56,606,582$ 64,496,657$ 84,502,882$ 92,987,845$
Source: Current and prior year's financial statements.
Note: In the 2014 original presentation, loss on land held for resale was netted in General Government expenditures, with the 2016 presentation it is netted in investment earnings.
Total all other governmental funds 74,603,242$ 78,708,353$ 63,688,506$ 61,730,102$ 71,634,982$ 116,835,901$ 118,989,936$ 99,788,836$ 143,157,347$ 98,409,918$
Source: Current and prior year's financial statements.
City of ThorntonSchedule 3
Fund Balances of Governmental Funds(modified accrual basis accounting)
Net change in fund balances 2,665,580$ 2,450,759$ (14,969,547)$ 3,454,793$ 10,113,622$ 36,893,144$ 4,681,532$ (9,263,196)$ 45,373,698$ (32,732,950)$
Debt service as a percentageof noncapital expenditures 8.9% 7.9% 7.1% 6.2% 6.6% 5.5% 6.6% 6.0% 5.4% 6.6%
Source: Current and prior year's financial statements.
City of ThorntonSchedule 4
Changes in Fund Balances of Governmental Funds(modified accrual basis of accounting)
Note: In the 2014 original presentation, loss on land held for resale was netted in General Government expenditures, with the 2016 presentation it is netted in investment earnings.
121
SpecificFiscal Sales Motel Use Property ownership Franchise CigaretteYear tax tax tax tax tax tax tax Total
1 Revenues from the General, Parks, Open Space, Parks and Open Space, Governmental Capital, TDA North and TDA 144th Capital Funds (excluding revenue pledged for debt service on the Series 2015 and Series 2015B Tax Increment Bonds).
Source: City of Thornton Finance Department
City of ThorntonSchedule 5
General Government Tax and Assessment Revenues by Source¹
122
TotalRestaurants Direct
Fiscal General Electric & Furniture & Liquor & Telecomm. & Total Tax1, 2
Year Merchandise Grocery Natural Gas Automotive Construction Electronics Food Service Cable Utility All Other Sales Tax Rate
1 Marijuana and related products sold at retail subject to additional 5% special sales tax.2 Sales tax rate within Denver Premium Outlet shopping area is 2.35%.
Source: City of Thornton Sales and Use Tax Reports
City of ThorntonSchedule 6
Sales Tax Revenue by Type of Industry
123
Rapid TotalTotal Direct Transit Cultural Football Overlapping
Source: City of Thornton Sales and Use Tax ReportsNote: Additional 10% Colorado sales tax on recreational use marijuana and additional 5% City sales tax on marijuana and related products sold at retail.
Overlapping Rates
City of ThorntonSchedule 7
Direct and Overlapping Sales Tax Rates
124
2010 2011 2012 2013 2014 2015 2016 2017 2018 2019
Aggregate top ten filers1 19,823,390$ 22,693,871$ 23,418,920$ 24,561,715$ 25,511,695$ 26,511,596$ 27,750,234$ 28,899,319$ 29,705,410$ 33,553,048$
Aggregate all other filers 24,751,811 23,759,751 25,234,811 26,756,004 29,585,489 31,843,532 33,794,535 33,714,456 38,945,465 45,719,083
Entity (1) Valuation (2) Outstanding to the City (3) of Overlapping DebtCity of Thornton direct debt 115,178,670$
Overlapping DebtAdams 12 Five Star School District 2,544,805,640$ 503,130,000$ 48.48 243,917,424 Adams County School District 1 807,370,100 163,670,749 19.35 31,670,290 Adams County School District 14 865,171,230 72,367,598 4.43 3,205,885 Amber Creek Metropolitan District 10,335,050 18,092,000 100.00 18,092,000 Aspen Reserve Metropolitan District 4,447,030 3,527,000 100.00 3,527,000 Brighton School District 27J 1,604,802,380 329,450,000 13.18 43,421,510 Bramming Farm Metropolitan District No. 1 4,918,670 5,420,000 100.00 5,420,000 Cherrylane Metropolitan District 4,090,780 3,764,000 100.00 3,764,000 Creekside Village Metropolitan District 6,760 11,502,000 100.00 11,502,000 Cundall Farms Metropolitan District 13,664,050 12,012,000 100.00 12,012,000 Fallbrook Metropolitan District 23,219,280 4,876,049 100.00 4,876,049 Fallbrook Villas Metropolitan District 1,802,080 2,803,000 100.00 2,803,000 Heritage Todd Creek Metropolitan District 41,039,660 36,052,175 100.00 36,052,175 Highpointe Park Metropolitan District 10,429,280 5,345,000 100.00 5,345,000 Hyland Hills Metro Park & Recreation 1,397,037,790 3,625,000 6.58 238,525 Lakeview Estates Water District 1,519,180 465,499 100.00 465,499 Lambertson Lakes Metro District 20,746,900 4,775,000 100.00 4,775,000 Larkridge Metropolitan District No. 1 372,570 11,960,000 100.00 11,960,000 Larkridge Metropolitan District No. 2 141,430 15,138,024 100.00 15,138,024 Lewis Pointe Metropolitan District 14,941,010 11,548,000 100.00 11,548,000 Marshall Lake Metropolitan District 12,016,480 910,800 100.00 910,800 North Holly Metropolitan District 4,054,160 564,785,030 100.00 564,785,030 North Metro Fire Rescue FKA Fire Dist. 1 587,805,840 13,720,000 0.36 49,392 Orchard Farms Metropolitan District 8,885,760 12,893,000 100.00 12,893,000 PLA Metropolitan District 3,929,100 875,000 100.00 875,000 Rangeview Library District 5,869,886,310 25,920,000 27.94 7,242,048 Talon Pointe Metropolitan District 5,622,950 49,819,337 100.00 49,819,337 Villas at Eastlake Reservoir Metro District 3,745,260 2,500,000 100.00 2,500,000 Willow Bend Metropolitan District 3,411,270 16,455,000 100.00 16,455,000 Subtotal, overlapping debt 1,125,262,988$
Total direct and overlapping debt 1,240,441,658$
(1)Adams County Parterre Metropolitan DistrictsAdams County Fire Protection District RII-DII Business Improvement DistrictAsh Meadows Metropolitan District Regional Transportation DistrictBrittany Place Metropolitan District River Valley Village Metropolitan DistrictCentral Colorado Water Conservancy Riverdale Peaks II Metropolitan DistrictCity of Thornton 136th Ave GID Riverdale Ranch Metropolitan DistrictCreekside Village Metropolitan District South Adams County Fire Protection DistrictEastcreek Farm Metropolitan District South Adams Water and Sanitation DistrictFire District 6 Greater Brighton Talon Pointe Coordinating Metro DistrictHome Place Metropolitan District Timberleaf Metropolitan DistrictHomestead Hills Metropolitan District Todd Creek Village Park and Recreation DistrictLees Farm Metropolitan District Urban Drainage and Flood Control DistrictMayfield Metropolitan District Urban Drainage and Flood Control District - S. PlatteNorth End Metropolitan Districts Village at Dry Creek Metro DistrictsNorth Metro Fire Bond (FKA FD1B) Village at Thorncreek Metropolitan DistrictNorth Washington Water and Sanitation District Wright Farms Metropolitan District
York Street Metropolitan District
(2)(3)
Note: Overlapping governments are those that coincide, at least in part, with the geographic boundaries of the City.
City of ThorntonSchedule 11
Direct and Overlapping Governmental Activities DebtAs of December 31, 2019
Sources: Adams County Assessor's office and individual taxing entities.
The following entities also overlap the City but have no reported general obligation debt outstanding:
Assessed values certified in 2019 are for collection of ad valorem property taxes in 2020.The percentage of each entity's outstanding debt chargeable to the City is calculated by comparing the assessed valuation of the portion overlapping the City to the total assessed valuation of the overlapping entity. To the extent the City's assessed valuation changes disproportionately with the assessed valuation of overlapping entities, the percentage of debt for which property owners within the City are responsible will also change.
Total net debt applicable as a percentage of debt - - - - - - - - - - limit
Legal Debt Margin Calculation for Fiscal Year 2019
Assessed Value 1,640,355,560$
Debt limit (10% of total assessed value)1 164,035,556 Debt applicable to limit General obligation bonds - Less: Amount set aside for repayment of general obligation debt -
Total net debt applicable to limit -
Legal debt margin 164,035,556$
1 Per the City of Thornton Charter, the City's general obligation debt should not exceed 10 percent of the total assessed property value. By law, the general obligation debt subject to the limitation may be offset by amounts set aside for repaying general obligation bonds.
Note: Details regarding the City's outstanding debt can be found in the notes to the financial statements.
Source: Current and prior year's financial statements and the Adams County Assessor's Office.
Notes: Water revenue refunding bonds were issued in 2013.Water charges and other includes investment earnings and tap fees.Operating expenses do not include depreciation or amortization expenses.TDA North Tax Increment Revenue Bonds series 2004 were refunded in 2015, no principal due in 2015.TDA 144th Tax Increment Revenue Bonds series 2015B, no principal or interest due in 2015.Sales and Use Tax Bonds series 2007, were paid in full in 2018.
City of ThorntonSchedule 13
Pledged-Revenue Coverage
131
Personal PerIncome Capita
Fiscal (thousands of Personal Unemployment Year Population of dollars) Income Rate
2010 118,772 3,099,949 26,100 8.3%
2011 120,147 3,135,837 26,100 8.9%
2012 121,211 3,241,909 26,746 8.4%
2013 122,643 3,258,134 26,566 6.9%
2014 123,648 3,243,040 26,228 4.4%
2015 131,761 3,528,823 26,782 3.5%
2016 134,149 3,704,927 27,618 2.7%
2017 137,443 3,916,713 28,497 3.0%
2018 140,509 4,228,478 30,094 3.8%
2019 143,788 4,499,270 31,291 2.4%
Sources: US Census Bureau (personal income), City of Thornton Planning Division (population), United States Department of Labor (Unemployment) for the City
City of ThorntonSchedule 14
Demographic and Economic Statistics
132
Percentageof Total City
Employer Type Employees Rank Employment
Retail Trade (350 units) 7,089 1 25%
Health Care and Social Assistance (237 Units) 4,565 2 16%
Accomodation and Food Services (210 Units) 3,984 3 14%
Educational Services (88 Units) 2,983 4 11%
Public Administration (47 Units) 2,059 5 7%
Other Services (271 Units) 1,410 6 5%
Construction (244 Units) 1,260 7 4%
Manufacturing (53 units) 904 8 3%
Professional, Service & Tech (156 Units) 785 9 3%
Information (52 Units) 724 10 3%
Total 25,763 91%
Total number of persons employed by Thornton establishments: 28,430
Percentageof Total City
Employer Type Employees Rank Employment
Educational Services (16 Units) 5,565 1 21%
Retail Trade (186 units) 5,163 2 20%
Health Care and Social Assistance (158 Units) 3,616 3 14%
Accommodation and Food Services (151 Units) 3,113 4 12%
Administrative support (78 Units) 1,962 5 8%
Construction (150 Units) 899 6 3%
Other Services (109 Units) 789 7 3%
Professional Services (165 Units) 695 8 3%
Information (20 Units) 620 9 2%
Finance and Insurance (90 Units) 491 10 2%
Total 22,913 88%
Total number of persons employed by Thornton establishments: 25,923
Note: The number of employees per business is confidential therefore the City is providing employee totals by sector.
Note: Indicators are not available for the general government function.* Indicator was not tracked in 2016.** Indicator was not tracked prior to 2019 - Trail Winds Recreation Center opened November 2019
Note: No capital asset indicators are available for the general government function.
Sources: Various city departments.
Capital Asset Statistics by FunctionSchedule 18
City of Thornton
136
City of Thornton, Colorado Compliance Report Year Ended December 31, 2019
Contents Report on internal control over financial reporting and on compliance and other matters based on an audit of financial statements performed in accordance with Government Auditing Standards
1-2 Report on compliance for the major federal program; report on internal control over compliance; and report on the schedule of expenditures of federal awards required by the Uniform Guidance
3-4 Schedule of expenditures of federal awards 5 Notes to schedule of expenditures of federal awards 6 Summary schedule of prior audit findings 7 Schedule of findings and questioned costs 8-9 Corrective action plan 10
1
Report on Internal Control Over Financial Reporting and on Compliance and Other Matters Based on an
Audit of Financial Statements Performed in Accordance with Government Auditing Standards
Independent Auditor’s Report
Honorable Mayor and Members of the City Council and City Manager of the City of Thornton, Colorado We have audited, in accordance with the auditing standards generally accepted in the United States of America and the standards applicable to financial audits contained in Government Auditing Standards issued by the Comptroller General of the United States, the financial statements of the governmental activities, the business-type activities, each major fund and the aggregate remaining fund information of the City of Thornton, Colorado (the City), as of and for the year ended December 31, 2019, and the related notes to the financial statements, which collectively comprise the City’s basic financial statements, and have issued our report thereon dated May 20, 2020. Internal Control Over Financial Reporting In planning and performing our audit of the financial statements, we considered the City’s internal control over financial reporting (internal control) to determine the audit procedures that are appropriate in the circumstances for the purpose of expressing our opinions on the financial statements, but not for the purpose of expressing an opinion on the effectiveness of the City’s internal control. Accordingly, we do not express an opinion on the effectiveness of the City’s internal control. A deficiency in internal control exists when the design or operation of a control does not allow management or employees, in the normal course of performing their assigned functions, to prevent, or detect and correct, misstatements on a timely basis. A material weakness is a deficiency, or a combination of deficiencies, in internal control, such that there is a reasonable possibility that a material misstatement of the City’s financial statements will not be prevented, or detected and corrected on a timely basis. A significant deficiency is a deficiency, or a combination of deficiencies, in internal control that is less severe than a material weakness, yet important enough to merit attention by those charged with governance. Our consideration of internal control was for the limited purpose described in the first paragraph of this section and was not designed to identify all deficiencies in internal control that might be material weaknesses or significant deficiencies and therefore, material weaknesses or significant deficiencies may exist that have not been identified. Given these limitations, during our audit we did not identify any deficiencies in internal control that we consider to be material weaknesses. We did identify a deficiency in internal control, described in the accompanying schedule of findings and questioned costs as item 2019-001 that we consider to be a significant deficiency.
2
Compliance and Other Matters As part of obtaining reasonable assurance about whether the City’s financial statements are free from material misstatement, we performed tests of its compliance with certain provisions of laws, regulations, contracts, and grant agreements, noncompliance with which could have a direct and material effect on the determination of financial statement amounts. However, providing an opinion on compliance with those provisions was not an objective of our audit, and accordingly, we do not express such an opinion. The results of our tests disclosed no instances of noncompliance or other matters that are required to be reported under Government Auditing Standards. City of Thornton, Colorado’s Response to the Finding The City’s response to the finding identified in our audit is described in the accompanying scheduled of findings and questioned costs. The City’s response was not subjected to the auditing procedures applied in the audit of the financial statement and, accordingly, we express no opinion on it. Purpose of this Report The purpose of this report is solely to describe the scope of our testing of internal control and compliance and the results of that testing, and not to provide an opinion on the effectiveness of the City’s internal control or on compliance. This report is an integral part of an audit performed in accordance with Government Auditing Standards in considering the City’s internal control and compliance. Accordingly, this communication is not suitable for any other purpose.
Denver, Colorado May 20, 2020
3
Report on Compliance for the Major Federal Program; Report on Internal Control Over Compliance; and
Report on the Schedule of Expenditures of Federal Awards Required by the Uniform Guidance
Independent Auditor’s Report
Honorable Mayor and Members of the City Council and City Manager of the City of Thornton, Colorado Report on Compliance for the Major Federal Program We have audited the City of Thornton, Colorado’s (the City) compliance with the types of compliance requirements described in the OMB Compliance Supplement that could have a direct and material effect on the City’s major federal program for the year ended December 31, 2019. The City's major federal program is identified in the summary of auditor's results section of the accompanying schedule of findings and questioned costs. Management’s Responsibility Management is responsible for compliance with federal statutes, regulations, and terms and conditions of its federal awards applicable to its federal programs. Auditor’s Responsibility Our responsibility is to express an opinion on compliance for the City’s major federal program based on our audit of the types of compliance requirements referred to above. We conducted our audit of compliance in accordance with auditing standards generally accepted in the United States of America; the standards applicable to financial audits contained in Government Auditing Standards, issued by the Comptroller General of the United States; and the audit requirements of Title 2 U.S. Code of Federal Regulations Part 200, Uniform Administrative Requirements, Cost Principles, and Audit Requirements for Federal Awards (Uniform Guidance). Those standards and the Uniform Guidance require that we plan and perform the audit to obtain reasonable assurance about whether noncompliance with the types of compliance requirements referred to above that could have a direct and material effect on a major federal program occurred. An audit includes examining, on a test basis, evidence about the City’s compliance with those requirements and performing such other procedures as we considered necessary in the circumstances. We believe that our audit provides a reasonable basis for our opinion on compliance for the major federal program. However, our audit does not provide a legal determination of the City’s compliance. Opinion on the Major Federal Program In our opinion, the City complied, in all material respects, with the types of compliance requirements referred to above that could have a direct and material effect on the major federal programs for the year ended December 31, 2019.
4
Report on Internal Control over Compliance Management of the City is responsible for establishing and maintaining effective internal control over compliance with the types of compliance requirements referred to above. In planning and performing our audit of compliance, we considered the City’s internal control over compliance with the types of requirements that could have a direct and material effect on each major federal program to determine the auditing procedures that are appropriate in the circumstances for the purpose of expressing an opinion on compliance for each major federal program and to test and report on internal control over compliance in accordance with the Uniform Guidance, but not for the purpose of expressing an opinion on the effectiveness of internal control over compliance. Accordingly, we do not express an opinion on the effectiveness of the City’s internal control over compliance. A deficiency in internal control over compliance exists when the design or operation of a control over compliance does not allow management or employees, in the normal course of performing their assigned functions, to prevent, or detect and correct, noncompliance with a type of compliance requirement of a federal program on a timely basis. A material weakness in internal control over compliance is a deficiency, or combination of deficiencies, in internal control over compliance, such that there is a reasonable possibility that material noncompliance with a type of compliance requirement of a federal program will not be prevented, or detected and corrected, on a timely basis. A significant deficiency in internal control over compliance is a deficiency, or a combination of deficiencies, in internal control over compliance with a type of compliance requirement of a federal program that is less severe than a material weakness in internal control over compliance, yet important enough to merit attention by those charged with governance. Our consideration of internal control over compliance was for the limited purpose described in the first paragraph of this section and was not designed to identify all deficiencies in internal control over compliance that might be material weaknesses or significant deficiencies. We did not identify any deficiencies in internal control over compliance that we consider to be material weaknesses. However, material weaknesses may exist that have not been identified. The purpose of this report on internal control over compliance is solely to describe the scope of our testing of internal control over compliance and the results of that testing based on the requirements of the Uniform Guidance. Accordingly, this report is not suitable for any other purpose. Report on Schedule of Expenditures of Federal Awards Required by the Uniform Guidance We have audited the financial statements of the governmental activities, business-type activities, each major fund, and the aggregate remaining fund information of the City of Thornton, Colorado as of and for the year ended December 31, 2019, and the related notes to the financial statements, which collectively comprise the City’s basic financial statements. We issued our report thereon dated May 20, 2020, which contained unmodified opinions on those financial statements. Our audit was conducted for the purpose of forming opinions on the financial statements that collectively comprise the basic financial statements. The accompanying schedule of expenditures of federal awards is presented for purposes of additional analysis as required by the Uniform Guidance and is not a required part of the basic financial statements. Such information is the responsibility of management and was derived from and relates directly to the underlying accounting and other records used to prepare the basic financial statements. The information has been subjected to the auditing procedures applied in the audit of the financial statements and certain additional procedures, including comparing and reconciling such information directly to the underlying accounting and other records used to prepare the basic financial statements or to the basic financial statements themselves, and other additional procedures in accordance with auditing standards generally accepted in the United States of America. In our opinion, the schedule of expenditures of federal awards is fairly stated in all material respects in relation to the basic financial statements as a whole.
Denver, Colorado May 20, 2020
5
City of Thornton, Colorado
Schedule of Expenditures of Federal AwardsYear Ended December 31, 2019
Federal Pass-ThroughFederal Grantor/ CFDA Entity Identifying Pass-Through to Federal
Pass-Through Grantor/Program Title Number Number or Grant Number Subrecipients Expenditures
U.S. Department of Homeland SecurityDirect Program
Federal Emergency Management AgencyStaffing for Adequate Fire and Emergency Response 97.083 EMW-2016-FH-00453 -$ 650,270 $
Direct ProgramFederal Emergency Management Agency
Staffing for Adequate Fire and Emergency Response 97.044 EMW-2017-FO06003 -$ 180,614 $
Pass-Through Program From: State of Colorado–Department of Public Safety
Subtotal 97.036 - 3,635,695 Total U.S. Department of Homeland Security - 4,466,579
U.S. Department of Housing and Urban DevelopmentDirect Program
Office of Community Planning and DevelopmentCommunity Development Block Grants/Entitlement Grants 14.218 B-16-MC-08-0015 59,102 95,565 Community Development Block Grants/Entitlement Grants 14.218 B-17-MC-08-0015 250,159 330,919 Community Development Block Grants/Entitlement Grants 14.218 B-18-MC-08-0015 5,503 538,163 Community Development Block Grants/Entitlement Grants 14.218 B-19-MC-08-0015 2,956 8,036
Subtotal 14.218 317,720 972,683 Total U.S. Department of Housing and Urban Development 317,720 972,683
U.S. Department of JusticeDirect Program
Edward Byrne Memorial Justice Assistance Grant Program 16.738 2017-DJ-BX-0763 - 9,561 Edward Byrne Memorial Justice Assistance Grant Program 16.738 2018-DJ-BX-0269 - 4,431 Edward Byrne Memorial Justice Assistance Grant Program 16.738 2019-DJ-BX-0269 - 7,937
Subtotal 16.738 - 21,929
Public Safety Partnership and Community Policing Grants 16.835 2018-BC-BX-0042 - 96,604
Public Safety Partnership and Community Policing Grants 16.710 2017-UM-WX-0160 - 250,088
Pass-Through Program From:State of Colorado—Department of Public Safety
Crime Victim Assistance 16.575 2018-VA-19-071-17 - 78,404 Total U.S. Department of Justice - 447,025
U.S Department of TransportationPass-Through Program From:
State of Colorado—Department of TransportationHighway Planning and Construction Cluster 20.205 AQC M286-044 (22323) - 447,020 Highway Planning and Construction Cluster 20.205 SAR M286-046 (22552) - 418
Subtotal 20.616 - 33,616 Total U.S. Department of Transportation - 481,054
Total Expenditures of Federal Awards 317,720 $ 6,367,341 $
See notes to schedule of expenditures of federal awards.
City of Thornton, Colorado Notes to Schedule of Expenditures of Federal Awards Year Ended December 31, 2019
6
Note 1. Basis of Presentation The accompanying schedule of expenditures of federal awards (the Schedule) includes the federal award activity of the City of Thornton, Colorado (the City) under programs of the federal government for the year ended December 31, 2019. All federal awards received directly from federal agencies, as well as federal awards passed through other governmental entities, are included in the Schedule. The information in this Schedule is presented in accordance with the requirements of Title 2 U.S. Code of Federal Regulations Part 200, Uniform Administrative Requirements, Cost Principles and Audit Requirements for Federal Awards (Uniform Guidance). Because the Schedule presents only a selected portion of the operations of the City, it is not intended to and does not present the financial position, changes in net position or cash flows of the City.
Note 2. Significant Accounting Policies Expenditures reported on the Schedule are reported on the accrual basis of accounting. Such expenditures are recognized following the cost principles contained in the Uniform Guidance, wherein certain types of expenditures are not allowable or are limited as to reimbursement. Pass-through identifying numbers are presented where available and grant numbers are provided for direct grants. Negative amounts, if any, shown on the Schedule represent adjustments or credits made in the normal course of business to amounts reported as expenditures in prior years.
Note 3. Indirect Cost Rate The City does not have a negotiated indirect cost allocation plan and elected not to use the 10% de minimis indirect cost rate allowed under the Uniform Guidance.
7
City of Thornton, Colorado
Summary Schedule of Prior Audit FindingsYear Ended December 31, 2019
The prior year single audit disclosed no findings in the Schedule of Findings and Questioned Costs andno uncorrected or unresolved findings exist from the prior auditor's Summary of Prior Audit Findings.
8
City of Thornton, Colorado
Schedule of Findings and Questioned CostsYear Ended December 31, 2019
Type of auditor's report issued on compliance for major programs: Unmodified
. Any audit findings disclosed that are required to be reported in accordance with
Section 2 CFR 200.516(a)? Yes No
Identification of major program:
CFDA Number Name of Federal Program or Cluster
97.036 Disaster Grants - Public Assistance (presidentially Declared Disasters)
Dollar threshold used to distinguish between type A and type B programs: $750,000
Auditee qualified as low-risk auditee? Yes No
(Continued)
City of Thornton, Colorado Schedule of Findings and Questioned Costs (Continued) Year Ended December 31, 2019
9
II. Findings Related to the Financial Statement Audit as Required to be Reported in Accordance with Generally Accepted Government Auditing Standards
A. Internal Control
2019-001
Finding: There was a payment to a developer in the TDA North capital projects fund that was did not get recorded in the correct period.
Criteria: In accordance with accounting principles generally accepted in the United States of America (US GAAP), capital outlay expenditures in a governmental fund should be reported on the modified accrual basis of accounting (in the period the expenditure is incurred.)
Condition: In the original financial statements prepared by management, capital outlay expenditures and accounts payable in the TDA North fund were understated by approximately $343,000 because the payment to the developer was recorded in fiscal year 2020 instead of fiscal year 2019.
Cause: Cutoff procedure controls related to developer reimbursed capital outlay expenditures were not operating effectively at year-end and expenditures relating to 2019 were not recorded in the correct period.
Effect: A misstatement to the financial statements could exists and not be detected in a timely manner. An audit adjustment of approximately $343,000 was proposed in order to correct the error.
Recommendation: We recommend the City implement additional controls related to the review of accruals related to developer reimbursed capital outlay.
Management’s response: Management agrees with the finding.
B. Compliance findings
No matters to report.
III. Findings and Questioned Costs for Federal Awards