33
City-regions and economic development: an overview Prof. Alan Harding Presentation to Tyne and Wear Chief Executives Development Day Workshop on Economic Assessments 7 January 2009, Durham
| Date post: | 14-Dec-2015 |
| Category: |
Documents |
| Upload: | reilly-whitley |
| View: | 215 times |
| Download: | 1 times |

City-regions and economic development:
an overviewProf. Alan Harding
Presentation to Tyne and Wear Chief Executives Development Day Workshop
on Economic Assessments7 January 2009, Durham

This presentation
• Three drivers of city-regionalism: conceptual, empirical, political
• Key challenges for city-regional economic assessments

Conceptual drivers: the emerging academic consensus
• City-regions are locomotives of the national economies within which they are situated, in that they are the sites of dense masses of interrelated economic activities that also typically have high levels of productivity by reason of their jointly-generated agglomeration economies and their innovative potentials
Scott and Storper, 2003• Metropolitan spaces are becoming, more and more, the
adequate ecosystems of advanced technology and economy…. [T]he decrease of communication costs does not by itself lead to a spreading and diffusion of wealth and power; on the contrary, it entails their polarization.
Veltz, 2005

Agglomeration: the ‘new’ buzz word
• Literally; ‘gathering together in a mass’• Old urban (economic) geography concept with 2
competing traditions• ‘Localisation economies’, benefits experienced by firms from co-location
(Modern version; Porter on ‘clusters’)• ‘Urbanisation economies’, benefits derived by workers and households as well
as firms from city size, density and variety (Modern version; Florida on ‘the creative class’)
• Associated with key observations e.g. productivity benefits of population growth, urban wage premium (within cities and on departure)
• Recent rediscovery by economists who had previously ignored ‘increasing returns to scale’
• Has become basis of new work on, e.g. ‘spillover effects’, ‘effective density’, attempts to explain why falling transport costs should be associated with concentration rather than dispersal of economic activity

.. and its implications?
• Big, dense, diverse, well-connected city-regions increasingly drive regional, and by implication national, economic performance
• But the performance gap between city-regions is growing; stretching urban hierarchies, nationally and internationally
• What’s the empirical evidence?

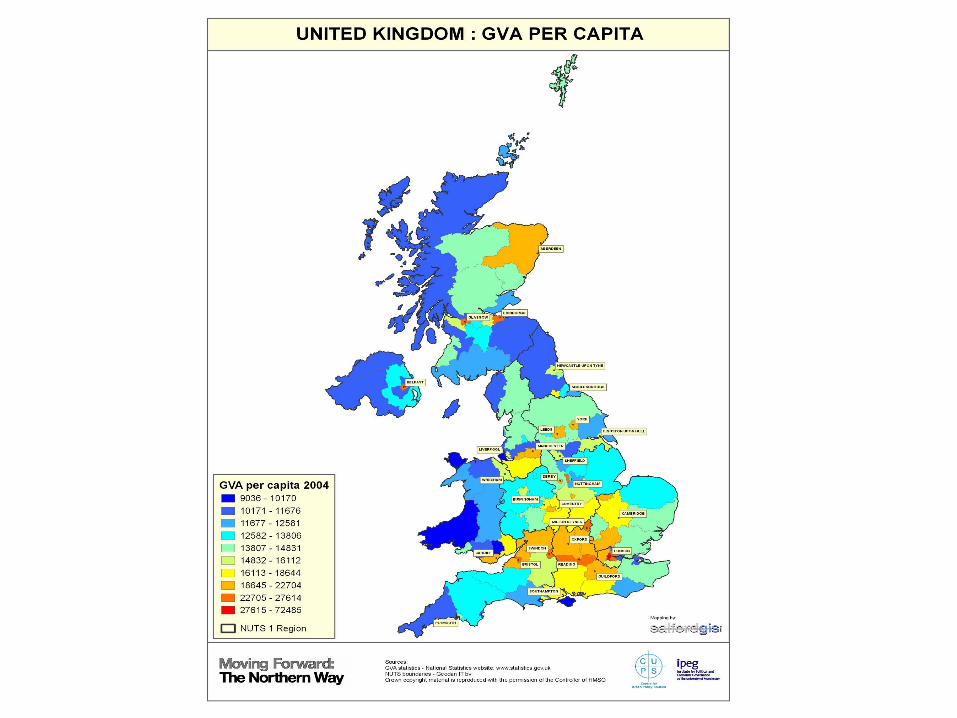
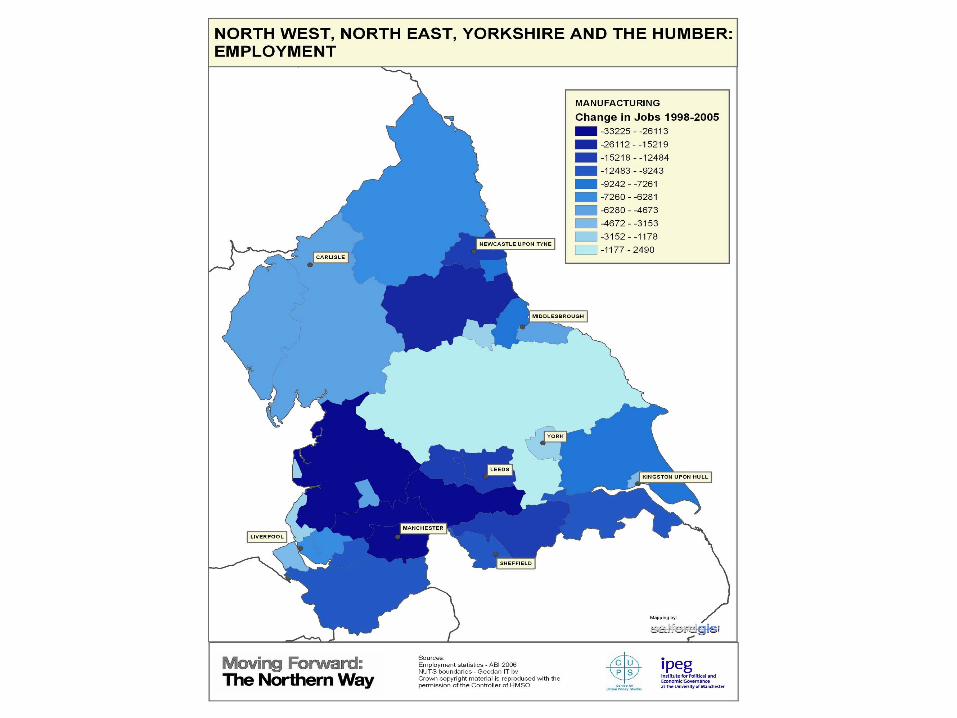
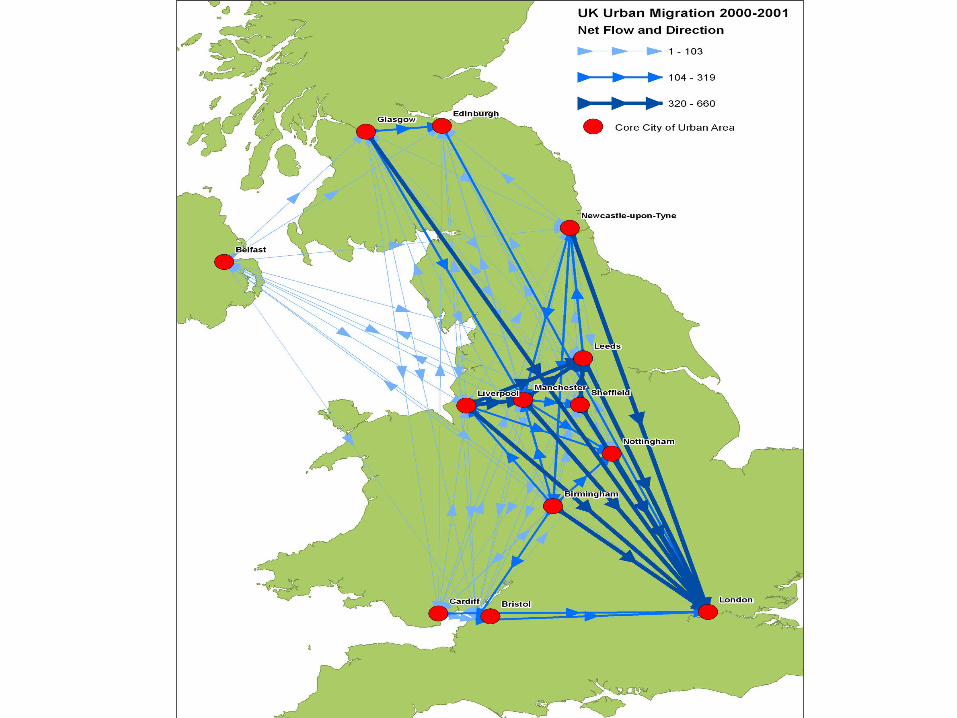
THE GEOGRAPHY OF THE UK BOOM…


BUT ALSO CROSS-NATIONALLY, WITH DIFFERENT ECONOMIC CYCLES...

Aachen
Amsterdam
Basel
Berlin
Bern
Besancon
Bonn
Bremen
Bremerhaven
Brussel
Cottbus
Dortmund
Dresden
Düsseldorf
Enschede
Erfurt
Frankfurt
Freiburg
GroningenHamburg
Hannover
Ingolstadt
Innsbruck
Kaiserslautern
Kassel
Kiel
Kobenhavn
Köln
Lausanne
Leipzig
Liechtenstein
Linz
Luxembourg
Lübeck
Magdeburg
Metz
Mulhouse
München
Nancy Nürnberg
Odense
Paderborn
Plzen
Praha
Rostock
Rotterdam
Salzburg
Schwerin
Siegen
Strasbourg Stuttgart
Szczecin
Wien
Würzburg
Zwickau
Zürich
Antwerpen
Higher than 15%Between 7% and 15%Between 3% and 7%Between 1.5% and 3%Between 0.5% and 1.5%Lower than 0.5%

Aachen
Amsterdam
Basel
Berlin
Bern
Besancon
Bonn
Bremen
Bremerhaven
Brussel
Cottbus
Dortmund
Dresden
Düsseldorf
Enschede
Erfurt
Frankfurt
Freiburg
GroningenHamburg
Hannover
Ingolstadt
Innsbruck
Kaiserslautern
Kassel
Kiel
Köln
Lausanne
Leipzig
Liechtenstein
Linz
Luxembourg
Lübeck
Magdeburg
Metz
Mulhouse
München
Nancy Nürnberg
Paderborn
Plzen
Praha
Rostock
Rotterdam
Salzburg
Schwerin
Siegen
Strasbourg Stuttgart
Szczecin
Wien
Würzburg
Zwickau
Zürich
Antwerpen
Higher than 5.5%Between 3% and 5.5%Between 2% and 3%Between 1.5% and 2%Between 0.5% and 1.5%Lower than 0.5%

Higher than 15%Between 7% and 15%Between 3% and 7%Between 1.5% and 3%Between 0.5% and 1.5%Lower than 0.5%
Seoul
KwangjuPusan
Kangnung
Kunsan
Chorwon
Chongju
Cheju

Higher than 5.5%Between 3% and 5.5%Between 2% and 3%Between 1.5% and 2%Between 0.5% and 1.5%Lower than 0.5%
Seoul
KwangjuPusan
Kangnung
Kunsan
Chorwon
Chongju
Cheju

AachenAmiens
Andorra
Angers
Barcelona
Basel
Bern
Besancon
Bilbao
Bonn
Bordeaux
Brest
Brussel
Clermont-Ferrand
Dijon
DortmundDüsseldorf
Enschede
Frankfurt
Freiburg
Geneve
Genova
Grenoble
Kaiserslautern
Köln
La Spezia
Lausanne
Le Havre
Le Mans
Liechtenstein
Lille
Limoges
Livorno
Luxembourg
Lyon
Marseille
Metz
Milano
Monaco
Montpellier
NancyNantes Orleans
Paris
Parma
Perpignan
Portsmouth
ReimsRennes
Rouen
Santander
Siegen
Strasbourg Stuttgart
Torino
Toulon
Toulouse
Valencia
Zaragoza
Zürich
Antwerpen
Higher than 15%Between 7% and 15%Between 3% and 7%Between 1.5% and 3%Between 0.5% and 1.5%Lower than 0.5%

AachenAmiens
Andorra
Angers
Barcelona
Basel
Bern
Besancon
Bilbao
Bonn
Bordeaux
Brest
Brussel
Clermont-Ferrand
Dijon
Dortmund
Enschede
Frankfurt
Freiburg
Geneve
Genova
Grenoble
Grosseto
Kaiserslautern
La Spezia
Lausanne
Le Havre
Le Mans
Liechtenstein
Lille
Limoges
Livorno
Luxembourg
Lyon
Marseille
Metz
Milano
Monaco
Montpellier
NancyNantes Orleans
Paris
Parma
Perpignan
Portsmouth
ReimsRennes
Rouen
Siegen
Strasbourg Stuttgart
Torino
Toulon
Toulouse
Valencia
Zaragoza
Zürich
Antwerpen
Higher than 5.5%Between 3% and 5.5%Between 2% and 3%Between 1.5% and 2%Between 0.5% and 1.5%Lower than 0.5%

POLICY ENVIRONMENT

Formal (decentralist) position: SNR
• The end of national urban policy based on top-down, needs-based prioritisation, targeted national programmes
• Instead, passing of responsibility to regional, sub-regional and local scales (without prioritising any in particular), strengthening of oversight by Westminster and Whitehall
• Recognises importance of city-regions…• ‘[O]ur towns and cities are often the engines of economic growth and many economic
markets operate at the level of sub-regions, including city-regions’
• …and makes provision for development of CR strategies and governance arrangements, voluntary and statutory
• ..but sees CRs as just one type of sub-region, between which there is no prioritisation
• Contrast this with…

Informal (centralist) position: CSR and ‘place blind’ policy reform
Tight spending settlement for 2008-11: cuts in sub-national e.d. & regeneration budgets, BUT
Response to growth management agenda in Eddington, Barker, and Leitch (coping with agglomeration pressures)
Realignment of major capital projects to support and manage the growth of the London super-region: e.g.
London Olympics, Crossrail, and ‘growth areas’, added to Heathrow 3rd runway, Chunnel rail link, and ‘incidental’
spatial policy (e.g. HE R&D) No equivalent package for any northern or midland
CRs
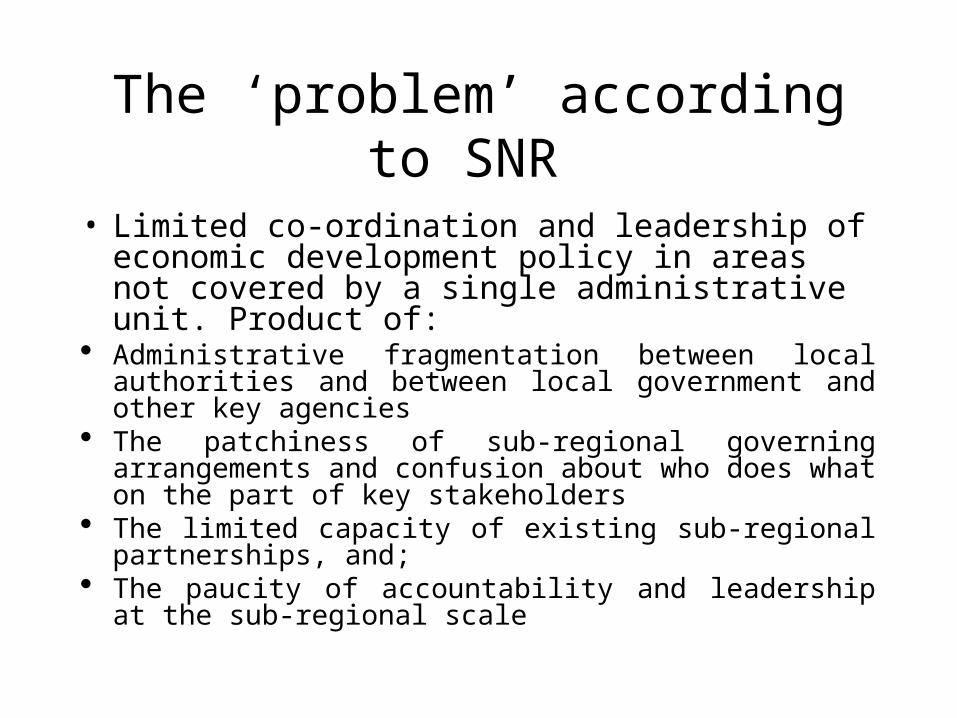
The ‘problem’ according to SNR
• Limited co-ordination and leadership of economic development policy in areas not covered by a single administrative unit. Product of:
Administrative fragmentation between local authorities and between local government and other key agencies
The patchiness of sub-regional governing arrangements and confusion about who does what on the part of key stakeholders
The limited capacity of existing sub-regional partnerships, and;
The paucity of accountability and leadership at the sub-regional scale

IMPLICATIONS AND CHALLENGES

Post-SNR, post-national urban & regional policy
Benign centralism and devolution within London SR Decentralisation rather than devolution for the rest
Policy environment characterised by: Lack of formal, national spatial development priorities (or
at least delivery mechanisms) Opaque decision-making, potentially radical change in
central-local relations; shift to inter-governmental bargaining, deal-making, informal coalition-building
Premium on leadership, assertiveness, having the right narrative, pressing the right buttons

Four overall challenges
Deciding whether to play the game, given uncertain rewards
The ‘it will pass’ position ignores the (international) economic and policy context and the likelihood that elements of the CR agenda would likely accelerate, not disappear, under a non-Labour govt.
Quality of evidence/understanding Relational analysis; economic, not administrative ‘units’; area-specific issues,
assets, interactivity, potential Persuasiveness of CR strategy
Parsimonious strategic goals, not shopping lists; how addressing ‘problems’ releases ‘potential’; ringing Govt. dept. bells: facilitating PSA delivery
Effectiveness of governance Influence; capacity; accountability and hard choices; delivery machinery

Specific challenges for city-regional economic assessments
Maintaining an economic focus; primarily about employment, productivity, transport, labour and housing markets
Address key headline questions re- where leading economic activities will be located in future and where the people who service them will come
from/choose to live Clarity about geographies: what is the CR scale and why is it important? [CR
vs region, admin. sub-region, other cross-district entities. urban-rural links] Developing a dynamic, future-orientated, forensic approach to analysis of
hot/cold spots and the assets that support them; Looking below district scale and outward to relationship to rest of region, other CRs, international
links Economic functions of key nodes, corridors; polynuclear or not?
Understanding linkages; employment & housing, TTW, migration, transport infrastructure; supply chains, purchases & sales;
Underpin clear view of priorities (USP), feasible use of policy levers Scenario-based flexibility; making analysis recession-proof

Manchester Independent Economic Review as the gold standard?
Independent 18 month programme of fundamental research & dissemination activity
£1.4m budget (from NESTA, NWDA, local partners) 6 main projects, focusing upon agglomeration economies,
innovation capacity & networks, inward & indigenous investment, trading links & supply chains, thick labour
markets & skills, sustainable communities (segregation & polarisation)
Comparative, within UK and (to limited extent) internationally
3 big challenges: building a common narrative, achieving consensus on policy implications, translating into practice

GEOGRAPHY OF THE BUST?

The regional geography of the last housing market crash
Prices Peak Trough Ave (end of trough)
Duration (quarters)
% decline
Region
East Q4, 1988 Q1, 1993 57,200 17 33.9
South East Q1, 1989 Q4, 1992 73,556 15 30.7
South West Q1, 1989 Q4, 1992 60,522 15 29.3
London Q4, 1988 Q1, 1993 75,832 17 27.9
East Midlands Q2, 1989 Q4, 1995 52,618 26 20.1
North West Q2, 1991 Q3, 1995 52,158 17 14.2
West Midlands Q2, 1989 Q2, 1995 60,441 24 12.3
North East Q4, 1991 Q3, 1995 48,750 15 11.3
Yorks/Humber Q1, 1991 Q3, 1995 50,249 18 10.2
England average Q3, 1989 Q4, 1995 61,115 25 12.5