Page 1
City, University of London Institutional Repository
Citation: Zhang, Haotian (2014). Smart Grid Technologies and Implementations. (Unpublished Doctoral thesis, City University London)
This is the accepted version of the paper.
This version of the publication may differ from the final published version.
Permanent repository link: http://openaccess.city.ac.uk/5918/
Link to published version:
Copyright and reuse: City Research Online aims to make research outputs of City, University of London available to a wider audience. Copyright and Moral Rights remain with the author(s) and/or copyright holders. URLs from City Research Online may be freely distributed and linked to.
City Research Online: http://openaccess.city.ac.uk/ [email protected]
City Research Online
Page 2
Smart Grid Technologies and Implementations
By
Haotian Zhang
This thesis is submitted for the Degree of
Doctor of Philosophy
At
City University London
School of Engineering and Mathematical Sciences
May 2014
Page 3
Smart Grid Technologies and Implementations
I
Acknowledgements
I wish to take this great opportunity to express my deep sense of respect and gratitude
to my supervisor, Professor Loi Lei Lai, and Professor Nicholas Karcanias, who have
had faith in me and provided me professional supervision to my Ph.D study with
patience. Especially under the guidance from Professor Lai, his encouragement and
technical support throughout the completion of my research work always came in time
when I met difficulties. I feel highly privileged to worked under them and grateful to
their kindness help.
I convey my appreciation and thankfulness to Dr. Fang Yuan Xu, Dr. Ying Nan Ma,
Dr. Long Zhou and many other colleagues at energy system group in City University
London. We often took time off from our own works and debated for some critical
problems, which gave me inspiration and directly helped me in accomplishment of my
research.
I gratefully express my deepest acknowledgement and sincere gratitude to my parents,
Pei Sheng Zhang and Xiang Dong Zhang, who provided intense support morally and
financially for my study abroad. My special thanks to my uncle and aunty Xiang Yang
Zhang and Shu-Chiu Hong, who helped me a lot and shared their experiences and
lessons of living overseas.
I would like to express my heartfelt thanks to my girlfriend, Ya Qing Lu for her patience,
encouragement when I am abroad. Her love is my major impetus to face the future.
Finally, I am thankful to my friends, Kasy Chong Wang, Andrew Lenard, Bryant Xu
Sheng Lin, Leanne Heng Liu, Shan Chong, Chun Sing Lai, Qi Ling Lai, Tian Yu Luo,
Jie Bei Zhu. They brought love and joy to me, and enriched my spare time during my
study in the UK.
Bow to All ones supporting me
Page 4
Smart Grid Technologies and Implementations
II
Abstract
Smart grid has been advocated in both developing and developed countries in many
years to deal with large amount of energy deficit and air pollutions. However, many
literatures talked about some specific technologies and implementations, few of them
could give a clear picture on the smart grid implementations in a macro scale like what
is the main consideration for the smart grid implementations, how to examine the power
system operation with communication network deployment, how to determine the
optimal technology scheme with consideration of economic and political constraints,
and so on. Governments and related institutions are keen to evaluate the cost and benefit
of new technologies or mechanisms in a scientific way rather than making decision
blindly. Decision Support System, which is an information system based on interactive
computers to support decision making in planning, management, operations for
evaluating technologies, is an essential tool to provide decision makers with powerful
scientific evidence.
The objective of the thesis is to identify the data and information processing
technologies and mechanisms which will enable the further development of decision
support systems that can be used to evaluate the indices for smart grid technology
investment in the future.
First of all, the thesis introduces the smart grid and its features and technologies in order
to clarify the benefits can be obtained from smart grid deployment in many aspects such
as economics, environment, reliability, efficiency, security and safety.
Besides, it is necessary to understand power system business and operation scenarios
which may affect the communication network model. This thesis, for the first time, will
give detailed requirements for smart grid simulation according to the power system
business and operation.
In addition, state of art monitoring system and communication system involved in smart
grid for better demand side management will be reviewed in order to find out their
impacts reflecting to the power systems. The methods and algorithms applied to the
smart grid monitoring, communication technologies for smart grid are summarized and
the monitoring systems are compared with each other to see the merits and drawbacks
in each type of the monitoring system.
Page 5
Smart Grid Technologies and Implementations
III
In smart grid environment, large number of data are need to be processed and useful
information are required to be abstracted for further operation in power systems.
Machine learning is a useful tool for data mining and prediction. One of the typical
machine learning artificial algorithms, artificial neural network (ANN) for load
forecasting in large power system is proposed in this thesis and different learning
methods of back-propagation, Quasi-Newton and Levenberg-Marquardt, are compared
with each other to seek the best result in load forecasting.
Bad load forecasting may leads to demand and generation mismatch, which could cause
blackout in power systems. Load shedding schemes are powerful defender for power
system from collapsing and keep the grid in integral to a maximum extent. A lesson
learned from India blackout in July 2012 is analyzed and recommendations on
preventing grid from blackout are given in this work. Also, a new load shedding
schemes for an isolated system is proposed in this thesis to take full advantage from
information sharing and communication network deployment in smart grid.
Lastly, the new trend of decision support system (DSS) for smart grid implementation
is summarized and reliability index and stability scenarios for cost benefit analysis are
under DSS consideration. Many countries and organizations are setting renewable
penetration goals when planning the contribution to reduce the greenhouse gas emission
in the future 10 or 20 years. For instance, UK government is expecting to produce 27%
of renewable energies EU-wide before 2030. Some simulations have been carried out
to demonstrate the physical insight of a power system operation with renewable energy
integration and to study the non-dispatchable energy source penetration level.
Meanwhile, issues from power system reliability which may affect consumers are
required to take into account. Reliability index of Centralized wind generations and that
of distributed wind generations are compared with each other under an investment
perspective.
Page 6
Smart Grid Technologies and Implementations
IV
Table of Content
Acknowledgements ...................................................................................................... I
Abstract ........................................................................................................................ II
Table of Content ......................................................................................................... IV
List of Figures .......................................................................................................... VIII
List of Tables .............................................................................................................. XI
Glossary of Terms ................................................................................................... XIII
Copyright Declaration ............................................................................................ XVI
Chapter 1 Introduction ............................................................................................. 1
1.1 Background and Objectives ............................................................................. 1
1.2 Organization of Thesis ..................................................................................... 3
1.3 Original Contribution ....................................................................................... 4
Chapter 2 Smart Grid Overview ............................................................................. 7
2.1 Introduction ...................................................................................................... 7
2.2 The Smart Grid Definitions ............................................................................. 7
2.3 Differences between Traditional Grid and Smart Grid .................................. 10
2.4 Smart Grid Features and Technologies .......................................................... 11
2.4.1 Advanced Metering Infrastructure (AMI) .............................................. 13
2.4.2 Customer Side Systems (CSS) ................................................................ 14
2.4.3 Electric Vehicle Charging and Discharging ........................................... 15
2.4.4 Transmission Enhancement Applications ............................................... 15
2.4.5 Distribution Grid Management System .................................................. 16
2.4.6 Integration with Renewable Energy and Distributed Energy Resources 16
2.4.7 Information and Communication Technology Integration (ICT) ........... 17
2.4.8 Wide-area Monitoring, Measurement and Control ................................. 17
2.5 Benefits of Smart Grid ................................................................................... 20
2.6 Motivations and Challenges towards Smart Grid .......................................... 24
2.6.1 Motivations ............................................................................................. 24
2.6.2 Challenges ............................................................................................... 25
2.7 Smart Grid Standards ..................................................................................... 26
2.8 Smart Grid Simulation ................................................................................... 28
Page 7
Smart Grid Technologies and Implementations
V
2.8.1 Additional Simulation Requirement of Smart Grid ................................ 32
2.9 Conclusion ..................................................................................................... 33
Chapter 3 Smart Grid Monitoring with Communication Technologies ............ 35
3.1 Introduction .................................................................................................... 35
3.2 Intelligent System Monitoring ....................................................................... 36
3.3 Power System and Smart Grid Monitoring .................................................... 38
3.4 Smart Grid Communication Business and Operation .................................... 45
3.4.1 Advanced Distribution Automation ........................................................ 46
3.4.2 Feeder Automation.................................................................................. 47
3.4.3 Wide-Area Monitoring and Control........................................................ 47
3.4.4 Substation Automation Systems ............................................................. 48
3.4.5 Self-Healing Technology ........................................................................ 48
3.4.6 Distributed Generation, Electricity Storage, Renewable Energy and
Micro-Grid Operation .......................................................................................... 49
3.5 Co-Simulation and Power-Communication Integration ................................ 49
3.6 Conclusion ..................................................................................................... 52
Chapter 4 Smart Grid Load Forecasting by Artificial Neural Network ........... 53
4.1 Introduction .................................................................................................... 53
4.2 Introduction to Artificial Neural Network (ANN) ......................................... 55
4.3 Perceptron ...................................................................................................... 56
4.3.1 Perceptron Model .................................................................................... 56
4.3.2 Activation Functions ............................................................................... 57
4.3.3 Multi-Layer Perceptron (MLP) ............................................................... 60
4.4 Back-Propagation Training ............................................................................ 61
4.4.1 Gradient Descent and delta learning rule ................................................ 62
4.4.2 Back-Propagation Theory ....................................................................... 62
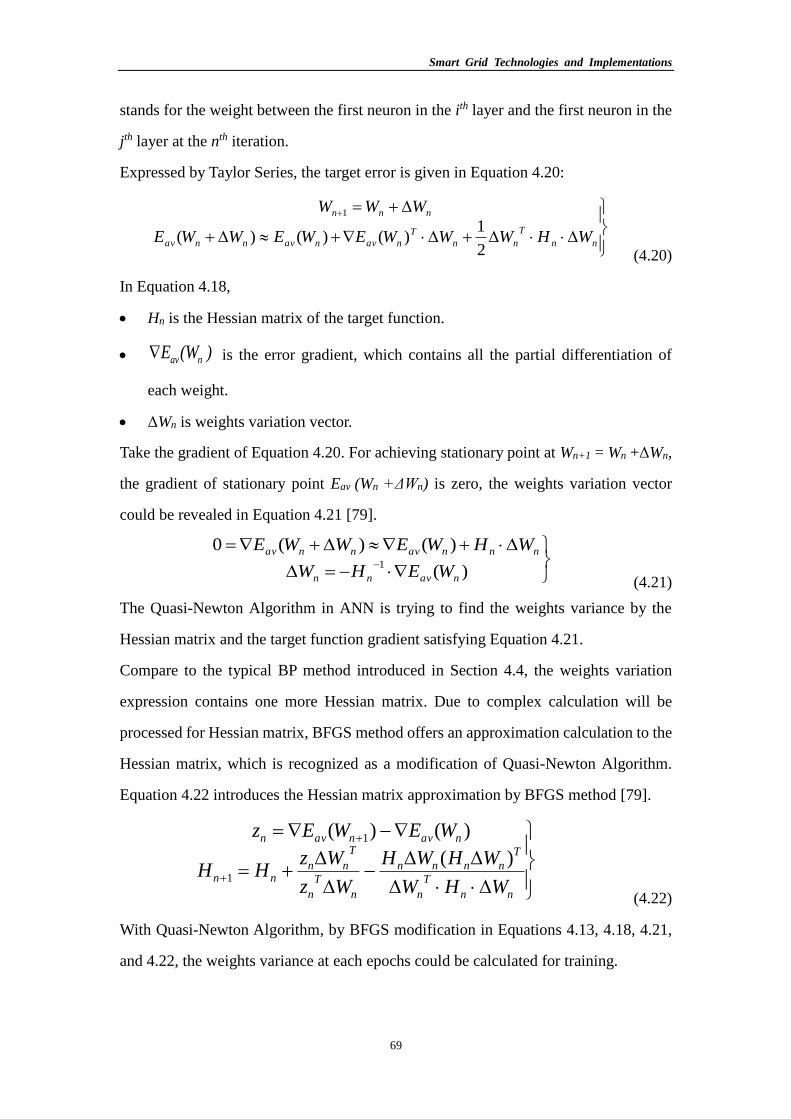
4.4.3 Quasi-Newton Algorithm........................................................................ 68
4.4.4 Levenberg-Marquardt (LM) Algorithm .................................................. 70
4.4.5 Load Forecasting implemented by Back-Propagation Training ............. 71
4.4.6 Indices for Performance Measurement and Comparison ........................ 73
4.5 Load Forecasting by ANN ............................................................................. 73
4.5.1 ANN Trained by Delta-Rule ................................................................... 74
4.5.2 ANN Trained by Quasi-Newton ............................................................. 76
4.5.3 ANN Trained by Levenberg-Marquardt ................................................. 78
Page 8
Smart Grid Technologies and Implementations
VI
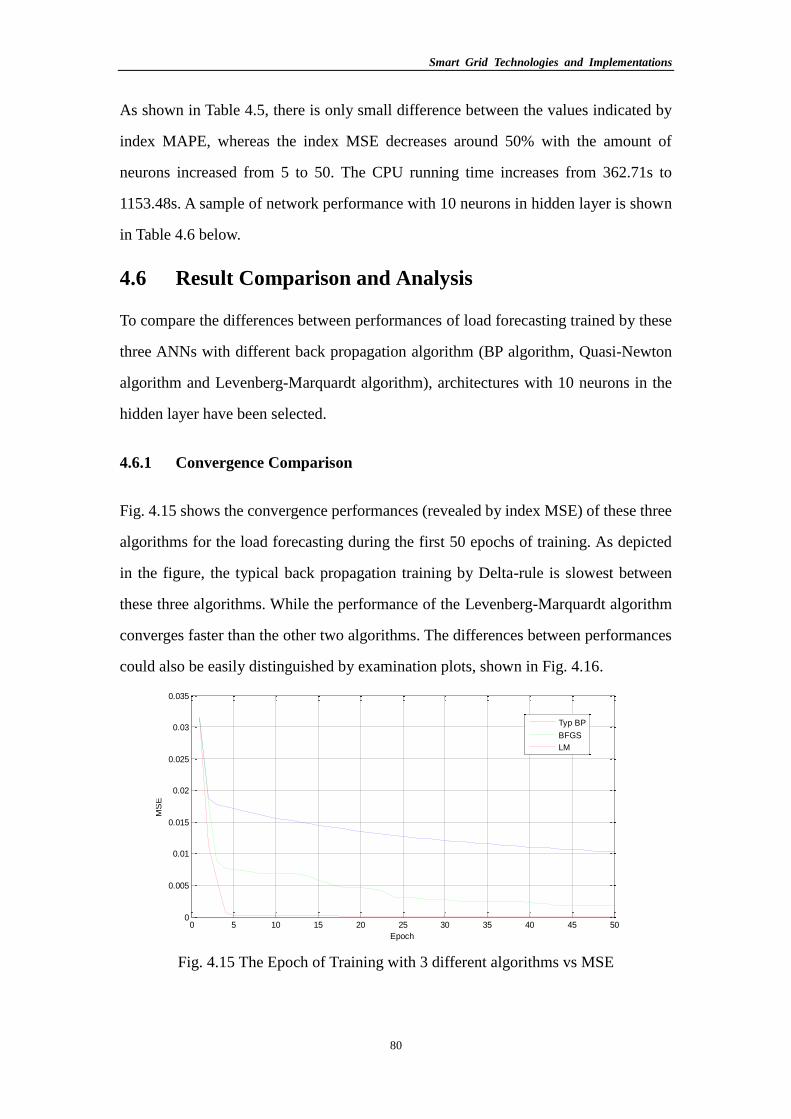
4.6 Result Comparison and Analysis ................................................................... 80
4.6.1 Convergence Comparison ....................................................................... 80
4.7 Conclusion ..................................................................................................... 82
Chapter 5 Self-Healing and Load Shedding in Smart Grid ................................ 83
5.1 Introduction .................................................................................................... 83
5.2 Blackout in India ............................................................................................ 84
5.2.1 Load changes in Northern Region .......................................................... 88
5.3 Load Shedding Scheme.................................................................................. 92
5.3.1 Power System Behaviour under Disturbances ........................................ 94
5.3.2 Magnitude of Load Shedding.................................................................. 95
5.3.3 Load Disconnection ................................................................................ 97
5.3.4 LLS Relay Operating Delay Impact ....................................................... 97
5.3.5 Case Study .............................................................................................. 97
5.4 Conclusion ................................................................................................... 101
Chapter 6 Decision Support Systems for Smart Grid Implementation ........... 103
6.1 Introduction .................................................................................................. 103
6.2 Decision Support System Requirements ...................................................... 104
6.2.1 DSS Functionalities .............................................................................. 104
6.2.2 Requirements for DSS .......................................................................... 106
6.3 Past, Present and Future ............................................................................... 107
6.3.1 Past ........................................................................................................ 107
6.3.2 Present ................................................................................................... 110
6.3.3 Future .................................................................................................... 113
6.4 Power System Stability Scenarios ............................................................... 115
6.4.1 Renewable and Solar Penetration Investigation ................................... 115
6.4.2 Wind Energy Conversion ...................................................................... 116
6.4.3 Solar Energy Conversion ...................................................................... 118
6.4.4 DIgSILENT Models for Stability Analysis .......................................... 119
6.5 Reliability Indices ........................................................................................ 125
6.5.1 Generation Investment .......................................................................... 126
6.5.2 Reliability Indices ................................................................................. 128
6.6 Conclusion ................................................................................................... 135
Chapter 7 Conclusions and Future Work ........................................................... 138
7.1 Overall Conclusion ...................................................................................... 138
Page 9
Smart Grid Technologies and Implementations
VII
7.2 Trends and Further Work ............................................................................. 140
List of Publications .................................................................................................. 143
REFERENCES ......................................................................................................... 145
Appendix I Biological Neural Networks ................................................................ 168
Appendix II Network Data for IEEE 33-bus Test System in Chapter 5 ............ 169
Page 10
Smart Grid Technologies and Implementations
VIII
List of Figures
Fig. 2.1 Applications involved in smart grid ................................................................. 8
Fig. 2.2 Future network vision ..................................................................................... 10
Fig. 2.3 NIST smart grid framework composed by secure communication and
electrical flows throughout 7 smart grid domains........................................................ 12
Fig. 2.4 Smart grid technologies deployment in power system ................................... 13
Fig. 2.5 AMI Technology and Interface ...................................................................... 14
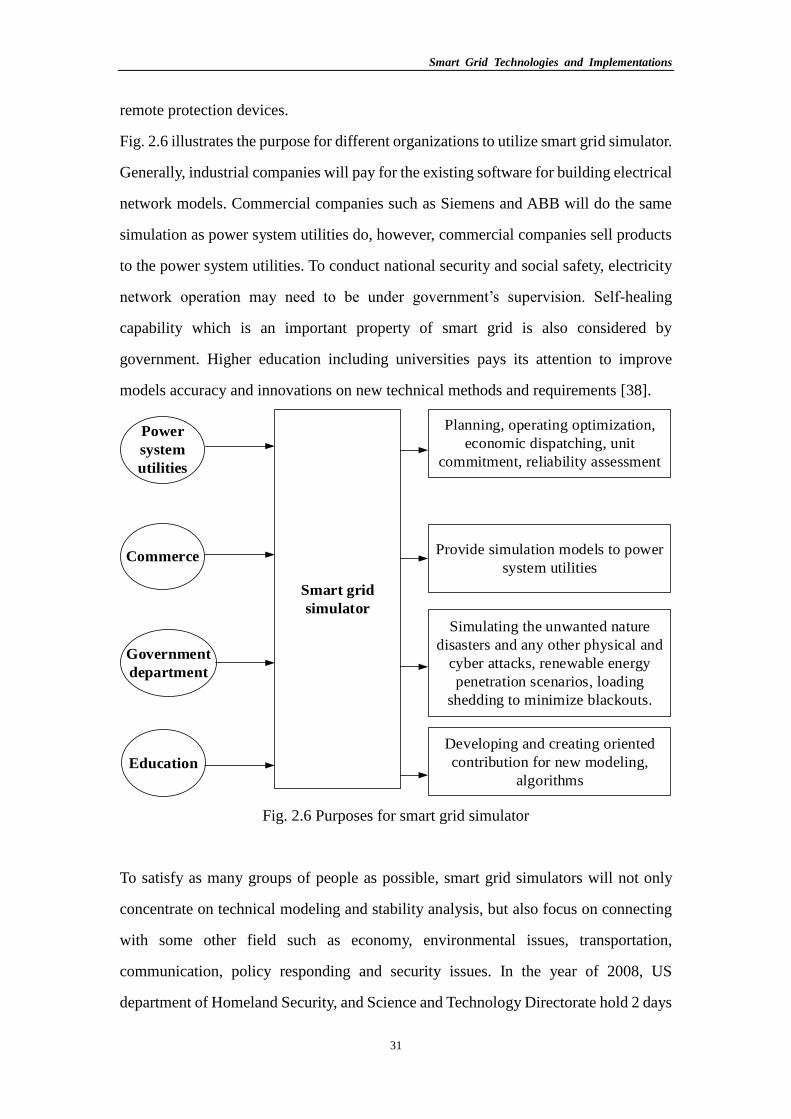
Fig. 2.6 Purposes for smart grid simulator ................................................................... 31
Fig. 3.1 Structure of the integrated approach to condition monitoring and plant
lifetime modeling ......................................................................................................... 38
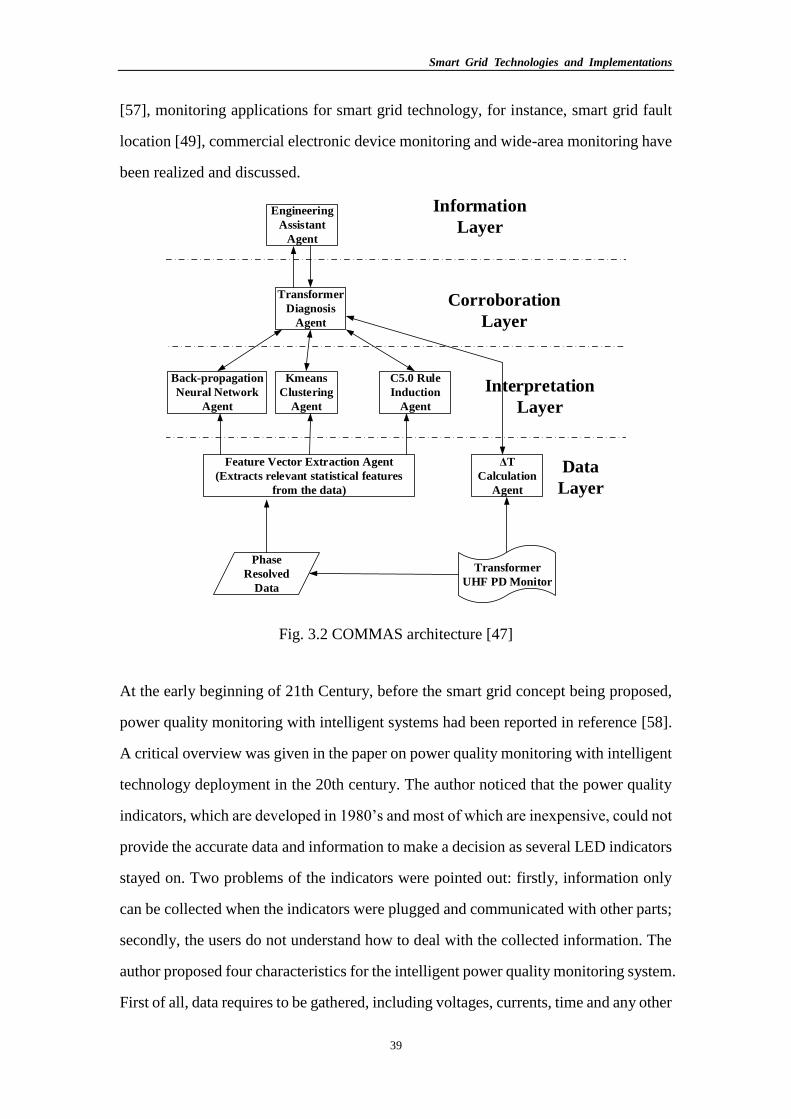
Fig. 3.2 COMMAS architecture................................................................................... 39
Fig. 3.3 Anomaly detection agent architecture ............................................................ 40
Fig. 3.4 Building blocks of the FNET system ............................................................. 42
Fig. 3.5 FNET application hierarchy and data flow paths ........................................... 42
Fig. 3.6 Heuristic flow diagram ................................................................................... 44
Fig. 4.1 Load forecasting on December 10, 2013 for Canadian Ontario Demand by
IESO ............................................................................................................................. 54
Fig. 4.2 Neuron working procedure ............................................................................. 56
Fig. 4.3 Perceptron neuron model ................................................................................ 57
Fig. 4.4 Identity linear function for activation function............................................... 58
Fig. 4.5 Binary Step function for activation function .................................................. 59
Fig. 4.6 Binary Sigmoid function for activation function ............................................ 59
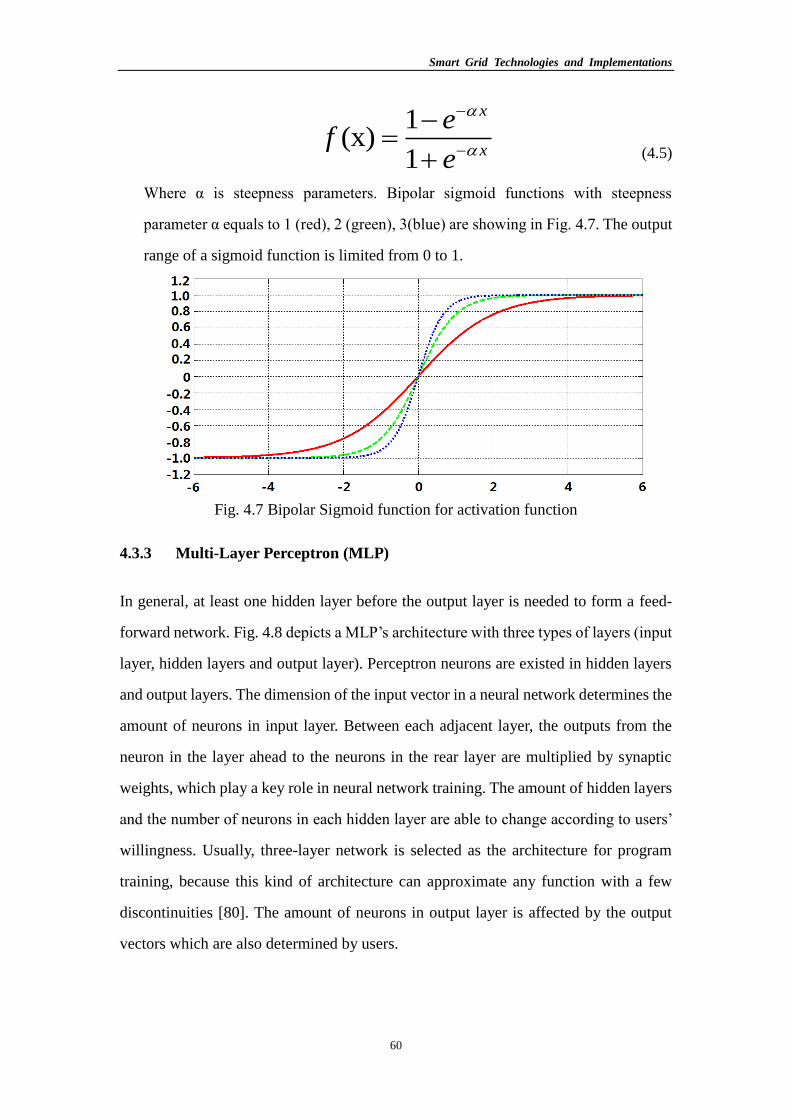
Fig. 4.7 Bipolar Sigmoid function for activation function........................................... 60
Fig. 4.8 Architecture of Multi-layer perceptron feed-forward network ....................... 61
Fig. 4.9 Feed-forward and back-propagation ............................................................... 63
Fig. 4.10 Three-layer Network..................................................................................... 63
Fig. 4.11 Procedure of Batch Training......................................................................... 68
Fig. 4.12 Architecture for load forecasting .................................................................. 71
Fig. 4.13 Population density of Ontario, Canada in 2006 ............................................ 72
Fig. 4.14 Measurement indices with different neuron number .................................... 75
Page 11
Smart Grid Technologies and Implementations
IX
Fig. 4.15 The Epoch of Training with 3 different algorithms vs MSE ........................ 80
Fig. 4.16 Examination plots of actual demand and prediction .................................... 81
Fig. 5.1 Brief Indian NEW Grid for disturbance study................................................ 86
Fig. 5.2 Frequency response in Western Region when load increasing in Northern
Region .......................................................................................................................... 89
Fig. 5.3 Rotor angle of thermal generator in North with reference to western region
when load increasing in Northern Region ................................................................... 89
Fig. 5.4 Frequency response in Northern Region when load increasing in Northern
Region .......................................................................................................................... 90
Fig. 5.5 Northern Region grid frequency response when thermal generation is
changing from 0% to 25% ........................................................................................... 91
Fig. 5.6 Rotor angle of the thermal generation in northern region when thermal
generation is changing from 0% to 25% ...................................................................... 92
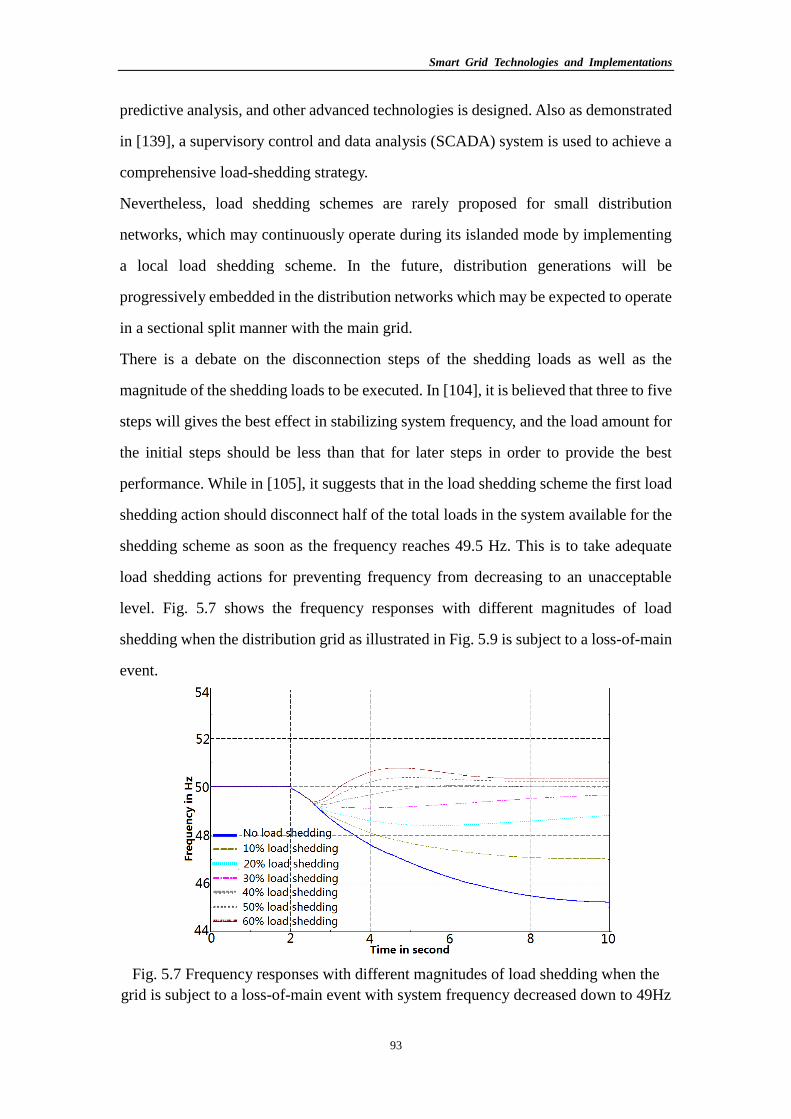
Fig. 5.7 Frequency responses with different magnitudes of load shedding when the
grid is subject to a loss-of-main event with system frequency decreased down to 49Hz
...................................................................................................................................... 93
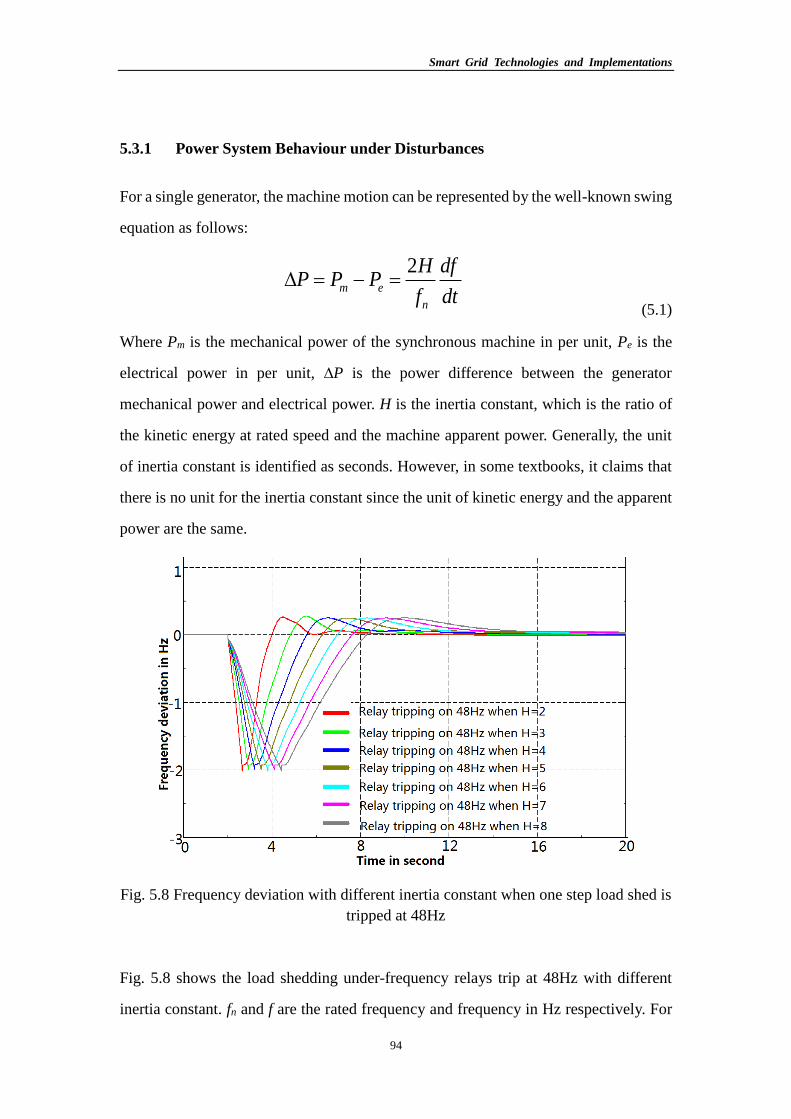
Fig. 5.8 Frequency deviation with different inertia constant when one step load shed is
tripped at 48Hz ............................................................................................................. 94
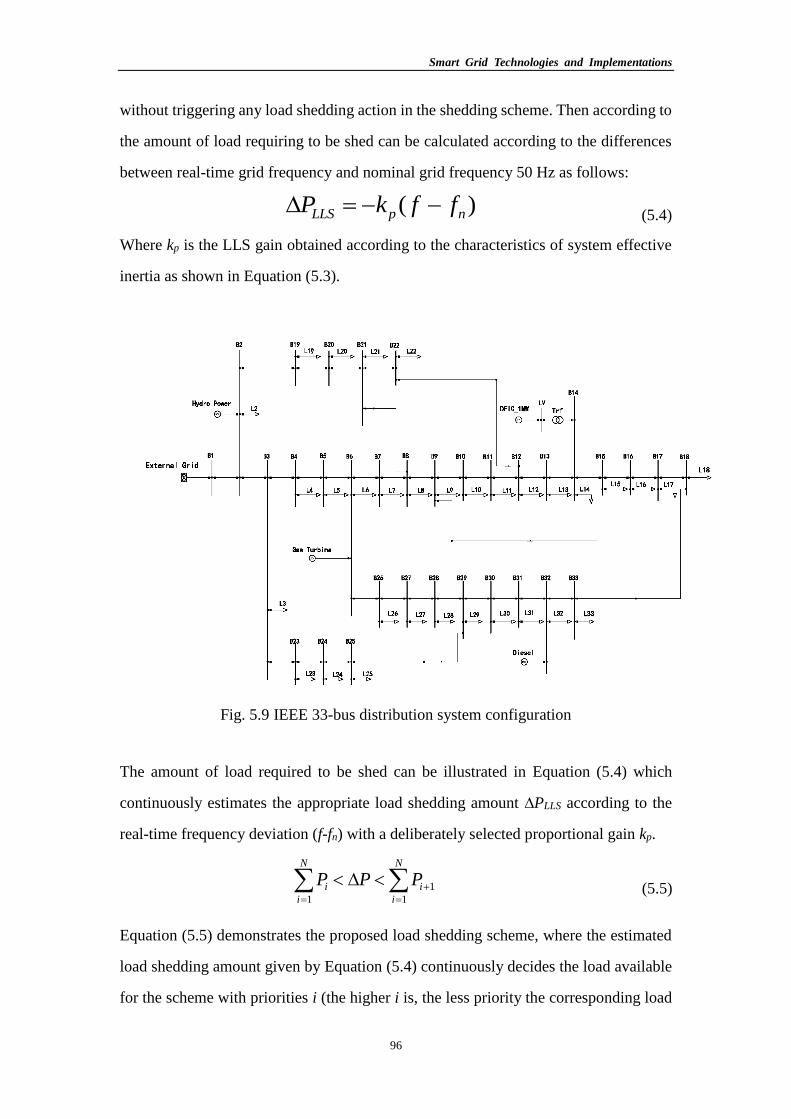
Fig. 5.9 IEEE 33-bus distribution system configuration.............................................. 96
Fig. 5.10 One step load shedding for 40% when relays set to 48Hz, 48.5Hz, 49Hz and
49.3Hz .......................................................................................................................... 99
Fig. 5.11 Frequency deviation with different time delay when one step load shed is
tripped at 49 Hz ............................................................................................................ 99
Fig. 5.12 Frequency derivation under 4 sequences .................................................... 101
Fig. 6.1 A typical structure of DSS ............................................................................ 106
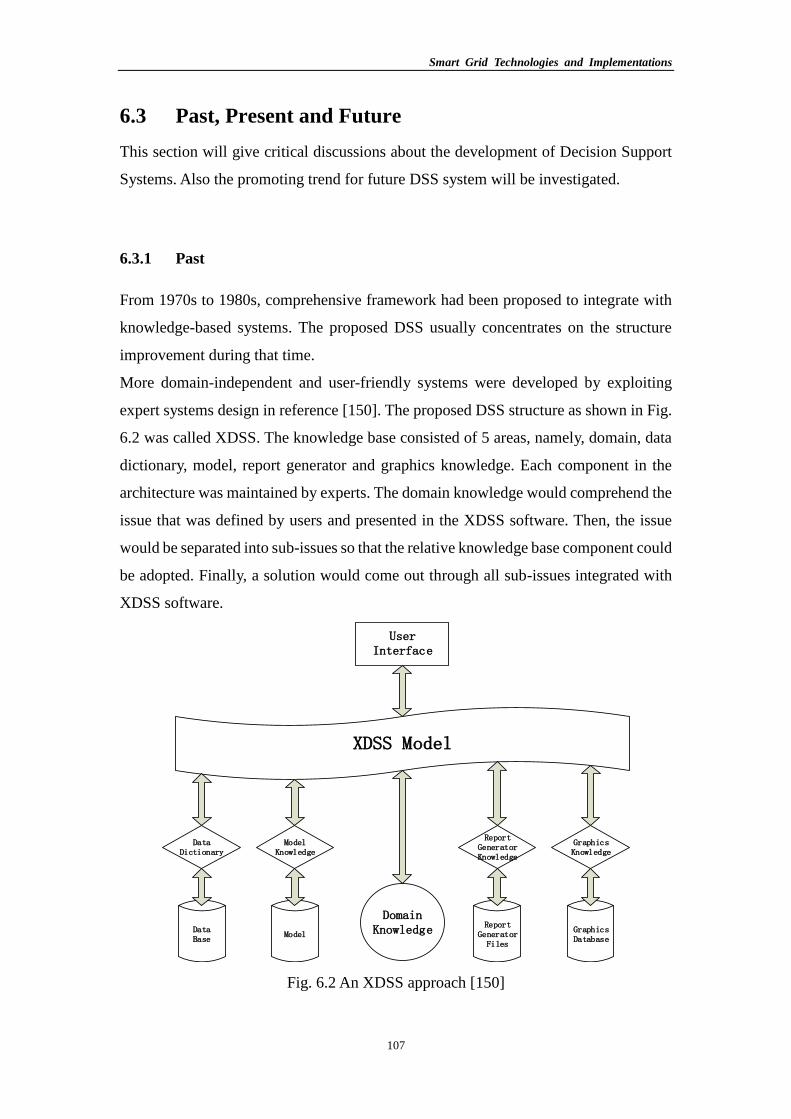
Fig. 6.2 An XDSS approach ...................................................................................... 107
Fig. 6.3 4 Generations for DSS development ............................................................ 108
Fig. 6.4 DSS with 2-layer information management system ..................................... 110
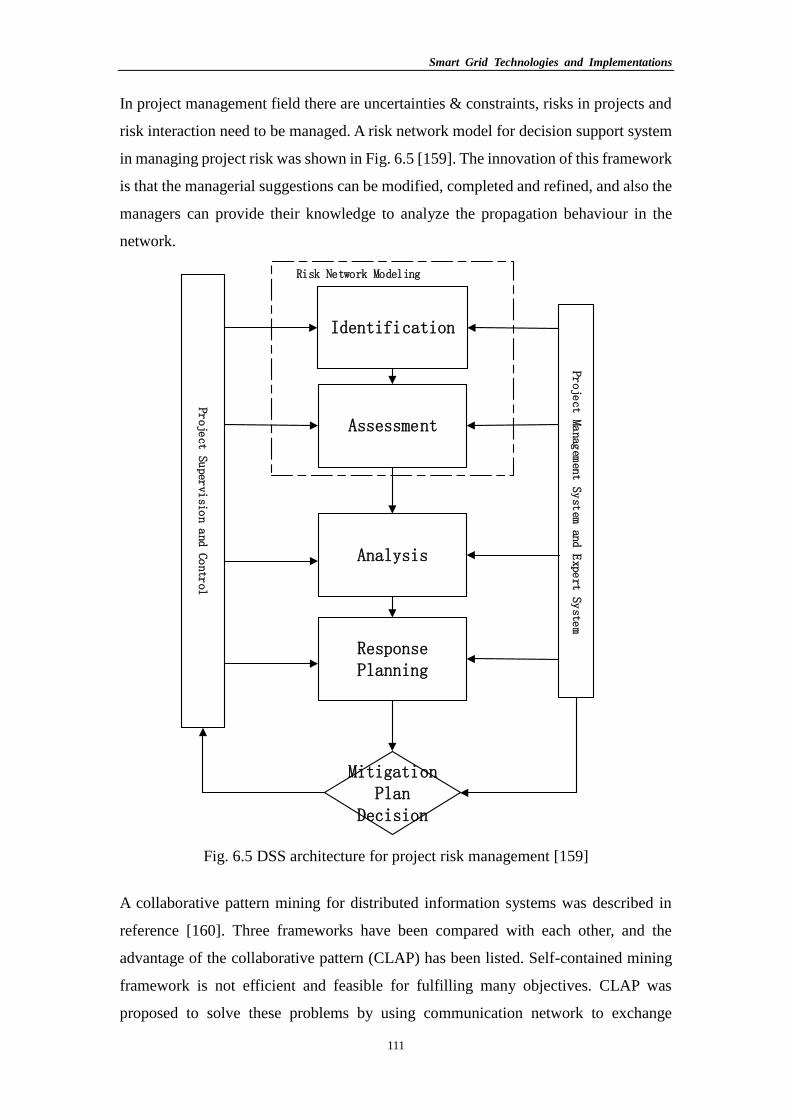
Fig. 6.5 DSS architecture for project risk management ............................................. 111
Fig. 6.6 Business and engineering decision model with dashboard .......................... 112
Fig. 6.7 DSS structure with cloud-computing technology ......................................... 113
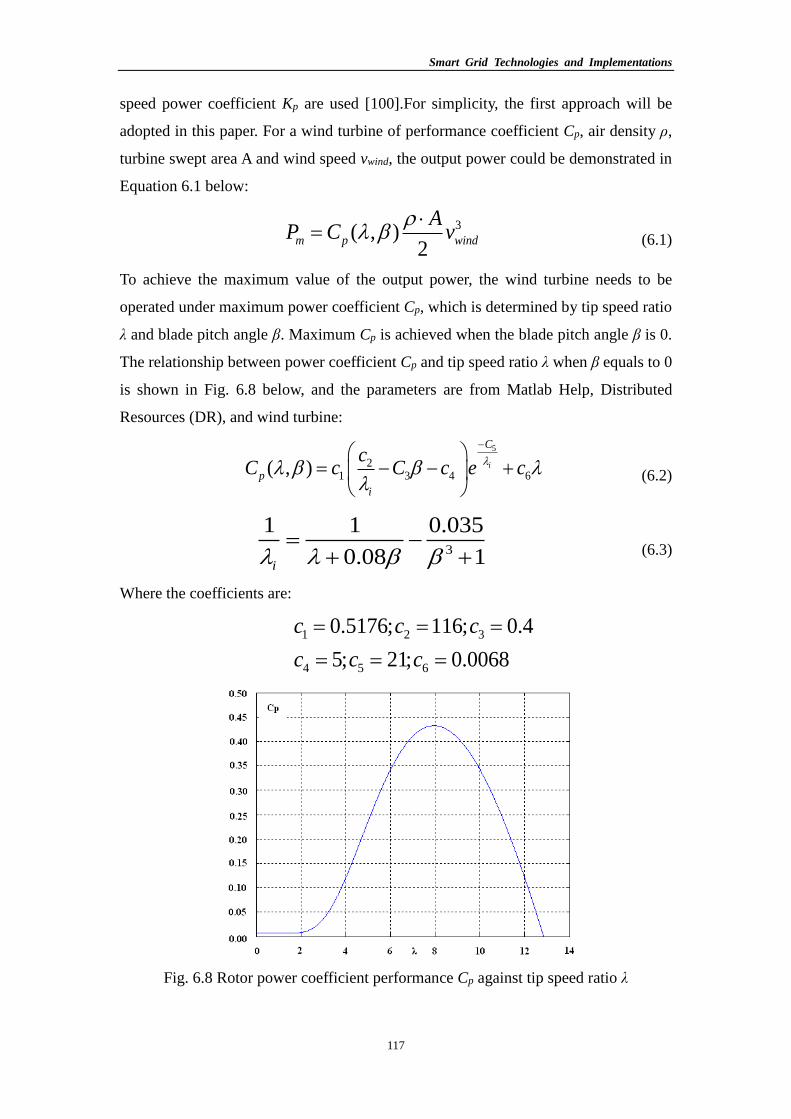
Fig. 6.8 Rotor power coefficient performance Cp against tip speed ratio λ ............... 117
Fig. 6.9 Wind speed VS output power curve ............................................................. 118
Fig. 6.10 Solar radiation for day-time with cloud impact .......................................... 119
Page 12
Smart Grid Technologies and Implementations
X
Fig. 6.11 Photo conversion efficiency VS solar radiation ......................................... 119
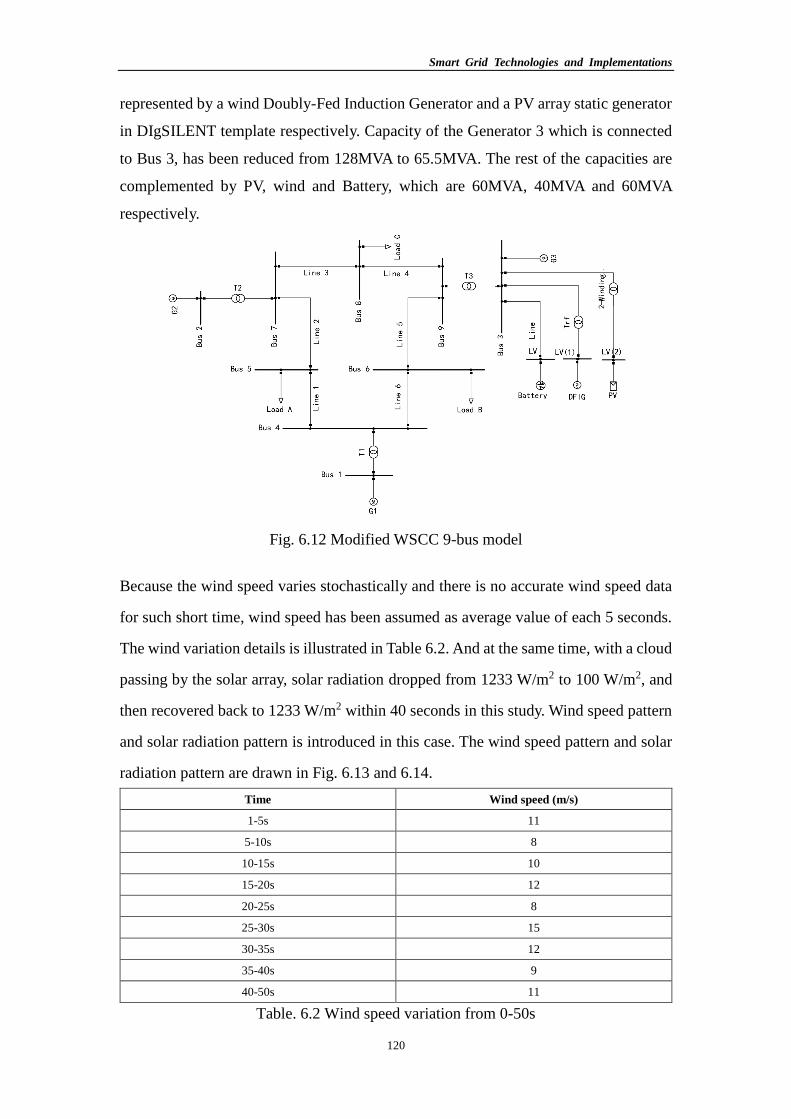
Fig. 6.12 Modified WSCC 9-bus model .................................................................... 120
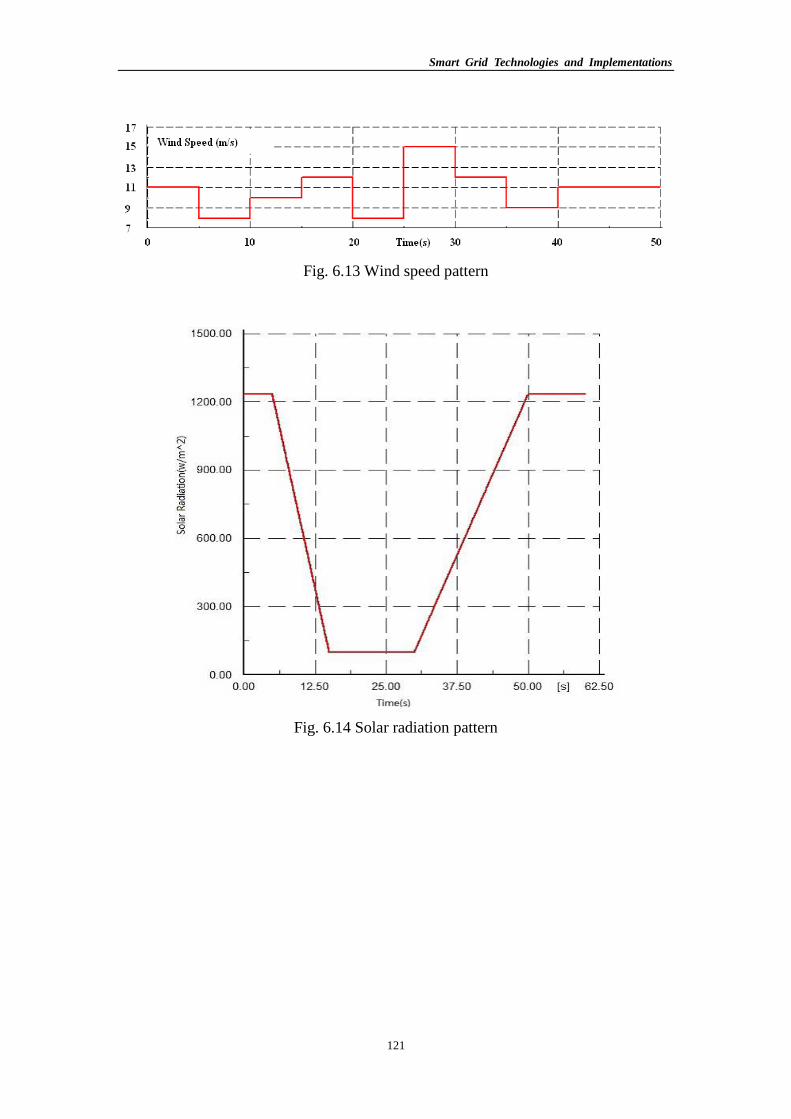
Fig. 6.13 Wind speed pattern ..................................................................................... 121
Fig. 6.14 Solar radiation pattern ................................................................................ 121
Fig. 6.15 Total active power and battery storage variation in Bus 3 when solar
radiation is changing .................................................................................................. 122
Fig. 6.16 Total active power and battery storage variation in Bus 3 when wind speed
is changing ................................................................................................................. 122
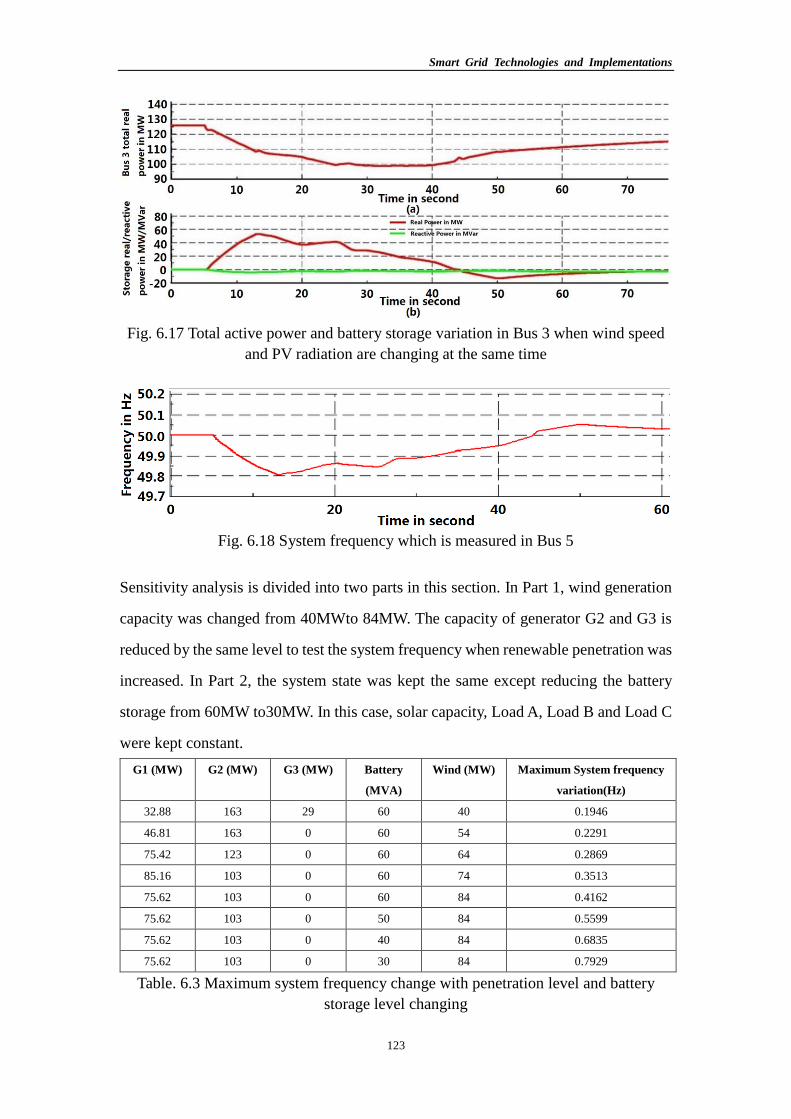
Fig. 6.17 Total active power and battery storage variation in Bus 3 when wind speed
and PV radiation are changing at the same time ........................................................ 123
Fig. 6.18 System frequency which is measured in Bus 5 .......................................... 123
Fig. 6.19 Relationship between reliability and cost ................................................... 126
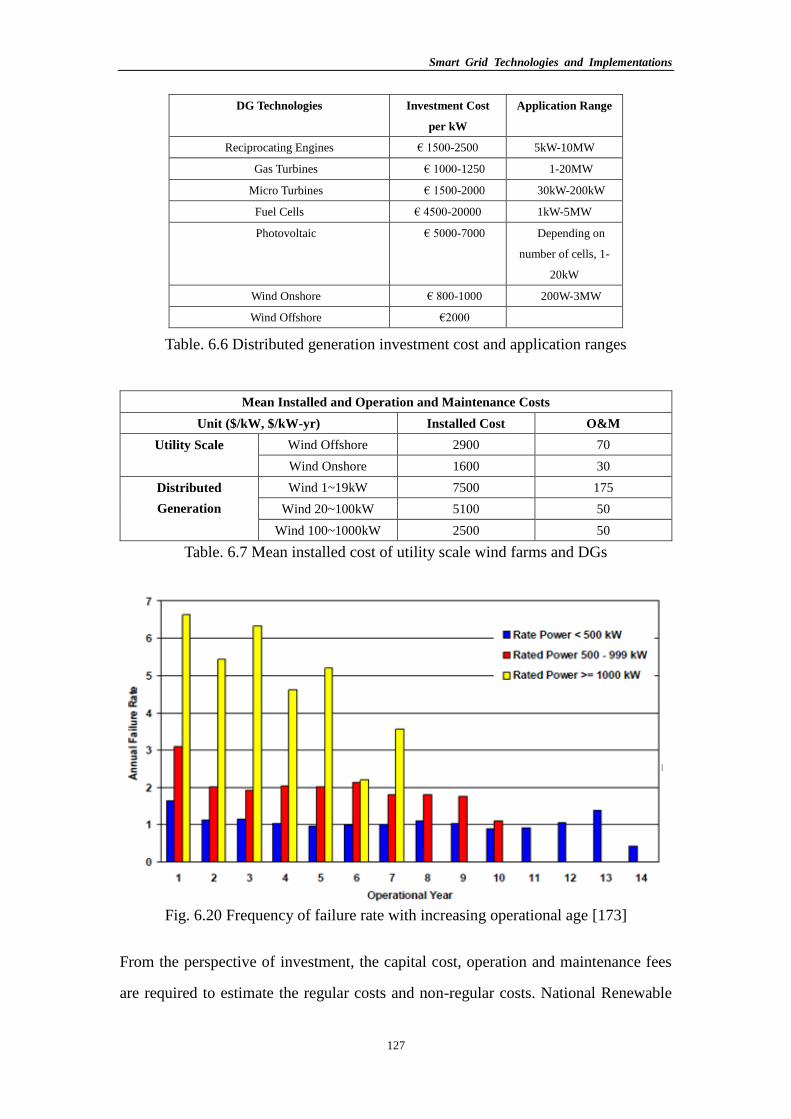
Fig. 6.20 Frequency of failure rate with increasing operational age ......................... 127
Fig. 6.21 New England 39-bus 10-gnerator systems ................................................. 132
Fig. 6.22 Distribution system for DG planning ......................................................... 133
Page 13
Smart Grid Technologies and Implementations
XI
List of Tables
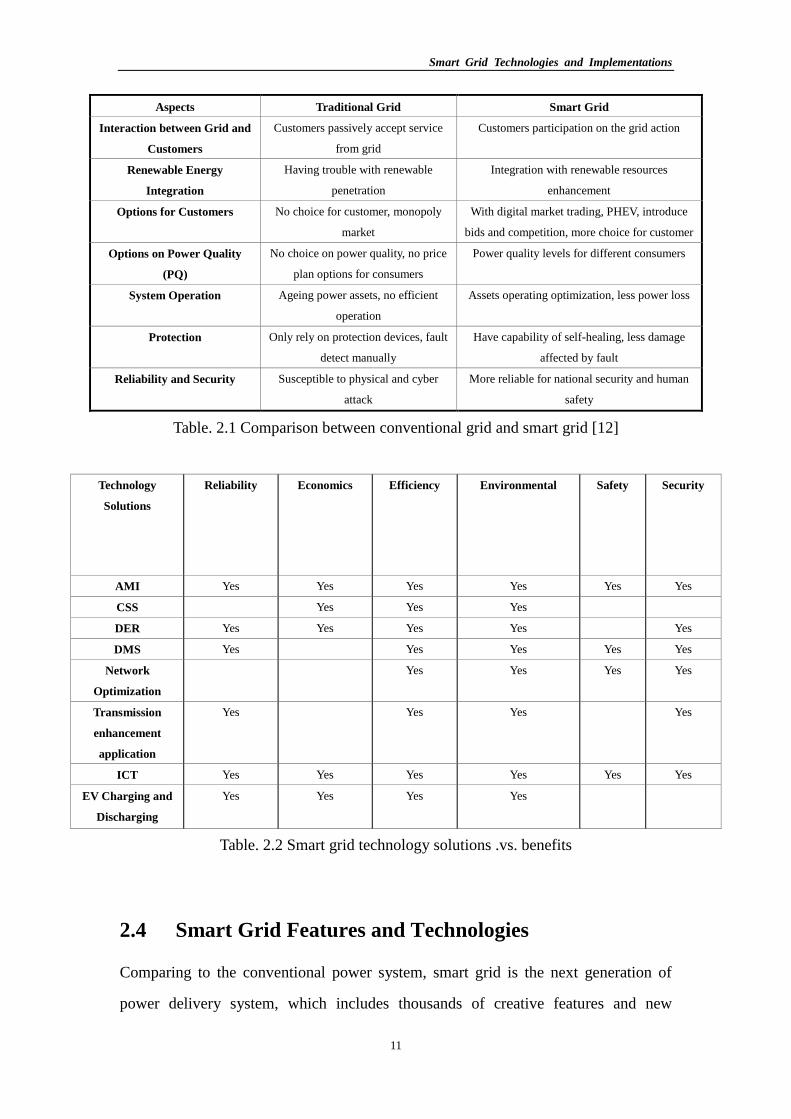
Table. 2.1 Comparison between conventional grid and smart grid ............................. 11
Table. 2.2 Smart grid technology solutions .vs. benefits ............................................. 11
Table. 2.3 Hardware and software employed into smart grid ...................................... 19
Table. 2.4 Smart grid benefits delivered to delivery company and electricity supplier
...................................................................................................................................... 22
Table. 2.5 Smart grid benefits delivered to residential consumer and broader societal
...................................................................................................................................... 23
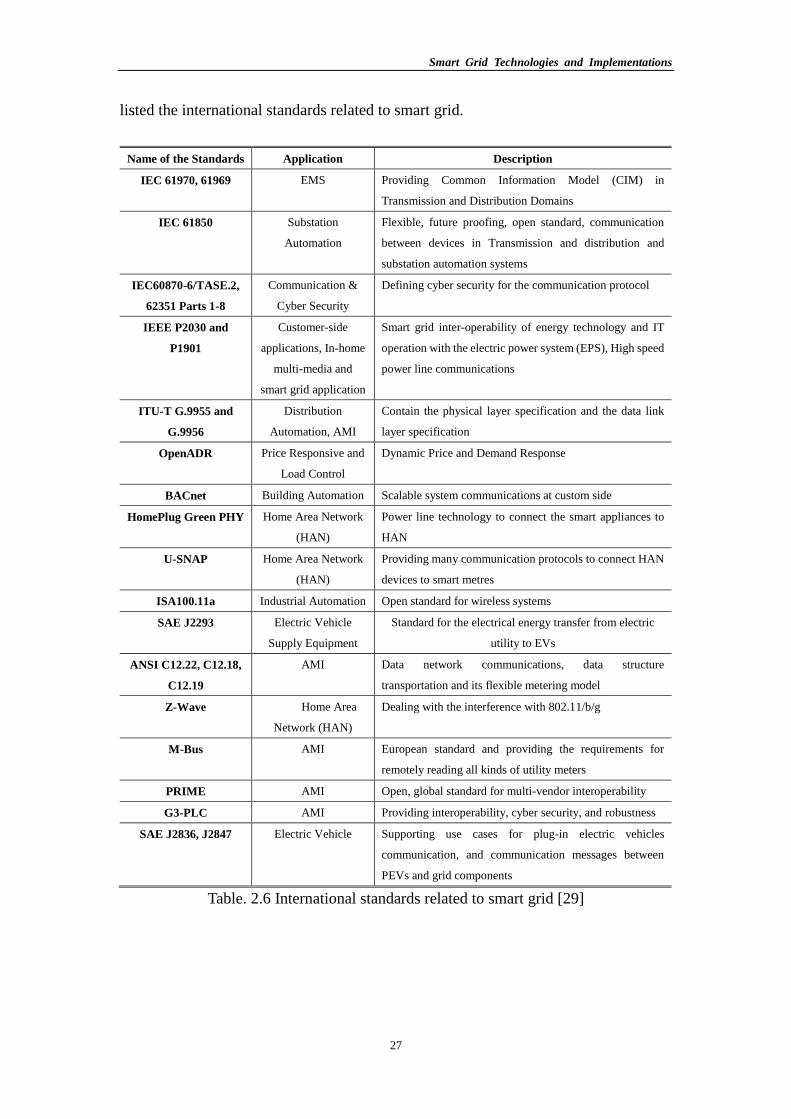
Table. 2.6 International standards related to smart grid............................................... 27
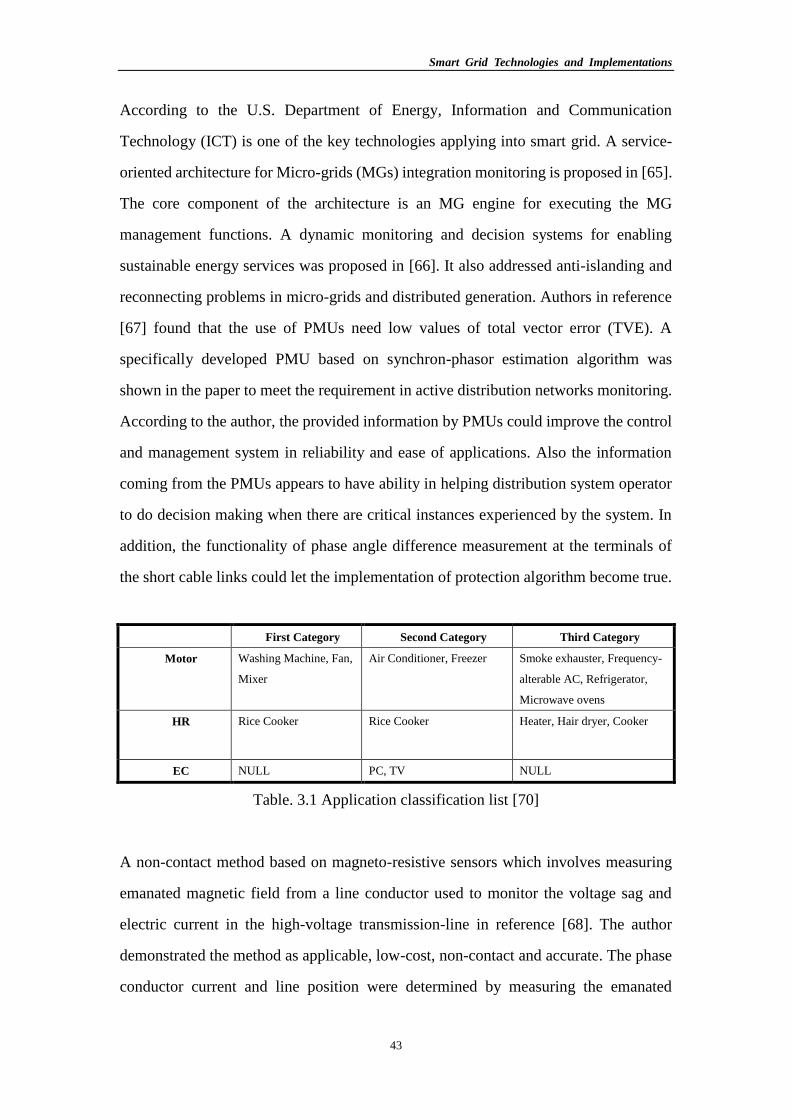
Table. 3.1 Application classification list...................................................................... 43
Table. 3.2 Methods and algorithms applying into the smart grid monitoring ............. 46
Table. 3.3 Smart Grid Standard and Co-simulation ..................................................... 50
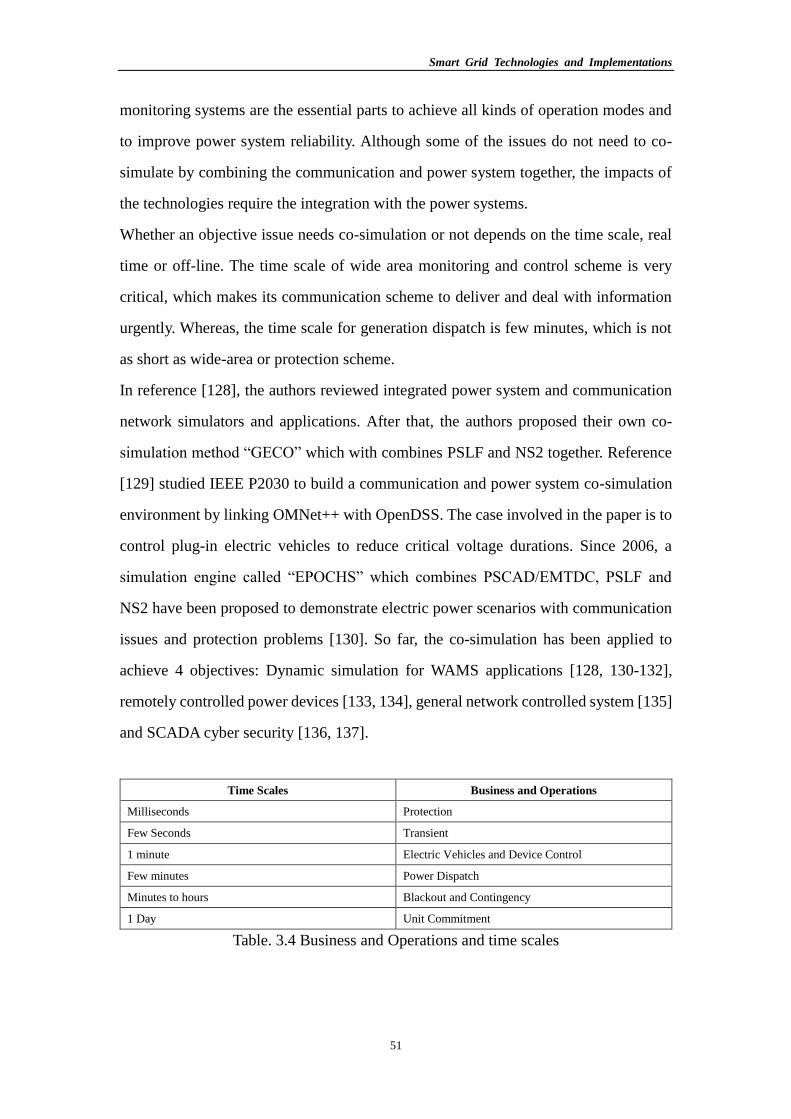
Table. 3.4 Business and Operations and time scales ................................................... 51
Table. 4.1 ANN Training performances with different architectures .......................... 75
Table. 4.2 Load forecasting by an ANN, Delta-rule training with 20 neurons in hidden
layer.............................................................................................................................. 76
Table. 4.3 ANN architecture selection for load forecast with Quasi-Newton (BFGS)
Method ......................................................................................................................... 77
Table. 4.4 Load forecasting by an ANN, Quasi-Newton training with 20 neurons in
hidden layer .................................................................................................................. 78
Table. 4.5 ANN architecture selection for load forecast with LM Method ................. 79
Table. 4.6 Load forecasting by an ANN, Levenberg-Marquardt training with 20
neurons in hidden layer ................................................................................................ 79
Table. 5.1 Generation and Demand Conditions with Power Import and Export before
Disturbances ................................................................................................................. 87
Table. 5.2 Generation Power Allocation in Each Region ............................................ 88
Table. 5.3 4 scenarios for the load selection .............................................................. 100
Table. 6.1 DSS approaches and architectures from the past to the future ................. 114
Table. 6.2 Wind speed variation from 0-50s.............................................................. 120
Page 14
Smart Grid Technologies and Implementations
XII
Table. 6.3 Maximum system frequency change with penetration level and battery
storage level changing................................................................................................ 123
Table. 6.4 Maximum frequency error with wind speed pattern dropping when wind
penetration is 40 MW................................................................................................. 124
Table. 6.5 Maximum frequency error with wind speed pattern dropping when wind
penetration is 84MW.................................................................................................. 124
Table. 6.6 Distributed generation investment cost and application ranges................ 127
Table. 6.7 Mean installed cost of utility scale wind farms and DGs ......................... 127
Table. 6.8 system component reliability parameter ................................................... 131
Table. 6.9 Results of reliability index in each bus when deploying DG ................... 134
Table. 6.10 Reliability result for different number of wind generation connected to the
grid ............................................................................................................................. 135
Table. 6.11 Reliability result for large-scale& DG wind generation ......................... 135
Page 15
Smart Grid Technologies and Implementations
XIII
Glossary of Terms
ACL Agent Communication Language
AI Artificial Intelligence
AIS Artificial Immunity System
AMI Advanced Metering Infrastructure
ANN Artificial Neural Network
APE Absolute Percentage Error
BAU Business as Usual
BP Back-propagation Algorithm
CA Computational Algorithm
CIS Customer Information System
CLAP Collaborative Pattern
CSS Customer Side Systems
CV Computer Vision
DER Distributed Energy Resources
DFIG Double-Fed-Induction-Generator
DFR Digital Fault Recorders
DLR Dynamic Line Rating
DMS Distribution grid Management System
DOE Department of Energy, United States
DPR Digital Protective Relays
DSS Decision Support System
DTR Dynamic Thermal Rating
EDB Extensional Database
EMD Empirical Mode Decomposition
EMI Electromagnetic Interference
ERP Enterprise Resource Planning
EV Electric Vehicle
EWEA European Wind Energy Association
FACTS Flexible Alternating Current Transmission Systems\
Page 16
Smart Grid Technologies and Implementations
XIV
FDR Frequency Disturbance Recorders
FNET Frequency monitoring network
G2V Grid to Vehicles
GIS Geographic Information System
GPS Global Positioning System
HAN Home Area Network
HSML Hybrid System Modeling Language
HTS High-Temperature Superconductors
HVDC High Voltage DC Systems
IaaS Infrastructure as a Service
ICT Information and Communication Technology
IDB Intentional Database
IEA International Energy Agency, United States
IED Intelligent Electronic Device
IEEE Institute of Electrical and Electronics Engineers, United States
KBS Knowledge Based System
LED Light-Emitting Diode
LLS Local Load Shedding Scheme
LM Levenberg-Marquardt Algorithm
LTE Long-Term Evolution (Communication)
MAPE Mean Absolute Percentage Error
MCU Microcontroller Unit
MDMS Meter data management system
MG Micro Grid
MLP Multi-layer Perceptron
NETL National Energy Technology Laboratory, United States
NILM Nonintrusive Load Monitoring
NIST National Institute of Standard and Technology
NREL National Renewable Energy Laboratory, United States
NS-2 Network Simulator 2
OLAP Online Analytical Processing
OMS Outage Management System
ORNL Oak Ridge National Laboratory
PaaS Platform as a Service
Page 17
Smart Grid Technologies and Implementations
XV
PDC Phasor Data Concentrator
PLC Power Line Carrier
PMU Phasor Measurement Units
PQ Power Quality
PV Photovoltaic
RFI Radio-Frequency Interference
RMSE Root Mean Squared Error
RTU Remote Terminal Unit
S2V Storage to Vehicles
SaaS Software as a Service
SCADA Supervisory Control and Data Acquisition
SSL Secure Socket Layer
SVM Support Vector Machine
TKEO Teager-Kaiser energy operator
TTU Telephone Terminal Unit
TVE Total Vector Error
UHF Ultra High Frequency
UPS Uninterruptible Power Supply
V2G Vehicles to Grid
V2S Vehicles to Storage
WAAPCA Wide-Area Adaptive Protection, Control and Automation
WAMS Wide-Area Monitoring Systems
WASA Wide-Area Situational Awareness
WIMAX Worldwide Interoperability for Microwave Access
WMS Workforce Management System
XDSS DSS Based on Expert Systems Approach
NETL National Energy Technology Laboratory, United States
IEA International Energy Agency, United States
IEEE Institute of Electrical and Electronics Engineers, United States
Page 18
Smart Grid Technologies and Implementations
XVI
Copyright Declaration
The author hereby grants power of discretion to the Librarian of the City University
London, to allow this thesis (SMART GRID TECHNOLOGIES AND
IMPLEMENTATIONS) to be copied in whole or in part without further reference to
the author. This permission covers only single copies made for study purposes, subject
to normal conditions of acknowledgement.
Haotian Zhang
London, May 2014
Page 19
Smart Grid Technologies and Implementations
1
Chapter 1
Introduction
1.1 Background and Objectives
With the extremely increasing of the large industry and commerce, energy supply
deficit and air pollution issues are becoming more and more critical. In order to solve
the problems in both developed and developing countries, smart grid with many
advanced architectures, outstanding algorithms and creative frameworks has been
advocated [1].
There are few “definitions” to explain what it is, though the conception of smart grid
has been proposed for several years, many institutes of power system around the world
concentrate on explanations of its functions and technical applications. In addition,
many countries and regions research and develop their specific smart grid in accordance
with their situations like energy resource distribution and consumption, environment
and climate, and commercial, industrial and residential daily life customs. For instance,
in Europe, people devote themselves to develop the renewable energies and distributed
generation systems, while in the US, smart metering and demand response are the main
direction in smart grid implementation. State Grid Corporation of China has proposed
to establish the “strong and robust smart grid”, which makes every effort to build
HVDC and FACTS in order to transmit electric power from the western region, which
is rich in energy, to eastern region in China.
One of the significant differences is that communication networks deployment in many
areas of a smart grid is much more critical than that of traditional grid. Many computer-
based remote monitoring, control and automation devices are beginning to apply to the
electricity delivery systems, to form a bi-communication channel linked through the
Page 20
Smart Grid Technologies and Implementations
2
grid from power plants to any consumers like residential, commercial, industrial and
agricultural. In addition to the information exchange within power systems, all other
systems such as petroleum, natural gas dispatch systems, weather forecasting will also
share the information with power systems. With the increasing penetration level of the
non-dispatchable energy resources like wind and solar and application of demand
response, the effect from weather is playing more and more significant role to power
systems.
Load forecasting mechanism is one of a great application for information exchange
between weather forecasting and power systems. Accurate short-term load forecasting
may contribute to the power economic dispatch and design an appropriate demand
response or load shedding plan to prevent the loads from over-withdrawing energy from
the grid. Long-term load forecasting can offer a consultative reference to further
planning for optimizing energy resource allocation.
It is a step-by-step procedure towards smart grid to replace the old power system
elements or build facilities based on existing grid instead of build up a brand new grid.
Thus, planning for smart grid may not only consider the effect that comes from the
creative technologies, but also respecting for diverse stakeholders’ interests. Cost
benefit analysis has to be carried out to make a correct or reasonable decision. One of
the most effective tool for estimating the smart grid technologies and implementations
is to build the Decision Support System, which is an information system based on
interactive computers to support decision making in planning, management, operations
for smart grid.
Objectives: This thesis aims to identify the data, specify and develop the information
processing technologies and mechanisms which will further contribute to the
development of decision support systems for the smart grid. These will contribute to
the evaluation of the investment indices for smart grid technology of the future.
Regarding to these objectives, the thesis is organized as follows in Section 1.2.
Page 21
Smart Grid Technologies and Implementations
3
1.2 Organization of Thesis
This thesis consists of 7 Chapters. The main focus is on Smart grid technologies and
implementations.
Chapter 2 Smart Grid Overview
Chapter 2 overviews smart grid definitions, features and its technologies. Moreover,
the differences between traditional grid and smart grid will be discussed. Strategy
planning, motivations, challenges and implementations will also be summarized in this
chapter. The key points of the chapter have been published in “An Overview on Smart
Grid Simulator”.
Chapter 3 Smart Grid Monitoring with Communication Technologies
Chapter 3 will give a state of the art review on smart grid monitoring systems and
communication systems. New technologies applied into intelligent system in many
technical fields will be discussed. The development of condition monitoring and smart
grid monitoring like wide-area monitoring technologies and commercial electronic
monitoring is demonstrated to examine the critical needs for smart grid systems.
Mechanisms and algorithms applied into intelligent monitoring system will be
summarized in order to find out their impacts reflecting to the power systems. A novel
framework for smart grid decision support system design will be proposed. Some of the
points have been published in “Monitoring System for Smart Grid”.
Chapter 4 Smart Grid Load forecasting by Artificial Neural Network
Artificial Neural Network (ANN) and Back-Propagation training is introduced in
Chapter 4 to achieve load forecasting for its excellent mapping approximation ability
such that there is a high potential for industrial use. A paper named “Artificial Neural
Network for Load Forecasting in Smart Grid” has been generated for this chapter.
Page 22
Smart Grid Technologies and Implementations
4
Chapter 5 Self-healing and load shedding in Smart grid
Chapter 5 reports lessons learned from India blackout in this chapter as a negative
example of real-life case study in load shedding. Also, ideas in published paper
“Lessons Learned from July 2012 Indian Blackout” and “Survive Distribution
Networks Using an Automatic Local Load Shedding Scheme” are derived in this
chapter.
Chapter 6 Decision Support System for Smart Grid Implementation
Chapter 6 reports the development of decision support systems (DSS) for smart grid
deployment. Cloud computing and agent-based DSS are discussed in this chapter for
smart grid implementation. Reliability, security and stability indices for smart grid are
considered for decision support systems through a cost-benefit analysis approach. The
integration of these elements together will form a new and novel application. Three
conference papers “New Trends for Decision Support Systems”, “Research on Wind
and Solar Penetration in a 9-bus Network”, and “Reliability and Investigation
Assessment for Wind Energy Generation” have been published from this chapter.
Chapter 7 Conclusions
Chapter 7 summarizes the work done and based on the current finding; direction for
future study will be discussed.
1.3 Original Contribution
1. Comparison, analysis and summary of smart grid technology and implementation
solutions. This work summarizes the smart grid technologies and its benefits in
different aspects. Various requirements have been considered and it will provide
tutorial values to the field, and also it will provide a direction for the academics,
researchers, engineers and decision makers as an important reference. (Chapter 2)
Page 23
Smart Grid Technologies and Implementations
5
2. Monitoring systems and Communication system for smart grid has been analyzed.
This work summarizes the methods and algorithms applied to the smart grid
monitoring, communication technologies for smart grid. Comparison on different
types of monitoring systems has been made, which could see the merits and
drawbacks in each type of the monitoring system. (Chapter 3)
3. A reasonable method for achieving power system and communication co-
simulation by taking into account real-life power system business and operation is
proposed. (Chapter 3)
4. Smart grid load forecasting system framework design for Ontario, Canada. This
work introduces a smart grid load forecast design procedure with consideration of
general influencing factors and Ontario local factors. (Chapter 4)
5. An Artificial Neural Network based load forecasting system design for Ontario,
Canada. This work compares results from different ANN training algorithms and
provides a novel explanation for the differences. (Chapter 4)
6. July 2012 India blackout was investigated and lessons learned from India blackout
will be discussed. The importance of load shedding will be demonstrated to reduce
the possibility of blackout occurrence. (Chapter 5)
7. Development of decision support systems to implement smart grid is summarized.
Past, present and future of the decision support systems are compared with each
other and new findings are discussed. (Chapter 6)
8. Reliability indices of the system with large scale wind generations are compared to
that with distributed generations, investment and cost were considered with power
utilities’ benefits for decision making. (Chapter 6)
Page 24
Smart Grid Technologies and Implementations
6
9. Stability indices of the system with wind and solar generations are discussed and
penetration levels of the wind and solar with stability performance in a 9-bus
network are presented. This work demonstrates the physical insight of the system,
and also provides stability indices for cost-benefit analysis and decision making.
(Chapter 6)
Page 25
Smart Grid Technologies and Implementations
7
Chapter 2
Smart Grid Overview
2.1 Introduction
Smart grid has been advocated in both developing and developed countries these days
to deal with the bottleneck of feeding large requirement in energy consumption as the
growing of industry and commerce. As a new concept for power delivery system, smart
grid involves plenty of advanced technologies, outstanding methodologies, novel
algorithms and creative architectures in service, business and operation to solve
problems like carbon emission deduction, resources allocation optimizations, grid
security and reliability enhancement and deliver power energy in a more efficient,
reliable, and optimal way.
This chapter will critically overview smart grid definitions, features and its technologies.
Moreover, the differences between traditional grid and smart grid will be discussed.
Benefits from smart grid technology aspects will be illustrated. Strategy planning,
motivations, challenges and implementations will also be summarized in the chapter.
2.2 The Smart Grid Definitions
The smart grid concepts have been discussed, expanded, developed by famous
organizations, research institutes and government departments around the world. There
is no agreed definition for smart grid, even different countries has different concept on
the future grid. For instance, China aims to establish massive strong smart grid which
includes all sections from generation, transmission, and distribution to utilization, while
the smart grid is defined within distribution network by National Grid, UK [9]. Many
Page 26
Smart Grid Technologies and Implementations
8
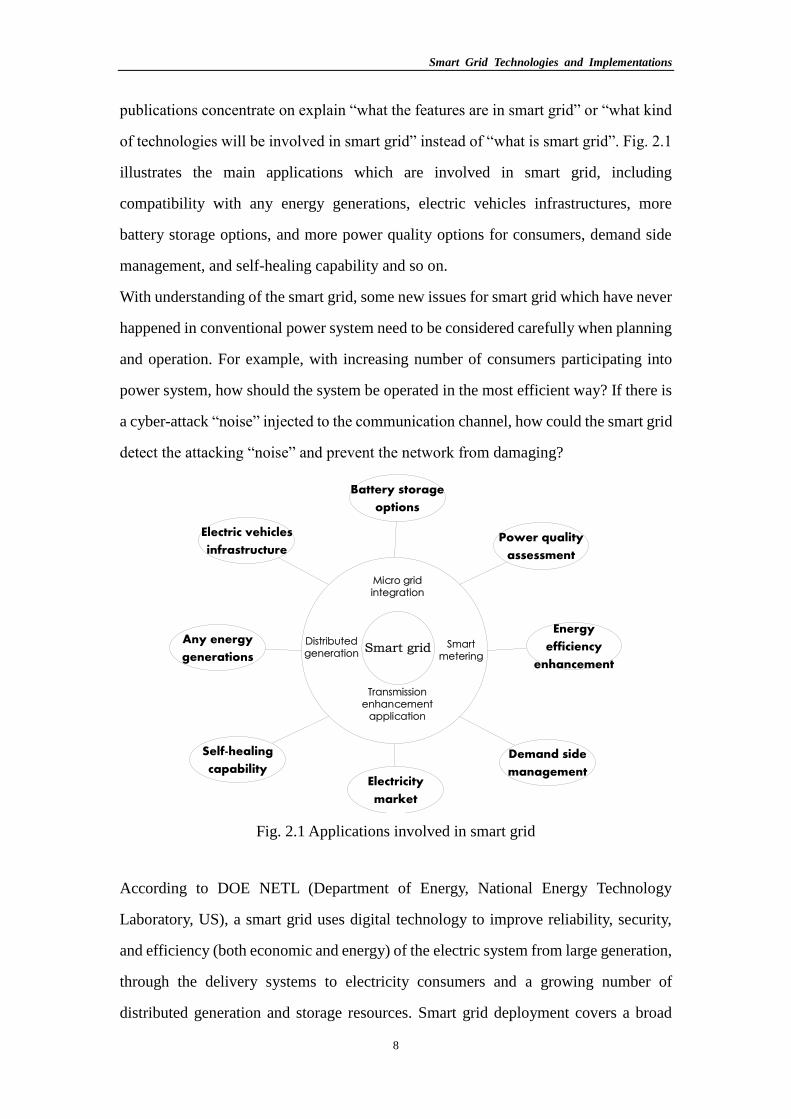
publications concentrate on explain “what the features are in smart grid” or “what kind
of technologies will be involved in smart grid” instead of “what is smart grid”. Fig. 2.1
illustrates the main applications which are involved in smart grid, including
compatibility with any energy generations, electric vehicles infrastructures, more
battery storage options, and more power quality options for consumers, demand side
management, and self-healing capability and so on.
With understanding of the smart grid, some new issues for smart grid which have never
happened in conventional power system need to be considered carefully when planning
and operation. For example, with increasing number of consumers participating into
power system, how should the system be operated in the most efficient way? If there is
a cyber-attack “noise” injected to the communication channel, how could the smart grid
detect the attacking “noise” and prevent the network from damaging?
Fig. 2.1 Applications involved in smart grid
According to DOE NETL (Department of Energy, National Energy Technology
Laboratory, US), a smart grid uses digital technology to improve reliability, security,
and efficiency (both economic and energy) of the electric system from large generation,
through the delivery systems to electricity consumers and a growing number of
distributed generation and storage resources. Smart grid deployment covers a broad
Power quality
assessment
Energy
efficiency
enhancement
Battery storage
options
Any energy
generations
Self-healing
capabilityElectricity
market
Demand side
management
Electric vehicles
infrastructure
Smart grid
Micro grid integration
Transmission enhancement
application
Distributed generation
Smart metering
Page 27
Smart Grid Technologies and Implementations
9
array of electricity system capabilities and services enabled through pervasive
communication and information technology, with the objective of improving reliability,
operating efficiency, resiliency to threats, and our impact on the environment [1, 2].
IEA (International Energy Agency, US) denotes smart grid as “an electricity network
that uses digital and other advanced technologies to monitor and manage the transport
of electricity from all generation sources to meet the varying electricity demands of
end-users” [3]. A Smart grid is an electricity network that can intelligently integrate the
actions of all users connected to it – generators, consumers and those that do both – in
order to efficiently deliver sustainable, economic and secure electricity supplies [10],
demonstrated by European Technology Platform. The "smart grid", described by IEEE,
is a next-generation electrical power system that is typified by the increased use of
communications and information technology in the generation, delivery and
consumption of electrical energy [11].
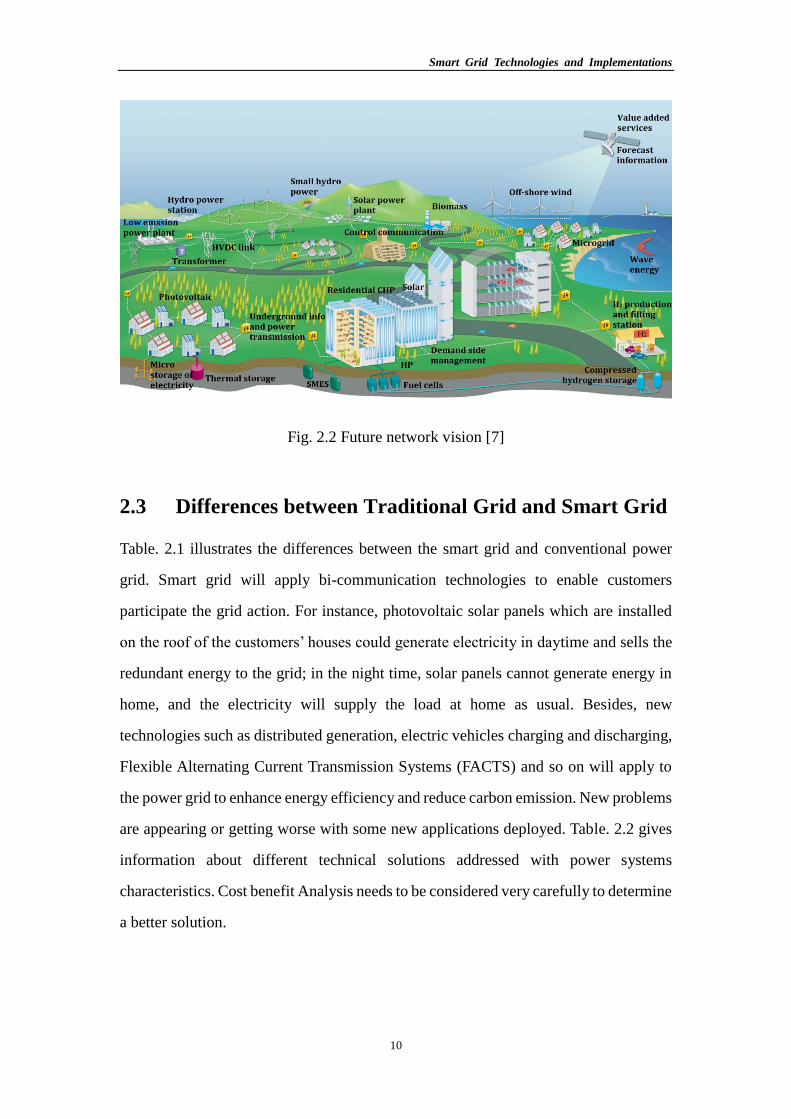
A general future smart grid network vision is shown in Fig. 2.2. No matter which is the
most accurate definition, the conception includes following information at least, smart
grid:
1. combines digital technologies throughout the whole power systems from generation
to end-users
2. improves reliability, security, and efficiency of the power delivery systems
3. contains both bulk generations and distributed generations, non-renewable energy
conversion and renewable energy conversion
Page 28
Smart Grid Technologies and Implementations
10
Fig. 2.2 Future network vision [7]
2.3 Differences between Traditional Grid and Smart Grid
Table. 2.1 illustrates the differences between the smart grid and conventional power
grid. Smart grid will apply bi-communication technologies to enable customers
participate the grid action. For instance, photovoltaic solar panels which are installed
on the roof of the customers’ houses could generate electricity in daytime and sells the
redundant energy to the grid; in the night time, solar panels cannot generate energy in
home, and the electricity will supply the load at home as usual. Besides, new
technologies such as distributed generation, electric vehicles charging and discharging,
Flexible Alternating Current Transmission Systems (FACTS) and so on will apply to
the power grid to enhance energy efficiency and reduce carbon emission. New problems
are appearing or getting worse with some new applications deployed. Table. 2.2 gives
information about different technical solutions addressed with power systems
characteristics. Cost benefit Analysis needs to be considered very carefully to determine
a better solution.
Page 29
Smart Grid Technologies and Implementations
11
Aspects Traditional Grid Smart Grid
Interaction between Grid and
Customers
Customers passively accept service
from grid
Customers participation on the grid action
Renewable Energy
Integration
Having trouble with renewable
penetration
Integration with renewable resources
enhancement
Options for Customers No choice for customer, monopoly
market
With digital market trading, PHEV, introduce
bids and competition, more choice for customer
Options on Power Quality
(PQ)
No choice on power quality, no price
plan options for consumers
Power quality levels for different consumers
System Operation Ageing power assets, no efficient
operation
Assets operating optimization, less power loss
Protection Only rely on protection devices, fault
detect manually
Have capability of self-healing, less damage
affected by fault
Reliability and Security Susceptible to physical and cyber
attack
More reliable for national security and human
safety
Table. 2.1 Comparison between conventional grid and smart grid [12]
Technology
Solutions
Reliability Economics Efficiency Environmental Safety Security
AMI Yes Yes Yes Yes Yes Yes
CSS Yes Yes Yes
DER Yes Yes Yes Yes Yes
DMS Yes Yes Yes Yes Yes
Network
Optimization
Yes Yes Yes Yes
Transmission
enhancement
application
Yes Yes Yes Yes
ICT Yes Yes Yes Yes Yes Yes
EV Charging and
Discharging
Yes Yes Yes Yes
Table. 2.2 Smart grid technology solutions .vs. benefits
2.4 Smart Grid Features and Technologies
Comparing to the conventional power system, smart grid is the next generation of
power delivery system, which includes thousands of creative features and new
Page 30
Smart Grid Technologies and Implementations
12
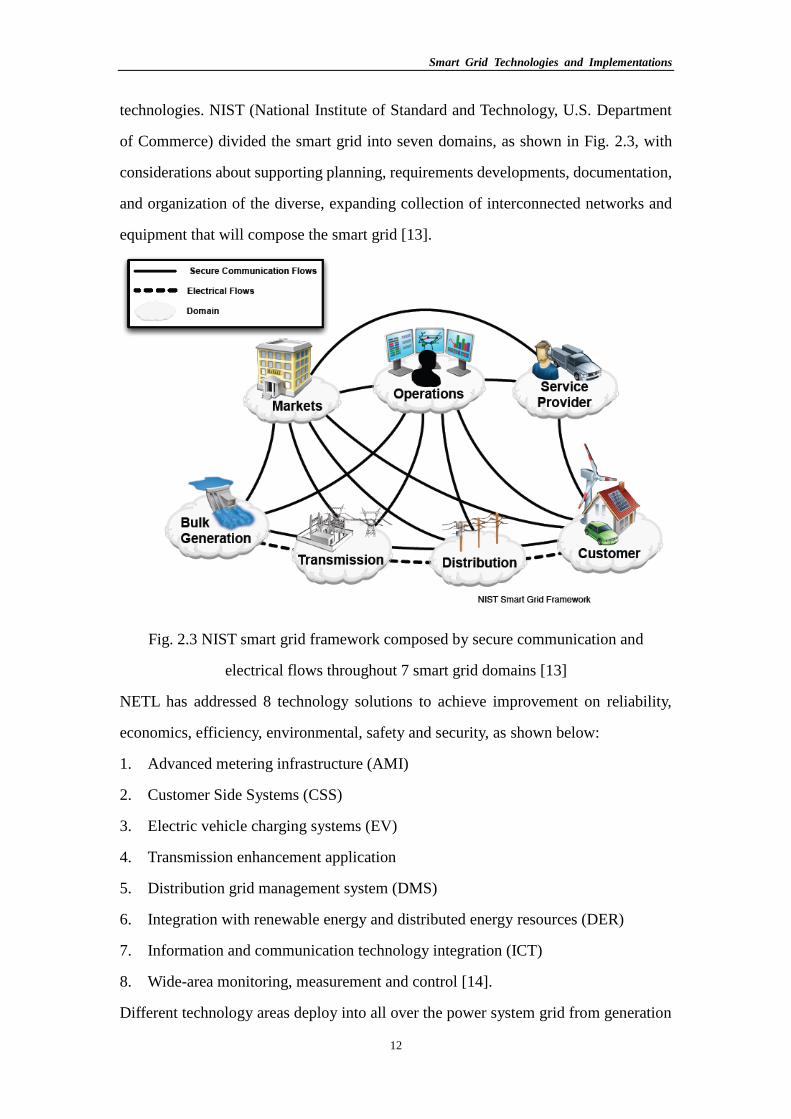
technologies. NIST (National Institute of Standard and Technology, U.S. Department
of Commerce) divided the smart grid into seven domains, as shown in Fig. 2.3, with
considerations about supporting planning, requirements developments, documentation,
and organization of the diverse, expanding collection of interconnected networks and
equipment that will compose the smart grid [13].
Fig. 2.3 NIST smart grid framework composed by secure communication and
electrical flows throughout 7 smart grid domains [13]
NETL has addressed 8 technology solutions to achieve improvement on reliability,
economics, efficiency, environmental, safety and security, as shown below:
1. Advanced metering infrastructure (AMI)
2. Customer Side Systems (CSS)
3. Electric vehicle charging systems (EV)
4. Transmission enhancement application
5. Distribution grid management system (DMS)
6. Integration with renewable energy and distributed energy resources (DER)
7. Information and communication technology integration (ICT)
8. Wide-area monitoring, measurement and control [14].
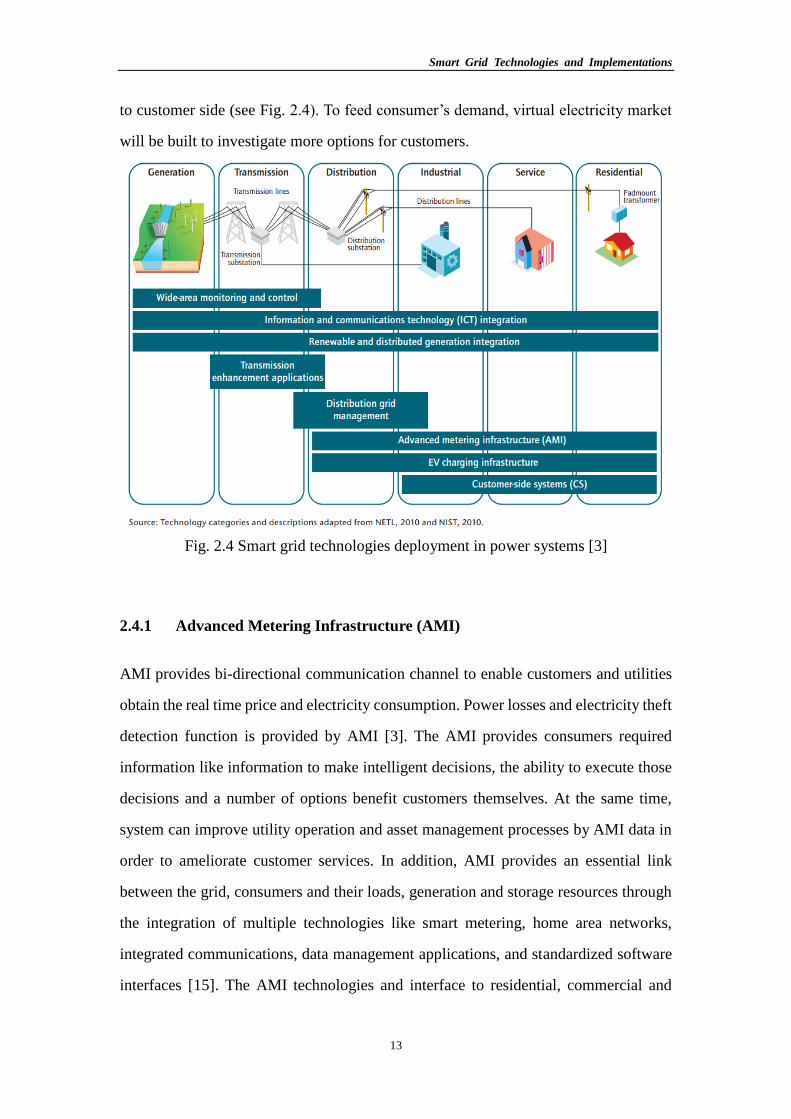
Different technology areas deploy into all over the power system grid from generation
Page 31
Smart Grid Technologies and Implementations
13
to customer side (see Fig. 2.4). To feed consumer’s demand, virtual electricity market
will be built to investigate more options for customers.
Fig. 2.4 Smart grid technologies deployment in power systems [3]
2.4.1 Advanced Metering Infrastructure (AMI)
AMI provides bi-directional communication channel to enable customers and utilities
obtain the real time price and electricity consumption. Power losses and electricity theft
detection function is provided by AMI [3]. The AMI provides consumers required
information like information to make intelligent decisions, the ability to execute those
decisions and a number of options benefit customers themselves. At the same time,
system can improve utility operation and asset management processes by AMI data in
order to ameliorate customer services. In addition, AMI provides an essential link
between the grid, consumers and their loads, generation and storage resources through
the integration of multiple technologies like smart metering, home area networks,
integrated communications, data management applications, and standardized software
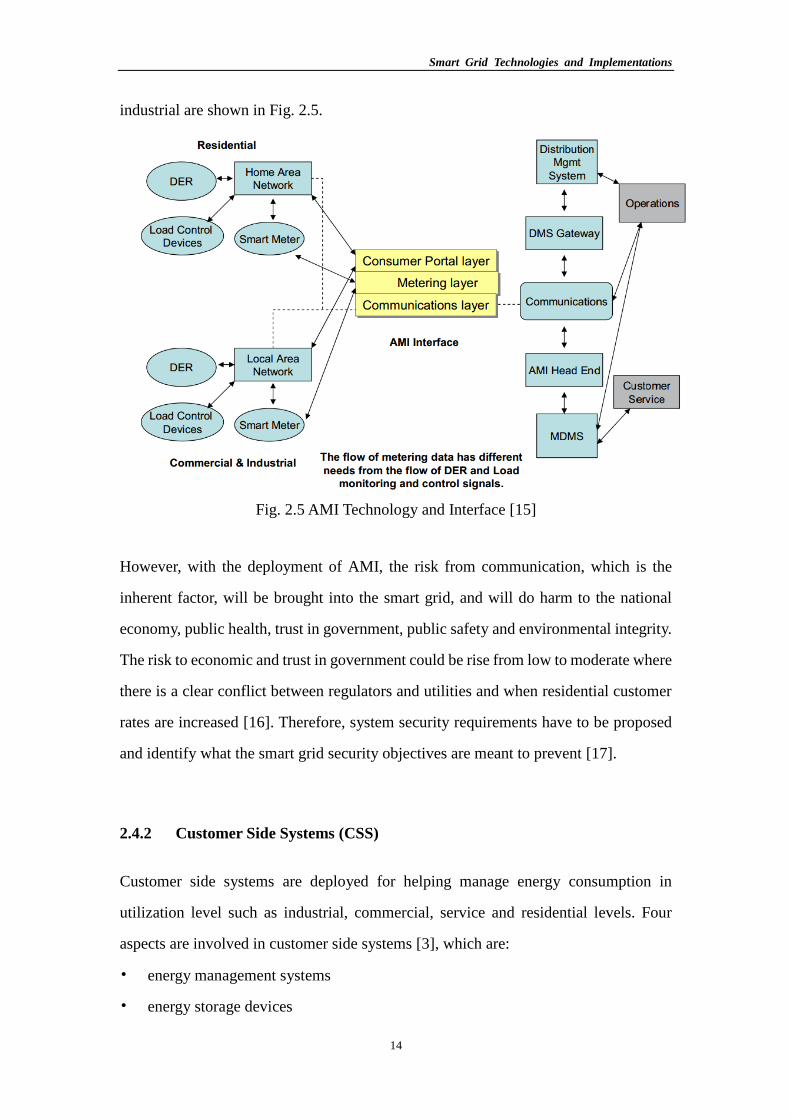
interfaces [15]. The AMI technologies and interface to residential, commercial and
Page 32
Smart Grid Technologies and Implementations
14
industrial are shown in Fig. 2.5.
Fig. 2.5 AMI Technology and Interface [15]
However, with the deployment of AMI, the risk from communication, which is the
inherent factor, will be brought into the smart grid, and will do harm to the national
economy, public health, trust in government, public safety and environmental integrity.
The risk to economic and trust in government could be rise from low to moderate where
there is a clear conflict between regulators and utilities and when residential customer
rates are increased [16]. Therefore, system security requirements have to be proposed
and identify what the smart grid security objectives are meant to prevent [17].
2.4.2 Customer Side Systems (CSS)
Customer side systems are deployed for helping manage energy consumption in
utilization level such as industrial, commercial, service and residential levels. Four
aspects are involved in customer side systems [3], which are:
• energy management systems
• energy storage devices
Page 33
Smart Grid Technologies and Implementations
15
• intelligent electronic devices
• distributed generations
In-home displays like energy dashboards, smart appliances and load storage
deployment could accelerate the profit of energy efficiency and reduction of peak
demand. Demand response is end-use customers reducing their use of electricity in
response to power grid needs, economic signals from a competitive wholesale market
or special retail rates [18]. Both manual customer response and automated, price-
responsive appliances and thermostats connect to Energy Management System or
controlled with a signal from the utility or system operator [3].
2.4.3 Electric Vehicle Charging and Discharging
Electricity vehicles charging infrastructure can regulate the demand by charging and
discharging. There are four operation modes for Electric vehicles charging and
discharging, which are grid to vehicles (G2V), vehicles to grid (V2G), storage to
vehicles (S2V), and vehicles to storage (V2S). With the increasing penetration of
demand response and dynamic price, vehicles could operate as moving storage
components to grid. When the grid is under peak demand and the state of EVs is fully
charged, EVs will discharge to grid to release the heavy load or discharge to home
storage devices to support residential electricity consumption. When the grid is under
peak demand and the state of EV is out of electricity, home storage devices will charge
the EV for daily utility; when the grid is under low energy demand and the electricity
price is getting lower, the EVs will charge from power grid.
2.4.4 Transmission Enhancement Applications
There are plenty of technologies applying to the transmission for improving the
controllability, transferring capability and reducing power loss. Four main applications
are shown below:
Page 34
Smart Grid Technologies and Implementations
16
1. Flexible AC Transmission Systems (FACTS)
2. High Voltage DC Systems (HVDC)
3. Dynamic Line Rating (DLR)
4. High-Temperature Superconductors (HTS) [3]
2.4.5 Distribution Grid Management System
The function of DMS is through real-time information processing, deploying advanced
sensors and meters to:
• reduce the outage and repair time
• maintain voltage level
• detect the fault locations
• improve asset management
• reconfigure feeders automatically
• optimize voltage and reactive power
• control distributed generation [3]
2.4.6 Integration with Renewable Energy and Distributed Energy Resources
Different scales of the renewable energy resources deploy in different power grid levels:
large scale renewable energy resources at the transmission level, medium scales at the
distribution level and small scales at customer side buildings. Controllability and
dispatchablity are still the main challenge issues for integrations of renewable energy
and distributed energy resources in power system operation. Both electrical and thermal
energy storage devices can alleviate the impact from renewable energy intermittence,
especially wind and solar [3]. DG integrations can improve power grid reliability and
reduce the heavy load.
Page 35
Smart Grid Technologies and Implementations
17
2.4.7 Information and Communication Technology Integration (ICT)
Information and communication technology integration (ICT) is to support data
transmission for deferred and real-time operation, and during outages, no matter which
communication networks is using, private (including radio networks, meter mesh
networks), or public (involving internet, cellular, cable and telephone). Stakeholders
are able to use and manage the grid in an efficient way with deploying communication
devices, significant computing, system control software and enterprise resource
planning software into bi-directional communication infrastructure [3].
2.4.8 Wide-area Monitoring, Measurement and Control
Wide-area monitoring and control supervise every power system component and
performance in a real-time way by interconnecting within large geographic areas, and
optimize power system components, behaviour and performance via assisting system
operators to understand them. Advanced system operation tools encompassing wide-
area situational awareness (WASA), wide-area monitoring systems (WAMS), and wide-
area adaptive protection, control and automation (WAAPCA), avoid blackouts and
facilitate the integration of variable renewable energy resources. In addition, data
generated by Wide-area Monitoring, Measurement and Control systems could also
facilitate system operating by
• informing decision making;
• mitigating wide-area disturbance;
• improving transmission capacity and reliability [3].
Table. 2.3 denotes the hardware and software which are related to each of technology
area and issues in smart grid. As can be seen in this table, communication network
elements are the essential parts for smart grid establishment, and deploying in many
technology areas in smart grid. Communication network would be employed to transfer
the energy consumption and storage level data to the control centre. Industry standard
Page 36
Smart Grid Technologies and Implementations
18
PC and Ethernet would be applied in smart grid to communicate between substations
and control centre. Universal monitoring and controlling devices which are installed
inside the control centre would fully be responsible for the energy generation, storage
and utilization. It will regulate the renewable energy generation, energy storage, and
consumptions according to the fluctuating generation forecasting (especially the
renewable energy) and dynamic energy load curve. Besides, new algorithms would be
built into the control and monitoring device. For instance, the micro-grid energy
management system needs to be more intelligent to deal with uncertainty and variability
of the demand and generation. Computational algorithm (CA) is one of intelligent
algorithms which can update information during the system operation.
Page 37
Smart Grid Technologies and Implementations
19
Smart Grid
Technologies and Issues
Hardware Systems and Software
Cyber Security Communication equipment (Power
line carrier, WIMAX, LTE, TF mesh
network, cellular), routes, relays,
switches, gateway, computers
(servers)
Supervisory control and data acquisition
(SCADA), distribution management
system (DMS), Firewall rules,
Vulnerability management
Protection Fiber communication network,
routes, relays, switches, computers
(servers)
wide-area adaptive protection, control and
automation (WAAPCA), wide-area
situational awareness (WASA), distribution
management system (DMS), Agent-based
Supervision
Wide-Area Monitoring
and Control
Phasor measurement units (PMU)
and other sensor equipment
Supervisory control and data acquisition
(SCADA), wide-area adaptive protection,
control and automation (WAAPCA), wide-
area situational awareness (WASA)
Information and
Communication
Technology integration
Communication equipment (Power
line carrier, WIMAX, LTE, TF mesh
network, cellular), routes, relays,
switches, gateway, computers
(servers)
Enterprise resource planning software
(ERP), customer information system (CIS)
Renewable and
Distributed Generation
Integration
Power conditioning equipment for
bulk power and grid support,
communication and control
hardware for generation and
enabling storage technology
Energy management system (EMS),
distribution management system (DMS),
SCADA, geographic information system
(GIS)
Transmission
Enhancement
Superconductors, FACTS, HVDC Network stability analysis, automatic
recovery systems
Distribution Grid
Management
Automated re-closers, switches and
capacitors, remote controlled
distributed generation and storage,
transformer sensors, wire and cable
sensors
Geographic information system (GIS),
distribution management system (DMS),
outage management system (OMS),
workforce management system (WMS)
Advanced Metering
Infrastructure
Smart meter, in-home displays,
servers, relays
Meter data management system (MDMS)
Electric Vehicle
Charging Infrastructure
Charging infrastructure, batteries,
inverters
Energy billing, smart grid-to-vehicle
charging (G2V) and discharging vehicle-to-
grid (V2G) methodologies
Customer Response Side Smart appliances, routes, in-home
display, building automation
systems, thermal accumulators,
smart thermostat
Energy dashboards, energy management
systems, energy applications for smart
phones and tablets
Table. 2.3 Hardware and software employed into smart grid [3]
Page 38
Smart Grid Technologies and Implementations
20
2.5 Benefits of Smart Grid
According to NETL, the benefit of the smart grid can enhance system operation and
utilization in six key areas, shown as follows:
1. Reliability — by reducing the cost of interruptions and power quality disturbances
and reducing the probability and consequences of widespread blackouts
2. Economics — by keeping downward prices on electricity prices, reducing the
amount paid by consumers as compared to the “business as usual” (BAU) grid,
creating new jobs, and stimulating the gross domestic product (GDP).
3. Efficiency — by reducing the cost to produce, deliver, and consume electricity
4. Environment — by reducing emissions when compared to BAU by enabling a
larger penetration of renewables and improving efficiency of generation, delivery,
and consumption
5. Security — by reducing the probability and consequences of manmade attacks and
natural disasters
6. Safety — by reducing injuries and loss of life from grid-related events [12]
Generally, the benefits brought from smart grid are:
– Improved system performance meters
– Better customer satisfaction
– Improved ability to supply information for rate cases; visibility of utility operation
/ asset management
– Availability of data for strategic planning, as well as better support for digital
summary
– More reliable and economic delivery of power enhanced by information flow and
secure communication
– Life cycle management, cost containment, and end-to-end power delivery is
improved in the smart grid design
– Improved ability to supply accurate information for rate cases- with compounding
impact in regulatory utilities
Page 39
Smart Grid Technologies and Implementations
21
– Input visibility of utility operation to asset management
– Impact access to historical data for strategic planning [19]
Different group of stakeholders could obtain benefits from smart grid deployment and
operation. NETL divided stakeholders into 4 groups, which are Delivery Company,
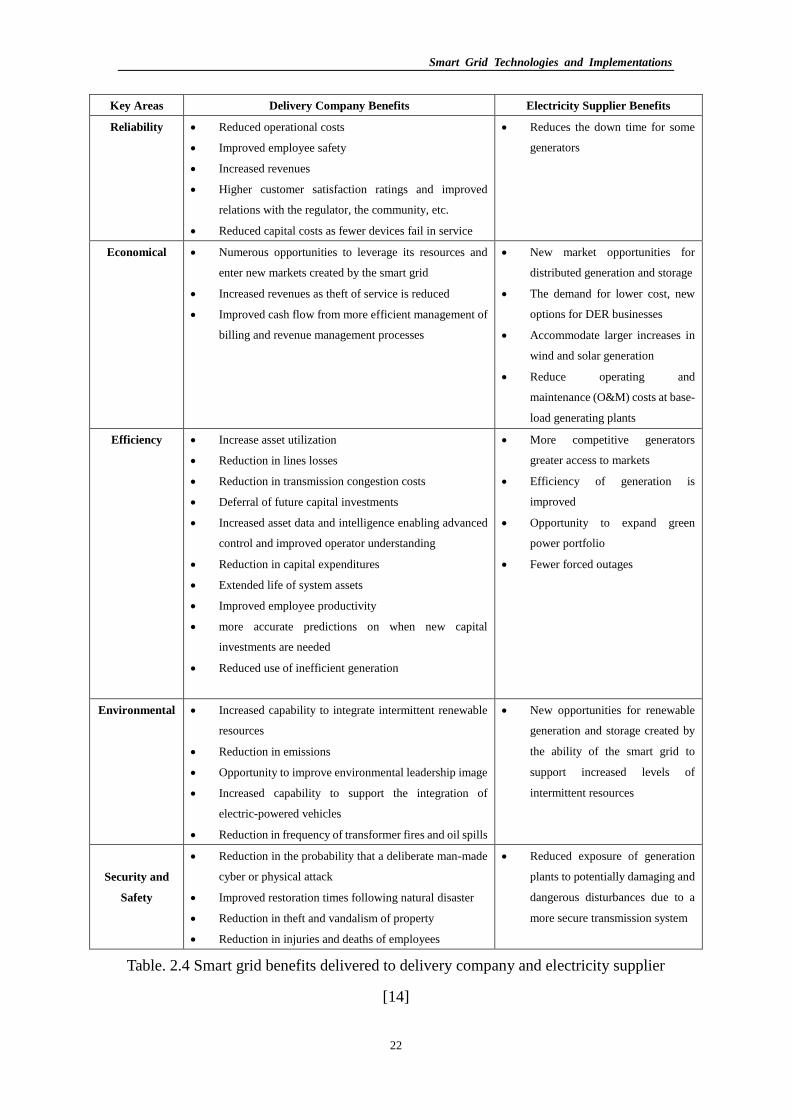
Electricity Supplier, Residential Consumer and Broader Societal. Table. 2.4 and Table.
2.5 show benefits that brought to different stakeholders from smart grid key areas.
Page 40
Smart Grid Technologies and Implementations
22
Key Areas Delivery Company Benefits Electricity Supplier Benefits
Reliability Reduced operational costs
Improved employee safety
Increased revenues
Higher customer satisfaction ratings and improved
relations with the regulator, the community, etc.
Reduced capital costs as fewer devices fail in service
Reduces the down time for some
generators
Economical Numerous opportunities to leverage its resources and
enter new markets created by the smart grid
Increased revenues as theft of service is reduced
Improved cash flow from more efficient management of
billing and revenue management processes
New market opportunities for
distributed generation and storage
The demand for lower cost, new
options for DER businesses
Accommodate larger increases in
wind and solar generation
Reduce operating and
maintenance (O&M) costs at base-
load generating plants
Efficiency Increase asset utilization
Reduction in lines losses
Reduction in transmission congestion costs
Deferral of future capital investments
Increased asset data and intelligence enabling advanced
control and improved operator understanding
Reduction in capital expenditures
Extended life of system assets
Improved employee productivity
more accurate predictions on when new capital
investments are needed
Reduced use of inefficient generation
More competitive generators
greater access to markets
Efficiency of generation is
improved
Opportunity to expand green
power portfolio
Fewer forced outages
Environmental Increased capability to integrate intermittent renewable
resources
Reduction in emissions
Opportunity to improve environmental leadership image
Increased capability to support the integration of
electric-powered vehicles
Reduction in frequency of transformer fires and oil spills
New opportunities for renewable
generation and storage created by
the ability of the smart grid to
support increased levels of
intermittent resources
Security and
Safety
Reduction in the probability that a deliberate man-made
cyber or physical attack
Improved restoration times following natural disaster
Reduction in theft and vandalism of property
Reduction in injuries and deaths of employees
Reduced exposure of generation
plants to potentially damaging and
dangerous disturbances due to a
more secure transmission system
Table. 2.4 Smart grid benefits delivered to delivery company and electricity supplier
[14]
Page 41
Smart Grid Technologies and Implementations
23
Key Areas Residential Consumer Benefits Broader Societal Benefits
Reliability Improved level of service with fewer
inconveniences caused by outages and poor
power quality
Reduced out-of-pocket costs
Reduced cost of losses suffered by large
consumers from outages
Reduced cost of losses suffered by large
consumers from poor power quality
Virtual elimination of blackouts
Improved conditions for economic
development
Economical Downward pressure on energy prices and total
customer bills
Increased capability, opportunity, and
motivation to reduce consumption
Opportunity to interact with the electricity
markets
Opportunity to reduce transportation costs
Opportunity to sell consumer-produced
electricity back to the grid
Downward pressure on prices
Creation of new jobs
Growing the U.S. economy
Creation of new electricity markets
Efficiency Increased capability, opportunity, and
motivation to be more efficient on the
consumption end of the value chain
Increased influence on the electricity market
Ability to switch from gasoline to electricity for
transportation
Deferral of capital investments
Reduced consumption provides for a
better utilization of resources
Sustained downward pressure on prices as
the smart grid enables these efficiency
improvements to endure
Environmental Increased capability, opportunity, and
motivation to shift to electric vehicle
transportation
Optimize energy-consumption behaviour
resulting in a positive environmental impact
shift from a carbon-based to a “green economy”
Reduced emissions
Improved public health
Security and
Safety
Increased peace of mind that the electric grid on
which they depend is less likely to be vulnerable
to terrorist activity
Increased ability of grid workers when outages
or power quality events occur
Increased national security
Reduction in the probability of widespread
and long-term outages due to terrorist
activity
Reduction in the number of injuries and
deaths associated with the public’s
contacts with grid assets
Table. 2.5 Smart grid benefits delivered to residential consumer and broader societal
[14]
Page 42
Smart Grid Technologies and Implementations
24
2.6 Motivations and Challenges towards Smart Grid
2.6.1 Motivations
As the next generation intelligent electricity delivery system, smart grid optimizes the
energy efficiency by grafting information technologies onto the existing network and
exchanging real-time information between electric suppliers and customers [20].
Besides the benefits to every group of stakeholders from smart grid, there are many
driving forces of the smart grid implementation.
Firstly, the conventional grid is aging, old-designed, and with poor reliability, one
example is the blackout occurring in many countries. The most serious blackout events
occurred in countries around the world are list as following:
1. 9 Nov. 1965, Northeast U.S. and Ontario blackout, over 30 millions of people
affected [21]
2. 11 March 1999, Southern Brazil blackout, most of the southern third of the country
affected [22]
3. 28 Sept. 2003, Italy, Switzerland blackout, about 45 millions of people affected [23]
4. 14–15 Aug. 2003, Northeast blackout, 50 millions of people affected [24]
5. 18 Aug 2005, Indonesia Java–Bali blackout, 100 millions of people affected[25]
6. 10–11 Nov 2009, Brazil and Paraguay blackout, 190 millions of people affected [26]
7. 30–31 July 2012 July 2012 India blackout, over 700 millions of people affected [27]
Secondly, transmission congestion is one of the significant problems for conventional
grid. It occurs when the dispatching of transactions causes the violation on the
transmission system [28]. Several reasons like transmission line and generators outages,
energy demand heavily changes, and uncoordinated trading may lead to congest in
transmission. Consequently, system operators may not dispatch power in a flexible way
even though the generators could provide more power. Furthermore, it may leads to
infeasibility in existing and future contracts.
Page 43
Smart Grid Technologies and Implementations
25
In addition, environmental impact is also one of the chief reasons for driving to smart
grid. With the dramatically climate changes during the last few decades, large quantities
released greenhouse gas and any other pollution gases from combusting fossil fuels in
conventional power plants are regarded as the main incentives to develop renewable
energies. Besides, improving energy efficiency becomes one of the significant strategic
objectives. Plenty of technical solutions (like FACTS, HVDC, UPS, STATCOM and so
on), and innovative ideas were applied into the system to promote transmission
efficiency and energy conversion efficiency [20].
2.6.2 Challenges
As the brand new concept and with plenty creative technological implementation, smart
grid is facing hundreds of challenges.
1. Safety and Security
With communication network integration into power grid, smart grid also brings the
issues which never happen in traditional networks. Cyber security issues need to be
taken greatly care in order to prevent power grid from operation modification
disruption or wrong message inserting. Targets for Power grid self-healing
technologies deployment also need to carefully consider to against natural disaster
and physical attack.
2. Reliability
Communication network integrate brings reliability problem to the power system
networks. There is no doubt that the communication system could deliver message
efficiently which can make power system operators respond faster when facing
some critical situation. However, the wrong messages produced by hackers sent to
the power network may be accompanied by serious consequences, and ultimately
results in power blackout. In addition, reliability index need to be reconsidered.
Besides some traditional indices like SAIDI, CAIDI, SAIFI CAIFI, new indices
with considering communication network deployment need to be produced to
illustrate the reliability properly.
Page 44
Smart Grid Technologies and Implementations
26
3. Power Quality
Disturbance identification and Harmonics suppression technology need to be
developed to provide power with a high quality level to consumers. Disturbance
identification is still in the early stage of research [30]. Non-dispatchable energy
resources like wind and solar need to be forecasted more accurately and exactly
with its increasing penetration as well as load consumption.
4. Interactivity between Grid and Customers
In order to produce more reliable power and improving energy efficiency, customer
have to participate into grid activities like demand response, choose power quality
according their willingness, installing small Distributed Generation devices and
purchase electric vehicles, which also need communication network to provide
security environment to prevent consumer personal information from leaking
deliberately.
2.7 Smart Grid Standards
There are many institutions and organizations in the world attempt to standardize smart
grid in technologies and implementations in both regional and national. Some of the
most famous organizations and institutions are listed as follow:
1. European Union Technology Platform
2. National Institute of Standards and Technology, U.S. Department of Commerce
3. American National Standards Institute (ANSI)
4. International Electro technical Commission (IEC)
5. Institute of Electrical and Electronics Engineers (IEEE)
6. International Organization for Standardization (ISO)
7. International Telecommunication Union (ITU)
8. Third Generation Partnership Project (3 GPP)
9. Korean Agency for Technology and Standards (KATS)
10. Joint Information Systems Committee (JISC) [29]
Only in IEEE, over 100 approved and proposed standards are related to smart grid,
including the call out in the NIST smart grid Interoperability standards [31]. Table.2.6
Page 45
Smart Grid Technologies and Implementations
27
listed the international standards related to smart grid.
Name of the Standards Application Description
IEC 61970, 61969 EMS Providing Common Information Model (CIM) in
Transmission and Distribution Domains
IEC 61850 Substation
Automation
Flexible, future proofing, open standard, communication
between devices in Transmission and distribution and
substation automation systems
IEC60870-6/TASE.2,
62351 Parts 1-8
Communication &
Cyber Security
Defining cyber security for the communication protocol
IEEE P2030 and
P1901
Customer-side
applications, In-home
multi-media and
smart grid application
Smart grid inter-operability of energy technology and IT
operation with the electric power system (EPS), High speed
power line communications
ITU-T G.9955 and
G.9956
Distribution
Automation, AMI
Contain the physical layer specification and the data link
layer specification
OpenADR Price Responsive and
Load Control
Dynamic Price and Demand Response
BACnet Building Automation Scalable system communications at custom side
HomePlug Green PHY Home Area Network
(HAN)
Power line technology to connect the smart appliances to
HAN
U-SNAP Home Area Network
(HAN)
Providing many communication protocols to connect HAN
devices to smart metres
ISA100.11a Industrial Automation Open standard for wireless systems
SAE J2293 Electric Vehicle
Supply Equipment
Standard for the electrical energy transfer from electric
utility to EVs
ANSI C12.22, C12.18,
C12.19
AMI Data network communications, data structure
transportation and its flexible metering model
Z-Wave Home Area
Network (HAN)
Dealing with the interference with 802.11/b/g
M-Bus AMI European standard and providing the requirements for
remotely reading all kinds of utility meters
PRIME AMI Open, global standard for multi-vendor interoperability
G3-PLC AMI Providing interoperability, cyber security, and robustness
SAE J2836, J2847 Electric Vehicle Supporting use cases for plug-in electric vehicles
communication, and communication messages between
PEVs and grid components
Table. 2.6 International standards related to smart grid [29]
Page 46
Smart Grid Technologies and Implementations
28
2.8 Smart Grid Simulation
One of cost-effective ways to evaluate the smart grid behaviours is via simulation with
computer-based software. The reason is that to investment in a test bed will cost a large
amount of money without foreseeing the consequence after applying the new
technologies. Plus, the test beds are not very flexible when comparing two or more
similar technologies while simulators could change the technologies without much
expense of time and money. There are many organizations and corporations has
developed the smart grid simulators with communication network integration, but none
of them are considering the co-simulation cases with accordance of the realistic
business.
There are some researchers and organizations co-simulate some functions of smart grid.
Some of them are co-simulating the smart grid system by hybrid power system
simulators and communication network simulators together. Reference [32]
emphasized the importance of developing smart grid simulators and its urgency. It
pointed out that optimization of the smart grid operation would require modeling the
involvement of all other devices, systems, customers and so on. In order to understand
the benefit in terms of reliability and economy etc., it is very difficult to have a practical
smart grid to get hold of all the results for various studied scenarios.
Reference [33] briefly states how continuous and discrete events may be synchronized
and co-simulated together with continuous events modeled with Simulink while
discrete model is programmed by SystemC. Reference [34] describes the ideas of
integration between hybrid system modeling language (HSML) model, presenting state
events and Matlab model, which is embedding with discrete events. In reference [35],
authors connect GE Energy PSLF which is used for simulating power system load flow
with NS-2, a simulator for deploying communication network to enhance the relay
ability. The authors performed an agent-base communication system for justifying the
correction of relay settings. However, this kind of simulation is neglecting the delay of
communication network. Whether the method to detect the fault is reliable or not
Page 47
Smart Grid Technologies and Implementations
29
remains to be studied by taken into account the relay and circuit breaker performance
together. In reference [36], the authors described the method to calculate the time delay
for communication network which is applied into power system. GridSim is an
emulator involving power system toolkit and communication toolkit which is proposed
by Washington State University [37]. The authors gave state estimator simulation result
on several substations for wide-area monitoring and control.
With the communication channel applying into power system network, information
around stakeholders will exchange via computing devices and system control software.
Meantime, cyber security becomes a significant issue which has to be considered.
Governments around the world have set a series of targets to reduce carbon emission
and increasing the penetration of renewable energy. Cost benefit analysis is also
important for making decisions around several operation and expansion plans in both
power system network and electricity market. Whereas, there is no such powerful
simulation software involved all of the areas to give a guideline. Also, there is no
detailed model for large scale power system network to plan the expansion stages with
the introduction of communication capability.
Current Power grid simulators usually focus on a certain professional domain which is
very narrow and less connection with any other field. Basically, there are 5 areas for
current power grid simulators.
1. Operation models are designed to estimate the reliability and normal, abnormal
operation scenarios for current power system.
2. Expansion models are used for assessing new technologies or network expansion,
the system operation under normal and abnormal scenarios to estimate the policy
feasibility.
3. Contingency analysis is employed into system modeling to discover inherent risk
when load is changing or post-fault operation.
4. Power market models research on market activities between stakeholders from
generators to customers under competition environment.
5. Specific models are designed for critical assessment when the system is suffered
from various disturbances [38].
Page 48
Smart Grid Technologies and Implementations
30
Data cannot be exchanged among the models in real-time, integration is impossible to
both market research and operation research on the same model. Communication
network does not exist in current simulator. Additional communication channel needs
to apply into power system by cooperating with communication network simulation.
Unnecessary obstacles such as synchronizing discrete network with continuous
network need to be addressed. Reference [39] is presenting SCADA cyber security
problems by co-simulating PowerWorld Server with a network emulator. Protection
devices are limited in the power system simulators.
In terms of smart grid functions, power grid models need to simulate three general
dimension scenarios as a whole, such as operation, system expansion and disruption.
In operation scenario, besides the basic functions such as load flow calculation and
stability analysis, smart grid simulator is required to carry out contingency analysis and
optimization in power system operations. For instance, power flow calculations aim to
minimize the power losses, minimize the cost or minimize load shedding need to be
presented. Post fault load flow needs to be done to study power transfer margins or
inherent risk inside the power system. In addition, power system market operation
needs to include simulation of behaviours between stakeholders and market participants
[38].
System expansion simulates the new technologies applied into existing grid for
assessing power system operation. Researching on scenario feasibility is modeled to
meet the future task. For example, to meet the target on renewable energy 30%
penetration in 2030, variability and uncertainty of renewable energy need to be
simulated and analyzed in a virtual but realistic environment before applying so many
wind and solar energy conversion systems in practice.
Last but not least, there is a need to simulate unwanted disasters and malicious physical
and cyber-attacks. This kind of modeling needs to integrate power system and
communication system together for stochastic events. Generally, power system
modeling is continuous while communication system is discrete. The two systems can
be synchronous with limited time scale. Reference [40] employs a global scheduler to
synchronize two systems implicitly to simulate the failure on primary protection and
Page 49
Smart Grid Technologies and Implementations
31
remote protection devices.
Fig. 2.6 illustrates the purpose for different organizations to utilize smart grid simulator.
Generally, industrial companies will pay for the existing software for building electrical
network models. Commercial companies such as Siemens and ABB will do the same
simulation as power system utilities do, however, commercial companies sell products
to the power system utilities. To conduct national security and social safety, electricity
network operation may need to be under government’s supervision. Self-healing
capability which is an important property of smart grid is also considered by
government. Higher education including universities pays its attention to improve
models accuracy and innovations on new technical methods and requirements [38].
Fig. 2.6 Purposes for smart grid simulator
To satisfy as many groups of people as possible, smart grid simulators will not only
concentrate on technical modeling and stability analysis, but also focus on connecting
with some other field such as economy, environmental issues, transportation,
communication, policy responding and security issues. In the year of 2008, US
department of Homeland Security, and Science and Technology Directorate hold 2 days
Smart grid
simulator
Power
system
utilities
Government
department
Commerce
Education
Planning, operating optimization,
economic dispatching, unit
commitment, reliability assessment
Simulating the unwanted nature
disasters and any other physical and
cyber attacks, renewable energy
penetration scenarios, loading
shedding to minimize blackouts.
Provide simulation models to power
system utilities
Developing and creating oriented
contribution for new modeling,
algorithms
Page 50
Smart Grid Technologies and Implementations
32
to discuss developing future grid simulation capability issues.
2.8.1 Additional Simulation Requirement of Smart Grid
A. Data accuracy, management and processing
To create a smart grid simulator, there are large number of data involved in building
models and operating status. Data accuracy is a significant problem to deal with. Data
quality and accuracy need to be justified and guaranteed for applying into models. Since
equipment is replaced and reset, data in smart grid simulators also need update and
version upgrade, which could be controlled to meet the realistic situation. Moreover,
according to the user classifications, data security needs to be warranted by authority.
B. New model functions
As mentioned above, operation in market would be modeled to find the relationship
between stakeholders and any group of people attending market activity. Stochastic
modeling is built for researching on dynamic behaviour of the market activities [41].
Forecasting on renewable energies such as wind and solar, market price must include
into smart grid simulator to determine how to optimize power flow, and power dispatch
and so on. Besides, appearance of new market products such as electric vehicles will
lead to simulate charging and discharging models in power grid. AMI will lead
customer charging their electric car during off-peak load time for saving money. As a
consequence, customer behaviours would also be modeled to achieve more accurate
load forecasting. Models integration to each other would give a whole picture from
energy generation to energy consumption.
C. Old model updating
Old models need to be updated to keep consistent with real world. Detailed models
would simulate the specified situation. For instance, single phase air conditioner model
cannot represent by 3-phase model for stability research [42].
D. Algorithm improvement
For academia such as university and research community, modeling method and
algorithms draw more attention for improving model robustness and promoting
Page 51
Smart Grid Technologies and Implementations
33
accuracy. Modeling template and self-programming capacity should build into the
smart grid simulator.
E. Interface integration
Interface between simulator and real system could help industries test and improve the
equipment to meet the requirement of utility. More detailed model and simulation could
bring the evolution in grid research. Instead of considering the simulation event
unilaterally, more comprehensive integrated models could emulate the event more
realistic. Reference [43] describes the communication and information capacity could
improve the market operation for dispatching energy. Meanwhile, the author also
doubted about the capability on grid response since so many conventional power plants
connect to the grid and require more time to starting-up. With model integration, this
kind of problem will become explicit. Some simulation laboratories intend to combine
controls, communications and electro-mechanical dynamics together. Oak Ridge
National Laboratory (ORNL) connects power system models to communication
network with discrete event [44].
2.9 Conclusion
This Chapter critically overview smart grid definitions, features and its technologies.
In addition, the differences between traditional grid and smart grid have been discussed.
Also, this work summarized the smart grid technologies and its benefits in different
aspects. Strategy planning, motivations, challenges and implementations are
summarized in the chapter as well.
Besides, the chapter, for the first time, is to provide critical overview on smart grid
simulator. Further to the report generated by National Power Grid Simulator workshop,
which is organized by US Department of Homeland Security in 2008, there is no such
powerful simulator so far. Cases need to be considered carefully in order to simulate
with communication tools. Some organizations have managed to a small degree of
achievement to integrate communication with power system in simulation. As the
Page 52
Smart Grid Technologies and Implementations
34
sampling frequency is too small, communication system information loss cannot be
avoided. No software has been available for smart grid researchers. A natural way is to
integrate two simulators or packages together with an interface between them. Because
of different electrical applicants and new devices in power system and communication
systems, detailed models and data requirement will be a huge challenge and opportunity
for the very near future. Various requirements have been considered and this chapter
will provide tutorial values to the field and also it will provide a direction for the
academics, researchers, engineers and decision makers as an important reference.
Page 53
Smart Grid Technologies and Implementations
35
Chapter 3
Smart Grid Monitoring with
Communication Technologies
3.1 Introduction
This chapter intends to give a critical overview about intelligent system monitoring in
power grid over the last decade. As an essential aspect for achieving smart grid,
intelligent system monitoring needs to be deployed into the system to deliver data and
messages timely. New technologies applied into intelligent system in many technical
fields will be discussed. The development of condition monitoring and smart grid
monitoring like wide-area monitoring technologies and commercial electronic
monitoring is demonstrated. Mechanisms and algorithms applied into intelligent
monitoring system will be summarized. In addition, this chapter category the power
system network cases and scenarios with communication deployment according to the
operation and business, and organize the scenarios by the different business to study in
which level power systems need to co-simulate with communication network, and in
which level power systems need integrate with communication not as critically as co-
simulation.
According to U.S. Department of Energy 2010 smart grid system report, smart grid was
defined as “uses digital technologies to improve the reliability, security, and efficiency
of the electricity system, from large generation through the delivery systems to
electricity consumers. Smart grid deployment covers a broad array of electricity system
capabilities and services enabled through pervasive communication and information
technology, with the objective of improving reliability, operating efficiency, resiliency
to threats, and our impact on the environment” [1]. Communication network plays a
Page 54
Smart Grid Technologies and Implementations
36
significant role in the entire smart grid businesses and operations, such as wide-area
monitoring and control, integrating distribution management systems, automation
electricity dispatch and automation distribution.
One of cost-effective ways to evaluate the smart grid behaviours is via simulation with
computer-based software. The reason is that to investment the test beds will cost a large
amount of money without foreseeing the consequence after applying the new
technologies. Plus, the test beds are not very flexible when comparing two or more
similar technologies while simulators could change the technologies without much
expense of time and money. There are many organizations and corporations has
developed the smart grid simulators with communication network integration, but none
of them are considering the co-simulation cases with accordance of the realistic
business.
3.2 Intelligent System Monitoring
Intelligent monitoring system involves functionalities like video analysis, behaviour
recognition and business intelligence. The functionality of video analysis is to gather
data and information through computer vision (CV) and artificial intelligence (AI) to
create a close mapping link from images to the event description. Behaviour recognition
contains analysis, monitoring and alarming functionality. Business intelligence is the
most extremely crucial part in the intelligent system, which provides the key video
business for users. Hierarchical structure of the intelligent technology is deployed
within the network, equipment and software to achieve information integration and
scheduling via system management platform [45].
Three main problems of the data capture have been realized by M. D. Judd, et al. in
reference [46]. Firstly, the quantities of the raw data were too large for engineers to deal
with. Secondly, the relationship between the plant item, health and condition
monitoring data could not be understood all the time so that it was difficult to extract
the meaningful information from condition monitoring data. Lastly, estimating the
lifetime expectation only from the health of the item is not easy as it is not always
Page 55
Smart Grid Technologies and Implementations
37
apparent. The structure of the integrated approach to power transformer condition
monitoring by Ultra High Frequency (UHF) sensors was illustrated in Fig. 3.1, and the
model has been further developed by the authors in 2004 [47], which is shown in Fig.
3.2. An agent-based system with self-contained functional software in each module was
proposed in the architecture. The information exchange and co-operation among the
independent modules were implemented via a standardized Agent Communication
Language (ACL).
A literature survey about condition monitoring techniques for power transformer,
generator and inductive motor was made in reference [48]. The authors found out that
a novel condition monitoring system requires signal processing and Artificial
Intelligent as tools for developing the next generation condition monitoring with high
level of sensitivity, reliability, intelligence and accuracy.
Monitoring applications improved by integrating the temporal and spatial aspects of
data and information was shown in reference [49]. Two new monitoring functions were
depicted in the paper, to show how the smart grid technologies could help reach more
accurate fault location results. Intelligent electronic devices (IEDs) including digital
protective relays (DPRs) and digital fault recorders (DFRs), are synchronized to the
GPS clock to tie to the absolute time. Transparent allocation of time and space across
many IEDs in a common infrastructure, which need data integration and information
exchange, is the future trend of monitoring function. Intelligent condition monitoring
has been applied in many technology fields such as clinic, industry, traffic, agriculture
and geography.
With the advancement of communication technology, monitoring based on web has also
been proposed in the last 10 years or so. A distributed intelligent monitoring system
based on 3G network has been proposed in monitoring the health of the railway bridges
[50]. Devices in gas stations for oil products retail network have been monitored by
embedded web [51]. An Extended Neuro Fuzzy System has been integrated into
monitoring system in reference [52]. Information obtained from fault diagnosis and
prognosis integration ensured that the monitoring reliability was improved. Overload
intelligent monitoring for trucks has been proposed in [53]. For clinical area,
Page 56
Smart Grid Technologies and Implementations
38
monitoring system also plays an important part in artificial heart monitoring [54].
Temperature and humidity intelligent monitoring for Chinese medicine via ZigBee
wireless networks has been proposed in [55].
Fig. 3.1 Structure of the integrated approach to condition monitoring and plant
lifetime modeling [46]
3.3 Power System and Smart Grid Monitoring
Since the smart grid been proposed and started to develop in both developed and
developing countries, intelligent monitoring has been paid more attention for smart grid
and power system monitoring. In addition to single equipment condition monitoring
such as transformer health monitoring [46, 47, 56] and distribution insulator monitoring
Signal condition,
data acquisition
Dynamically
evolving database
Data monitoring
layer
Plant physical
model
Interpretation
layer
Knowledge baseCorroboration
layer
Plant lifetime
model and
knowledge
Information layer
User
UHF Sensors
Data streams from
other sensors, control
systems and periodic
measurements
Interpretation
layer
Data monitoring
layer
Page 57
Smart Grid Technologies and Implementations
39
[57], monitoring applications for smart grid technology, for instance, smart grid fault
location [49], commercial electronic device monitoring and wide-area monitoring have
been realized and discussed.
Fig. 3.2 COMMAS architecture [47]
At the early beginning of 21th Century, before the smart grid concept being proposed,
power quality monitoring with intelligent systems had been reported in reference [58].
A critical overview was given in the paper on power quality monitoring with intelligent
technology deployment in the 20th century. The author noticed that the power quality
indicators, which are developed in 1980’s and most of which are inexpensive, could not
provide the accurate data and information to make a decision as several LED indicators
stayed on. Two problems of the indicators were pointed out: firstly, information only
can be collected when the indicators were plugged and communicated with other parts;
secondly, the users do not understand how to deal with the collected information. The
author proposed four characteristics for the intelligent power quality monitoring system.
First of all, data requires to be gathered, including voltages, currents, time and any other
Engineering
Assistant
Agent
Transformer
Diagnosis
Agent
Back-propagation
Neural Network
Agent
Kmeans
Clustering
Agent
C5.0 Rule
Induction
Agent
Feature Vector Extraction Agent
(Extracts relevant statistical features
from the data)
ΔT
Calculation
Agent
Phase
Resolved
Data
Transformer
UHF PD Monitor
Information
Layer
Corroboration
Layer
Interpretation
Layer
Data
Layer
Page 58
Smart Grid Technologies and Implementations
40
parameters. Secondly, data needs to be transferred to a useful location rather than a
power quality indicator on an outlet. Thirdly, other sources of data combination with
power quality are important. Last but not least, data requires converting into
information to take action.
Condition monitoring is a very hot topic in many aspects in power system. Authors in
[59] illustrated agent-based detection architecture for power plant operation and
maintenance monitoring. The proposed architecture is shown in Fig. 3.3. The agents
were classified into 4 categories by functionality, containing data abstraction, data
processing, analysis and presentation and administration. According to the authors,
agents were deployed into power plants to provide the dynamic linking of data source
to data processing functions. Correlation between different measurements would be
learned, knowledge concerning the data and models of plants behaviour would be
improved by continued detection. Comparing with other systems, the proposed
architecture by the authors was flexible, and achieved reusable agent with data
processing abilities, communication and cooperation ability for abnormal detection.
Fig. 3.3 Anomaly detection agent architecture [59]
JADE AMS
JADE DF
CONFIG
Anget
DatabaseData Abstraction
Agent
Data Processing
Agent
Data Processing
Agent
Data Processing
Agent
Charting AgentMonitoring
Agent Anomaly Agent
Analysis and
Presentation
Agent
Administration Agent
Page 59
Smart Grid Technologies and Implementations
41
Since 2010, papers and researches on smart grid have paid attention to intelligent
system monitoring. Some of the last implementations of Power system frequency
monitoring network (FNET) applications on wide-area monitoring systems (WAMS)
were discussed in [60]. Fig. 3.4 shows the building blocks of the FNET system. Widely
installed sensors such as frequency disturbance recorders (FDRs) are collecting and
transmitting phasor measurements from the North American Power grids to a local
client or a remote data centre. In Fig. 3.5, a modularized FNET application system was
demonstrated. Due to its hierarchical framework, any particular element could be
rearranged easily. The applications of FNET system are explored in many fields in
power systems such as dynamic monitoring, stability estimation, real-time control and
smart grid solutions. A wavelet-based method for achieving frequency and voltage
derivatives characteristics was proposed in [61] in order to do disturbance analysis. In
[62], an energy efficient security algorithm was developed for smart grid WAMS. Three
principles were proposed in the paper. First of all, energy consumption is one of the
important considerations. Three factors named energy, security and time need to be
balanced. In addition, encryption algorithms could increase the implementation
efficiency and reduce energy consumptions by code optimization. Lastly, the security
strength of encryption algorithms has close relationship with operation model, key
length and the number of iterations, which could be changed in affecting total energy
consumption.
The next generation monitoring functions were described in reference [63]. The authors
stated that the next generation monitoring functions should offer useful information
rather than raw data to operators. Besides, more data would be required, but it does not
mean more information needed. Advanced visualization techniques are required to help
the operator individually to obtain information efficiently.
In order to achieve the on-line real time monitoring on smart grid, communication
technologies such as local area sensor network, high-resolution meter reading, and
wireless sensor network played a huge role to deliver data and information. However,
new problems would be appeared with the deployment of the wireless communication
networks such as cyber-attack and fault disturbance. Monitoring on smart grid
Page 60
Smart Grid Technologies and Implementations
42
transmission and distribution technologies was discussed and monitoring on equipment
like transformers, wind generators are demonstrated in this period. An overview on
smart grid standards for protection, control, and monitoring applications was made in
reference [64].
Fig. 3.4 Building blocks of the FNET system [60]
Fig. 3.5 FNET application hierarchy and data flow paths [60]
Sensors
Medium and
Clients
Data Centre
Data concentrator
Satellite
FDR1FDR2
FDR
n
Client
Ethernet WANFirewall &Router
Firewall &Router
Firewall & Router
Client
Data Streaming
Data Storage
Non-Realtime
Applications
Realtime
Applications
Realtime Data Sharing
Memory Cache
FNET data
Records
Access
database
Txt Data
Records
Event
Trigger
Oscillation
Trigger
Frequency
Monitoring
Interface
Access
database
Data Concentrator
Real-Time Application
Server
Data Storage Server
Non Real-Time Application Server
Event Location
Oscillation
Modal Analysis
Event
Visualization
Web Service
Page 61
Smart Grid Technologies and Implementations
43
According to the U.S. Department of Energy, Information and Communication
Technology (ICT) is one of the key technologies applying into smart grid. A service-
oriented architecture for Micro-grids (MGs) integration monitoring is proposed in [65].
The core component of the architecture is an MG engine for executing the MG
management functions. A dynamic monitoring and decision systems for enabling
sustainable energy services was proposed in [66]. It also addressed anti-islanding and
reconnecting problems in micro-grids and distributed generation. Authors in reference
[67] found that the use of PMUs need low values of total vector error (TVE). A
specifically developed PMU based on synchron-phasor estimation algorithm was
shown in the paper to meet the requirement in active distribution networks monitoring.
According to the author, the provided information by PMUs could improve the control
and management system in reliability and ease of applications. Also the information
coming from the PMUs appears to have ability in helping distribution system operator
to do decision making when there are critical instances experienced by the system. In
addition, the functionality of phase angle difference measurement at the terminals of
the short cable links could let the implementation of protection algorithm become true.
First Category Second Category Third Category
Motor Washing Machine, Fan,
Mixer
Air Conditioner, Freezer Smoke exhauster, Frequency-
alterable AC, Refrigerator,
Microwave ovens
HR Rice Cooker Rice Cooker Heater, Hair dryer, Cooker
EC NULL PC, TV NULL
Table. 3.1 Application classification list [70]
A non-contact method based on magneto-resistive sensors which involves measuring
emanated magnetic field from a line conductor used to monitor the voltage sag and
electric current in the high-voltage transmission-line in reference [68]. The author
demonstrated the method as applicable, low-cost, non-contact and accurate. The phase
conductor current and line position were determined by measuring the emanated
Page 62
Smart Grid Technologies and Implementations
44
magnetic field from the transmission line. Moreover, a stochastic optimization, which
could enable to handle various line configurations, namely, artificial immunity system
(AIS) is applied to deal with complex scenarios.
Fig. 3.6 Heuristic flow diagram [69]
Besides condition monitoring the grid itself, smart grid monitoring also involves
monitoring the dynamic thermal rating for power system planning and commercial
electronic devices. A novel heuristic, whose flow diagram is illustrated in Fig. 3.6, was
proposed in [69] to identify the quantity and locations of the critical monitoring spans
for the implementation of dynamic thermal rating (DTR). The historical-simulated
weather data was generated by a Mesoscale weather model and the statistical analysis
of the thermal capacities from each span. By comprising tables between the total
number of monitoring stations needed for a given confidence level in each segment and
the one for a given confidence level in the paper, it was noticed that fewer monitoring
was required in the proposed heuristic, and also the proposed heuristic showed better
performance. Reference [70] illustrated a new nonintrusive load monitoring method
(NILM) for residential appliances identification and monitoring. Residential
applications were classified into three categories according to working style shown in
Find first critical span, the
best DTR estimator
Create new monitoring sets
by adding one span at a
time to the k monitoring
set
Select new monitoring set
k+1 adding best span
Keep adding spans until
confidence level is reached
Compute thermal capacity
for each span and the line
Page 63
Smart Grid Technologies and Implementations
45
Table.3.1. Three steps have been done to establish the platform of the appliance
identification. The first step is to identify the event detection with advantages of both
steady-state and transient analysis. The second step is to classify the load categories
into three areas. Finally, general multidimensional linear discriminate with function
feature has been used to make power evaluation. The advantages of the NILM methods
were also discussed by the author. Firstly, there is no need to have study sample
requirement. Secondly, a multifunction meter is applied to the sensor. Thirdly, the non-
working of internal MCU in multifunction meter could achieve a real-time system by
event detector, and no large space is required to store the raw data. Finally, although
under noisy measurements, the NILM was still working. The summarization of
Methods and algorithms that are applying to the smart grid monitoring is shown in
Table.3.2.
3.4 Smart Grid Communication Business and Operation
Smart grid communication technologies are deployed in the entire power systems in
different levels and for different utilizations. From smart grid business and operation
perspective, the communication network is mainly deploying implement technologies
in Advanced Distribution Automation, Feeder automation, Wide-area monitoring and
control, substation automation systems, self-healing technology, distributed generation,
electricity storage, renewable energy and micro-grid operations.
Page 64
Smart Grid Technologies and Implementations
46
Purposes Algorithms, key characteristics, hardware and software
Protection
relays
Allow new power system
problem-solving, cost saving
Microprocessors and intelligent electronic devices
Local area
sensor network
Provide benefits to power
quality, grid efficiency and
health monitoring
Smart meters, Telephone Terminal Unit (TTU) local area
network, IP address, Logging
Cyber
security, fault
detection, and
communication
Facilitate the linear quadratic
Gaussian control of power
system, collect gas flow data,
and detect small leaks and theft.
Discrete-time linear state space model, new locally
optimum method, high-resolution meter reading, Wireless
sensor network,
Smart grid
control centre
Implement parallel
computing infrastructure
Human-centered, comprehensive, proactive coordinated,
self-healing
Distribution
networks
Improve customer
satisfaction, improve the delay
of the network, improve the
control and management
system of the active distribution
network
Proactive approach, quality of Service, a synchrophasor
estimation algorithm for PMU
Transmission
networks
Monitor and optimize the
electric transmission, real-time
monitoring of changes in the
characteristic signature of
electromechanical oscillations
Wireless network based architecture, smart wireless
transformer sensor node, smart controlling station, smart
transmission line sensor node, smart wireless consumer
sensor node, data aggregation and synchronization
algorithm, remote monitoring and control, Rule
Identification Algorithm, Negative Data Oriented
Compensation Algorithm, Magneto-resistive Sensors,
empiricalmode decomposition (EMD) method with masking
technique, and the non-linear Teager-Kaiser energy operator
(TKEO)
Micro grids Integrate MG modeling,
monitoring and control
The service-oriented architectures
Power
quality and
stability
Track the modes of voltage
collapse and identify areas
vulnerable areas
Eigen-decomposition on Thevenin impedance matrix
Table. 3.2 Methods and algorithms applying into the smart grid monitoring
3.4.1 Advanced Distribution Automation
Advanced distribution automation cannot be achieved without widespread
communication deployment from the controllable devices to one control unit at least
[116]. Within distribution system communication deployment, there are three chief
Page 65
Smart Grid Technologies and Implementations
47
categories involving Power Line Carrier (PLC), Landline and wireless [117]. According
to EPRI, PLC works successfully in functionalities of automatic meter reading and load
control applications. However, distribution applications suffer from open circuit
problem when deploy PLC as communication channel [116]. Landline communication
can be classified in two categories, telephone and fiber optics. Telephone lines are
leased, which usually communicate from SCADA to RTU. Fiber optics can work within
high-voltage operating environment because of its dielectric and EMI/RFI noise
immunity, but its price is too high to apply in distribution system. Wireless network as
its communication to anywhere with low costing is the most popular communication
method in distribution automation achievement. Although the public wireless network
such as cellular network will save capital and maintenance cost, security reason is
always a main point for utilities consideration. From the EPRI’s perspective, security
risks can be neglected with deployment of security features like secure socket layers
(SSL), 128-bit encryption and frame relays.
3.4.2 Feeder Automation
Feeder automation includes
A. Fault location, isolation and service restoration
B. Optimal network reconfiguration
C. Planned islanding [118]
3.4.3 Wide-Area Monitoring and Control
Wide-area network can be deployed in both transmission and distribution systems.
WAMS could transmit current and voltage information to the control centre with a very
high rate via applying phasor measurement unit (PMU) on power system. Generally,
phasor data concentrators (PDC) collect data from PMU via wide area networks, and
then, control centre PDC gathered data through system-wide wide area networks. In [5],
three wide area measurement applications with communication network were described
Page 66
Smart Grid Technologies and Implementations
48
in detail. Firstly, power system monitoring involves state estimation, seams between
state estimates and instrument transformer calibration for all-PMU estimators. Secondly,
power system protection includes adaptive dependability and security, monitoring
apparent impedances towards relays characteristics, adaptive out-of-step, and
supervision of back-up zones, adaptive loss-of-field, intelligent load shedding,
intelligent islanding and system-wide implantation, and integration of system integrity
protection schemes. Lastly, power system control contains sustained oscillations, large
oscillations control, remedial action schemes and system restoration.
3.4.4 Substation Automation Systems
A substation automation scheme requires features like control and monitoring of all
substation electrical equipment from a central point, interface to remote SCADA system,
control and monitoring of electrical equipment in a bay locally, status monitoring of all
connected substation automation equipment, system database management, energy
management and condition monitoring of substation electrical equipment such as
switchgear, transformer, relays and IED’s [120]. In order to achieve this, high-
performance communication network with international standard IEC 61850 is required
to connect all IEDs to the substation human-machine interface. Unlike the distribution
automation, the communication for substation automation deployment only deploys
inside the substation to control and monitor the electrical devices.
3.4.5 Self-Healing Technology
The self-healing technology allows processors installed in each component of a
substation like breakers, switches, transformers and busbars to communicate with each
other. Besides, a parallel information connection must be installed in each high voltage
connection to the device, whose parameters, status and analog measurements from
sensors have permanent information. When a new device is added into a substation, the
Page 67
Smart Grid Technologies and Implementations
49
central control computer will update data after received from new device automatically
[121]. Ideally, a self-healing strategy should assure both the frequency and the dynamic
voltage stability, following a contingency [122]. The speed of communication devices
and switching actions will determine the speed of the tripping action in load shedding
scheme when applying self-healing in the real-time implementation [123].
3.4.6 Distributed Generation, Electricity Storage, Renewable Energy and
Micro-Grid Operation
Distributed generation with intended islanding function require communication
infrastructure to make a practical solution [124]. Also, in order to save or shift
electricity consumption, distribution systems with digitally controlled power
electronics, which form grid interface of the distributed power system elements like
distributed generation and storage, and many controllable loads, could evolve more
when a suitable communication infrastructure is present [125].
3.5 Co-Simulation and Power-Communication Integration
It is known that the advanced communication network will evolve power systems into
a new level. However, the traditional power system simulation tools cannot meet the
demand of such increasing research requirements. Co-simulations and technology
integration need to be added into simulators in order to research on impact of power
systems when deployed smart grid technologies. In reference [126], the authors listed
the communication standards and protocols according to different applications.
Although each application is related to energy and power, not all of them need to co-
simulate with power systems. The following table lists the applications and its standard
and protocols for smart grids. Besides, applications with co-simulation requirements
are marked in Table.5.1.
Page 68
Smart Grid Technologies and Implementations
50
Applications Standards and Protocols Co-simulation or Not Objects
Energy Management
Systems
IEC61970 and IEC61969 No Consumer, Power
Company
Substation Automation IEC61850 Yes Power Company
Inter-Control Centre
Communications
IEC60870-6/TASE.2 Yes Power Company
Cyber Security IEC62351 Part 1-8 Yes Power Company
Industrial Automation ISA100.11a No Consumer
Dynamic Pricing and
Demand Responds
OpenADR Yes Consumer,
Government
Customer-Side
Applications
IEEE P2030, BACnet, Yes Consumer
Advanced Metering
Infrastructure (AMI)
ANSI C12.22, ANSI
C12.18, ANSI C12.19, ITU-
T G.9955, G.9956, M-Bus,
PRIME, and G3-PLC
No Power Company
In-Home Multimedia,
Home Area Network
(HAN)
IEEE P1901, Home Plug
Green PHY, U-SNAP, and
Z-Wave
No Consumer
Electric Vehicle SAE J2293, SAE J2836,
SAE J2847
Yes Consumer, Power
Company,
Government
Table. 3.3 Smart Grid Standard and Co-simulation
Those applications without co-simulation also have closed relationships with power
systems, but not as critical as co-simulation ones. Different organizations or groups of
people consider smart grid from different aspects according to different objectives. For
example, government would like to know the impact to the society when applying smart
grid technologies, such as carbon emission deductions, blackout reductions, and policy
making etc. the power delivery company cares about the profits from smart grid
technologies, investment and benefits and so on. While the consumers concern the bills
and price drop by applying distribution generations, smart applicants and energy-saving
lamps. These smart grid applications need to be considered from different aspects to
feed the requirements for different groups of people.
Technologies integration includes demand side management integration, distributed
generation integration, renewable energy sources integration and energy storage
Integration etc. [127]. To deploy these technologies, communication network and
Page 69
Smart Grid Technologies and Implementations
51
monitoring systems are the essential parts to achieve all kinds of operation modes and
to improve power system reliability. Although some of the issues do not need to co-
simulate by combining the communication and power system together, the impacts of
the technologies require the integration with the power systems.
Whether an objective issue needs co-simulation or not depends on the time scale, real
time or off-line. The time scale of wide area monitoring and control scheme is very
critical, which makes its communication scheme to deliver and deal with information
urgently. Whereas, the time scale for generation dispatch is few minutes, which is not
as short as wide-area or protection scheme.
In reference [128], the authors reviewed integrated power system and communication
network simulators and applications. After that, the authors proposed their own co-
simulation method “GECO” which with combines PSLF and NS2 together. Reference
[129] studied IEEE P2030 to build a communication and power system co-simulation
environment by linking OMNet++ with OpenDSS. The case involved in the paper is to
control plug-in electric vehicles to reduce critical voltage durations. Since 2006, a
simulation engine called “EPOCHS” which combines PSCAD/EMTDC, PSLF and
NS2 have been proposed to demonstrate electric power scenarios with communication
issues and protection problems [130]. So far, the co-simulation has been applied to
achieve 4 objectives: Dynamic simulation for WAMS applications [128, 130-132],
remotely controlled power devices [133, 134], general network controlled system [135]
and SCADA cyber security [136, 137].
Time Scales Business and Operations
Milliseconds Protection
Few Seconds Transient
1 minute Electric Vehicles and Device Control
Few minutes Power Dispatch
Minutes to hours Blackout and Contingency
1 Day Unit Commitment
Table. 3.4 Business and Operations and time scales
Page 70
Smart Grid Technologies and Implementations
52
Table. 3.4 illustrates the Business and operation durations of a power system. Although
the communication network is covered the whole power system to build so called
“Smart grid”, only the power system business and operations with short time scale, for
instance, protections and transient, need co-simulate with communication networks.
3.6 Conclusion
A critical overview on smart grid monitoring and intelligent monitoring system was
given in this chapter. Algorithms and mechanisms which may be applied into the
monitoring systems have been discussed. To maximize the benefit of asset management,
it is essential to fully utilize resources and an efficient and reliable monitoring system
for smart grid technology deployment. Also the fully utilization of information is one
of the main strategies to take the full benefits of smart grid and promote its acceptance.
Another contribution of this chapter is that a reasonable method for achieving power
system and communication co-simulation by taking into account real-life power system
business and operation is proposed. In the smart grid, the information and
communication technology play a very critical role; however, there are many
limitations of the current power system on combining with communication system. It
is necessary to develop a smart grid and communication co-simulation simulator for
further research.
Page 71
Smart Grid Technologies and Implementations
53
Chapter 4
Smart Grid Load Forecasting by Artificial
Neural Network
4.1 Introduction
The Forecasting technologies are vitally beneficial to the power system and smart grid
in many aspects like load forecasting, wind generation forecasting, dynamic price
forecasting. As an essential part in the smart grid, high accuracy of the load forecasting
is required to give the exact information about the power purchasing and generation
[71] in electricity market, prevent more energy from wasting and abusing and making
the electricity price in a reasonable range. Besides, accurate load forecasting can
improve power stability to a certain degree by further actions like unit commitment,
power dispatching and load shedding.
Load forecasting could be classified into three categories according to different time
duration, namely, short-term load forecasting, medium-term load forecasting and long-
term load forecasting. Short-term load forecasting basically predict a period from
minutes level to a week, while medium-term load forecasting and long-term load
forecasting generally considers from one week to one year ahead, and longer than one
year but up to 10 years respectively. Load forecasting is associated with multiple factors
such as season differences, climate changes, working days or weekends and holidays,
disasters and political reasons, operation scenarios of the power plants and faults
occurring on the networks which lead to changes of the load demand and generations
[72].
Different load forecasting has differences in its purpose of decision making, even in
factors consideration. Short-term load forecasting usually aims to achieve a better plan
Page 72
Smart Grid Technologies and Implementations
54
for electricity production in order to minimise energy & money wasting and reduce
greenhouse emissions. The factors for short-term load forecasting consideration are
usually time, weather and human behaviours. Medium-term load forecasting is used in
maintenance scheduling, and to plan for outages and major works in the power system
[73]. Medium-term load forecasting considers growth factors like main events, addition
of new loads, seasonal variations, demand patterns of large facilities, and maintenance
requirements of large consumers [73]. While long-term load forecasting is important
for energy system planning and determine peak load in next few years and may focus
on the factors like economic variation which may affect power consumptions, Fig. 4.1
presents an example of day ahead load forecasting.
Fig. 4.1 Load forecasting on December 10, 2013 for Canadian Ontario Demand by
IESO [74]
Many ways such as Expert Systems, Grey System Theory, and Artificial Neural
Network (ANN) and so on are employed into load forecasting. Since 1990, the artificial
neural network (ANN) has been researched to apply into forecasting the load [71].
Owing to the transcendent characteristics, ANNs is one of the most competent methods
to do the practical works like load forecasting.
This Chapter intends to illustrate the representation of the Artificial Neural Network
Page 73
Smart Grid Technologies and Implementations
55
applied in load forecast based on practical situation in Ontario Province, Canada, and
concerns about the behaviours of artificial neural network in load forecasting. Historical
data of power consumption from 2007 to 2009 will be applied to the simulation.
Analysis of the multi-influencing factors like weather conditions, and weekdays or
weekends which are affecting the load demand in Ontario, Canada will be made to give
an effective way for load forecasting.
4.2 Introduction to Artificial Neural Network (ANN)
Artificial Neural Network is inspired by Biological Neural Networks (Appendix I).
Extending the characteristic of the biological neurons, the key features of the processing
elements of artificial neural networks are:
1. the processing element receives many signals
2. Signals may be modified by a weight at the receiving synapse.
3. The processing element sums the weighted inputs
4. Under appropriate circumstances (sufficient input), the neuron transmits a single
output
5. The output from a particular neuron may go to many other neurons (the axon
branches)
6. Information processing is local (although other means of transmission, such as the
action of hormones, may suggest means of overall process control).
7. Memory is distributed:
a. Long-term memory resides in the neurons' synapses or weights.
b. Short-term memory corresponds to the signals sent by the neurons.
8. A synapse's strength may be modified by experience.
9. Neurotransmitters for synapses may be excitatory or inhibitory [78].
According to the features illustrated above, neuron working procedure can be abstracted
as Fig. 4.2. In Fig. 4.2, x1 to xn are signals received from other neurons. These signals
pass to neuron body cell with added weights w1 to wn respectively. After a
summarization and processing function, an output y is generated.
Page 74
Smart Grid Technologies and Implementations
56
Fig. 4.2 Neuron working procedure
Since its transcendent characteristics and capability of dealing with non-linear problems,
artificial neural networks has been widely applied into various research fields and areas
such as signal processing, control, pattern recognition, medicine, speech production,
speech recognition, business.
Because the outstanding characteristic of the statistical and modeling capabilities, ANN
could deal with non-linear and complex problems in terms of classification. As the
problem defined, the relationship between the input and target is non-linear and very
complicated. ANN is an appropriate method to apply into the problem to forecast the
load situation.
4.3 Perceptron
4.3.1 Perceptron Model
The theory of perceptron is regarded that was first introduced by Frank Rosenblatt in
1958. Typically, a perceptron consisted of three layers, namely, sensory (or input) units,
associate units and a response (or output) unit. The sensory layer is connected to
associate layer via paths with fixed weights. A bias representing as the threshold value
····
Σ
f(Σ)
ω1
ω2
ω3
ωn-1
ωn
y
x1
x2
x3
xn-1
xn
Dendrite Neuron Body
CellAxon
Page 75
Smart Grid Technologies and Implementations
57
simply can be treated as any other weight, and can be adjustable, but with a unit
activation is always 1. A typical Perceptron neuron model is showing in Fig. 4.3. A
summarization is made with all inputs with their weights including bias b, goes through
the activation function f. Generally, the output is a function of the sum of bias and
weight multiplied by the input. The activation function could be any kinds of functions.
However, the generated output is different.
Fig. 4.3 Perceptron neuron model
The relationship between output and input in perceptron model can be expressed in
Equation 4.1 in terms of Fig. 4.3 above.
(4.1)
4.3.2 Activation Functions
Activation function is one of the key factors for determining the behaviours of a neuron.
Non-linear functions are popular in neural network applications. The output value of
activation functions is limited by an upper and a bottom value. Four activation functions
are introduced below.
····
Σ
f(Σ)
ω1
ω2
ω3
ωn-1
ωn
y
x1
x2
x3
xn-1
xn b
Perceptron Neuron
Sensory Layer Associate Layer Response Layer
1
( )n
i i
i
y f x b
Page 76
Smart Grid Technologies and Implementations
58
1. Identity linear function
Identity linear function is illustrated in Fig. 4.4, which also can be written as
Equation 4.2. Identity linear function usually applied in Back propagation algorithm,
which will be introduced in Equation 4.4.
(4.2)
Fig. 4.4 Identity linear function for activation function
2. Binary step function
The output of binary step function is either 1 or 0. When the net input is less than
the threshold, the output is 0; when the net input is greater than the threshold, the
output is 1. This function is usually applied in single layer perceptron network.
(4.3)
Where α is threshold. Fig. 4.5 gives binary step functions with threshold equals to
-1 (blue), 0 (green), and 1(red).
(x) xf
1,(x)
0,
xf
x
Page 77
Smart Grid Technologies and Implementations
59
Fig. 4.5 Binary Step function for activation function
3. Binary sigmoid function
Another common and useful logistic function is sigmoid function. As the feature of
differentiable and the capability of reducing training computational burden, sigmoid
function is beneficial for applying to back propagation training algorithms.
(4.4)
Where α is steepness parameters. Sigmoid functions with steepness parameter α
equals to 1 (red), 2 (green), 3(blue) are showing in Fig. 4.6. The output range of a
sigmoid function is limited from 0 to 1.
Fig. 4.6 Binary Sigmoid function for activation function
4. Bipolar Sigmoid
For given problem with the function output limited from -1 to 1, bipolar sigmoid is
another common activation function for neuron network. The function equation can
be represented as following in Equation 4.5.
1(x)
1 xf
e
Page 78
Smart Grid Technologies and Implementations
60
(4.5)
Where α is steepness parameters. Bipolar sigmoid functions with steepness
parameter α equals to 1 (red), 2 (green), 3(blue) are showing in Fig. 4.7. The output
range of a sigmoid function is limited from 0 to 1.
Fig. 4.7 Bipolar Sigmoid function for activation function
4.3.3 Multi-Layer Perceptron (MLP)
In general, at least one hidden layer before the output layer is needed to form a feed-
forward network. Fig. 4.8 depicts a MLP’s architecture with three types of layers (input
layer, hidden layers and output layer). Perceptron neurons are existed in hidden layers
and output layers. The dimension of the input vector in a neural network determines the
amount of neurons in input layer. Between each adjacent layer, the outputs from the
neuron in the layer ahead to the neurons in the rear layer are multiplied by synaptic
weights, which play a key role in neural network training. The amount of hidden layers
and the number of neurons in each hidden layer are able to change according to users’
willingness. Usually, three-layer network is selected as the architecture for program
training, because this kind of architecture can approximate any function with a few
discontinuities [80]. The amount of neurons in output layer is affected by the output
vectors which are also determined by users.
1(x)
1
x
x
ef
e
Page 79
Smart Grid Technologies and Implementations
61
Fig. 4.8 Architecture of Multi-layer perceptron feed-forward network
4.4 Back-Propagation Training
To date, Back propagation is widely used in neural networks, which is a feed-forward
network with continuously valued functions and supervised learning [77]. It can match
the input data and corresponding output in an appropriate way to approach a certain
function which is used for achieving an expected goal with some previous data in the
same manner of the input.
There are two types of training methods named supervised training and unsupervised
training. Supervised training is usually accomplished by presenting a sequence of
training vectors, or patterns, each with an associated target output vector. The weights
are then adjusted according to a learning algorithm. While in the unsupervised training,
neural nets are self-organized and group similar input vectors together without the use
of training data to specify what a typical member of each group looks like or to which
group each vector belongs. A sequence of input vectors is provided, but no target
vectors are specified [78]. In other words, supervised learning has a training target to
guide a learning system to approach a preferred output, while unsupervised learning
does not have such a target.
····
x1
x2
x3
xn-1
xn
Multi-Layer Perceptron
Input Layer Hidden Layers Output Layer
···
···
···
···
···
y1
yp-1
yp
Page 80
Smart Grid Technologies and Implementations
62
4.4.1 Gradient Descent and delta learning rule
Gradient descent learning attempts to minimize an error function by finding an
optimized point in some parameter space. It is a first-order optimization algorithm to
find the minimum of a function with taking proportional to the negative of the gradient.
This method can be introduced in Equation 4.6.
(4.6)
Where η is the learning step size.
Delta learning rule is a learning method for updating neural network weights by
implementing a gradient descent and moving the weight vector from the point on the
surface of the parabolic down toward the lowest point [81-82].
4.4.2 Back-Propagation Theory
Back-Propagation is a learning method by generalizing the delta rule. Generally, the
back-propagation training contains three stages:
1. Input feed-forwarding
2. Error propagating
3. Weight updating
In the input Feed-forwarding stage, the input signal is broadcasted to the hidden layer
via input unit, then activation is calculated in hidden layer and the signal is sent to
output unit, finally the output unit calculates the activation and generates the temporary
output as a response to the input signal. In the Error propagation stage, the error between
target and temporary output generated in input feed-forwarding stage is compared and
generating relative factors based on the error, then the factors are distributed from
output layer to input layer (Fig. 4.9). In the weight updating stage, weights are updated
according to the factors generated in the error propagating stage.
1n n n nx x f x
Page 81
Smart Grid Technologies and Implementations
63
Fig. 4.9 Feed-forward and back-propagation
····
x1
x2
x3
xi-1
xi
Input Layer i Hidden Layers j Output Layer p
···
···
y1
yp-1
ypωij ωjp
Fig. 4.10 Three-layer Network
Assume the training set X = [X1, X2, …, XN] contains N groups of input vectors. In each
input vector Xk= [xk1, xk2, …, xkI], (k=1,2,…,N). I is elements number, which is the same
as neurons’ number in input layer i. The actual output corresponding to the kth input
vector is Yk = [yk1, yk2, …, ykI], the same as the model’s output number. The expected
output corresponding to the kth input vector, so-call target, is tk=[tk1, tk2, …, tkp].
Assume the training process is at the nth epoch.
The function that wished to be achieved minimum is batch training average error Eav in
Input side Output side
Feed-
forward
Back-
propagation
Page 82
Smart Grid Technologies and Implementations
64
equation 4.7.
)()(
)(2
1)(
)(1
)(
1
2
1
nytne
nenE
nEN
nE
kpkpkp
P
p
kpk
N
k
kav
(4.7)
For the kth input vector from training input set:
ekp is the error between target and actual output at the pth element in the output
vector at the nth iteration.
Ek is the Least Mean Square error between the whole target vector and the output
vector corresponding to the kth input vector at the nth iteration.
Eav is the target function whose minimum is interested. It is the batch learning
error considering the errors corresponding to all the training input vectors at the
nth iteration.
Due to the Delta rule, the weights updating obeys relationship in Equation 4.8.
jp
avjpjpjpjp
ij
avijijijij
nEnnnn
nEnnnn
)()()()()1(
)()()()()1(
(4.8)
Where
ωij is the weight between the ith input element and the jth neuron in the hidden
layer.
ωjp is the weight between the jth neuron in hidden layer and the pth neuron in the
output layer.
The whole Equation 4.8 reveals that the variation direction of the weights is
towards the negative gradient and the step length is controlled by a parameter ε.
Forward Calculation
For batch learning, the whole training input set is passed to the ANN in every epoch.
At the nth epoch, when the kth input vector arrives at the input layer, forward calculation
Page 83
Smart Grid Technologies and Implementations
65
of the ANN model is shown in Equation 4.9.
)()(
))()(())(()()()()(
))(())(()()()(
11
11
nny
nnfnufnnnnu
xnfnufnxnnu
kpkp
J
j
kjjppkppkp
J
j
kjjpkp
I
i
kiijjkjjkj
I
i
kiijkj
(4.9)
Equation 4.9 description: this is the forward calculation corresponding to the kth input
vector at the nth epoch.
xki is the ith element in the input vector.
ωij is the weight between the ith neuron in input layer i and the jth neuron in
hidden layer j; ωjp is the weight between the jth neuron in hidden layer j and the
pth neuron in output layer p.
ukj is the input of the jth neuron in hidden layer j, which is achieved by the sum
of all the output in the previous layer multiplied with their weights; ukp is the
input of the pth neuron in output layer p.
vkj is the output of the jth neuron in hidden layer j; vkp is the output of the pth
neuron in output layer p; ykp is the pth element in the output vector.
fj is the activation function in the hidden layer j; fp is the activation function in
the output layer p.
Error Propagation
To look backward from the output side in Fig. 4.10, weights between the hidden layer
j and the output layer p are firstly updated. Considering Equation 4.8, the variation of
weights is determined by the negative gradient and a small length step controlling
variable ε as Delta-rule revealed in Equation 4.10.
jp
avjp
nEn
)()(
(4.10)
With Equation 4.7:
Page 84
Smart Grid Technologies and Implementations
66
jp
kp
kp
kp
kp
kp
kp
k
jp
k
N
k jp
k
jp
av
nu
u
ny
y
ne
e
nEnE
nE
N
nE
)()()()()(
)(1)(
1
(4.11)
Consider Equations 4.11 with 4.7 and 4.9, the second equation in Equation 4.11 could
be solved in Equation 4.12.
)()(
));(()(
;1)(
);()( ' n
nunuf
u
ny
y
nene
e
nEkj
jp
kp
kpp
kp
kp
kp
kp
kp
kp
k
(4.12)
In Equation 4.12, f ’p is the differentiation of fp in Equation 4.9. With Equations 4.11
and 4.12, the variation Δωjp could be calculated:
jp
avjp
N
k
kjkp
jp
av
kppkpkp
kjkppkp
jp
k
nEn
nnN
nE
nufnen
nnufnenE
)()(
)()(1)(
))(()()(
)())(()()(
1
'
'
(4.13)
When weights between output layer p and hidden layer j finish their updates,
propagation procedure updates the weights between hidden layer j and input layer i.
The variation of weights is still from Equation 4.8.
ij
avij
nEn
)()(
(4.14)
Consider Equations 4.14, 4.7 and 4.9:
kikjj
kp
k
ij
ki
kj
kj
kp
k
ij
k
N
k ij
k
ij
av
xnufnEnu
u
nnEnE
nE
N
nE
))(()()()()()(
)(1)(
'
1
(4.15)
Consider Equations 4.7 and 4.15
Page 85
Smart Grid Technologies and Implementations
67
])()(
)([)(
)()(
11 kp
kp
kp
kpP
p
kp
kp
kpP
p
kp
kp
knu
u
nene
nene
nE
(4.16)
With Equation 4.9, the two partial differentiations in Equation 4.16 could be revised in
4.17:
)()(
))(()(
'
nnu
nufu
ne
jp
kj
kp
kpp
kp
kp
(4.17)
With Equations 4.15, 4.16, 4.17 and 4.13, the variation Δωij could be calculated in
Equation 4.18.
ij
avij
P
p
jpkpkjjkj
kikj
ij
k
nEn
nnnufn
xnnE
)()(
))()(())(()(
)()(
1
'
(4.18)
Batch Training Procedure
The batch training procedure can be presented in steps as follows:
Step 1. Initialize all the weights into non-zero random value.
Step 2. Use Forward Calculation to calculate the Eav in Equation 4.3. Compare
Eav and the error acceptable limit, goal. If Eav is larger than the goal, turn to Step 3.
Otherwise turn to Step 5.
Step 3. Compare the iteration number n to its limit. If n is larger, turn to Step 5.
Otherwise turn to Step 4.
Step 4. Use Error Propagation to calculate all )1( nij
and)1( njp
to update
weights. Then turn to Step 2.
Step 5. Output the trained network and finish training.
Fig. 4.11 gives a brief flowchart of the procedure.
Page 86
Smart Grid Technologies and Implementations
68
Fig. 4.11 Procedure of Batch Training
4.4.3 Quasi-Newton Algorithm
Quasi-Newton Algorithm is firstly proposed by William C. Davidson in 1959. It is an
optimization method which is based on Newton’s Method to seek the point of a function
with 0 gradient, and find the local minimum and maximum value of the function.
Considering ANN network in Fig. 4.10, target function for ANN is the error function
Eav in Equation 4.3. For Quasi-Newton Algorithm, its expression could be re-written as
Equation 4.19.
),,,,,,,()( 12111211
njp
JP
njpnjpnij
IJ
nijnij
avnav EWE (4.19)
As from Equations 4.7 and 4.9, the target function is the function for all the weights
between layers. So Eav could be rewritten as Equation 4.19. Wn is a vector whose
elements are all the weights in ANN model. For each element of Wn, for instance, ,
Initialize the
Weights
Feed-
forwarding
stage
Eav(n) > goal
N > Limit
Error back-
propagating
and weights
updating
End
Start
No
Yes
Yes
No
11
ij n
Page 87
Smart Grid Technologies and Implementations
69
stands for the weight between the first neuron in the ith layer and the first neuron in the
jth layer at the nth iteration.
Expressed by Taylor Series, the target error is given in Equation 4.20:
nn
T
nn
T
navnavnnav
nnn
WHWWWEWEWWE
WWW
2
1)()()(
1
(4.20)
In Equation 4.18,
Hn is the Hessian matrix of the target function.
av nE (W ) is the error gradient, which contains all the partial differentiation of
each weight.
ΔWn is weights variation vector.
Take the gradient of Equation 4.20. For achieving stationary point at Wn+1 = Wn +ΔWn,
the gradient of stationary point Eav (Wn +ΔWn) is zero, the weights variation vector
could be revealed in Equation 4.21 [79].
)(
)()(01
navnn
nnnavnnav
WEHW
WHWEWWE
(4.21)
The Quasi-Newton Algorithm in ANN is trying to find the weights variance by the
Hessian matrix and the target function gradient satisfying Equation 4.21.
Compare to the typical BP method introduced in Section 4.4, the weights variation
expression contains one more Hessian matrix. Due to complex calculation will be
processed for Hessian matrix, BFGS method offers an approximation calculation to the
Hessian matrix, which is recognized as a modification of Quasi-Newton Algorithm.
Equation 4.22 introduces the Hessian matrix approximation by BFGS method [79].
nn
T
n
T
nnnn
n
T
n
T
nnnn
navnavn
WHW
WHWH
Wz
WzHH
WEWEz
)(
)()(
1
1
(4.22)
With Quasi-Newton Algorithm, by BFGS modification in Equations 4.13, 4.18, 4.21,
and 4.22, the weights variance at each epochs could be calculated for training.
Page 88
Smart Grid Technologies and Implementations
70
4.4.4 Levenberg-Marquardt (LM) Algorithm
Levenberg-Marquardt algorithm is a local optimization method to solve non-linear least
square problems by improving Gauss-Newton and gradient descent method. As given
by the target function in Equation 4.11, (
2
1 1
))((2
1)(
N
k
P
p
n
n
kpnav WeN
WE
) is the sum of
squares, LM method proposes another expression of gradient in Equation 4.23.
eJN
WE
WeWe
N
WE
Tn
enav
N
k
P
p ij
n
n
kp
n
n
kp
ij
nav
1)(
)()(
1)(
1 1
(4.23)
Where:
)( n
n
kp We is the re-write form of ekp(n) in Equation 4.3. k, p, n have the same
meaning as in Equation 4.7.
e is the error vector whose elements are all the )( n
n
kp We.
n
eJ is the Jacobian matrix for the error vector
e , respecting to the weights
vector Wn at the nth iteration.
For jp
nav WE
)(
, the expression is only to use ωjp to take the place of ωij.
New approximation of Hessian matrix is also given in Equation 4.24 by ignoring second
order partial derivative and adding a non-negative damping factor μ [79].
)(1
IJJN
H n
e
Tn
en (4.24)
Where μ is the damping factor influencing the convergence speed, it changes until the
step is a decrease step for target function.
From Equations 4.21 4.23 and 4.24, the weights variance of ANN by LM algorithm is
given in Equation 4.25.
Page 89
Smart Grid Technologies and Implementations
71
eJIJJWTn
e
n
e
Tn
en )( (4.25)
4.4.5 Load Forecasting implemented by Back-Propagation Training
Artificial Neural Network is implemented in load forecasting to map influencing factors
including weather conditions, day type, demand of the previous point, and time point
index in a time period with the training target, which is the demand at the same time.
Architecture for load forecasting is given in Fig. 4.12.
Fig. 4.12 Architecture for load forecasting
Weather conditions make human feel different in comfort level and may change the
human behaviours to utilize the load accordingly. 7 factors stimulus human comfort are:
• Temperature
• Dew Point Temperature
• Relative Humidity
• Wind Speed
• Visibility
• Atmosphere Pressure
Weather
Condition
Day Type
Demand of the
Previous Point
Time Point
Index
DemandANN Model
MappingInfluencing Factors Target
Page 90
Smart Grid Technologies and Implementations
72
• Weather Status
The 6 factors in front are the exact values of weather conditions, while the last one is
the fuzzy data to describe the weather like. Weather status is including 6 indices:
• Clarity Index (0, 0.5, 1)
• Cloud Index (0, 0.5, 1)
• Fog Index (0, 0.5, 1)
• Rain Index (0, 0.25, 0.5, 0.75,1)
• Thunder and Lighting Index (0, 0.5, 1)
• Snow Index (0, 0.3, 0.6, 1)
As can be seen in the indices listed above, the value of each index is between 0 and 1,
which indicate the intensity of the index. For instance, 0 in fog index means no fog in
the day, while 1 means the day is very foggy.
Fig. 4.13 reveals the population density of Ontario, Canada in 2006. The population is
centralized in east and south part of the entire province. Weather conditions may differ
between cities. Thus, cities in different locations are selected for weather data
acquisition. In this chapter, three cities located in Thunder Bay, Timmins, and Toronto
are selected for weather data acquisition. All weather data are obtained from Weather
Office of Canada, the predecessor of Environment Canada [83].
Fig. 4.13 Population density of Ontario, Canada in 2006 [84]
Thunder Bay
Timmins
Toronto
Page 91
Smart Grid Technologies and Implementations
73
4.4.6 Indices for Performance Measurement and Comparison
The network is required to check whether it can achieve the expectation after training.
Another set of input vectors and demand scenarios are needed to test the network.
Comparison needs to be made to check out the difference between the test output and
real demand. Two Indices are introduced here for performance measurement and
comparison, Root Mean Squared Error (RMSE) and Mean Absolute Percentage Error
(MAPE).
RMSE is an index to qualify the error between predicted demand and demand in reality.
The equation can be written as in Equation 4.7
(4.7)
Where n is total number of predicted outputs, Outputi is the output value of ith data and
Targeti is the corresponding target value of ith data.
MAPE is an index to qualify the error between predicted demand and demand in reality
with percentage to the demand in reality. The equation can be written as in Equation
4.8.
(4.8)
Where Targetmean is the mean value of all target values.
According to Equation 4.9, the performance of training by back-propagation neural
network is determined by 4 factors:
• Architecture: the amount of neurons in the hidden layer of an ANN
• Learning rate: Learning step size
• Goal: Margin of error
• Epoch: The maximum number of batch training iteration
4.5 Load Forecasting by ANN
3 years hourly data from Nov 11th, 2005 to Oct 31st, 2008, was applied to this simulation
for training the network. Comparison between the prediction and the target is made with
2
1 i ii
nOutput Targe
En
tMS
1
1 ni i
i mean
Target OutputMAPE
n Target
Page 92
Smart Grid Technologies and Implementations
74
the data from Nov 11th, 2008 to Oct 31st, 2009 for analyzing. 15% of training data is cut
out as validation set for early stopping against over-fitting.
4.5.1 ANN Trained by Delta-Rule
To compare the performance of different ANN architectures, the goal of each
architecture is set to 0.0001 uniformly. As different architecture has different best epoch
limit and learning rate, here epoch is limited to 300 for each architecture. The training
performances of different architectures with 5, 10, 20, 50, 100 neurons in the hidden
layers are listed in Table 4.1.
Each network has been trained 10 times to find out the best learning rate. After the best
learning rate was found, the networks are trained with different initial weights by back
propagation algorithm. The training performance is demonstrated by 3 indices, which
are Average training RMSE, Average CPU Time, and Average MAPE. Average train
RMSE is the average value of mean squared error of the 10 times training. Average
CPU time is the average value of CPU processing time of 10 times training. Average
MAPE is the average value of the Mean absolute percentage error by 10 times training.
Comparing the training performances in Table 4.1, Network architecture with 20
neurons in its hidden layer is with the lowest Ave Train RMSE and Ave MAPE, which
are 0.0059 and 11.18% respectively.
Fig. 4.14 gives another view of training performance with different architectures.
Obviously, the overall trend of the indices MAPE and RMSE is decreased with the
number of neurons increased and keep steady to some extent. Whereas the CPU time is
extremely increased with increasing in the number of neurons. Synthesize every index,
20 neurons in the hidden layer is the best option to provide a relative better performance
with less time. One of the load forecasting results of training performance samples with
20 neurons in hidden layer is shown in Table.4.2.
Page 93
Smart Grid Technologies and Implementations
75
Network Architecture
(neurons in hidden layer)
Network Training Parameter Training Performance
5
Goal: 0.0001; Ave Train RMSE: 0.0109
Epoch Limit: 300 Ave CPU Time: 200.1066s
Best Learning Rate: 0.05 Ave MAPE: 16.36%
10
Goal: 0.0001; Ave Train RMSE:0.0080
Epoch Limit: 300 Ave CPU Time:261.4057s
Best Learning Rate: 0.055 Ave MAPE: 13.99%
20
Goal: 0.0001; Ave Train RMSE:0.0059
Epoch Limit: 300 Ave CPU Time:284.7701s
Best Learning Rate: 1 Ave MAPE: 11.18%
50
Goal: 0.0001; Ave Train RMSE:0.0093
Epoch Limit: 300 Ave CPU Time:420.6352s
Best Learning Rate: 0.35 Ave MAPE: 11.97%
100
Goal: 0.0001; Ave Train RMSE:0.0091
Epoch Limit: 300 Ave CPU Time:447.6930
Best Learning Rate: 0.35 Ave MAPE: 11.15%
Table. 4.1 ANN Training performances with different architectures
Fig. 4.14 Measurement indices with different neuron number
Page 94
Smart Grid Technologies and Implementations
76
Network
Architecture
Network Training Parameter Training Performance
20
Goal: 0.0001; Train RMSE: 0.00081077
Training Epoch: 2000 CPU Time: 1695.3s
Best Learning Rate: 1 MAPE: 5.47%
Sample Training
Process
Sample
Compare
Between Target
and Prediction
of Test
Data
Table. 4.2 Load forecasting by an ANN, Delta-rule training with 20 neurons in hidden
layer
4.5.2 ANN Trained by Quasi-Newton
Same as the steps in 4.5.1, ANN Trained by Quasi-Newton is applied as the load
forecasting algorithm. The training performances of different architectures with 5, 10,
20, 50, 100 neurons in the hidden layers are listed in Table 4.3.
In Table 4.3, both of two indices, MAPE and MSE decreased slightly with the amount
of neuron increased from 5 to 50 in the hidden layer. However, the CPU calculation
time increased dramatically by approximately a hundredfold from 626.43s to 66775s.
There is no doubt that the result with 50 neurons in the hidden layer is the best choice
0 200 400 600 800 1000 1200 1400 1600 1800 20000
0.002
0.004
0.006
0.008
0.01
0.012
0.014
0.016
0.018
0.02
Epochs
MS
E
Feb 9th 2009 Feb 10th 2009 Feb 11th 20091.3
1.4
1.5
1.6
1.7
1.8
1.9
2
2.1x 10
4
MW
Prediction
Target
Page 95
Smart Grid Technologies and Implementations
77
without considering the impact of CPU running time.
Network Architecture
(neurons in hidden layer)
Average Training Performance
5
Goal: 5101
Ave Training MSE:
1.23410
Ave Training CPU Time:
626.43s
Ave MAPE (%): 1.55 Ave Largest (%): 11.34
Ave APE STD (%): 1.21 Ave Largest (MW): 1470
10
Goal: 5101
Ave Training MSE:
1.03410
Ave Training CPU Time:
805.07
Ave MAPE (%):1.53 Ave Largest (%): 12.49
Ave APE STD (%):1.28 Ave Largest (MW): 1450
20
Goal: 5101
Ave Training MSE:
0.87410
Ave Training CPU Time:
3056s
Ave MAPE (%):1.52 Ave Largest (%): 14.61
Ave APE STD (%):1.32 Ave Largest (MW): 1665
50
Goal: 5101
Ave Training MSE:
0.55410
Ave Training CPU Time:
66775s
Ave MAPE (%):1.39 Ave Largest (%): 15.23
Ave APE STD (%):1.34 Ave Largest (MW): 1784
Table. 4.3 ANN architecture selection for load forecast with Quasi-Newton (BFGS)
Method
Some of the utilities do not only use MAPE as the index to indicate the error distance
between real demand and prediction, but also introduce indices like Ave Largest and
Ave APE STD. Ave Largest index indicates the average largest percentage error of a
certain network type, it can be a percentage or an absolute value. Ave APE STD stands
for Standard deviation for absolute percentage error (APE), which indicates the error
variation of a certain network type. Although MAPE and MSE decreased, the indices
Ave Largest and Ave APE STD are increased which means the performance becomes
unstable when the ANN architecture increases the complexity. This is due to the more
complex architecture brings more capability for ANN to store redundancy, which is
generated by training without representing the set sufficiently and uniformly.
In this case, 20 neurons were selected, which averagely spend 3056s on running the
algorithm. A sample result is shown in Table 4.4 below:
Page 96
Smart Grid Technologies and Implementations
78
Network
Architecture
Network Training Parameter Training Performance
20
Goal: 5101 ; Train MSE:
51074.7
Training Epoch: 591 CPU Time: 4716.3s
Ave MAPE: 1.25%
Sample
Training
Process
Sample
Compare
Between Target
and Prediction
of Test Data
Table. 4.4 Load forecasting by an ANN, Quasi-Newton training with 20 neurons in
hidden layer
4.5.3 ANN Trained by Levenberg-Marquardt
Same as the training procedure in Section 4.5.1, ANN Trained by Levenberg-Marquardt
is applied in the load forecasting algorithm. The training performances of different
architectures with 5, 10, 20, 50, 100 neurons in the hidden layers are listed in Table 4.3.
As shown in Table 4.5, there is only small difference between the values indicated by
index MAPE, whereas the index MSE decreases around 50% with the amount of
neurons increased from 5 to 50. The CPU running time increases from 362.71s to
1153.48s. A sample of network performance with 10 neurons in hidden layer is shown
in Table 4.6 below.
0 100 200 300 400 5000
0.002
0.004
0.006
0.008
0.01
0.012
0.014
0.016
0.018
0.02
Epoch
MS
E
Feb 9th 2009 Feb 10th 2009 Feb 11th 20091.3
1.4
1.5
1.6
1.7
1.8
1.9
2
2.1x 10
4
MW
Prediction
Target
Page 97
Smart Grid Technologies and Implementations
79
Network Architecture
(neurons in hidden layer)
Average Training Performance
5
Goal: 5101
Ave Training MSE:
0.549410
Ave Training CPU Time:
362.71s
Ave MAPE: 1.08%
10
Goal: 5101
Ave Training MSE:
0.403410
Ave Training CPU Time:
595.12s
Ave MAPE:1.05%
20
Goal: 5101
Ave Training MSE:
0.352410
Ave Training CPU Time:
646.12s
Ave MAPE: 1.07%
50
Goal: 5101
Ave Training MSE:
0.294410
Ave Training CPU Time:
1153.48s
Ave MAPE:1.09%
Table. 4.5 ANN architecture selection for load forecast with LM Method
Network
Architecture
Network Training Parameter Training Performance
20
Goal: 5101 ; Train MSE:
510815.3
Training Epoch: 88 CPU Time: 398.5s
Ave MAPE: 1%
Sample
Training
Process
Sample
Compare
Between Target
and Prediction
of
Test Data
Table. 4.6 Load forecasting by an ANN, Levenberg-Marquardt training with 20
neurons in hidden layer
0 10 20 30 40 50 60 70 80 900
0.002
0.004
0.006
0.008
0.01
0.012
0.014
0.016
0.018
0.02
Epoch
MS
E
Feb 9th 2009 Feb 10th 2009 2,44 Feb 11th 20091.3
1.4
1.5
1.6
1.7
1.8
1.9
2
2.1x 10
4
MW
Prediction
Target
Page 98
Smart Grid Technologies and Implementations
80
As shown in Table 4.5, there is only small difference between the values indicated by
index MAPE, whereas the index MSE decreases around 50% with the amount of
neurons increased from 5 to 50. The CPU running time increases from 362.71s to
1153.48s. A sample of network performance with 10 neurons in hidden layer is shown
in Table 4.6 below.
4.6 Result Comparison and Analysis
To compare the differences between performances of load forecasting trained by these
three ANNs with different back propagation algorithm (BP algorithm, Quasi-Newton
algorithm and Levenberg-Marquardt algorithm), architectures with 10 neurons in the
hidden layer have been selected.
4.6.1 Convergence Comparison
Fig. 4.15 shows the convergence performances (revealed by index MSE) of these three
algorithms for the load forecasting during the first 50 epochs of training. As depicted
in the figure, the typical back propagation training by Delta-rule is slowest between
these three algorithms. While the performance of the Levenberg-Marquardt algorithm
converges faster than the other two algorithms. The differences between performances
could also be easily distinguished by examination plots, shown in Fig. 4.16.
Fig. 4.15 The Epoch of Training with 3 different algorithms vs MSE
0 5 10 15 20 25 30 35 40 45 500
0.005
0.01
0.015
0.02
0.025
0.03
0.035
Epoch
MS
E
Typ BP
BFGS
LM
Page 99
Smart Grid Technologies and Implementations
81
(a) ANN Trained by Delta rule
(b) ANN Trained by Quasi-Newton
(c) ANN Trained by LM
Fig. 4.16 Examination plots of actual demand and prediction
0.4 0.5 0.6 0.7 0.8 0.9 1
0.4
0.5
0.6
0.7
0.8
0.9
1
Actual Demand
Pre
dic
tio
n D
em
an
d
Prediction - Actual
Actual - Actual
0.2 0.4 0.6 0.8 1
0.4
0.5
0.6
0.7
0.8
0.9
1
Actual Demand
Pre
dic
tio
n D
em
an
d
Prediction - Actual
Actual - Actual
0.2 0.4 0.6 0.8 1
0.4
0.5
0.6
0.7
0.8
0.9
1
Actual Demand
Pre
dic
tio
n D
em
an
d
Prediction - Actual
Actual - Actual
Page 100
Smart Grid Technologies and Implementations
82
The set of plots above in Fig. 4.16 vividly depicted the error between actual demand
and predicted demand. The red line in each plot indicates the real demand during a
certain period and the blue dots around the red line means the predicted values during
the same period. The more dots converged to the red line, the more precisely the load
forecasted. Comparing these three plots, obviously, ANN Trained by LM has a better
performance.
4.7 Conclusion
This chapter focused on the behaviours of different training algorithms for load
forecasting by back propagation algorithm in Neural Network. Smart grid load
forecasting system framework design for Ontario, Canada. This work introduces a
smart grid load forecast design procedure with consideration of general influencing
factors and Ontario local factors. Due to the characteristic of imitating the mode of
human beings’ thinking, ANN can learn the relationship between input and output. Thus,
same function of the relationship can be applied into practical situation to find out the
output according to the information already known as input. Besides, this work
compares results from different ANN training algorithms and provides a novel
explanation for the differences. After research, training with LM algorithm which is
integrated in Neural Network Toolbox in Matlab is regarded as one of the best choice
to do load forecast. If the accurate results are required to forecast the load, more neurons
are needed to apply into the network architecture. On the other hand, over-fitting must
be considered to ensure the network can simulate the load situation well. Owing to the
condition limitation, the input vectors did not take all of the information into account.
A few of the simulation part didn’t meet the real demand very well, even large squared
error occurred. If the information was gathered enough and the networks were trained
more meticulous, better result could be obtained to apply into load forecasting for smart
grid.
Page 101
Smart Grid Technologies and Implementations
83
Chapter 5
Self-Healing and Load Shedding in Smart
Grid
5.1 Introduction
The self-healing technology in smart grid allows processors installed in each
component of a substation like breakers, switches, transformers and busbars to
communicate with each other. A parallel information connection must be installed in
each high voltage connection to the device, whose parameters, status and analog
measurements from sensors have permanent information. One of the typical instance of
self-healing is load shedding.
With the deployments of smart grid technologies and communication networks in
modern power systems, frequency relays, which are used for the purpose of power
system protection, are to achieve more advanced and reliable performance. Load
shedding strategies, which prevent power systems from suffering frequency instability
based on the real-time data frequency relays, are facing a challenge to adequately and
accurately take shedding actions, as power system loads are varying all the time. On
the generation side, increasingly non-dispatchable and inflexible renewable power
generations being integrated to the system complicates generation predictions and
results in frequent power imbalance.
This chapter investigates the main reasons for the blackout occurred in Indian July 2012,
and gives further suggestions to minimize the blackouts in future. In addition, this
chapter proposes a load shedding scheme with different magnitudes and load shedding
orders for distribution networks, with its effect on power system frequency stability
verified in a benchmark IEEE 33-bus distribution system and a large low voltage
Page 102
Smart Grid Technologies and Implementations
84
distribution system, which are simulated in DIgSILENT PowerFactory package.
5.2 Blackout in India
Power system stability is critical to the system operation and quality of supply. Any
power system imbalance, which can be caused by load variations or generation closure,
will immediately result in an overall frequency change in the system. A system
frequency too low can cause destructive damage to the system components. For
examples, nuclear power plants usually as base loads are strictly operated a frequency
above 48 Hz, whereas some hydro units may work with a frequency as low as 45 Hz
for frequency balancing purpose [103].
By means of monitoring the electricity usage continuously via automated
instrumentation, system operators will shut down certain pre-arranged electric loads or
devices (e.g. electric heaters, stoves, dryers and hot hubs), If the upper threshold of
electricity usage is approached. With energetically advocating of smart grid, demand
responds, which is changing the human behaviour of using the electrical power in a
relatively “controlled” manner, could also act like load shedding.
One of the good lessons is that the grid disturbances occurred on 30th and 31st of July
2012 leaving millions of Indians in the dark for hours. It was understood that in the
blackout that occurred on 31st of July, hydro power was slowed down which led to
inadequate power generation while people overdrew more power for cooling off since
the temperature was extremely high. Three of the Indian Grids were hit by power failure,
leaving a huge disturbance in the country. The power outage affected 620 million people
in India [91]. Trains were stopped, and a large amount of passengers were stranded on
the platform. Traffic was congested in large cities including New Delhi and Kolkata
due to failure of traffic lights.
When load is increasing and generators could not respond in time, loads are needed to
shed when the frequency is dropping. Otherwise, it will damage the generators
connected to the grid. Three of the Indian grids were hit by power failure twice, leaving
a huge disturbance in the country on 30th and 31st of July in 2012. The power outage
affected 620 million people in India [109]. In 2012, the first blackout was occurring at
Page 103
Smart Grid Technologies and Implementations
85
around 2:35 am on 30th of July in the Northern Region grid, which feeds electricity to
9 states of Northern India. Approximately 36000 MW was affected in this blackout.
Only 60 % of load in Northern Region was restored by 11:00 am by means of
hydroelectricity in the North Region and withdrawing power from Eastern and Western
Regions. And the Northern Region grid was not supplied with the full load until 7:00
pm. Afterwards, on 31st of July, there was another disturbance occurring at 1:00 pm,
almost covering the entire power grid in India, including Northern Region, Eastern
Region and North-eastern Region. Only some of the small pockets were not affected,
such as Narora. There were about 48000 MW of the total loads affected in the second
blackout, which was much more serious than the first one. It was reported that over 700
million people in India was suffered from darkness and production slowdown. In 2011,
India power losses owing to transmission and distribution issues are approximately 23.7%
on average in India, while the value is around 10-15% in Europe and North America
[110]. A weak monsoon was blamed as lacking of rain and decelerating the hydro power
generation [111]. In terms of India Meteorological Department, the actual rainfall in
June, July and August in India were much lesser than expected normal rainfall in these
three months in 2012 [110]. Furthermore, because of the price control on coal by Indian
government, some coal fire plants cannot afford such expensive coal importation and
leave their power stations operating below capacity for their own interests [112]. Also,
some experts blamed the disturbance due to the Indian grid infrastructure, which
connects with both AC and DC transmission lines. The grids can exchange power with
other region flexibly when only DC transmission cables connected between regions
under normal operation. In addition, faults in one region are difficult to spread into
others in abnormal conditions. Indian grid cannot take advantage from the benefits
which bring security effects from only DC connection.
An Enquiry Committee has been founded to investigate the factors which led to the
causes of the two grid disturbances on both days, and a report had been generated to
investigate the situation and gave some critical recommendations [113]. One of the
most serious problems is that the transmission system is very weak since the grid
suffered from multiple outages. Besides, the Northern Region loads withdrew too much
Page 104
Smart Grid Technologies and Implementations
86
power from the Western Region grid so that the corridor linked between north and west
was overloaded. Ineffective dispatch cannot prevent the Northern part from ‘overload’
electricity from the Western part. Without any fault occurring, zone 3 of the distance
relay protecting the Bina-Gwalior link was tripped, and caused Western Region
separated from Northern Region.
Fig. 5.1 Brief Indian NEW Grid for disturbance study
A brief model was built for simulating the grid behaviour during the disturbance with
PowerFactory DIgSILENT software Package. As stated in the Report of the Enquiry
Committee report and some media, Northern Region grid imported energy from all the
rest of NEW Grid (Eastern Region, Western Region and North-eastern Region) before
the disturbance occurrence. Besides, Bhutan, a country located at Northeast of India,
also imported 1127 MW from the Eastern Region of Indian grid. The pre-disturbance
generation and demand with power importing and exporting conditions on 30th of July
in 2012 02:00 am are shown in Table. 5.1. It is worth noting that few lines had been
tripped few hours before the collapse happening [114]. Each region in the NEW Grid
which is involved in the disturbance has been grouped by a general load and some
generation types such as thermal, hydro, nuclear and renewables.
Fig. 5.1 illustrates the India NEW Grid model for analyzing the scenarios of the grid
Page 105
Smart Grid Technologies and Implementations
87
disturbance in DIgSILENT software package. The Northern Region and the Western
Region were connected by both 400kV circuit lines from Agra to Gwalior and Zerda to
Kankroli, and 220kV circuit lines from Badod to Kota. All lines were assumed to have
the same parameters. Each region of these four in the simulation was modeled for hydro,
thermal and renewables generations and one load. Eastern Grid is connected to both
Northern Grid and Western Grid by AC transmission line. Northeastern Grid comprises
of hydro, thermal and renewable generations are connected to Eastern Grid only.
Region Generation
(MW)
Demand
(MW)
Import
(MW)
Northern 32636 38322 5686
Eastern 12452 12213 -239, (1127 MW
to Bhutan)
Western 33024 28053 -6229
Northeastern 1367 1314 -53
Total 79479 79479
Table. 5.1 Generation and Demand Conditions with Power Import and Export before
Disturbances
Table. 5.2 illustrates the pre-disturbance generation power allocated in each region
according to the enquiry report. The installed capacities of generations for each region
are:
Northern Region:
19830 MW Hydro generations, 34608 MW Thermal generations 1620 MW nuclear
generations;
Eastern Region:
3882 MW Hydro generations, 22545 MW Thermal generations and 411 MW from
renewable energy sources;
Western Region:
7448 MW Hydro generations, 49402 MW Thermal generations, 1840 MW nuclear
generation and 7909.95 MW from renewable energy sources;
Northeastern Region:
1200 MW Hydro generations, 2454.94 MW Thermal generations and 228 MW from
Page 106
Smart Grid Technologies and Implementations
88
renewable energy sources.
Regions
Generations
North Northeast East West
Hydro 10000 MW 267 MW 2000 MW 6000 MW
Thermal 21636 MW 1000 MW 10200 MW 24024 MW
Nuclear 1000 MW - - 1400 MW
Renewable - 100 MW 252 MW 600 MW
Total 32636 MW 1367 MW 12452 MW 33024 MW
Table. 5.2 Generation Power Allocation in Each Region
According to the Enquiry Committee report, load in the northern region were larger
than power generated, which means the Northern region needs to import power from
other regions unless there is a load shedding in the northern region.
5.2.1 Load changes in Northern Region
The aim of the sensitivity analysis is to find out the increased load at what level will
lead to generators in northern region out of step with the rest of the NEW Grid. The
increased level of reactive power of the load in the northern Region is fixed at 5 %. The
increased level of active power is changed from 1 % to 6 % with a step of 0.5 %, the
result of fire angle and frequency response in western, and northern region is shown in
Fig. 5.2-5.4. Pole slip has been pointed out in the table that when northern grid power
is increased by 6 %, generators in the northern region are out of step. Gaps between
maximum value and minimum value for both northern grid frequency and western grid
frequency are getting larger in terms of the increasing of the northern region load.
Page 107
Smart Grid Technologies and Implementations
89
Fig. 5.2 Frequency response in Western Region when load increasing in Northern
Region
Fig. 5.3 Rotor angle of thermal generator in North with reference to western region
when load increasing in Northern Region
Page 108
Smart Grid Technologies and Implementations
90
Fig. 5.4 Frequency response in Northern Region when load increasing in Northern
Region
The parameters of the governors and the AVR have been taken as the default parameters
available in the software. Also both hydro and thermal generation are coupled to the
same bus to represent the total inflow of power from a particular region. The steady
state power flow indicates that the lines between NR and WR are overloaded
substantially while the lines between ER and NR and the lines between WR and ER are
almost 100% loaded. The frequency of the system, however, seems to be within the
permissible limits. The tripping of the Agra-Gwalior line caused an overloading of the
other lines between NR and WR which resulted in the tripping of these lines. The
tripping of the lines has been simulated by putting the Agra-Gwalior line out of service
at t=5 seconds and Zerda-Kankroliline between NR and WR at t=5.5 seconds. The aim
of the case simulation is to observe the effect of cascade tripping of the lines between
the North and the West. Fig. 5.5 and Fig. 5.6 respectively illustrate the frequency of
Northern Region grid and changes in rotor angle between Northern Region and Western
Region when the transmission lines linking these regions trip. Sensitivity analysis for
investigating the grid robustness will be done in some cases below.
According to the background and the report, loads in the Northern Region grid are
usually larger than the generation, Northern Region grid need to import power from
other grids. This case is studying about behaviours of the entire grids when increasing
Page 109
Smart Grid Technologies and Implementations
91
the capacity investment or injecting more spinning reserve power into the Northern
Region grid.
The thermal power plant output power is increased from 100% to 125% with a step of
5%. The results of the frequency measured in the Northern Region bus are shown in
Fig. 5.5. As can be seen in the diagram, Northern Region frequency fluctuation is
getting smaller with the increased thermal generation output power. It is worth noting
that after the transmission line was out of service, frequency in the Northern Region
can be recovered to the stable range when the thermal generation output power is higher
than 120%. Owing to the generation increasing in the Northern Region, it could meet
such heavy load without importing energy from other grid.
Fig. 5.5 Northern Region grid frequency response when thermal generation is
changing from 0% to 25%
Page 110
Smart Grid Technologies and Implementations
92
Fig. 5.6 Rotor angle of the thermal generation in northern region when thermal
generation is changing from 0% to 25%
5.3 Load Shedding Scheme
Manual disconnecting load to assist the grid largely depends on with power system
operators’ experiences and judgments as well as the quickness which may lead to mal-
operations, whereas automatic disconnecting predetermined loads may provide a fast
response for load shedding schemes but requires a deliberately designed control
strategies and robust control systems. In recent years, smart grid technologies have been
proposed in order to meet the increasingly requirements on reliable, efficient and
economic power grids. On this occasion, a large number of innovative technologies,
advanced schemes and novel network architectures have been proposed to be
implemented in the power systems, which are dedicated to make the power grids
“smart”. As demonstrated in [138-143], advanced load shedding schemes with
intelligent systems and communication technologies are developed for the power
system protections for power islanding events. Particularly in [141], a comprehensive
intelligent load shedding scheme which is involved with online system data, equipment
rating, user-defined control parameters, a knowledge base, system dependencies,
Page 111
Smart Grid Technologies and Implementations
93
predictive analysis, and other advanced technologies is designed. Also as demonstrated
in [139], a supervisory control and data analysis (SCADA) system is used to achieve a
comprehensive load-shedding strategy.
Nevertheless, load shedding schemes are rarely proposed for small distribution
networks, which may continuously operate during its islanded mode by implementing
a local load shedding scheme. In the future, distribution generations will be
progressively embedded in the distribution networks which may be expected to operate
in a sectional split manner with the main grid.
There is a debate on the disconnection steps of the shedding loads as well as the
magnitude of the shedding loads to be executed. In [104], it is believed that three to five
steps will gives the best effect in stabilizing system frequency, and the load amount for
the initial steps should be less than that for later steps in order to provide the best
performance. While in [105], it suggests that in the load shedding scheme the first load
shedding action should disconnect half of the total loads in the system available for the
shedding scheme as soon as the frequency reaches 49.5 Hz. This is to take adequate
load shedding actions for preventing frequency from decreasing to an unacceptable
level. Fig. 5.7 shows the frequency responses with different magnitudes of load
shedding when the distribution grid as illustrated in Fig. 5.9 is subject to a loss-of-main
event.
Fig. 5.7 Frequency responses with different magnitudes of load shedding when the
grid is subject to a loss-of-main event with system frequency decreased down to 49Hz
Page 112
Smart Grid Technologies and Implementations
94
5.3.1 Power System Behaviour under Disturbances
For a single generator, the machine motion can be represented by the well-known swing
equation as follows:
(5.1)
Where Pm is the mechanical power of the synchronous machine in per unit, Pe is the
electrical power in per unit, ∆P is the power difference between the generator
mechanical power and electrical power. H is the inertia constant, which is the ratio of
the kinetic energy at rated speed and the machine apparent power. Generally, the unit
of inertia constant is identified as seconds. However, in some textbooks, it claims that
there is no unit for the inertia constant since the unit of kinetic energy and the apparent
power are the same.
Fig. 5.8 Frequency deviation with different inertia constant when one step load shed is
tripped at 48Hz
Fig. 5.8 shows the load shedding under-frequency relays trip at 48Hz with different
inertia constant. fn and f are the rated frequency and frequency in Hz respectively. For
2m e
n
H dfP P P
f dt
Page 113
Smart Grid Technologies and Implementations
95
a large power system with number N of machines (for both generators and loads), a
fictitious inertia centre can be defined to facilitate the analysis, and the total imbalance
between generators and loads can be computed as follows [106]:
(5.2)
(5.3)
Where ∆Pi is the difference between the ith generation’s mechanical and electrical power.
fc is the frequency of the equivalent inertial centre.
The common practice for load shedding actions is executed when there is a distribution
network disconnection from the main grid either by opening the primary circuit breaker
at a transient event occurring in the grid (e.g. significant grid frequency variations).
To design a load shedding scheme, the extent of system overloading has to be identified
in the first instance. However as a matter of fact, such identification may be a
challenging task that both the loads and generation in the distribution network are
varying all the time. Besides, power production from various DGs, especially
renewables, is less predictable and controllable compared to the conventional
generators with spinning reserves. This may lead to imprecise load shedding actions.
Therefore, a load shedding scheme should be well designed to perform the correct
extent of load curtailment and to avoid the mal-operations.
5.3.2 Magnitude of Load Shedding
The magnitude of load required to be shed is basically linked to the degree of the grid
contingencies and disturbances. The resulting consequences by grid contingencies and
disturbances can be measured by the dynamic imbalance between generators and
demand. To determine the amount of load to be shed, a threshold value Pthr used to
define as the maximum power imbalance which the distribution network tolerates
1
1
N
i i
iNc
i
i
H f
f
H
1
1 1
22
N
iN Ni c c
i i
i ii n
Hdf df
P P Hf dt f dt
Page 114
Smart Grid Technologies and Implementations
96
without triggering any load shedding action in the shedding scheme. Then according to
the amount of load requiring to be shed can be calculated according to the differences
between real-time grid frequency and nominal grid frequency 50 Hz as follows:
(5.4)
Where kp is the LLS gain obtained according to the characteristics of system effective
inertia as shown in Equation (5.3).
Fig. 5.9 IEEE 33-bus distribution system configuration
The amount of load required to be shed can be illustrated in Equation (5.4) which
continuously estimates the appropriate load shedding amount ∆PLLS according to the
real-time frequency deviation (f-fn) with a deliberately selected proportional gain kp.
(5.5)
Equation (5.5) demonstrates the proposed load shedding scheme, where the estimated
load shedding amount given by Equation (5.4) continuously decides the load available
for the scheme with priorities i (the higher i is, the less priority the corresponding load
( )LLS p nP k f f
1
1 1
N N
i i
i i
P P P
Page 115
Smart Grid Technologies and Implementations
97
has in the load shedding scheme). When the estimated load amount reaches the
threshold of a specific load value, this load should be tripped to fulfill the scheme
requirement. For example, the 0.2MW single load with priority of i=1 has to be tripped
off when ∆PLLS is accumulated to be 0.2MW due to a network disturbance, while the
second single 0.3MW load with priority i=2 has to be tripped off when it is increased
up to 0.5MW (0.2MW+0.3MW), and the rest can be done in the same manner.
5.3.3 Load Disconnection
The load disconnection order should be done in an optimal manner where the adequate
discriminations for the loads available for the proposed LLS are to cover the maximum
frequency drop. For instance, the LLS in the following case study section covers the
operational frequency from 48 to 49 Hz. The frequency above 49 Hz should not trigger
the load shedding action, whereas the load shedding actions only take place between 48
Hz and 49 Hz. Frequency below 48 Hz as a severe case is not liable to the proposed
LLS as the power system could be compensated immediately (e.g. generator spinning
reserve to restore the system frequency) and protected by other means (e.g. generator
under-frequency and over-current protections).
5.3.4 LLS Relay Operating Delay Impact
By taking the action of LLS, the distribution network frequency may still fall further to
a lower value. This is because there are various delays associated with signal data
transmission time, signal receiving and processing delays, and opening time period of
circuit breakers at load terminals. A high performance communication system as well
as robust load circuit breakers is preferable for the proposed LLS scheme. According
to [107], the nominal range of relay tripping time period using telecommunications is
between 5ms and 40ms.
5.3.5 Case Study
The load shedding scheme is studied with an IEEE 12.66kV 33-Bus distribution system
Page 116
Smart Grid Technologies and Implementations
98
[108] modelled by DIgSILENT PowerFactory, and system generator data shown in
Appendix II. In this meshed distribution network, 5 primary circuit switches
interconnect the networks between busbar B22 and B12, B8 and B21, B9 and B15, and
B18 and B33 respectively. 4 generators which are a hydro powered generator, gas
powered, diesel generator and double-fed-induction-generator based (DFIG) small
wind farm are connected with the distribution network in busbar B2, B6, B32 and B14
respectively.
The loads in this distribution network available for the proposed LLS scheme include
L2, L11, L23, L24, L25, L30 and L32, which occupy 40% of the total load in this
distribution network. The following three case studies are to examine the performance
of the proposed LLS scheme at loss-of-main event caused by a fault event occurring on
B2 at t=2s, after which the circuit breaker B1 opens the grid connection immediately to
result in a power island for the distribution network. As the distribution system initially
imports extra power from the transmission grid, the disconnection of the breaker results
local generation less than the total load in the temporarily islanded distribution system
and the frequency begins to fall down before the generator governors take effect.
Fig. 5.10 illustrates the effect of disconnecting the loads available in the LLS scheme
(40% of the total) for one time to response the frequency deviation. It can be seen that
the protective relay operates at an earlier stage of 49.3 Hz rather than 49 Hz, 48.5 Hz
and 48 Hz gives the best effect of preventing the frequency from falling low. This
coincides with the claim as referred in [105] and concludes that the action of the LLS
should be taken the earlier the better.
Page 117
Smart Grid Technologies and Implementations
99
Fig. 5.10 One step load shedding for 40% when relays set to 48Hz, 48.5Hz, 49Hz
and 49.3Hz
The control delays which are demonstrated in Section IV C are initially studied in this
case in terms of the lowest frequency deviation and restoration speed. It is obvious from
Fig. 5.11 that the lower the LLS control delays are, the better performance can be
resulted.
Fig. 5.11 Frequency deviation with different time delay when one step load shed is
tripped at 49 Hz
As the amount of loads to be shed cannot be determined at the initial drop of the system
Page 118
Smart Grid Technologies and Implementations
100
frequency, the discrete loads have to be disconnected by the scheme one after another
in order to give appropriate system support. Four scenarios on load disconnection
sequences are designed as shown in Table. 5.3 for the proposed LLS in a way as
demonstrated above. Due to the fault, the frequency begins to drop to a level which is
below the top threshold of 49 Hz to trigger the load shedding action for specific load(s)
which is designated to be first disconnected (e.g. L11 and L24 for Scenario I). Shortly
the frequency drops to a new lower threshold of 48.8 Hz to trigger the second load (e.g.
L25 for Scenario I) and 48.6 Hz to trigger the third (e.g. L32 for Scenario I) and so on.
The simulation results as presented in Fig. 5.11 examine the optimal scenarios for
disconnecting specific loads in the load shedding steps performed in different time
intervals. The frequency to be covered by the proposed LLS ranges from 48Hz to 49Hz
with 0.2Hz discrimination between two adjacent steps. This is to investigate whether
the best performance is resulted by smaller load disconnection and then higher load
disconnection or in a reversed manner.
Tripping
threshold Scenario I Scenario II Scenario III Scenario IV
49 Hz 0.48 MW
(L11 & L24)
0.09 MW
(L23)
0.48 MW
(L11 & L24)
0.1 MW
(L2)
48.8 Hz 0.42 MW
(L25)
0.1 MW
(L2)
0.21 MW
(L32)
0.21 MW
(L32)
48.6 Hz 0.21 MW
(L32)
0.2 MW
(L30)
0.1 MW
(L2)
0.48 MW
(L11 & L24)
48.4 Hz 0.2 MW
(L30)
0.21 MW
(L32)
0.09 MW
(L23)
0.42 MW
(L25)
48.2 Hz 0.1 MW
(L2)
0.42 MW
(L25)
0.2 MW
(L30)
0.2 MW
(L30)
48 Hz 0.09 MW
(L23)
0.48 MW
(L11 & L24)
0.42 MW
(L25)
0.09 MW
(L23)
Table. 5.3 4 scenarios for the load selection
Page 119
Smart Grid Technologies and Implementations
101
Fig. 5.12 Frequency derivation under 4 sequences
As it can be observed in Fig. 5.12, Scenario I which trigger the load amount from largest
to smallest results in the lowest frequency drop, whereas Scenarios IV which
disconnects the largest load in the middle range of the frequency 48.6Hz and 48.4Hz
gives the fastest frequency restoration speed. Scenarios II and III do not have
outstanding advantages compared to Scenarios I and IV.
5.4 Conclusion
The chapter gives a brief event sequence of the disturbance that occurred on 30th and
31st of July 2012 in the India power grid. Reasons for the disturbance have been
discussed. Grid infrastructure, which is applying both AC and DC transmission lines to
connect regions, is one of the main problems for these disturbances. The generation
production is dependent too much on the weather condition, and the power cannot be
restored within a short time. Some sensitivity analysis has been done to investigate the
level of the disturbance affected the grid when power generated in the North and wind
penetration level in the Western Region grid is increased. Increasing the power output
in the Northern Region is a simple solution when the load is increased in the Northern
Region grid as then the transmission line linking the regions is not overloaded. Wind
Page 120
Smart Grid Technologies and Implementations
102
generation in the Western Region grid cannot supply enough energy from the Western-
Eastern-Northern area when the lines between Northern Region and Western Region
are out of service. It can be foreseen that a coordinated dispatch schedule is essential
for a secure electricity supply. From the blackout, it also suggests that increasing rate
of generation capacity is lacking behind the economy development rate. It is important
to plan the electricity infrastructures at least few years in advance.
In addition, this chapter proposes a distribution load shedding (LLS) scheme for system
stability improvement. The proposed LLS scheme computes the amount of load to be
connected in real time based on the system frequency deviation and the characteristic
of the system effective inertia. The discrete loads available in the distribution network
are then disconnected by the real-time commands of the LLS scheme. The LLS scheme
is validated in an IEEE 33-bus distribution network model and its system advantages in
terms of reducing frequency deviations and promoting frequency storage speed are
verified in three case studies. It can be proved from the simulation that the proposed
LLS is able to prevent the system frequency from falling too low and quickly restore
the frequency to the nominal value. In the meanwhile, it is interesting to find that
shedding the largest loads in the first stage of load shedding actions results in a lowest
frequency deviation whereas shedding the largest loads in the middle range of covered
frequency results in a fastest frequency recovery speed. Various control delays of the
proposed LLS scheme and different tripping thresholds for the LLS scheme are also
studied in the simulation in terms of the impact on the performance of the proposed
LLS scheme.
It can be concluded that the proposed LLS scheme is an effective automatic load
shedding measure to survive the distribution network at transient system power
imbalances and provides economic and reliability advantages to distribution network
operators with an uninterruptable solution for system operations.
Page 121
Smart Grid Technologies and Implementations
103
Chapter 6
Decision Support Systems for Smart Grid
Implementation
6.1 Introduction
Decision Support System (DSS) is an information system, which is based on interactive
computer to support decision making in planning, management, operations for power
utility, business and organizations. The rapid changes on decision making, which
cannot be easily identified, can be assisted by communication technologies and
computer-based system compiling information gathered from a wide range of resources
like raw data, documents, experts’ experience and knowledge, and business models [85].
Originally, decision support concept came from the theoretical studies of decision
making for organizations by Carnegie Institute of Technology and technical practice on
interactive computer systems by Massachusetts Institute of Technology in the 60s [85].
In 70s, ‘decision support’ began to grow among academia, and the first paper appeared
in the conference and journal at that time. The DSSs have been introduced to China in
80s. In the earlier 1990s, DSS applications are spread into different areas through data
warehousing and on-line analytical processes. Since middle 1990s, DSS starts to apply
web-based analytical process [86]. Recently, with the development of cloud computing
technology, DSS based on cloud computing technology has been proposed [87-89].
Throughout the development of DSS in the recent 30 years, there are more than 20
methods to implement the DSS. It is difficult to distinguish the best principle to solve
decision making problems from others since proposed DSS systems are usually project-
oriented. DSS has been involved in a plenty of technical areas which include
transportation, electricity and resource dispatch and so on.
Page 122
Smart Grid Technologies and Implementations
104
In 2004, IEEE published a guide for electric power distribution reliability indices,
which is used for power system planning and operation. In realistic project, a decision
support system is required for assisting governments or network planners to make
critical decisions. In power system planning, reliability and security are the essential
input for a decision support system.
6.2 Decision Support System Requirements
A DSS involves a number of scientific areas such as computer science, simulation
technology, software programming and cognitive science and so on. Basically, there are
three types of problems for decision making, namely structured, unstructured and semi-
structured. Structured problems can be solved by standard solution techniques with
clearly specified procedures to make a decision. Whereas the procedures of
unstructured problems are unspecified in advance, and most of the decisions procedures
are followed only once. In semi-structured problems, procedures for decision making
can be specified but the optimal decision making cannot be verified. For different levels
in organizations and business companies, the objectives of the DSSs are not the same.
There are three different levels in companies and organizations. Firstly, strategic
planning, including long term policies planning, is used for governing resource
acquisition, utilization and disposition. Secondly, management control ensures the
resources can be obtained and used effectively and efficiently to achieve the
organization objectives. Finally, operation control ensures effective progress.
6.2.1 DSS Functionalities
In general, the DSS is project-oriented and the functionality is always determined by
system architecture. With different architectures, DSS functionalities can be
summarized as follows:
Collecting, managing and providing the organization external information
related to decision questions in domains like policy, economy, society,
environment, market and technology.
Collecting, managing and providing the organization internal information
Page 123
Smart Grid Technologies and Implementations
105
related to decision questions in domains like order request, storage status,
production capability and finance.
Collecting, managing and providing the feedback of each alternative
decision execution such as contract processing, material supply plan, and
production implementation.
Having a certain capability of data storage and managing mathematical
models which are closely linked with decision making.
Having a certain capability of storing and providing frequently-used
mathematical methodology and algorithm, such as regression analysis,
linear programming, and computational intelligence models.
Having a certain capability of easily adding and modifying data, model and
algorithm.
Having a certain capability of flexibly processing, collecting, analyzing and
forecasting data through models and methodology, thereby generating
general message and projections.
Providing a friendly interface to communicate between man and machine,
and functionality of graphic output. Also, there is a capability to meet the
request of stochastic data query to answer some “what…if…” questions
and so on.
Providing favourable functionality of data communication in order to
ensure that the required data can be collected, processed and delivered to
the user in time.
To include all the functionalities above, a typical DSS architecture should have an
optimization toolbox, an on-line analytical processing toolbox, a data mining toolbox,
a transaction processing system and a database as illustrated in Fig. 6.1. Users can
generate problems to the DSS and obtain the analyzed answers from the user interface.
And a data mining toolbox can find the required data in large database where data
related to the problem are located.
Page 124
Smart Grid Technologies and Implementations
106
Fig. 6.1 A typical structure of DSS
6.2.2 Requirements for DSS
In general, there are five types of DSSs to achieve a decision making, namely,
communication-driven DSS, data-driven DSS, document-driven DSS, knowledge-
driven DSS and model-driven DSS [90]. No matter what kind of DSS is applied to a
certain project, there are some generic requirements which are listed as follows:
Be compatible with as many decision processes and structures as possible.
Should have an interactive interface and friendly to users.
Can be accessed and controlled by users.
Allow end users to develop DSS without difficult.
Support modeling, data access and analysis.
Have an ability to work in both standalone and web-based environment.
DSS has been widely used in many areas, such as port planning, planning of the
workload, oil refineries, traffic control and driver safety, even a small case for helicopter
landing have been involved with DSS[144].
Decision Output
User Interface
Communication Technology
DSSDatabase
Transaction Processing
System
Optimization Tools
OLAP Tools
Data Mining Tools
Page 125
Smart Grid Technologies and Implementations
107
6.3 Past, Present and Future
This section will give critical discussions about the development of Decision Support
Systems. Also the promoting trend for future DSS system will be investigated.
6.3.1 Past
From 1970s to 1980s, comprehensive framework had been proposed to integrate with
knowledge-based systems. The proposed DSS usually concentrates on the structure
improvement during that time.
More domain-independent and user-friendly systems were developed by exploiting
expert systems design in reference [150]. The proposed DSS structure as shown in Fig.
6.2 was called XDSS. The knowledge base consisted of 5 areas, namely, domain, data
dictionary, model, report generator and graphics knowledge. Each component in the
architecture was maintained by experts. The domain knowledge would comprehend the
issue that was defined by users and presented in the XDSS software. Then, the issue
would be separated into sub-issues so that the relative knowledge base component could
be adopted. Finally, a solution would come out through all sub-issues integrated with
XDSS software.
Fig. 6.2 An XDSS approach [150]
Report Generator Files
Graphics Database
DataBase
Model
User Interface
XDSS Model
Data Dictionary
Model Knowledge
Report Generator Knowledge
Graphics Knowledge
Domain Knowledge
Page 126
Smart Grid Technologies and Implementations
108
A flexible logic-based DSS was proposed in reference [151]. The model developed by
the authors adopts intentional database (IDB) for logic-based system. It means that the
user could store a number of rules. However, there is another extensional database
(EDB) for storing the actual data. Two kinds of models, namely, coded models and
defined models, had been applied to the DSS system in order to reduce workload. The
author believed that the DSS model achieved considerable development, and was used
for design architectures based on IBM’s top down approach so on.
Model management evolution was divided into 4 generations and has been described
in [152]. Fig. 6.3 demonstrated these 4 generations for DSS development. The author
pointed out the advantages of the last generation models are:
Fig. 6.3 4 Generations for DSS development [152]
Model Tool Data
Model Data
Model Data
Tool Base
Model
Model
Tool Base
Database
Model
Model Base
Tool Base
Data Base
The 1st Generation
The 2nd Generation
The 3rd Generation
The 4th Generation
Page 127
Smart Grid Technologies and Implementations
109
1. The system could automatically integrate the model with data in order to reduce
the programming redundancy.
2. Authorized user can access the model without many problems since many DSS
systems were built in a distributed environment.
3. High compatibility enables the model management system to achieve more
flexibility for DSS. Accommodating new database management system, model
management system can reduce the impact of changing database models.
In reference [153], the framework of DSS for distributed computer system has been
provided. Optional solutions were explored systematically by this methodology when
objectives conflict with each other.
Three conceptual steps were developed to assess the DSS impact on organizational
elements in reference [154]. The first step is to establish the DSS to identify the real
consequence, at least in principle. The second step tries to recognize the subsets of the
real consequence. And the last step is to evaluate both the recognized consequence and
predicted consequence. The authors also discovered that the DSS could serve more
when linking to an information network with all organizational centers connected
together. Integrating with personal and organizational knowledge based systems is the
trend pointed out by the authors.
A framework of DSS for Computer-Integrated manufacturing has been discussed in
reference [155]. In this survey, an information processing approach has been adopted
to study the manufacturing environment. Some possible factors for designing the DSS
system, such as the role of problem formulation and specification (involving goal
setting), have been discussed in reference [156]. In 1985, a DSS system for global
decision-making was reported. It summarized that the DSS would achieve more
alternatives and better co-ordination [157]. Inquiry systems can be implemented for ill-
structured organizational problems and developing information systems. Strategies for
creating a cooperative communication between expert system database and deduction
have been outlined in reference [158]. There were many research papers debating on
the appropriate mechanisms for coupling deduction and data component for an expert
system. In reference [144], the authors proposed a new perspective in decision support
system for port planning. A 2-layer information management system architecture was
shown in Fig. 6.4 to illustrate a conceptual distance from the logical to physical data
structure.
Page 128
Smart Grid Technologies and Implementations
110
Fig. 6.4 DSS with 2-layer information management system [144]
6.3.2 Present
Around 2010s, DSS researchers began to pay attention to the multi-criteria decision
making and dynamic interaction within a DSS. An increasing number of people realized
that classical DSS cannot afford the dynamic changes in decision making of the real
world. Besides, DSS frameworks proposed during that period also tried to minimize
project risk.
Reference [146] proposed a new framework for dynamic multi-criteria decision support
system. Classical multi-criteria decision making model would be used to find all
available options. The proposed one introduced a dynamic environment where real
world decision is taking place. It is worth noting that the versatile framework chooses
a retention policy for historical options and can be widely used in many applications.
For example helicopter landing was provided to illustrate the dynamic DSS system
behaviour.
Scheme (Layer 1)
Internal Administrator (Layer 2)
Database
Decision makers
Model files
Information Management
System
Page 129
Smart Grid Technologies and Implementations
111
In project management field there are uncertainties & constraints, risks in projects and
risk interaction need to be managed. A risk network model for decision support system
in managing project risk was shown in Fig. 6.5 [159]. The innovation of this framework
is that the managerial suggestions can be modified, completed and refined, and also the
managers can provide their knowledge to analyze the propagation behaviour in the
network.
Fig. 6.5 DSS architecture for project risk management [159]
A collaborative pattern mining for distributed information systems was described in
reference [160]. Three frameworks have been compared with each other, and the
advantage of the collaborative pattern (CLAP) has been listed. Self-contained mining
framework is not efficient and feasible for fulfilling many objectives. CLAP was
proposed to solve these problems by using communication network to exchange
Identification
Assessment
Analysis
Response Planning
Risk Network Modeling
Proje
ct Ma
nagem
ent Sy
stem
and E
xpert
Syste
m
Proje
ct Su
pervisio
n and Co
ntrol
Mitigation Plan
Decision
Page 130
Smart Grid Technologies and Implementations
112
messages and database for information mining.
The authors in reference [147] added a dashboard between the decisions models and
decision makers as illustrated in Fig. 6.6 to consider both business and engineering
decision variables, which are sometimes conflict with each other. To carry out sub-
optimization for decision making, 2-stage decision based on optimization and agent-
based models had been proposed. The first stage is to solve a multi-objective robust
optimization problem by simulating integrated business and engineer models. The
variables obtained in stage one would transfer to the next stage and process iterates until
set criteria reached.
Fig. 6.6 Business and engineering decision model with dashboard [147]
A measurement approach was derived to quantify dynamic interaction in knowledge
based systems (KBS) based on control theory to examine the improvements [161]. The
authors believed that the decision maker’s initial attitude might affect the actual
dynamic interaction.
Neural networks were proposed in reference [162] for decision making. To improve the
decision making accuracy and reduce the misclassification, the authors have made
comparisons among different cost index to investigate the best convergence. The final
results made a clear picture that increasing number of cost index may lead to slower
converging for related cost-sensitive decision.
A text-based decision support system was proposed for financial sequence prediction
in reference [163]. In this system, event sequences can be extracted from shallow text
User Interface
Dashboard
Business Decisions
Engineering Decisions
Business ModelEngineering
ModelUncertain Parameters
Uncertain Parameters
Robust Optimization
Decision Flow
Information Flow
Page 131
Smart Grid Technologies and Implementations
113
patterns and a classifier-based inference engine was applied for predicting the
possibility of events occurring.
A shallow language model was provided to delete the incorrectly information. Also, the
DSS system could verify the priority of event occurrence with both explicit and implicit
knowledge participation during predicting. The other contribution was the inference
engine, which provided a robust and efficient means to predict financial texts. These
contributions made the prediction accuracy of the model improved by 7% for un-seen
data.
6.3.3 Future
Cloud computing was proposed for some future DSS systems for database and service
sharing. Services like computation, data access, software applications and so on need
to be delivered to the client. There are three service models comprising together to form
a cloud computation environment, namely software as a service (SaaS), platform as a
service (PaaS) and infrastructure as a service (IaaS). Fig. 6.7 shows the DSS
architecture with cloud computing technology.
Fig. 6.7 DSS structure with cloud-computing technology
Database
DSS Models
Business logics
Cloud Computing Network
Agent 1
Database
DSS Models
Business logics
Agent 2
Database
DSS Models
Business logics
Agent n
…
User Interface
Page 132
Smart Grid Technologies and Implementations
114
A management system for traffic control applied agent-base was described in reference
[148]. 4-layer framework, namely, platform, application, unified and fabric layers have
been proposed in cloud computing.
In reference [164], authors proposed a DSS architecture based upon cloud computing
in order to meet the requirement of increasing demands of the information. Cloud is
classified into three types: private cloud, public cloud and internal cloud. The aim of
the cloud computation application in DSS is to reduce the complexity of managing the
technology. Comparing with previous DSS systems, another benefit for applying cloud
computing is that the demand can be scaled, the data centre can be streamlined, business
processes can be improved and starting cost can be minimized. The authors in reference
[149] demonstrated the requirements for cloud-based DSS system. 6 activities and
proposed DSS framework and design clusters for traffic control has been described.
To implement DSS in a better way, communication technologies become more and
more important to achieve data mining. As an important trend for communication
development, cloud computing technologies will be involved for decision making. The
past to the future trend has been discussed in Table.6.1.
Past Present Future
Concentrating on architecture
development:
1. Applying XDSS framework
2. Integrating model management
with data management
3. Employing distributed computer
system
4. Data inference for DSS
5. Aggregating data
6. Expert system for accessing
specific declaration knowledge
Concentrating on dynamic interaction
and multi-criteria decisions:
1. Risk network model for project
risk management
2. Data mining methodology such as
SQLP, PALP and CLAP
3. Agent-based approach
4. Optimization methodology
5. Textual information data
Concentrating on data sharing and
information acquisition:
1. Cloud computing technology
2. Agent-based systems
3. Security
4. Integration with intelligent
methods, such as SVM, swarm
optimization and evolutionary
computing
Table. 6.1 DSS approaches and architectures from the past to the future
As mention in 6.2, Smart Grid Decision support systems need to establish a database
for system estimation and further evaluation. To achieve the implementation of smart
grid, plenty of models and scenarios are necessary to consist in the knowledge database.
Here a stability scenarios and indices to evaluate the system reliability are talked.
Page 133
Smart Grid Technologies and Implementations
115
6.4 Power System Stability Scenarios
Variability and uncertainty are the inherent characteristics of the power system. Many
countries’ national laboratories have studied wind and solar penetration to achieve large
percentage generation capacity to reduce carbon emission and air pollution. There could
be a stability problem when many wind turbines and PV farms integrated into power
grid. The penetration level of a power system is closely linked with how much flexible
generation capacities installation in the network. To deal with intermittence of wind and
solar energy generation, these generators must have the capability of fast response.
Various scenarios will be investigated to demonstrate the potential in maximizing the
use of variable renewables. Naturally, for a full scale project to be established, it is also
required to carry out a cost-benefit analysis. But in terms of technology, it shows that
there are many challenges and our fellow engineers will have a huge opportunity to
make contributions.
In addition to renewable connection scenario, load shedding strategy, which is talked
in the previous chapter, is preventing power systems from suffering frequency
instability based on the real-time data frequency relays. As power system loads are
varying all the time, Load shedding strategies are facing a challenge to adequately and
accurately take shedding actions. On the generation side, increasingly non-dispatchable
and inflexible renewable power generations being integrated to the system complicates
generation predictions and results in frequent power imbalance. If the load shedding is
not operating properly, the whole grid is exposed to a dangerous situation, as the
frequency will drop to a low level which may destroy the generators, especially the
steam turbine. And it may be followed by serious blackout. Here a network model with
renewable penetration is considered to evaluate the stability scenarios.
6.4.1 Renewable and Solar Penetration Investigation
Renewable energy sources such as wind, solar and hydro are regarded as one of the best
solutions to reduce carbon emission under the increase in power demand. Climate
change which is mainly caused by those power plants burning fossil fuels such as coal,
oil and gas, naturally, it is a trend to develop renewable energies to substitute fossil
fuels. However, renewable energies are intermittent, and difficult to forecast precisely.
Countries around the world have concentrated in renewable energy generation for
Page 134
Smart Grid Technologies and Implementations
116
decades. Renewable energies are growing rapidly and still increasing dramatically in
the near future. A target has been set by European Wind Energy Association (EWEA)
to generate 23%electric power from wind by 2030 [94]. Wind generation penetration in
Denmark has met the target around 20% in2006, and there is a suggestion on that to set
the target to 35%in 2015, and 50% in 2030. Spain set wind penetration target to
15% in 2011, which equals to 20GW installation capacity. And will reach the target
around 20% in wind and 4% in Solar PV in 2020, however, the penetration in the year
of 2004 in Spain is only about 6.5% [95, 96].
How much renewable energy can be penetrated into the power system network depends
on the generation structure. Power system network with large conventional generation
power plant such as coal and nuclear cannot response do not work very well with energy
with intermittent characteristics. Network with hydro power generation and pumped
hydro energy storage can respond quickly to varied wind energy [97]. A penetration
study on wind and solar integration was made by GE Energy through the U.S. National
Renewable Energy Laboratory (NREL) in May 2010. The survey is made to discuss
different scenarios on wind and solar penetration from10%-30% and 1%-5%
respectively [98]. Research is presenting from large time scale for one day long for unit
commitment and minimum time scale from minute to minute for regulation. Because
weather is changing all the time and forecasting error exists, renewable energy have
variability and uncertainty. Actually, every element in power system such as loads,
power lines, and generator availability has variability and uncertainty [99]. Even
conventional power plant like coal fire plant and nuclear cannot avoid from uncertainty
and variability. From the case study by Ernest Orlando Lawrence Berkeley National
Laboratory in reference [99], the output power can be smoothed via large wind farms
integration though there is uncertainty and variability in renewable energy, same
happened when the load aggregating could smooth the load curve. Power quality
including dynamic study caused by variability and uncertainty is a very important part
for stability study.
6.4.2 Wind Energy Conversion
In general, there are two ways to represent the power performance of the wind turbine
in dimensionless form. For fixed wind speed, it will use the power coefficient Cp and
the tip speed ratio λ. For fixed rotor angular speed, the advance ratio J and the rotor
Page 135
Smart Grid Technologies and Implementations
117
speed power coefficient Kp are used [100].For simplicity, the first approach will be
adopted in this paper. For a wind turbine of performance coefficient Cp, air density ρ,
turbine swept area A and wind speed vwind, the output power could be demonstrated in
Equation 6.1 below:
(6.1)
To achieve the maximum value of the output power, the wind turbine needs to be
operated under maximum power coefficient Cp, which is determined by tip speed ratio
λ and blade pitch angle β. Maximum Cp is achieved when the blade pitch angle β is 0.
The relationship between power coefficient Cp and tip speed ratio λ when β equals to 0
is shown in Fig. 6.8 below, and the parameters are from Matlab Help, Distributed
Resources (DR), and wind turbine:
(6.2)
(6.3)
Where the coefficients are:
Fig. 6.8 Rotor power coefficient performance Cp against tip speed ratio λ
3( , )2
m p wind
AP C v
5
21 3 4 6( , ) i
C
p
i
cC c C c e c
3
1 1 0.035
0.08 1i
1 2 3
4 5 6
0.5176; 116; 0.4
5; 21; 0.0068
c c c
c c c
Page 136
Smart Grid Technologies and Implementations
118
Basically, there is a cut-in wind speed when wind turbine is starting. When wind speed
is less than 5m/s, there is no electric power generated from wind. During operation, the
power generated from wind turbine has relationship with wind speed cubed. After
generator reaching its rated power, output power keep constant even though wind speed
is increasing. Wind generators will be shut down when wind speed exceeds25 m/s as
the wind is too strong, and damage will be caused [95]. Fig. 6.9 illustrates the wind
output power changes with wind speed variation.
Fig. 6.9 Wind speed VS output power curve
6.4.3 Solar Energy Conversion
Output power from the solar array depends on how much radiation injecting to solar
array from the sun. Not only affecting by ‘height’ of the sun, the radiation fluctuates all
the time because of quick passing clouds. Fig. 6.10 shows the radiation of Westminster,
London within 24 hours. As can be seen in the figure, the solar radiation changes
dramatically within a short period. However, as mentioned above, the solar output
power will be smoothed by aggregation. The more solar power distributed in different
area, the more smooth total output power from solar could be achieved.
Page 137
Smart Grid Technologies and Implementations
119
Fig. 6.10 Solar radiation for day-time with cloud impact [165]
Fig. 6.11 Photo conversion efficiency VS solar radiation [101]
Fig. 6.11 gives information on the PV characteristics about conversion efficiency when
the solar radiation is changing. The solar radiation in cloudy weather is represented
by500w/m2, and in brilliant weather by 1000w/m2, however, the efficiency of the
photovoltaic conversion does not change too much [101].
6.4.4 DIgSILENT Models for Stability Analysis
A modified WSCC 9-bus model in Fig. 6.12 is represented a power system network,
parameters of the model can be found in reference [102]. The wind and PV models are
0 200 400 600 800 10000
20
40
60
80
100
Solar radiation W/m2
Ph
oto
con
ver
sio
n e
ffic
ien
cy
Page 138
Smart Grid Technologies and Implementations
120
represented by a wind Doubly-Fed Induction Generator and a PV array static generator
in DIgSILENT template respectively. Capacity of the Generator 3 which is connected
to Bus 3, has been reduced from 128MVA to 65.5MVA. The rest of the capacities are
complemented by PV, wind and Battery, which are 60MVA, 40MVA and 60MVA
respectively.
Fig. 6.12 Modified WSCC 9-bus model
Because the wind speed varies stochastically and there is no accurate wind speed data
for such short time, wind speed has been assumed as average value of each 5 seconds.
The wind variation details is illustrated in Table 6.2. And at the same time, with a cloud
passing by the solar array, solar radiation dropped from 1233 W/m2 to 100 W/m2, and
then recovered back to 1233 W/m2 within 40 seconds in this study. Wind speed pattern
and solar radiation pattern is introduced in this case. The wind speed pattern and solar
radiation pattern are drawn in Fig. 6.13 and 6.14.
Time Wind speed (m/s)
1-5s 11
5-10s 8
10-15s 10
15-20s 12
20-25s 8
25-30s 15
30-35s 12
35-40s 9
40-50s 11
Table. 6.2 Wind speed variation from 0-50s
Page 139
Smart Grid Technologies and Implementations
121
Fig. 6.13 Wind speed pattern
Fig. 6.14 Solar radiation pattern
Page 140
Smart Grid Technologies and Implementations
122
Fig. 6.15 Total active power and battery storage variation in Bus 3 when solar
radiation is changing
Fig. 6.16 Total active power and battery storage variation in Bus 3 when wind speed is
changing
Fig. 6.15 shows the result of total active power and battery storage variation in bus 3
when PV radiation is changing, and wind speed is 11m/s. Fig. 6.16 illustrates the result
of active power and battery storage variation when wind speed is changing by following
the previous wind speed pattern. While Fig. 6.17 gives the information about the result
when wind speed and PV radiation are changing at the same time. In the meantime,
system frequency is dropped from rate frequency by 0.2Hz, which is shown in Fig. 6.18.
Page 141
Smart Grid Technologies and Implementations
123
Fig. 6.17 Total active power and battery storage variation in Bus 3 when wind speed
and PV radiation are changing at the same time
Fig. 6.18 System frequency which is measured in Bus 5
Sensitivity analysis is divided into two parts in this section. In Part 1, wind generation
capacity was changed from 40MWto 84MW. The capacity of generator G2 and G3 is
reduced by the same level to test the system frequency when renewable penetration was
increased. In Part 2, the system state was kept the same except reducing the battery
storage from 60MW to30MW. In this case, solar capacity, Load A, Load B and Load C
were kept constant.
G1 (MW) G2 (MW) G3 (MW) Battery
(MVA)
Wind (MW) Maximum System frequency
variation(Hz)
32.88 163 29 60 40 0.1946
46.81 163 0 60 54 0.2291
75.42 123 0 60 64 0.2869
85.16 103 0 60 74 0.3513
75.62 103 0 60 84 0.4162
75.62 103 0 50 84 0.5599
75.62 103 0 40 84 0.6835
75.62 103 0 30 84 0.7929
Table. 6.3 Maximum system frequency change with penetration level and battery
storage level changing
Page 142
Smart Grid Technologies and Implementations
124
In Table. 6.3, frequency will be dropped by increasing the penetration level when
battery storage was stayed the same. With the decreasing of the battery storage capacity,
the maximum system frequency is getting larger. With the same level of battery storage
capacity injecting to the grid, the increased penetration level of the wind and solar could
decrease the frequency stability of the grid. The reason is that the traditional power
plants cannot respond to the sudden variation of the wind generated power. Output
power from wind turbine is un-continuous due to the wind speed is varied all the time.
Large battery array could improve stability. When the battery storage capacity is getting
smaller, demand cannot be feed adequately, thus caused system frequency dropping.
When fix the penetration level to 40 MW and Wind speed pattern was moved
downwards from 0 unit to 5 units with the level each time by 1m/s, the results of
maximum frequency drop is shown in Table. 6.4. After the sensitivity analysis, the
penetration level is changed to 84MW and procedures are repeated. The results of the
maximum frequency deviation are shown in Table. 6.5.
Wind Pattern
dropping Times
Time for Δf reaching
maximum (s)
f (Hz) Δf max(Hz)
0 13.1482 49.8054 0.1946
1 13.1932 49.7913 0.2087
2 14.0112 49.7464 0.2536
3 14.1642 49.6948 0.3052
4 14.1742 49.6569 0.3431
5 14.1942 49.6323 0.3677
Table. 6.4 Maximum frequency error with wind speed pattern dropping when wind
penetration is 40 MW
Wind Pattern
dropping Times
Time for Δf reaching
maximum(s)
f (Hz) Δf max(Hz)
0 13.6842s 49.5853 0.4147
1 13.6912s 49.4088 0.5912
2 13.6772s 49.2803 0.7197
3 13.7002s 49.1865 0.8135
4 13.7442s 49.1179 0.8821
5 13.7812s 49.0718 0.9282
Table. 6.5 Maximum frequency error with wind speed pattern dropping when wind
penetration is 84MW
Page 143
Smart Grid Technologies and Implementations
125
As compared with Table. 6.5, the maximum frequency errors in Table.6.5 are much
larger than that in Table.6.4. With the increase in the wind and solar penetration level,
system frequency is susceptible to the wind speed and solar radiation variation. As can
be seen in the Table. 6.5, whenΔf max is getting large protection will start operation.
6.5 Reliability Indices
There are three major factors driving the changes for developing electric industry and
increasing renewable energies, including government policies, rapidly developing
economies and energy security. Wind energy is under deployment stage, and more
mature than any other technologies such as concentrating photovoltaic and wave energy
in renewable energies, which are under developing stage [166].
Distribution network reliability and generation adequacy attract an increasing number
of countries’ attention in both technical and economic area such as investment in power
systems. Investments on renewable energies and any other components of power
systems require to be considered when carrying out policy making or cost-benefit
analysis. A decision support tool in restructured electricity systems has been
overviewed in [167]. Reliability assessment has been considered in a framework for
creating a common spatial picture to include renewable energy investment [168].
Factors for long-term balancing the national energy requirement, ensuring energy
security and promoting sustainable development for renewable energy resources
investment have been discussed [169].In brief, system reliability assessment always
aims at single technical area, which could not lead investors or operators to make a
clear decision on network planning, rather than considering all the technology areas on
system reliability assessment as a whole. Also, for wind energy planning, distributed
generation and centralized generation have not been compared with each other on
system reliability so far. This section will illustrate the difference between the
centralized wind farm and distributed wind generation on reliability and investment
aspects.
Page 144
Smart Grid Technologies and Implementations
126
6.5.1 Generation Investment
There are some interactive effects between reliability and investment, because the
distribution network operators need to increase reliability of the network or maintain
reliability level of the network by increasing investment [170]. With the increasing
loads in distribution network, operators have to lay out money on grid expending.
Substations, cables, and other electric equipment need to update to deal with high
loading. Fig. 6.19 gives typical characteristic on relationship between cost and
investment. Moreover, roles of distributed generation for increasing network
reliability has been widely recognized [171]. With distributed generation installed,
network expanding will be deferred in a certain degree, and distribution capacity will
be reduced by small capacity of DG assisting. According to Table. 6.6 [172], onshore
wind generation is much more competitive among the DG technologies since the
investment cost is lower than any others, plus the application range is very flexible.
This section applies wind generation to the system for reliability assessment,
comparisons between network reliability indices on applying centralized large wind
generation and small DG wind turbines are addressed.
Fig. 6.19 Relationship between reliability and cost
Page 145
Smart Grid Technologies and Implementations
127
DG Technologies Investment Cost
per kW
Application Range
Reciprocating Engines € 1500-2500 5kW-10MW
Gas Turbines € 1000-1250 1-20MW
Micro Turbines € 1500-2000 30kW-200kW
Fuel Cells € 4500-20000 1kW-5MW
Photovoltaic € 5000-7000 Depending on
number of cells, 1-
20kW
Wind Onshore € 800-1000 200W-3MW
Wind Offshore €2000
Table. 6.6 Distributed generation investment cost and application ranges
Mean Installed and Operation and Maintenance Costs
Unit ($/kW, $/kW-yr) Installed Cost O&M
Utility Scale Wind Offshore 2900 70
Wind Onshore 1600 30
Distributed
Generation
Wind 1~19kW 7500 175
Wind 20~100kW 5100 50
Wind 100~1000kW 2500 50
Table. 6.7 Mean installed cost of utility scale wind farms and DGs
Fig. 6.20 Frequency of failure rate with increasing operational age [173]
From the perspective of investment, the capital cost, operation and maintenance fees
are required to estimate the regular costs and non-regular costs. National Renewable
Page 146
Smart Grid Technologies and Implementations
128
Energy Laboratory (NREL) indicates the range of recent capital cost estimates for both
large-scale renewable energy generations and distributed generations [174]. The
national-level cost data is provided in dollars per installed kilowatts of generating
capacity in 2006, United States. Table. 6.7 shows the mean installed and operation and
maintenance (O&M) cost of the utility scale onshore and offshore wind farms and
distributed wind generations with different capacities. As can be seen in the table, the
mean capital cost and O&M cost of the onshore wind farm are much less than that of
offshore one by 1300$/kW and 40$/kW-yr respectively. However, in distributed wind
generation, the high capacity the distributed wind generator is, the cheaper the installed
cost and O&M cost per kW will be.
6.5.2 Reliability Indices
To evaluate the reliability of a distribution network, three basic reliability data are
required to apply to the system:
1. Average failure rate λS
(6.4)
2. Average outage time rS
(6.5)
3. Average annual outage time US
(6.6)
According to IEEE guide, there are 12 indices (7 in the sustained interruption indices,
2 in the load based indices and 3 in the other momentary indices) to apply to distribution
systems, substations, circuits and defined regions. Sustained interruption indices are
S k
k
SS
S
Ur
S k k
k
U r
Page 147
Smart Grid Technologies and Implementations
129
related to customers affected, including system average interrupt frequency index
(SAIFI), system average interruption duration index (SAIDI), customer average
interruption duration index (CAIDI), customer total average interruption duration index
(CTAIDI), customer average interruption frequency index (CAIFI), average service
availability index (ASAI) and customer experiencing multiple interruption (CEMIn).
Load based indices which are involving average system interruption frequency index
(ASIFI) and average system interruption duration index (ASIDI) are closely linked with
connected served load and interrupted load. Other momentary indices namely
momentary average interruption frequency index (MAIFI), momentary average
interruption event frequency index (MAIFIE) and customers experiencing multiple
sustained interruption and momentary interruption events (CEMSMIn) are addressed
for momentary average interruption events [92]. However, usually generation adequacy
indices such as Total energy not supplied (ENS), loss of load probability (LOLP), loss
of load expectancy (LOLE), loss of energy expectancy (LOEE), and expected demand
not supplied (EDNS) are also placed into the reliability indices.
For distribution and transmission system planning, investors need to consider the
benefit and costs in order to obtain profits from the project. Three pieces of information
need to be considered carefully when estimating the expected or observed changes in
these reliability indicators to justify the costs of the investments required to achieve
smart grid: the utility costs required to achieve given levels of reliability such as
investment, maintenance and operation costs; the changes in CAIDI, SAIFI and MAIFI
which may result from a given smart grid investment or set of investment, and the
average economic losses resulting from the units of unreliability such as CAIDI, SAIFI
and so on [93]. The equations of SAIDI, SAIFI, CAIDI, CAIFI and ENS are shown
below:
Page 148
Smart Grid Technologies and Implementations
130
(6.7)
(6.8)
(6.9)
(6.10)
Where ri is the restoration time for each interruption event, CI is customer interrupted,
CMI is customer minutes interrupted, Ni is number of interrupted customers for each
sustained interruption event during the reporting period, NT is total number of
customers served for the areas, CN is total number of customers who have experienced
a sustained interruptions and momentary interruption events during the reporting period
[92].
Basically, there are two types of failures in wind energy generation. Firstly, mechanical
component failures that are occupy 79% of total number of failures. These include
failures due to the blades, gearbox, hydraulic unit, yaw unit and brake pad. Secondly,
i i
T T
Customer Interruption DurationsSAIDI
Total Number of Coustomers Served
r N CMI
N N
i
T T
Total Number of Customers InterruptedSAIFI
Total Number of Coustomers Served
N CI
N N
i i
i
Customer Interruption DurationCAIDI
Total Number of Coustomers Interrupted
r N SAIDI
N SAIFI
i
Total Number of Coustomers InterruptedCAIFI
Total Number of Coustomers Interrupted
N
CN
Page 149
Smart Grid Technologies and Implementations
131
electrical and electronic components failures that occupy 21% and this includes control
panel, capacitor panel and generator failures [175]. Fig. 6.20 illustrates the frequency
of failure rate of the wind generation with increasing operational age. It can be seen that
the failure rates of wind generators with different capacities are declined with the
increasing operational age. At the beginning of the operational years, the failure rate of
the wind generators with 500-999kW rated power, which was 3.1 in the first year, is
twice as much as that of wind generators with under 500kW rated power. Failure rates
colored in yellow representing wind generators with over 1000kW are dramatically
higher than any other wind generators [173].Here three basic reliability assessment
scenarios will be produced to study the effects of wind generation to the main power
grid. Some of the important reliability indices will be discussed. Investments between
distributed generation and large-scale wind farms will be compared with each other in
order to give decision making to develop renewables. An IEEE 39-bus 10-generator
system is modelled and shown in Fig. 6.21 for reliability assessment. A simple
distribution network for planning distributed generation shown in Fig. 6.22 is
considered in the study.
In order to simplify the system, common stochastic failure rate and time are applied to
same components. Only one customer in each load, failure rates and durations in each
component are given in Table. 6.8.
Power system elements Failure frequency Repair duration Additional fault frequency per
connection
100kV 30kV busbar 0.0002 72 hours 0.0002
11kV 10kV busbar 0.002 14hours 0.005
3.3kV busbar 0.002 14hours 0.005
Line type 0.025 212hours -
Transformer 0.02 343hours -
Table. 6.8 system component reliability parameter
Page 150
Smart Grid Technologies and Implementations
132
Fig. 6.21 New England 39-bus 10-gnerator systems
Page 151
Smart Grid Technologies and Implementations
133
Fig. 6.22 Distribution system for DG planning
Case 1 Distributed generations (DGs) at different busbars
Case 1 illustrates the difference in reliability indices when DGs dep1loyed at different
busbars. In this case, the distribution system with 4 distributed generators is deployed
into the 39-bus system. The results of reliability index in each bus are shown in Table.
6.9. As can be seen in the Table, CAIDI when the DGs are in the busbar 6 is much less
than in any other bus. However, CAIFI in bus 6 is the greatest with DG deployed.
CAIDI without any distributed generation deployment in the system is the worst, while
the CAIFI at that moment is the best.
Page 152
Smart Grid Technologies and Implementations
134
BUS
Number
SAIFI CAIFI SAIDI CAIDI
No DGs 0.066822 0.066822 13.337 199.592
1 0.066839 0.066839 13.338 199.560
2 0.066822 0.066822 13.337 199.592
3 0.066832 0.066832 13.338 199.573
4 0.066838 0.066838 13.338 199.562
5 0.066822 0.066822 13.337 199.592
6 0.067021 0.067021 13.351 199.212
7 0.066832 0.066832 13.338 199.572
8 0.066838 0.066838 13.338 199.560
9 0.066822 0.066822 13.337 199.592
10 0.066822 0.066822 13.337 199.592
11 0.066822 0.066822 13.337 199.592
12 0.066822 0.066822 13.337 199.592
13 0.066822 0.066822 13.337 199.592
14 0.066822 0.066822 13.337 199.592
15 0.066832 0.066832 13.338 199.573
16 0.066879 0.066879 13.341 199.482
17 0.066822 0.066822 13.337 199.592
18 0.066827 0.066827 13.337 199.583
19 0.066842 0.066842 13.339 199.554
20 0.066842 0.066842 13.339 199.554
21 0.066830 0.066830 13.338 199.576
22 0.066822 0.066822 13.337 199.592
23 0.066830 0.066830 13.338 199.577
24 0.066831 0.066831 13.338 199.573
25 0.066829 0.066829 13.338 199.579
26 0.066842 0.066842 13.339 199.554
27 0.066831 0.066831 13.338 199.575
28 0.066828 0.066828 13.338 199.580
29 0.066839 0.066839 13.338 199.560
39 0.066857 0.066857 13.340 199.524
Table. 6.9 Results of reliability index in each bus when deploying DG
Case 2: Multi-centralized wind generation in selected busbars
This case aims to investigate the reliability variations with different number of
centralized wind generation connected into the system. System reliability indices with
zero up to 3 wind generators connected into the system are demonstrated in Table. 6.10.
With the increasing number of wind generators, the system reliability index is getting
Page 153
Smart Grid Technologies and Implementations
135
lower and lower. That is because some additional bus rated failure and duration has
been accounted for the reliability indices.
BUS
Number
SAIFI CAIFI SAIDI CAIDI
NULL 0.066822 0.066822 13.337 199.592
23 0.066830 0.066830 13.338 199.577
23, 29 0.066839 0.066839 13.337 199.560
23,29,39 0.066874 0.066874 13.341 199.492
Table. 6.10 Reliability result for different number of wind generation connected to the
grid
Case 3: Comparison between large-scale wind generation and distributed wind
generation
Large scale wind generation is compared with the same capacity distributed wind
generations in Case 3 which is shown in Table. 6.11 According to Fig. 6.20, the large-
scale wind generation failure rate is 6.8 in the first year and distributed generation
failure rate is 3 times in the first year. These failure rates for large scale wind generation
and distributed generation is applied to Case 3 to observe the differences for these two
kinds of energy generation. Although the failure rate of distributed generation is less
than that of large-scale wind generator, CAIDI of DGs is larger than that of large scale
wind generator. The rest of reliability indices of DGs are better than that of the large-
scale cases.
Large-scale wind generation Distributed wind generation
SAIFI 0.066893 0.066857
CAIFI 0.066893 0.066857
SAIDI 13.342 13.340
CAIDI 199.456 199.524
Table. 6.11 Reliability result for large-scale& DG wind generation
6.6 Conclusion
First of all, there is an overview on the structure and projects in DSS development. The
current survey gives a brief investigation in decision support system from the very
beginning to the future. As a project-oriented structure, DSS cannot be compatible with
every project. However, researchers devote themselves to make contributions to the
Page 154
Smart Grid Technologies and Implementations
136
DSS in order to design a general structure which can be applied into as many
applications as possible. General DSS functionality and requirement have been
discussed. Some classical DSS frameworks with graphical illustration have also been
demonstrated. Cloud computing technology could make a real positive difference in the
future, however, security could be a major issue and full attention should be given to
this.
Secondly, the chapter talks about index and scenarios of a smart grid DSS system inputs
requirement. Two main aspects like power system reliability and stability is given as
examples. 8. Reliability indices of the system with large scale wind generations are
compared to that with distributed generations, investment and cost were considered
with power utilities’ benefits for decision making.
In stability scenarios, a tutorial value is given for the integration of renewables to power
grid. Some simulations have been carried out to demonstrate the physical insight of
such a system. This work demonstrates the physical insight of the system, and also
provides stability indices for cost-benefit analysis and decision making.
Naturally, for a full scale project to be established, it is also required to carry out a cost-
benefit analysis. But in terms of technology, it shows that there are many challenges
and our fellow engineers will have a huge opportunity to make contributions.
Wind energy and Photovoltaic have some degree of compensation ability to each other.
Solar panel can generate electric power during the day when the wind speed is not so
high; during the night, the solar panel cannot generate electricity while the wind
generates electricity as wind speed much higher than day-time. There is a common view
by countries around the world that developing renewable energy is a sustainable way
to deal with the carbon emission and air pollution.
The penetration level of a power system is closely linked with how much flexible
generation capacities installation in the network. To deal with variations of wind and
solar energy generation, these generators should have the capability of fast response.
In the future work, a more complex network will be studied, and more accurate
aerodynamic model will be built for dynamic stability study.
In reliability section, the reliability indices are compared between the use of large-scale
Page 155
Smart Grid Technologies and Implementations
137
wind generators and distributed generators, and between different busbars. The failure
rates of different size of wind generators have been considered during simulations.
Utility scale wind generation is much cheaper than distributed generation wind energy.
With the increasing of generator capacity, the capital cost is getting much cheaper and
cheaper. However, the reliability indices such as SAIFI, CAIFI and SAIDI indicate that
system large-scale generation reliability is worse than that with distributed generation.
Reliability indices such as SAIFI, CAIFI, and SAIDI indicate different meanings in
system reliability. The more wind generators connected to the system, the worse the
system reliability index achieved when only considering the failure duration and
frequency.
Page 156
Smart Grid Technologies and Implementations
138
Chapter 7
Conclusions and Future Work
7.1 Overall Conclusion
Plenty of advanced technologies, creative architectures, and novel algorithms will be
deployed into the existed power system to improve energy efficiency and achieve
resource allocation optimization and make the grid “smart”.
Bi-communication channel deployment is one of the distinct marking of the smart grid.
With smart grid monitoring system, smart grid can collect and transmit the data
monitored from power system components to the system operators and form a bi-
communication channel through the grid from power plant to electricity consumers.
Accurate short-term load forecasting may contribute to the power economic dispatch
and design an appropriate demand response or further load shedding plan to prevent the
loads from over-withdrawing energy from the grid. Long-term load forecasting can
offer a consultative reference to further planning for optimizing energy resource
allocation.
Accurate load forecasting gives further information of the load trend in advance to the
network operators for providing steady energy supply to the consumers. However,
contingency like supply deficit and fault may occur to the power system and impact on
energy consumption. As a key technical solution of self-healing technology, Load
shedding mechanism is the final step to prevent the power system from collapsing and
trying to maintain the integrity of the grid.
The implementation of a smart grid is a step-by-step procedure to replace the old power
system components or planning to build facilities based on existing grid instead of
establishing a brand new grid. For further smart grid planning, it may not only consider
Page 157
Smart Grid Technologies and Implementations
139
the effect from the creative technologies, but also respecting for all stakeholder’s
interest. Decision making may need to execute to analysis each smart grid component
investment and cost before deploying to the real grid.
Regarding to the issues mentioned above, this thesis reveals the overall structure of the
deigned communication and monitoring system. Fully utilization of the information is
one of the main strategies to take the full benefit of smart grid and promote its
acceptance. A case of information from weather forecasting system utilized for load
forecasting is talked in Chapter 4.
This thesis integrates Artificial Neural Network into load forecasting system for Macro
grid load forecast. Details of system architecture and simulation are revealed. Different
training algorithms such as gradient descent, Levemberg-Marquadt and Quasi-Newton
are applied to a 3-layer network for data training. Historical weather and demand data
from Ontario, Canada are applied for load prediction.
In addition, a common contingency of power system, load shedding strategy, is
proposed in this thesis. Lessons learned from India blackout in July 2012 are analyzed.
Some sensitivity analysis has been done to investigate the level of disturbance affected
the grid. A coordinated dispatch schedule is essential for a secure electricity supply.
Otherwise, a load shedding strategy may need to act properly to rescue the entire grid
from collapsing.
Last but not least, the architecture of decision support systems is reviewed and new
trend for decision support system was pointed out for further research. With large
penetration of new technologies such as renewable energies and communication
technologies integrated in power system, problems to power system such as power
stability, reliability, security are appearing or even becoming more critical than in
traditional power grid. Stability scenarios and reliability indices, which demonstrate the
physical insight of the system, are provided for cost-benefit analysis and decision
making.
Page 158
Smart Grid Technologies and Implementations
140
7.2 Trends and Further Work
As a brand new concept and with plenty creative technologies implementation, smart
grid is facing multiple challenges in many diverse aspects such as safety and security,
reliability, power quality, interactivity between grid and customers, market, efficiency,
and so on.
Because of the complexity of the electrical network, especially in distribution systems,
the necessity of intelligent device installation in the system demands evaluation.
Different groups of stakeholders may divide in benefit orientations. Well-balancing
between stakeholders may bring rapid development in smart grid, while how to balance
the interests is one of the ticklers in smart grid development. Since the communication
technology is still experiencing evolution, the communication devices might update
much more rapidly than that of electrotechnical devices which could mislead the
investment evaluation for long-term planning. Other open challenges like what the
system issues of integrating alternative energy sources are, where we place energy
storage devices to improve structural stability of the network, how we integrate micro-
grids are still existing and will be debated between smart grid researchers for long time
in the near future.
With increasing number of communication technologies deployment into power grid,
cyber security is becoming an issue. The impact of cyber-attack to power systems needs
to be simulated according to the real system business and operation scenarios. Data
package missing and modification by criminals may lead to mal-operation in power
systems which may further result in system collapse. Also, reliability of the whole
system and investment on communication may need to be re-evaluated. When the non-
dispatchable energies penetration level is increased, more accurate load forecasting is
required to balance between generation and demand. Thereby, more accurate data is
required for data mining and prediction. To achieve these scenarios, a co-simulation
engine between power system simulator and communication network simulators needs
to be established in the future. Models and Scenarios which are discussed above can be
built and simulated as core part of a decision support system for further evaluation.
Page 159
Smart Grid Technologies and Implementations
141
Optimal planning and coordination are required to take into account for the new
services and technologies deployment. In addition to this, decision support system for
smart grid implementation is extremely necessary for decision makers to take as a
reference. Plenty of advanced technologies, creative architectures, novel algorithms
will be deployed into the existing power systems to improve energy efficiency and
achieve optimization of resource allocation. However, there is no mature tools for
observing all impact of deploying a certain new technology to date. From the decision
making perspective, developing tools for implementation smart grid is extremely urgent
for determination of installing smart device throughout the entire system. A co-
simulation framework has been established during the research, the implementation of
co-simulation between two software need to be take action in the future.
There are numerous technologies applying into the power systems hardware and
software so that the power network could be called “smart grid”. It is not a simple job
to achieve smart grid. To date, the definitions of smart grid published by different
organizations and institutions are not unique. To develop a smart grid, not only technical
aspect need to be considered, but also the economical aspect has to be take into account.
This may need more precise models and accurate data for analyzing the contribution of
a certain new technology. Thus, more research work needs to be done for data mining
and modelling in the future.
Another future task is finding a proper way to integrate the electrical market and
services. Demand response is one of the critical aspects for consumers participating into
a grid activation in the further. New pricing policies such as dynamic pricing and
network operation strategies, for instance, real-time voltage control, need to be
considered in co-simulation and more scenarios need to be generated and compared
with each other for further decision making.
As the last step to prevent the whole grid from collapse, the load shedding scheme will
not only consider the technical aspect, the impact to the system reliability may also need
to be considered in the future work. More complex scenarios will be considered such
as the distributed generation with intended islanding, and new reliability indices for
assessing smart grid reliability and so on. Intelligent systems for reliability
Page 160
Smart Grid Technologies and Implementations
142
improvement also need to be addressed in the future work. Better decision making tools
for system designing and planning will be needed to study for improved security of
electricity supply system with higher reliability. Besides, new indices for smart grid
assessment will be generated. Considering the communication network, signal
generating and reception impacts on electricity delivery will be added to smart grid
reliability assessment.
Investment needs to be considered on smart grid planning in the further study. The
economic benefits and costs to the decision for each year of its life need to be quantified
and calculated.
Page 161
Smart Grid Technologies and Implementations
143
List of Publications
[1]. Hao-Tian Zhang, Fang Yuan Xu and Long Zhou, ‘Artificial neural network for load
forecasting in smart grid’,2010 International Conference on Machine Learning and
Cybernetics, IEEE, Vol. 6, pp. 3200-3205.
[2]. Hao-Tian Zhang and Loi Lei Lai, ‘An overview on smart grid simulator’, 2012
IEEE General Meeting on Power and Energy Society, Page 1-6.
[3]. Hao-Tian Zhang, Qian Yang, Chun Sing Lai and Loi Lei Lai, ‘New trends for
decision support systems’, 2012 IEEE International Conference on Systems, Man,
and Cybernetics, pp. 1373-1378.
[4]. Hao-Tian Zhang and Loi Lei Lai, ‘Research on wind and solar penetration in a 9-
bus network’, 2012 IEEE General Meeting on Power and Energy Society, pp. 1-6.
[5]. Hao-Tian Zhang and Loi Lei Lai, ‘Monitoring system for smart grid’, 2012
International Conference on Machine Learning and Cybernetics, IEEE, Vol. 3, pp.
1030-1037.
[6]. Hao-Tian Zhang and Loi Lei Lai, ‘Reliability and investment assessment for wind
energy generation’, 2012 International Conference on Advances in Power System
Control, Operation and Management, IET, Hong Kong.
[7]. Loi Lei Lai, Hao-Tian Zhang, Sukumar Mishra, Deepak Ramasubramanian, Chun
Sing Lai and Fang Yuan Xu, ‘Lessons learned from July 2012 Indian blackout’,
2012 International Conference on Advances in Power System Control, Operation
and Management, IET, Hong Kong.
Page 162
Smart Grid Technologies and Implementations
144
[8]. Hao-Tian Zhang, Loi Lei Lai and Jiebei Zhu, ‘Survive distribution networks using
an automatic local load shedding scheme’, IEEE SMC 2013, Oct. 2013.
[9]. Loi Lei Lai, Fang Yuan Xu, Hao-Tian Zhang, Linyu Wang, ‘Smart grid and
communication integrated simulator’, Chinese Patent (to be filed).
[10]. Loi Lei Lai, Hao-Tian Zhang, Chun Sing Lai, Fang Yuan Xu and Linyu Wang,
‘Interaction between power network and communication system in smart grid
operation’, under preparation for IEEE Transactions on Power Systems submission.
Page 163
Smart Grid Technologies and Implementations
145
REFERENCES
[1] U.S. Department of Energy, Report to Congress ‘2010 Smart Grid System Report’,
February 2012, Available
on:http://energy.gov/sites/prod/files/2010%20Smart%20Grid%20System%20Rep
ort.pdf, visited on June 24th 2013.
[2] U.S. Department of Energy, Report ‘2009 Smart Grid System Report’, July 2009,
Available
on:http://energy.gov/sites/prod/files/2009%20Smart%20Grid%20System%20Rep
ort.pdf, visited on June 24th 2013.
[3] International Energy Agency, Report ‘Technology Roadmap Smart Grids’, 2011,
Available
on:http://www.iea.org/publications/freepublications/publication/smartgrids_road
map.pdf, visited on June 24th 2013.
[4] China Pours Money into Smart Grid Technology, Available on:
http://www.americanprogress.org/issues/green/report/2011/10/24/10473/china-
pours-money-into-smart-grid-technology/, visited on June 24th 2013.
[5] Yinmin Wang, “China’s Smart Grid Program: One Goal, Two Main Lines, Three
Stages and More”, Available on: http://smartgrid.ieee.org/october-2012/684-china-
s-smart-grid-program-one-goal-two-main-lines-three-stages-and-more, visited on
June 24th 2013.
[6] Zpryme’s Smart Grid Insights, “China: Rise of The Smart Grid”, Available on:
Page 164
Smart Grid Technologies and Implementations
146
https://www.smartgrid.gov/sites/default/files/doc/files/China_Rise_Smart_Grid_2
01103.pdf, Jan. 2011, visited on June 24th 2013.
[7] European commission, Report ‘European SmartGrids Technology Platform’
Available on: http://ec.europa.eu/research/energy/pdf/smartgrids_en.pdf, visited
on June 28th 2013.
[8] Zeng Ming, at al. “Bottleneck Problem Structure of Technical Economy to Strong
Smart Grid in China”, Power and Engineering Conference (APPEEC), 2010 Asia-
Pacific.
[9] http://www.nationalgridus.com/energy/, visited on June 28th 2013.
[10] Anne Harris, “Smart Grid Thinking”, Engineering & Technology Magazine, Vol.
4, Issue 9, 25 May 2009, pp46-49.
[11] “IEEE & Smart Grid”, Available on: http://smartgrid.ieee.org/ieee-smart-grid,
visted on 29th Nov 2013.
[12] “Understanding the Smart Grid: Features, Benefits and Costs”, U.S. Department of
Energy, National Energy Technology Laboratory, 2008.
[13] “NIST Framework and Roadmap for Smart Grid Interoperability Standards,
Release 2.0”, Office of the National Coordinator for Smart Grid Interoperability,
Engineering Laboratory, Available on:
http://www.nist.gov/smartgrid/upload/NIST_Framework_Release_2-0_corr.pdf,
Visited on 1st Dec 2013.
[14] U.S. Department of Energy, National Energy Technology Laboratory,
“Understanding the Benefits of the Smart Grid”, June 18, 2010, pp.1-2.
Page 165
Smart Grid Technologies and Implementations
147
[15] U.S. Department of Energy, National Energy Technology Laboratory, “Advanced
Metering Infrastructure”, February 2008. Available on:
http://www.netl.doe.gov/smartgrid/referenceshelf/whitepapers/AMI%20White%2
0paper%20final%20021108%20(2)%20APPROVED_2008_02_12.pdf, Visited on
1st Dec 2013.
[16] SANDIA REPORT, “Advanced Metering Infrastructure Security Consideration”,
Available on: http://energy.gov/sites/prod/files/oeprod/DocumentsandMedia/20-
AMI_Security_Considerations.pdf, Visited on 1st Dec 2013.
[17] “AMI System Security Requirements”, Available on:
http://energy.gov/sites/prod/files/oeprod/DocumentsandMedia/14-
AMI_System_Security_Requirements_updated.pdf, Visited on 1st Dec 2013.
[18] “Demand Response”, Available on: http://www.pjm.com/markets-and-
operations/demand-response.aspx, Visited on 1st Dec 2013.
[19] James A. Momoh, “Smart Grid Design for Efficient and Flexible Power Networks
Operation and Control”, Power System Conference and Exposition, IEEE PES,
March 2009.
[20] Yang Han, Lin Xu, “A Survey of the Smart Grid Technologies: background,
motivation and practical applications”, Available on:
http://pe.org.pl/articles/2011/6/8.pdf, Visited on 1st Dec 2013.
[21] “The Learning Network”, Available on:
http://learning.blogs.nytimes.com/2011/11/09/nov-9-1965-northeast-is-hit-by-
blackout/?_r=0, Visited on 3 July, 2013.
Page 166
Smart Grid Technologies and Implementations
148
[22] “Wide Power Failure Strikes Southern Brazil”,
http://www.nytimes.com/1999/03/12/world/wide-power-failure-strikes-southern-
brazil.html, Visited on 3 July, 2013.
[23] M. Sforna, M. Delfanti, “Overview of the events and causes of the 2003 Italian
blackout”, Power Systems Conference and Exposition, 2006, IEEE PES.
[24] The Electricity Consumers Resource Council (ELCON), “The Economic Impacts
of the August 2003 Blackout”, February 9, 2004, Available on:
http://www.elcon.org/Documents/EconomicImpactsOfAugust2003Blackout.pdf,
Visited on 3 July.
[25] Shawn Donnan in Jakarta, “Indonesian outage leaves 100m without electricity”,
Available on: http://www.ft.com/cms/s/0/bffd3f32-1044-11da-bd5c-
00000e2511c8.html?nclick_check=1#axzz2YlhTe96B, Visited on 3 July.
[26] Pio de Janeiro, el al, “Millions left in dark by Brazilian blackout”, available on:
http://www.theguardian.com/world/2009/nov/11/itaipu-blackout-hits-brazil,
Visited on 3 July.
[27] “India blackouts leave 700 million without power”, available on:
http://www.theguardian.com/world/2012/jul/31/india-blackout-electricity-power-
cuts, Visited on 3 July.
[28] F. Hussin, M.Y. Hassan, K.L.Lo, “Transmission Congestion Management
Assessment in Deregulated Electricity Market”, Student Conference on research
and development (SCOReD 2006), Shah Alam, Selangor, MALAYSIA, 27-28 June,
2006.
[29] Vehbi C. Gungor, Dilan Sahin, et al, “Smart Grid Technologies: Communication
Page 167
Smart Grid Technologies and Implementations
149
Technologies and Standards”, IEEE Transactions on Industrial Informatics, Vol. 7,
No.4, November 2011.
[30] F. Bagnan Beidou, “Smart Grid: Challenges, Research Directions and Possible
Solutions”, 2010 2nd IEEE International Symposium on Power Electrics for
Distribution Generation Systems.
[31] ‘IEEE Smart Grid Standard List’, IEEE website, [on-line]. Available:
http://smartgrid.ieee.org/standards/ieee-approved-proposed-standards-related-to-
smart-grid, Visited on 3 Dec.
[32] Podmore R., Robinson, M.R., “The Role of Simulators for Smart Grid
Development”, IEEE Transactions on Smart Grid, pp.205-212.
[33] Bouchhima, F., Briere, M., Nicolescu, G., “A SystemC/Simulink Cosimulation
framework for Continuous/Discrete-Events Simulation”, Behavioral Modeling and
Simulation Workshop, IEEE, 2006, pp.1-6.
[34] Taylor James H., Jie Zhang, “Rigorous Hybrid Systems Simulation with
Continuous-time Discontinuities and Discrete-time Components”, Control &
Automation, Mediterranean Conference, 2007, pp.1-6.
[35] Garlapati, S., Hua Lin, Sambamoorthy, S., “Agent Based supervision of Zone 3
Relays to Prevent Hidden Failure Based Tripping”, Smart Grid Communications,
2010, pp.256-261.
[36] Stahlhut, J.W., Browne, T.J., Heydt, G.T., “Latency Viewed as a Stochastic Process
and its Impact on Wide Area Power System Control Signals”, IEEE Transaction on
Power Systems, 2008, pp.84-91.
Page 168
Smart Grid Technologies and Implementations
150
[37] David Anderson, Chuanlin Zhao, Carl H. Hauser, “A Virtual Smart Grid” IEEE
PES Power & Energy Magazine, Volume 10, Number 1, January/February 2012,
pp.49-57.
[38] U.S. Department of Homeland Security, “National Power Grid Simulation
Capability: Needs and Issues”. December 2008.
[39] C. M. Davis, et al., “SCADA Cyber Security Test bed Development”, 38th North
American Power Symposium, 2006, pp.483-488.
[40] Hua Lin, Sambamoorthy. S., Shukla, S., “Power System and Communication
Network Co-Simulation for Smart Grid Applications”, Jan, 2011, Innovative Smart
Grid Technologies (ISGT), IEEE PES pp.1-6.
[41] Sangpetch, T., Lo, K.L., “Stochastic Modeling and AI Techniques for Power
System Reinforcements in A Competitive Energy Market”, Fifth International
Conference on Power System Management and Control, IEE Conf. Publ. No. 488,
April, 2002, pp.377-383.
[42] Dmitry Kosterev, Anatoliy Meklin, “Load Modeling in WECC”, PSCE Meeting,
IEEE, Oct/Nov 2006, pp. 576-581.
[43] Lin, J, “Issues and Challenges in Smart-grid Market Operation and Simulation”,
IEEE PES, General Meeting, July 2011, pp.1-4.
[44] Nutaro, J, “Designing Power System Simulators for The Smart Grid: Combining
Controls, Communications, and Electro-mechanical Dynamics”, IEEE PES
General Meeting, July 2011, pp.1-5.
[45] http://www.gemtc.net/en/news/content.asp?id=10, visited on 9, Nov 2013.
Page 169
Smart Grid Technologies and Implementations
151
[46] M. D. Judd, S. D. J. McArthur, J.R. McDonald and O. Farish, “Intelligent condition
monitoring and asset management Partial discharge monitoring for power
transformers” Power Engineering Journal, Volume 16, Issue 6, 2002, pp297-304.
[47] Stephen D. J. McArthur, Scott M. Strachan, and Gordon Jahn, “The Design of a
Multi-Agent Transformer Condition Monitoring System” IEEE Transactions on
Power Systems, Volume 19, Number 4, November 2004, pp1845-1852.
[48] Y. Han and Y. H. Song, “Condition Monitoring Techniques for
ElectricalEquipment—A Literature Survey”, IEEE Transactions on Power
Delivery, Vol. 18, No. 1, January 2003, pp4-13.
[49] Mladen Kezunovic “Smart Fault Location for Smart Grids”, Transactions on Smart
Grid, Volume 2, No.1 March 2011, pp11-22.
[50] Li Yundong and Zhao weigang, “Intelligent Bridge Monitoring System Based on
3G”, Communications and Networks (CECNet), 2011 International Conference on
Consumer Electronics, 2011, pp426-429.
[51] Liu Yucheng, Liu Yu bin, “Design of Intelligent Monitoring System Based on
Embedded Web” International Forum on Information Technology and Applications,
2009. IFITA '09. Volume 2, 2009, pp521-525.
[52] Wilson Wang, “An Intelligent System for Machinery Condition Monitoring”, IEEE
Transactions on Fuzzy Systems, Volume 16, Number 1, February 2008, pp110-122.
[53] Tingdong Hu, “A Framework of Truck Overload Intelligent Monitoring
System”2011 Fourth International Symposium on Computational Intelligence and
Design (ISCID), Volume 2, 2011, pp 107-110.
Page 170
Smart Grid Technologies and Implementations
152
[54] Jaesoon Choi, JunW. Park, Jinhan Chung, andByoung G. Min, “An Intelligent
Remote Monitoring System forArtificial Heart”, IEEE Transactions on
Information Technology in Biomedicine, Volume 9, Number 4, December 2005,
pp564-573.
[55] Zhang Wei-zhao, Ma Sheng-qian, Fan Man-hong, Li Jin-long, “Design of
Temperature and Humidity Intelligent Monitoring System” International
Conference on Electrical and Control Engineering (ICECE), 2010 , pp782-785.
[56] James L, Kirtley, Jr, Wayne H. Hagman, Bernard C. Lesieutre, Mary Jane Boyd, E.
Paul Warren, Hsiu P. Chou, Richard D. Tabors, “Monitoring the Health of Power
Transformers”, Computer Applications in Power, IEEE, Volume 9, Issue 1, 1996,
pp18-23.
[57] M. Jaya Bharata Reddy, B. Karthik Chandra, D. K. Mohanta “A DOST Based
Approach for the Condition Monitoring of 11 kV Distribution Line Insulators”,
IEEE Transactions on Dielectrics and Electrical Insulation, Volume 18, Issue 2,
2011, pp588-595.
[58] Alex McEachern, “Roles of Intelligent Systems in Power Quality Monitoring: Past,
Present, and Future” 2001, Power Engineering society Summer Meeting, pp1103-
1105.
[59] Stephen D. J. McArthur, Campbell D. Booth, J. R. McDonald and Ian T. McFadyen
“An Agent-Based Anomaly Detection Architecture for Condition Monitoring”
IEEE Transaction on Power Systems, Volume 20 Number.4, November 2005, pp.
1675-1682.
[60] Yingchen Zhang, et al. “Wide-Area Frequency Monitoring Network (FNET)
Page 171
Smart Grid Technologies and Implementations
153
Architecture and Applications”, IEEE Transactions on Smart Grid Volume 1,
Number 2 September 2010, pp.159-167.
[61] Wenzhong Gao, and Jiaxin Ning“Wavelet-Based Disturbance Analysis for Power
System Wide-Area Monitoring” IEEE Transactions on Smart Grid, Volume 2, No.1
March 2011, pp121-130.
[62] Meikang Qiu, Wenzhong Gao, Min Chen, Jian-Wei Niu, and Lei Zhang, “Energy
Efficient Security Algorithm for Power Grid Wide Area Monitoring System”
Transactions on Smart Grid, Volume 2, No.4 December 2011, pp715-723.
[63] Pei Zhang, Fangxing Li and Navin Bhatt, “Next-Generation Monitoring, Analysis
and Control for the Future Smart Control Center”, IEEE Transactions on Smart
Grid, Volume 1, No.2 September 2010, pp186-192.
[64] Mitalkumar G. Kanabar, et al., “Reviewing Smart Grid Standards for Protection,
Control, and Monitoring Applications” Innovative Smart Grid Technologies
(ISGT), 2012 IEEE PES, pp1-8.
[65] Alfredo Vaccaro, Marjan Popov, Domenico Villacci and Vladimir Terzija “An
Integrated Framework for Smart Microgrids Modeling, Monitoring, Control,
Communication, and Verification”, Proceedings of the IEEE, Volume 99, Issue 1,
2011, pp119-132.
[66] Marija D. Ilic´, “Dynamic Monitoring and Decision Systems for Enabling
Sustainable Energy Services”, Proceedings of the IEEE, Volume 99, Issue 1, 2011,
pp58-79.
[67] Alberto Borghetti, Carlo Alberto Nucci, Mario Paolone, “Synchronized Phasors
Monitoring During the Islanding Maneuver of an Active Distribution Network”
Page 172
Smart Grid Technologies and Implementations
154
IEEE Transactions on Smart Grid, Volume 2, No.1 March 2011, pp82-91.
[68] X. Sun, K. S. Lui, K. K. Y. Wong, W. K. Lee, Y. Hou, Q. Huang, and P. W. T. Pong,
“Novel Application of Magnetoresistive Sensors for High-Voltage Transmission-
Line Monitoring”, IEEE Transactions on Magnetics, Volume 10, Number 10,
October 2011, pp2608-2611.
[69] Marcelo Matus, Doris Sáez, Mark Favley, Carlos Suazo-Martínez, José Moya,
Guillermo Jiménez-Estévez, Rodrigo Palma-Behnke, Gabriel Olguín, and Pablo
Jorquera, “Identification of Critical Spans for Monitoring Systems in Dynamic
Thermal Rating” IEEE Transactions on Power Delivery, Volume 27, Number 2,
April 2012, pp1002-1009.
[70] Zhenyu Wang and Guilin Zheng, “Residential Appliances Identification and
Monitoring by a Nonintrusive Method” IEEE Transactions on Smart Grid Volume
3, Number 1, March 2012, pp 80-92.
[71] Eugene A. Feinberg and Dora Genethliou, “Load Forecasting,” in Applied
Mathematics for Restructured Electric Power Systems: Optimization, Control, and
Computational Intelligence (J. H. Chow, F.F. Wu, and J.J. Momoh, eds.), Spinger,
pp. 269-285, 2005.
[72] Grzegorz Dudek “Artificial Immune System for Short-Term Electric Load
Forecasting,” Rutkowski et al. (Eds.): ICAISC 2008, LNAI 5097, pp. 1007–1017,
2008.
[73] Nazih Abu-Shikhah, Fawwaz Elkarmi, “Medium-term electric load forecasting
using singular value decomposition”, Energy 36, 2011, pp4259-4271.
[74] Independent Electricity System Operator (IESO) Home website, Available online
Page 173
Smart Grid Technologies and Implementations
155
at: http://www.ieso.ca/imoweb/siteShared/demand_price.asp, visited on 5th Dec
2013.
[75] Ani1 K. Jain, Jianchang MaoK.M. Mohiuddin, “Artificial Neural Networks: A
tutorial”, Computer, Vol.29, Issue 3, Mar, 1996.
[76] Neural Network tutorial course running by Graham Kendall, available online at
http://www.cs.nott.ac.uk/~gxk/courses/g5aiai/006neuralnetworks/neural-
networks.htm, visited on 5th Dec 2013.
[77] Eugene A. Feinberg and Dora Genethliou, “Load Forecasting,” in Applied
Mathematics for Restructured Electric Power Systems: Optimization, Control, and
Computational Intelligence (J. H. Chow, F.F. Wu, and J.J. Momoh, eds.), Spinger,
pp. 269-285, 2005.
[78] Laurene Fausett, “Fundamentals of Neural Networks-Architectures, Algorithms
and Applications”, Chapter 1, Prentice Hall International, 1994.
[79] Jorge Nocedal, Stephen J. Wright, ‘Numerical Optimization’, Second Edition,
Springer Verlag, ISBN 9780387987934, 2006.
[80] Howard Demuth, Mark Beale and Martion Hagan, “Back propagation” in “Neural
Network Toolbox 6 User’s Guide, Matlab” pp. 5-10 – 5-14.
[81] Russell, Ingrid. “The Delta Rule”. University of Hartford. Available online at
http://uhavax.hartford.edu/compsci/neural-networks-delta-rule.html, Visited on
Dec 5th 2013
[82] Loi Lei Lai, “Intelligent System Applications in Power Engineering – Evolutionary
Programming and Neural Network”, John Wiley & Sons, Chapter 1, 1998, pp1-35.
Page 174
Smart Grid Technologies and Implementations
156
[83] Climate data, available online at http://climate.weather.gc.ca/, visited on Dec 5th
2013.
[84] Population Density of Ontario Canada, Statistics Canada, [on-line]. Availabe at
http://www12.statcan.ca/census-recensement/2006/as-sa/97-550/vignettes/m2o-
eng.htm, visited on Dec 5th 2013.
[85] http://en.wikipedia.org/wiki/Decision_support_system, visited on 16 Dec 2013.
[86] http://dssresources.com/history/dsshistory.html, visited on 16 Dec 2013
[87] Muzafar Ahmad Bhat, Razeef Mohd Shah, Bashir Ahmad, Inayat Rasool Bhat,
“Cloud Computing: A Solution to Information Support Systems (ISS)”
International Journal of Computer Applications, Vol. 11-No.5, Dec. 2010, pp 5-9
[88] ZhenJiang Li and Cheng Chen, Ka i Wang, “Cloud Computing for Agent-Based
Urban Transportation Systems” Intelligent Transportation Systems,
January/February 2011, 2011 IEEE, the IEEE Computer Society, pp73-79
[89] Shah Jahan Miah and Rakib Ahamed, “A Cloud-Based DSS Model for Driver
Safety and Monitoring on Australian Roads”, Int. J. Emerg. Sci., 1(4), Dec.2011,
pp634-648
[90] Dr. Saeed Shiry, “Decision Support Systems”, Introduction
http://ceit.aut.ac.ir/~shiry/lecture/DSS/Introduction.ppt, visited on 3rd of March,
2012
[91] http://www.usatoday.com/news/world/story/2012-07-31/india-power-
outage/56600520/1, visited on 16th Dec, 2013
Page 175
Smart Grid Technologies and Implementations
157
[92] IEEE Guide for Electric Power Distribution Reliability Indices, IEEE Standard
1366-2003, May 2004.
[93] http://fscgroup.com/reports/2011-renew-grid-article.pdf visited on 16 Dec, 2013
[94] Johan HR Enslin, “The Role of Power Electronics and Storageto Increase
Penetration levels of Renewable Power”, IEEE PES General Meeting, July 2008.
[95] Brendan Fox, Damian Flynn, Leslie Bryans, Nick Jenkins, David Milborrow, Mark
O.Malley, Richard Watson and Olimpo Anaya-Lara, Wind Power Integration:
Connection and System Operational Aspects, The Institution of Engineering and
Technology, London, United Kingdom, 2007.
[96] “EU Energy Policy to 2050: Achieving 80-95% Emission Reduction”, Reported
by European Wind Energy Association(EWEA), March 2011.
[97] M. Khantibi and M. Jazaeri, “An Analysis for Increasing the Penetration of
Renewable Energies by Optimal Sizing of Pumped-Storage Power Plants”, Electric
Power Conference(EPEC), Oct 2008, IEEE Canada.
[98] “Western Wind and Solar Integration Study: Executive Summary”, GE Energy,
prepared for The National Renewable Energy Laboratory, DOE, US, May, 2010
[99] Andrew Mills, et al., “Understanding Variability andUncertainty of Photovoltaics
for Integration with the ElectricPower System” reported by Ernest Orlando
Lawrence BerkeleyNational Laboratory, Report No. LBNL-2855E, December
2009.
[100] David. A. Spera. Wind Turbine Technology: FundamentalConcepts of Wind
Page 176
Smart Grid Technologies and Implementations
158
Turbine Engineering, ASME Press, 2009.
[101] Mukund R. Patel, Wind and Solar Power Systems: design,Analysis and
Operation, Taylor and Francis, 2006.
[102] P.M. Anderson and A. A. Fouad, Power System Control andStability, 2nd
Edition, IEEE Press and Wiley, 2003.
[103] G. Anderson, Dynamics and Control of Electric Power Systems, Power
Systems Laboratory, ETH Zurich, Feb 2011
[104] H. E. Lokay, V. Burtnyk, “Application of under-frequency relays for automatic
load shedding”, IEEE Transactions on Power Apparatus and Systems, Vol. PAS-87,
No. 3, March 1968, pp. 776-783.
[105] Lukic, M, Kuzle, I., Tesnjak, S. “An adaptive approach to setting
underfrequency load shedding relays for an isolated power system with private
generation”, 1998 Electrotechnical Conference. MELECON 98., 9th
Mediterranean,Vol. 2, pp. 1122-1125.
[106] Terzija, V. “Adaptive underfrequency load shedding based on the magnitude
of the disturbance estimation”,IEEE Transactions on Power Systems, Vol. 21, No.
3, 2006, pp. 1260-1266.
[107] ALSTOM, “Network Protection & Automation Guide”, Chapter 8-Protection
Signaling and Inter-tripping, First Edition, July 2002
[108] Baran, M.E., Wu, F.F., "Network reconfiguration in distribution systems for
loss reduction and load balancing," IEEE Transactions on Power Delivery, Vol. 4,
No.2, pp.1401-1407, Apr 1989.
Page 177
Smart Grid Technologies and Implementations
159
[109] http://www.usatoday.com/news/world/story/2012-07-31/india-power-
outage/56600520/1, visited on 16th Dec, 2013
[110] Global Data, “July 2012 Power Blackout in Northern India – Undisciplined
State Electricity Boards and Technology Shortcomings to Blame” Reference Code:
GDSG0053VPT
[111] http://spectrum.ieee.org/energywise/energy/the-smarter-grid/disappointing-
monsoon-season-wreaks-havoc-with-indias-grid, visited on16th Dec, 2013
[112] http://www.bloomberg.com/news/2012-08-01/worst-india-outage-highlights-
60-years-of-missed-targets-energy.html, visited on 16th Dec, 2013
[113] “Report of the Enquiry Committee on Grid Disturbance in Northern Region
on 30th July 2012 and in Northern, Eastern & North-eastern Region on 31st July
2012”, http://www.cea.nic.in/reports/articles/god/grid_disturbanc e_report.pdf ,
visited on 16th Aug, 2012
[114] “Operation Performance Report for the Month of July 2012”,
http://www.nldc.in/NLDC/monthlyreport/July%20
2012%20Monthly%20Report%20.pdf, visited on 16th Aug, 2012
[115] 2010 Smart Grid System Report, Report to Congress February 2012, DOE.
http://energy.gov/sites/prod/files/2010%20Smart%20Grid%20System%20Report.
pdf visited on 19th Jan 2013
[116] M. McGranaghan and F. Goodman, “TECHNICAL AND SYSTEM
REQUIREMENTS FOR ADVANCED DISTRIBUTION AUTOMATION”, 18th
Page 178
Smart Grid Technologies and Implementations
160
International Conference and Exhibition on Electricity Distribution, 2005. CIRED
2005.
[117] Scott Schoenherr, “Wireless Technologies for Distribution Automation”,
Transmission and Distribution Conference and Exposition, 2003 IEEE PES
[118] R. W. Uluski, “The Role of Advanced Distribution Automation in the Smart
Grid”, Power and Energy Society General Meeting, 2010 IEEE
[119] A.G. Phadke and J.S. Thorp “Communication needs for Wide Area
Measurement applications”, Conference on Critical Infrastructure (CRIS), 2010
5th International
[120] “Network Protection & Automation Guide”
http://www.csteixeira.com/misc/E-
Books/network%20protection%20&%20automation%20guide.pdf, visited on 19th
Jan 2013
[121] Massoud Amin “Challenges in Reliability, Security, Efficiency, and Resilience
of Energy Infrastructure: Toward Smart Self-healing Electric Power Grid”, Power
and Energy Society General Meeting - Conversion andDelivery of Electrical
Energy in the 21st Century, 2008 IEEE
[122] Seethalekshmi K., S. N.Singh, and S. C. Srivastava, “A Synchrophasor
Assisted Frequency and Voltage Stability Based Load Shedding Scheme for Self-
Healing of Power System” Smart Grid, IEEE Transactions on Volume: 2 , Issue: 2
[123] Haibo You, Vijay Vittal, and Zhong Yang, “Self-Healing in Power Systems:
Page 179
Smart Grid Technologies and Implementations
161
An Approach Using Islanding and Rate of Frequency Decline-Based Load
Shedding” Power Systems, IEEE Transactions on Volume: 18 , Issue: 1
[124] K. A. Nigim and Y. G. Hegazy, “INTENTION ISLANDING OF
DISTRIBUTED GENERATION FOR RELIABILITY ENHANCEMENT” Power
Engineering Society General Meeting, 2003, IEEE, Volume: 4
[125] “Distributed Generation in Future Grids” http://www.leonardo-
energy.org/sites/leonardo-energy/files/root/Documents/2009/FutureGrids.pdf,
visited on 19th Jan 2013
[126] Vehbi C. Gungor, et al. “Smart Grid Technologies: Communication
Technologies and Standards”, Industrial Informatics, IEEE Transactions on,
Volume: 7 , Issue: 4
[127] IEADSM Report on “Integration of Demand Side Management, Distributed
Generation, Renewable Energy Sources and Energy Storages” Integration of
Renewables into the Distribution Grid, CIRED 2012 Workshop
[128] Hua Lin, et al. “GECO: Global Event-Driven Co-Simulation Framework for
Interconnected Power System and Communication Network” Smart Grid, IEEE
Transactions on Volume: 3 , Issue: 3
[129] Martin Levesque et al. “Communication and Power Distribution Network Co-
simulation for Multidisciplinary Smart Grid Experimentations” Proceeding
ANSS’12 Proceedings of the 45th Annual Simulation Symposium Article No. 2,
Society for Computer Simulation International, San Diego, CA, USA 2012.
[130] K. Hopkinson, W. Xiaoru, R. Giovanini, J. Thorp, K. Birman, and D. Coury,
“EPOCHS: A platform for agent-based electric power and communication
Page 180
Smart Grid Technologies and Implementations
162
simulation built from commercial off-the-shelf components,” IEEE Trans. Power
Syst., vol. 21, pp. 548–558, 2006.
[131] J. Nutaro, P. T. Kuruganti, L. Miller, S. Mullen, and M. Shankar, “Integrated
hybrid-simulation of electric power and communications systems,” in Proc. IEEE
Power Eng. Soc. Gen. Meet. 2007, pp. 1–8.
[132] K. Zhu, M. Chenine, and L. Nordstrom, “ICT architecture impact on wide area
monitoring and control systems’ reliability,” IEEE Trans. Power Del., vol. 26, no.
4, pp. 2801–2808, Oct. 2011.
[133] W. Li, A. Monti, M. Luo, and R. A. Dougal, “VPNET: A co-simulation
framework for analyzing communication channel effects on power systems,” in
Proc. 2011 IEEE Electr. Ship Technol. Symp. (ESTS), pp. 143–149.
[134] V. Liberatore and A. Al-Hammouri, “Smart grid communication and co-
simulation,” in Proc. 2011 IEEE Energytech, pp. 1–5.
[135] T. Xiaoyang, “The co-simulation extending for wide-area communication
networks in power system,” in Proc. 2010 Asia-Pacific Power Energy Eng. Conf.
(APPEEC), pp. 1–4.
[136] C. M. Davis, J. E. Tate, H. Okhravi, C. Grier, T. J. Overbye, and D. Nicol,
“SCADA cyber security testbed development,” in Proc. 38th North Amer. Power
Symp. (NAPS 2006), pp. 483–488.
[137] M. Mallouhi, Y. Al-Nashif, D. Cox, T. Chadaga, and S. Hariri, “A testbed for
analyzing security of SCADA control systems (TASSCS),” in Proc. 2011 IEEE
PES Innov. Smart Grid Technol. (ISGT), pp. 1–7.
[138] Sevov, L, Zhao, T.W., Voloh, I. “The Power of IEC 61850: Bus-transfer and
Page 181
Smart Grid Technologies and Implementations
163
load-shedding applications”, IEEE Industry Applications Magazine, No. 19 , No.
1, Jan.-Feb. 2013, pp. 60-67.
[139] Jethwa, U.K.; Bansal, R.K.; Date, N.; Vaishnav,R. “Comprehensive load-
shedding system”, IEEE Transactions on Industry Applications, Vol. 46 , No.
2, pp. 740-749.
[140] Ying-Yi Hong, Po-Hsuang Chen, “Genetic-based underfrequency load
shedding in a stand-alone power system considering fuzzy loads”, IEEE
Transactions on Power Delivery, Vol. 27, No. 1, Jan. 2012, pp. 87-95.
[141] FarrokH Shokooh, et al., “Intelligent load shedding-case study of the
application in a large industrial facility”, IEEE INDUSTRY APPLICATIONS
MAGAZINE, Mar-Apr, 2011, pp. 44-53.
[142] Mahat, P., Zhe Chen, Bak-Jensen, B., “Underfrequency load shedding for an
islanded distribution system with distributed generators”, IEEE Transactions on
Power Delivery, Vol. 25, No. 2, 2010, pp. 911-918.
[143] Ceja-Gomez,F, Qadri, S.S.; Galiana, F.D. “Under-frequency load shedding via
integer programming”, IEEE Transactions on Power Systems, Vol.27 , Issue: 3,
Aug. 2012, pp1387-1394.
[144] Hans-Herbert Wagschal, “New Perspective in Decision Support for Port
Planning” Decision Support Systems 1, 1985, Elsevier Science Publisher B. V.
(North-Holland), pp.277-292
[145] W.P.A van der Heyden and J.A. OTTJES, “A Decision Support System for the
Planning of the Workload on a Grain Terminal” Decision Support Systems 1, 1985,
Elsevier Science Publisher B. V. (North-Holland), pp.293-297
Page 182
Smart Grid Technologies and Implementations
164
[146] Gianluca Campanella, Rita A. Ribeiro, “A framework for dynamic multiple-
criteria decision making” Decision Support Systems 52, 2011, Elsevier Science
Publisher B. V. (North-Holland), pp.52-60
[147] W. Hu, A Almansoori, P.K. Kannan, S.Azarm, Z.Wang, “Corporate dashboards
for integrated business and engineering decision in oil refineries: An agent-base
approach: An agent-based approach” Decision Support Systems 52, 2012, Elsevier
Science Publisher B. V. (North-Holland), pp.729-741
[148] Zhenjiang Li and Cheng Chen, Kai Wang, “Cloud Computing for Agent-Based
Urban Transportation Systems” Intelligent Transportation Systems,
January/February 2011, 2011 IEEE, the IEEE Computer Society, pp73-79
[149] Shah Jahan Miah and Rakib Ahamed, “A Cloud-Based DSS Model for Driver
Safety and Monitoring on Australian Roads”, Int. J. Emerg. Sci., 1(4), Dec.2011,
pp634-648
[150] Arun SEN and Gaytam Biswas, “Decision Support Systems: An Expert
System Approach”, Decision Support Systems 1, 1985, Elsevier Science
Publisher B. V. (North-Holland), pp.197-204
[151] Michael C CHEN and Lawtence J. Henschen, “On the Use and Internal
Structure of Logic-base DSS” Decision Support Systems 1, 1985, Elsevier
Science Publisher B. V. (North-Holland), pp.205-219
[152] Ting-Peng Liang, “Integrating Model Management with Data Management in
Decision Support Systems” Decision Support Systems 1, 1985, Elsevier Science
Publisher B. V. (North-Holland), pp.221-232
[153] Amitava DUTTA and Hemant K. JAIN, “A DSS for Distributed Computer
Page 183
Smart Grid Technologies and Implementations
165
System Design in the presence of Multiple Conflicting Objectives” Decision
Support Systems 1, 1985, Elsevier Science Publisher B. V. (North-Holland),
pp.233-246
[154] H.K. Klein and R. Hirschheim, “Fundamental Issues of Decision Support
Systems: A Consequentiality Perspective” Decision Support Systems 1, 1985,
Elsevier Science Publisher B. V. (North-Holland), pp.5-24
[155] Suranjan De, Shimon Y. Nof and Andrew B. Whinston, “Decision Support in
computer-Integrated Manufacturing” Decision Support Systems 1, 1985, Elsevier
Science Publisher B. V. (North-Holland), pp.37-56
[156] David Dery and Theodore J. Mock, “Information Support Systems for Problem
Solving” Decision Support Systems 1, 1985, Elsevier Science Publisher B. V.
(North-Holland), pp.103-109
[157] Henk G. SOL, “Aggregating Data for Decision Support” Decision Support
Systems 1, 1985, Elsevier Science Publisher B. V. (North-Holland), pp.111-121
[158] Yannis Vassiliou, James Clifford and Mattias Jarke, “Access to Specific
Declarative Knowledge by Expert System: The Impact of Logic Programming”
Decision Support Systems 1, 1985, Elsevier Science Publisher B. V. (North-
Holland), pp.123-141
[159] Chao Fang, Franck Marle, “A simulation-Based risk Network model for
decision support in project risk management” Decision Support Systems 52, 2012,
Elsevier Science Publisher B. V. (North-Holland), pp.635-644
[160] Xingquan Zhu, Bin Li, Xindong Wu, Dan He, Chengqi Zhang, “CLAP:
Collaborative pattern mining for distributed information systems” Decision
Page 184
Smart Grid Technologies and Implementations
166
Support Systems 52, 2011, Elsevier Science Publisher B. V. (North-Holland),
pp.40-51.
[161] Brandon A. Beemer, Dawn G Gregg, “Dynamic interaction in knowledge
based systems: An exploratory investigation and empirical evaluation” Decision
Support Systems 49, 2010, Elsevier Science Publisher B. V. (North-Holland),
pp.386-395
[162] Guang-Zhi Ma, Enmin Song, Chih-Cheng Hung, Li Su, Dong-Shan Huang,
“Multiple costs based decision making with back-propagation neural networks”
Decision Support Systems 52, 2012, Elsevier Science Publisher B. V. (North-
Holland), pp.657-663
[163] Samuel W.K. Chan, James Franklin, “A Text-Based Decision Support System
for Financial Sequence Prediction” Decision Support Systems 52, 2011, Elsevier
Science Publisher B. V. (North-Holland), pp.189-198
[164] Muzafar Ahmad Bhat, Razeef Mohd Shah, Bashir Ahmad, Inayat Rasool Bhat,
“Cloud Computing: A Solution to Information Support Systems (ISS)”
International Journal of Computer Applications, Vol. 11-No.5, Dec. 2010, pp 5-9
[165] Weather monitoring Systwm, Available online
http://weather.lgfl.org.uk/qgraphs.aspx?sid=2&pid=4, visited on 13 Dec 2013
[166] T. S. Key, “Future of Renewable Energy Development &Deployment”, Power
& Energy Society General Meeting, 2009. PES '09. IEEE, pp. 1.
[167] Ebrahim Vaahedi, Mohammad Shahidehpour, “Decision Support Tools in
Restructured Electricity Systems An Overview”, IEEE Transactions on Power
Systems, Vol.19,No.4, November 2004, pp1999-2005
Page 185
Smart Grid Technologies and Implementations
167
[168] Sreenivas R. Sukumar, et, al. “Modeling Resource, Infrastructure, and Policy
Cost Layers for Optimizing Renewable Energy Investment and Deployment”,
Innovative Technologies for an Efficient and Reliable Electricity Supply (CITRES),
2010 IEEE Conference, pp 151-158.
[169] Udochukwu B. Akuru, Ogbonnaya I. Okoro, “Renewable Energy Investment
in Nigeria: A Review of the Renewable Energy Master Plan”, Energy Conference
and Exhibition (EnergyCon), 2010 IEEE International, pp166-171
[170] Ron Allan, Roy Billinton “Probabilistic Assessment of Power Systems”,
Proceedings of the IEEE, Feb. 2000,Vol. 88, Issue 2, pp.140-162
[171] Piccolo, A.; Siano, P, “Evaluating the Impact of Network Investment Deferral
on Distributed Generation Expansion” IEEE Transactions on Power Systems, Aug.
2009, Vol.24, Issue:3, pp1559-1567
[172] G. Pepermans et al. “Distributed generation: definition, benefits and issues”,
Energy Policy 33, 2005, pp787-798
[173] Berthold Halm, Micharl Durstewitz, Kurt Rohrig, “Reliability of Wind
Tubines” http://www.iset.uni-kassel.de/abt/FB-I/publication/2006-02-09
Reliability.pdf, visited on 27th of April, 2012.
[174] www.nrel.gov/analysis/tech_costs.html visited on 27th of April, 2012
[175] G.M. Joselin Herbert, S. Iniyan, Ranko Goic, “Performance, reliability and
failure analysis of wind farm in a developing Country”, Renewable Energy 35,
2010, Elsevier Science Publisher, pp2739-2751
Page 186
Smart Grid Technologies and Implementations
168
Appendix I
Biological Neural Networks
Biological neuron which is contained in our brain pallium, is a special cell that can
process information received from other neurons and transmit the signals generated by
its cell body. These signals are transmitted via axon and branches into strands and sub-
strands, whose terminals are so called “synapses”. A synapse is an elementary structure
and functional unit between two neurons. The signals passing through a synapse can
adjust the effectiveness of the synapse, and makes synapse be able to learn from the
activities they participate [75].
A simplified biological neuron model is shown in Fig. A.I. As can be seen in the figure,
a neuron includes:
1. a cell body or so called “Soma” with a nucleus inside
2. a number of dendrites which is the receiver connecting to other neurons
3. an axon which is the transmitter and eventually split into a number of strands to link
to other neurons
4. A single neuron may connect with 100,000 other neurons via dendrites and axons
[76].
Fig. A.I.Biological Neuron [76]
Page 187
Smart Grid Technologies and Implementations
169
Appendix II
Network Data for IEEE 33-bus Test System
in Chapter 5
1. 33-bus System Network Data
Line Number Sending Bus Receiving Bus
Load at receiving end bus
Impedance
(Ohm)
Power
(kVA)
1 1 2 0.0922+j0.0477 100+j60
2 2 3 0.493+j0.2511 90+j40
3 3 4 0.366+j0.1864 120+j80
4 4 5 0.3811+j0.1941 60+j30
5 5 6 0.819+j0.707 60+j20
6 6 7 0.1872+j0.6188 200+j100
7 7 8 1.7114+j1.2351 200+j100
8 8 9 1.03+j0.74 60+j20
9 9 10 1.04+j0.74 60+j20
10 10 11 0.1966+j0.065 45+j30
11 11 12 0.3744+j0.1238 60+j35
12 12 13 1.468+j1.155 60+j35
13 13 14 0.5416+j0.7129 120+j80
14 14 15 0.591+j0.526 60+j10
15 15 16 0.7463+j0.545 60+j20
16 16 17 1.289+j1.721 60+j20
17 17 18 0.732+j0.574 90+j40
18 2 19 0.164+j0.1565 90+j40
19 19 20 1.5042+j1.3554 90+j40
20 20 21 0.4095+j0.4784 90+j40
21 21 22 0.7089+j0.9373 90+j40
22 3 23 0.4512+j0.3083 90+j50
23 23 24 0.898+j0.7091 420+j200
24 24 25 0.896+j0.7011 420+j200
25 6 26 0.203+j0.1034 60+j25
26 26 27 0.2842+j0.1447 60+j25
27 27 28 1.059+j0.9337 60+j20
28 28 29 0.8042+j0.7006 120+j70
29 29 30 0.5075+j0.2585 200+j600
30 30 31 0.9744+j0.963 150+j70
31 31 32 0.3105+j0.3619 210+j l00
32 32 33 0.341+j0.5302 60+j40
33a 21 8 2+j2
Page 188
Smart Grid Technologies and Implementations
170
34a 9 15 2+j2
35a 12 22 2+j2
36a 18 33 0.5+j0.5
37a 25 29 0.5+j0.5
Substation voltage = 12.66 kV, MVA base = 10 MVA
2. Generator Governors parameters
Hydro Generator Parameter
Power MVA 3 MVA
Terminal voltage 12.66 kV
Permanent droop R 0.04
Temporary droop r 0.5
Governor Time Constant Tr 8.408
Filter Time Constant Tf 0.05 s
Servo time constant Tg 0.5 s
Water starting time Tw 0.496 s
Turbine Gain At 1.15
Gate Velocity Limit Velm 0.2 p.u.
Maximum Gate Limit Gmax 1
Gas Generator Parameter
Power MVA 0.8 MVA
Terminal voltage 12.66 kV
Speed droop R 0.02
Controller Time Constant T1 0.4 s
Actuator Time Constant T2 0.1 s
Compressor Time Constant T3 3 s
Ambient Temperature Load limit
AT 1
Turbine Factor Kt 2
Controller Minimum Output Vmin 0
Controller Maximum Output Vmax 1 p.u.
Diesel Generator Parameter
Power MVA 0.8 MVA
Terminal voltage 12.66 kV
Actuator Gain K 10
T1 0.2
T2 0.3
T3 0.3
T4 1
T5 0.1
T6 0.2
Droop 0.03
Combustion Delay 0.01
Time constant power feedback 0.5
Minimum Throttle
0
Maximum Throttle 1
DFIG Wind Generator Parameter
Power MVA 1 MVA
Terminal voltage 0.69/12.66 kV