City, University of London Institutional Repository Citation: Low, N., Butt, S., Ellis, P. and Davis Smith, J. (2007). Helping out: a national survey of volunteering and charitable giving. London: Cabinet Office. This is the unspecified version of the paper. This version of the publication may differ from the final published version. Permanent repository link: http://openaccess.city.ac.uk/2547/ Link to published version: Copyright and reuse: City Research Online aims to make research outputs of City, University of London available to a wider audience. Copyright and Moral Rights remain with the author(s) and/or copyright holders. URLs from City Research Online may be freely distributed and linked to. City Research Online: http://openaccess.city.ac.uk/ [email protected]City Research Online
Transcript
City, University of London Institutional Repository
Citation: Low, N., Butt, S., Ellis, P. and Davis Smith, J. (2007). Helping out: a national survey of volunteering and charitable giving. London: Cabinet Office.
This is the unspecified version of the paper.
This version of the publication may differ from the final published version.
Copyright and reuse: City Research Online aims to make research outputs of City, University of London available to a wider audience. Copyright and Moral Rights remain with the author(s) and/or copyright holders. URLs from City Research Online may be freely distributed and linked to.
City Research Online: http://openaccess.city.ac.uk/ [email protected]
Helping Out: A national survey of volunteering and charitable giving
Natalie Low, Sarah Butt, Angela Ellis Paine and Justin Davis Smith
Prepared for the Office of the Third Sector in the Cabinet Office by the National Centrefor Social Research and the Institute for Volunteering Research
The authors ...................................................................................................................................................................... 6
1.1 Setting the scene............................................................................................................................................. 10
1.2.1 Formal and informal volunteering ..................................................................................................... 10
1.2.2 Regular and occasional volunteering................................................................................................. 11
1.2.3 PSA4 target groups and those ‘at risk of social exclusion’ ................................................................. 11
1.2.4 Giving and donations........................................................................................................................ 12
1.2.5 Current, regular and tax-efficient giving............................................................................................ 12
1.3 Summary of study methods............................................................................................................................. 12
1.3.1 Study management .......................................................................................................................... 12
1.4.1 Reading tables in this report ............................................................................................................. 13
2 The extent of formal volunteering ........................................................................................................................ 15
2.2 Levels of formal volunteering........................................................................................................................... 15
2.3 The frequency of formal volunteering.............................................................................................................. 15
2.4 Average amount of time spent volunteering.................................................................................................... 16
2.5 Economic value of formal volunteering............................................................................................................ 16
2.6 Comparisons with other studies ...................................................................................................................... 16
3 Who volunteers?...................................................................................................................................................... 19
3.2 Age and sex .................................................................................................................................................... 19
3.3 Employment status .......................................................................................................................................... 20
3.6 Government Office region ............................................................................................................................... 21
3.7 Risk of social exclusion (PSA4) ......................................................................................................................... 21
4 What volunteers do ................................................................................................................................................. 23
4.2 Number and sector of organisations helped .................................................................................................... 23
4.3 Field of interest of organisations helped .......................................................................................................... 24
4.3.1 Fields of interest supported by different groups of volunteers ........................................................... 25
4.4 Types of volunteering activity........................................................................................................................... 28
4.4.1 Variation in volunteering activity by demographic group................................................................... 29
Contents
2 Helping Out: A national survey of volunteering and charitable giving
5 Routes into volunteering ........................................................................................................................................ 33
5.1 The reasons why people volunteer................................................................................................................... 33
5.1.1 Motivations of current formal volunteers .......................................................................................... 33
5.1.2 Variations in motivations among different demographic groups........................................................ 34
5.2 Finding out about volunteering ....................................................................................................................... 37
5.2.1 Routes into volunteering................................................................................................................... 37
5.2.2 Sources of information about volunteering ....................................................................................... 40
6 The organisation of volunteering .......................................................................................................................... 44
6.2 Advice and support ......................................................................................................................................... 44
6.2.1 Availability of advice and support ..................................................................................................... 44
6.2.2 Need for advice and support............................................................................................................. 44
6.2.3 Satisfaction with advice and support................................................................................................. 45
6.3 Payment of expenses ....................................................................................................................................... 46
6.3.1 Receiving fees or allowances............................................................................................................. 47
6.4 Provision of training......................................................................................................................................... 47
6.4.1 Satisfaction with training .................................................................................................................. 48
6.5 Elements of volunteer management ................................................................................................................ 48
6.7 The opportunity to manage others .................................................................................................................. 54
7 The benefits and drawbacks of volunteering ....................................................................................................... 55
7.2 Reflections on the experience of volunteering: the highs and lows .................................................................. 55
7.3 Recognition and qualifications......................................................................................................................... 58
7.3.1 The importance of recognition.......................................................................................................... 58
7.4 The personal benefits of volunteering.............................................................................................................. 60
8 Limitations to volunteering .................................................................................................................................... 64
8.2 Past experience of volunteering ....................................................................................................................... 64
8.2.1 Reasons for stopping volunteering.................................................................................................... 64
8.3 The potential to ‘grow’ volunteering ............................................................................................................... 65
8.3.1 What would people do if they became volunteers ............................................................................ 66
8.4 Barriers to volunteering ................................................................................................................................... 68
8.4.1 Making it easier to get involved........................................................................................................ 69
9.2 Existence of employer-supported volunteering and giving schemes.................................................................. 72
9.2.1 Types of scheme ............................................................................................................................... 73
9.2.2 Participation in employer-supported volunteering and giving ............................................................ 73
9.2.3 Frequency of participation in employer-supported volunteering schemes .......................................... 73
9.2.4 Benefits of volunteering through employer-supported volunteering schemes .................................... 74
9.3 Increasing participation in employer-supported volunteering and giving schemes ............................................ 75
9.3.1 Setting up new schemes................................................................................................................... 75
9.3.2 Making it easier to get involved in existing schemes ......................................................................... 75
10 The extent of charitable giving .............................................................................................................................. 77
10.2 Levels of charitable giving................................................................................................................................ 77
10.3 Methods of charitable giving ........................................................................................................................... 77
10.4 Average amount donated................................................................................................................................ 78
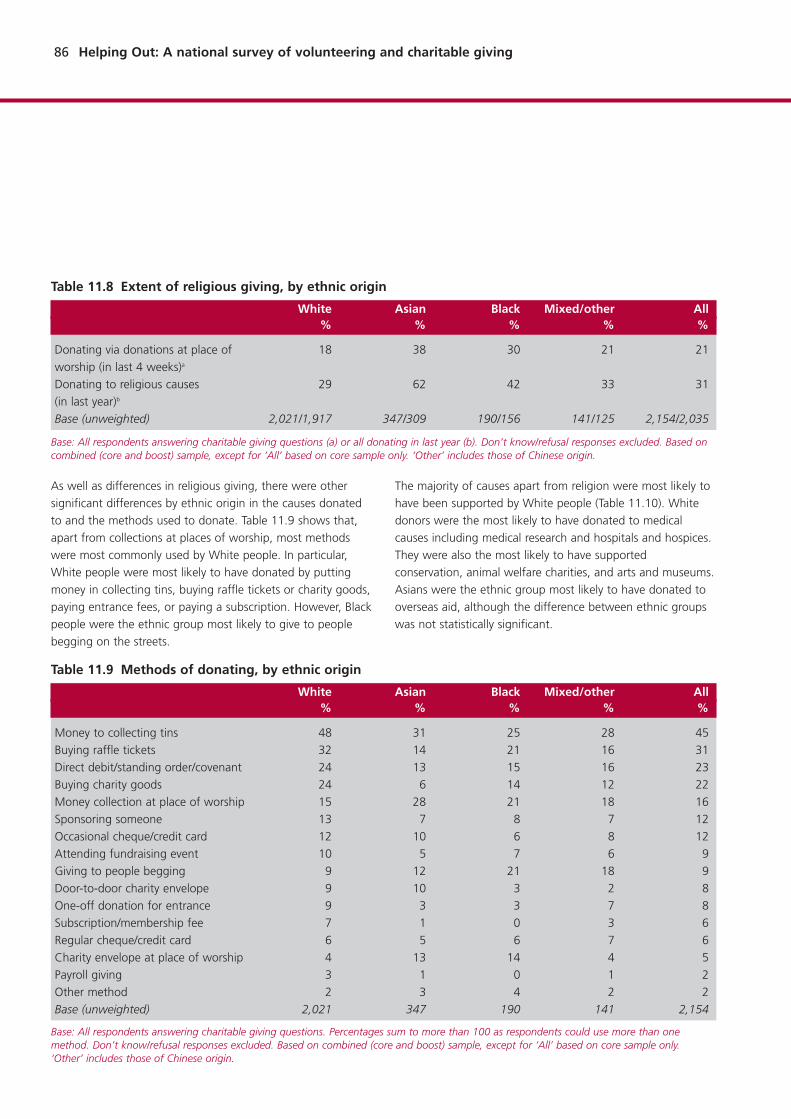
10.5 Causes donated to .......................................................................................................................................... 79
10.6 Comparisons with other studies ...................................................................................................................... 79
11 Who gives? ............................................................................................................................................................... 82
11.2 Age and sex .................................................................................................................................................... 82
11.3 Employment status .......................................................................................................................................... 83
11.4 Income ............................................................................................................................................................ 84
11.7 Risk of social exclusion (PSA4) ......................................................................................................................... 87
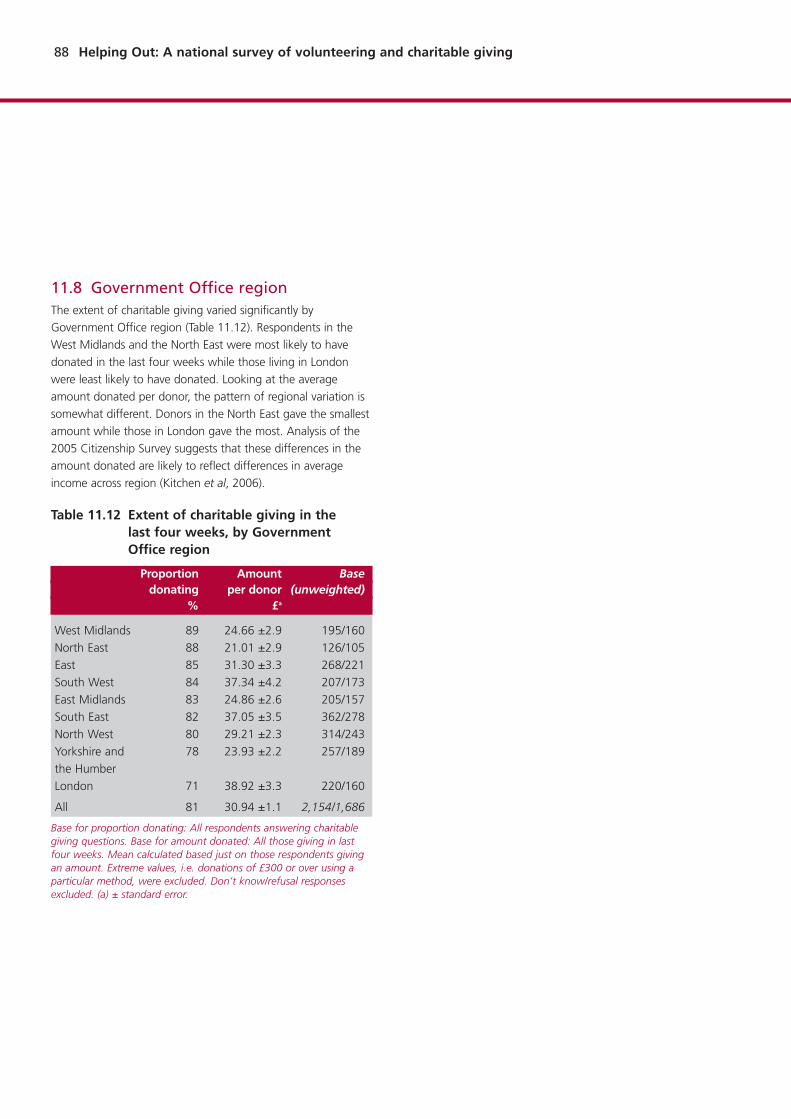
11.8 Government Office region ............................................................................................................................... 88
12 Tax-efficient methods of giving ............................................................................................................................. 89
12.2 Awareness of tax-efficient methods of giving .................................................................................................. 89
12.2.1 Who was aware?.............................................................................................................................. 90
12.3 Use of tax-efficient methods of giving ............................................................................................................. 92
12.3.1 Who used tax-efficient methods of giving?....................................................................................... 92
12.4 Reasons for not using tax-efficient methods of giving ..................................................................................... 94
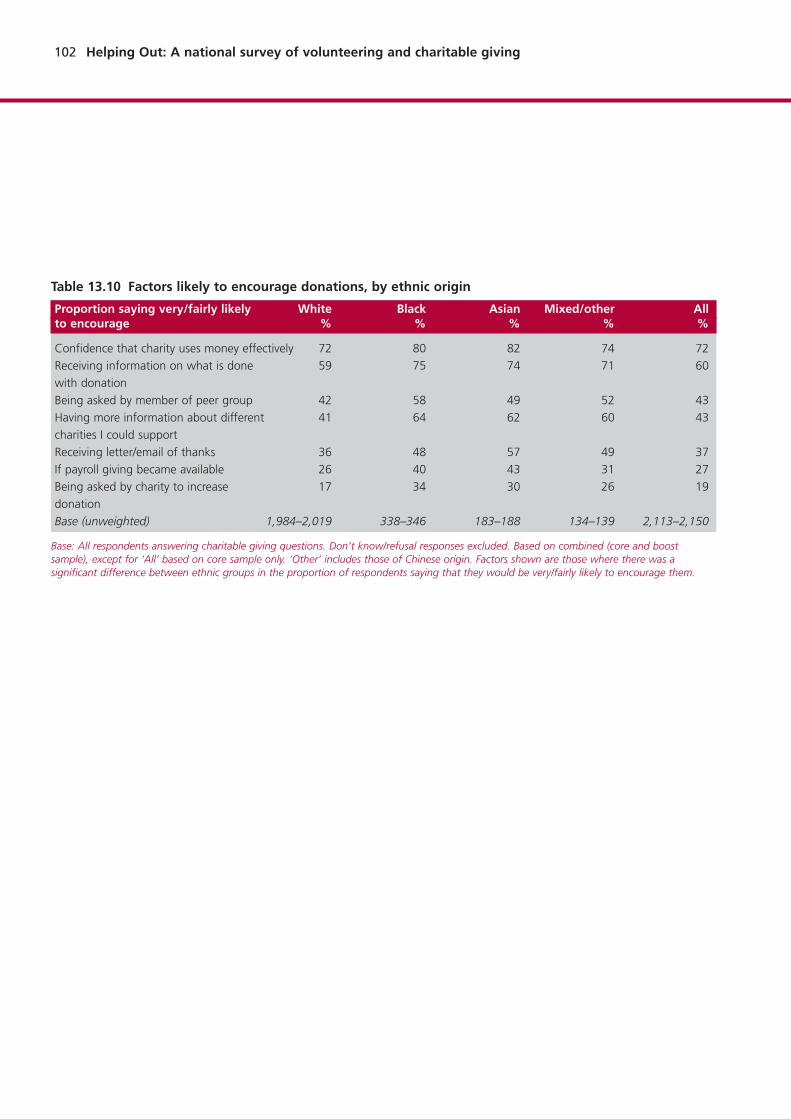
13 Motivations for and barriers to charitable giving ................................................................................................ 95
13.2 Why people donate to charity ......................................................................................................................... 95
13.3 Increases in charitable giving ........................................................................................................................... 96
13.3.1 Changes to donations....................................................................................................................... 96
13.3.2 Increases in regular donations........................................................................................................... 98
13.4 Barriers to giving ............................................................................................................................................. 98
14.2 Propensity to volunteer and to donate............................................................................................................. 103
14.4 Donating as a substitute for volunteering ........................................................................................................ 106
14.5 Volunteering as a substitute for donating ........................................................................................................ 107
14.6 The comparative value of volunteering and charitable giving........................................................................... 108
Appendix A References ............................................................................................................................................ 110
Appendix B Additional tables ................................................................................................................................. 111
Appendix C Glossary ................................................................................................................................................ 126
Appendix D Index of tables and figures ................................................................................................................ 127
Acknowledgements 5
We would like to thank those people who served on the
advisory group for the project and those individuals and
organisations who took part in the consultation exercise
during the development of the questionnaire. These include
representatives from the Charities Aid Foundation (CAF),
National Council of Voluntary Organisations (NCVO) and
Community Service Volunteers (CSV).
A number of other colleagues at the National Centre for
Social Research (Natcen) and the Institute for Volunteering
Research (IVR) contributed to the research. Thanks to Steve
Edwards, Shaun Scholes, Pauline Burge and the Green Team
at Natcen and to Mike Locke at IVR.
Our thanks also go to colleagues at the Office of the Third
Sector, particularly Ben Morgan and Debbie Burton, and to
Richard Tonkin and Marianne Law at Communities and Local
Government, who managed the research.
Most importantly we would like to thank the respondents
who gave up their time to participate in this study.
Acknowledgements
6 Helping Out: A national survey of volunteering and charitable giving
Natalie Low is a Research Director at the National Centre for
Social Research
Sarah Butt is a Researcher at the National Centre for
Social Research
Angela Ellis Paine is Assistant Director of the Institute for
Volunteering Research
Justin Davis Smith is Director of the Institute for
Volunteering Research
The authors
Executive summary 7
IntroductionThis report details the main findings of a national survey of
volunteering and charitable giving – termed Helping Out –
carried out by the National Centre for Social Research
(NatCen) in partnership with the Institute for Volunteering
Research (IVR) in 2006/07. The study was carried out for the
Office of the Third Sector in the Cabinet Office.
The main aims of the study were to examine:
n how and why people give unpaid help to organisations,
and what they think of their experiences;
n what stops people from giving help;
n the links between giving time and giving money;
n how, why and how much people give money to charity;
n what stops people from giving money to charity.
There was also interest in estimates of the prevalence of
volunteering and charitable giving. However, for a number of
reasons (detailed in Chapters 2 and 10), prevalence estimates
derived from this study should not be used to look at changes
in these measures over time. Other study series are better
suited to this purpose.
In terms of volunteering, the study focused on formal help
given through groups and organisations rather than informalhelp (given as an individual, e.g. to family and friends).
Survey methodsFor Helping Out, a sub-sample of respondents to the previous
2005 Citizenship Survey was interviewed. This allowed certain
groups of particular interest to the study to be over-sampled
to ensure sufficient numbers for more detailed analysis (e.g.
volunteers, ethnic minority respondents).
The main starting points for the questionnaire design were
the 1997 National Survey of Volunteering and 2005
Citizenship Survey and (additionally for the charitable giving
questions) the module of questions commissioned by the
National Council of Voluntary Organisations (NCVO) and
Charities Aid Foundation (CAF). In addition, a full consultation
was carried out with the Third Sector, alongside input from
the advisory group set up for the study.
Fieldwork ran from the end of October 2006 until the middle
of February 2007. In total, 2,156 respondents were
interviewed for the core sample, giving a response rate of
62%. Among a separate minority ethnic boost sample
(designed primarily to supplement the numbers of Black and
Asian respondents interviewed), 549 respondents were
interviewed, with a response rate of 51%.
The extent of formal volunteering(Chapter 2)Overall, three-fifths (59%) of the sample had given formal
volunteering help through an organisation in the last year,
while two-fifths (39%) had done so on a regular basis (at
least once a month). On average, formal volunteers had spent
11 hours helping over the last four weeks.
The prevalence estimates of formal volunteering from Helping
Out tended to be higher than those from the recent
Citizenship Surveys and the National Surveys of Volunteering.
However, there are a number of factors which affect these
comparisons (discussed in detail in the main report). The
Helping Out estimate is not an indicator of recent trends in
formal volunteering.
Who volunteers? (Chapter 3)Levels of formal volunteering varied across key socio-
demographic groups. The proportion of volunteers tended to
be higher among those in the 34–44 and 55–64 age brackets,
women, respondents in work (although there was much
variation in the non-working group), those actively practising
a religion and those not in a group at risk of social exclusion
(which is a particular focus of government efforts on
volunteering).
What volunteers do (Chapter 4)The majority (59%) of volunteers helped more than one
organisation. Looking at the main organisation helped, this
was most often in the voluntary and community sector (65%
of volunteers) or public sector (23%).
The most common organisational fields of interest were
education (31% of volunteers), religion (24%), sports and
exercise (22%) and health and disability (22%).
The most common types of volunteering activity were raising
and handling money (67% of volunteers) and organising and
helping to run events (50%). Most (71%) volunteers
undertook more than one volunteering activity.
Routes into volunteering (Chapter 5)The most common reasons for getting involved in
volunteering were in order to improve things or help people
Executive summary
8 Helping Out: A national survey of volunteering and charitable giving
(53% of volunteers), because the cause was important to the
volunteer (41%) or because they had spare time on their
hands (41%).
Word of mouth was the most common way that people
had found out about volunteering (66% of current formal
volunteers found out about volunteering in their main
organisation this way), with previous use of the services being
the second most common way (20%). The most common
sources of information about volunteering were the (national
or local) organisations themselves.
The organisation of volunteering(Chapter 6)Advice and support were available for a majority (83%) of
volunteers within the main organisations they helped,
although most felt that they did not need it. Of those who
did, nearly all (95%) said the advice and support they received
were adequate.
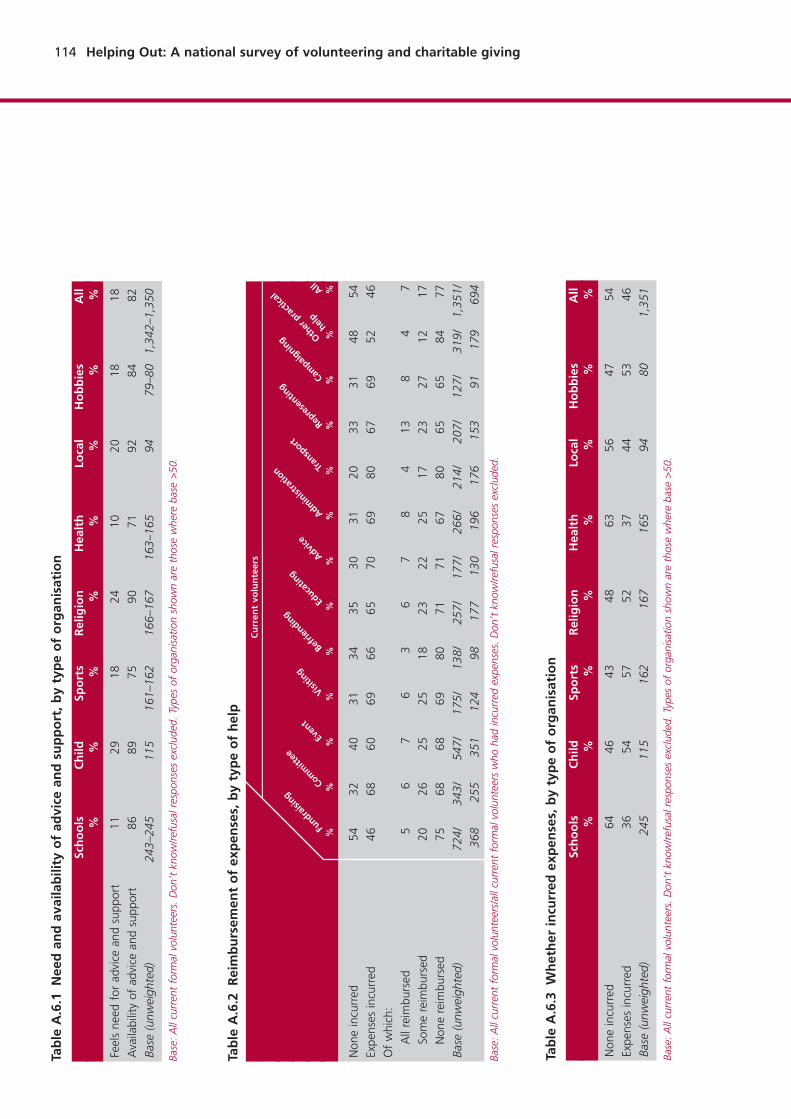
Just over half (54%) of current volunteers had not incurred
any expenses in the past year. Of those that had, 77% had
not had any of those expenses reimbursed and 17% had only
had some of their expenses reimbursed.
Most (79%) of the volunteers had not received any training
for their role within their main organisation, although of
those who had received training, nearly all (97%) felt it
was adequate.
A majority of volunteers (78%) had not been asked to attend
an interview before commencing their activities, nor had they
been provided with a role description (81%), had their
references taken up (89%), been asked for details of criminal
convictions (82%) or been subject to Criminal Record Bureau
checks (82%). Those who had been subject to these processes
generally did not mind about it.
On the whole, volunteers were not overly concerned about
issues connected with risk, although 10% had worried about
issues of risk connected with their volunteering. Around a
quarter (27%) of volunteers had been given information by
their organisation about how to reduce risk.
The benefits and drawbacks ofvolunteering (Chapter 7)Regular volunteers were generally positive about their
volunteering experiences, although there was room for
improvement in the numbers saying that their volunteering
could be better organised, that there was too much
bureaucracy and that they could not leave as there was no one
else to take over.
Volunteers had mixed views on the importance of having their
help recognised, with half feeling that it was important and
half not. Most felt they received enough recognition, usually
through (verbal or written) thanks from the organisation
volunteered for.
Half (51%) of regular volunteers did not know they could
gain qualifications through their volunteering, and only a
small proportion had done so.
The main benefits of helping organisations mentioned by
volunteers were getting satisfaction from seeing the results
of their volunteering, enjoyment and personal achievement.
Limitations to volunteering (Chapter 8)One-fifth (21%) of the sample said they had never volunteered.
A further 19% were not currently volunteering but had done
so in the past. However, many of these respondents said they
would like to spend more time volunteering.
Time, or more specifically a lack of spare time, was the most
commonly cited reason for stopping volunteering or not
volunteering (more often or at all). Having more spare time
was seen as the most significant factor in making it easier to
get involved (reported by 31% of respondents), followed by
working less (11%) and having more information (9%).
Employer-supported volunteering(Chapter 9)Three in ten employees worked for an employer with both a
volunteering and giving scheme, and a further fifth had
access to one type or the other.
Where an employer-supported volunteering scheme was
available, 29% of employees had participated in the last year.
Take-up of employer-supported giving schemes was higher,
with 42% of employees making use of a giving scheme
available to them.
The number of people working for employers with a
volunteering scheme appears to have increased since 1997,
while there has been no change in employees’ willingness to
use schemes available to them. This would suggest an increase
in the numbers of employees involved in such schemes.
Executive summary 9
Over half of employees would like to see a volunteering or
giving scheme established by their employer where they don’t
currently exist.
The key factors which would encourage people to take part in
these schemes were identified as paid time off; being able to
choose the activity; and gaining skills from taking part.
The extent of charitable giving(Chapter 10)Most respondents (81%) had given to charity in the last four
weeks, most commonly by putting money in a collecting tin,
followed by buying raffle tickets. The average total amount
donated in the last four weeks was £25 per adult, or £31
per donor.
The most popular causes donated to were health and
disability, followed by overseas aid or disaster relief.
As for volunteering, the study estimates of the prevalence of
charitable giving cannot be directly compared with other
studies, and the higher figures reported here compared with
some other studies cannot not be taken as indicating an
increase in donations. The study context, fieldwork period
(which for Helping Out included Christmas), question
methods and sample profile might all affect how comparisons
can be made.
Who gives? (Chapter 11)Women, those in work, White respondents, higher income
groups and those actively practising a religion were all more
likely to have donated in the four weeks prior to interview. On
average, higher amounts were donated by those aged 55 or
older, women, higher income groups and those actively
practising a religion. The prevalence of donations and the
average amount donated varied by Government Office region,
though this might reflect regional differences in income.
Tax-efficient methods of giving (Chapter 12)Gift Aid was by far the most recognised method of
tax-efficient giving (with 64% having heard of it), followed
by payroll giving (40%) and legacies (24%). Other forms of
tax-efficient giving elicited very low levels of awareness.
Reflecting these low levels of awareness, use of tax-efficient
methods of giving was not widespread. A third of the sample
had used Gift Aid in the last year, but other forms were used
by less than 5% of the sample.
Lack of awareness was the main reason given for not using
tax-efficient methods of giving, followed by not being a
taxpayer and giving too infrequently.
Motivations for and barriers to charitablegiving (Chapter 13)The most common reason for donating to charity was that the
work of the charity was deemed important (52% of donors),
followed by a belief that it is the right thing to do (41%).
Nearly a half of respondents said they had increased the
amount donated since 2000, with 37% having increased
the frequency of donations. The most common reason given
for this increase was a rise in the respondent’s level of
disposable income.
The most common reason for not donating or for decreasing
donations was not having enough money to spare. A sizeable
minority had decreased donations because they were
dissatisfied with charities in some way.
Provision of information seemed to be key in encouraging
more charitable giving in the future: having confidence that
money was being effectively used and receiving information
about what was done with the donation were the most
frequently cited motivators.
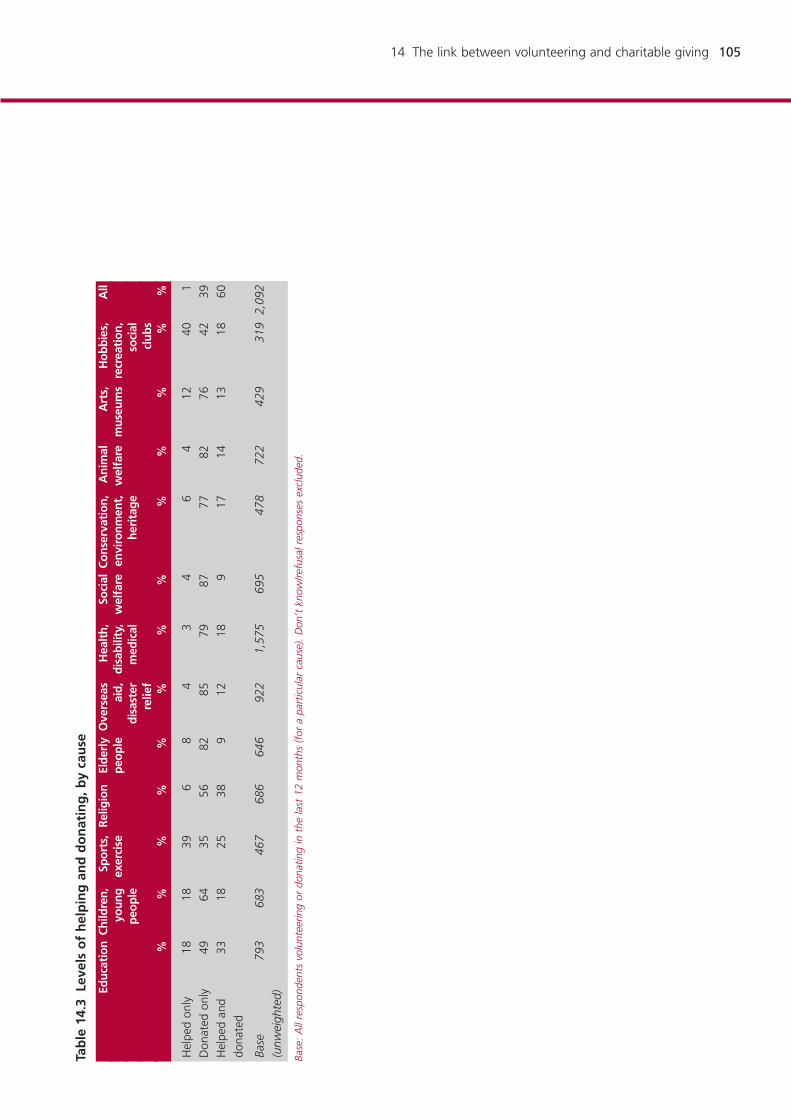
The link between volunteering andcharitable giving (Chapter 14)Over half of respondents (58%) had both volunteered and
donated to charity in the past year. Just over half of those
respondents who volunteered and made donations to the
same organisation said they were more likely to give money to
an organisation if they were involved in it through
volunteering, the main reasons being that they knew and
cared more about that charity.
Most respondents (73%) said that they had not donated to
charity as a substitute for volunteering, although a sizeable
minority (27%) said they had. Similarly, most respondents
(88%) said that they had not volunteered as a substitute for
donating to a charity.
Just over half of respondents (52%) perceived giving time as
showing more commitment to a charity than giving money.
A majority (58%) thought that both activities would be
equally valuable to the charity.
10 Helping Out: A national survey of volunteering and charitable giving
1.1 Setting the scene This report details the findings of a national study of
volunteering and charitable giving – termed Helping Out –
carried out by the National Centre for Social Research
(NatCen) in partnership with the Institute for Volunteering
Research (IVR) in 2006/07. The study was carried out on
behalf of the Office of the Third Sector in the Cabinet Office.
It builds on three earlier National Surveys of Volunteering,
conducted in 1981 (Field and Hedges, 1984), 1991 (Lynn and
Davis Smith, 1991) and 1997 (Davis Smith, 1998).
Volunteering and charitable giving are both hot topics. Never
before has the UK government directed such attention to
volunteering, or invested so heavily in initiatives to promote it.
Similarly, government in recent years has devoted increasing
attention to supporting charitable giving by developing new
forms of tax-efficient methods and encouraging employers to
support giving among their employees. Public interest in
volunteering and charitable giving also seems to be growing,
with recent studies suggesting that levels of participation in
volunteering are on the up (see, for example, Kitchen et al,
2006), and that three-quarters of the adult population are
involved in charitable giving (Kitchen et al, 2006).
A growing number of studies have been devoted to exploring
the propensity to ‘help out’ (e.g. the series of Citizenship
Surveys and the surveys of giving conducted by the National
Council of Voluntary Organisations (NCVO) and the Charities
Aid Foundation (CAF)), but most have focused on levels of
participation in, rather than people’s motivations for or
experiences of, volunteering and charitable giving. The last
National Survey of Volunteering did explore patterns of
volunteering and the experience of volunteering but it is now
10 years old, and much has changed since then. The need for
new and up-to-date information on volunteering and
charitable giving has never been greater.
The principle objective of this new study was to supplement
the ‘who’ questions asked in the Citizenship Surveys with
questions focused on the ‘how’, with the aim of enhancing
understanding of people’s experiences and attitudes towards
volunteering and giving, and the barriers to participation,
particularly for those from disadvantaged backgrounds. It is
hoped that the results of the study will enable practitioners,
policy makers and funders to better target and manage
programmes in support of volunteering and giving, and to
challenge further the barriers to engagement.
The main aims of this study were to examine:
n how and why people give unpaid help to organisations,
and what they think of their experiences;
n what stops people from giving help;
n the links between giving time and giving money;
n how, why and how much people give money to charity;
n what stops people from giving money to charity.
There was also interest in estimates of the prevalence of
volunteering and charitable giving. However, for a number of
reasons (detailed in Chapters 2 and 10), prevalence estimates
derived from this study should not be used to look at changes
in these measures over time. Other study series are better
suited to this purpose (principally the Citizenship Survey for
volunteering, and the CAF-NCVO studies for charitable giving).
This report describes the main findings from the study.
A series of research bulletins supplement this main report,
summarising the findings for different topic areas and offering
additional discussion on the implications of the findings for
policy and practice.
1.2 DefinitionsBefore going any further it is important to discuss a number
of definitional issues, both for volunteering and for charitable
giving. (These definitions were used to develop questions and
identify activities and groups of interest. They were not
provided directly to respondents, who were instead asked a
number of questions to determine their status according to
these definitions.)
1.2.1 Formal and informal volunteering
The focus of this study was on formal volunteering, as
opposed to informal volunteering.
The study adopted the following definition of volunteering:
Any activity which involves spending time, unpaid,
doing something which aims to benefit someone
(individuals or groups) other than or in addition to
close relatives, or to benefit the environment.
This was based on the definition used in the 1997 National
Survey of Volunteering, and is (broadly) that which is
enshrined within the Compact Volunteering Code of Good
Practice (Home Office, 2005).
1 Introduction
1 Introduction 11
More specifically, however, the following definition for formalvolunteering was used:
Giving unpaid help through groups, clubs or
organisations to benefit other people or the
environment (for example, the protection of wildlife
or the improvement of public open spaces).
The study focused on formal volunteering, as its primary
aim was to explore the experience of volunteers within
organisations. It did not focus on informal volunteering, which
is defined as ‘giving unpaid help as an individual’ (i.e. not
through a group, club or organisation) and which involves a
greater number of people. Much is known about levels of
informal volunteering from the Citizenship Surveys (Kitchen
et al, 2006), and new data were not needed so urgently. The
length of the interview also created limits to what could be
included. This is not to underestimate the importance of
informal volunteering. Both formal and informal volunteering
are recognised to be equally as valid and important.
In this report, we will refer to ‘volunteers’ and to
‘volunteering’ to mean those giving formal, rather than
informal, help. Unless otherwise stated, all the results refer
to formal volunteering.
1.2.2 Regular and occasional volunteering
Formal volunteering is reported upon in the following ways.
n Current volunteers: those respondents undertaking any
formal volunteering within the past 12 months. They can
be further broken down into:
– regular volunteers: those respondents carrying out
formal volunteering activities at least once a month
in the past 12 months;
– occasional volunteers: those respondents carrying
out formal volunteering activities in the past 12
months less frequently than once a month. This
includes activities carried out every couple of
months and those undertaken on a one-off
(episodic) basis;
– episodic volunteers: those respondents undertaking
formal volunteering activities on a one-off basis in
the past 12 months.
n Non-volunteers: all those respondents who have not
volunteered within the past 12 months; this includes
people who have never volunteered as well as
ex-volunteers. Given the focus of this report, this
includes the many people who are engaged in informal
volunteering.
n Ex-volunteers: those respondents who have taken part in
formal volunteering activities in the past but have not
done so in the past 12 months.
For some sections of the questionnaire, current volunteers
were asked to answer with reference to the main organisation
they had helped. The questionnaire prompted respondents
who had helped more than one organisation in the last year
to select the organisation they felt they had done most for,
i.e. had spent the most time helping.
1.2.3 PSA4 target groups and those ‘at risk ofsocial exclusion’
Individuals who belong to certain Black and minority ethnic
(BME) groups, have no qualifications or have a disability or
limiting, long-term illness can be seen as at particular risk of
social exclusion. These three groups have also been shown to
volunteer less (see Kitchen et al, 2006), and as such have
become the focus of government initiatives and policies to
increase levels of participation and are specifically referred
to in the Cabinet Office Public Service Agreement 4 (PSA4)
objectives.1 Throughout this report, BME respondents and
those with no qualifications and/or a limiting, long-term
illness or disability have been grouped together and are
referred to as being at risk of social exclusion, to enable
analysis of volunteering (and charitable giving for purposes
of comparison) that picks up on this important public policy
focus. Where appropriate, separate results are also presented
for the constituent groups, including those with no
qualifications and those with a limiting, long-term illness or
disability. A summary figure for all BME respondents is not
provided, as the sample was designed to provide results
separately for Black and Asian respondents. Detailed
breakdowns of results by ethnic group, highlighting important
differences between them, are therefore provided separately.
1. Public Service Agreements set targets for what each government department is supposed to deliver by way of improvements in public servicesin return for investment. They highlight key policy priorities and are an integral part of the Government’s spending plans. As of June 2006, thevolunteering element of Cabinet Office PSA4 was defined as to ‘increase voluntary and community engagement, especially amongst those atrisk of social exclusion’.
12 Helping Out: A national survey of volunteering and charitable giving
1.2.4 Giving and donations
Throughout this report charitable giving is referred to as
‘donating’. This includes planned and unplanned donations to
charities but also to selected individuals such as beggars and
to selected public institutions such as hospitals and schools.
1.2.5 Current, regular and tax-efficient giving
Charitable giving is reported upon in the following ways.
n Current donors: those respondents making a donation in
the last four weeks.
n Donors in the last year: those respondents making a
donation in the last 12 months.
n Regular (or planned) giving methods: those methods
which are most likely to be made on a regular basis,
defined as donations by direct debit, standing order or
covenant, regular donations by cheque or credit card and
payroll giving.
n Tax-efficient giving methods: defined as Gift Aid, payroll
giving, giving via Self-Assessment Forms, tax relief on the
value of gifts of shares given to charities, tax relief on
the value of gifts of land or buildings given to charities,
and legacies.
1.3 Summary of study methodsThis section summarises the key elements of the study
methodology. A fuller, more detailed report of the methods
used in the study and some of the issues raised can be found
in the (separate) technical report (Low and Butt, 2007).
1.3.1 Study management
The study was commissioned by the Office of the Third Sector
in the Cabinet Office, although the project was managed by
researchers from Communities and Local Government. In
addition, an advisory group was convened to represent
volunteering and charitable giving interests from government
and the third sector.
1.3.2 Sample design
The Helping Out survey was run as a follow-up study to the
2005 Citizenship Survey, drawing the sample from those
respondents to the Citizenship Survey who agreed at the time
to be re-contacted for further research.
The advantage of this method was that certain groups of
particular interest to the study could be over-sampled to allow
sufficient numbers for more detailed analysis. The groups that
were over-sampled in this way were:
n regular formal volunteers (as identified in the 2005
Citizenship Survey interview);
n young people aged 16–24 (at the time of the Citizenship
Survey interview); and
n those belonging to the PSA4 target groups, comprising
those with limiting, long-term illnesses, those with no
qualifications and BME respondents. The oversampling
of BME respondents made use of the separate minority
ethnic boost sample that the Citizenship Survey had
employed.
However, a potential disadvantage is the risk of bias in such a
sample, as it did not include those who refused to take part in
the Citizenship Survey or did not agree to be re-contacted for
future research. They could differ from respondents in terms
of the key variables of interest, although it was anticipated
that some types of bias could be corrected for using the
information already available from the Citizenship Survey.
1.3.3 Questionnaire development
The starting points for the questionnaire design were the
1997 National Survey of Volunteering and 2005 Citizenship
Survey and (additionally for the questions on charitable
giving) the module of questions commissioned by the NCVO
and CAF.
Some changes were made to these questions to reflect
developments in the topic areas of interest and the policy
needs of the study. In addition, a full consultation was carried
out with the third sector to ensure that their main interests
and needs were covered. The advisory group was consulted
and commented on drafts of the questionnaire.
Cognitive testing (which looks in-depth at respondents’
understanding of questions and how they formulate the
answers they give) was carried out on a limited set of
questions in the study, in particular the introductory
questions, which established the prevalence of volunteering
and charitable giving, and the new section about the links
between volunteering and giving. A number of changes
were subsequently made to the wording and response
frames of questions.
1 Introduction 13
A full dress rehearsal pilot was carried out in September 2006.
It was found that respondents were likely to double-count
volunteering activities and organisations, and a number of
extra checks and questions were included to try to reduce this.
1.3.4 Fieldwork
Face-to-face briefings were held for interviewers working on
the study from October to November 2006. Fieldwork ran
from the end of October 2006 until the middle of February
2008, with the majority of areas finishing work by the end
of January.
1.3.5 Response rates
In total, 2,705 people were interviewed for Helping Out.
Of these, 2,156 were within the core sample and 549 were
within the separate minority ethnic boost sample (which is
used only for analyses by ethnic group).
Overall, 60% of the issued sample were interviewed, nearly
all of which were full interviews. Forty per cent of the sample
could not be interviewed, with 20% (half the non-responders)
refusing an interview. Another 10% of the sample had moved
and could not be traced to a new address. (A range of
reasons accounted for the rest of those not interviewed,
including being uncontactable, respondents moving out of
England, some respondents having died, and illness or
absence during the whole fieldwork period.)
In the core sample, the response rate was 62%. This gave a
base of 2,156 cases for analysis (around 350 short of the
original target). The response among the minority ethnic
boost sample was somewhat lower: 51% of the sample were
interviewed (around 250 short of the original target).
Although refusals were a little higher than for the core, the
main difference was in the proportion of movers (15% as
opposed to 10% in the core) and non-contacts (7% as
opposed to 4% in the core), some of whom may also have
been movers.
1.3.6 Weighting
Data were weighted to incorporate or correct for:
n the pre-existing weighting structure used for the original
2005 Citizenship Survey sampling;
n differences in the characteristics between those agreeing
and not agreeing to be recontacted;
n differences in the characteristics between those
agreeing and not agreeing to be interviewed for the
Helping Out study; and
n the over-sampling of certain groups carried out for the
Helping Out study.
1.4 Report structure The report brings together in 14 chapters the main findings of
the study. After this introductory chapter the next seven
chapters (2 to 8) discuss levels of volunteering, motivations
and routes into volunteering and the experience of
volunteering. The following chapter (9) focuses specifically on
participation in employer-supported volunteering and giving
initiatives. The next four chapters (10–13) focus on charitable
giving, looking at the levels and amounts of donations, use of
tax-efficient giving methods and the reasons people give for
giving or not giving to charity. The final chapter (14) brings
together findings on volunteering and charitable giving,
exploring the connections between the two.
1.4.1 Reading tables in this report
All tables and figures in this report show weightedpercentages. However, base sizes (the number of cases on
which percentages are based) are unweighted. Unless
otherwise stated, differences between different groups in the
current study have been tested for statistical significance
(taking into account the sampling weight used in the study).2
Some simplification of the statistical testing applied to
differences between current study results and external studies
was necessary, meaning that sampling weights were not
necessarily taken into account. However, few if any of these
differences were marginal (in terms of statistical significance).
Figures are for respondents to the core sample only unless
otherwise indicated. Most of the analyses used respondents to
2. The approach taken in significance testing was to test for the overall presence of significant difference on the basis of, for example, age ratherthan testing for significant differences between individual sub-groups (e.g. 16–24 vs 25–34).
14 Helping Out: A national survey of volunteering and charitable giving
the core sample only. Sub-group analysis of ethnic and
religious groups used the combined core and boost sample.
Percentages are not shown for groups with a base size less
than 50. This means that for some tables age categories
and/or ethnic groups have had to be combined.
In tables, percentages are rounded to the nearest whole
number; percentages of less than 0.5% are indicated by ‘*’.
2 The extent of formal volunteering 15
Summaryn Of the people questioned in this study, three-fifths (59%)
had given some sort of formal volunteering help to an
organisation in the last year. Two-fifths (39%) had
volunteered on a regular basis (at least once a month).
n Over the longer period of five years, 68% of the sample
had given formal help in some way, while 45% could be
classed as regular formal volunteers.
n Two-thirds (66%) of formal volunteers in the last year
had given regular help (once a month or more), while
just over a quarter (27%) said they had helped more
than once, but less regularly. Seven per cent of formal
volunteers had taken part only in a one-off activity over
the last year.
n On average, formal volunteers (in the last year) had
spent 11 hours helping in the last four weeks, while for
regular volunteers the figure was higher at 16 hours.
n The economic value of formal volunteering was
calculated from the study estimates of time spent in the
last four weeks (in combination with the size of adult
population and average employee wage). For this study,
the estimated economic value of formal volunteering
was £38.9 (±2.5) billion.
n The findings from this survey on the total number of
volunteers are not directly comparable with those from
other surveys. In particular, the figures should not be
taken as indicating an increase in volunteering since the
2005 Citizenship Survey (which showed 44% of people
engaged in formal volunteering). Factors specific to the
Helping Out study may have elicited higher reports of
volunteering activities than the Citizenship Survey.
2.1 IntroductionThis chapter gives an overview of formal volunteering as
reported to Helping Out. The current study asked about
formal volunteering over a range of time periods (the last
year, the last 1–5 years and longer ago), but the main focus
of this chapter is on current volunteers (those giving help in
the past 12 months).
Respondents were first asked a very broad question about
taking part in, supporting or helping any ‘groups, clubs,
charities or organisations’. Later questions then collected the
names of individual organisations helped and checked in
detail what sort of help was given.
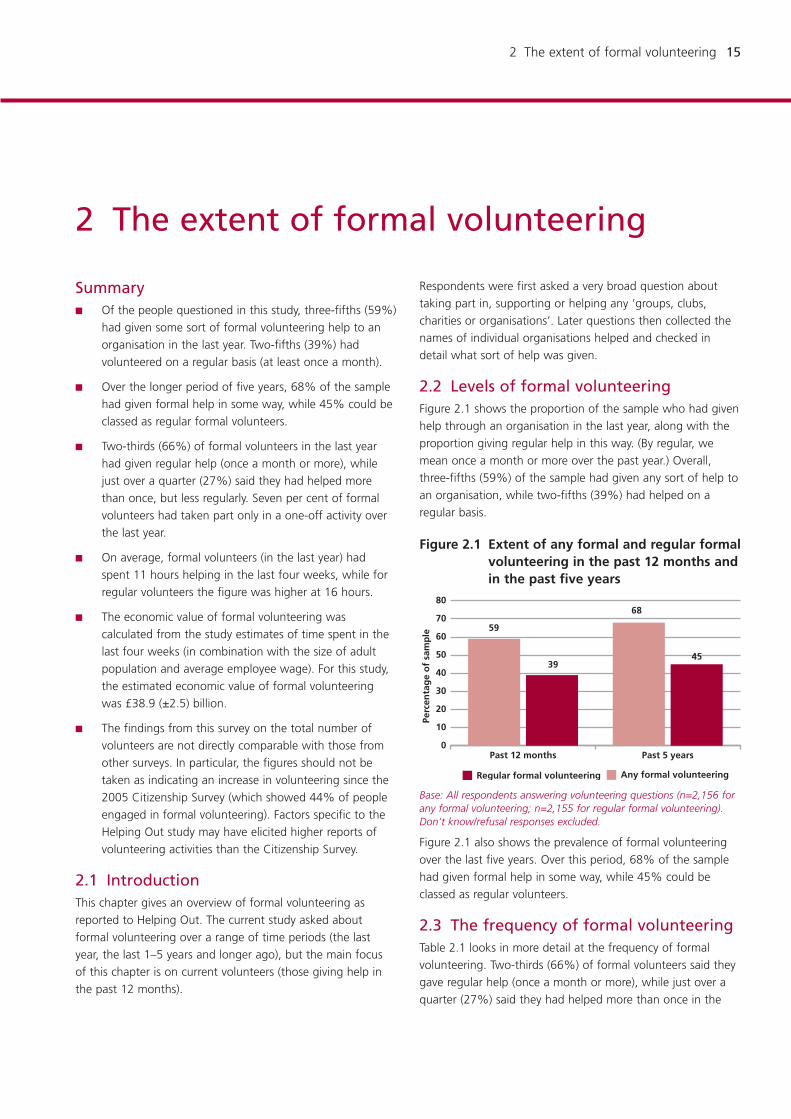
2.2 Levels of formal volunteeringFigure 2.1 shows the proportion of the sample who had given
help through an organisation in the last year, along with the
proportion giving regular help in this way. (By regular, we
mean once a month or more over the past year.) Overall,
three-fifths (59%) of the sample had given any sort of help to
an organisation, while two-fifths (39%) had helped on a
regular basis.
Figure 2.1 Extent of any formal and regular formalvolunteering in the past 12 months andin the past five years
Base: All respondents answering volunteering questions (n=2,156 forany formal volunteering; n=2,155 for regular formal volunteering).Don’t know/refusal responses excluded.
Figure 2.1 also shows the prevalence of formal volunteering
over the last five years. Over this period, 68% of the sample
had given formal help in some way, while 45% could be
classed as regular volunteers.
2.3 The frequency of formal volunteeringTable 2.1 looks in more detail at the frequency of formal
volunteering. Two-thirds (66%) of formal volunteers said they
gave regular help (once a month or more), while just over a
quarter (27%) said they had helped more than once in the
0
10
20
30
40
50
60
70
80
Regular formal volunteering Any formal volunteering
Past 5 yearsPast 12 months
59
Perc
enta
ge
of
sam
ple
39
68
45
2 The extent of formal volunteering
16 Helping Out: A national survey of volunteering and charitable giving
year, but less regularly. Seven per cent of formal volunteers
(or 4% of the sample overall) could be classed as episodic
volunteers, and had only taken part in a one-off activity over
the last year.
Table 2.1 Frequency of formal volunteering in thepast 12 months
Base: All respondents answering volunteering questions. Don’tknow/refusal responses excluded.
2.4 Average amount of time spentvolunteering
For each organisation they had helped, respondents were
asked how many hours they had spent helping in the last four
weeks (Table 2.2). On average, formal volunteers had spent
11 hours helping in the last four weeks, while for regular
volunteers the figure was higher at 16 hours.
The Helping Out estimates of time spent are in line with the
most recent Citizenship Survey estimates (11.9 hours in the
2005 Citizenship Survey). However, in 1997, the average
number of hours spent by current volunteers on formal
volunteering was four in the past week, giving an average of
16 hours when grossed up for the last four weeks. Although
caution is needed in making direct comparisons, this suggests
that the amount of time spent by individuals volunteering
may have declined since the late 1990s.
Table 2.2 Average number of hours spent helpingin the last four weeks by currentvolunteers
Base: All respondents answering volunteering questions. Don’tknow/refusal responses excluded. Respondents who initially stated theyhad not helped an organisation in the last year, but who later said theydid help in the more detailed questions, were not asked about thenumber of hours spent – they were therefore set to ‘don’t know’ forthis table.
2.5 Economic value of formal volunteeringUsing the Helping Out estimate of the hours spent on formal
volunteering in combination with the size of population and
average (employee) wage, it is possible to calculate a
grossed-up estimate for the total value of formal volunteering
to the economy. Such calculations are necessarily sensitive to
the underlying assumptions (for example, whether mean or
median wage rates are used).3
For this study, we estimated the economic value of formal
volunteering at £38.9 (±2.5) billion.4 While this must be
treated as a broad estimate, it is clear that volunteering makes
a significant contribution to England’s economy.
2.6 Comparisons with other studiesIn this section, we draw comparisons between the current study
and results on formal volunteering from the Citizenship Survey
and the National Survey of Volunteering. For reasons discussed
below, we must be aware of study-specific factors that might
affect the different estimates of the extent of volunteering
activity. (See also Low and Butt (2007) for further discussion.)
Table 2.3 shows the levels of formal volunteering across
the different studies. The current study, in focusing on
volunteering, has produced higher estimates of formal
volunteering than those identified in the Citizenship Survey
All current Regular volunteers volunteers
Average number of hours 10.9 15.9
± standard error ±0.6 ±0.9
Base (unweighted) 1,240 844All Currentvolunteers
% %
Regular (once a month or more) 39 66
Quite often or just a few times 16 27
One-off activity only 4 7
No formal volunteering 41 N/A
Base (unweighted) 2,155 1,371
3. For this calculation, the following formula was used: mean hours spent on formal volunteering in the last four weeks (6.1) x 12 x mean hourlywage (£13 – source: Annual Survey of Hours and Earnings, 2006) x number of adults aged 16 or over (40,711,000 – source: ONS mid-yearpopulation estimates, 2005). Non-volunteers in the sample were set to have zero hours’ volunteering in the last four weeks.
4. Although comparisons are tenuous, this figure is of a broadly similar order to a calculation of £40 billion for Great Britain derived from the1997 National Survey of Volunteering, with its somewhat higher figure of average hours and lower wage rates.
2 The extent of formal volunteering 17
and the National Survey of Volunteering (the last of which
was conducted 10 years ago, in 1997).
Looking at the levels of regular formal volunteering, the
Helping Out figures are also higher: around 8–12% more than
the other studies.
It is always difficult to draw direct comparisons between
studies. Differences between estimates may be due to
variations in the methodology of the study or the profile of
respondents, rather than reflecting genuine differences in the
population or actual changes over time.
Since the last National Survey of Volunteering in 1997, there
have been several developments in volunteering and it may
well be that some of the difference between the Helping Out
figures and the National Survey of Volunteering series reflects
a degree of genuine change. For example, volunteering has
grown considerably on the policy agenda. There have been a
number of significant initiatives to encourage volunteering
launched since 1997, including, for example, Millennium
Volunteers, which aimed to increase volunteering among
16–24 year olds. 2001 was the United Nation’s International
Year of Volunteering, while 2005 was designated as the Year
of the Volunteer in the UK. Developments have also taken
place across the third sector with regard to volunteering, with
considerable investments made in the development of
volunteer management practices.
However, while it is true that a substantial period of time has
elapsed since the National Survey of Volunteering series, with
numerous developments in the field of volunteering, this is
clearly not the case with the more recent Citizenship Surveys.
We must therefore look to additional explanations for the
differences observed between the Helping Out estimate and
the more recent studies, among which will be:
a) Question methods and the study context – Helping
Out drew heavily from the methods used in the
Citizenship Surveys (some of which were themselves
drawn from the National Survey of Volunteering) to
identify volunteers initially,5 so we would not expect this
to be a major issue for comparisons between the studies.
However, it is possible that the studies with a particular
focus on volunteering may elicit higher recall of such
activities. Some of this might result from better
identification of relevant activities: for example,
interviewers and respondents may be more alert to the
types of activity that might be of interest to the study. In
Helping Out, interviewers were explicitly encouraged to
include rather than exclude activities at the initial
screener stage (although it is important to remember
that any help mentioned was consistently checked in the
current study by a series of follow-up questions).
However, respondents may also feel under more pressure
to mention relevant activities (see, for example, Sudman
National Survey of Citizenship Helping Volunteering Survey Out
– formal volunteers in the past 12 months 44 51 48 39 42 44 59
– regular formal volunteers in the past 12 months 27 31 29 27 28 29 39
Base (unweighted) 1,808 1,488 1,486 9,430 8,922 9,195 2,155
Table 2.3 Extent of formal and regular formal volunteering in the past 12 months: comparison of HelpingOut, Citizenship Surveys and National Surveys of Volunteering
Base for Helping Out: All respondents answering volunteering questions. Don’t know/refusal responses excluded.
5. For all the studies, respondents were shown sets of shuffle packs with different types of organisation and examples given for category. (Thecategories varied slightly to reflect changes over time and the needs of each individual study.) The cards were intended to prompt respondentsabout any help they may have given. In the National Survey of Volunteering and Helping Out, more detailed questions were then asked abouteach organisation in order to check the type of help given. In theory, this might mean that in Helping Out and the National Survey ofVolunteering more help mentioned by the respondent may have been subsequently excluded, leading to lower levels of volunteering.However, this does not seem to have been the case: as Table 2.3 shows, the levels of volunteering for these studies tend to be higher thanthose seen in the Citizenship Surveys.
18 Helping Out: A national survey of volunteering and charitable giving
and Bradburn, 1982). In contrast, volunteering was only
one of many topics covered by the Citizenship Survey.
b) Sample profile and bias – data in the current study
have been weighted to take account of non-response to
the study and the fact that different groups were more
or less likely to respond. One important factor accounted
for in this is individuals’ volunteering status as measured
in the 2005 Citizenship Survey. Given the likely link
between volunteering recently and volunteering in the
past, this should reduce – to some extent, but notentirely – any bias in the sample towards recent
volunteers.
Because of these differences, the Helping Out figures on the
prevalence of volunteering are not directly comparable to
figures from other surveys. In particular, the Helping Out
estimates cannot be seen as evidence of a rise in formal
volunteering since the last Citizenship Survey. It is more likely
that a combination of the context of a more focused study
and differences in sample profile may explain the observed
differences in the prevalence of volunteering. In order to gain
a clearer picture of how volunteering has recently changed
over time, reference should be made to the findings from the
Citizenship Survey (Kitchen et al, 2006).
3 Who volunteers? 19
Summaryn There was some variation in formal volunteering across
key socio-demographic groups.
n Levels of formal volunteering varied significantly with age
and sex. The proportion of formal volunteers was highest
among people in the 35–44 and 55–64 age brackets,
lower among those aged 34 or younger, and lowest in
the 65 or over age group. Women were significantly
more likely to volunteer than men, either on a regular
basis or at all.
n The overall proportion of formal volunteers was lowest
among those not working. However, within this group,
levels varied according to the reasons for not working.
For example, those looking after the home had high
levels of formal volunteering, in contrast to those who
have a disability or limiting, long-term illness.
n Levels of all formal volunteering did not vary significantly
by ethnic origin. However, there were lower rates of
regular formal volunteering among those of Asian origin
(29%). This may be related to the lower rates of
participation among people born outside the UK (as
observed in the Citizenship Surveys).
n Patterns of formal volunteering varied by religious group,
for both regular and any formal help. As well as the
lower rates of participation among those born outside
the UK, these differences may also be linked to the
higher rates of participation among those activelypractising their religion (which varied by religious group).
n There was significant variation by Government Office
region, particularly with regard to regular volunteering.
The North East had the lowest levels of (regular or any)
formal volunteering, while the South West and West
Midlands regions had the highest levels.
n Individuals at particular risk of social exclusion
(comprising Black and minority ethnic groups, those with
no qualifications and those who have a disability or
limiting, long-term illness, here termed groups at risk of
social exclusion) had lower levels of formal volunteering
than those not at risk. The Government’s volunteering
policy is targeting these groups.
3.1 IntroductionThis chapter looks at how formal volunteering varied across
key socio-demographic groups.
The tables show levels of volunteering by each
socio-demographic factor separately: they do not take into
account interactions between the factors themselves.
However, the majority of the differences observed here are
seen even when other factors are taken into account. Where
previous analyses have indicated that this is not the case, it
is indicated in the text.
3.2 Age and sexLevels of formal volunteering varied significantly with age. The
proportion of formal volunteers was highest among people
in the 35–44 and 55–64 age brackets, with 64% of these
groups saying they had helped in some way over the last year
(Table 3.1). It was lower among those aged 34 or younger
(57%) and lowest in the 65 or over age group (53%). Regular
volunteering followed a slightly different age pattern
(although levels were not significantly different across
Base (unweighted) 1,100 165 887 51 109 117 551 2,155
Table 3.3 Extent of formal volunteering, by employment status
Base: All respondents answering volunteering questions. Don’t know/refusal responses excluded.
3 Who volunteers? 21
Figure 3.1 Extent of formal volunteering, byethnic origin
Base: All respondents answering volunteering questions. Don’t know/refusal responses excluded. Based on combined (core and boost)sample, except for ‘All’ sample based on core sample only. ‘Other’includes those of Chinese origin. See Table A.3.1 for details ofbase sizes.
Levels of formal volunteering varied significantly across
religious group, for both regular and any formal help.
However, these differences should not be taken at face value:
it is likely that they are at least partly explained by the lower
rates of participation among those born outside the UK
(Kitchen et al, 2006).
The differences are also linked to the different levels of
respondents who said they actively practised their religion.
As Table 3.4 also shows, there is a clear link between those
who actively practised their religion compared with those who
were not active, or did not profess to have any religion.6
Sixty-seven per cent of those actively practising their religion
gave some level of formal help (compared with 55% in other
groups), and over half were regular formal volunteers
(compared with a third or less in other groups).
There were some interesting variations in patterns of formal
volunteering within religious groups. For example, Hindu
respondents reported the highest levels of formal volunteering
(61%), although a lower proportion gave regular help (27%).
Muslim respondents were the least likely to give formal help
(45%), but this was less true when looking at regular formal
volunteering (32%). Those belonging to other religions
(including Buddhism and Judaism) also had high levels of any
or regular volunteering, while the reverse was true for those
not belonging to any religion.
3.6 Government Office regionTable 3.5 gives details by Government Office region. There
was some significant variation by region, particularly with
regard to regular volunteering. The North East had the lowest
levels of (regular or any) formal volunteering (41% compared
with 59% overall for all volunteering, and 24% compared
with 39% overall for regular volunteering). Conversely, the
South West and West Midlands regions had the highest levels
of volunteering.
3.7 Risk of social exclusion (PSA4)Individuals who belong to certain Black and minority ethnic
groups, have no qualifications or have a disability or limiting,
0
20
40
60
80
White Asian Black Mixed Other All
Perc
enta
ge
of
sam
ple
Regular formal volunteers Occasional or one-off volunteers
6. The majority of Buddhist, Hindu, Muslim and Sikh respondents said they actively practised their religion, while the reverse was true forChristian and Jewish respondents.
Base (unweighted) 1,917 97 204 152 1,061 1,314 326 2,155
Table 3.4 Extent of formal volunteering, by religion and religious activity
Base: All respondents answering volunteering questions. Don’t know/refusal responses excluded. Based on combined (core and boost) sample,except for ‘All’ sample based on core sample only.
22 Helping Out: A national survey of volunteering and charitable giving
long-term illness can be seen to be at particular risk of social
exclusion. These three groups have also been shown to
volunteer less, and as such have become the focus of
government initiatives and policies to increase levels of
participation, and are specifically referred to in the Cabinet
Office Public Service Agreement (PSA4) objectives. Table 3.6
confirms the lower levels of formal volunteering among
groups at risk of social exclusion: just under a half had helped
in some way over the last year compared with two-thirds of
those not at risk, while 32% said they were regular volunteers
compared with 42% among those not at risk. In particular,
those with a limiting, long-term illness or disability had lower
levels of formal volunteering, with 28% classed as regular
formal volunteers. (Figure 3.1 gives full details for the other
constituent group – Black and minority ethnic respondents –
for the at-risk group.)
East East of London North North South South West York- All
Table 3.5 Extent of formal volunteering, by Government Office region
Base: All respondents answering volunteering questions. Don’t know/refusal responses excluded.
Table 3.6 Extent of formal volunteering, by groups at risk of social exclusion
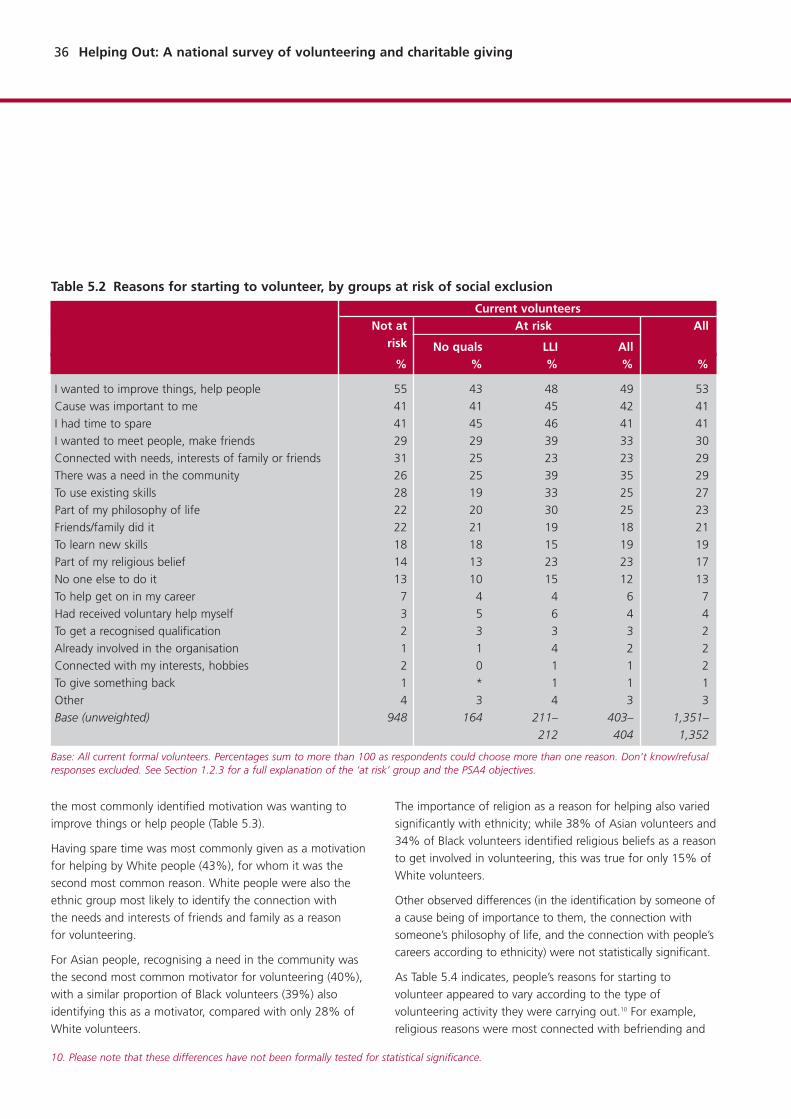
Base: All respondents answering volunteering questions. Don’t know/refusal responses excluded. See Section 1.2.3 for a full explanation of the‘at risk’ group and the PSA4 objectives.
At risk of which: Not at risk All
Disability No
or limiting, qualifications
long-term
illness
% % % % %
All formal volunteers 48 42 46 65 59
Regular formal volunteers 32 28 31 42 39
Occasional or one-off volunteers 16 14 15 23 20
Non-volunteers 52 58 54 35 41
Base (unweighted) 797 457 334 1,358 2,155
4 What volunteers do 23
Summaryn Fifty-nine per cent of current volunteers helped more
than one organisation. The main organisation for 65%
of volunteers was in the voluntary and community sector,
while for 23% it was in the public sector and for 11% it
was in the private sector. There were some differences in
the sectors volunteered in according to age and sex.
n The most common field of interest supported by
volunteers was education, with 31% of current
volunteers being involved in this area. Other common
fields of interest were religion (24%), sports and exercise
(22%) and health and disability (22%).
n Women were more likely than men to volunteer in
organisations whose main field of interest was education
and health/disability, while men were more likely than
women to be involved in sports/exercise-based
organisations.
n Those aged 55 and over were the age group least likely
to be involved in education and in children’s/young
people’s organisations, but most likely to volunteer in
organisations whose main field of interests were elderly
people and local community/citizen groups.
n Asian and Black volunteers were particularly likely to help
organisations whose main field of interest was religion.
n Seventy-one per cent of volunteers undertook more than
one volunteering activity. Raising and handling money
was the most common type of volunteering activity
(undertaken by 65% of current volunteers). Organising
and helping to run events was the second most common
(50%).
n Age made a difference to participation in certain types
of volunteering activities (committee membership,
transporting and visiting people), but for all age groups
raising and handling money and organising or helping
to run an event were the two most common forms
of volunteering activity.
n Women were more likely than men to be involved in
organising or helping to run an event, while men were
more likely than women to be involved in transporting.
n There were significant differences in the activities
undertaken by ethnic group with White volunteers the
ethnic group most likely to be involved as committee
members, in administrative activities, transporting and
visiting people.
4.1 Introduction Volunteers are engaged in a wide variety of activities for a
wide range of organisations. This chapter explores the types
of organisations that volunteers supported, before examining
the type of help they gave.
4.2 Number and sector of organisationshelped
Many volunteers (59%) helped more than one organisation,
with over one-third (36%) helping three or more (Table 4.1).
There has been a significant increase in the proportion of
volunteers helping more than one organisation since the 1997
National Survey of Volunteering (NSV) (Table 4.1).
The number of organisations helped by volunteers did not
vary significantly with age, sex, being at risk of social
exclusion or ethnicity.
Table 4.1 Number of organisations helped byvolunteers
Base: All current formal volunteers. Don’t know/refusal responsesexcluded.
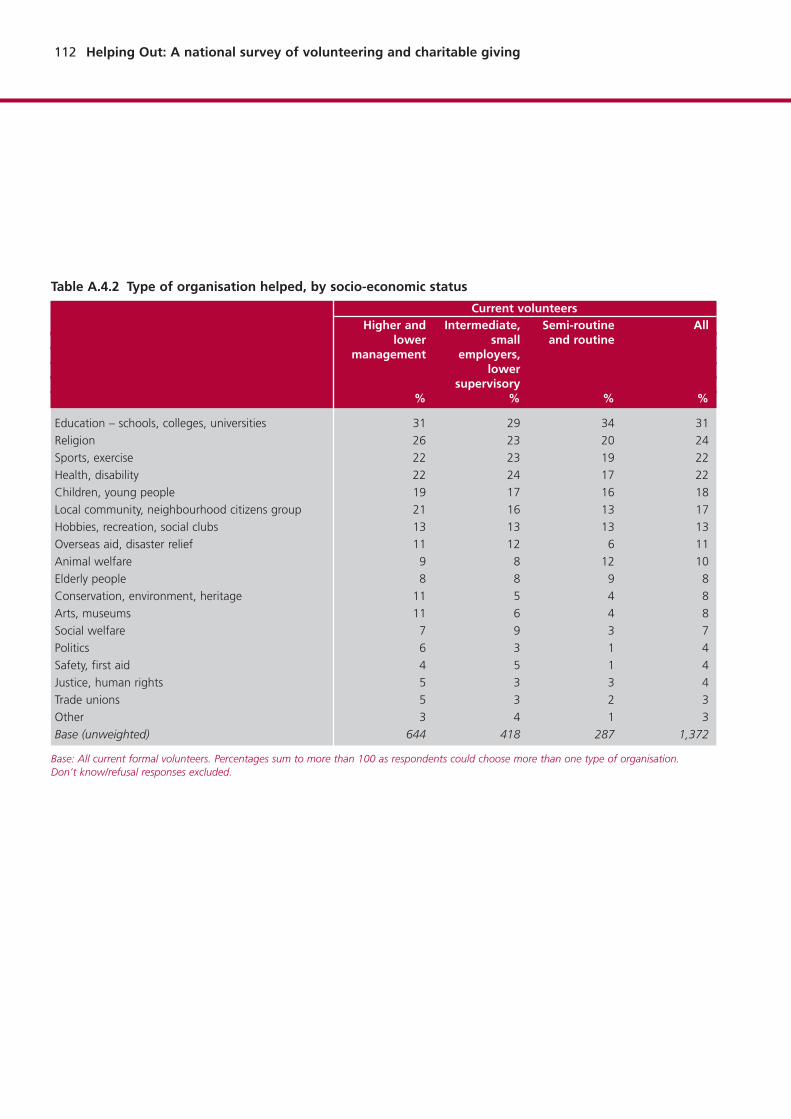
In terms of sectors within which volunteers were engaged
(Table 4.2), for 65% of volunteers the main organisation they
helped was within the voluntary and community sector.
The main organisation for 23% of volunteers was within the
public sector, and for 11% of volunteers it was within the
private sector.
It is not possible to compare the results for sectors
volunteered with directly with those from the 1997 National
Helping Out NSV 1997, 2006/07, current
current volunteersvolunteers
% %
1 41 47
2 23 24
3 to 5 30 23
6 or over 6 6
Base (unweighted) 1,372 704
4 What volunteers do
24 Helping Out: A national survey of volunteering and charitable giving
Survey of Volunteering, as in 2006/07 the questions focused
on the sector of the main organisation that volunteers were
helping,7 whereas the 1997 survey asked about the sectors of
all organisations supported. To give an indication, however, in
1997 84% of volunteers helped within the voluntary and
community sector, 24% within the public sector and 13% in
the private sector (Davis Smith, 1998), suggesting a broadly
similar pattern to that found in 2006/07.
There was significant variation in the sector of volunteers’
main organisations by age and sex (Table 4.2). Young people,
aged 16–24, and older people, aged 65 and over, were the
age groups most likely to volunteer within the voluntary and
community sector and least likely to volunteer in the public
sector. The main organisations that men volunteered in were
more likely to be in the private sector than those of women.
Overall, volunteers from groups at risk of social exclusion were
more likely to volunteer in a main organisation that was
within the voluntary and community sector than not at risk
volunteers (see Table 4.3). Although higher proportions of
Black and Asian respondents helped such organisations (73%
and 75% respectively), these differences were not significant
when more detailed breakdowns by ethnicity (incorporating
the boost sample) were examined.
4.3 Field of interest of organisations helpedRespondents were asked about the fields of interest of the
organisations that they volunteered for. The emphasis was on
the overall field of interest of the organisation, rather than the
type of help actually undertaken by the volunteer. So, for
example, when a person volunteered by doing a sponsored
run for a cancer charity, the organisation would be classified
as health and disability, rather than as sports.
As Table 4.4 shows, the most common field of interest
supported by volunteers was education – with 31% of current
Base: All current formal volunteers. Don’t know/refusal responses excluded. See Section 1.2.3 for a full explanation of the ‘at risk’ group and thePSA4 objectives.
Table 4.2 Sector of organisation helped by volunteers, by age and sex
Base: All current formal volunteers. Don’t know/refusal responses excluded.
Table 4.3 Sector of organisation helped by volunteers, by groups at risk of social exclusion
Current volunteers
Not at risk At risk All
No quals LLI All% % % % %
Voluntary and community 63 66 69 72 65
Public 25 23 21 19 23
Private 12 12 10 9 11
Base (unweighted) 941 161 208 396 1,337
7. Respondents who helped more than one organisation were asked to think about the main organisation with which they volunteered. Thequestion prompted them to select the organisation for which they had done most (i.e. had spent most time helping).
4 What volunteers do 25
formal volunteers (or 18% of all respondents) helping schools,
colleges, universities and other educational institutions. Also
well supported were religious organisations (24% of current
volunteers, 14% of all respondents), sports and exercise-based
organisations (22% and 13%) and health and disability-based
organisations (22% and 13%).
Politics (4% of current volunteers, and 2% of all respondents),
safety and first aid (4% and 2%), justice and human rights
(4% and 2%) and trade unions (3% and 2%) were the least
commonly supported fields of interest.
Table 4.4 Types of organisation helped
Base: (a) All respondents answering the volunteering questions.(b) All current formal volunteers. Percentages sum to more than 100as respondents could help more than one type of organisation. Don’tknow/refusal responses excluded.
Due to slight changes in the questions asked, it is not possible
to make direct comparisons between these results and those
from the 1997 National Survey of Volunteering, particularly as
some organisational fields were amended. However, to give
an indication of change, in 1997 26% of current volunteers
volunteered within sports and exercise, whereas in 2006/07
this was 22%. Meanwhile, while 14% of volunteers in 1997
volunteered with children and young people, this was 18% in
2006/07. The proportion involved in animal welfare seems to
have increased, going from 3% in 1997 to 10% in 2006/07,
while the proportion involved in safety and first aid seems to
have decreased, going from 9% in 1997 to 4% in 2006/07.
4.3.1 Fields of interest supported by differentgroups of volunteers
The categories of organisations supported by volunteers varied
to some extent with the age, sex, risk of social exclusion and
ethnicity of respondents (Tables 4.5, 4.6 and 4.7).
Women were more likely than men to volunteer in education
(37% and 23% respectively) and with organisations
concerned with health and disability (26% and 17%
respectively). Men were more likely than women to volunteer
in sports and exercise (30% and 16% respectively). Women
were also more likely than men to be involved in
organisations concerned with overseas aid and disaster relief
(14% and 7% respectively).
Age also made a difference to volunteering in education, with
13–18% of those aged 55 and over volunteering in schools,
colleges and universities compared with around two-fifths
(36–43%) of 16–54 year olds (for whom it was the most
popular field of interest). Those aged 55 and over were the
age group least likely to volunteer in organisations for children
and young people (6–11%), but most likely to volunteer in
organisations supporting elderly people (14%) and in local
community, neighbourhood and citizens groups (21–22%).
In contrast to all other age groups, for people aged 55 and
over, religion was the most common field of activity, rather
than education.
As Table 4.6 shows, those not deemed at risk of social
exclusion were significantly more likely to volunteer in
educational organisations than the at-risk groups combined
(33% compared with 24%) and in organisations concerned
with sports and exercise (25% compared with 14%).
Participation among two of the constituent at-risk groups –
those with no qualifications and those with a limiting, long-
term illness or disability – were also low for these types of
organisation (see Table 4.7 for the breakdown by ethnicity).
Volunteers from groups at risk of social exclusion were more
All Current volunteers
% %
Education – schools, colleges, 18 31
universities
Religion 14 24
Sports, exercise 13 22
Health, disability 13 22
Children, young people 11 18
Local community, neighbourhood, 10 17
citizens group
Hobbies, recreation, social clubs 8 13
Overseas aid, disaster relief 6 11
Animal welfare 6 10
Elderly people 5 8
Arts, museums 5 8
Conservation, the environment, heritage 4 8
Social welfare 4 7
Politics 2 4
Safety, first aid 2 4
Justice, human rights 2 4
Trade unions 2 3
Other 2 3
None 41 N/A
Base (unweighted) 2,156a 1,372b
26 Helping Out: A national survey of volunteering and charitable giving
Table 4.5 Types of organisation helped, by age and sex
Base: All current formal volunteers. Percentages sum to more than 100 as respondents could help more than one type of organisation.Don’t know/refusal responses excluded.
4 What volunteers do 27
likely to volunteer in religious organisations than were
volunteers not at risk (though this was largely driven by the
higher rate of participation in these organisations among
Black and minority ethnic respondents; see Table 4.7).
There was significant variation in levels of volunteering within
organisations concerned with religion, sports and exercise, and
overseas aid and disaster relief across ethnic groups (Table 4.7).
While nearly half (49%) of Asian volunteers and two-fifths
(41%) of Black volunteers helped organisations whose main
field of interest was religion (and this was the most common
type of organisation helped for these groups), this was the
case for just one-fifth (20%) of White volunteers (for whom
education was the most common field of interest). Similarly,
while 24% of Asian and 18% of Black volunteers participated
in organisations concerned with overseas aid and disaster
relief, only 10% of White volunteers helped these types
of organisation.
While 24% of White volunteers participated in organisations
whose main field of interest was sports or exercise, 12% of
Asian and 8% of Black volunteers participated in these
organisations.
There was no significant difference in levels of volunteering in
organisations concerned with education across ethnic groups.
The observed differences in participation were also not
significant for health and disability-related organisations,
children and young people or local community,
neighbourhood or citizens groups.
A breakdown of organisation type by religion shows significant
differences by denomination consistent with the findings for
ethnicity (Table A.4.1). Organisations concerned with religion
or overseas aid were most likely to be supported by Hindus
and Muslims. Conversely, organisations relating to sport and
exercise were least likely to be supported by Muslims.
Base: All current formal volunteers. Percentages sum to more than 100 as respondents could help more than one type of organisation.Don’t know/refusal responses excluded. See Section 1.2.3 for a full explanation of the ‘at risk’ group and the PSA4 objectives.
Table 4.6 Types of organisation helped, by groups at risk of social exclusion
Local community, neighbourhood, citizens group 17 16 22 21 17
Hobbies, recreation, social clubs 14 7 6 5 13
Overseas aid, disaster relief 10 24 18 16 11
Animal welfare 10 1 7 1 10
Elderly people 8 7 11 6 8
Conservation, environment, heritage 8 3 3 2 8
Arts, museums 8 3 5 4 8
Social welfare 7 5 5 12 7
Politics 4 2 2 6 4
Safety, first aid 4 2 0 1 4
Justice, human rights 4 4 3 11 4
Trade unions 4 2 5 5 3
Other 3 0 1 3 3
Base (unweighted) 1,293 178 115 87 1,372
Base: All current formal volunteers. Percentages sum to more than 100 as respondents could help more than one type of organisation.Don’t know/refusal responses excluded. Based on combined (core and boost) sample, except for ‘All’ sample based on core sample only.‘Other’ includes those of Chinese origin.
4 What volunteers do 29
Table 4.8 Number of volunteering activitiesundertaken
Base: (a) All respondents answering the volunteering questions2006/07. (b) All current formal volunteers 2006/07. Don’t know/refusalresponses excluded. (c) All current formal volunteers 1997.
In terms of what they actually did, the most common type of
volunteering activity was raising or handling money, with 65%
of current formal volunteers involved (Table 4.9). Organising
or helping to run an event was the next most common type
of activity (50%), followed by being a committee member
(28%), educating others (which includes coaching, 25%)
and administrative activities (21%). Thirty-five per cent of
volunteers were involved in practical help other than those
activities specifically listed. The least common types of
volunteering activity were befriending (15%) and
campaigning (14%).
As Table 4.9 indicates, by looking at all respondents, almost
two-fifths (38%) of the sample were involved in fundraising
activities over the past year, while nearly a third (30%) were
involved in organising or helping to run an event.
Although direct comparisons with the 1997 National Survey
of Volunteering are again problematic, results from the two
surveys do suggest that there have been some, but small,
changes in the types of activity current volunteers are
engaging in. For example, just looking at the most common
activities, in 1997 66% of current volunteers were involved in
fundraising; 65% were involved in this activity in 2006/07. In
1997, 55% were involved in organising or helping to run an
event; 50% were involved in this activity in 2006/07. Thirty-six
per cent of current volunteers in 1997 were involved as
committee members; this figure was 28% in 2006/07.
Transporting seems to have seen the biggest drop in
participation, with 26% of current volunteers in 1997 saying
they were involved in this activity, down to 19% in 2006/07.8
Table 4.9 Types of volunteering activity
Base: (a) All respondents answering the volunteering questions.(b) All current formal volunteers. Percentages sum to more than 100as respondents could choose more than one type of help. Don’tknow/refusal responses excluded.
4.4.1 Variation in volunteering activity bydemographic group
Levels of participation in certain types of volunteering activity
varied with age, but for all age groups raising and handling
money and organising or helping to run an event were the two
most common forms of volunteering activity (Table 4.10).
There was a significant difference in committee membership
according to age, although this did not follow a simple
pattern. While 32% of young people aged 16–24 were
involved as committee members, this then fell among 25–34
year olds and 35–44 year olds (19% and 22% respectively)
before increasing again to 30% among 45–64 year olds and
37% among those aged 65 and over. Young people aged
All Current volunteers
% %
Raising, handling money 38 65
Organising, helping run an event 30 50
Committee member 17 28
Educating 14 25
Secretarial, administrative, clerical 12 21
Transporting 11 19
Representing 11 19
Visiting people 10 17
Giving advice, information, counselling 10 16
Befriending 9 15
Campaigning 9 14
Other practical help 21 35
Other help 8 14
No help given 41 N/A
Base (unweighted) 2,156a 1,372b
Helping Out 2006/07 NSV 1997All Current Current
volunteers volunteers% % %
0 41 – –
1 16 28 32
2 11 18 21
3 9 15 15
4 7 11 10
5+ 16 27 22
Base (unweighted) 2,156a 1,372b 704c
8. Although the 2005 Citizenship Survey, using a summary measure, estimated that 24% of volunteers were involved in transporting or driving.
30 Helping Out: A national survey of volunteering and charitable giving
Table 4.10 Types of volunteering activity, by age and sex
Base: All current formal volunteers. Percentages sum to more than 100 as respondents could choose more than one type of help.Don’t know/refusal responses excluded.
Base: All current formal volunteers. Percentages sum to more than 100 as respondents could choose more than one type of help.Don’t know/refusal responses excluded. See Section 1.2.3 for a full explanation of the ‘at risk’ group and the PSA4 objectives.
Table 4.11 Types of volunteering activity, by groups at risk of social exclusion
Base: All current formal volunteers. Percentages sum to more than 100 as respondents could choose more than one type of help.Don’t know/refusal responses excluded. Based on combined (core and boost) sample, except for ‘All’ sample based on core sample only.‘Other’ includes those of Chinese origin.
32 Helping Out: A national survey of volunteering and charitable giving
Table 4.13 Types of volunteering activity, by socio-economic status
Current volunteersHigher and lower Intermediate, Semi-routine All
management small employers, and routinelower supervisory
Base: All current formal volunteers. Percentages sum to more than 100 as respondents could choose more than one type of help.Don’t know/refusal responses excluded.
helping to run an event, 40% of those in semi-routine
or routine employment got involved in these volunteering
activities. People from higher and lower management
were also the socio-economic group most likely to be
committee members.
5 Routes into volunteering 33
Summaryn The most common reason for getting involved in
volunteering, identified by 53% of current formal
volunteers, was to improve things or help people. Other
common reasons were because the cause was important
to the volunteer (41%) and because they had spare time
on their hands (41%).
n Although the overall priority of reasons for getting
involved was similar across different age groups, there
were some differences in the strength of identification
with certain reasons according to age. For example,
getting involved in order to meet people or make new
friends was most common among the youngest and
oldest age groups. Getting involved because of the
needs of family or friends was most common among the
middle aged.
n Ethnicity also made a difference to the reasons identified
for volunteering. For example, among White people,
having spare time was the second most common reason
for volunteering (43%), and they were more likely to
identify this as a reason for getting involved than Black
(37%) or Asian (28%) volunteers.
n Word of mouth was the most common way that people
had found out about volunteering (66% of current
formal volunteers found out about volunteering in their
main organisation this way). Having previously used the
services of an organisation was the second most
common way of finding out about volunteering (20%).
n The study also looked at sources of information used to
find out about volunteering, although half of the current
volunteers had not used any of those listed. The most
common sources used were information provided by
national and local organisations.
5.1 The reasons why people volunteer People volunteer for a range of different reasons, and this was
highlighted within this study. Respondents were shown a list
of different reasons for getting involved and asked to select
those factors that were important to them in starting to help
the main organisation with which they volunteered.9
They could select more than one reason.
5.1.1 Motivations of current formal volunteers
As Figure 5.1 shows, volunteers reported a range of
pragmatic and altruistic reasons for starting to volunteer (and
many mentioned a number of reasons for their involvement).
Just over half of all current formal volunteers (53%) got
involved because they wanted to improve things or help
people. For two-fifths (41%) it was because the cause was
important to them that they got involved, while having spare
time on their hands was a motivating factor for two-fifths
(41%). Social aspects of volunteering were also important,
with 30% getting involved to meet people or to make new
friends. Wanting to give something back was the least
common motivator (1%).
Due to slight changes in questions asked, direct comparisons
are difficult, but it does appear that people’s reasons for
starting to volunteer have changed somewhat between 1997
and 2006/07. Wanting to improve things and to help people
appears to have become more important, with 35% of
current volunteers reporting this as a reason for starting to
volunteer in 1997 compared with 53% doing so in 2006/07.
Having spare time also appears to have become more
significant, reported by 21% of respondents as a reason for
volunteering in 1997 and by 41% in 2006/07. Conversely,
volunteering in organisations because they were connected
with the needs or interests of friends and family seems to
have become less important, noted by 45% of respondents in
1997 and by 29% in 2006/07.
5 Routes into volunteering
9. Respondents who helped more than one organisation were asked to think about the main organisation with which they volunteered.The question prompted them to select the organisation for which they had done most (i.e. had spent most time helping). Basesthroughout this chapter exclude some respondents who selected a type of informal volunteering as their main organisation. They alsoexclude some respondents who were not initially identified as having volunteered in the last year and so were not asked the questionsabout their main organisation.
34 Helping Out: A national survey of volunteering and charitable giving
5.1.2 Variations in motivations among differentdemographic groups
The main reasons people gave for getting involved in
volunteering were consistent across age groups. However,
there was some variation between age groups in the
proportion of respondents identifying particular motivations
as being important (Table 5.1).
Those at either end of the age spectrum (16–24 year olds and
those aged 65 and over) were the age groups most likely to
get involved in volunteering in order to meet new people or
make friends. Age also made a difference as to whether or
not people were motivated by the needs or interests of friends
and family, with 16–24 year olds and those aged 65 and over
the age groups least likely to identify this as a motivation and
those aged 35–44 the most likely to do so.
Figure 5.1 Reasons for starting to volunteer
0 10 20 30 40 50 60
Other
Give something back
Connected with my interests/hobbies
Already involved with organisation
Get a recognised qualification
Had received voluntary help myself
Help get on in my career
No one else to do it
Part of my religious belief
Learn new skills
Friends/family did it
Part of my philosophy of life
Use existing skills
There was a need in the community
Connected to family/friends’ interests
I wanted to meet people, make friends
I had time to spare
The cause was important to me
I wanted to improve things, help people
Percentage of current volunteers
53
41
41
30
29
29
27
23
21
19
17
13
7
4
2
2
2
1
3
Base: All current formal volunteers (n=1,351–1,352). Percentages sum to more than 100 as respondents could choose more than one reason.Don’t know/refusal responses excluded.
5 Routes into volunteering 35
Young people (aged 16–24) were the age group most likely to
say that they got involved in volunteering to help them get on
in their careers. They were also most likely to mention
wanting to gain new skills from their volunteering.
In contrast, older people (especially those aged 65 and over)
were the group most likely to say that they got involved
because they had spare time. They were also the most likely
to say that volunteering was part of their philosophy of life.
Motivations for volunteering were broadly similar among men
and women, although men were significantly more likely than
women to say that they got involved because their friends or
family did it (26% and 17% respectively).
Reasons for getting involved presented by volunteers from
groups deemed at risk of social exclusion (see Section 1.2.3)
varied slightly from those identified by volunteers not at risk
(Table 5.2). Volunteers from the at-risk groups – specifically
those with limiting, long-term illnesses and those from
minority ethnic backgrounds (see Table 5.3) – were more likely
to get involved due to religious motivations than those not at
risk (23% overall compared with 14%). However, volunteers
from at-risk groups were less likely than others to get involved
for reasons connected with the needs and interests of friends
and family (23% compared with 31%).
There was some variation in the reasons identified by
volunteers from different ethnic backgrounds, although for all
Table 5.1 Reasons for starting to volunteer, by age and sex
Base: All current formal volunteers. Percentages sum to more than 100 as respondents could choose more than one reason. Don’t know/refusalresponses excluded.
36 Helping Out: A national survey of volunteering and charitable giving
the most commonly identified motivation was wanting to
improve things or help people (Table 5.3).
Having spare time was most commonly given as a motivation
for helping by White people (43%), for whom it was the
second most common reason. White people were also the
ethnic group most likely to identify the connection with
the needs and interests of friends and family as a reason
for volunteering.
For Asian people, recognising a need in the community was
the second most common motivator for volunteering (40%),
with a similar proportion of Black volunteers (39%) also
identifying this as a motivator, compared with only 28% of
White volunteers.
The importance of religion as a reason for helping also varied
significantly with ethnicity; while 38% of Asian volunteers and
34% of Black volunteers identified religious beliefs as a reason
to get involved in volunteering, this was true for only 15% of
White volunteers.
Other observed differences (in the identification by someone of
a cause being of importance to them, the connection with
someone’s philosophy of life, and the connection with people’s
careers according to ethnicity) were not statistically significant.
As Table 5.4 indicates, people’s reasons for starting to
volunteer appeared to vary according to the type of
volunteering activity they were carrying out.10 For example,
religious reasons were most connected with befriending and
Current volunteersNot at At risk All
risk No quals LLI All% % % % %
I wanted to improve things, help people 55 43 48 49 53
Cause was important to me 41 41 45 42 41
I had time to spare 41 45 46 41 41
I wanted to meet people, make friends 29 29 39 33 30
Connected with needs, interests of family or friends 31 25 23 23 29
There was a need in the community 26 25 39 35 29
To use existing skills 28 19 33 25 27
Part of my philosophy of life 22 20 30 25 23
Friends/family did it 22 21 19 18 21
To learn new skills 18 18 15 19 19
Part of my religious belief 14 13 23 23 17
No one else to do it 13 10 15 12 13
To help get on in my career 7 4 4 6 7
Had received voluntary help myself 3 5 6 4 4
To get a recognised qualification 2 3 3 3 2
Already involved in the organisation 1 1 4 2 2
Connected with my interests, hobbies 2 0 1 1 2
To give something back 1 * 1 1 1
Other 4 3 4 3 3
Base (unweighted) 948 164 211– 403– 1,351–
212 404 1,352
Table 5.2 Reasons for starting to volunteer, by groups at risk of social exclusion
Base: All current formal volunteers. Percentages sum to more than 100 as respondents could choose more than one reason. Don’t know/refusalresponses excluded. See Section 1.2.3 for a full explanation of the ‘at risk’ group and the PSA4 objectives.
10. Please note that these differences have not been formally tested for statistical significance.
5 Routes into volunteering 37
visiting activities, while ‘no one else would do it’ was more
associated with administrative activities than other forms of
volunteering.
5.2 Finding out about volunteering Current volunteers were asked two questions about their
routes into volunteering. First they were asked about the
mechanisms by which they found out about opportunities to
help (e.g. word of mouth, radio, newspapers). Next they were
asked about the sources of information they had used in
becoming involved (e.g. from the charity or organisation itself,
from libraries or from local councils), regardless of the format
of this information. Respondents could and did give more
than one answer to these questions.
5.2.1 Routes into volunteering
As in the 1997 National Survey of Volunteering (Davis Smith,
1998), word of mouth was the most common way in which
people found out about the opportunity to volunteer in their
main organisation. Two-thirds of current formal volunteers
(66%) got involved through word of mouth (Table 5.5).
Having previously used the services of the organisation was
Current volunteersWhite Asian Black Mixed/ All
other% % % % %
I wanted to improve things, help people 54 57 56 50 53
Cause was important to me 42 30 49 41 41
I had time to spare 43 28 37 41 41
I wanted to meet people, make friends 31 27 25 28 30
Connected with needs, interests of family or friends 30 15 23 22 29
There was a need in the community 28 40 39 38 29
To use existing skills 29 19 25 31 27
Part of my philosophy of life 23 32 21 28 23
Friends/family did it 21 18 12 18 21
To learn new skills 19 23 23 23 19
Part of my religious belief 15 38 34 24 17
No one else to do it 14 6 5 11 13
To help get on in my career 7 15 11 11 7
Had received voluntary help myself 4 2 1 10 4
To get a recognised qualification 2 3 3 1 2
Already involved in the organisation 2 1 2 * 2
Connected with my interests, hobbies 2 * 0 3 2
To give something back 1 * * 3 1
Other 4 2 9 5 3
Base (unweighted) 1,275– 173 115 86 1,351–
1,276 1,352
Table 5.3 Reasons for involvement, by ethnicity of volunteers
Base: All current formal volunteers. Percentages sum to more than 100 as respondents could choose more than one reason. Don’t know/refusalresponses excluded. Based on combined (core and boost) sample, except for ‘All’ sample based on core sample only. ‘Other’ includes those ofChinese origin.
38 Helping Out: A national survey of volunteering and charitable givingTa
Table 5.5 Routes into volunteering, by age and sex
Base: All current formal volunteers. Percentages sum to more than 100 as respondents could choose more than one source. Don’t know/refusalresponses excluded.
the second most common way of finding out about
volunteering (20%), and seeing the opportunity advertised on
a leaflet or poster was the third most common (15%).
Radio (both national and local), specific volunteering websites
and national newspapers were the least common ways of
finding out about volunteering (all identified by 1% or less of
current volunteers). In common with the 1997 National Survey
of Volunteering, 2% of volunteers had found out about
volunteering through visiting a Volunteer Centre or Bureau.
Although word of mouth, having been a service user and
seeing a leaflet or poster were the three most common ways
of finding out about volunteering for both men and women
and for all age groups, there were some significant differences
in the routes into volunteering according to age and sex
(Table 5.5).
The use of leaflets and posters as a source of information
about volunteering varied according to age, being used least
by people aged 65 and over (6%) and most by those aged
35–44 (22%) and 25–34 (20%). The use of organisational
websites also varied significantly with age, with the highest
use being among 25–34 year olds (10%) and the lowest
among those aged 65 and over (<1%).
Men were significantly more likely than women to have found
out about their volunteering opportunities through word of
mouth (71% compared with 63%).
Volunteers from groups at risk of social exclusion were less
likely to find out about volunteering through a leaflet or
poster or through an employer than those not at risk
(Table 5.6). Beyond these two ways of finding out about
volunteering however, the observed differences between the
40 Helping Out: A national survey of volunteering and charitable giving
two categories of respondents were not significant. (It is
worth noting, however, the significantly lower proportion of
respondents with a limiting, long-term illness or disability
using websites to access information compared with other
respondents.)
The ways in which people from different ethnic groups found
out about the opportunity to volunteer in their main
organisations were broadly similar, with only the use of TV
and of organisational websites varying significantly (Table 5.7).
While 8% of Asian volunteers found out about volunteering
through local or national TV, this was true for 3% of Black
and 2% of White volunteers. Similarly, while 10% of Asian
volunteers found out about volunteering through their
organisation’s own website, this was true for 4% of Black
volunteers and 4% of White volunteers.
Table 5.8 shows how people found out about those
opportunities, according to the types of volunteering activities
undertaken.11 Word of mouth was the most common route
into volunteering across all types of activities, while having
previously used the services of the organisation was the
second most common across all activities (highest among
committee members and those undertaking administrative
roles) except for campaigning, for which leaflets and posters
were the second most common (followed closely by previously
being a service user).
5.2.2 Sources of information about volunteering
Half of all current formal volunteers had not used any of the
organisational sources of information that were listed
(Table 5.9). This is likely to reflect the large number of
Current volunteersNot at At risk All
risk No quals LLI All% % % % %
Word of mouth 66 71 67 67 66
Previously used services of the organisation 20 14 23 20 20
Leaflet or poster 17 11 11 11 15
Local event 7 6 4 6 7
Employer 8 5 3 4 7
Organisation website 4 6 1 4 4
Set up own group 5 4 4 3 4
Local newspaper 3 5 4 4 3
National or local TV 1 3 1 2 2
Visited a Volunteer Centre/Bureau 2 5 2 4 2
Involvement with the organisation, but not as a 2 2 2 1 2
service user
National newspaper 1 3 1 2 1
Local radio 1 1 1 1 1
General volunteering website * 2 * 1 1
National radio * 1 * 1 *
Other 3 5 2 4 4
Base (unweighted) 948 164 211 403 1,351
Table 5.6 Routes into volunteering, by groups at risk of social exclusion
Base: All current formal volunteers. Percentages sum to more than 100 as respondents could choose more than one source. Don’t know/refusalresponses excluded. See Section 1.2.3 for a full explanation of the ‘at risk’ group and the PSA4 objectives.
11. Please note that these differences have not been formally tested for statistical significance.
5 Routes into volunteering 41
respondents who found out about volunteering through
word of mouth.
Information provided directly by a national (19%) or local
(18%) organisation were the most common sources for
current formal volunteers, and this was true among all age
groups, sexes and ethnic groups.
There were no significant differences in the sources of
information used by different age groups or by men and
women (Table 5.9), although slight variations did exist.
The only difference in the sources of information used by
volunteers from groups at risk of social exclusion and those
not at risk was with regard to local organisations – volunteers
from at-risk groups were less likely to get information from a
local organisation than those not from at-risk groups (14%
and 19% respectively, see Table A.5.1).
Similarly, there was little difference in the sources of
information identified by different ethnic groups, with the
exception of community centres (Table A.5.2). While 9% of
Asian volunteers reported community centres as a source of
volunteering information, this was so for only 3% of Black
and 1% of White volunteers.
Current volunteersWhite Asian Black Mixed/ All
other% % % % %
Word of mouth 67 63 57 61 66
Previously used services of the organisation 19 17 19 19 20
Leaflet or poster 15 16 11 11 15
Local event 7 7 10 6 7
Employer 7 5 7 11 7
Organisation website 4 10 4 10 4
Set up own group 5 5 1 7 4
Local newspaper 3 2 1 7 3
National or local TV 2 8 3 1 2
Visited a Volunteer Centre/Bureau 2 3 4 2 2
Involvement with the organisation, but not as a 2 2 1 0 2
service user
National newspaper 1 5 3 1 1
Local radio 1 4 3 1 1
General volunteering website 1 * 5 3 1
National radio * 1 0 1 *
Other 3 1 6 6 4
Base (unweighted) 1,275 173 115 86 1,351
Table 5.7 Routes into volunteering, by ethnicity
Base: All current formal volunteers. Percentages sum to more than 100 as respondents could choose more than one source. Don’t know/refusalresponses excluded. Based on combined (core and boost) sample, except for ‘All’ sample based on core sample only. ‘Other’ includes those ofChinese origin.
42 Helping Out: A national survey of volunteering and charitable givingTa
Table 5.9 Sources of information on volunteering, by age and sex
Base: All current formal volunteers. Percentages sum to more than 100 as respondents could choose more than one source. Don’t know/refusalresponses excluded.
44 Helping Out: A national survey of volunteering and charitable giving
Summaryn Advice and support were available for a majority (83%)
of volunteers within the main organisation they helped.
However, most volunteers felt that they did not need
advice and support (although this was less true among
regular volunteers). Nearly all (94%) of those volunteers
who said they needed them felt the advice and support
they received were adequate.
n Fifty-four per cent of current volunteers said they had
not incurred any expenses in the past year. Of those who
had incurred expenses, 77% had not had any of those
expenses reimbursed and 17% had had only some of
their expenses reimbursed.
n Seventy-nine per cent of volunteers had not received any
training for their role within their main organisation,
although regular volunteers were more likely than
occasional volunteers to have done so. Among those
who had received training, nearly all (96%) felt it
was adequate.
n A majority of volunteers (78%) had not been asked to
attend an interview before commencing their activities,
nor had they been provided with a role description
(81%), had their references taken up (89%), been asked
for details of criminal convictions (82%) or been subject
to Criminal Records Bureau (CRB) checks (82%). The
likelihood of receiving each of these interventions
increased among regular volunteers when compared
with occasional volunteers.
n Those who had been asked to attend an interview, had
their references taken up, been asked for details of
criminal convictions or been subject to a CRB check
generally did not mind.
n On the whole, volunteers were not overly concerned
about issues connected with risk, although 10% had
worried about issues of risk connected with their
volunteering. Very few had considered stopping because
of any concerns about risk (2%), and fewer still had
been involved in incidents that had resulted in
organisations being sued (<1%). In terms of information
provided by organisations, 27% of volunteers had been
given information about how to reduce risks.
6.1 IntroductionThe rise of volunteer management practices has been well
reported (for example Davis Smith, 1996). Not since the 1997
National Survey of Volunteering (NSV) (Davis Smith, 1998),
however, have volunteers systematically been asked on a
national basis about their experience of and attitudes towards
various volunteer management practices.
All current formal volunteers were asked a series of questions
about the organisation of their volunteering in the mainorganisation that they helped.12
6.2 Advice and supportVolunteers were asked whether or not they felt they needed
advice and support for their volunteering activities and their
perceptions of the advice and support that were available.
6.2.1 Availability of advice and support
Advice and support were available for a majority (83%) of
volunteers. (The study did not explore in detail where that
advice and support came from.) For a significant minority of
volunteers (18%) there was no one available to offer support.
Volunteers for organisations concerned with health or
disability or with sport were least likely to say that advice
was available (71% and 75% said so respectively – see
Table A.6.1). In contrast, 92% of volunteers with local
or community groups said advice was available.
6.2.2 Need for advice and support
Most volunteers (82%) did not feel that they needed advice
and support (Table 6.1). The proportion of volunteers feeling
the need for advice and support had declined significantly
between 1997 and 2006/07, from 22% to 18%.
In 2006/07, there was, however, a significant difference in the
perceived need for advice and support among regular and
occasional volunteers. Regular volunteers were significantly
6 The organisation of volunteering
12. Respondents who helped more than one organisation were asked to think about the main organisation with which they volunteered. Thequestion prompted them to select the organisation for which they had done most (i.e. had spent most time helping). Bases throughout thischapter exclude some respondents who selected a type of informal volunteering as their main organisation. They also exclude somerespondents who were not initially identified as having volunteered in the last year and so were not asked the questions about theirmain organisation.
6 The organisation of volunteering 45
more likely to feel that they needed advice and support than
occasional volunteers (24% compared with 10%).13
Volunteers for religious organisations were the most likely
to want advice and support (24% did so – see Table A.6.1).
Volunteers for schools or other educational organisations
(11%) and for organisations related to health or disability
(10%) were the least likely.
Table 6.2 Need for advice and support, by type ofvolunteering activity
Base: All current formal volunteers. Don’t know/refusal responsesexcluded.
The perceived need for advice and support did not vary
significantly according to age or sex. It did, however, vary
slightly according to the types of activities that volunteers
were engaged in. Those involved in advice, administrative,
committee, educating, befriending, representing and visiting
roles were most likely to feel the need for advice and support
(Table 6.2).
6.2.3 Satisfaction with advice and support
Those who felt they needed advice and support were
generally pleased with the advice and support they received
(Table 6.3). Nearly all (94%) of the volunteers who said they
needed them felt the advice and support they received were
adequate, with 59% saying they were very adequate.
Table 6.3 Perceived adequacy of adviceand support
Base: All current formal volunteers who felt they needed advice andsupport. Don’t know/refusal responses excluded.
Current volunteers needing advice
and support%
Very adequate 59
Fairly adequate 35
Fairly inadequate 4
Very inadequate 3
Base (unweighted) 285
Proportion of Basecurrent volunteers (unweighted)
needing advice and support
%
Raising, handling money 18 723
Organising, helping run an event 25 546
Committee member 37 342
Secretarial, administrative, clerical 37 265
Educating 35 256
Representing 34 207
Transporting 23 214
Visiting people 34 174
Giving advice, information, counselling 45 177
Befriending 34 138
Campaigning 28 127
Other practical help 18 319
Other help 17 95
All 18 1,350
Helping Out 2006/07 NSV 1997
Occasional Regular All current Currentvolunteers volunteers volunteers volunteers
% % % %
Yes, do feel the need for advice and support 10 24 18 22
No, never feel the need for advice and support 90 76 82 77
Base (unweighted) 510 838 1,350 704
Table 6.1 Need for advice and support
Base: All current formal volunteers. Don’t know/refusal responses excluded.
13. Throughout this chapter, regular and occasional volunteers refer to the level of help given to the main organisation. Occasional volunteersinclude episodic or one-off volunteers as well as those who helped more often. See Chapter 1 or Appendix C for the full definitions.
46 Helping Out: A national survey of volunteering and charitable giving
6.3 Payment of expensesOver half (54%) of all current volunteers had not incurred any
expenses (Table 6.4). However, regular volunteers were more
likely to incur expenses than occasional volunteers (69% of
occasional volunteers had not incurred expenses, compared
with 42% of regular volunteers).
Table 6.4 Reimbursement of expenses, byvolunteer status
Base: All current formal volunteers. Don’t know/refusal responsesexcluded.
Comparing findings between 2006/07 and 1997 suggests
that there has been little (or no) change in the proportion of
volunteers who do not incur expenses (Table 6.5). There has
been little change in the proportion of volunteers who have
all or some of their expenses reimbursed, but a significant
increase in the proportion of volunteers who reported that
none of their expenses were reimbursed.
Table 6.5 Reimbursement of expenses, comparisonwith previous studies
Base: All current formal volunteers. Don’t know/refusal responsesexcluded.
Of those volunteers who had incurred expenses, a majority
(77%) did not have any of them reimbursed (Table 6.6). Just
7% of current formal volunteers who had incurred expenses
had them all reimbursed, with an additional 17% having had
some of their expenses reimbursed. There was no significant
difference in the reimbursement of incurred expenses
according to volunteer status, nor by age or sex.
Table 6.6 Reimbursement of expenses for thoseincurring expenses, by volunteer status
Base: All current formal volunteers who had incurred expenses. Don’tknow/refusal responses excluded.
Those volunteers who had incurred expenses but had not had
them all reimbursed were asked why this was the case.
As Figure 6.1 indicates, there was a range of reasons why
expenses were not reimbursed. For some volunteers (29%),
expenses were seen as a form of donation to an organisation
and as such they did not seek to have them reimbursed. For
others (29%), asking for expenses to be reimbursed would
feel like taking money away from the organisation and so
they chose not to do so. However, in 20% of cases
respondents said that ‘the organisation does not reimburse
any expenses’ and in an additional 6% of cases it ‘does not
Base (unweighted) 510 839 1,351Been Asked/been Base (un-
given info told about weighted)on risk insurance
Proportion saying yes % % %
Raising, handling money 29 27 720–723
Organising, helping run 33 35 546–547
an event
Committee member 42 50 343
Secretarial, administrative, 40 47 265–266
clerical
Educating 40 33 256–257
Representing 45 47 207
Transporting 34 42 213–214
Visiting people 41 39 174–175
Giving advice, information, 48 46 176–177
counselling
Befriending 44 40 137
Campaigning 42 42 126
Other practical help 32 30 319
Other help 24 19 95
All 27 26 1,345–
1,350
7 The benefits and drawbacks of volunteering 55
Summaryn Regular volunteers were generally positive about their
volunteering experiences, with 97% saying that they
could cope with the things they were asked to do by
their main organisation, 95% saying that their efforts
were appreciated and 91% agreeing that they were
given the opportunity to take part in activities they
liked to do.
n However, several issues were highlighted. For example,
31% of regular volunteers felt that their volunteering
could be much better organised (which, although this
indicated a considerable improvement on the results of
the 1997 National Survey of Volunteering, is still a
concern). Twenty-eight per cent of regular volunteers felt
that there was too much bureaucracy involved and 24%
felt that they could not leave their volunteering as there
was no one else to take it over.
n Volunteers had mixed views on the importance of having
their help recognised, with half feeling that it was
important and half not. Young people were more likely
than older people to think it was important.
n Whether they felt it was important or not, most
volunteers felt they received enough recognition. The
most popular, and most commonly received, forms of
recognition were thanks, verbal and written, from the
organisation volunteered for.
n Half (51%) of regular volunteers were unaware that they
could gain qualifications through their volunteering, and
only a small proportion (6%) had done so.
n Volunteers reported a number of benefits from helping
organisations, with 97% reporting that getting
satisfaction from seeing the results of their volunteering
was an important benefit, and 98% saying enjoyment
and 93% saying personal achievement were important
benefits of volunteering. There were some differences
in the benefits highlighted according to age, sex and
ethnicity.
7.1 IntroductionThis chapter focuses on the experiences of and reflections
from regular formal volunteers (i.e. those who volunteer at
least once every month), within their main organisation.15
It looks at the benefits but also the drawbacks associated
with volunteering.
7.2 Reflections on the experience ofvolunteering: the highs and lows
Regular volunteers were asked to reflect on the good and
bad points of their volunteering, particularly with regard to
different aspects of the ways in which their volunteering is
organised.
As Table 7.1 indicates, most people were positive about their
volunteering experiences. Nearly all regular volunteers said
that they could cope with the things they were asked to do
by their main organisation (97%) and that their efforts were
appreciated (95%). A majority of volunteers also agreed that
they were given the opportunity to do activities that they liked
(91%), although fewer ‘definitely agreed’ with this statement
compared with the previous two.
On the whole, volunteers were also happy with the workload
they were given, with 84% agreeing that the organisation
had reasonable expectations of them in this regard. Many
(70%) also agreed that they were given the chance to
influence the development of the main organisation they
were involved in.
However, while a majority of respondents were, on the whole,
positive about the experience of volunteering, a number of
drawbacks were identified, with a significant minority of
regular volunteers highlighting issues connected to the
organisation of their volunteering.
Nearly a third (31%) of regular volunteers felt that their
volunteering could have been much better organised. This
figure has decreased significantly from the 71% of
respondents who reported in 1997 that their volunteering
could be much better organised (Davis Smith, 1998),
7 The benefits and drawbacks ofvolunteering
15. Respondents who helped more than one organisation were asked to think about the main organisation with which they volunteered. Thequestion prompted them to select the organisation for which they had done most (i.e. had spent most time helping). The bases reportedthroughout the chapter exclude some respondents who volunteered regularly with organisations other than the one they selected as theirmain organisation. They also exclude some respondents who were not initially identified as having volunteered in the last year and so werenot asked the questions about their main organisation.
56 Helping Out: A national survey of volunteering and charitable giving
suggesting considerable improvements (see below for further
discussion). Nonetheless, with nearly a third of respondents
identifying this as an issue, it is still an area for concern.
Twenty-eight per cent of volunteers felt that there was too
much bureaucracy and 17% felt it was becoming too much
like paid work. One-quarter (24%) of respondents felt that
they could not leave the organisation as there was no one else
to take over from them.
Although direct comparisons are difficult due to changes in the
format of the questions, on the whole, evidence suggests that
the situation seems to have improved somewhat since the last
National Survey of Volunteering in 1997. As highlighted above,
volunteers were significantly less likely to think that their
volunteering could be better organised (31% agreed with this
in 2006/07 compared to 71% in 1997), and fewer thought
that volunteering took up too much of their time (down to
13% from 31%) or that the organisation wasn’t going
anywhere (8% from 16%). More volunteers in 2006/07,
however, reported that the organisation did not really need
their help (up from 5% in 1997 to 9% in 2006/07).
In general, men and women and people from different age
groups did not vary significantly in their responses to the
experience of volunteering (Table 7.2). However, people aged
between 35 and 54 years old tended to be the most critical of
their experiences. For example, there was a significant
difference in the reporting of excessive bureaucracy within
organisations according to age, with 35% of 35–44 year olds
and 34% of 45–54 year olds identifying this as an issue,
compared with 20% of 16–34 year olds. While the views of
men and women towards most aspects of their volunteering
did not vary significantly, men were more likely than women
to report that things could be much better organised (37%
compared with 27%).
Volunteers from groups at risk of social exclusion were
significantly more likely to report feeling that volunteering was
becoming too much like paid work than were volunteers not
Base: All current formal volunteers who volunteered regularly with their main organisation. Don’t know/refusal responses excluded.
Table 7.1 The highs and lows of volunteering
Definitely Tend to Tend to Definitely Baseagree agree disagree disagree (unweighted)
% % % %
I can cope with the things I’m asked to do 69 28 2 1 831
My efforts are appreciated by the organisation 62 33 4 1 829
I am given the opportunity to do the sort of things 49 42 6 3 830
I like to do
The organisation has reasonable expectations in 36 48 10 6 819
terms of workload
I am given the opportunity to influence the 26 44 19 12 825
development of the organisation
I feel things could be much better organised 8 23 41 28 831
I feel there is too much bureaucracy 8 20 38 35 821
I feel I would be unable to leave my role as there 8 16 40 36 827
is no one else to take my place
I feel that volunteering is becoming too much 4 13 39 44 830
like paid work
I feel the organisation is too concerned about risk 4 7 40 49 826
My involvement takes up too much time 3 10 37 50 833
My help is not really needed 3 6 36 56 831
I feel the organisation isn’t really going anywhere 3 5 29 63 829
I get bored or lose interest in involvement 1 6 27 67 832
7 The benefits and drawbacks of volunteering 57
at risk (24% of volunteers from at-risk groups agreed with
this statement compared with 15% of volunteers from not-at-
risk groups).
While there were few differences in the reporting of positive
aspects of volunteering according to ethnic groups, there was
greater difference in reporting on some of the drawbacks to
volunteering (Table 7.3).
White people were the ethnic group most likely to report
feeling that there would be no one else to take their place if
they withdrew from an organisation.
Black volunteers (44%) were the most likely to report feeling
that volunteering had become too much like paid work. Black
volunteers (26%) were also the ethnic group most likely to
report that the main organisations they were involved in were
becoming too concerned about risk.
Whether volunteers felt that their involvement took up too
much of their time also varied with ethnicity, with 22% of
Black and Asian volunteers agreeing with this statement
compared with 11% of White volunteers.
In general there was not much variation in attitudes to
volunteering depending on the type of activity undertaken,
especially as regards the positive aspects of volunteering.
However, there was some variation by activity in the
proportion of volunteers reporting that it took up too much
time. Those involved in campaigning (33%) or representing
(25%) were the most likely to agree that volunteering took
Table 7.2 The highs and lows of volunteering, by age and sex
I can cope with the things I’m asked to do 98 99 95 96 98 97 98 97
My efforts are appreciated by the 97 94 94 96 94 94 95 95
organisation
I am given the opportunity to do the sort 92 92 90 91 89 88 93 91
of things I like to do
The organisation has reasonable 84 82 87 86 82 84 84 84
expectations in terms of workload
I am given the opportunity to influence 73 68 73 70 63 71 68 69
the development of the organisation
I feel things could be much better organised 28 37 31 31 30 37 27 31
I feel there is too much bureaucracy 20 35 34 21 30 28 27 27
I feel I would be unable to leave my role 17 29 22 25 27 22 25 24
as there is no one else to take my place
I feel that volunteering is becoming too 16 18 23 16 14 15 19 17
much like paid work
I feel the organisation is too concerned 9 11 13 9 13 13 10 11
about risk
My involvement takes up too much time 16 16 14 11 8 15 12 13
My help is not really needed 10 6 10 6 11 10 8 9
I feel the organisation isn’t really going 3 10 11 5 10 10 6 8
anywhere
I get bored or lose interest in involvement 10 6 7 1 5 6 6 6
Base (unweighted) 124–125 166–170 155–157 184–188 187–193 332–338 487–495 819–833
Base: All current formal volunteers who volunteered regularly with their main organisation. Don’t know/refusal responses excluded.
58 Helping Out: A national survey of volunteering and charitable giving
up too much time while those involved in raising money
(13%) were least likely to agree. Those involved in
administration (38%) or transportation (37%) were most
likely to agree that there was too much bureaucracy.
Volunteers helping through administration (41%) were also
most likely to agree that they felt unable to leave because
there was no one to take their place (see Table A.7.1).
7.3 Recognition and qualificationsRegular volunteers were asked a series of questions
specifically about the recognition that they received for their
volunteering. These questions covered different forms of
recognition, from a simple thank you through to award
schemes and qualifications.
7.3.1 The importance of recognition
Volunteers had mixed views as to how important receiving
recognition was, with half stating that it was important and
half not (Figure 7.1).
Figure 7.1 Importance of receiving recognition
Base: All current formal volunteers who volunteered regularly withtheir main organisation (n=832). Don’t know/refusal responsesexcluded.
Not at all important
Not very important
Fairly important
Very important
1317
33 37
Percentage of regular volunteers
Table 7.3 The highs and lows of volunteering, by ethnicity
Regular volunteersWhite Asian Black All
Proportion agreeing with statements % % % %
I can cope with the things I’m asked to do 98 96 92 97
My efforts are appreciated by the organisation 96 90 93 95
I am given the opportunity to do the sort of things I like to do 91 95 95 91
The organisation has reasonable expectations in terms of workload 85 77 84 84
I am given the opportunity to influence the development of the 69 69 76 69
organisation
I feel things could be much better organised 31 47 41 31
I feel there is too much bureaucracy 29 19 24 27
I feel I would be unable to leave my role as there is no one else to 26 14 11 24
take my place
I feel that volunteering is becoming too much like paid work 16 12 44 17
I feel the organisation is too concerned about risk 10 14 26 11
My involvement takes up too much time 11 22 22 13
My help is not really needed 9 9 5 9
I feel the organisation isn’t really going anywhere 9 7 8 8
I get bored or lose interest in involvement 6 12 6 6
Base (unweighted) 772–786 88–90 71–72 819–833
Base: All current formal volunteers who volunteered regularly with their main organisation. Don’t know/refusal responses excluded. Based oncombined (core and boost) sample, except for ‘All’ sample based on core sample only.
7 The benefits and drawbacks of volunteering 59
Table 7.4 Importance of recognition, by age and sex
Regular volunteersAge Sex All
16–34 35–44 45–54 55–64 65+ M F% % % % % % % %
Very important 18 10 14 9 12 12 13 13
Fairly important 47 37 36 31 33 34 39 37
Not very important 24 35 41 36 32 35 31 33
Not at all important 11 18 9 25 24 18 17 17
Base (unweighted) 125 170 157 187 193 338 494 832
Base: All current formal volunteers who volunteered regularly with their main organisation. Don’t know/refusal responses excluded.
The importance attached to recognition did not vary
significantly with sex or age (Table 7.4).
Volunteers from groups at risk of social exclusion (see Section
1.2.3) were significantly more likely to say that recognition was
very important than those not at risk (Table A.7.2). There was
also variation according to ethnicity, with Black volunteers
most likely to report that recognition was important
(Table 7.5).
7.3.2 Receiving recognition
Most volunteers (90%) felt that they had received enough
recognition, regardless of whether or not they thought it was
important. There was no significant difference in this between
age, sex, social exclusion and ethnic groups.
Respondents were asked about the types of recognition they
thought volunteers should receive, before being asked how
they were currently recognised by their main organisation.
As Table 7.6 indicates, informal forms of recognition were
more popular and more widely applied than formal methods.
Receiving verbal and written thanks from an organisation
were the most popular forms of recognition and the most
widely received. Just over one-fifth of respondents thought
volunteers should receive awards or certificates from the
organisation itself, while less than one in ten were currently
recognised in this way (awards and certificates provided by
external organisations were even less popular). Few
respondents (3%) felt that volunteers should be recognised
through discount cards.
Base: All current formal volunteers who volunteered regularly with their main organisation. Don’t know/refusal responses excluded. Based oncombined (core and boost) sample, except for ‘All’ sample based on core sample only.
Table 7.5 Importance of recognition, by ethnicity
Regular volunteersWhite Asian Black All
% % % %
Very important 11 15 32 13
Fairly important 38 38 28 37
Not very important 34 37 33 33
Not at all important 17 11 8 17
Base (unweighted) 785 90 72 832
60 Helping Out: A national survey of volunteering and charitable giving
Table 7.6 Types of recognition
Base: All current formal volunteers who volunteered regularly withtheir main organisation. Don’t know/refusal responses excluded.
7.3.3 Qualifications
People can gain qualifications connected to their volunteering
through a number of routes, whether these be direct
volunteering qualifications (e.g. Award Scheme Development
and Accreditation Network (ASDAN)), skills-based
accreditation for activities undertaken as a volunteer, or
through using volunteering as evidence for other
qualifications. The study explored the extent to which regular
volunteers were currently receiving qualifications for their
volunteering.
As found in the 1997 National Survey of Volunteering, many
volunteers (51% in 2006/07, 48% in 1997) were unaware
that they could gain qualifications through their volunteering.
Only a small number (6% in 2006/07, 8% in 1997) had
actually gained qualifications directly through volunteering
(Table 7.7). In 2006/07, 9% of volunteers had used their
experiences to contribute to a qualification.
Although there was no significant variation in receipt of
qualifications according to age or sex, older age groups were
the least likely to know that qualifications were available .
Those volunteers from groups at risk of social exclusion were
also less likely to know that qualifications were available than
were their counterparts not from at-risk groups (Table A.7.3).
There was also no significant variation in receipt of
qualifications for volunteering according to ethnicity (19% of
Black regular volunteers had received qualifications compared
with 9% of Asian and 6% of White volunteers – see
Table 7.8). However, levels of awareness (the proportion who
did not know qualifications were available) did vary
significantly with ethnicity, with Asian volunteers particularly
unlikely to know that qualifications were available.
7.4 The personal benefits of volunteering The benefits of volunteering for individuals and communities
are increasingly recognised. This study focused on the benefits
that individual volunteers got out of their participation, asking
How Howvolunteers volunteersshould be are
recognised recognised% %
Verbal thanks from the 69 73
organisation
Written thanks from the 44 24
organisation
Award or certificate from the 22 9
organisation
Reference or testimonial 20 5
Long service awards 17 2
Recognition in press 13 4
Receiving gifts from people 9 14
Award or certificate from an 6 2
external organisation
Discount card 3 2
Recognition in other ways 5 5
None of these 12 15
Base (unweighted) 833 833
Table 7.7 Receiving qualifications for volunteering, by age and sex
Regular volunteersAge Sex All
16–34 35–44 45–54 55–64 65+ M F% % % % % % % %
Yes 6 8 10 4 5 6 7 6
No 47 45 47 41 33 44 41 43
Didn’t know qualifications were available 46 48 42 55 62 50 52 51
Base (unweighted) 125 170 157 188 193 338 495 833
Base: All current formal volunteers who volunteered regularly with their main organisation. Don’t know/refusal responses excluded.
7 The benefits and drawbacks of volunteering 61
Base: All current formal volunteers who volunteered regularly with their main organisation. Don’t know/refusal responses excluded. Based oncombined (core and boost) sample, except for ‘All’ sample based on core sample only.
Table 7.8 Receiving qualifications for volunteering, by ethnicity
Regular volunteersWhite Asian Black All
% % % %
Yes 6 9 19 6
No 44 29 30 43
Didn’t know qualifications were available 50 62 51 51
Base (unweighted) 786 90 72 833
Table 7.9 The personal benefits of volunteering
Very Fairly Not very Not Baseimportant important important important (unweighted)
at all% % % %
Get satisfaction from seeing the results 68 29 2 1 831
I really enjoy it 70 27 3 1 833
It gives me a sense of personal achievement 49 39 9 4 832
Meet people and make friends 49 37 11 4 833
It gives me a chance to do things I’m good at 35 48 12 5
It broadens my experience of life 38 44 13 5 831
It gets me out of myself 31 38 21 10 831
It gives me more confidence 31 35 23 12 833
Makes me a less selfish person 30 42 20 9 827
It makes me feel needed 27 40 24 9 832
It gives me the chance to learn new skills 26 35 21 19 833
It makes me feel less stressed 19 32 30 19 827
It improves my physical health 18 25 26 31 832
It gives me a position in the community 15 23 34 27 832
It gives me the chance to improve my employment prospects 12 12 18 59 832
It gives me the chance to get a recognised qualification 6 8 18 69 831
Base: All current formal volunteers who volunteered regularly with their main organisation. Don’t know/refusal responses excluded.
respondents to review a list of potential personal benefits and
to say how important each one was to them.
Volunteering has a considerable impact on the individuals
involved, ranging from enjoyment through to personal and
professional development. In common with the 1997 National
Survey of Volunteering (Davis Smith, 1998), the most
important benefits identified in the 2006/07 Helping Out
survey were the sense of satisfaction that comes through
seeing the results of volunteering and the enjoyment of being
involved (Table 7.9). Volunteering also leads to a sense of
personal achievement and can aid social interaction, with
many respondents highlighting the importance of meeting
people and making new friends through their volunteering.
Links between volunteering and employability and
qualifications were the least important benefits. Less than
one-quarter of volunteers reported that it was important that
62 Helping Out: A national survey of volunteering and charitable giving
their volunteering gave them a chance to improve their
employment prospects and just over one-tenth said the
chance to gain qualifications was important.
As Table 7.10 indicates, the importance attached to different
personal benefits of volunteering varied with age and with
sex, although all groups were unanimous in their view that
satisfaction and enjoyment were the top two benefits of
volunteering.
Young people aged 16–34, for example, were the age group
most likely to ascribe importance to the benefits of gaining
new skills through volunteering, enhancing their employment
prospects, gaining a recognised qualification and gaining a
position in the community. They were also most likely to say
that it was important that volunteering made them feel less
stressed. Meanwhile, older volunteers (aged 65 or over) were
the age group most likely to stress the importance of
volunteering in terms of ‘getting out of themselves’.
Women were more likely than men to place importance on
feeling less selfish through volunteering, getting out of
themselves, feeling needed and enhancing their confidence.
There were also significant differences in the importance
ascribed to different benefits of volunteering according to
whether or not someone was classified as being at risk of social
exclusion or not (Table A.7.4). In general, volunteers from at-risk
I get satisfaction from seeing 98 99 100 95 95 97 97 97
the results
I really enjoy it 98 96 95 96 94 95 97 96
It gives me a sense of personal 94 88 90 79 85 88 88 88
achievement
I meet people and make friends 87 80 84 84 91 83 87 86
It gives me the chance to do 83 84 85 84 81 83 83 83
things I am good at
It broadens my experience of life 89 83 80 78 77 82 82 82
It makes me a less selfish person 79 70 71 60 72 65 76 71
It gets me out of myself 68 66 63 57 82 60 74 69
It makes me feel needed 63 70 61 63 76 63 71 67
It gives me more confidence 75 57 65 55 68 60 69 65
It gives me the chance to learn 80 60 60 55 47 57 63 61
new skills
It makes me feel less stressed 63 50 45 42 48 52 49 51
It improves my physical health 49 46 38 37 45 45 42 44
It gives me a position in the 49 38 35 25 40 40 38 38
community
It gives me the chance to get a 25 13 15 6 5 12 14 13
recognised qualification
It gives me the chance to improve 53 26 18 8 3 19 26 23
my employment prospects
Base (unweighted) 124–125 169–170 156–157 186–188 191–193 335–338 492–495 827–833
Table 7.10 The personal benefits of volunteering, by age and sex
Base: All current formal volunteers who volunteered regularly with their main organisation. Don’t know/refusal responses excluded.
7 The benefits and drawbacks of volunteering 63
Table 7.11 The personal benefits of volunteering, by ethnicity
Regular volunteersWhite Asian Black All
Proportion saying very/fairly important % % % %
I get satisfaction from seeing the results 97 89 97 97
I really enjoy it 96 100 97 96
It gives me a sense of personal achievement 87 90 92 88
I meet people and make friends 86 83 86 86
It gives me the chance to do things I am good at 82 84 85 83
It broadens my experience of life 82 86 87 82
It makes me a less selfish person 70 77 77 71
It gets me out of myself 68 77 72 69
It makes me feel needed 66 67 83 67
It gives me more confidence 64 84 76 65
It gives me the chance to learn new skills 59 73 77 61
It makes me feel less stressed 48 68 50 51
It improves my physical health 41 51 49 44
It gives me a position in the community 35 65 71 38
It gives me the chance to get a recognised qualification 11 15 49 13
It gives me the chance to improve my employment prospects 21 39 46 23
Base (unweighted) 779–786 89–90 72 827–833
Base: All current formal volunteers who volunteered regularly with their main organisation. Don’t know/refusal responses excluded. Based oncombined (core and boost) sample, except for ‘All’ sample based on core sample only.
groups were more effusive about the benefits of volunteering.
They were significantly more likely than those not from at-risk
groups to place importance on personal achievement, feeling
less selfish, getting out of themselves, feeling needed,
enhancing their confidence, gaining new skills and recognised
qualifications, gaining a position in the community, enhanced
employability (though, interestingly, with the exception of
disabled respondents) and feeling less stressed.
There were some considerable differences in the importance
ascribed to various personal benefits of volunteering
according to ethnicity (Table 7.11). For example, Asian
volunteers were the ethnic group least likely to report
satisfaction as an important benefit of volunteering and
most likely to note the importance of feeling less stressed
through volunteering.
Volunteers from White backgrounds were generally the least
likely to attach importance to the benefits of gaining new
skills or employability through their volunteering, gaining a
position in the community, enhancing their confidence or
feeling needed.
64 Helping Out: A national survey of volunteering and charitable giving
Summaryn One-fifth (21%) of the sample said they had never
volunteered. A further 19% were not currently
volunteering but had done so in the past.
n The most common reason identified among
ex-volunteers for stopping volunteering was a lack of
time due to changing home or work commitments.
n Over half (54%) of non-volunteers, ex-volunteers and
occasional volunteers said that they would like to spend
more time volunteering. Forty per cent said they would
help if asked and, of those, 33% said they were likely
to commence volunteering in the next year or two.
n Time, or more specifically a lack of spare time, was the
most commonly cited reason for not volunteering (or not
volunteering regularly), reported by eight in ten
respondents. Other significant reasons for not
volunteering included being put off by bureaucracy
(49%) and being worried about risk and liability (47%).
n Young people were most likely to be put off by a lack of
spare time and not knowing how to get involved. Men
were more likely than women to cite concerns about not
having the right skills or being out of pocket as reasons for
not getting involved, while women were more likely than
men to cite concerns about threats to safety. Black and
Asian people were particularly likely to cite being worried
about not fitting in as a reason for not volunteering.
n As for what would make it easier to get involved, having
more spare time was the most significant factor
(reported by 31% of respondents), followed by working
less (11%) and having more information (9%).
8.1 IntroductionThis chapter explores the barriers to volunteering, looking at
the experience of people who had never or who had stopped
volunteering.16
8.2 Past experience of volunteeringAs Figure 8.1 indicates, four-fifths of the sample had
volunteered at some point in their lives; three-fifths were
currently volunteering,17 while approximately one-fifth had
volunteered in the past but had not done so in the last year.
One-fifth of respondents had never volunteered.
Figure 8.1 Volunteer status over time
Base: All respondents answering the volunteering questions (n=2,126).Don’t know/refusal responses excluded.
8.2.1 Reasons for stopping volunteering
Ex-volunteers (i.e. those who had taken part in formal
volunteering in the past, but not in the last 12 months) were
presented with a range of reasons why people might stop
volunteering and asked to select which applied to them. By
far the most common reason for stopping volunteering was
time, and particularly a lack of time due to changing home
or work circumstances, identified by 41% of respondents
(Table 8.1). Time was also one of the key reasons identified
for stopping volunteering in the 1997 National Survey of
Volunteering.
The second, third and fourth most commonly identified
reasons for stopping volunteering in the current study were,
respectively, because the activity was no longer relevant,
health problems or old age, and moving away from the area.
Overall, therefore, changing personal circumstances were
the most common reasons for quitting volunteering. Factors
more closely related to organisations themselves, such as
organisations being more demanding, not asking volunteers
to do the things they want to do, or folding, were
less common.
Perc
enta
ge
of
sam
ple
0
20
40
60
80
100
Current volunteerEx-volunteerNever volunteered
60
19
21
8 Limitations to volunteering
16. Bases throughout this chapter exclude some respondents who identified themselves as volunteers but were later reclassified as non-volunteers because they were engaged in informal volunteering.
17. This figure differs slightly from that shown in Figure 2.1 because of the greater number of respondents where it could not be establishedwhether they had ever volunteered.
8 Limitations to volunteering 65
Table 8.1 Reasons for stopping volunteering
Base: All respondents who were not formal volunteers in the last year,but who had volunteered previously. Percentages sum to more than100 as respondents could give more than one reason. Don’tknow/refusal responses excluded.
8.3 The potential to ‘grow’ volunteeringAll respondents, except regular volunteers, were asked a series
of questions to explore the potential to encourage more
people to start volunteering or to do more volunteering.
Over half (54%) said they would like to spend more time
volunteering. This suggests a considerable latent potential
to increase levels of participation in volunteering.
There was significant variation in the desire to volunteer
according to age, but not according to sex (Table 8.2). Young
people, aged 16–34, were the age group most likely to say
that they wanted to spend more time volunteering, while
those aged 65 and over were the least likely to do so.
There was also variation between groups at risk of social
exclusion and others, with not-at-risk groups being more
likely to want to spend time volunteering than at-risk groups
(Table A.8.1).
Ethnicity also made a difference to future desires to spend
more time volunteering, with 68% of Black respondents
saying that they would like to spend more time volunteering
compared with 59% of Asian and 53% of White respondents
(Figure 8.2).
Ex-volunteers %
Not enough time due to changing home or work 41
circumstances
Wasn’t relevant any more 15
Health problems or old age 14
Moved away from the area 13
It took up too much time 6
Lost interest 5
Not enough time due to increasing time demands of 4
Table 8.2 Desire to spend more time volunteering, by age and sex
Base: All respondents who were not regular formal volunteers in the last year. Don’t know/refusal responses excluded.
66 Helping Out: A national survey of volunteering and charitable giving
Figure 8.2 Desire to spend more timevolunteering, by ethnicity
Base: All respondents who were not regular formal volunteers in thelast year (White=1,109, Asian=248, Black=106, Other=91, All=1,190).Don’t know/refusal responses excluded. Based on combined (core andboost) sample, except for ‘All’ sample based on core sample only.
When asked more directly whether they would volunteer
if they were asked to do so, two-fifths of respondents
(excluding regular volunteers) said that they would do so,
either because they would be pleased to help or because they
would feel they could not refuse, while one-fifth said that it
would depend. Two-fifths said that they would refuse, either
because they hadn’t got time or for other reasons (Table 8.3).
Table 8.3 Likely responses if asked to help
Base: All respondents who were not regular formal volunteers in thelast year. Don’t know/refusal responses excluded.
As for the likelihood of actually commencing volunteering,
one-third of non-volunteers who said they would consider
volunteering were likely to do so in the next year or two
(Table 8.4). There was no significant differences in degree
of likelihood of starting to volunteer according to age, sex
or ethnicity.
Table 8.4 Likelihood of commencing volunteeringin a year or two
Base: All respondents who were not formal volunteers in the last yearbut would like to start to help. Don’t know/refusal responsesexcluded.
8.3.1 What would people do if they becamevolunteers
Those respondents who said that they would consider
volunteering were then asked what types of volunteering
activities they would consider helping in. Fundraising was the
most commonly identified activity that people would consider
getting involved in, although this did vary with age, with
younger people being significantly more likely to select this
than older people (Table 8.5). Those not from groups at risk of
social exclusion were also more likely than those from at-risk
groups to mention fundraising as a potential activity (Table
A.8.2). Helping out by visiting people and through organising
events were also common volunteering activities that people
would consider getting involved in.
Looking at differences between ethnic groups, Black people
were the ethnic group least likely to consider getting involved
through helping on a committee (Table 8.6). Otherwise,
differences were not significant by ethnic group.
Non-volunteers, who would consider
volunteering in the future
%
Very likely 7
Fairly likely 26
Not very likely 46
Not at all likely 21
Base (unweighted) 382
Occasional or non-volunteers
%
I would be pleased to help 33
I would feel I couldn’t refuse 7
I would refuse because I haven’t got time 26
I would refuse for other reasons 12
It would depend (spontaneous) 21
Other (spontaneous) 1
Base (unweighted) 1,190
Perc
enta
ge
of
occ
asio
nal
/no
n-v
olu
nte
ers
0
20
40
60
80
100
Would not like to spend more time volunteering
Would like to spend more time volunteering
AllMixed/other
BlackAsianWhite
3247
4129
46
53 59 68 7154
8 Limitations to volunteering 67
Occasional or non-volunteers who would considervolunteering in the future
Age Sex All
16–34 35–44 45–54 55–64 65+ M F% % % % % % % %
Fundraising 52 38 35 35 23 39 42 40
Visiting people 28 31 31 40 28 25 36 31
Organising an event 37 32 28 24 8 29 31 30
Educating 25 24 21 17 8 25 17 21
Advice 20 16 29 21 16 16 25 20
Befriending 17 18 17 16 2 14 17 16
Transport 7 25 17 26 8 21 10 15
Campaigning 16 9 15 16 2 16 10 13
Administration 10 16 16 12 3 8 16 12
Committee 9 11 14 10 1 14 5 10
Representing 5 8 6 5 0 5 6 5
Other practical help 37 42 38 50 33 37 42 40
Other help 3 2 2 1 16 4 4 4
Base (unweighted) 162 156 119 107 64 275 333 608
Table 8.5 Forms of volunteering that respondents would consider, by age and sex
Base: All respondents who were not regular formal volunteers in the last year and who would consider helping out. Don’t know/refusalresponses excluded.
Occasional or non-volunteers who would considervolunteering in the future
White Asian Black Mixed/other All% % % % %
Fundraising 41 36 41 41 40
Visiting people 30 35 48 36 31
Organising an event 30 34 49 32 30
Educating 20 18 19 32 21
Advice 19 29 29 33 20
Befriending 16 15 27 17 16
Transport 16 9 3 21 15
Campaigning 13 16 8 16 13
Administration 12 14 14 17 12
Committee member 9 10 1 10 10
Representing 4 10 3 12 5
Other practical help 41 32 21 34 40
Other help 4 1 2 2 4
Base (unweighted) 560 136 73 59 608
Table 8.6 Forms of volunteering that respondents would consider, by ethnicity
Base: All respondents who were not regular formal volunteers in the last year and who would consider helping out. Don’t know/refusalresponses excluded. Based on combined (core and boost) sample, except for ‘All’ sample based on core sample only. ‘Other’ includes those ofChinese origin.
Applies a lot Applies a little Does not Baseapply at all (unweighted)
% % %
Not enough spare time 60 23 18 638
Put off by bureaucracy 17 32 51 632
Worried about risk/liability 16 31 53 635
Don’t know how to find out about getting involved 12 27 61 636
Not got the right skills/experience 6 33 61 635
Wouldn’t be able to stop once got involved 7 29 64 632
Worried about threat to safety 8 19 73 636
Worried I might end up out of pocket 6 19 75 637
Worried I wouldn’t fit in with other people involved 4 20 77 638
Illness or disability 13 9 78 638
Feel I am too old 8 11 80 638
Family/partner wouldn’t want me to 5 15 80 638
Worried about losing benefits 3 4 93 633
Table 8.7 Reasons for not volunteering
Base: All respondents who were not formal volunteers in the last year, but would like to start to help. Don’t know/refusal responses excluded.
68 Helping Out: A national survey of volunteering and charitable giving
8.4 Barriers to volunteeringThose respondents who had not been formal volunteers in the
last year, but who would have liked to help, were asked what
stopped them doing so. They were presented with a list of
potential barriers to volunteering and were asked to identify
which, if any, were relevant to them. A range of practical and
attitudinal barriers were identified.
In common with other studies (see for example, Institute for
Volunteering Research, 2004 or the 1997 National Survey of
Volunteering (Davis Smith, 1998)), time was the most
commonly identified reason for not volunteering (Table 8.7).
Eight out of ten respondents cited a lack of spare time as a
reason for not helping.
Other significant reasons (cited by over 40% of respondents)
included being put off by bureaucracy and being worried
about risk and liability. Although the questions are not directly
comparable, concerns about bureaucracy seem to have
increased in significance as a reason for not volunteering
between the last National Survey of Volunteering in 1997 and
Helping Out in 2006/07 (risk was not included as a reason
for not volunteering in 1997). Many (over one-third of)
respondents said that they did not know how to find out
about getting involved, that they felt they did not have the
right skills or experience, or that they were concerned that
they wouldn’t be able to stop once they got involved.
As Table 8.8 (and Table A.8.3) indicates, there were some
significant differences in the reasons for not volunteering
given by respondents according to age, sex and whether they
were at risk of social exclusion.
For example, while time was the most significant reason for
not volunteering for all groups, it was most likely to be
identified by younger people and by those not at risk of social
exclusion. Not knowing how to get involved was also more
of an issue for younger people than it was for older people.
Older people were more concerned about being too old or ill/
disabled, and this was also true for people from at-risk groups
as compared with those from not-at-risk groups
(unsurprisingly, since at-risk groups include people with a
limiting, long-term illness or disability). Those from at-risk
groups were also more likely to be concerned about threats
to safety, being out of pocket and fitting in with others when
compared with respondents not at risk.
Men were more likely than women to cite concerns about not
having the right skills and being out of pocket as reasons for
not getting involved, while women were more likely than men
to cite being worried about threats to safety as a reason for
not getting involved.
There were also some differences in the reasons cited for not
volunteering according to ethnicity (Table 8.9). For example,
Black and Asian people were the ethnic groups most likely to
8 Limitations to volunteering 69
Non-volunteers who would like to start helpingAge Sex All
Table 8.8 Reasons for not volunteering, by age and sex
Base: All respondents who were not formal volunteers in the last year, but would like to start to help. Don’t know/refusal responses excluded.
identify concerns about not fitting in as a reason for not
volunteering. Asian people were the group most likely to
identify being worried about being out of pocket and safety
concerns as reasons for not volunteering.
8.4.1 Making it easier to get involved
Respondents who were not currently regular volunteers (i.e.
those who volunteered less than once a month, ex-volunteers
and non-volunteers) were asked what would make it easier
for them to get involved.
Time-related issues, particularly having more spare time
(identified by three in ten respondents) and working less (one
in ten respondents) were the items that respondents most
commonly felt would make it easier to volunteer (Figure 8.3).
Having more information about volunteering was also a
significant factor, identified by one in ten respondents.
One-fifth (21%) of respondents, however, said that nothing
would make it easier for them to get involved.
Although caution is needed when making comparisons, due
to slight differences in options available and respondents
asked, these results suggest that the need for more time has
become slightly more important since 1997, while the need
for more information has become slightly less important
(see Table A.8.4).
There were some differences in the factors that respondents
felt would make it easier to volunteer according to age and
whether or not they were classified as being within groups at
risk of social exclusion, but not according to sex (Table 8.10).
People aged 54 and under were the age groups most likely to
say that having more spare time would make it easier for them
to get involved. Young people (particularly those aged 16–24)
70 Helping Out: A national survey of volunteering and charitable giving
Non-volunteers who would like to start helping
White Asian Black Mixed/other All% % % % %
Not enough spare time 81 88 81 93 82
Put off by bureaucracy 48 44 40 50 49
Worried about risk/liability 46 52 53 41 47
Don’t know how to find out about 38 57 40 56 39
getting involved
Not got the right skills/experience 39 50 46 44 39
Wouldn’t be able to stop once 35 34 48 39 36
got involved
Worried about threat to safety 25 43 32 29 27
Worried I might end up out of pocket 22 36 26 45 25
Worried I wouldn’t fit in with other 22 37 37 29 23
people involved
Illness or disability 23 24 32 9 22
Feel I am too old 21 16 22 5 20
Family/partner wouldn’t want me to 20 26 18 20 20
Worried about losing benefits 7 8 4 5 7
Base (unweighted) 583–588 144–148 62–65 47–49 632–638
Table 8.9 Reasons for not volunteering, by ethnicity
Base: All respondents who were not formal volunteers in the last year, but would like to start to help. Don’t know/refusal responses excluded.Based on combined (core and boost) sample, except for ‘All’ sample based on core sample only. ‘Other’ includes those of Chinese origin.
Base: All respondents who were not regular formal volunteers in the last year (n=1,154). Percentages sum to more than 100 as respondentscould pick more than one answer. Don’t know/refusal responses excluded.
Figure 8.3 Things that would make it easier to get involved
0
5
10
15
20
25
30
35
Nothin
g
Other
thin
gs
More
conve
nient
timin
gs
More
conve
nient
loca
tion
Drivin
g lice
nce/
transp
ort
If so
meo
ne I k
new
got invo
lved
More
money
Childca
re re
late
d
If I w
as a
sked
Few
er o
ther
com
mitm
ents
Health
impro
vem
ent
More
info
rmat
ion
Work
ing le
ss
More
spar
e tim
e
31
Perc
enta
ge
of
occ
asio
nal
/no
n-v
olu
nte
ers
11 11
21
98
6 5 43
2 21 1
8 Limitations to volunteering 71
were most likely to say that having more information would
make it easier for them to get involved. Conversely, older
people (particularly those aged 65 and over) were most likely
to say that health improvements would make it easier for them
to get involved. Older people were also more likely to say that
nothing would make it easier for them to get involved. The
provision of childcare or fewer childcare responsibilities were
particularly highlighted by those aged 25–34 as factors that
would make it easier for them to get involved.
Respondents from groups at risk of social exclusion were less
likely than those not at risk to say that having more time and
working less would make it easier for them to get involved
(with lack of time being particularly unimportant for
respondents with a disability). However, they were more likely
to say that health improvements would make it easier for
them to get involved, and this was particularly the case for
disabled respondents. They were also more likely to say that
nothing would make it easier for them to get involved.
The only significant variation in factors that would make it
easier for people to get involved in volunteering activities
according to ethnicity was ‘nothing’. While 21% of White
respondents said that nothing would make it easier for them
to get involved, this was so for 15% of Asian and 11% of
Black respondents.
Occasional and non-volunteers who would like to help more
Age Not Groups at risk All
16–24 25–34 35–44 45–54 55–64 65+ at No LLI Allrisk quals
Table 8.10 Making it easier to get involved, by age and groups at risk of social exclusion
Base: All respondents who were not regular formal volunteers in the last year. Percentages sum to more than 100 as respondents could pick morethan one answer. Don’t know/refusal responses excluded. See Section 1.2.3 for a full explanation of the ‘at risk’ group and the PSA4 objectives.
72 Helping Out: A national survey of volunteering and charitable giving
Summaryn Three in ten employees worked for an employer that had
both a volunteering and a giving scheme, while one-fifth
worked for an employer with either a giving or
volunteering scheme.
n Employees working for larger companies were more
likely to work for an employer that had both a
volunteering and giving scheme.
n Where an employer-supported volunteering scheme was
available, 29% of employees had participated in the last
year. Take-up of employer-supported giving schemes was
higher, with 42% of employees making use of a giving
scheme available to them.
n The number of people working for employers with a
volunteering scheme appears to have increased since
1997, while there has been no change in employees’
willingness to use schemes available to them. This would
suggest an increase in the number of employees involved
in such schemes.
n Over half of employees would like to see a volunteering
or giving scheme established by their employer where
they don’t currently exist.
n The key factors that would facilitate people taking part in
these schemes were identified as paid time off, being able
to choose the activity and gaining skills from taking part.
9.1 IntroductionEmployers can support their staff with getting involved in
helping out in a number of different ways, including setting
up employer-supported volunteering and giving schemes. This
chapter explores how widespread such schemes are, the
extent to which employees participate in them, the benefits of
involvement and ways in which more people may be
encouraged or enabled to get involved.
9.2 Existence of employer-supportedvolunteering and giving schemes
Half (51%) of current employees worked for an employer that
did not have either a volunteering or a giving scheme. Three
in ten employees worked for someone that had both a
volunteering and giving scheme, while one-fifth worked for
employers with either a giving scheme or a volunteering
scheme (Figure 9.1).
Figure 9.1 Proportion of employees with availableschemes
Base: All respondents who were current employees (n=880). Don’tknow/refusal responses excluded. Employees saying this question was‘not applicable’ also excluded.
Both the size and the sector of the employer made a significant
difference as to whether or not such schemes were in place
(Table 9.1). Current employees working for larger companies
(with over 250 paid staff) were most likely to say that their
employer had a volunteering or giving scheme. Employees
working in the public sector were more likely than those from
the private sector to say that their employer had a volunteering
scheme; private sector employees were more likely to say that
their employer had neither a giving nor a volunteering scheme.
(There were too few employees working in the voluntary sector
to be included in the significance testing.)
Among those employees whose employers had a volunteering
and/or giving scheme, there was no significant difference in
the type of scheme on offer according to age or sex of the
employee.
Looking just at volunteering schemes, the 1997 National
Survey of Volunteering found that 81% of respondents (base
= 1,130) said their employer did not have a scheme, while
16% said their employer had a volunteering scheme (3% did
not know). These results suggests that the proportion of
people working for employers with a volunteering scheme has
increased considerably in the 10 ten years.18
Neither
Helping and giving scheme
Giving scheme only
Helping scheme only
13%
7%
51% 29%
9 Employer-supported volunteering
18. Note that the 1997 National Survey of Volunteering figures include former as well as current employees.
9 Employer supported volunteering 73
9.2.1 Types of scheme
In terms of the types of giving scheme provided by employers,
limited details were gathered through the study, with
questions restricted to match funding initiatives (although see
Chapter 12 for information on payroll giving). Two-fifths
(43%) of current employees whose employer had a scheme
provided matched funding for money raised by staff, while
three-fifths (57%) did not.
Further details were, however, sought with regards to
volunteering schemes. Among those current employees
whose employer had a supported volunteering scheme, the
most common way in which this worked was through
employers supporting staff to volunteer in their own time;
this was true in 33% of cases (Table 9.2). However, many
employers had schemes that in various ways supported staff
to volunteer within work time. For example, 21% said their
employer gave them a certain amount of paid time off work
for volunteering, 17% received flexi-time for time spent
volunteering and 11% could take time off in lieu.
9.2.2 Participation in employer-supportedvolunteering and giving
Table 9.3 looks at whether or not current employees had
participated in employer-supported volunteering and/or giving
schemes where they were available.
Where an employer-supported volunteering scheme was
available, 29% of employees said they had participated in
this in the last year. Take-up of employer-supported giving
schemes was higher, with 42% of employees making use of
a giving scheme available to them.
Table 9.2 How time is treated in employer-supported volunteering schemes
Base: All respondents who were current employees and whoseemployer had a scheme. Don’t know/refusal responses excluded.
The level of participation in employer-supported volunteering
schemes (29%) is very similar to that found in the 1997
National Survey of Volunteering (32%), suggesting no change
in employees’ willingness to use such schemes when they are
available. Given that the number of available schemes may have
increased (see Section 9.2), this would suggest an increase in
the number of employees involved in such schemes.
9.2.3 Frequency of participation in employer-supported volunteering schemes
Most participation in employer-supported volunteering
schemes happened on an occasional or one-off basis
(Table 9.4). One in ten participated at least once a month.
Current employees with employer-
supported volunteering scheme
%
Do it in your own time 33
Paid time off, up to a certain maximum 21
Flexi-time to cover the hours spent 17
Time off in lieu to match the hours spent 11
out of working hours
Paid time off, with no maximum 6
Unpaid time off 6
Something else 7
Base (unweighted) 309
Number of employees Sector All
<50 50–249 250+ Private Public% % % % % %
Scheme for helping only 4 7 9 4 12 7
Scheme for giving only 9 14 14 13 13 13
Scheme for both helping and giving 13 16 42 26 33 29
Neither 74 62 35 57 42 51
Base (unweighted) 254 151 473 500 355 880
Table 9.1 Proportion of employees with available schemes, by size and sector of employer
Base: All respondents who were current employees. Don’t know/refusal responses excluded. Employees saying this question was ‘not applicable’also excluded.
74 Helping Out: A national survey of volunteering and charitable giving
Table 9.3 Participation in employer-supportedvolunteering and giving schemes
Base: (a) All respondents who were current employees and whoseemployer had a volunteering scheme (including in combination with agiving scheme). (b) All respondents who were current employees andwhose employer had a giving scheme (including in combination witha volunteering scheme). Don’t know/refusal responses excluded.
In terms of the actual hours spent helping out through
employer-supported volunteering schemes, 58% of those
respondents who had participated in such a scheme had
volunteered for zero hours in the past four weeks, while 37%
had done between one and ten hours, and 5% had
volunteered for 11 hours or more.
Table 9.4 Frequency of participation in employer-supported volunteering schemes
Base: All respondents who were current employees and whoparticipated in an employer-supported volunteering scheme. Don’tknow/refusal responses excluded.
9.2.4 Benefits of volunteering through employer-supported volunteering schemes
Those who had participated in employer-supported
volunteering schemes were asked what benefits they had
gained through helping out (Figure 9.2). They were asked
to select from a list of options.
The most frequently identified benefit of helping out in an
employer-supported volunteering scheme was the satisfaction
of doing so, identified by 67% of respondents. Gaining a
sense of personal achievement and enjoyment were also
important, each identified by over four in ten respondents.
Direct career-related benefits were less significant, as was the
possibility of moving into regular volunteering.
Figure 9.2 Benefits of participation in employer-supported volunteering schemes
Base: All respondents who were current employees and whoparticipated in an employer-supported volunteering scheme (n=113).Percentages sum to more than 100 as respondents could give morethan one benefit. Don’t know/refusal responses excluded.
0 10 20 30 40 50 60 70 80
None of these
Other
Start volunteering regularly
Something for CV
New contacts to help career
Change of scene
Transferable skills
Feel less selfish
Mix with different people
Enjoy it
Personal achievement
Satisfaction from results
Percentage of current employees participating in employer-supported volunteering schemes
67
43
41
35
31
11
11
6
5
2
1
4
Current employees participating in employer-supported
volunteering scheme %
Frequency of involvement:
On three or more days a week 2
On two days a week 3
On one day a week 7
On one day a fortnight 1
At least once a month 11
Quite often but not regularly 22
Just a few times 33
One-off activity 18
On a seasonal basis 3
Regularity of involvement:
Regular 24
Occasional 57
One-off 18
Base (unweighted) 112
Employer- Employer-supported supported
volunteering giving schemesa schemesb
% %
Participated in scheme 29 42
Did not participate 71 58
Base (unweighted) 338 365
9 Employer supported volunteering 75
9.3 Increasing participation in employer-supported volunteering and givingschemes
9.3.1 Setting up new schemes
In order to assess levels of interest in such schemes, current
employees whose employer did not already have a
volunteering or giving scheme were asked whether they
would like them to do so in the future. As Table 9.5 indicates,
there was considerable interest in this, with over half (54%)
saying that they would like their employer to have a scheme.
There was some variation, however, in the demand for such
schemes in the future, according to both the age and sex of
employees (but not to whether respondents were part of a
group at risk of social exclusion or not). Men were more likely
than women to say that they would like their employer to
have a scheme, while 16–34 year olds were the age group
most likely to say they would like their employer to have a
scheme (Table 9.5).
9.3.2 Making it easier to get involved in existingschemes
There were a number of factors that would encourage
employees not currently involved in such schemes to take part
in the future. Having paid time off, an ability to choose the
activity, and being able to improve skills through volunteering
were all identified by over eight in ten employees as things that
would encourage them to get involved in the future (Table 9.6).
Current employees without scheme
Age Sex All
16–34 35–44 45–54 55+ M F% % % % % % %
Yes 66 61 44 34 59 49 54
No 34 39 56 66 41 51 46
Base (unweighted) 133 144 134 115 234 292 526
Table 9.5 Whether respondents would like their employer to have a scheme, by age and sex
Base: All respondents who were current employees and whose employer did not have a volunteering or giving scheme. Don’t know/refusalresponses excluded.
Helping Out 2006/07
Would Would Would not Baseencourage encourage encourage (unweighted)
me a lot me a little at all% % %
If I could choose the activity 42 42 16 223
If I could have paid time off to do ita 50 32 18 222
If it would help improve my skills 40 41 19 223
If there was more information available 27 52 22 223
If I could do it as part of a group 36 38 26 222
If it would benefit my career 35 35 30 223
If I could use workplace materials 19 50 31 222
If I could get qualifications 34 33 33 223
If I could have unpaid time off to do it 17 32 51 222
Table 9.6 Factors that would encourage people to take part in employer-supported volunteering schemes
Base: All respondents who were current employees, whose employer had a scheme that they were not currently participating in. Don’tknow/refusal responses excluded. (a) Please note that in 1997 the wording was ‘If I was able to do it during work hours’; in 2006/07 it was ‘If Icould have paid time off to do it’.
76 Helping Out: A national survey of volunteering and charitable giving
Having more readily available information, being able to help
out as part of a group and knowing that the volunteering
would benefit career development were also important factors.
Table 9.7 reports on the elements that employees identified as
encouraging them to get involved in the 1997 National Survey
of Volunteering. Although not strictly comparable with
Helping Out in 2006/07, the two sets of results suggest that
similar factors were identified in the two studies, although
being able to choose the activities was found to be more
important in 2006/07.
NSV 1997
Would Would Would not Don’t Baseencourage encourage encourage know (unweighted)
me a lot me a little at all% % % %
If I could have unpaid time off to do ita N/A N/A N/A N/A N/A
If it would help improve my skills 49 32 15 4 86
If I was able to do it during my 47 32 19 2 86
working hoursb
If I could do it as part of a group 48 30 20 2 86
If I could get qualifications 44 32 21 4 86
If it would benefit my career 53 22 21 4 86
If I could use workplace materials 23 50 24 3 86
If I could choose the activity 42 29 27 2 86
If there was more information available 23 47 28 2 86
Table 9.7 Results from the 1997 National Survey of Volunteering: Factors that would encourage peopleto take part in employer-supported volunteering schemes
Base: All respondents who were current employees, whose employer had a scheme that they were not currently participating in. Don’tknow/refusal responses excluded. (a) Not included as an option in 1997. (b) In 2006/07, the wording for this option was slightly different – itread ‘If I could have paid time off to do it’ rather than ‘If I was able to do it during my working hours’.
10 The extent of charitable giving 77
Summaryn Nearly all respondents to this study (95%) had given to
charity in the last year, with 81% having given in the last
four weeks.
n The most common method of donating in the last four
weeks was putting money in a collecting tin, followed by
buying raffle tickets.
n Almost three in ten (29%) of respondents had used some
form of regular giving method in the last four weeks.
n The average total amount donated in the last four weeks
was £25 per adult or £31 per donor.
n The most popular causes donated to were health and
disability, followed by overseas aid/disaster relief.
n As with volunteering, it is difficult to compare results
from this study directly with others, and the higher levels
of donations reported in Helping Out compared with
other studies cannot be taken as an indication of trends
in giving. The study context, fieldwork period (which for
Helping Out included Christmas), question methods and
sample profile might all affect how comparisons can
be made.
10.1 IntroductionThis chapter gives an overview of charitable giving. It looks at
the proportion of people who donated money to charity in
the four weeks prior to interview and in the last year. It
considers the methods by which people donated, the
amounts donated and the causes to which they gave.
10.2 Levels of charitable giving Respondents were shown a list of ways of donating to charity
and then asked whether they had given to charity using these
or any other methods. They were asked first about the four
weeks prior to the interview and then to consider the last year.
Figure 10.1 shows the proportion of people saying they had
donated, by any method, in the last four weeks and in the
last year.19 Nearly all (95%) said they had given to charity in
the last year and a high proportion (81%) had given in the
last four weeks.
Figure 10.1 Extent of charitable giving in the lastfour weeks and in the last year
10.3 Methods of charitable givingTable 10.1 looks at the proportion of donors in the sample by
the method of donation. The breakdown of methods used is
also shown for current donors (those giving in the last four
weeks) and all donors over the last year. People could, and
often did, report giving by more than one method.
The most common method of donation in the last four weeks
was putting money in collecting tins (45% of the sample),
followed by buying raffle tickets (31%). Other popular
methods of giving, used by over a fifth of all respondents
in the last four weeks, were donating by direct debit,
standing order or covenant, and buying goods from a
charity shop or catalogue.
In the last four weeks, 29% of the sample had used some form
of regular giving method (defined here as donations by direct
debit, standing order or covenant, regular donations by cheque
or credit/debit card or donations through payroll giving).
Donations over the last year tended to be made using similar
methods. Again, putting money in collecting tins (63% of the
sample) and buying raffle tickets (51%) were the most
popular methods of giving. In addition, nearly two-fifths of
the sample (39%) had bought goods from a charity shop or
catalogue and just over a third (34%) had given money by
sponsoring someone.
0
20
40
60
80
100
Donated in last yearDonated in last four weeks
81
95
Perc
enta
ge
of
sam
ple
10 The extent of charitable giving
19. If a respondent said they had used a method in the last four weeks, but later indicated a zero amount donated in the last four weeks, theywere counted as non-givers.
78 Helping Out: A national survey of volunteering and charitable giving
10.4 Average amount donated People who said they had donated in the four weeks prior to
interview were asked how much they had given using each
method mentioned.
Table 10.2 presents the average amount given in total using
all methods. The average total amount donated in the last
four weeks per adult20 was £25, or per donor, £31.
Table 10.2 Average amount donated in the lastfour weeks
Base for all: All respondents answering charitable giving questions.Base for current donors: All those giving in the last four weeks. Meancalculated based just on those respondents giving an amount.Extreme values, i.e. donations of £300 or over using a particularmethod, were excluded.
All Currentdonors
Average amount donated in the 24.90 30.94
last four weeks (£)
Standard error ±0.96 ±1.15
Base (unweighted) 2,065 1,686
All, using method in: Current DonorsLast 4 Last donors in last weeks year year
% % % %
Money to collecting tins 45 63 56 66
Buy raffle tickets 31 51 38 54
Donations by direct debit, standing order, covenant 23 27 28 28
Buy goods from charity shop/catalogue 22 39 28 41
Collection at place of worship (loose notes/coins) 16 24 20 25
Sponsor someone 12 34 15 36
Occasional donations by cheque or credit/debit card 12 23 14 24
One-off entrance donation to museum, gallery etc. 8 21 10 22
Subscription/membership to charitable organisation 6 14 7 15
Regular donations by cheque or credit/debit card 6 9 7 9
Collection at place of worship (charity envelope) 5 9 6 10
Payroll giving 2 3 3 3
Give shares 0 * 0 *
Give land/buildings 0 0 0 0
Other 2 3 2 3
No giving 19 5 N/A N/A
All regular giving methods 29 34 35 36
Base (unweighted) 2,154a 2,147–2,153a 1,775b 2,054–2,060 c
Table 10.1 Extent of charitable giving in the last four weeks and in the last year, by method of donation
Base: (a) All respondents answering charitable giving questions. Base: (b) All those giving in the last four weeks. Base: (c) All those giving in thelast 12 months. Don’t know/refusal responses excluded. Percentages sum to more than 100% as respondents could use more than one method.Buying The Big Issue is included in ‘Give money to people begging on street’.
20. Defined as aged 16 and over, at the time of the 2005 Citizenship Survey interview.
10 The extent of charitable giving 79
Table 10.3 gives more details with the average amount perdonor broken down by the method of giving. The average
amount donated was highest for cheque/credit card donations,
subscriptions to charitable organisations and donations by
direct debit, standing order or covenant. It was smaller for
more ad hoc methods such as door-to-door collections, money
in collecting tins and giving to people begging.
It should be borne in mind that people often found it difficult
to supply precise estimates of donations (particularly for more
ad hoc methods) and that quite a high proportion of donors
were unable (or unwilling) to supply an amount at all.
10.5 Causes donated to People who said they had donated in the last year were asked
what causes they had donated to (Table 10.4).
Causes related to health and disability were particularly
popular. Overall, the most common cause, supported by just
over half of donors (52%), was medical research. Donors also
commonly supported hospitals and hospices (34%) and
organisations dealing with disability (31%) and physical or
mental healthcare (23%).
The second most common cause was overseas aid/disaster
relief (42%). Just under a third of donors also supported
organisations dealing with animal welfare, social welfare,
those related to education (including schools) and religious
causes.
Given the high proportion of people who donated in the last
year, proportions based on the whole sample – also shown in
Table 10.4 – were very similar to those based on donors in the
last year.
10.6 Comparisons with other studies There are a number of studies covering the field of charitable
giving, and it can sometimes be difficult to reconcile the
resulting estimates of the proportion of donors and the
amounts they give. In this section, findings from the current
study are drawn together with those from the Citizenship
Surveys and the ongoing series of questions run by the
Amount Standard Basedonated error (unweighted)
per donor(£)
All methods 30.94 ±1.15 1,686
Occasional donations by cheque or credit/debit card 27.97 ±3.14 261
Subscription/membership to charitable organisation 25.05 ±3.03 146
Donations by direct debit, standing order, covenant 24.94 ±1.61 545
Regular donations by cheque or credit/debit card 23.31 ±2.84 129
Collection at place of worship (charity envelope) 20.21 ±2.97 113
Fundraising event 19.94 ±2.68 214
Buy goods from charity shop/catalogue 15.73 ±1.14 533
Collection at place of worship (loose notes/coins) 11.84 ±1.17 347
Sponsor someone 9.85 ±1.00 292
Payroll giving 8.94 ±1.37 58
One-off entrance donation to museum, gallery etc. 8.81 ±1.22 178
Give money to people begging on street 3.43 ±0.34 188
Table 10.3 Average amount donated per donor in the last four weeks, by method
Base for each method: All respondents using the method to donate in the last four weeks. Mean calculated based just on those respondentsgiving an amount. Extreme values, i.e. donations of £300+ using a particular method, were excluded.
80 Helping Out: A national survey of volunteering and charitable giving
Charities Aid Foundation (CAF) and the National Council for
Voluntary Organisations (NCVO).21
Table 10.4 Extent of charitable giving in the lastyear, by cause supported
Base for all: All respondents answering charitable giving questions. Basefor donors in last year: All those giving in the last 12 months. Don’tknow/refusal responses excluded. Also excludes 35 respondents whowere only identified as donors after reminder questions. Percentagessum to more than 100% as respondents could donate to more thanone cause.
Table 10.5 shows the proportion of people donating in the
last four weeks across the three studies. The figure obtained
by Helping Out is very similar to that obtained in the 2005
Citizenship Survey. However, both these surveys identify a
much higher proportion of donors (around 20% more) than
the NCVO-CAF studies.
The pattern of variation is different when comparing the
average amounts donated per donor in the last four weeks.
The figure for Helping Out is comparable to that obtained in
the NCVO-CAF survey, but twice as large as the amount
estimated in the 2005 Citizenship Survey.
Table 10.5 Extent of charitable giving and averageamount donated per donor in the lastfour weeks (95% confidence intervals):comparison of Helping Out, CitizenshipSurvey and NCVO-CAF studies
Base for Helping Out: All respondents answering charitable givingquestions. Don’t know/refusal responses excluded. Figures inparentheses represent 95% confidence intervals, i.e. upper and lowerbounds of estimates.
As was discussed in Chapter 2 in relation to the results on
formal volunteering, it is always difficult to draw comparisons
between different studies, and to determine the extent to
which differences between them reflect genuine differences in
the population as opposed to artefactual differences between
the studies. In particular, the following considerations should
be borne in mind when comparing Helping Out estimates
with those from other studies:
a) The study context – Helping Out was explicitly
concerned with charitable giving, in contrast to the
Citizenship Survey and NCVO-CAF studies, where the
topic is one among many in the interview. This may
mean that interviewers and respondents are more alert
to the types of activity that might be of interest to the
study and therefore more likely to recall them. However,
this may also put more pressure on respondents to
mention donations, even if they did not occur within the
time frame asked about.22
b) Fieldwork periods – the studies covered very different
time periods throughout the year: the NCVO-CAF
questions were asked in June, October and February
(deliberately avoiding Christmas); the Citizenship Survey
NCVO-CAF Citizenship Helping2005/06 Survey Out
2005 2006/07
Proportion donating in 58 78 81
the last 4 weeks (%) (56–59) (77–79) (79–83)
Average donation 26.53 15.17 30.94
per donor (£) (24.13–28.94) (14.45–15.89) (28.69–33.20)
All Donors inlast year
% %
Medical research 48 52
Overseas aid/disaster relief 39 42
Hospitals and hospices 32 34
Animal welfare 30 32
Social welfare 29 31
Disabled people 29 31
Schools, colleges, universities and 29 31
other education
Religion 24 31
Children or young people 24 26
Elderly people 22 26
Physical and mental health 18 23
Conservation, the environment 16 19
and heritage
The arts and museums 12 17
Sports and exercise 8 13
Hobbies, recreation and social clubs 6 9
Other 6 7
Base (unweighted) 2,152 2,035
21. These are run in the Office for National Statistics Omnibus.
22. To alleviate this problem, the NCVO-CAF study also included a sentence in their introduction saying ‘Not everyone gives to charity and if youdo not, that is fine.’
10 The extent of charitable giving 81
fieldwork ran from March to September; while the
Helping Out study was conducted between October and
February. In particular, the recall period for Helping Out
would have included the Christmas period for most
respondents, which might have affected the volume of
donations in the last four weeks. (It also raises issues
over how ‘typical’ the last four weeks were for giving
in Helping Out, and how annual estimates should be
calculated.23) However, this would not explain the
higher prevalence of giving also uncovered by the
Citizenship Survey.
c) Question methods – the overall approach used to
identify donors was very similar between the studies.
However, in order to estimate the amount donated, the
Citizenship Survey did not follow up individual methods
in any detail and covered the amounts given by use of
one summary question. In contrast, the other studies
established this via a series of follow-up questions. This
different methodology may, to a large extent, explain the
discrepancy in the average amount donated.
d) Topic coverage – readers should also note a few (minor)
differences in coverage. The NCVO-CAF study did not
include giving to people begging on the street, which
was included by the other studies. The Citizenship Survey
estimate of the average amount donated excluded
buying goods,24 which was included by the other studies.
e) Sample profile and bias – data in the current study
have been weighted to take account of non-response to
the study, and the fact that different groups were more
or less likely to respond.25 However, there may still be
some residual bias in the sample towards those groups
more likely to respond.
See also Low and Butt (2007) for a further analysis.
There is reason to believe that, in focusing on charitable
giving, Helping Out may over-report the scale of donations.
The overall estimates should therefore be treated with caution
and, in particular, not be taken as indicating an increase in
giving when compared with other studies. In order to gain a
picture of how the extent of charitable giving has recently
changed over time, reference should be made to the findings
from the Citizenship Survey (Kitchen et al, 2006).
Helping Out does enable a detailed analysis of who donates
and why, and this is discussed in the following chapters.
23. For the NCVO-CAF studies, the average annual amount was estimated by multiplying the monthly average by 12. For Helping Out, thefrequency of donation was taken into account: donations made at least once a month were multiplied by 12 for an annual amount, whilethose given less often were multiplied by the number of times donations were given during that year (maximum 12). In both studies, non-givers in the last four weeks were assumed to be non-givers for the whole year.
24. Excluding buying goods from the Helping Out estimate of the average amount donated reduced it by around £4.
25. Although respondents identified in the Citizenship Survey as giving to charity were more likely to respond, this was explained by differencesin other factors affecting response (e.g. their volunteering status or age). Therefore, charitable giving was not explicitly included as aweighting factor.
82 Helping Out: A national survey of volunteering and charitable giving
Summaryn There were no significant differences by age in the
proportion of respondents who had donated in the last
four weeks. However, there were differences by age in
the average amount donated, with those aged 16–24
giving the smallest amount.
n Women were significantly more likely to have donated
than men but there was no significant difference
between men and women in the average amount
donated.
n Charitable giving was related to employment status with
those not in work least likely to have donated. The
extent of charitable giving also varied significantly
according to the reason given for not working, with
retired respondents most likely to have donated.
n Charitable giving varied significantly with income. Those
in higher income groups were more likely to have
donated, and to have donated higher amounts.
n The prevalence of charitable giving varied by ethnic
origin with White respondents most likely to have
donated. The average amount donated per donor
did not vary significantly with ethnic origin.
n The prevalence of charitable giving also varied by
religious denomination with Christians and ‘Other’
religious groups (including Buddhists and Jews) most
likely to have donated and Muslims least likely. Those
who actively practised a religion gave most on average.
n Those identified as being at risk of social exclusion were
less likely to have donated in the last four weeks than
other respondents.
n The prevalence of donations and the average amount
donated varied by Government Office region. However,
some of these differences may be explained by regional
differences in income.
11.1 IntroductionThis chapter looks primarily at variation in the extent of
charitable giving across key socio-demographic groups. The
focus is on patterns of charitable giving across groups; which
groups give more and which give less than others rather
than the actual levels and amount of giving. Groups are
compared in terms of the proportion of people donating in
the past four weeks and the average amount donated per
donor. Some results are also given for causes donated to.
The tables show levels of charitable giving by each socio-
demographic factor separately: they do not take into account
interactions between the factors themselves. However, the
majority of the differences observed here are seen even when
other factors are controlled for. Where previous analyses have
indicated that this is not the case, it is indicated in the text.
11.2 Age and sexThe prevalence of donations did not vary significantly with
age (Table 11.1). The proportion of people donating was
consistently high across all age groups.
However, the average amount donated per donor did vary
significantly with age. Donors aged 16–24 gave the least
while donors aged 55–64 gave the most.
Table 11.1 Extent of charitable giving in the lastfour weeks, by age
Base for proportion donating: All respondents answering charitablegiving questions. Base for amount donated: All those giving in lastfour weeks. Mean calculated based just on those respondents givingan amount. Extreme values, i.e. donations of £300 or over using aparticular method, were excluded. Don’t know/refusal responsesexcluded. (a) ± standard error.
Table 11.2 shows that women were significantly more likely
than men to have donated in the last four weeks. However,
there was no significant difference between men and women
in the average amount donated per donor.
Proportion Amount Basedonating per donor (unweighted)
% £a
16–24 74 16.93 ±2.4 123/90
25–34 79 30.67 ±2.9 258/206
35–44 86 30.77 ±2.2 4,572/378
45–54 83 33.40 ±3.0 406/324
55–64 82 36.25 ±2.7 427/332
65+ 80 32.76 ±2.5 483/356
All 81 30.94 ±1.1 2,154/1,686
11 Who gives?
11 Who gives? 83
Table 11.2 Extent of charitable giving in the lastfour weeks, by sex
Base for proportion donating: All respondents answering charitablegiving questions. Base for amount donated: All those giving in lastfour weeks. Mean calculated based just on those respondents givingan amount. Extreme values, i.e. donations of £300 or over using aparticular method, were excluded. Don’t know/refusal responsesexcluded. (a) ± standard error.
There was some variation by age in the causes donated to.
The proportion donating to medical causes increased with
age, with those aged 16–34 the least likely to have donated
to medical research, hospitals and causes relating to physical
and mental health. Those aged 35–44 were the age group
most likely to have donated to schools, colleges and other
educational causes.
Women were more likely to have donated to most causes
than men, consistent with the higher prevalence of donors
among women (Table 11.3). In particular, women were
significantly more likely than men to have donated to animal
welfare charities, causes related to social welfare and schools.
They were also significantly more likely to have donated to the
various medical causes including medical research, hospitals
and disabled people.
11.3 Employment status Table 11.4 looks at the extent of charitable giving by work
status, distinguishing between the employed, self-employed
and those not in work. Respondents not in work were
significantly least likely to have donated in the last four
weeks. Donors not in employment also tended to donate the
smallest amounts, although the difference between groups
was not statistically significant.
Proportion Amount Basedonating per donor (unweighted)
Base: All respondents donating in last year. Percentages sum to more than 100 as respondents could donate to more than one cause.Don’t know/refusal responses excluded.
84 Helping Out: A national survey of volunteering and charitable giving
However, the extent of charitable giving varied significantly
depending on the reason people gave for being out of work.
Among those not in work, retired people were most likely
to have donated while the long-term sick, unemployed and
students were least likely to have donated. Similarly, retired
donors gave the largest amounts on average. The long-term
sick gave the least, closely followed by students and the
unemployed.
Table 11.4 Extent of charitable giving in the lastfour weeks, by employment status
Base for proportion donating: All respondents answering charitablegiving questions. Base for amount donated: All those giving in lastfour weeks. Mean calculated based just on those respondents givingan amount. Extreme values, i.e. donations of £300 or over using aparticular method, were excluded. Don’t know/refusal responsesexcluded. (a) ± standard error.
11.4 IncomeIt is to be expected that levels of charitable giving would be
closely related to the respondent’s income. Table 11.5 shows
that the prevalence of charitable giving did vary significantly
with income. There was consistent evidence of a positive
relationship between income and donating, with those in the
higher income groups most likely to have donated. However,
it should be noted that the proportion of respondents
donating was consistently high across all groups.
The average amount donated per donor also increased with
income. In particular, there were large increases in the average
donation above the £20,000 earnings threshold and again
among those earning £50,000 or more.
Higher rate taxpayers were significantly more likely to have
donated in the last four weeks, and to have donated a
higher amount per donor, than those who were not higher rate
taxpayers. Chapter 12 looks in more detail at the relationship
between the tax system and giving, presenting detailed findings
on the awareness and use of tax-efficient giving methods.
Table 11.5 Extent of charitable giving in the lastfour weeks, by respondent’s income
Base for proportion donating: All respondents answering charitablegiving questions. Base for amount donated: All those giving in lastfour weeks. Mean calculated based just on those respondents givingan amount. Extreme values, i.e. donations of £300 or over using aparticular method, were excluded. Don’t know/refusal responsesexcluded. (a) ± standard error.
11.5 Religion Included in the definition of charitable giving are donations
made to a church or other place of worship. It is therefore
interesting to consider how the extent of charitable giving
varies by religion. Results are broken down both by religious
denomination (Christian, Hindu, Muslim, Other) and by religious
activity (the extent to which those with a religion said that they
were actively practising or not). In both cases, comparisons are
made with those who said they had no religion.
The prevalence of donating varied significantly by religious
Buddhists and Jews) were most likely to have donated in the
last four weeks followed by Christians. Muslims were the
group least likely to have donated (66%), less so than those
with no religion (74%).
Proportion Amount Base donating per donor (unweighted)
% £a
Under £5,000 74 23.48 ±2.2 354/255
£5,000–£9,999 75 25.82 ±2.6 411/297
£10,000–£14,999 88 29.21 ±2.4 309/260
£15,000–£19,999 79 28.04 ±3.2 242/199
£20,000–£29,999 85 37.68 ±3.0 324/269
£30,000–£49,999 91 37.02 ±3.6 254/215
£50,000+ 94 49.73 ±6.6 87/74
Higher rate taxpayer 93 41.80 ±3.8 187/159
Not higher rate 80 29.41 ±1.2 1,794/1,410
taxpayer
All 81 30.94 ±1.1 2,154/1,686
Proportion Amount Basedonating per donor (unweighted)
% £a
Employed 84 31.80 ±1.6 1,110/910
Self-employed 85 34.25 ±3.9 165/132
Not employed 76 28.83 ±1.7 886/642
Looking after home 79 27.23 ±3.5 110/82
Sick 65 17.75 ±2.9 117/74
Retired 82 33.81 ±2.4 550/418
Other (unemployed/ 65 17.89 ±3.1 108/68
students)
All 81 30.94 ±1.1 2,154/1,686
11 Who gives? 85
26. There is, unsurprisingly, a close correspondence between ethnic origin and religious denomination; 97% of Christians were of White ethnicorigin while 98% of Hindus and 78% of Muslims were of Asian origin.
27. Forty-one per cent of Muslims had donated via donations to a place of worship in the last four weeks compared with 21% of Christiansand 16% of Hindus.
While Muslims were the religious group least likely to have
given, Muslim donors gave the highest amount on average
of all religious groups. However, this difference was not
statistically significant.
Across all denominations, those respondents actively
practising a religion were significantly more likely to have
given than those who said that they had a religion but were
not active. This finding is due to the fact that those actively
practising were more likely to have given to charity via
donations at their place of worship; once we exclude religious
giving, those actively practising were no more likely than
other respondents to have donated in the last four weeks.
Overall, those respondents actively practising any religion
donated significantly higher amounts on average than those
not actively practising or with no religion. Furthermore, this
remained the case even after excluding donations made via
a place of worship.
Table 11.6 Extent of charitable giving in thelast four weeks, by religion andreligious activity
Base for proportion donating: All respondents answering charitablegiving questions. Base for amount donated: All those giving in lastfour weeks. Mean calculated based just on those respondents givingan amount. Extreme values, i.e. donations of £300 or over using aparticular method, were excluded. Don’t know/refusal responsesexcluded. Based on combined (core and boost) sample, except for‘All’ based on core sample only. (a) ± standard error.
11.6 Ethnic origin The following section looks in details at patterns of charitable
giving by ethnic origin (Table 11.7). White respondents were
the ethnic group most likely to have donated in the last four
weeks. However, there were no significant differences
between ethnic groups in the amount donated per donor.
Table 11.7 Extent of charitable giving in the lastfour weeks, by ethnic origin
Base for proportion donating: All respondents answering charitablegiving questions. Base for amount donated: All those giving in lastfour weeks. Mean calculated based just on those respondents givingan amount. Extreme values, i.e. donations of £300 or over using aparticular method, were excluded. Don’t know/refusal responsesexcluded. Based on combined (core and boost) sample, except for‘All’ based on core sample only. ‘Other’ includes those of Chineseorigin. (a) ± standard error.
Religious giving has been shown to be a particularly important
source of charitable giving for Black and minority ethnic
groups (Kitchen et al, 2006). Table 11.8 explores the
relationship between ethnic origin and religious giving in more
detail.26 Despite the fact that overall a smaller proportion of
Black and Asian respondents had given to charity in the last
four weeks, those of Black or Asian origin were the ethnic
groups most likely to have donated to charity in the last four
weeks via donations at a place of worship.
Donations to religious causes were also most common among
Black and Asian respondents.
The prevalence of religious giving was particularly high among
Asian respondents, consistent with high levels of religious
giving among Muslims.27
Proportion Amount Basedonating per donor (unweighted)
% £a
White 83 31.10 ±1.2 2,021/1,594
Asian 73 31.80 ±2.9 347/245
Black 71 32.39 ±5.2 190/124
Mixed/other 62 37.39 ±5.2 141/95
All 81 30.94 ±1.1 2,154/1,686
Proportion Amount Basedonating per donor (unweighted)
% £a
Christian 83 31.61 ±1.3 1,915/1,496
Hindu 70 28.52 ±5.1 97/67
Muslim 66 36.29 ±4.1 204/140
Other 89 32.20 ±5.4 153/118
Religious, active 87 45.81 ±2.6 1,060/823
Religious but not active 80 23.80 ±1.2 1,314/1,000
No religion 74 26.59 ±2.5 326/235
All 81 30.94 ±1.1 2,154/1,686
86 Helping Out: A national survey of volunteering and charitable giving
As well as differences in religious giving, there were other
significant differences by ethnic origin in the causes donated
to and the methods used to donate. Table 11.9 shows that,
apart from collections at places of worship, most methods
were most commonly used by White people. In particular,
White people were most likely to have donated by putting
money in collecting tins, buying raffle tickets or charity goods,
paying entrance fees, or paying a subscription. However, Black
people were the ethnic group most likely to give to people
begging on the streets.
The majority of causes apart from religion were most likely to
have been supported by White people (Table 11.10). White
donors were the most likely to have donated to medical
causes including medical research and hospitals and hospices.
They were also the most likely to have supported
conservation, animal welfare charities, and arts and museums.
Asians were the ethnic group most likely to have donated to
overseas aid, although the difference between ethnic groups
was not statistically significant.
White Asian Black Mixed/other All% % % % %
Donating via donations at place of 18 38 30 21 21
worship (in last 4 weeks)a
Donating to religious causes 29 62 42 33 31
(in last year)b
Base (unweighted) 2,021/1,917 347/309 190/156 141/125 2,154/2,035
Table 11.8 Extent of religious giving, by ethnic origin
Base: All respondents answering charitable giving questions (a) or all donating in last year (b). Don’t know/refusal responses excluded. Based oncombined (core and boost) sample, except for ‘All’ based on core sample only. ‘Other’ includes those of Chinese origin.
White Asian Black Mixed/other All% % % % %
Money to collecting tins 48 31 25 28 45
Buying raffle tickets 32 14 21 16 31
Direct debit/standing order/covenant 24 13 15 16 23
Buying charity goods 24 6 14 12 22
Money collection at place of worship 15 28 21 18 16
Sponsoring someone 13 7 8 7 12
Occasional cheque/credit card 12 10 6 8 12
Attending fundraising event 10 5 7 6 9
Giving to people begging 9 12 21 18 9
Door-to-door charity envelope 9 10 3 2 8
One-off donation for entrance 9 3 3 7 8
Subscription/membership fee 7 1 0 3 6
Regular cheque/credit card 6 5 6 7 6
Charity envelope at place of worship 4 13 14 4 5
Payroll giving 3 1 0 1 2
Other method 2 3 4 2 2
Base (unweighted) 2,021 347 190 141 2,154
Table 11.9 Methods of donating, by ethnic origin
Base: All respondents answering charitable giving questions. Percentages sum to more than 100 as respondents could use more than onemethod. Don’t know/refusal responses excluded. Based on combined (core and boost) sample, except for ‘All’ based on core sample only.‘Other’ includes those of Chinese origin.
11 Who gives? 87
11.7 Risk of social exclusion (PSA4)Individuals who belong to certain Black and minority ethnic
groups, have no qualifications, or who have a disability or
limiting, long-term illness can be seen as being at particular
risk of social exclusion. They are also the focus of a Public
Service Agreement target (PSA4) to increase levels of
volunteering. Although not specifically targeted in terms of
government giving policies, analysis has been included here
to enable comparisons with the volunteering chapters.
Those groups at risk of social exclusion were significantly less
likely to have donated in the past four weeks compared with
those not at risk (Table 11.11). Those in at-risk groups who
had donated also gave less on average than other donors,
although the difference was not statistically significant.
Respondents with no qualifications in particular were less
likely to donate and they donated smaller amounts than other
respondents. (See Table 11.7 for extent of charitable giving by
people of Black and minority ethnic origin.)
Table 11.11 Extent of charitable giving in thelast four weeks, by groups at riskof social exclusion
Base for proportion donating: All respondents answering charitablegiving questions. Base for amount donated: All those giving in lastfour weeks. See Section 1.2.3 for a full explanation of the ‘at risk’group and the PSA4 objectives. Mean calculated based just on thoserespondents giving an amount. Extreme values, i.e. donations of £300or over using a particular method, were excluded. Don’t know/refusalresponses excluded. (a) ± standard error.
Proportion Amount Base donating per donor (unweighted)
% £a
At risk 73 28.10 ±1.4 798/569
Limiting, long-term 74 28.24 ±2.3 457/323
illness or disability
No qualifications 71 23.12 ±3.0 335/234
Not at risk 86 32.31 ±1.9 1,356/1,117
All 81 30.94 ±1.1 2,154/1,686
White Asian Black Mixed/other All% % % % %
Medical research 53 34 25 46 52
Overseas aid/disaster relief 42 51 37 43 42
Hospitals and hospices 36 20 14 20 34
Animal welfare 33 10 10 15 32
Social welfare 32 22 27 16 31
Disabled people 32 22 22 20 31
Schools, colleges, other education 32 19 19 23 31
Religion 29 62 42 33 31
Children and young people 26 24 24 21 26
Elderly people 26 16 17 21 26
Physical and mental health 24 12 12 16 23
Conservation, environment, heritage 20 2 3 10 19
Arts and museums 18 4 9 18 17
Sports/exercise 13 6 10 7 13
Hobbies/recreation/social clubs 9 3 7 6 9
Base (unweighted) 1,917 309 156 125 2,035
Table 11.10 Causes donated to, by ethnic origin
Base: All respondents donating in last year. Percentages sum to more than 100 as respondents could donate to more than one cause. Don’tknow/refusal responses excluded. Based on combined (core and boost) sample, except for ‘All’ based on core sample only. ‘Other’ includes thoseof Chinese origin.
88 Helping Out: A national survey of volunteering and charitable giving
11.8 Government Office regionThe extent of charitable giving varied significantly by
Government Office region (Table 11.12). Respondents in the
West Midlands and the North East were most likely to have
donated in the last four weeks while those living in London
were least likely to have donated. Looking at the average
amount donated per donor, the pattern of regional variation is
somewhat different. Donors in the North East gave the smallest
amount while those in London gave the most. Analysis of the
2005 Citizenship Survey suggests that these differences in the
amount donated are likely to reflect differences in average
income across region (Kitchen et al, 2006).
Table 11.12 Extent of charitable giving in thelast four weeks, by GovernmentOffice region
Base for proportion donating: All respondents answering charitablegiving questions. Base for amount donated: All those giving in lastfour weeks. Mean calculated based just on those respondents givingan amount. Extreme values, i.e. donations of £300 or over using aparticular method, were excluded. Don’t know/refusal responsesexcluded. (a) ± standard error.
Proportion Amount Basedonating per donor (unweighted)
% £a
West Midlands 89 24.66 ±2.9 195/160
North East 88 21.01 ±2.9 126/105
East 85 31.30 ±3.3 268/221
South West 84 37.34 ±4.2 207/173
East Midlands 83 24.86 ±2.6 205/157
South East 82 37.05 ±3.5 362/278
North West 80 29.21 ±2.3 314/243
Yorkshire and 78 23.93 ±2.2 257/189
the Humber
London 71 38.92 ±3.3 220/160
All 81 30.94 ±1.1 2,154/1,686
12 Tax-efficient methods of giving 89
Summaryn Gift Aid was the most recognised method of tax-efficient
giving, with two-thirds of respondents aware of it. This
was followed by payroll giving (40%) and legacies
(24%). Other forms of tax-efficient giving elicited very
low levels of awareness.
n Awareness of tax-efficient giving varied between
different groups. Those with higher income or in the
45–64 age brackets were generally most aware.
Reflecting the availability of certain methods to particular
types of employment, awareness also varied by
employment status.
n Unsurprisingly, given the relatively low level of awareness
of tax-efficient giving overall, use of such methods of
giving was not widespread. A third of the sample had
used Gift Aid in the last year, but other forms were used
by fewer than 5% of the sample.
n Patterns in use of tax-efficient giving were similar to
those for awareness.
n Lack of awareness was the main reason given for not
using tax-efficient methods of giving, followed by not
being a taxpayer and giving too infrequently.
12.1 IntroductionThis chapter looks at the use and awareness of tax-efficient
giving methods. For the purposes of the study these were
defined as:
n Gift Aid;
n payroll giving;
n giving via Self-Assessment Forms;
n tax relief on the value of gifts of shares given to charities;
n tax relief on the value of gifts of land or buildings given
to charities; and
n legacies.
Respondents were asked whether they had heard about
any of these forms of giving. With the exception of
legacies,28 they were also asked which ones they had used
in the last year.
12.2 Awareness of tax-efficient methodsof giving
Figure 12.1 shows the levels of (prompted and unprompted)
awareness of tax-efficient methods of giving (see also Table
A.12.1 for full details).
Gift Aid was by far the most recognised method. Around a
third of the sample (35%) were able to describe or name it
without prompting, and awareness climbed to almost
two-thirds of the sample (64%) when prompted.
Figure 12.1 Awareness of tax-efficient methodsof giving
Proportion aware (prompted White Asian Black Mixed/other Alland unprompted) % % % % %
Gift Aid 66 35 35 49 64
Payroll giving 41 21 26 29 40
Legacies 25 8 9 9 24
Tax relief on gifts of shares 15 11 13 11 14
Self-Assessment Form 12 8 9 12 12
Tax relief on gifts of land/buildings 10 5 3 8 10
Base (unweighted) 2,022 347 189 141 2,155
Table 12.4 Awareness of tax-efficient methods of giving, by ethnic origin
Base: All respondents answering charitable giving questions. Don’t know/refusal responses excluded. Based on combined (core and boost)sample, except for ‘All’ based on core sample only. ‘Other’ includes those of Chinese origin.
Gift Aid Payroll giving Self- Tax relief on Tax relief onAssessment gifts of gifts of land/
Form shares buildingsProportion using % % % % %
Used in last 12 months 34 3 1 * *
Not used 66 97 99 100 100
Base (unweighted) 2,151 2,151 2,151 2,151 2,151
Table 12.5 Use of tax-efficient methods of giving in the last 12 months
White Asian Black Mixed/other AllProportion using in last 12 months % % % % %
Gift Aid 36 13 13 21 34
Payroll giving 3 4 2 1 3
Base (unweighted) 2,022 347 189 141 2,151
Table 12.9 Use of Gift Aid and payroll giving, by ethnic origin
Base: All respondents answering charitable giving questions. Don’t know/refusal responses excluded. Based on combined (core and boost)sample, except for ‘All’ based on core sample only. ‘Other’ includes those of Chinese origin.
94 Helping Out: A national survey of volunteering and charitable giving
12.4 Reasons for not using tax-efficientmethods of giving
Respondents who had used methods in the last year which
potentially could have been tax efficient30 but who had not
taken up this option were asked the main reasons why they
had not done so. The reasons are shown in Table 12.10.
Unsurprisingly, given the generally low levels of awareness,
lack of awareness was the main reason cited (mentioned by
37% of respondents who were asked the question). Not
being a taxpayer was the next most common reason (29%).
The third most common reason was infrequent giving,
mentioned by 19% of those asked the question. Many
respondents (16%) could not think of any particular reason
why they had not used these forms of giving.
Table 12.10 Reasons for not using tax-efficientmethods of giving
Base: All respondents using potentially tax-efficient methods ofgiving, but who did not take up this option. Percentages sum to morethan 100 as respondents could give more than one reason. Don’tknow/refusal responses excluded.
Proportion mentioningeach reason
%
Not aware of tax-efficient methods 37
Not a taxpayer 29
Only give from time to time 19
Didn’t realise applied to small amounts 9
Didn’t realise applied to me 9
Too much effort to arrange 7
Employer does not offer payroll giving 7
Wanted donations independent of government 6
Not informed by charity 5
Too complicated to understand 5
Someone else in household deals with tax 2
Advised not to 2
Don’t pay enough tax *
No real reason 16
Other reason 2
Base (unweighted) 865
30. Potentially tax-efficient methods of giving were defined as donations given via direct debits, standing orders or covenants, cheque ordebit/credit card, payroll giving, charity envelopes, entrance fees, subscriptions or memberships, sponsorship or gifts of shares orland/buildings.
13 Motivations for and barriers to charitable giving 95
Summaryn The most common reason for donating to charity was
that the work of the charity was deemed important
(52% of current donors), followed by a belief that it is
the right thing to do (41%).
n Nearly a half of respondents said they had increased the
amount donated since 2000, with 37% having increased
the frequency of donations.
n The most common reason given for this increase was a
rise in the respondent’s level of disposable income.
n Respondents using regular giving methods were
specifically asked if they increased the amount they gave:
18% did. Interestingly, around two-fifths said that they
had increased or would increase their donations if asked.
n The most common reason for not donating or for
decreasing donations was not having enough money
to spare. A sizeable minority had decreased donations
because they were dissatisfied with charities in
some way.
n Provision of information seemed to be key in
encouraging more charitable giving in the future: having
confidence that money was being used effectively and
receiving information about what was done with the
donation were cited most frequently as motivators.
13.1 IntroductionThis chapter looks at the reasons why people donate money
to charity and the barriers that might stop people from
donating. It also considers possible strategies for increasing
levels of charitable giving.
13.2 Why people donate to charityAll respondents who had donated money in the last four
weeks were shown a list of possible reasons for donating and
asked to select the main reasons that were relevant to them.
Respondents could pick more than one reason.
The main reason for donating, mentioned by just over half
(52%) of donors, was that the work of the charity was
important (Figure 13.1). Forty-one per cent of donors said that
they gave because it was the right thing to do, while a smaller
proportion gave for more self-interested reasons, either
because of something that had happened to them or
someone they knew (25%) or because it may benefit them in
the future (22%). A sizeable minority said that they gave in
response to an appeal or information from the charity, with
18% donating after seeing a campaign or appeal in the
media, for example. Only a small proportion of donors said
that they felt pressured into giving either because they felt
uncomfortable refusing when asked (6%) or because they felt
donating was expected of them (5%).
The reasons for giving varied by age (Table 13.1). Donors in
the 25–34 age group were the most likely to say that they
gave because it made them feel good. Those aged 16–24
were the least likely to say that they gave because of an
appeal in the media or after seeing information from a charity.
The proportion of donors saying that they donated because
the work of the charity was important increased significantly
with age.
The reasons for donating did not vary significantly with sex
(Table A.13.1). There were also few differences on the basis of
income (Table A.13.2). However, unsurprisingly, the proportion
of donors saying that they gave because they could afford to
varied significantly with income. This reason was given by
37% of higher rate taxpayers compared with 19% of
other donors.
There were some significant differences in the reasons for
donating by ethnic origin (Table 13.2). Asian respondents
were the most likely to say that they donated because of their
religion, consistent with the higher levels of religious giving
observed among this group in Chapter 11. Black respondents
were the most likely to say that they donated because it made
them feel good.
There was some variation in donors’ reasons for giving
depending on the cause to which they were donating
(Table A.13.3). For example, those donating to religious
causes were the group most likely to say that they gave
because of their religion and the least likely to say that they
gave because they might benefit in the future. Donors to the
arts and conservation were the groups most likely to say that
they gave because they could afford to.31
13 Motivations for and barriers tocharitable giving
31. Differences in motivation by cause have not been formally tested for statistical significance.
96 Helping Out: A national survey of volunteering and charitable giving
13.3 Increases in charitable giving
13.3.1 Changes to donations
All those donating in the last 12 months were asked what
had happened to their donations since the year 2000.32 They
were asked about changes to the frequency with which they
donated and to the amount given per donation (Figure 13.2).
Nearly half of donors (48%) said they had increased the
amount donated since 2000, while 37% said that they had
increased the frequency of donations. Only 9% said that the
amount donated had decreased, while the same proportion
said that the frequency of their donations had decreased.
Those who had increased either the amount or the frequency
of their donations were asked their reasons for this (Table 13.3).
32. The year 2000 was chosen as a benchmark as this was the year in which substantial changes to the arrangements for tax-efficient methodsof giving occurred.
Figure 13.1 Reasons for donating in the last four weeks
Base: All respondents donating in the last four weeks (n=1,765). Percentages sum to more than 100 as respondents could give more than onereason. Don’t know/refusal responses excluded.
0 10 20 30 40 50 60
Other
Advised for financial reasons
Feel it’s expected
Feel uncomfortable refusing
Because of my religion
No other way to fund charity work
Asked by someone I knew
Saw information about charity
Makes me feel good
Asked by charity representative
Appeal or campaign
Can afford to
May benefit in future
Something happened to me/relative/etc
Just feel like giving
Right thing to do
Work of charity important
Percentage of current donors
52
41
31
25
22
20
18
17
17
15
15
12
12
6
5
<1
1
13 Motivations for and barriers to charitable giving 97
Table 13.1 Reasons for donating in the last four weeks, by age
Received or saw information about charity 7 11 12 22 17 15 14
No other way to fund charity work 6 6 12 15 19 13 12
Base (unweighted) 94 209 389 340 347 386 1,765
Base: All respondents donating in last four weeks. Percentages sum to more than 100 as respondents could give more than one reason. Don’tknow/refusal responses excluded. Reasons shown in table are those where there was a significant difference between age groups in theproportion of donors mentioning them.
The most common reason for giving more was an increase
in disposable income, cited by 41% of donors. A third of
those who increased their donations said that they did so
because they felt they should be giving more. A further 24%
said that they increased donations as a result of changes in
personal circumstances.
The proportion of donors increasing their donations since
2000 varied significantly with age (Table 13.4). Those in the
youngest age groups (16–34) were the most likely to have
increased both the amount and frequency of their donations
since 2000. This is likely to be related to changes in donors’
income and personal circumstances. Fifty-nine per cent of
16–34 year olds cited changes in income as a reason for
increasing donations, while 28% cited changes in
personal circumstances.
Current donors
White Asian Black Mixed/other All% % % % %
Work of charity important 53 32 37 53 52
Right thing to do 40 49 46 59 41
Result of something that happened 27 13 11 15 25
to me/friend/relative
May benefit in future 23 6 22 22 22
Makes me feel good 16 26 31 28 17
Because of my religion 10 37 23 18 12
Base (unweighted) 1,670 263 133 97 1,765
Table 13.2 Reasons for donating in the last four weeks, by ethnic origin
Base: All respondents donating in the last four weeks. Percentages sum to more than 100 as respondents could give more than one reason.Don’t know/refusal responses excluded. Based on combined (core and boost sample), except for ‘All’ based on core sample only. ‘Other’ includesthose of Chinese origin. Reasons shown in the table are those where there was a significant difference between ethnic groups in the proportionof donors mentioning them.
Figure 13.2 Changes in the frequency and amountof donations since 2000
Base: All donating in last year (n for amount=2,055; n forfrequency=2,059). Don’t know/refusal responses excluded.
Given the apparent importance of changes in income as a
reason for increased donations, it is not surprising that the
proportion of donors saying their donations had increased
since 2000 varied significantly with income.
Seventy-one per cent of donors falling within the higher tax
band had increased the amount of their donation compared
with 46% of other donors (Table 13.4). Two-thirds of those
in the higher tax band said that they had increased their
donations because of changes in income.
There were no significant differences in the proportion of donors
increasing their donations by sex or ethnic origin (Table A.13.4).
13.3.2 Increases in regular donations
All those respondents who had donated using regular giving
methods in the last year were asked whether they tended to
increase the amounts they gave through regular giving
methods each year.33 Only 18% of regular donors said that
they did increase the amount.
However, it may be possible for charities to increase the
amount given in regular donations by making a direct request
to donors (Table 13.5). Respondents who had donated by direct
debit in the last year were asked whether they had ever been
contacted by a charity requesting an increase in the amount
donated. Fifty-two per cent said that they had been contacted
in this way. Of these, 42% said that they had agreed to
increase the amount of their donation. A similar proportion
(43%) of direct debit donors who had not been contacted said
that they would be happy to increase their donation if asked.
Table 13.3 Reasons for increasing donationssince 2000
Base: All saying amount or frequency of donation had increased.Percentages sum to more than 100 as respondents could give morethan one reason. Don’t know/refusal responses excluded.
13.4 Barriers to giving The small proportion of respondents who had not donated to
charity in the last year were asked why they had not done so.
Similarly, donors who said that they had decreased their donations
since 2000 (see Section 13.3.1) were asked why this was the case.
Respondents were shown a list of reasons why people might not
donate and were asked to select all that applied.
By far the most common barrier to giving was not having
enough money to spare, with 58% of non-givers and 75% of
those who decreased their donations mentioning this reason
(Table 13.6). A sizeable minority of respondents had
decreased their donations because they were dissatisfied with
charities in some way. Sixteen per cent of those who had
decreased their donations said that it was because charities
wasted too much money on administration, while 10% said
that it was because charities did not achieve what they were
Respondents increasingfrequency or
amount ofdonation
%
Disposable income increased 41
Felt I should give more 33
Change in personal circumstances 24
Something that happened to me/friend/relative 17
Get asked more 4
Inflation 1
Other reason 6
No real reason 11
Base (unweighted) 1,062
0
20
40
60
80
100
DecreasedKept sameIncreased
Frequency of donationAmount of donation
9 9
4355
4837
Perc
enta
ge
of
do
no
rs in
last
yea
r98 Helping Out: A national survey of volunteering and charitable giving
33. Regular giving methods are defined as donations by direct debit, standing order or covenant, regular donations by cheque or credit card, andpayroll giving.
13 Motivations for and barriers to charitable giving 99
supposed to. Eleven per cent of non-donors said that they
had not donated because they had not been asked, although
no respondent gave this as the only reason for not donating.
Table 13.4 Proportion of donors increasingdonations since 2000, by ageand income
Base: All donating in last year. Don’t know/refusal responses excluded.
It is not possible to make reliable comparisons of the barriers
to giving across different socio-demographic subgroups
because of the small numbers of non-givers.
13.5 Encouraging charitable giving
All respondents were asked how likely they thought a range of
factors would be to encourage them to start donating or to
donate more in the future (Table 13.7). Providing people with
more information emerged as a potentially important way to
encourage donations (although the questions did not probe
for the types of information that respondents wanted).
Seventy-two per cent of all respondents said that having
confidence that money was spent effectively would be likely
to encourage them to donate, while 60% said they would be
encouraged by receiving information about how their donation
was spent. Tax-efficient giving also emerged as a potentially
important way to encourage donations. Forty-four per cent
of respondents said that being able to give by tax-efficient
methods would be likely to encourage them to donate
(although it should be noted that the question did not
distinguish between different forms of tax-efficient giving,
e.g. Gift Aid or payroll giving).
Interestingly, only a relatively small proportion (19%) said that
being asked by the charity to increase their donation would
encourage them to give more. This is despite the evidence on
giving by direct debit (Section 13.3.2 above) which suggests
that a substantial proportion of donors did increase their
donations when asked.
Table 13.5 Proportion of direct debit donors askedto increase donations, and who agreedor would agree to do so
Base: All donating using regular giving methods in last year. Base for(a): All direct debit donors asked to increase their donations. Base for(b): All direct debit donors not asked to increased their donations.Don’t know/refusal responses excluded.
Direct debit Asked to Not askeddonors in increase to increaselast year donationsa donationsb
Asked by charitable 52 N/A N/Aorganisation toincrease donationNot asked by 48 N/A N/Acharitableorganisation toincrease donationAgreed or would N/A 42 43agree to increasedonationDid not or N/A 58 57would not agreeto increase donationBase (unweighted) 649 349 274
Increased Increased Base amount frequency (unweighted)
% %
Age
16–24 59 54 115–116
25–34 58 49 248–250
35–44 50 38 440
45–54 47 36 388–389
55–64 43 33 411–412
65+ 37 21 452–453
Income
Under £5,000 42 33 317–318
£5,000–£9,999 37 26 384
£10,000–£14,999 51 41 297–299
£15,000–£19,999 51 41 235
£20,000–£29,999 52 38 317–318
£30,000–£49,999 60 44 252
£50,000+ 77 61 86
Higher rate 71 54 185
Not higher rate 46 35 1,703–1,707
All 48 37 2,055–2,059
Table 13.6 Reasons for not donating or fordecreasing donations
Base for (a): All respondents not donating in last year. Base for (b): Alldonors who decreased frequency/amount of donations since 2000.Percentages sum to more than 100 as respondents could give morethan one reason. Don’t know/refusal responses excluded.
For each factor, existing donors (those who had given in the
last four weeks or the last year) were more likely to say that it
would encourage them to donate than were non-donors. The
only factors that did not receive significantly more support
from existing donors were the availability of payroll giving and
receiving a letter/email of thanks.
Comparing across age groups, respondents in younger age
groups were the most likely to say that they would be
encouraged to give (Table 13.8). This was the case regardless
of the factor being considered.
There were few significant differences between men and
women. However, men were more likely to say that
tax-efficient giving (47%) and/or more generous tax relief
(50%) would be likely to encourage them to donate
compared with women (40% and 42% respectively).
Support for the different ways to encourage charitable giving
varied significantly with income (Table 13.9). In particular, those
in higher income bands (and therefore paying the higher tax
rate) were more likely than other respondents to say that they
would be encouraged to give by the availability of tax-efficient
giving methods and/or greater tax relief. This is despite the fact
that current awareness and use of tax-efficient giving methods
was already higher among this group (Chapter 12). Higher rate
taxpayers were also significantly more likely to say that being
asked by their friends or family, or another member of their
peer group, would encourage them to donate.
Non-donors Donorsin last decreasingyeara donations
since 2000b
% %
Not enough money to spare 58 75Charities waste too much on 16 16administrationGovernment’s responsibility 13 8to do what charities doMost charities do not achieve 9 10what they are supposed to (Now) give in different ways 10 5Not all charities are honest 8 12A relationship with a charity was 0 4disappointing Have not been asked 11 N/ADo not believe in giving to charity 8 N/ANo particular cause appeals * N/APlan to donate in will 0 N/AOther reason 7 11No real reason 15 8Base (unweighted) 89 237
100 Helping Out: A national survey of volunteering and charitable giving
Current Donors in last Non- Alldonors year but not donors
last four weeks in last yearProportion saying very/fairly likely to encourage % % % %
Confidence that charity uses money effectively 74 74 48 72Receiving information on what is done with donation 61 64 39 60Being asked by a friend/family member 58 55 39 57More generous tax relief 48 44 27 46Being able to give by tax-efficient methods 45 41 19 44Being asked by member of peer group 44 41 30 43Having more information about different charities 42 51 36 43I could supportReceiving letter/email of thanks 37 43 31 37If payroll giving became available 28 21 20 27Being asked by charity to increase donation 20 17 7 19Base (unweighted) 1,742–1,774 277–285 91–93 2,113–2,150
Table 13.7 Factors likely to encourage donations, by donor status
Being able to give by tax-efficient methods 57 60 49 42 37 25 44
If payroll giving became available 47 45 36 26 16 4 27
Being asked by charity to increase donation 26 23 23 17 17 10 19
Base (unweighted) 119–123 254–258 445–456 402–406 418–427 470–483 2,113–
2,150
Base: All respondents answering charitable giving questions. Don’t know/refusal responses excluded. Factors shown are those where there was asignificant difference between age groups in the proportion of respondents saying that they would be very/fairly likely to encourage them.
Table 13.9 Factors likely to encourage donations,by income
Base: All respondents answering charitable giving questions. Don’tknow/refusal responses excluded. Factors shown are those wherethere was a significant difference between groups in the proportionof respondents saying that they would be very/fairly likely toencourage them.
Unsurprisingly, the extent to which payroll giving was seen
as likely to encourage donations varied significantly with
employment status. Thirty-seven per cent of employees said
that the availability of payroll giving was likely to encourage
them to give compared with 13% of those not working.
In most instances, White respondents were the ethnic group
least likely to say that any factor would be likely to encourage
them to donate (Table 13.10). Asian respondents were the
group most likely to say that receiving a letter/email of thanks
would encourage them to donate. Black respondents were
particularly likely to say that being asked by another member
of their peer group would encourage them to donate. There
was no significant difference between ethnic groups in the
proportion of respondents saying that the availability of
tax-efficient giving methods would be likely to encourage
Receiving information on what is done 59 75 74 71 60
with donation
Being asked by member of peer group 42 58 49 52 43
Having more information about different 41 64 62 60 43
charities I could support
Receiving letter/email of thanks 36 48 57 49 37
If payroll giving became available 26 40 43 31 27
Being asked by charity to increase 17 34 30 26 19
donation
Base (unweighted) 1,984–2,019 338–346 183–188 134–139 2,113–2,150
Table 13.10 Factors likely to encourage donations, by ethnic origin
Base: All respondents answering charitable giving questions. Don’t know/refusal responses excluded. Based on combined (core and boostsample), except for ‘All’ based on core sample only. ‘Other’ includes those of Chinese origin. Factors shown are those where there was asignificant difference between ethnic groups in the proportion of respondents saying that they would be very/fairly likely to encourage them.
14 The link between volunteering and charitable giving 103
Summaryn Over half of respondents (58%) had both volunteered
and donated to charity in the past year.
n Just over half of those respondents who volunteered and
made donations to the same organisation said they were
more likely to give money to an organisation if they were
involved in it through volunteering, while just one in ten
were less likely to do so.
n The reasons why people were more likely to donate to
an organisation that they also volunteered for included
knowing and caring more about the charity.
n Most donors in the last year (73%) said that they had
not donated to charity as a substitute for volunteering,
although a sizeable minority (27%) said they had.
n Similarly, most current volunteers (88%) said that
they had not volunteered as a substitute for donating
to a charity.
n A majority of respondents (52%) perceived giving time
as showing more commitment to a charity than giving
money, but a majority (58%) also thought that both
activities would be equally valuable to the charity.
14.1 IntroductionThis final chapter explores the link between volunteering and
charitable giving, first by looking at propensity to volunteer, to
donate and to do both; secondly at whether or not people
give time and money to the same or to different
organisations; and thirdly whether or not donating is ever
seen as a substitute for volunteering and vice versa.
Figure 14.1 Levels of helping and donating
Base: All respondents answering volunteering and giving questions(n=2,153). Don’t know/refusal responses excluded.
14.2 Propensity to volunteer and todonate
Few people (3%) had neither given to charity nor volunteered
in the past year, with many (58%) having done both
(see Figure 14.1).
There were, however, differences according to age and sex
(Table 14.1). Women were more likely than men to have
helped and donated in the last year, whereas men were more
likely than women to have donated only. Those aged 35–44
and 55–64 were most likely to have helped and donated.
Neither
Helped and donated
Donated only
Helped only
13
58
38
Percentage of sample
14 The link between volunteering andcharitable giving
There were no significant differences in the patterns of
volunteering and donating according to ethnicity, but there
were differences according to religion (Table 14.2). For
example, those who actively practised their religion were the
most likely to both volunteer and to give while those who
were not active in their religion or who were not religious
were most likely to have donated only. Looking within
religious groups, those classified as other religions (including
Buddhism and Judaism) were the most likely to have both
helped and donated, while Muslims were the least likely to
have done so.
For both volunteering and charitable giving, respondents were
asked what types of organisations they had supported over
the last year, and so it was possible to look in detail at the
level of overlap between helping and donating for different
causes (Table 14.3). (Because of the variation in levels of
helping and donating by cause, the table excludes non-
participants in order to illustrate patterns of involvement,
independent of the overall levels of helping and donating for
any particular cause.) There were some interesting and
intuitive patterns within the levels of volunteering and
donating by cause, although people were most likely to have
only donated to a cause.34 The exception was among
respondents supporting sports and exercise-based
organisations, who were most likely to have volunteered only
(rather than having volunteered and donated or donated
only); levels of volunteering only were also relatively high
among respondents supporting hobby-based, recreational or
social clubs. In contrast, religious and educational causes were
distinctive in terms of the relatively high levels of overlap
between volunteering and donating. Support for
organisations dealing with elderly people, overseas aid or
disaster relief, social welfare or animal welfare primarily came
in the form of donations only.
104 Helping Out: A national survey of volunteering and charitable giving
Table 14.1 Levels of helping and donating, by age and sex
Base: All respondents answering volunteering and giving questions. Don’t know/refusal responses excluded.
Table 14.2 Levels of helping and donating, by religion and religious activity
Religion Any religion No religion All
Christian Hindu Muslim Other Active Not active% % % % % % % %
Helped only 1 5 0 0 1 1 2 1
Donated only 37 35 48 30 30 41 40 38
Helped and donated 58 56 45 66 66 54 53 58
Neither helped nor donated 3 5 7 4 3 4 4 3
Base (unweighted) 1,914 97 204 152 1,059 1,313 326 2,153
Base: All respondents answering volunteering and giving questions. Don’t know/refusal responses excluded. Based on combined (core and boost)sample, except for ‘All’ sample based on core sample only.
34. Please note that these differences have not been tested for statistical significance.
14 The link between volunteering and charitable giving 105
Tab
le 1
4.3
Leve
ls o
f h
elp
ing
an
d d
on
atin
g,
by
cau
se
Educ
atio
nCh
ildre
n,Sp
orts
,Re
ligio
nEl
derl
yO
vers
eas
Hea
lth,
Soci
alCo
nser
vati
on,
Ani
mal
A
rts,
Hob
bies
,A
llyo
ung
exer
cise
peop
leai
d,di
sabi
lity,
wel
fare
envi
ronm
ent,
wel
fare
mus
eum
sre
crea
tion
,pe
ople
disa
ster
med
ical
heri
tage
soci
alre
lief
club
s%
%%
%%
%%
%%
%%
%%
Hel
ped
only
1818
396
84
34
64
1240
1
Don
ated
onl
y49
6435
5682
8579
8777
8276
4239
Hel
ped
and
3318
2538
912
189
1714
1318
60
dona
ted
Base
79
368
346
768
664
692
21,
575
695
478
722
429
319
2,09
2
(unw
eigh
ted)
Base
: A
ll re
spon
dent
s vo
lunt
eerin
g or
don
atin
g in
the
last
12
mon
ths
(for
a p
artic
ular
cau
se).
Don
’t k
now
/ref
usal
res
pons
es e
xclu
ded.
14.3 Organisational affiliationsThere is a clear link between volunteering and donating
within the same organisation. For example, 59% of current
volunteers had given money to an organisation that they
had also volunteered for in the last 12 months (Table 14.4).
Of those, one-third had only given money to the organisation
that they volunteered for; the remaining two-thirds had given
to other organisations as well (Table 14.5).
Similar results were found in 1997, when 54% of volunteers
said they had also made donations to at least one of the
organisations that they helped (Davis Smith, 1998).
Table 14.4 Giving money to organisations helped
Base: All respondents giving or donating in the last year. Don’tknow/refusal responses excluded. Note: Excludes 11 people notoriginally classified as helping/donating in the last year.
Table 14.5 Giving money to other organisations
Base: All respondents giving and donating to the same organisation.Don’t know/refusal responses excluded.
Just over half of those respondents who volunteered and
made donations to the same organisation said that they were
more likely to give money to an organisation if they were
involved in it through volunteering, while just one in ten were
less likely to do so (Table 14.6).
Similar results were found in 1997, when 42% of current
volunteers who had made donations in the past year said they
were more likely to donate to an organisation they helped,
while 12% said they were less likely to do so.
Table 14.6 Likelihood of giving money toorganisations helped
Base: All respondents giving and donating to the same organisation.Don’t know/refusal responses excluded.
Those respondents who said they were more likely to donate
to an organisation that they also volunteered for were asked
why. Knowing and caring more about the charity were the
two most commonly identified reasons (Table 14.7), both
selected by over half of the respondents. Many respondents
(29%) noted that they were more likely to be asked to give by
a charity that they volunteered for and this was a reason for
being more likely to donate to it, but few (3%) said that they
felt under pressure to give because of that relationship.
Table 14.7 Reasons why more likely to donate toorganisations helped
Base: All respondents giving and donating to the same organisation.Don’t know/refusal responses excluded.
14.4 Donating as a substitute forvolunteering
To further explore the link between volunteering and giving,
all respondents who had donated in the last year were asked
if they had ever donated as a substitute for giving their time:
most (73%) had not, although a sizeable minority (27%) had.
Volunteers who were more likely to donate tothe charity they helped
%
Better understand the needs of this charity 70
It is the charity I care about the most 56
More likely to be asked by this charity 29
It is my role to fundraise 18
Friends/family give to this charity 12
Feel under pressure because of relationship with charity 3
Other 2
Base (unweighted) 410
Current volunteers who volunteer for anddonate to the same organisation
%
More likely if involved 51
Less likely if involved 10
Neither 39
Base (unweighted) 789
Current volunteers who volunteer for anddonate to the same organisation
%
Just this one 34
Given to others 66
Base (unweighted) 792
Current volunteers%
I have given money to an organisation I helped 59
I have not given money to an organisation I helped 41
Base (unweighted) 1,325
106 Helping Out: A national survey of volunteering and charitable giving
14 The link between volunteering and charitable giving 107
Table 14.8 Donating as a substitute for volunteering, by age
Have donated as a substitute for volunteering 30 34 27 27 30 20 27
Have not donated as a substitute for volunteering 70 66 73 73 70 80 73
Base (unweighted) 116 250 440 388 410 454 2,058
Base: All respondents who had donated in the last year. Don’t know/refusal responses excluded.
There were some significant variations according to age, but
not according to sex, ethnicity or religion. Those aged 65 and
over were least likely to have donated as a substitute for
volunteering (Table 14.8). There were also some significant
differences by employment status (Table A.14.1), with those
not in work least likely to say they had given money as a
substitute for helping (21%).
All respondents were asked whether they thought that people
who gave money to charity should also be encouraged to give
time to them as well. The majority of respondents disagreed
with this idea, although almost a third (32%) said that they
definitely or tended to agree (Figure 14.2). Levels of
agreement with this statement did not vary according to
whether the respondent had themselves given unpaid help or
donated money in the last 12 months.
Figure 14.2 Whether those giving money shouldbe encouraged to give time as well
Base: All those answering questions (base=2,107). Don’t know/refusalresponses excluded.
14.5 Volunteering as a substitute fordonating
All those respondents who had volunteered in the last
12 months were asked if they had ever helped out as a
substitute for donating: most (88%) had not. As such, people
were slightly less likely to volunteer as a substitute for
donating than they were to donate as a substitute for
volunteering.
This time, there were no significant variations in whether or
not people ever helped as a substitute for donating according
to age or sex, but there were differences according to religion
(Table 14.9). Hindus were the religious group most likely to
have helped as a substitute for donating.
All respondents were asked whether they thought that people
who gave unpaid help should also be encouraged to give
money to them. The majority of respondents disagreed with
this idea, although a significant minority (19%) said that they
definitely agreed or tended to agree (Figure 14.3). Levels of
agreement with this statement did not vary according to
whether the respondent had themselves given unpaid help
in the last 12 months. Overall, there was less agreement that
volunteers should also be encouraged to give money than
that those who gave money should also be encouraged to
give help (see Figure 14.2).
0
10
20
30
40
50
Definitelydisagree
Tend todisagree
Tend toagree
Definitelyagree
5
27
44
24
Perc
enta
ge
of
sam
ple
Figure 14.3 Whether those giving unpaid helpshould be encouraged to give moneyas well
Base: All those answering questions (base=2,114). Don’t know/refusalresponses excluded.
14.6 The comparative value ofvolunteering and charitable giving
Respondents were asked to imagine two individuals, with the
same amount of free time and identical incomes, one of
whom volunteered for eight hours a month with a charity and
one who donated £50 a month to the same charity. They
were then asked which individual they felt was most
committed to the charity and which individual was of greatest
value to the charity.
The evidence suggests that people view giving unpaid help to
a charity as showing greater commitment than donating
money (Table 14.10). A majority of respondents (52%) said
that the individual who gave their time to the charity was
more committed than the one who gave money. Most other
respondents (44%) felt that both were equally committed.
Perhaps surprisingly, responses did not vary according to
whether the respondent had themselves given unpaid help to
a charity in the last year. However, income made a significant
difference to how people viewed the relative commitment of
giving time and money. Those at the lowest end of the
income distribution (earning <£5,000) and those at the higher
end of the distribution (earning £50,000+) were most likely
to say that the person giving unpaid help showed more
commitment (Table 14.11).
Men were significantly more likely than women to view
someone who gave unpaid help as more committed than
someone who donated money. Women were more likely to
see both as equally committed. There was no significant
difference in responses by age.
When asked who they thought was most valuable to the
charity, the majority of respondents (58%) said that they
thought the person who gave money and the person who
gave time were equally valuable (Table 14.12). However,
almost a third of respondents (31%) said that they thought
the person who gave their time was more valuable, compared
with only 5% who said they thought the person who gave
money was more valuable.
Again, perceptions of the relative value of giving time and
money did not vary significantly according to whether the
respondent had themselves given unpaid help or donated
money to a charity in the last year.
0
10
20
30
40
50
60
Definitelydisagree
Tend todisagree
Tend toagree
Definitelyagree
3
16
49
32
Perc
enta
ge
of
sam
ple
108 Helping Out: A national survey of volunteering and charitable giving
Table 14.9 Volunteering as a substitute for donating, by religion and religious activity
Religion Any religion No religion All
Christian Hindu Muslim Other Active Not active% % % % % % % %
Have volunteered as a substitute 12 29 21 7 15 10 11 12
for donating
Have not volunteered as a 88 71 79 93 85 90 89 88
substitute for donating
Base (unweighted) 1,212 57 92 93 698 760 195 1,357
Base: All respondents who had volunteered in the last year. Don’t know/refusal responses excluded. Note: Excludes 11 people not originallyclassified as helping in the last year. Based on combined (core and boost) sample, except for ‘All’ sample based on core sample only.
14 The link between volunteering and charitable giving 109
Base (unweighted) 354 409 307 241 324 254 87 2,148
Table 14.11 Perceived commitment shown by giving time or money, by income
Base: All respondents answering volunteering and giving questions. Don’t know/refusal responses excluded.
There was some variation by income, with those earning
£50,000 or more most likely to say that giving time was more
valuable than giving money (Table A.14.2). However, the
difference was not statistically significant.
Men were more likely than women to say that giving time
was more valuable, while women were more likely to see
both activities as equally valuable. There was no significant
difference in responses by age.
110 Helping Out: A national survey of volunteering and charitable giving
Davis Smith, J. (1996) ‘Should volunteers be managed?’, in
Billis, D. and Harris, M. Voluntary Agencies: challenges of
organisation and management, Macmillan: London.
Davis Smith, J. (1998) The 1997 National Survey of
Volunteering, Institute for Volunteering Research: London.
Field, J. and Hedges, B. (1984) A National Survey of
Volunteering, Social and Community Planning Research:
London.
Gaskin, K. (2006) On the Safe Side: Risk, risk management
and volunteering, Volunteering England: London.
Home Office (2005) Volunteering Compact Code of Good
Practice, Home Office: London.
Institute for Volunteering Research (2004) Volunteering for
All? Exploring the link between volunteering and social
exclusion, Institute for Volunteering Research: London.
Kitchen, S., Michaelson, J., Wood, N. and John, P. (2006)
2005 Citizenship Survey: Active communities topic report,
Department for Communities and Local Government: London.
Low, N. and Butt, S. (2007) Helping Out: A national study of
giving and participation. Technical report, National Centre for
Social Research: London.
Lynn, P. and Davis Smith, J. (1991) The 1991 National Survey
of Voluntary Activity in the UK, Volunteer Centre UK:
Berkhamsted.
National Council for Voluntary Organisations and Charities Aid
Foundation (2004/05) UK Giving 2004/05: Results of the
2004/05 survey of individual charitable giving in the UK,
Charities Aid Foundation and National Council for Voluntary
Organisations: London.
National Council for Voluntary Organisations and Charities Aid
Foundation (2005/06) UK Giving 2005/06: Results of the
2005/06 survey of individual charitable giving in the UK,
Charities Aid Foundation and National Council for Voluntary
Organisations: London.
Smeaton, D., Marsh, A., Rajkumar, R. and Thomas, A. (2004)
Individuals’ donations to charities and their use of tax relief,
HM Revenue and Customs: London.
Sudman, S. and Bradburn, N. M. (1982) Asking questions:
A practical guide to questionnaire construction, Jossey-Bass.
Appendix A: References
Appendix B: Additional tables 111
White Asian Black Mixed Other All% % % % % %
All formal volunteers 59 52 55 66 45 59
Regular formal volunteers 40 29 36 32 23 39
Occasional or one-off volunteers 20 22 18 34 22 20
Non-volunteers 41 48 45 34 55 41
Base (unweighted) 2,023 348 189 71 69 2,155
Table A.3.1 Extent of formal volunteering, by ethnic origin
Base: All respondents answering volunteering questions. Don’t know/refusal responses excluded. Based on combined (core and boost) sample,except for ‘All’ sample based on core sample only. ‘Other’ includes those of Chinese origin.
Table A.4.1 Type of organisation helped, by religion and religious activity
Religion Any religion No AllChristian Hindu Muslim Other Active Not religion
Base (unweighted) 1,225 58 93 95 707 768 199 1,372
Base: All current volunteers. Don’t know/refusal responses excluded. Based on combined (core and boost) sample, except for ‘All’ sample basedon core sample only. ‘Other’ includes those of Chinese origin.
Appendix B: Additional tables
Current volunteersHigher and Intermediate, Semi-routine All
Local community, neighbourhood citizens group 21 16 13 17
Hobbies, recreation, social clubs 13 13 13 13
Overseas aid, disaster relief 11 12 6 11
Animal welfare 9 8 12 10
Elderly people 8 8 9 8
Conservation, environment, heritage 11 5 4 8
Arts, museums 11 6 4 8
Social welfare 7 9 3 7
Politics 6 3 1 4
Safety, first aid 4 5 1 4
Justice, human rights 5 3 3 4
Trade unions 5 3 2 3
Other 3 4 1 3
Base (unweighted) 644 418 287 1,372
112 Helping Out: A national survey of volunteering and charitable giving
Table A.4.2 Type of organisation helped, by socio-economic status
Base: All current formal volunteers. Percentages sum to more than 100 as respondents could choose more than one type of organisation.Don’t know/refusal responses excluded.
Appendix B: Additional tables 113
Current volunteersNot at risk At risk All
No quals LLI All% % % % %
National organisation 20 11 17 16 19
Local organisation 19 14 13 14 17
Local council 5 5 6 4 5
Library 2 3 2 4 3
Charity shop 2 4 3 3 2
Community centre 2 1 2 3 2
Doctor’s surgery 1 3 5 3 2
Citizens Advice Bureau 1 1 * 1 1
Volunteer Centre/Bureau 1 1 2 2 1
www.do-it.org.uk 1 0 * 1 1
Other 11 13 15 15 12
None of these 50 59 51 50 50
Base (unweighted) 948 164 211 403 1,351
Table A.5.1 Sources of information on volunteering, by groups at risk of social exclusion
Base: All current formal volunteers. Percentages sum to more than 100 as respondents could choose more than one source. Don’t know/refusalresponses excluded. See Section 1.2.3 for a full explanation of the ‘at risk’ group and the PSA4 objectives.
Current volunteers
White Asian Black Mixed/other All% % % % %
National organisation 19 14 14 14 19
Local organisation 18 10 16 16 18
Local council 6 4 4 7 5
Library 3 5 4 2 3
Charity shop 2 2 3 2 2
Community centre 1 9 3 3 2
Doctors’ surgery 2 2 1 * 2
Citizen’s Advice Bureau 1 1 1 * 1
Volunteer Centre/Bureau 1 2 1 3 1
www.do-it.org.uk 1 1 3 0 1
Other 12 15 15 22 12
None of these 50 52 49 46 50
Base (unweighted) 1,275 173 115 86 1,351
Table A.5.2 Sources of information on volunteering, by ethnic origin
Base: All current formal volunteers. Percentages sum to more than 100 as respondents could choose more than one source. Don’t know/refusalresponses excluded. Based on combined (core and boost) sample, except for ‘All’ sample based on core sample only. ‘Other’ includes those ofChinese origin.
Sch
oo
lsC
hild
Spo
rts
Rel
igio
nH
ealt
hLo
cal
Ho
bb
ies
All
%%
%%
%%
%%
Feel
s ne
ed f
or a
dvic
e an
d su
ppor
t11
2918
2410
2018
18
Ava
ilabi
lity
of a
dvic
e an
d su
ppor
t86
8975
9071
9284
82
Base
(un
wei
ghte
d)24
3–24
511
516
1–16
216
6–16
716
3–16
594
79–8
01,
342–
1,35
0
114 Helping Out: A national survey of volunteering and charitable giving
Cu
rren
t vo
lun
teer
s
%%
%%
%%
%%
%%
%%
%
Non
e in
curr
ed
5432
4031
3435
3031
2033
3148
54
Expe
nses
incu
rred
4668
6069
6665
7069
8067
6952
46
Of
whi
ch:
All
reim
burs
ed
56
76
36
78
413
84
7
Som
e re
imbu
rsed
20
2625
2518
2322
2517
2327
1217
Non
e re
imbu
rsed
75
6868
6980
7171
6780
6565
8477
Base
(un
wei
ghte
d)
724/
343/
547/
175/
138/
257/
177/
266/
214/
207/
127/
319/
1,35
1/
368
255
351
124
9817
713
019
617
615
391
179
694
Tab
le A
.6.1
Nee
d a
nd
ava
ilab
ility
of
advi
ce a
nd
su
pp
ort
, b
y ty
pe
of
org
anis
atio
n
Base
: A
ll cu
rren
t fo
rmal
vol
unte
ers.
Don
’t k
now
/ref
usal
res
pons
es e
xclu
ded.
Typ
es o
f or
gani
satio
n sh
own
are
thos
e w
here
bas
e >
50.
Sch
oo
lsC
hild
Spo
rts
Rel
igio
nH
ealt
hLo
cal
Ho
bb
ies
All
%%
%%
%%
%%
Non
e in
curr
ed
6446
4348
6356
4754
Expe
nses
incu
rred
3654
5752
3744
5346
Base
(un
wei
ghte
d)24
511
516
216
716
594
801,
351
Tab
le A
.6.3
Wh
eth
er i
ncu
rred
exp
ense
s, b
y ty
pe
of
org
anis
atio
n
Base
: A
ll cu
rren
t fo
rmal
vol
unte
ers.
Don
’t k
now
/ref
usal
res
pons
es e
xclu
ded.
Typ
es o
f or
gani
satio
n sh
own
are
thos
e w
here
bas
e >
50.
Tab
le A
.6.2
Rei
mb
urs
emen
t o
f ex
pen
ses,
by
typ
e o
f h
elp
Base
: A
ll cu
rren
t fo
rmal
vol
unte
ers/
all c
urre
nt f
orm
al v
olun
teer
s w
ho h
ad in
curr
ed e
xpen
ses.
Don
’t k
now
/ref
usal
res
pons
es e
xclu
ded.
Fundra
ising
Comm
ittee
Ev
ent
Visitin
g
Befrie
nding
Educa
ting
Advice
Admin
istra
tion Tr
ansp
ort Rep
rese
nting
Campai
gning Oth
er p
ract
ical
help
All
Appendix B: Additional tables 115
Sch
oo
lsC
hild
Spo
rts
Rel
igio
nH
ealt
hLo
cal
Ho
bb
ies
All
%%
%%
%%
%%
Role
des
crip
tion
prov
ided
1526
1119
2128
919
Refe
renc
es t
aken
up
1121
88
910
111
Ask
ed f
or d
etai
ls o
f cr
imin
al c
onvi
ctio
ns22
3611
1912
202
18
CRB
che
ck24
3812
2612
171
18
Base
(un
wei
ghte
d)24
511
516
216
716
2–16
490
–94
801,
342–
1,35
0
Tab
le A
.6.4
Part
icip
atio
n i
n d
iffe
ren
t vo
lun
teer
rec
ruit
men
t p
ract
ices
, b
y ty
pe
of
org
anis
atio
n
Base
: A
ll cu
rren
t fo
rmal
vol
unte
ers.
Don
’t k
now
/ref
usal
res
pons
es e
xclu
ded.
Typ
es o
f or
gani
satio
n sh
own
are
thos
e w
here
bas
e >
50.
Sch
oo
lsC
hild
Spo
rts
Rel
igio
nH
ealt
hLo
cal
Ho
bb
ies
All
%%
%%
%%
%%
Wor
ried
abou
t ris
ks o
f vo
lunt
eerin
g9
1713
411
1511
10
Con
side
red
stop
ping
vol
unte
erin
g
beca
use
of c
once
rns
abou
t ris
ks3
33
12
33
2
Been
giv
en in
form
atio
n by
org
anis
atio
n
on h
ow t
o re
duce
ris
ks18
3926
3524
2421
27
Ask
ed o
r be
en t
old
abou
t
orga
nisa
tion’
s in
sura
nce
cove
r16
3436
2814
3229
26
Not
bee
n ab
le t
o do
an
activ
ity
beca
use
of in
sura
nce
risks
615
47
36
127
Been
invo
lved
in a
n in
cide
nt w
hich
resu
lted
in o
rgan
isat
ion
bein
g su
ed0
02
01
10
*
Base
(un
wei
ghte
d)24
4–24
511
516
1–16
216
6–16
716
3–16
593
–94
801,
345–
1,35
1
Tab
le A
.6.5
Exp
erie
nce
of
risk
an
d r
isk
man
agem
ent,
by
typ
e o
f o
rgan
isat
ion
Base
: A
ll cu
rren
t fo
rmal
vol
unte
ers.
Don
’t k
now
/ref
usal
res
pons
es e
xclu
ded.
Typ
es o
f or
gani
satio
n sh
own
are
thos
e w
here
bas
e >
50.
116 Helping Out: A national survey of volunteering and charitable giving
Cu
rren
t vo
lun
teer
s
%%
%%
%%
%%
%%
%%
%%
Can
cop
e w
ith t
hing
s I’m
ask
ed
to d
o 98
9999
9898
9997
9997
9995
9796
97
My
effo
rts
are
appr
ecia
ted
9597
9699
9995
9998
9394
9796
9795
Giv
en o
ppor
tuni
ty t
o do
thi
ngs
I lik
e 91
9492
9693
9595
9691
9293
9091
91
The
orga
nisa
tion
has
reas
onab
le
expe
ctat
ions
of
wor
kloa
d84
8686
8787
8486
9179
8881
8283
84
Giv
en o
ppor
tuni
ty t
o in
fluen
ce t
he
orga
nisa
tion
7384
7673
7980
7982
6887
8166
6569
Feel
thi
ngs
coul
d be
muc
h be
tter
orga
nise
d33
3933
3531
3438
4036
3634
3433
31
Feel
the
re is
too
muc
h bu
reau
crac
y37
3129
2427
2728
3837
2936
2815
27
Feel
I w
ould
be
unab
le t
o le
ave
as n
o on
e el
se t
o ta
ke m
y pl
ace
2634
2729
2126
3541
2631
3524
3024
Feel
vol
unte
erin
g is
bec
omin
g to
o
muc
h lik
e pa
id w
ork
2022
1818
1919
2219
1922
3216
917
Feel
org
anis
atio
n to
o co
ncer
ned
abou
t ris
k12
1410
1012
1013
816
1214
1317
11
T ake
s up
too
muc
h tim
e13
2115
1718
1823
1419
2533
105
13
Hel
p no
t re
ally
nee
ded
74
66
67
22
910
310
129
Feel
the
org
anis
atio
n is
n’t
real
ly
goin
g an
ywhe
re8
107
54
67
1210
710
95
8
Get
bor
ed o
r lo
se in
tere
st8
55
35
64
54
78
35
6
Base
(un
wei
ghte
d)43
1–30
0–40
1–15
7–11
6–20
9–15
1–22
2–17
2–17
8–91
–20
1–51
–81
9–
437
302
404
160
119
212
153
226
175
181
9220
454
833
Tab
le A
.7.1
The
hig
hs
and
lo
ws
of
volu
nte
erin
g,
by
typ
e o
f vo
lun
teer
ing
act
ivit
ies
Base
: A
ll cu
rren
t fo
rmal
vol
unte
ers.
Per
cent
ages
sum
to
mor
e th
an 1
00 a
s re
spon
dent
s co
uld
choo
se m
ore
than
one
res
pons
e. D
on’t
kno
w/r
efus
al r
espo
nses
exc
lude
d.
Fundra
ising
Comm
ittee
Ev
ent
Visitin
g
Befrie
nding
Educa
ting
Advice
Admin
istra
tion Tr
ansp
ort
Repre
sentin
g Campai
gning Oth
er p
ract
ical
help
Other
hel
p All
Appendix B: Additional tables 117
Regular volunteersNot at risk At risk All
No quals LLI All% % % % %
Very important 9 16 20 22 13
Fairly important 40 35 34 32 37
Not very important 33 35 33 32 33
Not at all important 19 15 13 15 17
Base (unweighted) 580 99 129 252 832
Table A.7.2 Importance of recognition, by groups at risk of social exclusion
Base: All current formal volunteers who volunteered regularly with their main organisation. Don’t know/refusal responses excluded. See Section 1.2.3for a full explanation of the ‘at risk’ group and the PSA4 objectives.
Regular volunteersNot at risk At risk All
No quals LLI All% % % % %
Yes 6 3 9 8 6
No 47 35 32 33 43
Didn’t know qualifications were available 47 62 59 59 51
Base (unweighted) 580 100 129 253 833
Table A.7.3 Receiving qualifications for volunteering, by groups at risk of social exclusion
Base: All current formal volunteers who volunteered regularly with their main organisation. Don’t know/refusal responses excluded. See Section 1.2.3for a full explanation of the ‘at risk’ group and the PSA4 objectives.
118 Helping Out: A national survey of volunteering and charitable giving
Regular volunteersNot at risk At risk All
No quals LLI AllProportion saying very/fairly important % % % % %
Get satisfaction from seeing the results 97 98 97 97 97
I really enjoy it 95 99 98 99 96
It gives me a sense of personal achievement 86 95 86 92 88
Meet people and make friends 85 93 87 87 86
Gives me the chance to do things I am good at 82 89 83 86 83
It broadens my experience of life 81 84 78 85 82
Makes me a less selfish person 68 75 78 79 71
It gets me out of myself 65 74 78 76 69
It makes me feel needed 63 72 78 76 67
It gives me more confidence 61 83 66 73 65
It gives me the chance to learn new skills 58 65 60 68 61
It makes me feel less stressed 45 67 54 63 51
It improves my physical health 40 54 42 52 44
It gives me a position in the community 33 49 44 51 38
It gives me the chance to get a recognised 11 18 12 19 13
qualification
It gives me the chance to improve my employment 20 33 16 29 23
prospects
Base (unweighted) 575–580 99–100 127–129 249–253 827–833
Table A.7.4 The personal benefits of volunteering, by groups at risk of social exclusion
Base: All current formal volunteers who volunteered regularly with their main organisation. Don’t know/refusal responses excluded. See Section 1.2.3for a full explanation of the ‘at risk’ group and the PSA4 objectives.
Appendix B: Additional tables 119
Occasional or non-volunteers who wouldconsider volunteering in the future
Not at risk At risk AllNo quals LLI All
% % % % %
Fundraising 46 26 23 30 40
Visiting people 29 42 29 35 31
Organising an event 34 27 12 21 30
Educating 22 6 20 19 21
Advice 19 17 22 23 16
Befriending 17 6 16 13 13
Transport 16 10 18 14 20
Campaigning 15 6 5 8 12
Administration 13 5 12 11 15
Committee membership 10 6 13 9 10
Representing 5 2 5 7 5
Other practical help 41 49 34 37 40
Other help 4 0 8 4 4
Base (unweighted) 393 86 119 215 608
Table A.8.2 Areas in which respondents would consider volunteering, by groups at risk of social exclusion
Base: All respondents who were not regular formal volunteers in the last year and who would consider helping out. Don’t know/refusal responsesexcluded. See Section 1.2.3 for a full explanation of the ‘at risk’ group and the PSA4 objectives.
Occasional or non-volunteersNot at risk At risk All
No quals LLI All% % % % %
Would like to spend more time volunteering 60 41 37 44 54
Would not like to spend more time volunteering 40 59 63 56 46
Base (unweighted) 678 218 313 512 1,190
Table A.8.1 Desire to spend more time volunteering, by groups at risk of social exclusion
Base: All respondents who were not regular formal volunteers in the last year. Don’t know/refusal responses excluded. See Section 1.2.3 for a fullexplanation of the ‘at risk’ group and the PSA4 objectives.
120 Helping Out: A national survey of volunteering and charitable giving
Non-volunteers who would like to start helpingNot at risk At risk All
No quals LLI AllProportion saying statement applies % % % % %
Not enough spare time 90 78 50 71 82
Put off by bureaucracy 49 52 50 50 49
Worried about risk/liability 45 53 48 50 47
Don’t know how to find out about getting involved 37 44 33 42 39
Not got the right skills/experience 38 46 38 41 39
Wouldn’t be able to stop once got involved 35 40 34 38 36
Worried about threat to safety 21 40 33 37 27
Worried I might end up out of pocket 20 30 27 32 25
Worried I wouldn’t fit in with other people involved 19 26 28 29 23
Illness or disability 6 33 84 45 22
Feel I am too old 12 25 50 32 20
Family/partner wouldn’t want me to 20 25 20 21 20
Worried about losing benefits 5 15 13 11 7
Base (unweighted) 354–358 128–130 150–154 275–280 632–638
Table A.8.3 Reasons for not volunteering, by groups at risk of social exclusion
Base: All respondents who were not formal volunteers in the last year, but would like to start to help. Don’t know/refusal responses excluded. SeeSection 1.2.3 for a full explanation of the ‘at risk’ group and the PSA4 objectives.
Helping Out 2006/07 National Survey of Volunteering 1997 Occasional or non-volunteers who would like to help more
% %
More spare time 31 14
Working less 11 9
More information 9 15
Health improvement 8 2
Fewer other commitments 6 6
If I was asked 5 7
Child related – childcare, fewer childcare responsibilities 4 3
More money 3 4
If someone I knew got involved too 2 4
Driving licence/transport 2 3
More convenient location 1 6
More convenient timings 1 2
Other reason(s) 11 0
Nothing 21 0
Base (unweighted) 1,154 177
Table A.8.4 Things that would make it easier to get involved
Base: All respondents who were not regular formal volunteers in the last year. Percentages sum to more than 100 as respondents could pickmore than one answer. Don’t know/refusal responses excluded.
Appendix B: Additional tables 121
Gift Aid Payroll Legacies Tax relief Self- Tax relief ongiving on gifts Assessment gifts of land/
of shares Form buildings% % % % % %
Aware, of which: 64 40 24 14 12 10
unprompted 35 7 2 2 2 *
prompted 29 33 22 13 10 9
Not aware 36 60 76 86 88 90
Base (unweighted) 2,155 2,155 2,155 2,155 2,155 2,155
Table A.12.1 Awareness of tax-efficient methods of giving
Has made arrangements to leave charitable legacy 5 N/A
Has not made arrangements, of which: 95 N/A
– would consider leaving legacy N/A 38
– would not consider leaving legacy N/A 62
Base (unweighted) 2,153 1,964
Table A.12.2 Whether respondent has made or would consider making arrangements to leavecharitable legacies
Base for making arrangements: All respondents answering charitable giving questions. Base for considering leaving legacy: All those withouta legacy arranged. Don’t know/refusal responses excluded. Respondents who said they were not making a will included in those not makingarrangements for legacies and not considering doing so.
Men Women AllProportion using in last 12 months % % %
Gift Aid 33 35 34
Payroll giving 2 3 3
Base (unweighted) 985 1,166 2,151
Table A.12.3 Use of Gift Aid and payroll giving, by sex
122 Helping Out: A national survey of volunteering and charitable giving
Men Women All% % %
Work of charity important 51 53 52
Right thing to do 44 40 41
Just feel like giving 31 32 31
Result of something that happened to me/friend/relative 24 26 25
May benefit in future 20 24 22
Can afford to 23 18 20
Because of an appeal or campaign 17 19 18
Asked by charity representative 20 15 17
Makes me feel good 16 17 17
Asked by someone I knew 13 17 15
Saw information about charity 12 16 14
No other way to fund charity work 11 14 12
Because of my religion 14 10 12
Feel uncomfortable refusing 6 7 6
Feel it’s expected 5 5 5
Advised for financial reasons 1 0 *
Other 3 2 3
Base (unweighted) 767 998 1,765
Table A.13.1 Reasons for donating in the last four weeks, by sex
Base: All respondents donating in the last four weeks. Percentages sum to more than 100 as respondents could give more than one reason.Don’t know/refusal responses excluded.
Appendix B: Additional tables 123
Tab
le A
.13.
2R
easo
ns
for
do
nat
ing
in
th
e la
st f
ou
r w
eeks
, b
y in
com
e
<£5
k£5
–£1
0–£1
5–£2
0–£3
0–£5
0k o
r N
ot
hig
hH
igh
rat
eA
ll<
£10k
<£1
5k<
£20k
<£3
0k<
£50k
mo
rera
te t
ax-
taxp
ayer
pay
er%
%%
%%
%%
%%
%
Wor
k of
cha
rity
impo
rtan
t48
4750
5958
4859
5153
52
Righ
t th
ing
to d
o46
4337
3938
4551
4147
41
Just
fee
l lik
e gi
ving
3232
3033
2528
3130
3231
Hap
pene
d to
fam
ily/f
riend
2029
2532
2523
1925
2325
May
ben
efit
in f
utur
e23
2523
2521
2313
2417
22
Can
aff
ord
to14
1318
2522
3245
1937
20
Med
ia c
ampa
ign
1814
1620
1624
2017
2218
Ask
ed b
y ch
arity
rep
rese
ntat
ive
1411
1723
2420
2417
2417
Mak
es m
e fe
el g
ood
1618
1818
1713
2517
2017
Ask
ed b
y so
meo
ne I
knew
1713
1118
2116
1116
1515
Saw
info
rmat
ion
abou
t ch
arity
1314
1417
1712
1415
1314
No
othe
r w
ay t
o fu
nd c
harit
y
wor
k11
1710
1315
1212
1312
12
Beca
use
of m
y re
ligio
n13
1312
117
1111
1210
12
Feel
unc
omfo
rtab
le r
efus
ing
97
44
77
67
56
Feel
it’s
expe
cted
54
46
55
45
45
Adv
ised
for
fin
anci
al r
easo
ns*
**
0*
01
**
*
Oth
er2
24
23
22
25
3
Base
(un
wei
ghte
d)26
031
327
020
227
422
782
1,45
417
41,
765
Base
: A
ll re
spon
dent
s do
natin
g in
last
fou
r w
eeks
. Pe
rcen
tage
s su
m t
o m
ore
than
100
as
resp
onde
nts
coul
d gi
ve m
ore
than
one
rea
son.
Don
’t k
now
/ref
usal
res
pons
esex
clud
ed.
124 Helping Out: A national survey of volunteering and charitable giving
%%
%%
%%
%%
%%
%%
%%
%%
%
Wor
k of
cha
rity
impo
rtan
t56
5355
5664
6058
6062
5761
6259
6261
5852
Righ
t th
ing
to d
o40
4844
4645
4845
4043
4546
4341
4244
3641
Just
fee
l lik
e gi
ving
2933
3532
3533
3329
2833
2928
3430
2726
31
Hap
pene
d to
fam
ily/f
riend
2729
2923
3125
3231
3631
2826
2726
2424
25
May
ben
efit
in f
utur
e27
2528
1929
2327
2827
3024
2024
2533
2222
Can
aff
ord
to21
2323
2023
2523
2124
2224
3121
3323
3020
Med
ia c
ampa
ign
2120
2519
1825
2118
2420
2423
2020
2211
18
Ask
ed b
y ch
arity
rep
rese
ntat
ive
2121
2118
2120
2021
2020
2223
1926
1315
17
Mak
es m
e fe
el g
ood
1621
1718
1715
1814
1520
1712
1816
1510
17
Ask
ed b
y so
meo
ne I
knew
2118
2113
1516
1716
1613
1515
1517
2017
15
Saw
info
rmat
ion
abou
t ch
arity
1818
1614
2022
1518
1919
1924
1622
2021
14
No
othe
r w
ay t
o fu
nd c
harit
y13
1616
1313
1314
1616
1714
1616
1316
1112
wor
k
Beca
use
of m
y re
ligio
n10
137
3110
1611
1012
1110
107
106
712
Feel
unc
omfo
rtab
le r
efus
ing
77
86
76
78
108
85
79
84
6
Feel
it’s
expe
cted
65
106
65
65
66
64
46
74
5
Adv
ised
for
fin
anci
al r
easo
ns*
*1
1*
**
**
**
**
**
**
Oth
er3
21
22
12
32
33
22
22
73
Base
(un
wei
ghte
d)59
751
126
359
453
180
599
071
647
761
861
540
362
134
517
412
71,
765
Tab
le A
.13.
3R
easo
ns
for
do
nat
ing
, b
y ca
use
Base
: A
ll do
natin
g in
last
fou
r w
eeks
. D
on’t
kno
w/r
efus
al r
espo
nses
exc
lude
d. P
erce
ntag
es s
um t
o m
ore
than
100
as
resp
onde
nts
coul
d ch
oose
mor
e th
an o
ne r
easo
n.
School
Childre
nSp
orts
Relig
ion
Elder
ly p
eople Ove
rsea
s aid M
edica
l res
earch
Hospita
lsHea
lth
Disable
d
Socia
l wel
fare
Envi
ronm
enta
l/
conse
rvat
ion
Animal
wel
fare
Arts
Hobby
Other
Tota
l
Appendix B: Additional tables 125
Table A.13.4 Proportion of donors increasing donations since 2000, by sex and ethnic origin
Increased Increased Baseamount frequency (unweighted)
% %
Sex
Male 47 35 925–928
Female 49 39 1,130–1,131
Ethnic origin
White 48 37 1,932–1,934
Asian 44 33 317–319
Black 46 40 164–165
Mixed/Other 50 43 126–127
All 48 37 2,055–2,059
Base: All donating in last year. Don’t know/refusal responses excluded. All figures based on core sample only except for breakdowns by ethnicorigin, which are based on combined (core and boost) sample.
Table A.14.1 Donating as a substitute for volunteering, by employment status
Donors in the last yearEmployee Self- Not All
employed working% % % %
Have donated as a substitute for volunteering 31 34 21 27
Have not donated as a substitute for volunteering 69 66 79 73
Base (unweighted) 1,072 159 824 2,058
Base: All respondents who had donated in the last year. Don’t know/refusal responses excluded.
Table A.14.2 Perceived value to charity of giving time or money, by income
<£5k £5– £10– £15– £20– £30– £50k or All<£10k <£15k <£20k <£30k <£50k more
Percentage saying more valuable % % % % % % % %
Someone who gives money 5 8 5 3 1 4 2 5
Someone who gives time 30 29 33 31 28 31 50 31
Both equally valuable 61 59 58 60 63 59 38 58
It depends 5 3 3 6 8 6 10 6
Base (unweighted) 354 409 307 241 324 254 87 2,147
Base: All respondents answering questions. Don’t know/refusal responses excluded.
126 Helping Out: A national survey of volunteering and charitable giving
Charitable giving Includes planned and unplanned donations, donations to charities but also to selectedindividuals such as beggars and to selected public institutions such as hospitals and schools.
Current donor Anyone donating to charity in the last 12 months.
Current volunteer Anyone engaged in formal volunteering within the last 12 months.
Episodic volunteer Anyone undertaking formal volunteering activities on a one-off basis in the past 12 months.
Ex-volunteer Anyone who has taken part in formal volunteering activities in the past but has not done soin the last 12 months.
Formal volunteering Giving unpaid help through groups, clubs or organisations to benefit other people or theenvironment. This study focuses on formal volunteering only.
Gift Aid Tax relief on money donated to UK charities.
Informal volunteering Giving unpaid help as an individual, for example to friends, relatives or neighbours. Not countedas volunteering for the purposes of this study.
Main organisation The one organisation formal volunteers did most for i.e. spent most time helping (as selectedby the respondent).
Non-volunteer Anyone who has not volunteered within the past 12 months; includes people who have nevervolunteered as well as ex-volunteers. Given the definition of volunteering used in this report,also includes informal volunteers.
Occasional volunteer Anyone carrying out formal volunteering activities in the past 12 months less frequently thanonce a month. It includes activities carried out every couple of months and those undertakenon a one-off (episodic) basis
Payroll giving A method of donating whereby money is deducted straight from wages/salary.
PSA4 groups Groups targeted by Cabinet Office PSA4. They include individuals who belong to certain Blackand minority ethnic groups, have no formal qualifications or who have a disability or limiting,long-term illness. These groups are seen as at risk of social exclusion and government policy isfocused on increasing their levels of participation.
Public Service Agreement Targets for what each government department is supposed to deliver by way of improvementsin public services in return for investment. They highlight key policy priorities and are an integralpart of the Government’s spending plans.
Regular giving methods Those methods that are most likely to be made on a regular basis, defined as donations bydirect debit, standing order or covenant, regular donations by cheque or credit card andpayroll giving.
Regular volunteer Anyone carrying out formal volunteering activities at least once a month in the last 12 months.
Social exclusion, Those groups that form the Cabinet Office PSA4 target groups i.e. individuals who belong to groups at risk of certain Black and minority ethnic groups, have no formal qualifications or who have a disability
or limiting, long-term illness
Tax-efficient giving Gift Aid, payroll giving, giving via Self-Assessment Forms, tax relief on the value of gifts ofshares given to charities, tax relief on the value of gifts of land or buildings given to charities,and legacies.
Appendix C: Glossary
Appendix D: Index of tables and figures 127
Appendix D: Index of tables and figures
Extent and frequency of formal volunteeringFigure 2.1 Extent of any formal and regular formal volunteering in the past 12 months and in the past five years .. 15
Table 2.1 Frequency of formal volunteering in the past 12 months ........................................................................ 16
Table 2.2 Average number of hours spent helping in the last four weeks by current volunteers ............................. 16
Table 2.3 Extent of formal and regular formal volunteering in the past 12 months: comparison of Helping Out,
Citizenship Surveys and National Surveys of Volunteering ....................................................................... 17
Table 3.1 Extent of formal volunteering, by age ..................................................................................................... 19
Table 3.2 Extent of formal volunteering, by sex ...................................................................................................... 20
Table 3.3 Extent of formal volunteering, by employment status ............................................................................. 20
Figure 3.1 Extent of formal volunteering, by ethnic origin ....................................................................................... 21
Table 3.4 Extent of formal volunteering, by religion and religious activity ............................................................... 21
Table 3.5 Extent of formal volunteering, by Government Office region .................................................................. 22
Table 3.6 Extent of formal volunteering, by groups at risk of social exclusion ......................................................... 22
Table A.3.1 Extent of formal volunteering, by ethnic origin ....................................................................................... 111
What volunteers doTable 4.1 Number of organisations helped by volunteers ........................................................................................ 23
Table 4.2 Sector of organisation helped by volunteers, by age and sex ................................................................... 24
Table 4.3 Sector of organisation helped by volunteers, by groups at risk of social exclusion ................................... 24
Table 4.4 Types of organisation helped ................................................................................................................... 25
Table 4.5 Types of organisation helped, by age and sex .......................................................................................... 26
Table 4.6 Types of organisation helped, by groups at risk of social exclusion .......................................................... 27
Table 4.7 Types of organisation helped, by ethnicity ............................................................................................... 28
Table 4.8 Number of volunteering activities undertaken ......................................................................................... 29
Table 4.9 Types of volunteering activity .................................................................................................................. 29
Table 4.10 Types of volunteering activity, by age and sex ......................................................................................... 30
Table 4.11 Types of volunteering activity, by groups at risk of social exclusion .......................................................... 30
Table 4.12 Types of volunteering activity, by ethnicity ............................................................................................... 31
Table 4.13 Types of volunteering activity, by socio-economic status .......................................................................... 32
Table A.4.1 Type of organisation helped, by religion and religious activity .................................................................. 111
Table A.4.2 Type of organisation helped, by socio-economic status ........................................................................... 112
Routes into volunteeringFigure 5.1 Reasons for starting to volunteer ............................................................................................................ 34
Table 5.1 Reasons for starting to volunteer, by age and sex .................................................................................... 35
Table 5.2 Reasons for starting to volunteer, by groups at risk of social exclusion .................................................... 36
Table 5.3 Reasons for involvement, by ethnicity of volunteers ................................................................................ 37
Table 5.4 Reasons for involvement, by type of volunteering activities ..................................................................... 38
Table 5.5 Routes into volunteering, by age and sex ................................................................................................ 39
Table 5.6 Routes into volunteering, by groups at risk of social exclusion ................................................................ 40
Table 5.7 Routes into volunteering, by ethnicity ..................................................................................................... 41
Table 5.8 Routes into volunteering, by types of volunteering activities .................................................................... 42
Table 5.9 Sources of information on volunteering, by age and sex ......................................................................... 43
Table A.5.1 Sources of information on volunteering, by groups at risk of social exclusion .......................................... 113
Table A.5.2 Sources of information on volunteering, by ethnic origin ........................................................................ 113
128 Helping Out: A national survey of volunteering and charitable giving
The organisation of volunteeringTable 6.1 Need for advice and support ................................................................................................................... 45
Table 6.2 Need for advice and support, by type of volunteering activity ................................................................. 45
Table 6.3 Perceived adequacy of advice and support .............................................................................................. 45
Table 6.4 Reimbursement of expenses, by volunteer status .................................................................................... 46
Table 6.5 Reimbursement of expenses, comparison with previous studies .............................................................. 46
Table 6.6 Reimbursement of expenses for those incurring expenses, by volunteer status ........................................ 46
Figure 6.1 Reasons for non-reimbursement of expenses .......................................................................................... 47
Table 6.7 Receipt of training, by volunteer status ................................................................................................... 47
Table 6.8 Receipt of training, by type of volunteering activity ................................................................................. 48
Figure 6.2 Perceived adequacy of training ................................................................................................................ 48
Table 6.9 Experience of interview prior to volunteering, by volunteer status ........................................................... 49
Table 6.10 Being asked to interview, by type of volunteering activity ....................................................................... 49
Table 6.11 Attitudes towards interviews ................................................................................................................... 49
Table 6.12 Participation in different volunteer recruitment practices, by volunteer status .......................................... 50
Table 6.13 Participation in different volunteer recruitment practices, by age and sex ................................................ 50
Table 6.14 Participation in different volunteer recruitment practices, by volunteer activity ........................................ 51
Table 6.15 Reflections on different aspects of volunteer management ..................................................................... 52
Table 6.16 Experience of risk and risk management, by volunteer status .................................................................. 53
Table 6.17 Experience of risk and risk management, by age and sex ........................................................................ 53
Table 6.18 Experience of risk and risk management, by type of volunteering activity ............................................... 54
Table 6.19 The opportunity to manage others, by volunteer status .......................................................................... 54
Table A.6.1 Need and availability of advice and support, by type of organisation ...................................................... 114
Table A.6.2 Reimbursement of expenses, by type of help .......................................................................................... 114
Table A.6.3 Whether incurred expenses, by type of organisation ............................................................................... 114
Table A.6.4 Participation in different volunteer recruitment practices, by type of organisation ................................... 115
Table A.6.5 Experience of risk and risk management, by type of organisation ........................................................... 115
Benefits and drawbacks of volunteeringTable 7.1 The highs and lows of volunteering ........................................................................................................ 56
Table 7.2 The highs and lows of volunteering, by age and sex ............................................................................... 57
Table 7.3 The highs and lows of volunteering, by ethnicity ..................................................................................... 58
Figure 7.1 Importance of receiving recognition ........................................................................................................ 58
Table 7.4 Importance of recognition, by age and sex ............................................................................................. 59
Table 7.5 Importance of recognition, by ethnicity ................................................................................................... 59
Table 7.6 Types of recognition ................................................................................................................................ 60
Table 7.7 Receiving qualifications for volunteering, by age and sex ........................................................................ 60
Table 7.8 Receiving qualifications for volunteering, by ethnicity .............................................................................. 61
Table 7.9 The personal benefits of volunteering ..................................................................................................... 61
Table 7.10 The personal benefits of volunteering, by age and sex ............................................................................ 62
Table 7.11 The personal benefits of volunteering, by ethnicity ................................................................................. 63
Table A.7.1 The highs and lows of volunteering, by type of volunteering activities .................................................... 116
Table A.7.2 Importance of recognition, by groups at risk of social exclusion .............................................................. 117
Table A.7.3 Receiving qualifications for volunteering, by groups at risk of social exclusion ......................................... 117
Table A.7.4 The personal benefits of volunteering, by groups at risk of social exclusion ............................................. 118
Appendix D: Index of tables and figures 129
Limitations to volunteeringFigure 8.1 Volunteer status over time ...................................................................................................................... 64
Table 8.1 Reasons for stopping volunteering .......................................................................................................... 65
Table 8.2 Desire to spend more time volunteering, by age and sex ........................................................................ 65
Figure 8.2 Desire to spend more time volunteering, by ethnicity .............................................................................. 66
Table 8.3 Likely responses if asked to help ............................................................................................................. 66
Table 8.4 Likelihood of commencing volunteering in a year or two ........................................................................ 66
Table 8.5 Forms of volunteering that respondents would consider, by age and sex ................................................ 67
Table 8.6 Forms of volunteering that respondents would consider, by ethnicity ...................................................... 67
Table 8.7 Reasons for not volunteering .................................................................................................................. 68
Table 8.8 Reasons for not volunteering, by age and sex ......................................................................................... 69
Table 8.9 Reasons for not volunteering, by ethnicity ............................................................................................... 70
Figure 8.3 Things that would make it easier to get involved .................................................................................... 70
Table 8.10 Making it easier to get involved, by age and groups at risk of social exclusion ........................................ 71
Table A.8.1 Desire to spend more time volunteering, by groups at risk of social exclusion ......................................... 119
Table A.8.2 Areas in which respondents would consider volunteering, by groups at risk of social exclusion ............... 119
Table A.8.3 Reasons for not volunteering, by groups at risk of social exclusion .......................................................... 120
Table A.8.4 Things that would make it easier to get involved .................................................................................... 120
Employer-supported volunteeringFigure 9.1 Proportion of employees with available schemes ..................................................................................... 72
Table 9.1 Proportion of employees with available schemes, by size and sector of employer .................................... 73
Table 9.2 How time is treated in employer-supported volunteering schemes .......................................................... 73
Table 9.3 Participation in employer-supported volunteering and giving schemes .................................................... 74
Table 9.4 Frequency of participation in employer-supported volunteering schemes ................................................. 74
Figure 9.2 Benefits of participation in employer-supported volunteering schemes .................................................... 74
Table 9.5 Whether respondents would like their employer to have a scheme, by age and sex ................................ 75
Table 9.6 Factors that would encourage people to take part in employer-supported volunteering schemes ............ 75
Table 9.7 Results from the 1997 National Survey of Volunteering: Factors that would encourage people to take
part in employer-supported volunteering schemes .................................................................................. 76
The extent of charitable givingFigure 10.1 Extent of charitable giving in the last four weeks and in the last year ..................................................... 77
Table 10.1 Extent of charitable giving in the last four weeks and in the last year, by method of donation ................ 78
Table 10.2 Average amount donated in the last four weeks ..................................................................................... 78
Table 10.3 Average amount donated per donor in the last four weeks, by method .................................................. 79
Table 10.4 Extent of charitable giving in the last year, by cause supported ............................................................... 80
Table 10.5 Extent of charitable giving and average amount donated per donor in the last four weeks (95%
confidence intervals): comparison of Helping Out, Citizenship Survey and NCVO-CAF studies ................ 80
Who gives?Table 11.1 Extent of charitable giving in the last four weeks, by age ........................................................................ 82
Table 11.2 Extent of charitable giving in the last four weeks, by sex ........................................................................ 83
Table 11.3 Causes donated to, by age and sex ......................................................................................................... 83
Table 11.4 Extent of charitable giving in the last four weeks, by employment status ................................................ 84
Table 11.5 Extent of charitable giving in the last four weeks, by respondent’s income .............................................. 84
130 Helping Out: A national survey of volunteering and charitable giving
Table 11.6 Extent of charitable giving in the last four weeks, by religion and religious activity ................................. 85
Table 11.7 Extent of charitable giving in the last four weeks, by ethnic origin .......................................................... 85
Table 11.8 Extent of religious giving, by ethnic origin ............................................................................................... 86
Table 11.9 Methods of donating, by ethnic origin .................................................................................................... 86
Table 11.10 Causes donated to, by ethnic origin ........................................................................................................ 87
Table 11.11 Extent of charitable giving in the last four weeks, by groups at risk of social exclusion ........................... 87
Table 11.12 Extent of charitable giving in the last four weeks, by Government Office region ..................................... 88
Tax-efficient methods of givingFigure 12.1 Awareness of tax-efficient methods of giving .......................................................................................... 89
Table 12.1 Awareness of tax-efficient methods of giving, by income ........................................................................ 90
Table 12.2 Awareness of tax-efficient methods of giving, by employment status ...................................................... 90
Table 12.3 Awareness of tax-efficient methods of giving, by age ............................................................................. 91
Table 12.4 Awareness of tax-efficient methods of giving, by ethnic origin ................................................................ 91
Table 12.5 Use of tax-efficient methods of giving in the last 12 months ................................................................... 91
Table 12.6 Use of Gift Aid and payroll giving, by income ......................................................................................... 92
Table 12.7 Use of Gift Aid and payroll giving, by employment status and reason for not working ............................ 92
Table 12.8 Use of Gift Aid and payroll giving, by age ............................................................................................... 93
Table 12.9 Use of Gift Aid and payroll giving, by ethnic origin ................................................................................. 93
Figure 12.2 Proportion making arrangements to leave charitable legacy, by age ........................................................ 93
Table 12.10 Reasons for not using tax-efficient methods of giving ............................................................................. 94
Table A.12.1 Awareness of tax-efficient methods of giving .......................................................................................... 121
Table A.12.2 Whether respondent has made or would consider making arrangements to leave charitable legacies ..... 121
Table A.12.3 Use of Gift Aid and payroll giving, by sex ................................................................................................ 121
Motivations for and barriers to charitable givingFigure 13.1 Reasons for donating in the last four weeks ............................................................................................ 96
Table 13.1 Reasons for donating in the last four weeks, by age ............................................................................... 97
Table 13.2 Reasons for donating in the last four weeks, by ethnic origin ................................................................. 97
Figure 13.2 Changes in the frequency and amount of donations since 2000 ............................................................. 98
Table 13.3 Reasons for increasing donations since 2000 .......................................................................................... 98
Table 13.4 Proportion of donors increasing donations since 2000, by age and income ............................................. 99
Table 13.5 Proportion of direct debit donors asked to increase donations, and who agreed or would agree
to do so .................................................................................................................................................. 99
Table 13.6 Reasons for not donating or for decreasing donations ............................................................................ 100
Table 13.7 Factors likely to encourage charitable giving, by donor status ................................................................. 100
Table 13.8 Factors likely to encourage donations, by age ......................................................................................... 101
Table 13.9 Factors likely to encourage donations, by income ................................................................................... 101
Table 13.10 Factors likely to encourage donations, by ethnic origin ........................................................................... 102
Table A.13.1 Reasons for donating in the last four weeks, by sex ................................................................................ 122
Table A.13.2 Reasons for donating in the last four weeks, by income .......................................................................... 123
Table A.13.3 Reasons for donating, by cause ............................................................................................................... 124
Table A.13.4 Proportion of donors increasing donations since 2000, by sex and ethnic origin ..................................... 125
Appendix D: Index of tables and figures 131
The link between volunteering and charitable givingFigure 14.1 Levels of helping and donating ............................................................................................................... 103
Table 14.1 Levels of helping and donating, by age and sex ...................................................................................... 104
Table 14.2 Levels of helping and donating, by religion and religious activity ............................................................. 104
Table 14.3 Levels of helping and donating, by cause ................................................................................................ 105
Table 14.4 Giving money to organisations helped .................................................................................................... 106
Table 14.5 Giving money to other organisations ...................................................................................................... 106
Table 14.6 Likelihood of giving money to organisations helped ................................................................................ 106
Table 14.7 Reasons why more likely to donate to organisations helped .................................................................... 106
Table 14.8 Donating as a substitute for volunteering, by age ................................................................................... 107
Figure 14.2 Whether those giving money should be encouraged to give time as well ................................................ 107
Table 14.9 Volunteering as a substitute for donating, by religion and religious activity ............................................. 108
Figure 14.3 Whether those giving unpaid help should be encouraged to give money as well .................................... 108
Table 14.10 Perceived commitment shown by giving time or money, by age and sex ................................................. 109
Table 14.11 Perceived commitment shown by giving time or money, by income ........................................................ 109
Table 14.12 Perceived value to charity of giving time or money, by age and sex ......................................................... 109
Table A.14.1 Donating as a substitute for volunteering, by employment status ........................................................... 125
Table A.14.2 Perceived value to charity of giving time or money, by income ................................................................ 125
To order a copy of this report, please call 0845 015 0010 and quote URN 07/Z6 and the title of the publication. Please
note that stocks are limited.
If you have further enquiries regarding the content of this document please contact the Third Sector Research Team.