49
JUNE 2020
JUNE 2020

Disclaimer
No representation or warranty, express or implied is made as to, and no reliance should be placed on the fairness, accuracy, completeness orcorrectness of such information or opinions contained herein. The information contained in this presentation is only current as of its date. Certainstatements made in this presentation may not be based on historical information or facts and may be “forward looking statements”, including thoserelating to the bank’s general business plan’s and strategy, its future financial condition and growth prospects and future developments in the industryrelating to the bank’s general business plan’s and strategy, its future financial condition and growth prospects and future developments in the industryand regulatory environment. Actual results may differ materially from these forward-looking statements due to a number of factors, including futurechanges or developments in the bank’s business, its competitive environment and political, economic, legal and social conditions in India. Thiscommunication is for general information purpose only, without regard to specific objectives, financial situations and needs of any particular person. Thispresentation does not constitute an offer or invitation to purchase or subscribe for any shares in the bank and neither any part of it shall form the basisof or be relied upon in connection with any contract or commitment whatsoever. The bank may alter, modify or otherwise change in any manner thecontent of this presentation, without obligation to notify any person of such revisions or changes. This presentation should not be copied and/ordisseminated in any manner.
2
TABLE OF CONTENTS
Overview Performance Highlights – Financial Performance &
4 10 14
Overview
Branch Network
Performance Highlights –June 2020
Shareholding Pattern
Financial Performance &Business Profile
Corporate Governance
42 44 46
3
Covid Outbreak
36

OVERVIEWOVERVIEW
4

Deposits
INR 41,026 CR
Advances
INR 34,536 CR
Net Interest Margin
3.98%
OVERVIEW
City Union Bank Ltd., the oldest Private Sector Bank in India, was founded on October 31, 1904 and is headquartered atKumbakonam,Tamil Nadu, India.
The main focus of the Bank – lending to MSME, Retail / WholesaleTrade with granular asset profile including providing short termand long term loans to agricultural sector.
FACTS & FIGURES
Position as on 30.06.2020
INR 41,026 CR
Net NPA
2.11%
ATM’s
1,788
Employees
5,743
Efficiency Ratio
40.42%
Branches
700
INR 34,536 CR 3.98%
5

KEY MILESTONES
2017
Scheduled bank since 22.03.1945
Amalgamation of ‘TheCity Forward Bank Limited’ & ‘The Union Bank Limited’ with our Bank
Entered into agreement withTCS for core banking solution “Quartz”
Preferential allotment for equity shares strengtheningbank’s capital funds
Rights Issue @ 1 : 4-to reward the existing shareholders & employees under “Employee Reservation Scheme”
Bonus Issue@ 1 : 10 -rewardedto the existing Shareholders
1904
1945
1957
1965
1998 2003
2007
2009
2012
2014
2017
2018&2002
Incorporationof the Bank
Took over CommonWealth Bank Limited
Initial Public Offering (IPO); Listing bank’sshares on theBSE, NSE &MSE
Obtained licenses to act as a agent for procuring life insurance & general insurance business
Rights Issue @ 1 : 4 - toreward the existing shareholders
RaisedINR Rs.3,500 mn in Equity capital Through QIP route
6

SME / MSMEfocus
Invested in Robust Infrastructure
Prudent Risk Management
Purely retail Liability Franchise
SME/MSME specializedbusiness model focusingon large untappedsegment
Segment consistently
SME exposures’ result ingranular asset profile
Granular deposit base withhigh retention rates result instable liability profile
Comprehensiveemployee trainingand recruitmentinfrastructure throughstaff training college
No Certificate of Deposit
No reliance on Corporate
bulk deposits
CITY UNION BANK -A SPECIALIZED BANKING MODELALIGNEDTOTARGET
SEGMENT – SME / MSME
Segment consistentlydelivering higher yields
Superior client servicingleading to client retentionand low businessacquisition costs
stable liability profile
SME / MSME Loans resultin lower NPA as they are:
Additionally collateralisedby residential property andpersonal guarantees etc.
Predominantly singlebanker relationshipswith minimal exposureto consortium / multiplebanking arrangements /infrastructure lendings.
staff training college
All branches and 100%business under CBSfromTCS
10 year CAGR of 20%+ Consistent Return with Superior ROA, ROE
7

COMPETITIVE ADVANTAGES
STRONG TRACK RECORD
Continuous profitability and dividend payout in all 115+ years of operationsBusiness growth of 20%+ CAGR in last 10 years
ROBUST CORPORATE GOVERNANCE PRACTICESADEQUATELYCAPITALISED
NETWORKPan India presence with 700 branches
Strong presence in South India (628 branches)of which 485 are in Tamil Nadu alone
GOVERNANCE PRACTICES
Strong board with majority of directors being independent directors Consistency in management with only 7 CEOs appointed in 100+ years
DIVERSIFIED ASSETPROFILE
Granular asset profile with advances to top 20 group borrowers contributing around 8.11%Lower ticket size lending backed by adequatecollaterals
HIGHER YIELDING LOAN PORTFOLIO
Trading and MSME loan segments earninghigh yields constitute about 47% of advances
ADEQUATELYCAPITALISEDStrong Capital Adequacy ratio of 16.77% out of whichTier 1 constitutes 15.69%
8
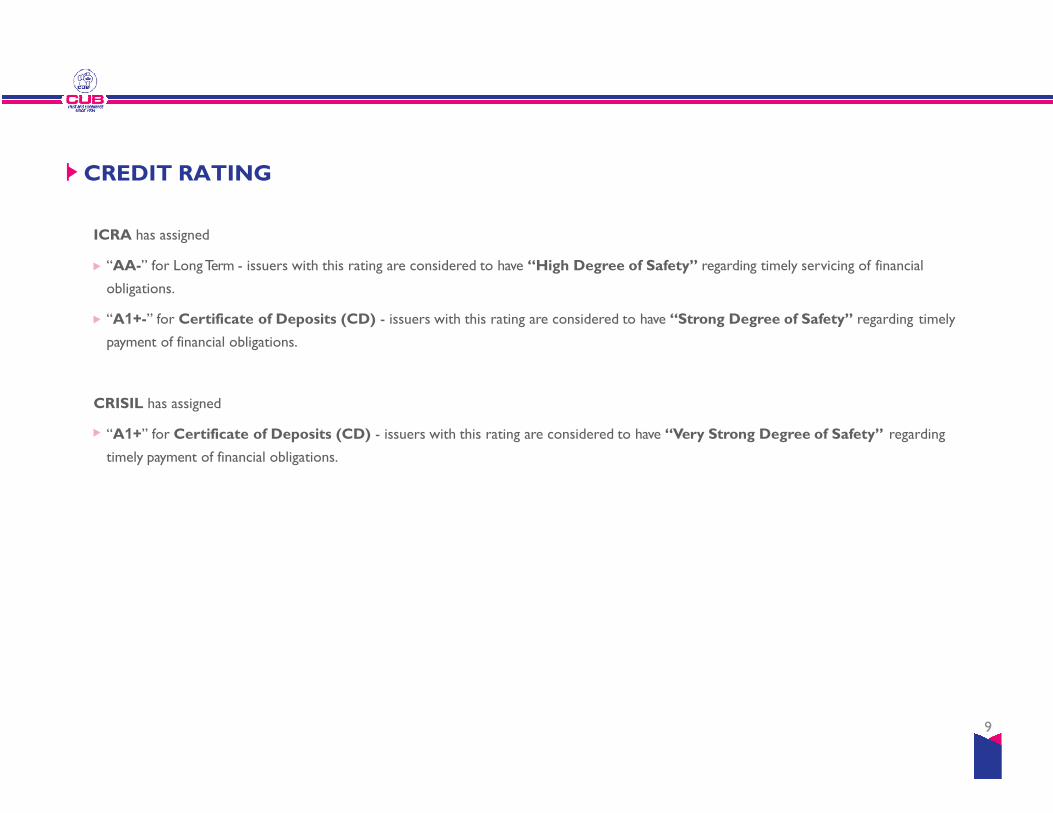
CREDIT RATING
ICRA has assigned
“AA-” for Long Term - issuers with this rating are considered to have “High Degree of Safety” regarding timely servicing of financial
obligations.
“A1+-” for Certificate of Deposits (CD) - issuers with this rating are considered to have “Strong Degree of Safety” regarding timely
payment of financial obligations.
CRISIL has assigned
9
CRISIL has assigned
“A1+” for Certificate of Deposits (CD) - issuers with this rating are considered to have “Very Strong Degree of Safety” regarding
timely payment of financial obligations.
9

PERFORMANCE HIGHLIGHTS – JUNE 2020PERFORMANCE HIGHLIGHTS – JUNE 2020
10
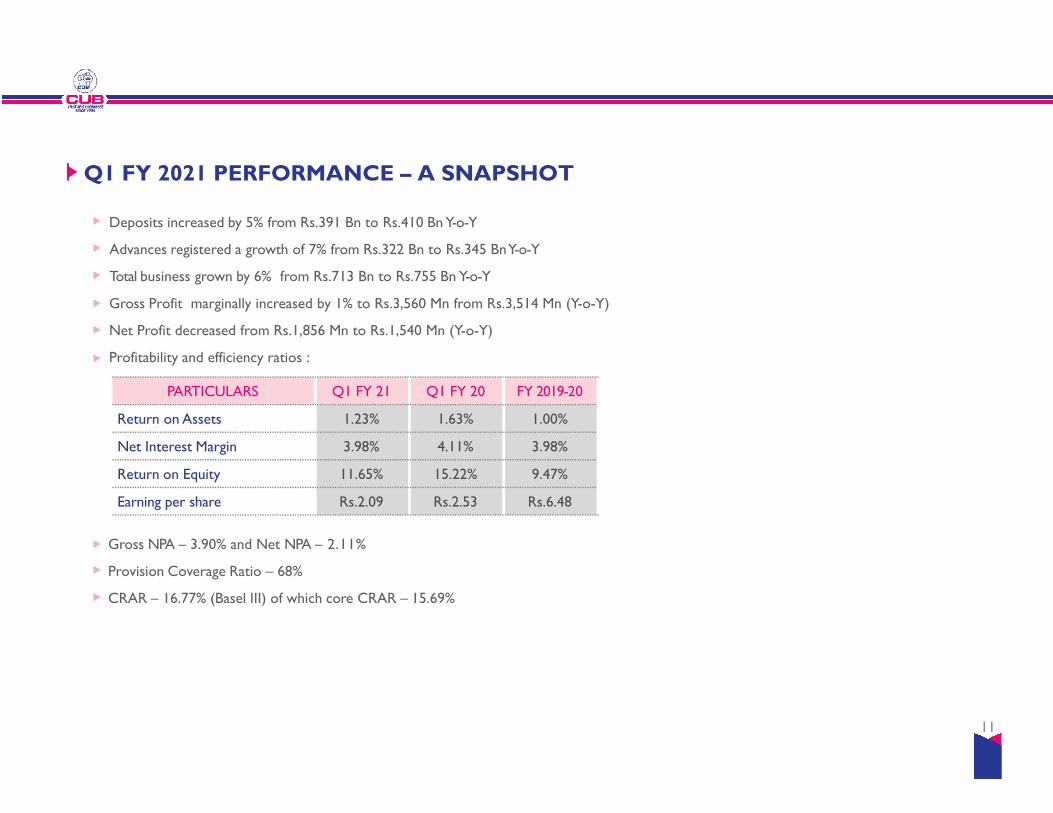
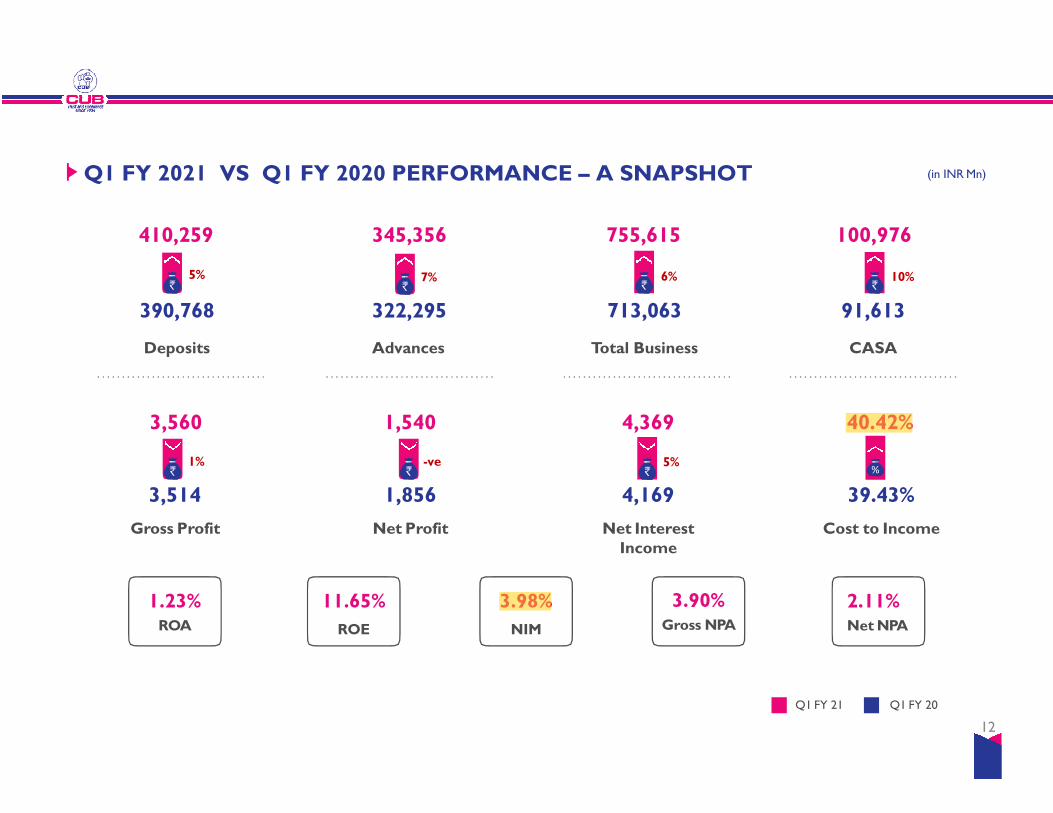
Q1 FY 2021 PERFORMANCE – A SNAPSHOT
Deposits increased by 5% from Rs.391 Bn to Rs.410 BnY-o-Y
Advances registered a growth of 7% from Rs.322 Bn to Rs.345 BnY-o-Y
Total business grown by 6% from Rs.713 Bn to Rs.755 Bn Y-o-Y
Gross Profit marginally increased by 1% to Rs.3,560 Mn from Rs.3,514 Mn (Y-o-Y)
Net Profit decreased from Rs.1,856 Mn to Rs.1,540 Mn (Y-o-Y)
Profitability and efficiency ratios :
PARTICULARS Q1 FY 21 Q1 FY 20 FY 2019-20
Gross NPA – 3.90% and Net NPA – 2.11%
Provision Coverage Ratio – 68%
CRAR – 16.77% (Basel III) of which core CRAR – 15.69%
11
Return on Assets 1.23% 1.63% 1.00%
Net Interest Margin 3.98% 4.11% 3.98%
Return on Equity 11.65% 15.22% 9.47%
Earning per share Rs.2.09 Rs.2.53 Rs.6.48
Q1 FY 2021 VS Q1 FY 2020 PERFORMANCE – A SNAPSHOT
410,259
390,768
Deposits
5%
345,356
322,295
Advances
755,615
713,063
Total Business
6%
100,976
91,613
CASA
7% 10%
(in INRMn)
3,514
Gross Profit
1.23%ROA
11.65%
ROE
3.98%
NIM
3.90% Gross NPA
2.11%NetNPA
Q1 FY 21 Q1 FY 20
3,560 1,540
1,856
Net Profit
-ve
4,369
4,169
Net Interest Income
5%
40.42%
39.43%
Cost to Income
12
1%%
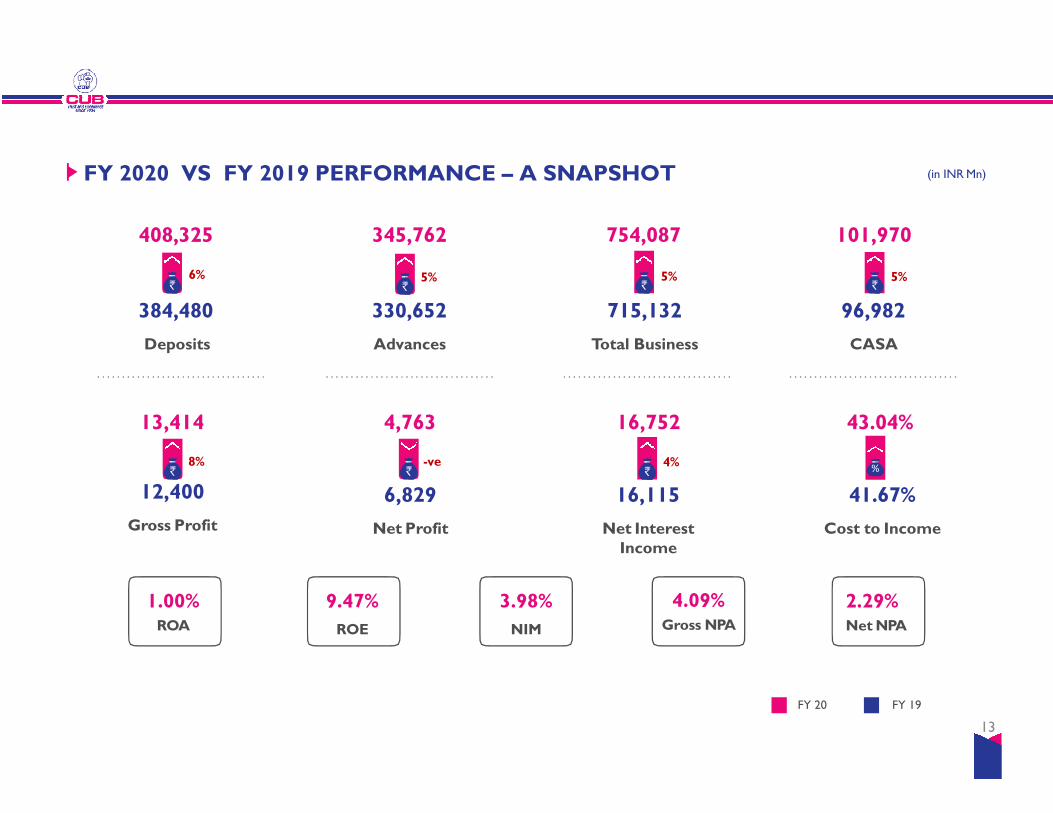
FY 2020 VS FY 2019 PERFORMANCE – A SNAPSHOT
408,325
384,480
Deposits
6%
345,762
330,652
Advances
754,087
715,132
Total Business
5%
101,970
96,982
CASA
5% 5%
(in INRMn)
12,400
Gross Profit
1.00%ROA
9.47%
ROE
3.98%
NIM
4.09% Gross NPA
2.29%NetNPA
FY 20 FY 19
13,414 4,763
6,829
Net Profit
-ve
16,752
16,115
Net Interest Income
4%
43.04%
41.67%
Cost to Income
13
8%%

FINANCIAL PERFORMANCE & BUSINESS PROFILEFINANCIAL PERFORMANCE & BUSINESS PROFILE
14
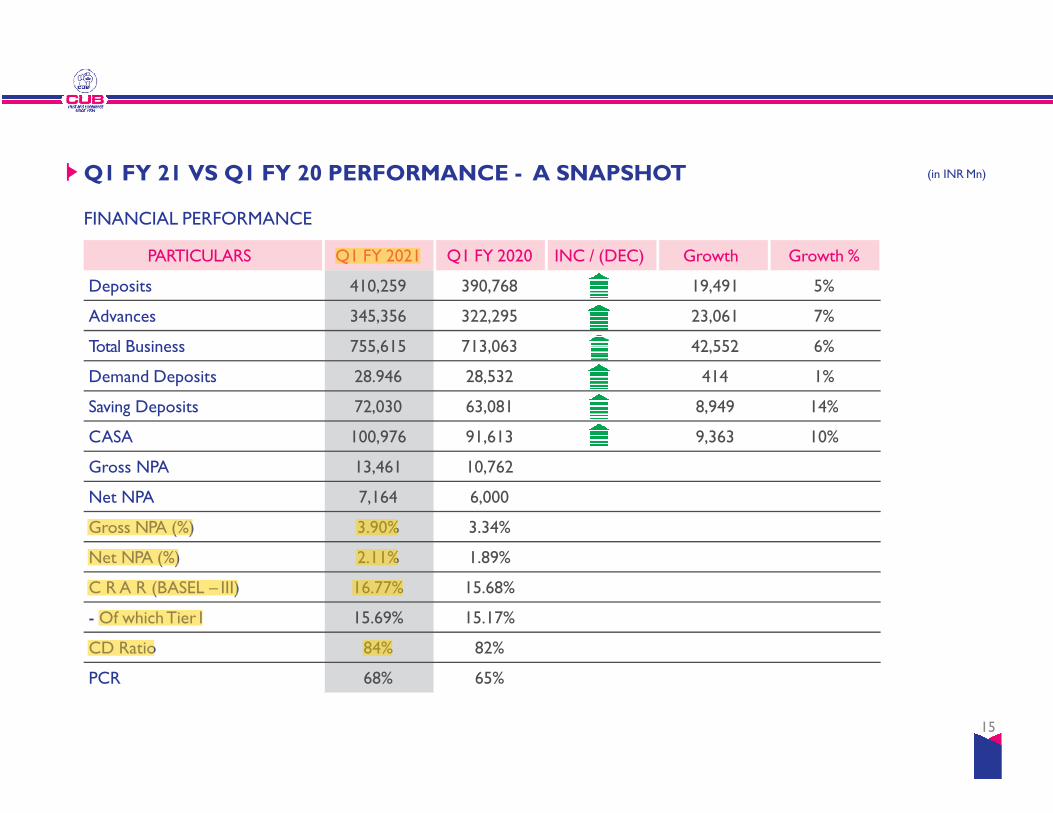
Q1 FY 21 VS Q1 FY 20 PERFORMANCE - A SNAPSHOT
FINANCIAL PERFORMANCE
PARTICULARS Q1 FY 2021 Q1 FY 2020 INC / (DEC) Growth Growth %
Deposits 410,259 390,768 19,491 5%
Advances 345,356 322,295 23,061 7%
Total Business 755,615 713,063 42,552 6%
Demand Deposits 28.946 28,532 414 1%
Saving Deposits 72,030 63,081 8,949 14%
(in INRMn)
Saving Deposits 72,030 63,081 8,949 14%
CASA 100,976 91,613 9,363 10%
Gross NPA 13,461 10,762
Net NPA 7,164 6,000
Gross NPA (%) 3.90% 3.34%
Net NPA (%) 2.11% 1.89%
C R A R (BASEL – III) 16.77% 15.68%
- Of which Tier I 15.69% 15.17%
CD Ratio 84% 82%
PCR 68% 65%
15

Q1 FY 21 VS Q1 FY 20 PERFORMANCE -A SNAPSHOT (in INRMn)
FINANCIAL PERFORMANCE
PARTICULARS Q1 FY 2021 Q1 FY 2020 INC / (DEC) Growth % Q4 FY 2020
Net Interest Income 4,369 4,169 200 5% 4,195
Other Income 1,606 1,633 -27 -ve 1,793
Operating Expenses 2,415 2,288 127 6% 2,637
Gross Profit 3,560 3,514 46 1% 3,351
Provisions & Contingencies 2,020 1,658 362 22% 4,304
Net Profit 1,540 1,856 -316 -ve -953
Return onAssets 1.23% 1.63% -0.77%
Return on Equity 11.65% 15.22% -7.22%
Net Interest Margin 3.98% 4.11% 3.91%
16

FY 20 VS FY 19 PERFORMANCE - A SNAPSHOT
FINANCIAL PERFORMANCE
PARTICULARS FY 2020 FY 2019 INC / (DEC) Growth Growth %
Deposits 408,325 384,480 23,845 6%
Advances 345,762 330,652 15,110 5%
Total Business 754,087 715,132 38,955 5%
Demand Deposits 29,244 32,145 -2,901 -ve
Saving Deposits 72,726 64,837 7,889 12%
(in INRMn)
Saving Deposits 72,726 64,837 7,889 12%
CASA 101,970 96,982 4,988 5%
Gross NPA 14,134 9,771
Net NPA 7,785 5,915
Gross NPA (%) 4.09% 2.95%
Net NPA (%) 2.29% 1.81%
C R A R (BASEL – III) 16.76% 15.55%
- Of which Tier I 15.80% 15.03%
CD Ratio 85% 86%
PCR 65% 63%
17

FY 20 VS FY 19 PERFORMANCE -A SNAPSHOT (in INRMn)
FINANCIAL PERFORMANCE
PARTICULARS FY 2020 FY 2019 INC / (DEC) Growth %
Net Interest Income 16,752 16,115 637 4%
Other Income 6,799 5,144 1,655 32%
Operating Expenses 10,137 8,859 1,278 14%
Gross Profit 13,414 12,400 1,014 8%
Provisions & Contingencies 8,651 5,571 3,080 55%
Net Profit 4,763 6,829 -2066 -ve
Return onAssets 1.00% 1.64%
Return on Equity 9.47% 15.25%
Net Interest Margin 3.98% 4.32%
18

PROVISIONS & CONTINGENCIES – BREAKUP (in INRMn)
PARTICULARS Q1 FY 21 Q1 FY 20 FY 19-20 FY 18-19 Q4 FY 20
Provision for:
-Tax 450 500 1,100 2,420 -200
- Bad Debts 500 1,440 6,310 2,700 3,105
- Covid 19 1,000 - 1,250 - 1,250
- Standard Assets 40 -37 193 215 80
- Depn on Investments - -240 -317 160 3
- Depn on Shifting - - - 65 -
- Restructuring / FITL 30 - 69 -96 25
- Others - -5 46 107 41
Total 2,020 1,658 8,651 5,571 4,304
19

(in INRMn)Q1 FY 21 VS Q1 FY 20 – INCOMEAND EXPENSES BREAKUP
INTEREST INCOME BREAKUP INTEREST EXPENSES BREAKUP
PARTICULARSQ1 FY2021
Q1 FY2020
Growth %
Interest on Loans 8,922 8,686 3%
Interest on Investments 1,400 1,411 -ve
Other Interest Income 171 195 -ve
Total Interest Income 10,493 10,292 2%
PARTICULARSQ1 FY2021
Q1 FY2020
Growth %
Int Exp on Deposits 5,899 5,945 -ve
Other Int Expenses 225 178 26%
Total InterestExpenses 6,124 6,123 -
20
OTHER INCOME BREAKUP OPERATING EXPENSES BREAKUP
Total Interest Income 10,493 10,292 2% Expenses 6,124 6,123 -
PARTICULARSQ1 FY2021
Q1 FY2020
Growth %
Employee Cost 1,164 1,004 16%
Other Operating Expenses
1,251 1,284 -ve
Total Expenses 2,415 2,288 6%
PARTICULARSQ1 FY2021
Q1 FY2020
Growth %
CEB & Charges 456 796 -ve
Treasury Income 1,085 446 143%
Other Inc incl recoveries in written off a/cs
65 391 -ve
Total Other Income 1,606 1,633 -ve
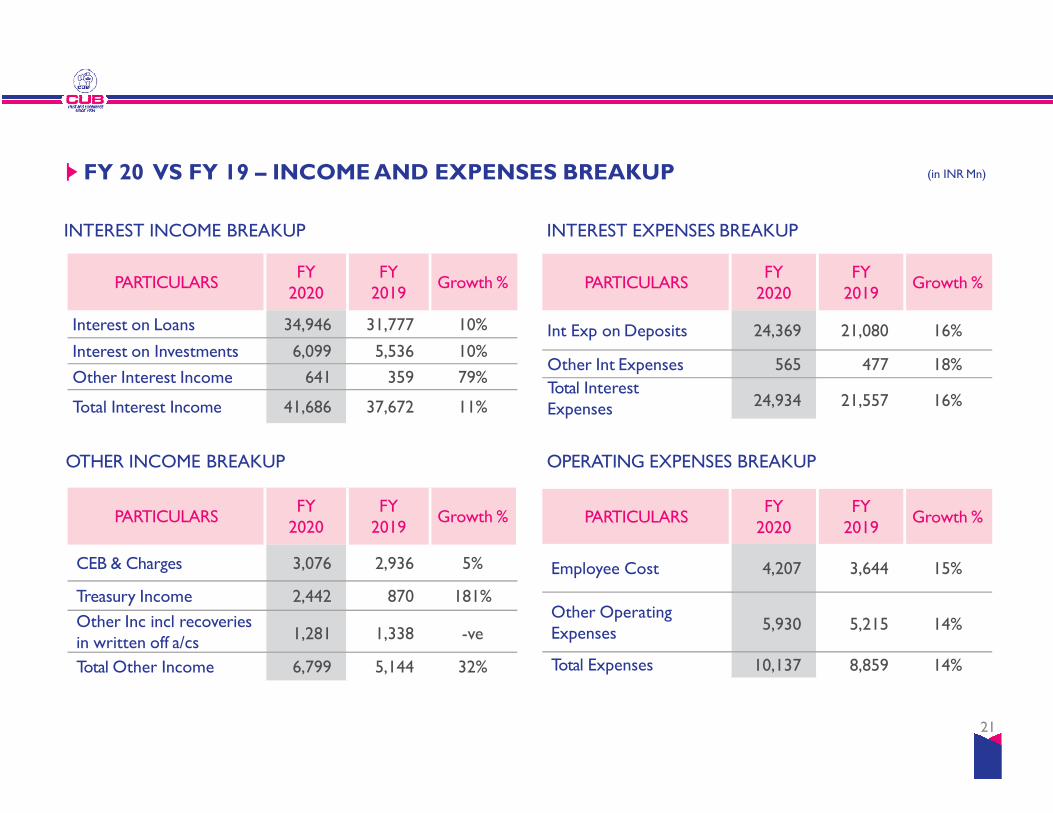
(in INRMn)FY 20 VS FY 19 – INCOMEAND EXPENSES BREAKUP
INTEREST INCOME BREAKUP INTEREST EXPENSES BREAKUP
PARTICULARSFY
2020FY
2019Growth %
Interest on Loans 34,946 31,777 10%
Interest on Investments 6,099 5,536 10%
Other Interest Income 641 359 79%
Total Interest Income 41,686 37,672 11%
PARTICULARSFY
2020FY
2019Growth %
Int Exp on Deposits 24,369 21,080 16%
Other Int Expenses 565 477 18%
Total InterestExpenses 24,934 21,557 16%
21
OTHER INCOME BREAKUP OPERATING EXPENSES BREAKUP
Total Interest Income 41,686 37,672 11% Expenses 24,934 21,557 16%
PARTICULARSFY
2020FY
2019Growth %
Employee Cost 4,207 3,644 15%
Other Operating Expenses
5,930 5,215 14%
Total Expenses 10,137 8,859 14%
PARTICULARSFY
2020FY
2019Growth %
CEB & Charges 3,076 2,936 5%
Treasury Income 2,442 870 181%
Other Inc incl recoveries in written off a/cs
1,281 1,338 -ve
Total Other Income 6,799 5,144 32%

STRONG DEPOSITS AND ADVANCES GROWTH (in INRMn)
DEPOSITS ADVANCES
301,157328,526
384,480 408,325 410,259
11%CAGR
241,125282,386
330,652 345,762 345,356
13%CAGR
542,282610,912
715,132 754,087 755,615
BUSINESS CASA
70,39079,567
96,982 101,970 100,976
17%CAGR
12%CAGR
22
31-MAR-2017 31-MAR-2018 31-MAR-2019 31-MAR-2020 30-JUN-2020 31-MAR-2017 31-MAR-2018 31-MAR-2019 31-MAR-2020 30-JUN-2020
31-MAR-2017 31-MAR-2018 31-MAR-2019 31-MAR-2020 30-JUN-2020 31-MAR-2017 31-MAR-2018 31-MAR-2019 31-MAR-2020 30-JUN-2020
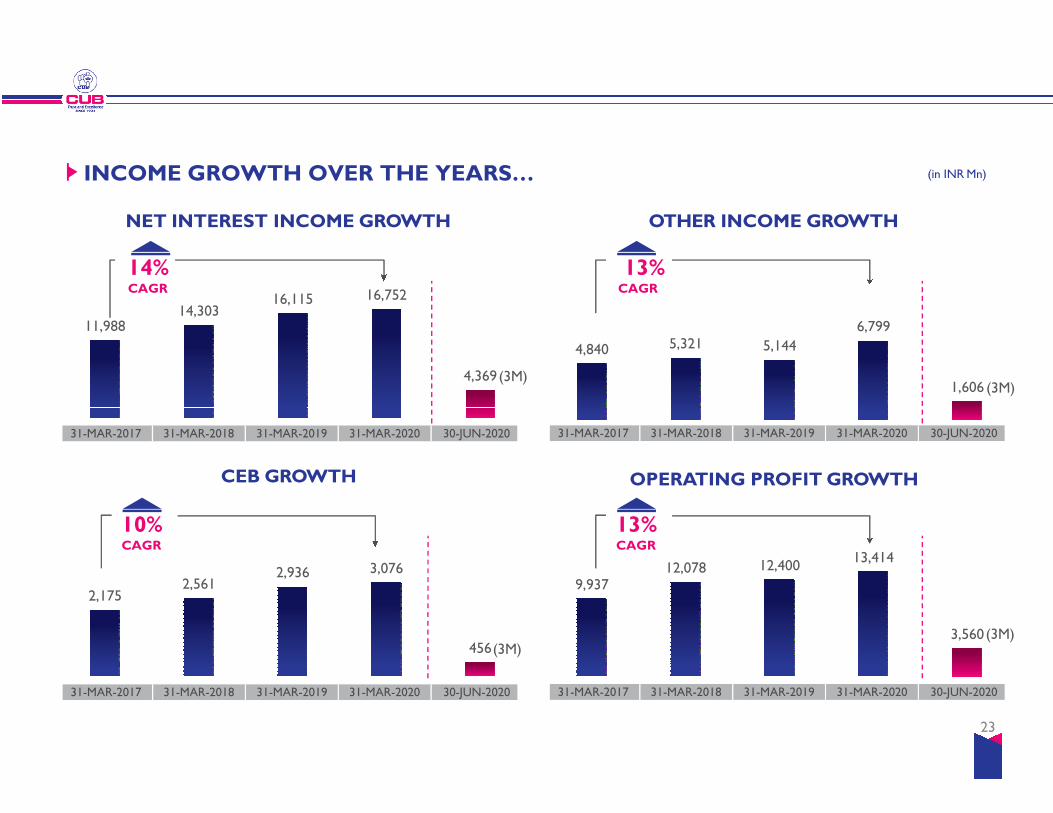
4,840 5,321 5,144
6,799
1,606
11,98814,303
16,115 16,752
4,369
INCOME GROWTH OVER THE YEARS… (in INRMn)
NET INTEREST INCOME GROWTH OTHER INCOME GROWTH
14%CAGR
13%CAGR
(3M)(3M)
2,1752,561
2,936 3,076
456
9,93712,078 12,400
13,414
3,560
CEB GROWTH OPERATING PROFIT GROWTH
13%CAGR
10%CAGR
(3M)(3M)
23
31-MAR-2017 31-MAR-2018 31-MAR-2019 31-MAR-2020 30-JUN-2020 31-MAR-2017 31-MAR-2018 31-MAR-2019 31-MAR-2020 30-JUN-2020
31-MAR-2017 31-MAR-2018 31-MAR-2019 31-MAR-2020 30-JUN-2020 31-MAR-2017 31-MAR-2018 31-MAR-2019 31-MAR-2020 30-JUN-2020
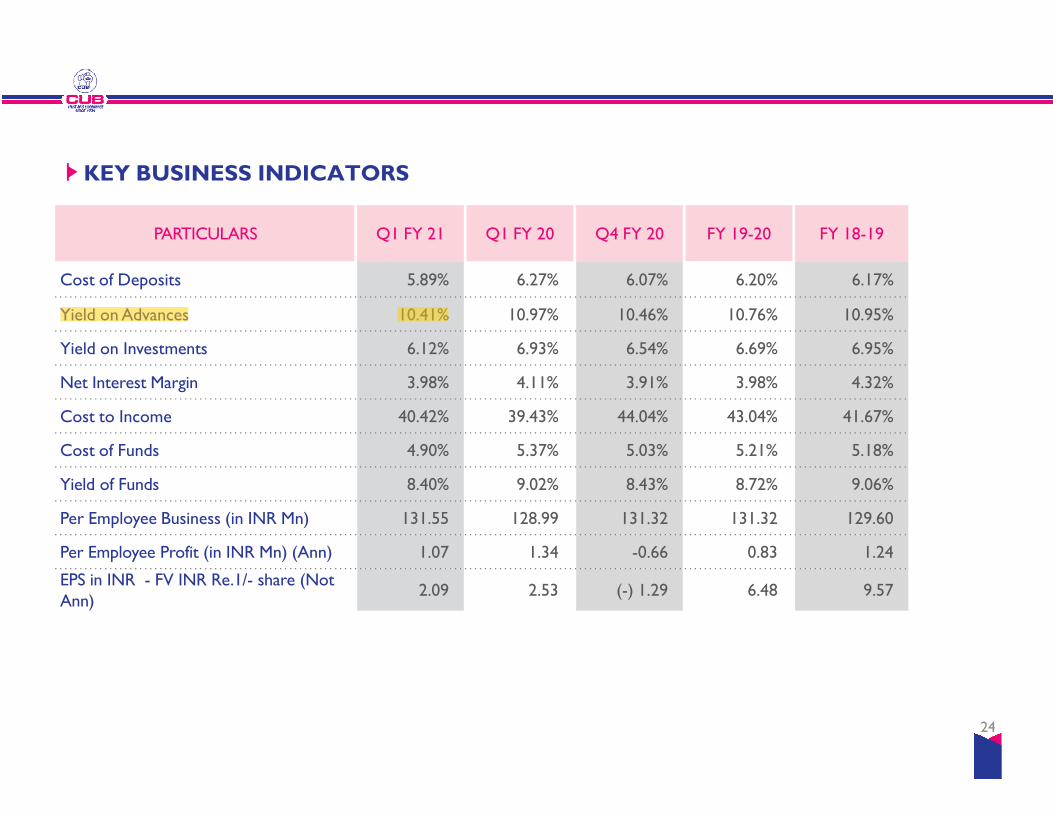
KEY BUSINESS INDICATORS
PARTICULARS Q1 FY 21 Q1 FY 20 Q4 FY 20 FY 19-20 FY 18-19
Cost of Deposits 5.89% 6.27% 6.07% 6.20% 6.17%
Yield on Advances 10.41% 10.97% 10.46% 10.76% 10.95%
Yield on Investments 6.12% 6.93% 6.54% 6.69% 6.95%
Net Interest Margin 3.98% 4.11% 3.91% 3.98% 4.32%
Cost to Income 40.42% 39.43% 44.04% 43.04% 41.67%
24
Cost to Income 40.42% 39.43% 44.04% 43.04% 41.67%
Cost of Funds 4.90% 5.37% 5.03% 5.21% 5.18%
Yield of Funds 8.40% 9.02% 8.43% 8.72% 9.06%
Per Employee Business (in INR Mn) 131.55 128.99 131.32 131.32 129.60
Per Employee Profit (in INR Mn) (Ann) 1.07 1.34 -0.66 0.83 1.24
EPS in INR - FV INR Re.1/- share (Not Ann)
2.09 2.53 (-) 1.29 6.48 9.57
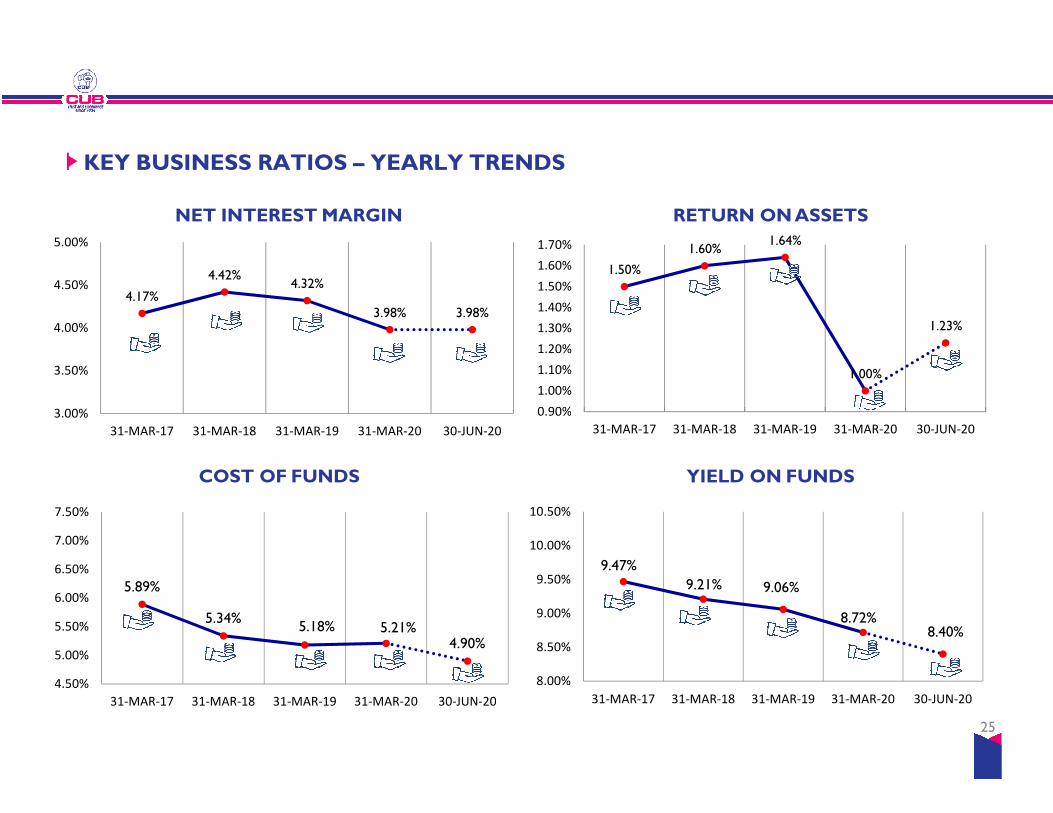
KEY BUSINESS RATIOS – YEARLY TRENDS
NET INTERESTMARGIN RETURN ONASSETS
4.17%
4.42%4.32%
3.98% 3.98%
3.00%
3.50%
4.00%
4.50%
5.00%
1.50%
1.60%1.64%
1.00%
1.23%
0.90%
1.00%
1.10%
1.20%
1.30%
1.40%
1.50%
1.60%
1.70%
COST OF FUNDS
25
3.00%
31-MAR-17 31-MAR-18 31-MAR-19 31-MAR-20 30-JUN-20
5.89%
5.34%5.18% 5.21%
4.90%
4.50%
5.00%
5.50%
6.00%
6.50%
7.00%
7.50%
31-MAR-17 31-MAR-18 31-MAR-19 31-MAR-20 30-JUN-20
0.90%
31-MAR-17 31-MAR-18 31-MAR-19 31-MAR-20 30-JUN-20
YIELD ON FUNDS
9.47%
9.21% 9.06%
8.72%8.40%
8.00%
8.50%
9.00%
9.50%
10.00%
10.50%
31-MAR-17 31-MAR-18 31-MAR-19 31-MAR-20 30-JUN-20

COST OF DEPOSITS & YIELD ON ADVANCES
12.47
13.56 13.49 13.43 13.1812.83
12.1011.46
10.95 10.7610.41
8.118.44 8.37 8.15
10
12
14
16
(in %)
Spread between cost of deposits and yield on advances of our bank maintained in the last 10 years
26
6.94
8.118.44 8.37 8.15
7.62
6.826.29 6.17 6.20
5.89
0
2
4
6
8
Mar 11 Mar 12 Mar 13 Mar 14 Mar 15 Mar 16 Mar 17 Mar 18 Mar 19 Mar 20 Jun 20
Yield on Advances
Cost of Deposits
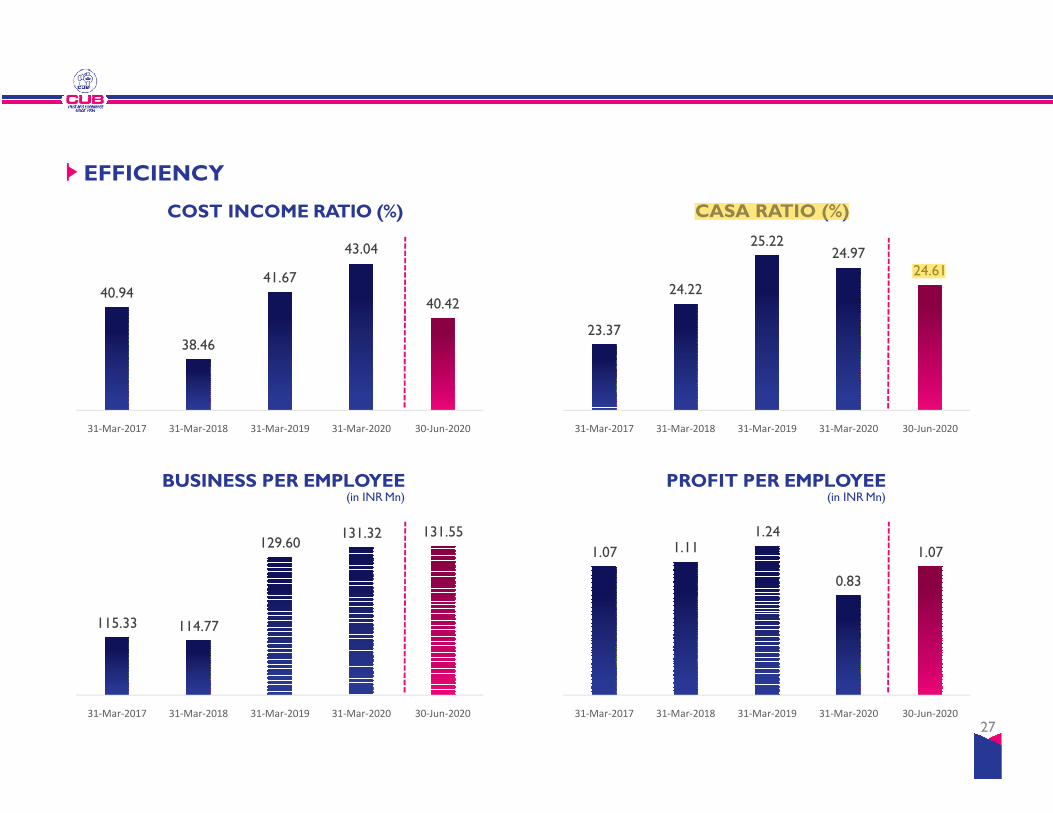
EFFICIENCY
COST INCOME RATIO (%)
40.94
38.46
41.67
43.04
40.42
23.37
24.22
25.2224.97
24.61
CASA RATIO (%)
BUSINESS PER EMPLOYEE(in INRMn)
PROFIT PER EMPLOYEE(in INRMn)
27
31-Mar-2017 31-Mar-2018 31-Mar-2019 31-Mar-2020 30-Jun-2020 31-Mar-2017 31-Mar-2018 31-Mar-2019 31-Mar-2020 30-Jun-2020
1.07 1.111.24
0.83
1.07
31-Mar-2017 31-Mar-2018 31-Mar-2019 31-Mar-2020 30-Jun-2020
115.33 114.77
129.60131.32 131.55
31-Mar-2017 31-Mar-2018 31-Mar-2019 31-Mar-2020 30-Jun-2020
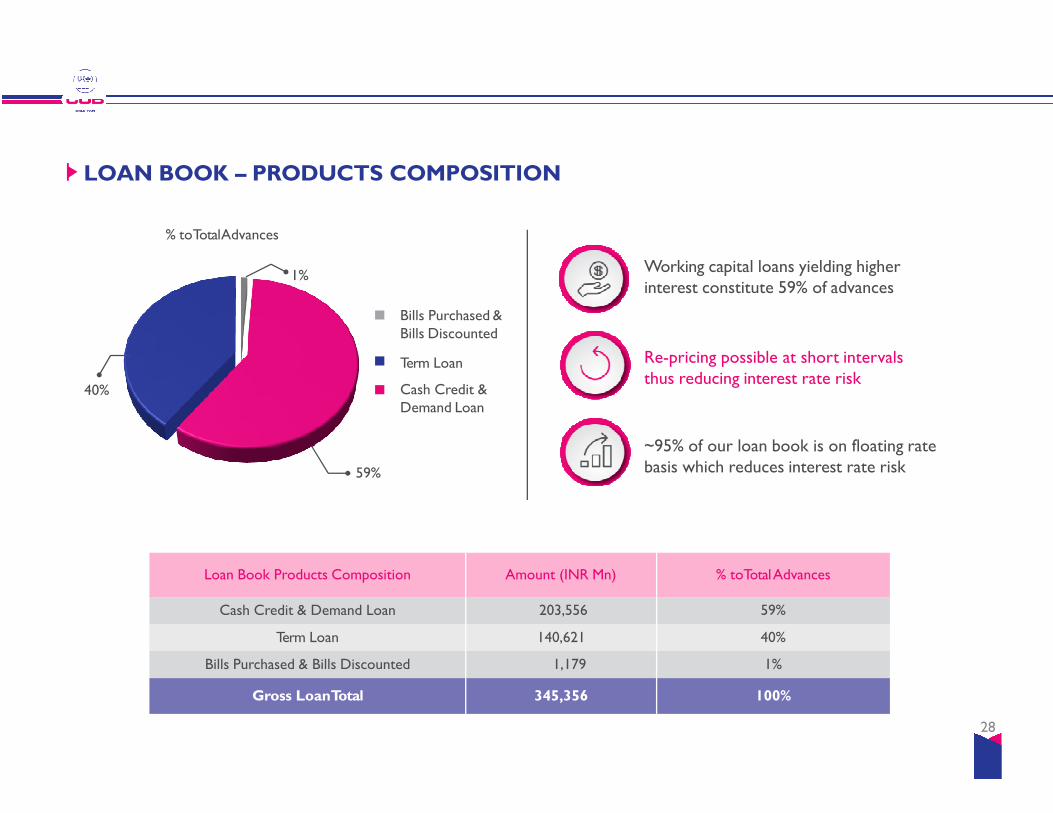
LOAN BOOK – PRODUCTS COMPOSITION
% toTotalAdvances
Working capital loans yielding higher interest constitute 59% of advances
Re-pricing possible at short intervalsthus reducing interest rate risk
Bills Purchased & Bills Discounted
Term Loan
Cash Credit & Demand Loan
1%
40%
~95% of our loan book is on floating ratebasis which reduces interest rate risk
Demand Loan
59%
Loan Book Products Composition Amount (INR Mn) % toTotal Advances
Cash Credit & Demand Loan 203,556 59%
Term Loan 140,621 40%
Bills Purchased & Bills Discounted 1,179 1%
Gross LoanTotal 345,356 100%
28
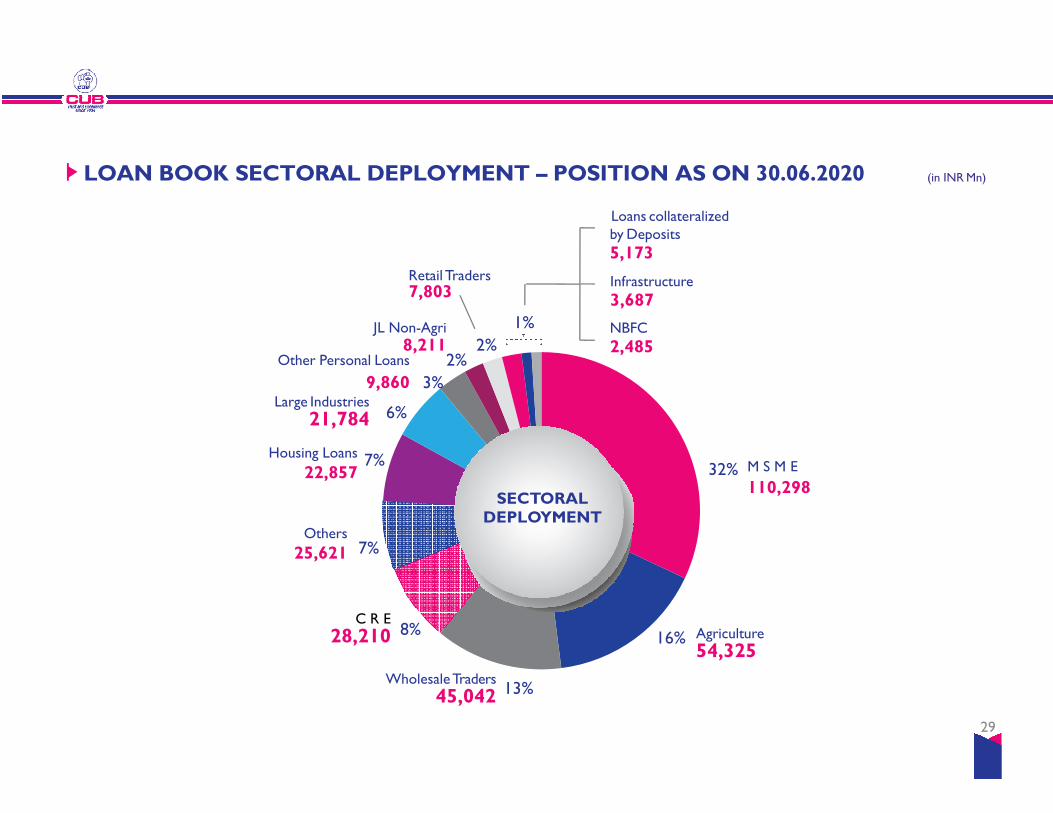
LOAN BOOK SECTORAL DEPLOYMENT – POSITION AS ON 30.06.2020 (in INRMn)
Large Industries
21,784 6%
3%
2%
Retail Traders 7,803
Infrastructure
3,687
NBFC
2,4852%
1%
Loans collateralizedby Deposits
5,173
JL Non-Agri8,211
Other Personal Loans
9,860
Agriculture
54,325
C R E
28,210
Large Industries
21,784
16%8%
7%
6%
M S M E
110,29832%
13%Wholesale Traders
45,042
7%Housing Loans
22,857
Others
25,621
29
SECTORALDEPLOYMENT
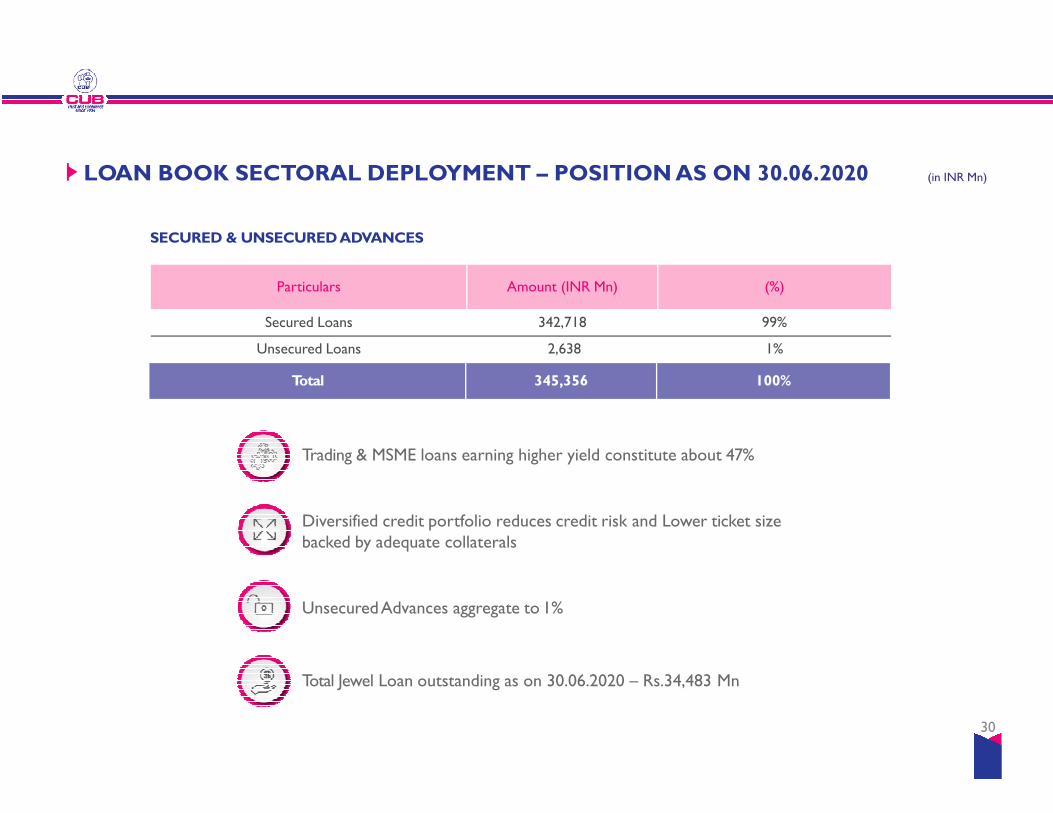
Total 345,356 100%
Particulars Amount (INR Mn) (%)
Secured Loans 342,718 99%
Unsecured Loans 2,638 1%
LOAN BOOK SECTORAL DEPLOYMENT – POSITION AS ON 30.06.2020 (in INR Mn)
SECURED & UNSECURED ADVANCES
Trading & MSME loans earning higher yield constitute about 47%
Diversified credit portfolio reduces credit risk and Lower ticket size backed by adequate collaterals
Unsecured Advances aggregate to 1%
Total Jewel Loan outstanding as on 30.06.2020 – Rs.34,483 Mn
30

TEXTILE
a) Cotton
b) Other Textiles
METALS
a) Iron & Steel
b) Other Metals
Loan Book –Advances to Major Industries
Advances to Major Industries 30th June 2020
Industry NameAmount
(in INR Mn)% to Total Advances
16,823 (5%)
20,903 (6%)
10,685 (3%)
5,419 (1%)
Corporate Governance
( in INR Mn)
-1% 1% 2% 3% 4% 5% 6% 7%
PAPER & PAPER PROD
FOOD PROCESSING
CHEMICALS
RUBBER & PLASTICS
ENGINEERING
BEVERAGE & TOBACCO
AUTOMOBILES
OTHER INDUSTRIES
373
Advances to Major Industries
82,941 24%
All other advances(Agri, Trade, Service, Gold Loan, etc.)
262,415 76%
Total Gross Advances 345,356 100%
7.354 (2%)
3,826 (1%)
4,440 (1%)
6,013 (2%)
1,931 (1%)
1,185 (1%)
3,989 (1%)
31

8,566
9,771
14,13413,461
4,083
4,748
5,915
7,7857,164
ASSET QUALITY
GROSS NPA QTM & GROSS NPA % NET NPA QTM & NET NPA%
(in INRMn)
32
6,820
2.83% 3.03%2.95%
4.09% 3.90%
31-Mar-17 31-Mar-18 31-Mar-19 31-Mar-20 30-Jun-20
4,083
1.71% 1.70% 1.81%2.29% 2.11%
31-Mar-17 31-Mar-18 31-Mar-19 31-Mar-20 30-Jun-20
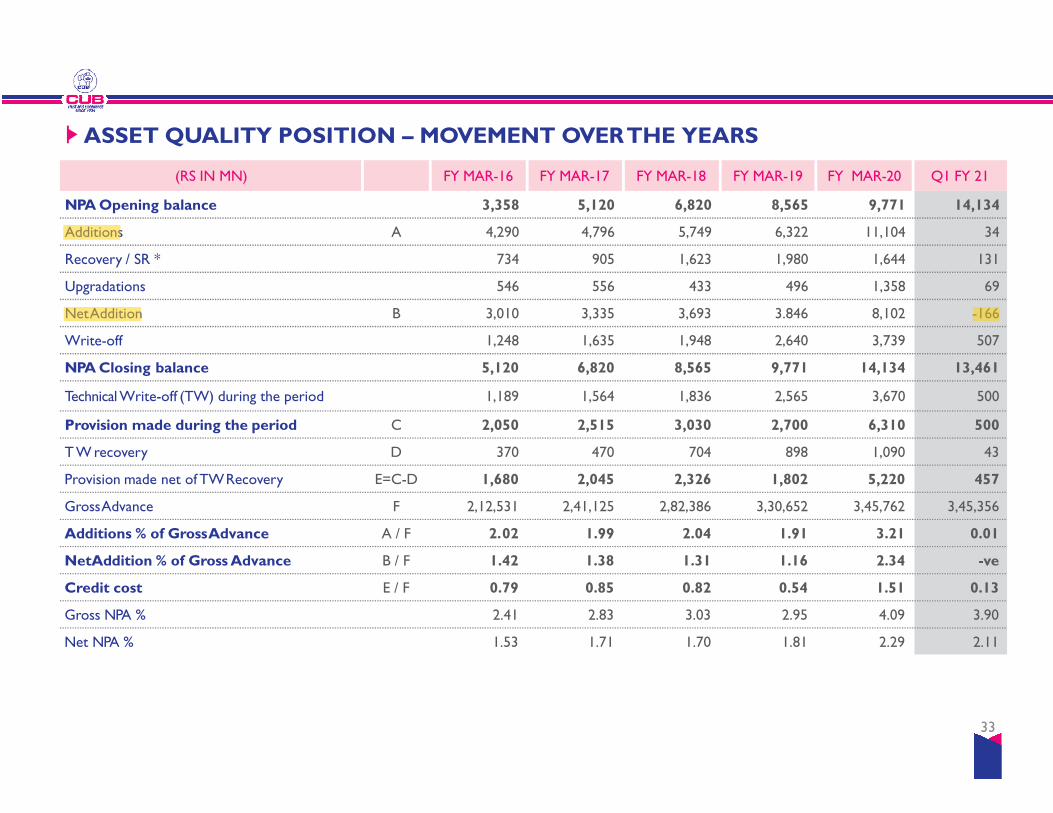
ASSET QUALITY POSITION – MOVEMENT OVERTHE YEARS
(RS IN MN) FY MAR-16 FY MAR-17 FY MAR-18 FY MAR-19 FY MAR-20 Q1 FY 21
NPA Opening balance 3,358 5,120 6,820 8,565 9,771 14,134
Additions A 4,290 4,796 5,749 6,322 11,104 34
Recovery / SR * 734 905 1,623 1,980 1,644 131
Upgradations 546 556 433 496 1,358 69
NetAddition B 3,010 3,335 3,693 3.846 8,102 -166
Write-off 1,248 1,635 1,948 2,640 3,739 507
NPA Closing balance 5,120 6,820 8,565 9,771 14,134 13,461
Technical Write-off (TW) during the period 1,189 1,564 1,836 2,565 3,670 500
Provision made during the period C 2,050 2,515 3,030 2,700 6,310 500
T Wrecovery D 370 470 704 898 1,090 43
Provision made net of TWRecovery E=C-D 1,680 2,045 2,326 1,802 5,220 457
GrossAdvance F 2,12,531 2,41,125 2,82,386 3,30,652 3,45,762 3,45,356
Additions % of GrossAdvance A / F 2.02 1.99 2.04 1.91 3.21 0.01
NetAddition % of Gross Advance B / F 1.42 1.38 1.31 1.16 2.34 -ve
Credit cost E / F 0.79 0.85 0.82 0.54 1.51 0.13
Gross NPA % 2.41 2.83 3.03 2.95 4.09 3.90
Net NPA % 1.53 1.71 1.70 1.81 2.29 2.11
33

RESTRUCTURED ACCOUNTS
Balance outstanding as on 30.06.2020 in respect of Restructured Standard borrowers
The above disclosure is in respect of Restructured Standard Accounts excluding NPA
Type of Restructuring No. of Borrowers Amount (in INR Mn)
Total 166 3880.05
S M E 120 3663.57
N S M E 46 216.48
The above disclosure is in respect of Restructured Standard Accounts excluding NPA
Restructured Standard Advances to Gross Advances – 1.12% as on Jun-20
In terms of RBI Circular DBR No.BP.BC.18/21.04.048/2018-19 dt 01.01.2019 on MSME Sector - Restructuring of Advances, the bank has
restructured 17 Standard accounts to the tune of Rs.680 mn in Q1 FY 2021. As of Q1 FY 21, the total outstanding restructured Standard
accounts was 166 in numbers and amounting to Rs.3,880 mn. The Bank hold a provision of Rs.121 mn against the requirement of Rs.118 mn
towards Restructured Standard accounts.
No fresh sale to ARC on SR basis from FY 17-18 and amount outstanding in Security Receipts – Rs.2,474 mn. Out of this, 4 a/cs which
constitutes 90% of total SRs, the resolution has been finalized and payments has started in all the 4 accounts. Since the repayment term goes
upto 2022, we expect there will be continuous cash flows.
34

INVESTMENTS –AT AGLANCE
Investments Breakup and Categorywise
Particulars JUN 2020 JUN 2019
SLR Securities 94,220 82,611
Non-SLR Securities 3,065 3,652
Total Investments 97,285 86,263
Yield on Investments 6.12% 6.93%
(in INRMn)
Investments Breakup:
- A F S 18,868 (19%) 20,988 (24%)
- H TM 78,417 (81%) 65,275 (76%)
- H FT - -
Total Investments 97,285 86,263
Modified Duration:
- A F S 1.12 0.85
- H TM 4.89 4.39
- H FT - -
- Overall Portfolio 4.24 3.63
35

COVID 19 OUTBREAKCOVID 19 OUTBREAK
3636
COVID-19 : Update on current situation
� As predicted by experts, COVID-19 pandemic is at its peak right now and our country is in the 3rd
position in the world with more than 2.27 million cases.
� However positive news are coming from around the world with vaccine which is expected to hit the market
in the coming months.
� The mobility restrictions are still in place with respect to educational institutions, religious festivals, mass
gatherings, tourism & Travel and public transport. However, the economic activity is picking up slowly and
our economy will be out of the clutches of COVID in the next few quarters.
37
our economy will be out of the clutches of COVID in the next few quarters.
� We are strictly adhering to all the safety measures prescribed by government authorities and continuously
working towards the safety and security of our employees.
� Also people are allowed to work from home or shift basis wherever possible.
� As of now, 107 employees were infected with COVID-19 virus – 35 of them recovered and 72 are under
treatment / home quarantine.

COVID-19 : Measures taken by the Bank
Business continuity:
� Our Business continuity plans worked well during this tough situation. We were successfully relocated someof our key functional departments on temporary basis and restored back on a smooth basis withuninterrupted service to our customers.
� Our branches and ATMs functioned without interruption during this tough times and though our branchstaffs get infected we were quick to restore our services to our customers.
Supporting the MSMEs / Entrepreneurs :
38
Supporting the MSMEs / Entrepreneurs :
� Through our branch network, our staffs were continuously communicating with our customers to understandtheir needs and help them out with their cash flow needs.
� So far we have sanctioned Rs.1583 crs & disbursed Rs.1218 Cr under ECLGS schemes to eligible MSMEbusiness segments.
� As per the revised relaxation in turnover and exposure norms prescribed by RBI, the eligible exposure shallbe Rs.8163 cr and the disbursal could be appx Rs.1632 cr under ECLGS scheme.

COVID-19 : Status of Loan Accounts as of 29th Feb 2020
� Present outstanding balance of the accounts which are in default as of 29th Feb 2020 is as below:
Position as on 15.06.2020 Position as on 31.07.2020
(Rs in Cr) No. of A/cs O/s Amount No. of A/cs O/s Amount
SMA 0 571 175 471 204
SMA 1 1102 348 926 341
SMA 2 327 122 * 171 83 *
Total 2000 645 1568 628
• In accordance with RBI guidelines, the Bank is required to make provision @ 10% of outstanding advances over two quarters
39
� The outstanding amount of Rs.628 cr as on 31.07.2020 comprises 1.82% of the total loan portfolio.
• In accordance with RBI guidelines, the Bank is required to make provision @ 10% of outstanding advances over two quarters
beginning with quarter ended March 31, 2020 in respect of borrower accounts which are at default and asset classification
benefit has been taken. The outstanding amount of those accounts for the bank stood at Rs.125.61 cr as on 29th Feb 2020 (O/s
balance as on 15.06.2020 – Rs.122 cr as indicated above). During Q4 FY 20, the Bank has made an adhoc COVID provision of
Rs.102 Cr in addition to the required RBI mandatory provision. In the current quarter Q1 FY 21, the bank has made an additional
adhoc provision of Rs.100 cr to meet any future contingency arising out of Covid pandemic. Thus, the total provision in this
regard held by the bank as on 30th June 2020 is Rs.202 crs.

COVID-19 : Repayment Status of Accounts – Position as of 30th Jun 2020:
1 monthly
installment /
interest
2 monthly
installments /
interest
3 monthly
installments /
interest
4 monthly
installments /
interest
LoanA/cs 73.46% 56.74% 51.04% 46.17%
CCODA/cs 98.24% 91.90% 89.94% 88.20%
Total 87.55% 76.74% 73.16% 70.07%
We have given below status of repayment made by our borrowers instalment-wise (upto June 2020) since grant
of moratorium:
40
Total 87.55% 76.74% 73.16% 70.07%
The above workings is based on total performing advances book of around Rs.26,918 cr excluding JL, ODAD/LAD, Staff loan, etc. to
the tune of Rs.7618 cr
Moratorium:
� The Bank has extended the option to all the borrowers to avail moratorium as per the RBI
instructions.
� Though the bank had given moratorium option to every customer, accounts with an exposure of
87.55% have paid atleast one monthly installment / interest to total performing advances book
(excluding JL, ODAD/LAD, Staff loan, etc.) since grant of moratorium. Accounts with an exposure of
70.07% have paid in full or four months (till Jun-20) and only 12.45% have fully used the
moratorium.

Liquidity Business growthBusiness segments Capital adequacy
� Maintaining LCR above
200% (270% as of
30.06.2020).
� We have liquidity to the
tune of Rs.3,000 cr which
were placed as short term
deposits in overseas
� Deposits grown by Rs.193
cr during Q1 FY 21
� Lesser quantum of
Government deposits
� Advances decreased by
� CRAR stood at 16.77%
� Maintaining higher capital
than required.
� Bank to seek permission
from the stakeholders at
COVID-19 : Bank’s position
� Strong Retail Franchise
� No Certificate of Deposit
� No reliance on Corporate
bulk deposits. Only 11%deposits in overseas
branches of Nationalized
banks.
� Contingency funding
measures are in place to
take care of exigencies.
� Advances decreased by
Rs.40 cr during Q1 FY 21.
from the stakeholders at
the ensuing Annual General
Meeting to be held on
14.08.2020 to go for QIP
for Rs. 600 crs as an
enabling resolution.
41
bulk deposits. Only 11%
of the total deposits are
above 2 Cr
� Low concentration of
deposits – Top 20
deposits constitutes less
than 7% of the total
deposits

BRANCH NETWORKBRANCH NETWORK
4242
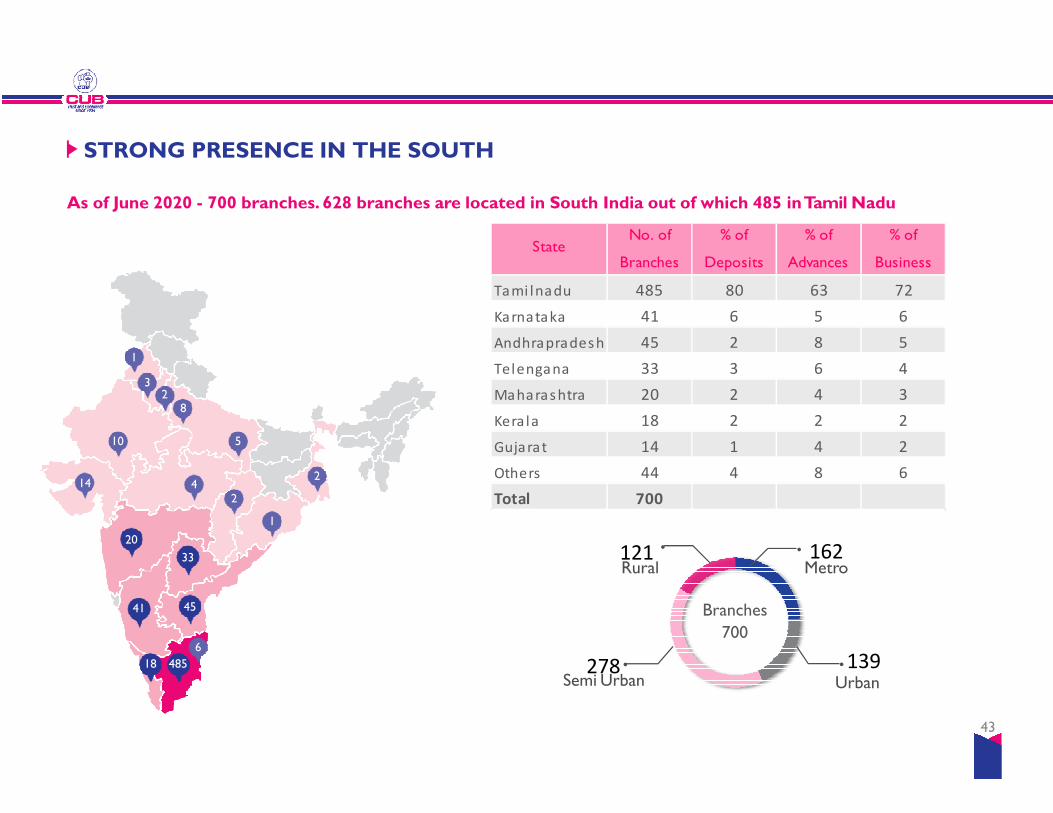
STRONG PRESENCE IN THE SOUTH
As of June 2020 - 700 branches. 628 branches are located in South India out of which 485 in Tamil Nadu
1
32
8
StateNo. of
Branches
% of
Deposits
% of
Advances
% of
Business
Tami lnadu 485 80 63 72
Karnataka 41 6 5 6
Andhrapradesh 45 2 8 5
Telengana 33 3 6 4
Maharashtra 20 2 4 3
162
139278
121
6
1
2
2
5
4
10
14
41 45
33
20
Metro
Branches
700
UrbanSemi Urban
Rural
8
18 485
43
Kera la 18 2 2 2
Gujarat 14 1 4 2
Others 44 4 8 6
Total 700

SHAREHOLDING PATTERNSHAREHOLDING PATTERN
44
F P I,
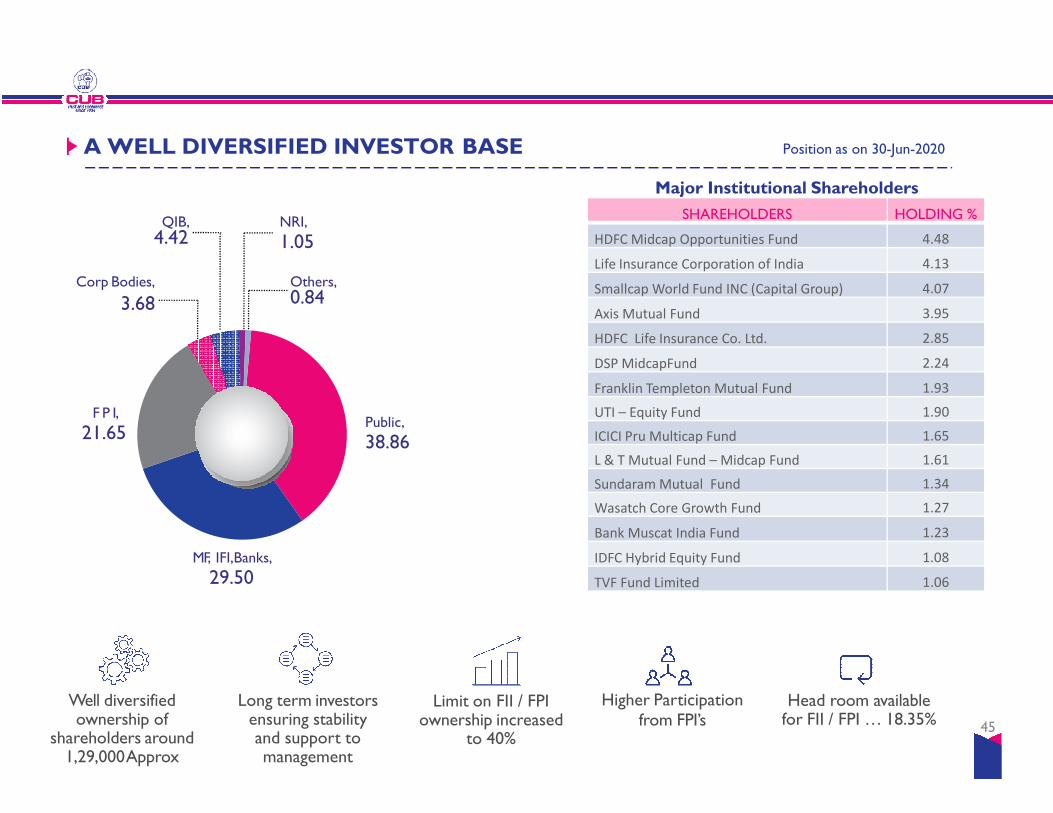
A WELL DIVERSIFIED INVESTOR BASE Position as on 30-Jun-2020
Major Institutional Shareholders
Corp Bodies,
3.68
NRI,
1.05
Others, 0.84
SHAREHOLDERS HOLDING %
HDFC Midcap Opportunities Fund 4.48
Life Insurance Corporation of India 4.13
Smallcap World Fund INC (Capital Group) 4.07
Axis Mutual Fund 3.95
HDFC Life Insurance Co. Ltd. 2.85
DSP MidcapFund 2.24
Franklin Templeton Mutual Fund 1.93
UTI – Equity Fund 1.90
QIB, 4.42
Public,
38.86
MF, IFI,Banks,
29.50
F P I,
21.65
Well diversified ownership of
shareholders around 1,29,000Approx
Long term investors ensuring stability and support to management
Limit on FII / FPI ownership increased
to 40%
Higher Participationfrom FPI’s
Head room available for FII / FPI … 18.35% 45
UTI – Equity Fund 1.90
ICICI Pru Multicap Fund 1.65
L & T Mutual Fund – Midcap Fund 1.61
Sundaram Mutual Fund 1.34
Wasatch Core Growth Fund 1.27
Bank Muscat India Fund 1.23
IDFC Hybrid Equity Fund 1.08
TVF Fund Limited 1.06
CORPORATE GOVERNANCECORPORATE GOVERNANCE
46

Shri. R. Mohan | B.Sc., MBA, CAIIB
Non-Executive Chairman
Shri. R. Mohan is a bachelor of Science, Master of Business Administration
and a CAIIB. Prior to joining the Board, he served as Chief General Manager
of our Bank.
Smt.Abarna Bhaskar | BA., FCA
Director
Smt. Abarna Bhaskar is a qualified Chartered Accountant by profession and
the first woman director of the Bank. She has served in senior positions with
Foreign Banks abroad and a large private sector bank in India. She also holds
expertise in Risk Management.
Shri. S. Bernard | B.Com. FCA
Director
Shri. S. Bernard is a graduate in Commerce and Fellow member of the
AWELL EXPERIENCEDAND STRONG BOARD
Dr N. Kamakodi | B.Tech., MBA., PhD., CAIIB
M.D. & C.E.O.
Dr. N. Kamakodi is serving as MD & CEO of the Bank from May 2011. He
joined the Bank as DGM in the year 2003 and was elevated as GM in 2005
and later as Executive Director in 2006.
Shri. M. Narayanan | B.Sc. FCA, Grad CMA, DISA
Director
Shri. M. Narayanan is a practicing Chartered Accountant by profession and
has handled Finance,Accounts and Taxation at various levels upto CFO
while in service for over 20 years in companies of repute viz. BHEL,
Dalmia Cements, Fenner, Ramco Cements and Dishnet etc. He is also an
agriculturist and a qualified system Auditor.
Shri. Subramaniam Narayanan |
PGDM-IIM(A), Chartered Accountant, FCS, Grad CMAShri. S. Bernard is a graduate in Commerce and Fellow member of the
Institute of Chartered Accountants of India. He worked as an accountant /
divisional accountant in Eastern Coal Fields (subsidiary of Coal India Ltd.) and
Best & Crompton Engineering for a period of 6 years. Since 1984, he is
practicing Chartered Accountant .
Shri.V.N. Shiva Shankar | B.Com,ACS,ACMA, BL
Director
Shri. V.N. Shiva Shankar is a qualified Lawyer, Company Secretary and Cost
Management Accountant with 25 years of rich experience in Indian
Corporate Law. He is also the founder of M/s VNS Legal Corporate Law firm
based in Chennai which focuses on legal advisory services on Capital Market
Regulation, Takeover Offers, Corporate Litigation, etc. He is a member of the
Executive Committee in Southern India Chamber of Commerce. He has
expertise in SEBI Regulations & Risk Management.
Shri.K. Vaidyanathan | B.Sc., FCMA, FCS
Director
Shri K. Vaidyanathan is a Fellow member of the Institute of Cost
Management Accountants of India and also the Institute of Company
Secretaries of India. He has over 40 years of rich domain experience in
Financial and Management Accounting, Corporate Finance, Auditing and
Regulatory Compliance. He is a Practicing Company Secretary. He also hold
expertise in Compliance and Business management.
PGDM-IIM(A), Chartered Accountant, FCS, Grad CMA
Director
Shri. Subramaniam Narayanan posses rich experience in the areas of
Business Management, Private Equity, Finance, Accountancy, Treasury &
Risk Management , Information Technology and Payment & Settlements.
He has held the position of CEO in First India Asset Management Company
Ltd., and handled treasury services for Bank of America and Abu Dhabi
Commercial Bank, UAE. Besides, he has been associated as Director in IT /
Fintech Companies of repute for a longtime.
Dr.T.S. Sridhar IAS (Retd.) | M.A., Phd.,
Director
Dr T.S. Sridhar is a Retd. IAS officer having 35 years of vast experience in
all levels of administration and as Principal Secretary, he has expertise and
knowledge on Rural economy, farm sector and Industries especially
MSME. He was a Director on the Board of NABARD. He hold expertise in
Human Resource and Economics as well.
Shri. T.K. Ramkumar | B.Com., B.L.
Director
Shri. T.K. Ramkumar is one of the leading Lawyers in Chennai possessing
special knowledge in Banking law, Company law and Intellectual Property
Rights. He is also an active environmentalist.47

TRANSPARENT ‘CORPORATE GOVERNANCE’ PRACTICES
Board consists of 9 Independent Directors (including 1WomenDirector)And 1 Executive
Director
Various sub-committees of Board functions to oversee the
operations of the Bank
Disclosure norms strictly adhered to
KYC / AML Norms strictly complied with
Code of conduct for Directors and SeniorManagement
put in place
WE HAVE EMINENT PERSONALITIES ON OUR BOARD WE HAVE EMINENT PERSONALITIES ON OUR BOARD WITH DIVERSE PROFESSIONAL EXPERTISE
Career Banker with 4 Decades of banking
experience
Practicing Company Secretary, Business
Management, IT & Compliance
Practicing Advocate, Compliance function and Risk
Management
48
Practicing CharteredAccountant
Practicing Chartered Accountant & Risk
Management . First Women Director of the Bank
Advocate in Banking Law & Environmental Activist
Practicing Chartered Accountant , qualified system Auditor and Agriculturist
Retired IAS Officer, Rural Economy, MSME, Business
Management, Human resource and Economics.
Private Equity Fund Manager, Risk Management, IT and Treasury Management

CITY UNION BANK LTD.
Regd.Office :149,TSR Big Street,Kumbakonam – 612001,Tamilandu.
Admin Office :"Narayana" No.24 B,Gandhi Nagar,Kumbakonam - 612001,Tamil Nadu.
Tel :0435-2402322,2401622,| FAX:0435-2431746 | www.cityunionbank.com
INVESTORCONTACTINVESTORCONTACT
Name :K.Jayaraman,DGM
Mob : +91 9344303740
Email :[email protected]
For any queries regarding presentation, please write to [email protected]


