29
December 3, 2019 City Wide Inclusive Sanitation Service Assessment and Planning

December 3, 2019
City Wide Inclusive SanitationService Assessment and Planning

CWIS Planning – A Holistic Perspective
Sanitation Market
Service Delivery Model
Service Providers
Technology
Households

“The tool provides a platform for stakeholders to periodically review CW sanitation market, deliberate on investment options, make well informed structural/policy decisions”
Financial Policy
National Government
• Limited budgetary headroom• Exhausted borrowing limits
• Sanitation service a right – improve access• Helps regulate environment mgt• Provides empirical justification for planning
County Government• Assets transferred to utilities• Equity holding in utilities
• Pro-Sewerage political disposition
Regulator
• Level playing field for private sector• Balance between access, affordability and
financial sustainability • Protect LIC customers• Helps appreciate cost to serve
Utility
• Capital budgeting challenge• Legacy assets• Compute to cost to serve better• Unrecovered revenues from public sector• Optimize future asset allocation• Improve accounting systems
• Cross-subsidization of LIC services• Improve operations efficiency• Partner with private sector
Private Sector
• Seeks high return (less regulated, higher risks, higher returns)
• Willing to invest• Fears being crowded out
• Expects policy predictability• Interested to organize / formalize

Tool Fundamentals

What Constitutes an Intervention – According to the Tool
SANITATION SYSTEM (HARDWARE)
REVENUE MODELSERVICE DELIVERY
MODEL
Would the intervention comprise of an
investment in a particular sanitation
system/technology?
Would the intervention entail modifying the sources/method of
revenue generation?
Who provides the service? How would it be provided – would it be regulated?
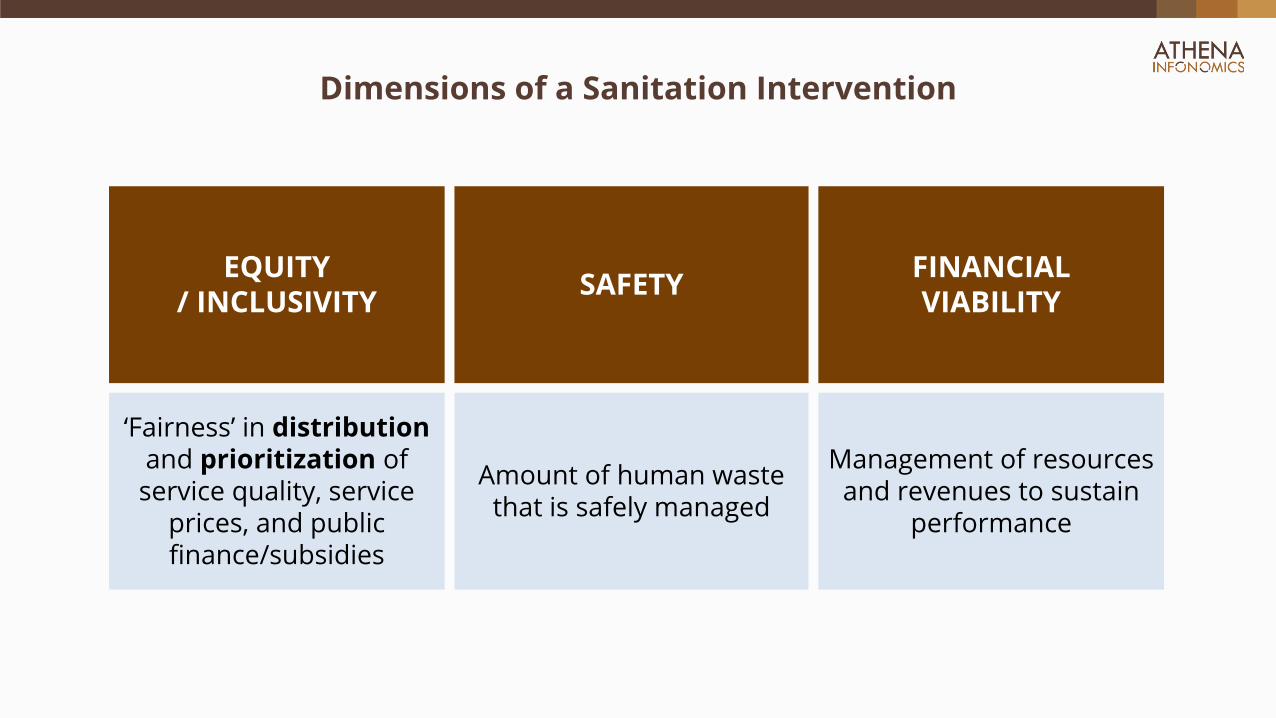
Dimensions of a Sanitation Intervention
EQUITY / INCLUSIVITY
SAFETYFINANCIAL VIABILITY
‘Fairness’ in distributionand prioritization of service quality, service
prices, and public finance/subsidies
Amount of human waste that is safely managed
Management of resources and revenues to sustain
performance

Indicator Choices for the Dimensions
EQUITY / INCLUSIVITY
SAFETYFINANCIAL VIABILITY
1. Household Expenditure
2. Coverage and Quality of Sanitation Services for Low Income Households (LIH)
3. Subsidies/Investment Priorities and their Impact of LIH
1. Proportion of sludge that is safely managed across the sanitation supply chain – An SFD like approach
1. Net Income Projections for the Service Providers
2. Cost Coverage Ratio for the different sanitation systems

Systems and Customer Typologies
System Number
Category Toilet Contain / Convey R&T Treatment
1 Sewer Sewer Connection with Cistern Flush Sewer Conventional Sewer Conventional WWTP
2 Sewer Sewer Connection with Cistern Flush Sewer Condominial - Septic Tank ABR Vacuum Truck WWTP
3 Sewer Sewer Connection with Cistern Flush Sewer Condominial - Ring Pit ABR Vacuum Truck WWTP
4 Sewer Sewer Connection with Cistern FlushSewer Simplified - Connected to
Conventional SewersVacuum Truck WWTP
5 Safe On-Site Septic Tank (Individual) with Pour Flush Individual Septic Tank Vacuum Truck WWTP
6 Safe On-Site Septic Tank (Shared) with Pour Flush Shared Septic Tank Vacuum Truck WWTP
7A Safe On-Site Lined Pit Latrine (Individual) with Slab Individual Lined Pit LatrineManual and Transported in Barrels by
TrucksWWTP
7B Safe On-Site Lined Pit Latrine (Individual) with Slab Individual Lined Pit Latrine Vacuum Truck WWTP
8 Unsafe On-Site Unlined Pit Latrine (Individual) with Slab Individual Unlined Pit LatrineManual and Transported in Barrels by
TrucksWWTP
9A Safe On-Site Lined Pit Latrine (Shared) with Slab Shared Lined Pit LatrineManual and Transported in Barrels by
Trucks WWTP
9B Safe On-Site Lined Pit Latrine (Shared) with Slab Shared Lined Pit Latrine Vacuum Truck WWTP
10 Unsafe On-Site Unlined Pit Latrine (Shared) with Slab Shared Unlined Pit LatrineManual and Transported in Barrels by
TrucksWWTP
NLIC LIC

Tool Workflow
Scenarios
Identify Service Delivery Models (Baseline, Planned)
Project Investments
(Committed and Planned)
Determine Revenue Model (Baseline, Planned)
Coverage
Assumptions
Understanding the Demand Side – Number of connections by system type, understanding the number of pits emptied
Understanding Engineering Details – ex: How large is a pit? How many HHs does it serve? No of HHs connected per KM of sewer line
Cost and Revenue Data
What is the average tariff per meter cube for seweredhouseholds (LIC and NLIC)?
What is the price charged to the households per vacuum truck trip?
Outputs
Sustainability -Financial Analysis for Service Providers
Equity - Expenditure Analysis for Households, subsidy distribution
Safety – Overall City Level

A Look at the Tool – Using the Tool for the City of Oz

About Oz
• Oz is a small city with a population of around 500,000 and a population growth rate of 3%.
• The city currently has sewer network (serving 27% of the city’s population) and two waste water treatment plants (capable of co-treatment). Both the network and the treatment plants are not well maintained and need to be rehabilitated.
• 48% of the population reside in Low Income Areas (slums, temporary settlements).
• The city’s households are either connected to the sewer or have some form of on-site containment technology (septic tanks, lined pit latrines or unlined pit latrines).
• The city’s utility currently has a regressive tariff system, where 30% of the water bill from ALLcustomers with access to water connection goes to sewerage sub-business.
• The utility does not regulate the removal and transportation service providers for on-site containment systems.

The Potential Interventions for Oz –Business as Usual
SANITATION SYSTEM (HARDWARE)
REVENUE MODELSERVICE DELIVERY
MODEL
Oz utility is planning to expand the sewer
network to increase sewer coverage by 7%
Oz utility will invest in a new WWTP
Oz utility will continue to apportion 30% of the water bill of ALL their
water customers
Oz utility will not intervene to regulate the
removal and transportation business

The Potential Interventions for Oz – Reform with a Sewer Focus
SANITATION SYSTEM (HARDWARE)
REVENUE MODELSERVICE DELIVERY
MODEL
Oz utility is planning to expand the sewer
network to increase sewer coverage by 27%
Oz utility will invest in a new WWTP
Oz utility will introduce a separate volumetric tariff
for all their customers connected to the sewer
network
The utility will increase the tariff to compensate for
the expansion
The utility will sign service contracts with the open
market vacuum truck operators, price control
will be introduced

The Potential Interventions for Oz – Reform with a On-Site Focus
SANITATION SYSTEM (HARDWARE)
REVENUE MODELSERVICE DELIVERY
MODEL
The utility will subsidize the construction of lined pit latrines in low income
areas by 80%
The utility will also invest in Mechanical Desludging
Units and Transfer Trucks
utility will sign service contracts with the open
market vacuum truck operators, price control
will be introduced
The utility will sign service contracts with the open
market vacuum truck operators, price control
will be introduced
The utility will provide MDUs for lease to the
manual emptying groups (for free) and regulate the
their prices
Oz utility will introduce a separate volumetric tariff
for all their customers connected to the sewer
network
The utility will actively regulate the prices of
vacuum tank and MDU operators

The Dashboard
CITY WIDE INCLUSIVE SANITATION SERVICE ASSESSMENT AND PLANNING TOOL - DASHBOARD - SCENARIO VIEW
Open Market 0%-30%
Regulated Services 30%-70%
Both 70%-100%
Contain
/ConnectRemove Transport Treat
Connect
/ContainEmpty Convey Treat
Sewer 27%
Safe Containment 50%
Unsafe Containment 22%
Sewer 34%
Safe Containment 46%
Unsafe Containment 20%
Sewer 54%
Safe Containment 26%
Unsafe Containment 20%
Sewer 30%
Safe Containment 64%
Unsafe Containment 6%
Hardware: 4 additional transportation
trucks, 6 Mechanical Desludging Units
and a Rehabilitating the WWTPs
Revenue Model: Separate Volumetric
Tariff for Sewer Customers.
Service Delivery Model: Utility enters
Removal Business via providing MDUs
and Transportation Trucks. Utility also
introduces price control for vacuum
tankers.
Reform - Onsite
Investments
Scenario 3
Scenario 1
Baseline
SAFETY
SCENARIO SERVICE SEGMENTS POPULATION SERVED MARKET STRUCTURE
ANNUAL HOUSEHOLD
EXPENDITURE (Oz
Dollars/HH/Year) - 2029
% OF SLUDGE SAFELY MANAGEDCOST TO BE RECOVERED VERSUS PRICE
CHARGED - 2029
Hardware: 25 KM of additional Sewer
Network and Additional Waste Water
Treatment Plant
EQUITY SUSTAINABILITY
Service Delivery Model: Remains Same.
Business as Usual
Reform - Sewer
Investments
Hardware: 57KM of additional sewer
network and a WWTP
Revenue Model: Separate Volumetric
Tariff for Sewer Customers and Price
Control for Vacuum Tankers
Service Delivery Model: Utility introduces
price control for vacuum tankers.
Revenue Model: Remains Same
Scenario 2
0% 25% 50% 75% 100%
Low IncomeConsumers
Non-Low IncomeConsumers
0% 25% 50% 75% 100%
21%
123%
0%
-43%
118%
0%
-100% -50% 0% 50% 100% 150% 200%
Non-Low Income Consumers
Low Income Consumers
-13%
188%
19%
-59%
194%
24%
-100% -50% 0% 50% 100% 150% 200%
0% 25% 50% 75% 100%
-31%
43%
-47%
-73%
6%
-48%
-100% -50% 0% 50% 100% 150% 200%
0% 25% 50% 75% 100%
-5%
-12%
0%
-73%
-17%
-9%
-100% -50% 0% 50% 100% 150% 200%
1,798
1,7986,767
6,767
7861,329
0 2,000 4,000 6,000 8,000
NLIC - Regulated ServicesLIC - Regulated ServicesNLIC - Open MarketLIC - Open Market
1,798
1,7986,767
6,767
9391,329
0 2,000 4,000 6,000 8,000
492
870
257
5,453
753
0 2000 4000 6000 8000
477
460
725
566
280
3,265
0 2,000 4,000 6,000 8,000

The Dashboard – Summarizing the Scenarios
Sewer 27%
Safe Containment 50%
Unsafe Containment 22%
Sewer 34%
Safe Containment 46%
Unsafe Containment 20%
Sewer 54%
Safe Containment 26%
Unsafe Containment 20%
Sewer 30%
Safe Containment 64%
Unsafe Containment 6%
Hardware: 4 additional transportation
trucks, 6 Mechanical Desludging Units
and a Rehabilitating the WWTPs
Revenue Model: Separate Volumetric
Tariff for Sewer Customers.
Service Delivery Model: Utility enters
Removal Business via providing MDUs
and Transportation Trucks. Utility also
introduces price control for vacuum
tankers.
Reform - Onsite
Investments
Scenario 3
Scenario 1
Baseline
SCENARIO SERVICE SEGMENTS POPULATION SERVED
Hardware: 25 KM of additional Sewer
Network and Additional Waste Water
Treatment Plant
Service Delivery Model: Remains Same.
Business as Usual
Reform - Sewer
Investments
Hardware: 57KM of additional sewer
network and a WWTP
Revenue Model: Separate Volumetric
Tariff for Sewer Customers and Price
Control for Vacuum Tankers
Service Delivery Model: Utility introduces
price control for vacuum tankers.
Revenue Model: Remains Same
Scenario 2
0% 25% 50% 75% 100%
Low IncomeConsumers
Non-Low IncomeConsumers
0% 25% 50% 75% 100%
0% 25% 50% 75% 100%
0% 25% 50% 75% 100%

Dashboard Equity Indicator
Those with safe on-site containment pay for services they never receive, artificially inflating their budget. A substantial portion of these are LIC HHs.
The regressive tariff system continues in the ‘Business as Usual’ scenario, the picture is the same as the baseline as there are no tariff reforms taken (including any increase in the tariff).
The introduction of the separate sewerage volumetric tariff system and price control regulations significantly reduces the expenditure of the households with safe on-site sanitation.
The introduction of the separate sewerage volumetric tariff system and price control regulations significantly reduces the expenditure of the households with safe on-site sanitation. The utility is also helping the manual emptying groups in this scenario
Scenario 3 -
Reform with On-
site Focus
Sewer
Safe On-Site
Unsafe
Unsafe
Unsafe
Scenario 1 -
Business as Usual
Sewer
Safe On-Site
Scenario 2 -
Reform with
Sewer Focus
Sewer
Safe On-Site
Scenarios
Considered
EQUITY
ANNUAL HOUSEHOLD EXPENDITURE
(Oz Dollars/HH/Year) - 2029
Baseline
Sewer
Safe On-Site
Unsafe
1,798
1,798
6,767
6,767
786
1,329
0 2,000 4,000 6,000 8,000
NLIC - Regulated ServicesLIC - Regulated ServicesNLIC - Open MarketLIC - Open Market
1,798
1,798
6,767
6,767
939
1,329
0 2,000 4,000 6,000 8,000
492
870
257
5,453
753
0 2000 4000 6000 8000
477
460
725
566
280
3,265
0 2,000 4,000 6,000 8,000

Understanding the Sustainability Measure
• The sustainability measure used in the tool is the difference between the Price Paid for the sanitation service and the respective Cost to Serve.
• By ‘Sanitation Service’ we look at the recurring costs for the entire system from emptying/conveyance to treatment.
• We arrive at the cost to serve by dividing the total of all relevant costs associated to a service by the relevant operational metric (could be metric cube or trips based on the type of technology)
All Relevant Direct and Indirect Costs
Relevant Operational Metric
• We then compare this with the total price paid and standardize it by the cost. A negative number implies that the customers pay lesser than the cost of the service.
Price Paid −Cost to Serve
Cost to Serve

Dashboard Sustainability Indicator
Due to the current tariff model, the households with on-site sanitation are infact subsidizing the sewer population.
The introduction of the separate tariff system and regulations substantially brings down the profits.
The utility is almost completely subsidizing the emptying of unlined pits, and to a large extent is reducing the profit margins of the vacuum tankers. The LIC are most benefitted as they often have shared lined pits/septic tanks.
Safe On-Site
Unsafe
Baseline
Scenario 2 -
Reform with
Sewer Focus
Scenario 3 -
Reform with On-
site Focus
Unsafe
Sewer
Safe On-Site
Unsafe
Sewer
Safe On-Site
Safe On-Site
Sewer
Unsafe
Scenarios
Considered
Scenario 1 -
Business as Usual
SUSTAINABILITY
COST TO BE RECOVERED VERSUS PRICE
CHARGED - 2029
Sewer
21%
123%
0%
-43%
118%
0%
-100% -50% 0% 50% 100% 150% 200%
Non-Low Income Consumers
Low Income Consumers
-5%
-12%
0%
-73%
-17%
-9%
-100% -50% 0% 50% 100% 150% 200%
-5%
-12%
0%
-73%
-17%
-9%
-100% -50% 0% 50% 100% 150% 200%
-31%
43%
-47%
-73%
6%
-48%
-100% -50% 0% 50% 100% 150% 200%

Dashboard Safety Indicator
The improperly maintained sewer pipes and waste water treatment plants are causing much of the trouble.
The regulation of the private sector and rehabilitation of WWTP and sewer network seems to have an impact on the safety parameters for sewer and safe on-site connections
The regulation of manual emptying groups, vacuum tanker and the rehabilitation of existing sewer and WWTP infrastructure has the highest impact on safety
0%-30%
30%-70%
70%-100%
Connect
/ContainEmpty Convey Treat
SAFETY
% OF SLUDGE SAFELY MANAGED
Scenario 2 -
Reform with
Sewer Focus
Sewer
Safe On-Site
Unsafe
Scenario 3 -
Reform with On-
site Focus
Sewer
Safe On-Site
Unsafe
Scenarios
Considered
Baseline
Sewer
Safe On-Site
Unsafe
Scenario 1 -
Business as
Usaual
Sewer
Safe On-Site
Unsafe
The rehabilitation of sewers and WWTP improves the safety numbers, but the lack of proper regulation of vacuum truck operators and manual emptying groups implies that not much of the sludge collected reaches the WWTP

Provider View

Household View

Subsidy View

“The tool helps understand trade-offs more holistically”
Safety

Data Challenges
I © Athena Infonomics 2019

Data Challenges
• Toilet Database and Understanding of the Baseline data – Toilet Database & Potentially Leveraging Maji Data
• Understanding the costs and demand base for private sector - The CACTUS initiative might greatly help in addressing this gap and understanding costs for private players
• Repository of planning data and historical data about costs for operations – Tools such as the tariff model in Lusaka are helping us organize such data better. City level master planning documents would also be a very useful source of data
• Sub-business (cost center) level cost capturing – There is a lot of interest in wanting to capture cost data at the level of the sub-business unit (sewer network, WWTP, on-site business)
• Demand Factors - Willingness to Pay of the consumers for sanitation systems and barriers to their uptake of technologies need to be better captured. This would help improve the accuracy of the demand estimates.

Annexure

Equity
The price paid by a household of type i and with system t is,
The average expenditure is computed by weighting across the systems in that group,
The weights are arrived at by the relative proportion of population in the type (LIC/NLIC) with system t,
System Number (t) Description Category (c)
System 1 Conventional Sewer
System 2 Condominial 1 Sewer
System 3 Condominial 2 Sewer
System 4 Simplified Sewer
System 5 Ind. ST Safe On-Site
System 6 Shared ST Safe On-Site
System 7A Ind. PL (Manual) Safe On-Site
System 7B Ind PL (Vacuum) Safe On-Site
System 8 Ind Pl (Unhygenic) Unsafe On-Site
System 9AShared. PL (Manual)
Safe On-Site
System 9BShared PL (Vacuum)
Safe On-Site
System 10Shared Pl
(Unhygenic)Unsafe On-Site

Sustainability
The cost to serve per meter cube for system t is1,
The cost to serve for a event (example – desludging an individual pit) is,
The weights are arrived at by the relative proportion of population in the type (LIC/NLIC) with system t,
System Number (t) Description Category (c)
System 1 Conventional Sewer
System 2 Condominial 1 Sewer
System 3 Condominial 2 Sewer
System 4 Simplified Sewer
System 5 Ind. ST Safe On-Site
System 6 Shared ST Safe On-Site
System 7A Ind. PL (Manual) Safe On-Site
System 7B Ind PL (Vacuum) Safe On-Site
System 8 Ind Pl (Unhygenic) Unsafe On-Site
System 9AShared. PL (Manual)
Safe On-Site
System 9BShared PL (Vacuum)
Safe On-Site
System 10Shared Pl
(Unhygenic)Unsafe On-Site
The weighted average difference between the cost to serve and the price paid per event is reported,
1For vacuum tankers, this is done at a event/trip level (denominator) and not by volume


