39
Public Kickoff Meeting Lower East River, Kill van Kull, Arthur Kill, and New York Bay St. John’s University, Staten Island March 27, 2018 Citywide/Open Waters CSO Long Term Control Plan

Public Kickoff Meeting
Lower East River, Kill van Kull,
Arthur Kill, and New York Bay
St. John’s University, Staten Island
March 27, 2018
Citywide/Open Waters CSO Long Term Control Plan

2
Agenda
Topic Speaker
1 Welcome & Introduction Mikelle Adgate
2 Waterbody & Watershed Characteristics
and Water Quality Sampling Keith Mahoney
3 Water Quality Improvement Projects
• Grey Infrastructure
• Green Infrastructure
Keith Mahoney
Melissa Enoch
4 LTCP Modeling & Alternative
Development Process Keith Mahoney
5 Next Steps Mikelle Adgate
6 Discussion and Q&A Session All

3
Welcome & Introduction
Mikelle Adgate
Senior Policy Advisor
DEP

4
What is a Combined Sewer Overflow (CSO)?
NYC’s sewer system is approximately 60% combined, which means it is
used to convey both sanitary and storm flows.
When the sewer system is at full capacity, a mixture of rain water and sewage may be
released into local waterways. This is called a combined sewer overflow (CSO).
Down
Spout
Catch Basin
Combined
Sewer Outfall
Sewer
Regulator
Dry Weather
Conditions
City Sewer Main
Building Sewer
Connection
Down
Spout
Catch Basin
Stormy Weather Conditions
Combined
Sewer Outfall
Sewer
Regulator
City Sewer Main
Building Sewer
Connection

5
How does rainfall affect CSOs?
Not every rainfall causes a
CSO event:
Approximately 40% of the
average rainfall events per year
may trigger a CSO into the
Lower East River, Kill van Kull,
or New York Harbor
Photo Credit: Baptisete Pons
https://www.flickr.com/photos/bpt/2882285636/

6
What is a LTCP and CSO Consent Order?
Long Term Control Plan (LTCP)
identifies appropriate CSO controls to achieve applicable
water quality standards
consistent with the Federal CSO Policy and Clean Water Act
CSO Consent Order
an agreement between NYC and DEC that settles past
legal disputes without prolonged litigation
DEC requires DEP to develop LTCPs and mitigate CSOs

7
LTCP Process and Public Involvement
ONGOING PUBLIC/STAKEHOLDER INPUT
Existing Information
Review
Data Collection &
Analysis Modeling
Alternatives Development & Evaluation
Prepare
LTCP
Submit to DEC
Kickoff
Meeting
TODAY
Alternatives
Meeting
TBD
Final Plan
Review Meeting
TBD

8
LER, KVK, AK, NYB in Phase 3 Sampling
Phase 1 Sampling
Hudson & Harlem River
Phase 3 Sampling
LER, KVK, AK, NYB Phase 2 Sampling
East River
NC-014
CSO Outfalls Monitored
Shoreline
Open Water
LTCP-02 Proposed Sampling Locations
The Citywide/Open
Waters Sampling
Program was divided
into 3 Phases
Lower East River, Kill
van Kull, Arthur Kill,
and New York Bay
were covered under
Phase 3
OH-017 PR-031
OH-015
OH-003

9
Waterbody & Watershed
Characteristics and
Water Quality Sampling
Keith Mahoney, PE
Director of Water Quality Planning
DEP

10
Combined Sewer Drainage Areas to LER, KVK, AK, NYB
WWTP LIS and East River (acres)
Port Richmond 4,586
Oakwood Beach 0
Red Hook 2,991
Owl’s Head 9,191
Newtown Creek 6,329
TOTAL 23,097
Lower
NY Bay
Lower
East
River
Upper
NY Bay
Kill van
Kull
Arthur
Kill

11
South Beach
Midland
Beach Cedar Grove
Beach
Wolfe’s Pond
Beach
Coney Island
Beach
Seagate Beach
Club
Owl’s Head
Park
Dyker Beach
Park
Von Briesen
Park
Shore Rd.
Park
Alice Austin
Park
Land Use in Combined Sewer Drainage Area Residential
Mixed Residential
Commercial and Office
Industrial and Manufacturing
Transportation and Utility
Public Facilities and Institutions
Open Space and Outdoor Recreation
Parking Facilities
Vacant Land
LER, KVK, AK, NYB
Land Use LER, NYB,
KVK, AK
Residential 44%
Mixed Residential & Commercial 13%
Commercial 6%
Transportation & Utility 9%
Public Facilities 12%
Park & Open Space 14%
Other 2%

12
OB MS4
Other
MS4
CSO
LER, KVK, AK, NYB Overview
25%
13%
13% 22%
16%
11%
CSO Volumes by Outfall OH-015
(1,189
MGY)
NCB-014
(607 MGY)
OH-002
(598 MGY)
74 Outfalls
<50 MGY (Total 544 MGY,
Avg 7.3 MGY)
6 Outfalls
50-200 MGY (Total 737
MGY, Avg
122.7 MGY)
OH-017,
OH-003,
PR-031 (455 MGY,
400 MGY,
207 MGY)
(86 Outfalls) CSO
MS4
Other(1)
(1) Includes direct drainage and other
non-DEP stormwater
(2) Oakwood Beach SW from October
2007 WWFP Modeling Report
4,679 MGY
2,124 MGY
2,269 MGY
Note: Preliminary Existing
Condition Modeling results.
8,476 MGY OB SW(2)
MS4 Outfall
CSO Outfall (colors vary)
12

13
Staten Island
Brooklyn
Upper New York
Bay
Lower New York
Bay
LER, KVK, AK, NYB Overview
Outerbridge
Crossing
Verrazano
Bridge
Seagate
South
Beach
Ward’s Point
St. George
Newark Bay
Goethals
Bridge
Legend CSO Outfalls
Water Quality Classifications
Class SA
Class SB
Class I
Class SD
Bayonne Bridge
On March 21, 2018, DEC publicly noticed a
revision to the water quality standards and
classifications for certain waterbodies.
DEP is in the process of assessing attainment
with the proposed standards and classifications.
13

14
Water Quality Standards and LTCP Goals
CSO LTCP Goals and Targets:
Seasonal Bacteria Compliance
Annual Dissolved Oxygen Compliance
Time to Recovery for Bacteria of ≤ 24 hours
Floatables Control
CLASS SB B a t h i n g
The best usage of Class SB
water are primary and
secondary contact
recreation and fishing. These
waters shall be suitable for
fish, shellfish and wildlife
propagation and survival.
CLASS I B o a t i n g / F i s h i n g
The best usage of Class I water
is secondary contact
recreation and fishing. These
waters shall be suitable for fish,
shellfish and wildlife propagation
and survival. In addition, the
water quality shall be suitable for
primary contact recreation,
although other factors may limit
the use for this purpose.
CLASS SD B o a t i n g / F i s h i n g
The best usage of Class SD
water is fishing. These waters
shall be suitable for fish,
shellfish and wildlife survival.
In addition, the water quality
shall be suitable for primary
and secondary contact
recreation, although other
factors may limit the use for
this purpose.
*(NYCRR Part 703.3)
**(NYCRR Part 703.4)
CLASS SA S h e l l f i s h
The best usage of Class SA
water are shellfishing for
market purposes, primary and
secondary contact recreation
and fishing. These waters shall
be suitable for fish, shellfish
and wildlife propagation and
survival.
Location Class
Dissolved Oxygen* (mg/L)
Fecal Coliform** (col/100 mL)
Total Coliform** (col/100 mL)
Lower NYB SA ≥ 4.8 (daily average)
≥ 3.0 (acute, never less than)
Monthly Geometric Mean
≤ 200
Monthly Median
≤ 2,400
and
80% ≤ 5,000
Lower NYB SB
LES, Upper NYB,
Arthur Kill I ≥ 4.0 (acute, never less than)
Kill van Kull,
Arthur Kill SD > 3.0 (acute, never less than)
On March 21, 2018, DEC publicly noticed a
revision to the water quality standards and
classifications for certain waterbodies.
DEP is in the process of assessing attainment
with the proposed standards and classifications.
14

15
Ongoing Receiving Water Sampling Programs Program Harbor Survey
Monitoring
Sentinel
Monitoring
PVSC
Sampling
Citizen
Sampling
Sampling Frequency Monthly
(Oct – May)
Weekly
(Jun – Sept)
Quarterly Weekly, WW events
(Apr ‘16 – Mar ‘17)
Weekly
(May – Oct)
EAST RIVER, KILL VAN KULL, ARTHUR KILL, NEW YORK BAY
# of Sampling
Locations 12 16 11 7
Para
mete
rs
Fecal
Entero
*YSI
*YSI Parameters: Dissolved Oxygen,
Temperature, Conductivity, and Salinity.
Data is available here:
http://www.nyc.gov/html/dep/html/harborwater/harbor_
water_sampling_results.shtml
https://www.riverkeeper.org/water-quality/hudson-
river/nyc-hudson-bergen/
15
16
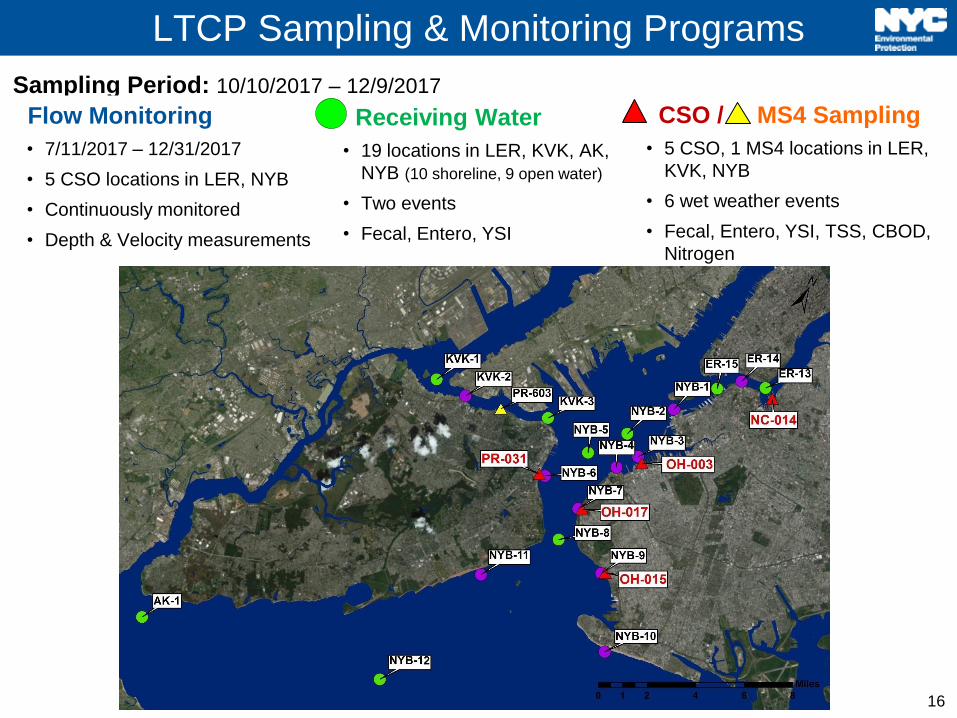
LTCP Sampling & Monitoring Programs
Sampling Period: 10/10/2017 – 12/9/2017
CSO / MS4 Sampling
• 5 CSO, 1 MS4 locations in LER,
KVK, NYB
• 6 wet weather events
• Fecal, Entero, YSI, TSS, CBOD,
Nitrogen
Receiving Water
• 19 locations in LER, KVK, AK,
NYB (10 shoreline, 9 open water)
• Two events
• Fecal, Entero, YSI
Flow Monitoring
• 7/11/2017 – 12/31/2017
• 5 CSO locations in LER, NYB
• Continuously monitored
• Depth & Velocity measurements

17
15
8
22 21 27 20
81
28
273
138 119 80
1
10
100
1,000
10,000
K5 K4 K3 KVK-1/K2
KVK-2 KVK-3/K1
Feca
l Co
lifo
rm, c
fu/1
00
mL
AK and KVK – Fecal Coliform
Sampling Period
(2017)
# Locations # Samples
Dry Wet
LTCP Oct 10 – Dec 9 3 8 26
HSM Jan 1 – Dec 31 5 14 11
SM Jan 1 – Dec 31 5 2 2
Sampling Details
Dry Weather Data
Wet Weather Data
Dry Weather Geomean
Wet Weather Geomean
K3 KVK-1/
K2
KVK-2 KVK-3/
K1 K4 K5
Arthur Kill Kill van Kull
LTCP2 Open Water
LTCP2 Shoreline
HSM
SM
CSO
1,000
17

18
LER and NYB – Fecal Coliform
Sampling Period
(2017)
# Locations # Samples
Dry Wet
LTCP Oct 10 – Dec 9 16 8 26
HSM Jan 1 – Dec 31 7 14 11
SM Jan 1 – Dec 31 11 2 2
Sampling Details
Dry Weather Data
Wet Weather Data
Dry Weather Geomean
Wet Weather Geomean
Lower NYB Upper NYB Lower East River
AK-1/
K5A
NYB-12/
K6
NYB-11/
S40 NYB-10/
N9
NYB-9/
GB1 NYB-8/
N8
NYB-7 NYB-6/
S39
NYB-5/
N7 NYB-4 NYB-3 NYB-2 N6 NYB-1/
S18
ER-15 ER-14 ER-13/
S16 /
S17
LTCP2 Open Water
LTCP2 Shoreline
HSM
SM
CSO
10
2
13 9 9 7
29 31 14 16
23 23 10
22 33 35
23 37
18 39
19
89 43
98 72 60 92 97 81
42 87 92 122 110
1
10
100
1,000
10,000
100,000
Feca
l Co
lifo
rm, c
fu/1
00
mL
18

19
6 3
4 5 9
4
39
11
59
25 22 20
1
10
100
1,000
10,000
K5 K4 K3 KVK-1/K2
KVK-2 KVK-3/K1
Ente
roco
cci,
cfu
/10
0m
L
AK and KVK – Enterococci
Sampling Period
(2017)
# Locations # Samples
Dry Wet
LTCP Oct 10 – Dec 9 3 8 26
HSM Jan 1 – Dec 31 5 14 11
Sampling Details
Dry Weather Data
Wet Weather Data
Dry Weather Geomean
Wet Weather Geomean
Arthur Kill Kill van Kull
K3 KVK-1/
K2
KVK-2 KVK-3/
K1 K4 K5
LTCP2 Open Water
LTCP2 Shoreline
HSM
CSO
100
19

20
3
1
2 2 2 1
4 7
3 5 5
3 3 5 5 6 6
17
4 8
4
13 9
13 15 11
16 17 15 14 16 21 21 20
1
10
100
1,000
10,000
AK-1/K5A
NYB-12/K6
NYB-11 NYB-10/N9
NYB-9/GB1
NYB-8/N8
NYB-7 NYB-6 NYB-5/N7
NYB-4 NYB-3 NYB-2 N6 NYB-1 ER-15 ER-14 ER-13
Ente
roco
cci,
cfu
/10
0m
L
LER and NYB – Enterococci
Sampling Period
(2017)
# Locations # Samples
Dry Wet
LTCP Oct 10 – Dec 9 16 8 26
HSM Jan 1 – Dec 31 7 14 11
Sampling Details
Dry Weather Data
Wet Weather Data
Dry Weather Geomean
Wet Weather Geomean
AK-1/
K5A
NYB-12/
K6
NYB-11 NYB-10/
N9
NYB-9/
GB1 NYB-8/
N8
NYB-7 NYB-6 NYB-5/
N7 NYB-4 NYB-3 NYB-2 N6 NYB-1 ER-15 ER-14 ER-13
Lower NYB Upper NYB Lower East River
LTCP2 Open Water
LTCP2 Shoreline
HSM
CSO
100
20

21
7.4 7.4 7.4 7.1 6.7 7.1 6.7 6.7 6.7 6.6 5.7
6.6
0.0
2.0
4.0
6.0
8.0
10.0
12.0
14.0
16.0
K5 K4 K3 KVK-1/K2
KVK-2 KVK-3/K1
Dis
solv
ed O
xyge
n, m
g/L
AK and KVK – Dissolved Oxygen
Sampling Period
(2017)
# Locations # Samples
Dry Wet
LTCP Oct 10 – Dec 9 3 8 26
HSM Jan 1 – Dec 31 5 28 22
Sampling Details
Arthur Kill Kill van Kull
K3 KVK-1/
K2
KVK-2 KVK-3/
K1 K4 K5
Dry Weather Data
Wet Weather Data
Dry Weather Average
Wet Weather Average
LTCP2 Open Water
LTCP2 Shoreline
HSM
CSO
21

22
7.4 7.7 6.8
7.3 7.6 7.6 7.3 7.6 7.3 6.7 6.4 6.4
7.8
6.4 6.5 6.7 6.3 6.7
7.9
5.6
7.1 7.2 7.0 6.3
7.1 6.7
5.6 5.5 5.5
7.0
5.5 5.7 5.3 5.5
0.0
2.0
4.0
6.0
8.0
10.0
12.0
14.0
16.0
AK-1/K5A
NYB-12/K6
NYB-11
NYB-10/N9
NYB-9/
GB1
NYB-8/N8
NYB-7 NYB-6 NYB-5/N7
NYB-4 NYB-3 NYB-2 N6 NYB-1 ER-15 ER-14 ER-13
Dis
solv
ed O
xyge
n, m
g/L
LER and NYB – Dissolved Oxygen
Sampling Period
(2017)
# Locations # Samples
Dry Wet
LTCP Oct 10 – Dec 9 16 8 26
HSM Jan 1 – Dec 31 7 28 22
Sampling Details
AK-1/
K5A
NYB-12/
K6
NYB-11 NYB-10/
N9
NYB-9/
GB1 NYB-8/
N8
NYB-7 NYB-6 NYB-5/
N7 NYB-4 NYB-3 NYB-2 N6 NYB-1 ER-15 ER-14 ER-13
Lower NYB Upper NYB Lower East River
Dry Weather Data
Wet Weather Data
Dry Weather Average
Wet Weather Average
LTCP2 Open Water
LTCP2 Shoreline
HSM
CSO
22

23
LTCP2/Citizen Comparison – Enterococci
LTCP2 Data
Citizen Data
LTCP2 Geomean
Citizen Geomean
Sampling
Period
(2017)
#
Locations
# Samples
Dry Wet
LTCP2 Oct 10 – Oct 31 4 4 16
Citizen May 1 – Sep 31 10 13 25
Sampling Details LTCP
Citizen
CSO
2 2 2 2
28 45
10 12 13
1
10
100
1,000 Dry Weather
11 15 13 12
42 31 22 30 22
1
10
100
1,000Wet Weather
En
tero
co
cci, c
fu/1
00m
L
En
tero
co
cci, c
fu/1
00m
L
23

24
Preliminary Gap Analysis
Station
Baseline Fecal Coliform Baseline Enterococcus
Annual Monthly GM
≤ 200cfu/100mL
Recreational
Season Monthly GM ≤
200cfu/100mL
Recreational
Season Monthly GM
< 30cfu/100mL
Recreational
Season Monthly STV
< 110cfu/100mL
KVK-1
KVK-2
KVK-3
AK-1 71%
NYB-12
NYB-11
NYB-10
NYB-9
NYB-8
NYB-7
NYB-6
NYB-5
NYB-4 89%
NYB-3
NYB-2
NYB-1 90%
ER-15 91%
ER-14 87%
ER-13 86%
≥ 95% Attainment
Notes: Preliminary Existing Conditions
Gap Analysis; Attainment based on
modeled 10-year averages. On March
21, 2019, DEC publicly noticed a
revision to the WQS and Classifications
for certain waterbodies. DEP is in the
process of modeling attainment with
the proposed standard and
classifications.
Lower East River
Upper NY Bay
Lower NY Bay
Kill van Kull
24

25
Water Quality Improvement Projects
Grey Infrastructure
Keith Mahoney, PE
Director of Water Quality Planning
DEP

26
Existing Grey Infrastructure Projects
Port Richmond WWTP Throttling Facility Regulator Improvements
Project Cost Status
Port Richmond WWTP Throttling Facility $4M Completed in June 2010
Outer Harbor CSO Regulator Improvements $4.5M Construction Completed in July 2008
3. Inner Harbor In-Line Storage $10M Construction Completed in April 2006
Total = $18.5M
1
2
1 2
3

27
Water Quality Improvement Projects
Green Infrastructure
Melissa Enoch
Program Manager, Private Incentives
DEP
28
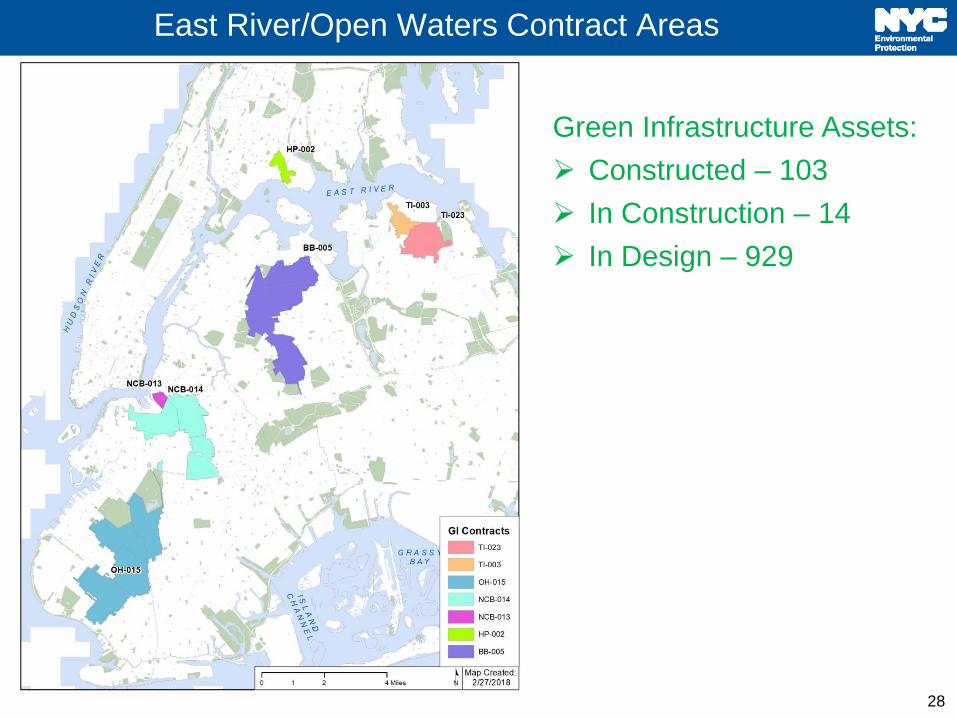
East River/Open Waters Contract Areas
Green Infrastructure Assets:
Constructed – 103
In Construction – 14
In Design – 929

29
Public Property Retrofits in East River/Open Waters
Before
Project Status
Parks/
Playgrounds
Public
Schoolyards Total
Preliminary 1 7 8
In Design 7 4 11
In Construction 14 0 14
Constructed 9 3 12
Total 31 14 45
After
P.S. 15 Roberto Clemente
333 East 4th Street, Manhattan

30
Private Property GI Programs
Green Infrastructure Grant Program
• More than $14.5 million committed to date to 35 private property
owners
• 26 grants awarded in EROW
NYC Housing and Preservation Department Partnership
• Establishing on-going funding source for GI as part of HPD new
affordable housing development
• 1 project in FY18, up to 5 projects in FY19 as initial investment
Ballet Tech The New School ATCO
31
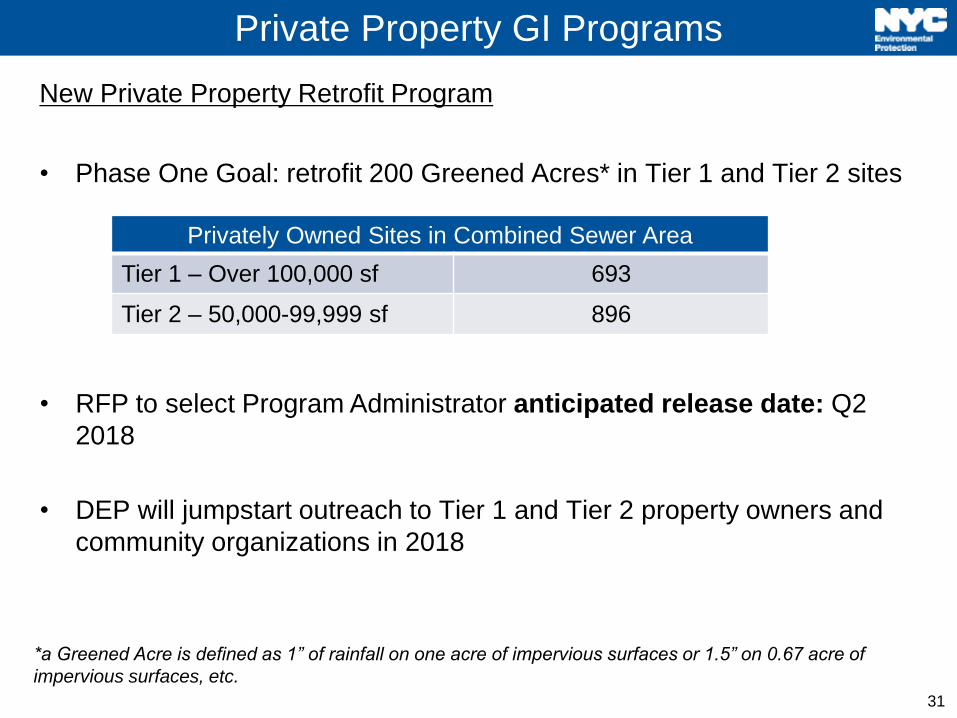
Private Property GI Programs
New Private Property Retrofit Program
• Phase One Goal: retrofit 200 Greened Acres* in Tier 1 and Tier 2 sites
• RFP to select Program Administrator anticipated release date: Q2
2018
• DEP will jumpstart outreach to Tier 1 and Tier 2 property owners and
community organizations in 2018
*a Greened Acre is defined as 1” of rainfall on one acre of impervious surfaces or 1.5” on 0.67 acre of
impervious surfaces, etc.
Privately Owned Sites in Combined Sewer Area
Tier 1 – Over 100,000 sf 693
Tier 2 – 50,000-99,999 sf 896

32
Other Private Property GI Opportunities
2012 Stormwater Rule:
In 2012, DEP amended the allowable flow rate of stormwater to the
City’s combined sewer system for new and existing development. Site
Connection Proposals may include green infrastructure technologies
to meet the new allowable rate.

33
LTCP Modeling and
Alternatives Development Process
Keith Mahoney, PE
Director of Water Quality Planning
DEP
34
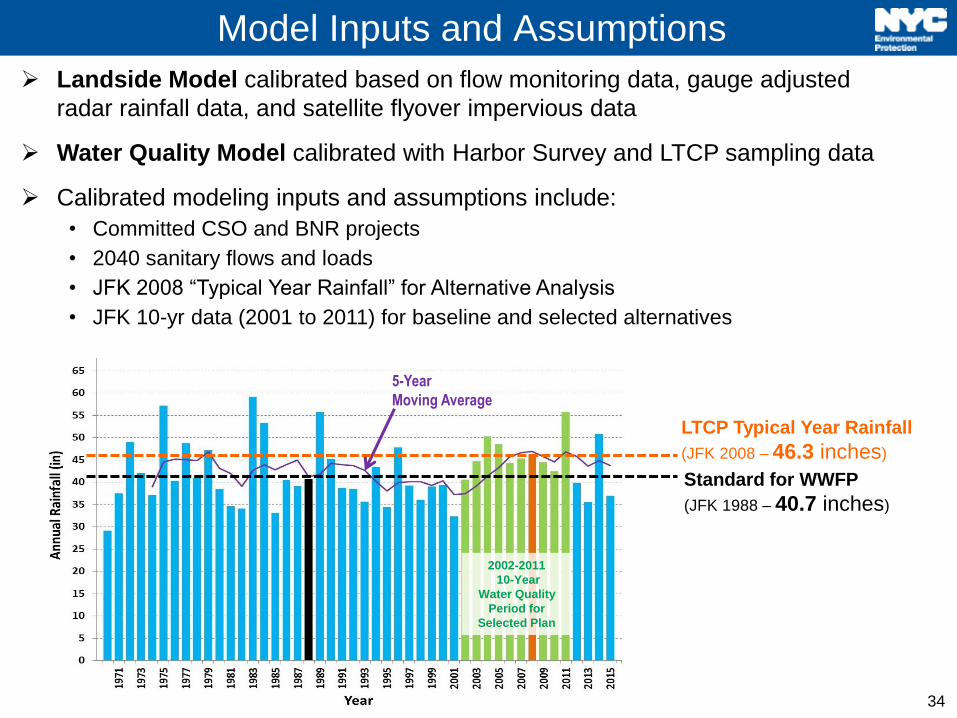
Model Inputs and Assumptions
Landside Model calibrated based on flow monitoring data, gauge adjusted
radar rainfall data, and satellite flyover impervious data
Water Quality Model calibrated with Harbor Survey and LTCP sampling data
Calibrated modeling inputs and assumptions include:
• Committed CSO and BNR projects
• 2040 sanitary flows and loads
• JFK 2008 “Typical Year Rainfall” for Alternative Analysis
• JFK 10-yr data (2001 to 2011) for baseline and selected alternatives
5-Year
Moving Average
Standard for WWFP
(JFK 1988 – 40.7 inches)
LTCP Typical Year Rainfall
(JFK 2008 – 46.3 inches)
2002-2011
10-Year
Water Quality
Period for
Selected Plan

35
CSO Control Evaluation Process
1. Bacteria Source Component Analysis
CSO, stormwater and direct drainage
2. Gap Analysis for Water Quality Standard
(WQS) Attainment
Calculate bacteria and dissolved oxygen for:
Baseline Conditions
100% CSO Control Conditions
3. Assess Levels of CSO Control Necessary
to Achieve WQS
4. Identify Technologies to Cost-Effectively
Achieve the Required Level of CSO Control
Inc
rea
sin
g C
SO
Re
du
ctio
n P
ote
ntia
l Storage
Treatment
System
Optimization
Source
Control
Sample
Technologies:

36
Source Control Green Infrastructure Storm Sewers
System
Optimization Fixed Weir
Parallel
Interceptor /
Sewer
Bending Weirs
Control Gates
Pump
Station
Optimization
Pump
Station
Expansion
CSO
Relocation
Gravity Flow Tipping
to Other Watersheds
Pumping Station
Modification
Flow Tipping with
Conduit/Tunnel and Pumping
Water Quality /
Ecological
Enhancement
Floatables
Control
Environmental
Dredging Wetland Restoration & Daylighting
Treatment
Satellite:
Centralized:
Outfall
Disinfection Retention Treatment Basin (RTB)
High Rate
Clarification (HRC)
WWTP Expansion
Storage In-System Shaft Tank Tunnel
CSO Mitigation Toolbox

37
Next Steps
Mikelle Adgate
Senior Policy Advisor
DEP

38
Next Steps
Alternatives and LTCP Recommendation Meetings, TBD
Public opportunity to review and comment on DEP’s selected
alternative before the LTCP is submitted to DEC
Comments can be submitted to:
• New York City DEP at: [email protected]

39
Additional Information & Resources
Visit the informational tables tonight for handouts and
poster boards with detailed information
Go to www.nyc.gov/dep/ltcp to access:
• LTCP Public Participation Plan
• Presentation, handouts and poster boards from this meeting
• Links to Waterbody/Watershed Facility Plans
• CSO Order including LTCP Goal Statement
• NYC’s Green Infrastructure Plan
• Green Infrastructure Pilots 2011 and 2012 Monitoring Results
• NYC Waterbody Advisory Program
• Upcoming meeting announcements
• Other LTCP updates


