Civil Liberties and War Chapter 5 of AMERICA AT WAR: PUBLIC OPINION DURING WARTIME, FROM WORLD WAR II TO IRAQ Preliminary Draft! May 18, 2007 For the most recent version, see: http://web.mit.edu/berinsky/www/civil.pdf Please do not cite, quote, or read too carefully (but comments are appreciated….) Adam J. Berinsky Associate Professor Massachusetts Institute of Technology Department of Political Science [email protected]
Transcript
Civil Liberties and War
Chapter 5 of
AMERICA AT WAR: PUBLIC OPINION DURING WARTIME, FROM WORLD WAR II TO IRAQ
Preliminary Draft!
May 18, 2007
For the most recent version, see: http://web.mit.edu/berinsky/www/civil.pdf
Please do not cite, quote, or read too carefully (but comments are appreciated….)
Adam J. Berinsky Associate Professor
Massachusetts Institute of Technology Department of Political Science
The tradeoff between security and civil liberties is always difficult to navigate in a
democratic society. As Sniderman, et al. (1996) argue, “Liberty is contestable because it
unavoidably collides, when choices must be made, with other values.” (1996, 244). During times
of national crisis, liberty does not always prevail. In the days and weeks after 9/11, evoking
earlier eras in the nation’s history, some commentators warned that the government’s offensive
against terrorist activity might subvert the democratic foundations of American society and
change the very way that ordinary citizens thought about their civil liberties. Elisa Massimino,
the director of the Washington office of the Lawyers Committee for Human Rights cautioned
that the Patriot Act would lead America down a troubling road: “These kinds of provisions, once
they infect a country’s justice system, are incredibly hard to cure” (New York Times, October
26, 2001). Would the public willingly cede their basic liberties to government authorities for the
promise of protection from unknown threats? Would they offer up the rights of groups of
minorities as sacrifices for that cause?
In late 2001, a number of organizations conducted in-depth investigations of America’s
commitment to civil liberties and political tolerance to answer just these questions. The overall
tenor of these findings provided mixed support for critics such as Massimino. On the whole,
support for civil liberties was lower than it had been before the attack (Pew Center for the People
and the Press Report, September 19, 2001).1 On the other hand, many scholars found that
aggregate support for civil liberties policy remained quite strong. For instance, Davis and Silver
(2004) found that a majority of the public took the pro-liberty position on two-thirds of questions
1 These findings can be found at http://people-press.org/reports/display.php3?PageID=30 (accessed May 18, 2007).
2
involving the tradeoff between security and civil liberties.2 While U.S. citizens may indeed have
been willing to accept greater restrictions on some liberties after 9/11, even in the wake of that
devastating terrorist attack, residual support for protecting civil liberties remained fairly strong.
However, not all citizens were so accepting of these basic liberties. As I will discuss in
more detail below, the overall picture of support for civil liberties may then have been one of
moderation, but that support was tempered by fear and trust. Some citizens held steadfast in their
support for liberties. Others – those who feared continued attacks, but trusted the government –
were quite willing to grant the government a wide berth in navigating the War on Terror.
These patterns of opinion should be familiar to scholars of American politics. In this
chapter I show that civil liberties judgments during wartime differ in depth and scope – not in
kind – to civil liberties judgments during times of peace. Put simply, the structure of civil
liberties judgments remain the same in times of war and in times of peace. Any change in how
individuals reason about civil liberties during war are a result of public reaction to a change in
the magnitude of threat, not a shift in the underlying dynamics of opinion. Civil liberties
judgments during war are simply an extreme realization of “normal politics.” Thus, as in
previous chapters, we can understand the nature of public opinion during war by looking to the
same kinds of processes that motivate domestic politics. However, breaking somewhat from the
theme of the last three chapters, I find an important exception to this rule; the political
implications of civil liberties during wartime may differ in some important respects from
ordinary civil liberties judgments. In particular, I make the novel argument that differences
2 Support for these liberties ranged from a slim majority of 53 percent who thought that the government should not be permitted to “arrest and detain a non-citizen indefinitely if that person is suspected of belonging to a terrorist organization” to a near-unanimous support level of 92 percent who believed that people who participate in nonviolent protests against the U.S. government “have the right to meet in public and express unpopular views as long as they are not violating the law.” These findings are largely consistent with other polls taken at that time (see Huddy et al. 2002), though it should be noted that some polling organizations found a shallower commitment to civil liberties (See discussion below).
3
among individuals in support for war determines in part their support for civil liberties during
time of threat and conflict. Perhaps most troubling for the prospects of an open democratic
society, the supporters of a war are the most enthusiastic about suppressing the speech of others,
including their opponents.
This chapter begins with a discussion of the formation of civil liberties judgments during
times of peace. I focus on the findings of the political tolerance literature, explicitly drawing
links between support for the rights of marginal groups and support for civil liberties more
generally. In both cases, a salient threat – whether from a particular group in society or from an
undifferentiated and ambiguous menace – reduces support for general civil liberties. I then draw
on data from a 30-year span to show that any threat – even one ostensibly unrelated to the target
of a particular civil liberties judgment – leads individuals to restrict the rights of others in times
of peace. Moreover, I find direct parallels between the public’s reactions to the attacks on the
Pentagon and the World Trade Center and the structure of civil liberties judgments at a very
different time in American history. As was the case in the months after 9/11, when they are
threatened, individuals who trust the government are more willing to cede their liberties to
political authorities than those who do not trust politicians in Washington. Having established the
general principles which structure public opinion concerning civil liberties, I examine data from
over 60 years of U.S. history and demonstrate that these same factors – namely threat and, in
some cases, group attachments and enmities, including partisan attachments – drive civil liberties
judgments during times of war.
4
Civil Liberties and Political Tolerance
When considered in the abstract, Americans have long expressed broad support for civil
liberties. In 1938, 92 percent of respondents said that they “believe in freedom of speech.” Forty
years later, McClosky and Brill (1983) found that 90 percent of Americans supported “free
speech for all, no matter what their view might be” (see also McClosky 1964; Prothro and Grigg
1960). But, as noted above, civil liberties are rarely contemplated in the abstract. In practice, as
Gibson and Bingham (1985) observe, support for civil liberties must be weighed against other
values and beliefs.
Much of the work conducted in the wake of 9/11 directly considers the balance between
support for civil liberties and government efforts to provide for the safety and security from
terrorism (Davis 2007; Davis and Silver 2004; Huddy et al. 2005; Jenkins-Smith and Herron
2006). Though level of support for particular civil liberties may have diminished in reaction to
the events of 9/11 and its political aftermath (see below), these findings regarding judgments
about those liberties in the wake of the attack comport with the findings of studies of civil
liberties during times of peace.
Scholars who study public support for civil liberties generally follow one of two research
traditions. Some scholars choose to study the types of questions which concern the proper scope
of government restrictions on basic civil liberties for a society as a whole. A second set of
scholars instead study “political tolerance” – the extension of fundamental rights to particular
groups in society. Researchers in the first tradition essentially ask, “What should we let the
government do to us (as a society as a whole)?” Scholars of political tolerance instead ask,
“What should we let the government do to others?” Though almost all scholars have studied
5
these two sets of judgments as distinct processes, the two traditions are, in large part, different
sides of the same coin. Both literatures address the treatment of the same general civil liberties,
such as free speech and free association. Moreover many scholars in both traditions look to
similar explanatory factors, such as the prevailing political climate and demographic variables
such as education. Of course, some important differences exist between the two types of
questions. The discussion in the last chapter of the treatment of Japanese-Americans
demonstrates that, in studies of political tolerance, affect towards disliked groups can play a large
role in determining civil liberties judgments. However, as Sniderman, Brody, and Tetlock (1991)
have shown, respondent judgments about the rights of particular groups are at least as reflective
of “principled” support for general democratic norms as they are about affect towards those
particular groups.3 Put another way, following Chong (1993), there are two classes of
considerations on civil liberties issues: (1) considerations of principles and rights and (2)
considerations about the people and groups that are involved in the issue, including
considerations about how the issue might affect oneself. The general tradeoff questions and the
tolerance items differ in the balance of these relevant considerations, but both give us a window
into general judgments regarding civil liberties. 4
Drawing these parallels between societal and group-specific measures of commitment to
civil liberties is valuable because the largest body of theoretic and empirical work on liberties
3 Sullivan et al (1982) also find that belief in democratic norms was one of the strongest predictors of political tolerance. 4 Echoing Davis, I find important linkages between the two research traditions. He writes, “Individual citizens were asked to tolerate government’s encroachment on civil liberties in the same way that many unpopular groups in American society challenge the democratic resolve of many of it’s citizens” (2007, 58). At an empirical level, scholars have observed a great deal of overlap between the two types of questions in studies of civil liberties after 9/11. Skitka et al. (2004) use a composite measure of support for civil liberties and find that both questions which concern the liberties of minority groups and a measure asking if the Bush administration has gone too far in restricting civil liberties to fight terrorism scaled on the same dimension. Similarly, Schildkraut (2002) finds that support for granting the police the power to stop and search: (1) anyone, (2) people who fit a terrorist profile, and (3) any Arab or Muslim are predicted by many of the same independent variables, most notably being worried about being a victim of an attack. As I demonstrate below, I find similar empirical overlap in the context of World War II.
6
comes out the political tolerance tradition. The proper measurement of political tolerance – the
extension of civil liberties to groups that express ideas in opposition to ones own – has been the
subject of volumous debate in political science. Seminal studies of public support for civil
liberties in the 1950s by Stouffer (1955) examined respondents’ willingness to grant free speech
to particular groups that lay outside of mainstream of society at that time, namely socialists,
atheists, and Communists. Stouffer found strong support for restricting the rights of these groups.
Researchers who studied public willingness to extend liberties to these same groups in the early
1970s found remarkable increases in tolerance. Some authors attributed these trends to changes
in society that created a political climate more tolerant of dissent (Davis 1975; Nunn, Crockett,
and Williams 1978). These increases, however, turned out be largely illusionary. Sullivan,
Pierson, and Marcus (1982) demonstrated that while Americans were, on the whole, more
tolerant in the 1970s of the particular groups that Stouffer investigated in the 1950s, this increase
in tolerance did not extend to other controversial groups in society. When Sullivan and his
colleagues measured an individual’s willingness to extend free speech to groups that an
individual said she disliked, they found levels of political intolerance comparable to that found
by Stouffer. Sullivan, Pierson, and Marcus therefore concluded that any apparent increase in
tolerance was a result of an increase in the likeability of socialists, atheists, and Communists, not
an increase in general support for civil liberties.5 Thus, Sullivan et al. proposed instead
measuring tolerance using their “least-liked” strategy where a researcher first asks which groups
a respondent dislikes and then assesses tolerance toward those groups. This measurement
strategy has been widely adopted in the study of tolerance (though see Gibson 1992).
5 However, Mueller (1988) notes that since Communists were not the most disliked group for all citizens in the 1950s, general tolerance almost certainly rose since that time.
7
Research in this tradition has found that the correlates of tolerance are similar to the
predictors of a commitment to civil liberties found by scholars in the months following 9/11. One
of the strongest findings in the tolerance literature is that conditions of threat – more precisely,
perceptions of conditions of threat – increase support for restrictions on civil liberties (Marcus et
al. 1995, Sullivan, et al. 1982). Looking in the 1950s, Stouffer found that respondents who felt
that American Communists who were a danger to the United States were more likely to support
restrictions on civil liberties than those who felt that Communists posed no danger. Sullivan et al
(1982) extended this analysis, measuring threat by asking respondents to describe the group they
liked the least using a series of paired polar adjectives – for instance violent/nonviolent and
unpredictable/predictable. They found that respondents were most intolerant of those groups they
found normatively threatening – groups that were viewed as “violent,” “dangerous,” or
“untrustworthy.” 6 In this view, threat – both its sources and its effects – are best viewed at the
group level. This conclusion seems on its face to be somewhat different from that of the authors
discussed above. For instance, Davis and Silver (2004) and Huddy et al. (2005) both examined
individuals’ general psychological reaction to threat and its effects on civil liberties more
generally.7 The broader view adopted by these authors is, however, consistent with more recent
work by Sullivan and his colleagues. Marcus et al (1995) found that those respondents who feel
threatened by many groups from across the ideological spectrum – individuals high on “threat
predisposition” – were most willing to restrict the civil liberties of any and all marginal groups.
In fact, the effect of general threat was even stronger than that of threat from the least-liked
group – what they call the “standing decision” regarding threat (see also Feldman and Stenner
6 Mueller (1988) argues that this measure, in fact, is better conceived as a measure of group dislike than as a measure of group threat. 7 Both sets of authors found that personal threat – the level of concerns for one’s own safety – had only a small effect on civil liberties judgments, they found that sociotropic threat – fear that the United States might suffer another terrorist attack – had a large effect on opinion.
8
1997; Stenner 2005). Thus, while threats from particular targets may be significant predictors of
intolerance, in times of peace as in times of war, it is general notion of threat – whatever its
source – that lead to support for restrictions on civil liberties.
The Politics of Fear
Data from the General Social Survey (GSS) allows us to put this assertion to a systematic
test. As expected, the similarities between findings in the wake of 9/11 on the one hand and
Sullivan et al. on the other regarding the relationship between threat and civil liberties extend
across a 30-year period covering times of war and peace. The GSS asks respondents about their
willingness to extend rights to five diverse targets from across the political spectrum, namely
racists, militarists, atheists, homosexuals and Communist.8 This measurement strategy is
consistent with Sullivan, Pierson, and Marcus’s admonition not to focus questions on political
targets of one ideological stripe. Following convention, I constructed an intolerance score by
computing the percent of the time a respondent supports restricting the civil liberties of a
particular group in a particular realm.9
8 Specifically the GSS asks if the target group should be permitted to engage in three public activities: (1) deliver public speeches, (2) have books that they write be available in public libraries, and (3) teach in colleges and universities. In effect, the GSS casts a wide net, hoping to find some disliked target group for every respondent. As Gibson notes, “the use of a broad range of fringe groups, as in the GSS, provides everyone an opportunity to express his or her intolerance.” (1992, 574). Gibson (1992) demonstrated that though the GSS battery and the content-controlled “least-liked” tolerance questions advanced by Sullivan and his colleagues were not highly correlated, the use of either variable led to similar conclusions regarding the determinants of tolerance. Gibson concludes that either measurement approach is adequate for measuring tolerance. I therefore use the GSS data to measure variation in levels of intolerance, both across individuals and over time. 9 Recently, Mondak and Sanders (2003; 2005) and Gibson (2005) carried out a debate over the best way to analyze trends in tolerance over time. Mondak and Sanders note that assessing trends in tolerance through the GSS battery is difficult because changes in tolerance might arise though true increases or decreases in tolerance or it might arise through changes in affect toward the specific target groups used by the GSS. In essence Mondak and Sanders argue that the problems identified by Sullivan et al. might contaminate the GSS data. Proceeding from Sullivan et al.’s definition of tolerance – “Political tolerance exists when respondents allow the full legal rights of citizenship to groups they themselves dislike” – Mondak and Sanders argue that tolerance is inherently dichotomous; advocating the restriction of the rights of any group constitutes intolerance. Adopting a dichotomous measurement strategy, the authors argue, sidesteps the problem caused by changing attitudes towards groups. As long as there is one group that a respondent dislikes, once can measure tolerance and changes in tolerance. Gibson writes that this position is incorrect, arguing that a continuous measure is preferable on theoretic grounds. Here I adopt Gibson’s strategy, but check my results using Mondak and Sanders’s dichotomous measure.
9
The GSS questions concerning threat are more limited. The GSS has asked one item
relating to fear of crime fairly consistently over the last 30 years. It reads, “Is there any area right
around here – that is, within a mile – where you would be afraid to walk alone at night?”10 This
item is less than ideal for a number of reasons. First, the item is phrased in a generic way with
few response options; it does not allow us to discriminate among respondents in terms of their
levels of threat. Furthermore, the item asks about personal threat, which, as several scholars have
noted, exerts a less powerful influence on political tolerance than a societal threat (see Davis
2007 for a review). At the same time, the particular limitation of this item allows for a strong test
of the effects of threat on civil liberties judgments. The GSS item does not make reference to any
of the groups included in the civil liberties battery and is therefore conceptually orthogonal to
those judgments. A finding that threat influences civil liberties judgments here – with a
somewhat poorly specified and operationalized concept of threat – provides strong evidence of
some relationship between general fear and civil liberties.
I predicted an individual’s intolerance score as a function of the threat variable,
controlling for factors plausibly associated with both levels of intolerance and threat.11 As
expected, I find that those respondents who are threatened by their neighborhood are more
willing to tolerate restrictions on civil liberties than those who are not.12 This effect is not
10 GSS included the item on the 1973, 1974, 1976, 1977, 1980, 1982, 1984, 1985, 1987, 1988, 1989, 1990, 1994, 1996, 1998, 2000, 2002, and 2004 surveys. 11The control variables were: age, education, region, and city size. The full model results are presented in the Appendix. I pooled the data across all years, including fixed effects for study year, using 1972 and 1973, as the baseline (the model would not converge if I included a separate dummy variable for 1972). I also ran these analyses separately in each year. The effect of the fear variable varied somewhat from year to year, and was not always statistically significant. However, the effect was always positive, ranging from 0.02 to 0.08 12I also ran my analysis with a measure of authoritarianism that was available in some of the surveys, under the assumption that individuals who scored high on the authoritarianism scale would be both more threatened by their neighborhood and less tolerant of political dissent. While authoritarianism had a large effect on intolerance, the inclusion of that measure did not change the effect of the threat variable.
10
particularly large – threatened respondents are the equivalent of three points on a 100 point scale
less tolerant than other respondents – but the difference is statistically significant. 13
The relationship between threat and intolerance is even stronger when I use better
measures of threat, which are contained only on a single survey. In 2000 respondents were asked
how afraid they were of nuclear war.14 This measure taps the preferred concept of sociotropic
threat – the threat to the nation as a whole, as oppose to a particular threat to the respondent –
and allows a greater gradation of levels of threat in the response. Analysis parallel to the “fear of
neighborhood” question above indicates that respondents who think war is more of a threat today
scored 13 points higher on the 100 point tolerance scale than those who thought it was less of a
threat.15
Most importantly, the GSS data allows us to directly investigate the proposition that
general threat – rather than the particular fear of war or foreign attack – determines in part the
civil liberties judgments of individuals. Davis and Silver (2004) explore the relationship between
threat and trust in government and find that those individuals who trusted the federal government
were also willing to give up their liberties. However, citizens’ level of trust in government
13 I also conducted analysis on trends in mean intolerance levels and mean threat over the last 30 years. These two trends follow somewhat different trajectories, but are clearly related. The correlation between the two series is .60 and a bivariate regression of intolerance levels on the threat measure indicates that a 10 percent increase in the proportion of people expressing fear in a given year is associated with a .08 movement on aggregate intolerance score (where 0 represents the most tolerant position and 1 is the least tolerant position). Moreover these results hold even accounting for the mid-1990s increase in the fear of crime. Using 1990 as the breaking point for the analysis, the correlation between tolerance and threat actually increases after 1989. Before 1990, the two series are correlated at 0.57, but after 1990, the correlation rises to 0.69. The effect of a 10 percent increase in fear level drops from 0.06 in the first time period to 0.03 in the second period, but remains statistically significant. Using the Mondak and Sanders approach, I find the same basic results, though the relationships are somewhat weaker. The threat and intolerance measures are correlated at 0.45 and regression analysis indicates that a 10 percent increase in the proportion of people expressing fear is associated with a .03 increase on aggregate intolerance score – an increase of more than one standard deviation. The convergence of the two sets of results should not be surprising since the continuous tolerance measure and the binary tolerance measure are correlated at 0.86. In any case, the data suggest that increases in aggregate levels of threat are related to increased support for restrictions on civil liberties. 14 Specifically, the GSS asked, “Are the following threats [nuclear war] to the United States greater, about the same, or less today than they were 10 years ago?” 15 This effect is statistically significant as well. I also ran the analysis using the three responses to the nuclear war variable as dummy variables and confirmed that the effect of the nuclear war threat variable is linear.
11
moderated the impact of the perceived threat of another attack. Fear of terrorism had no effect on
civil liberties judgments for respondents who expressed low levels of trust. On the other hand,
among respondents who placed a great deal of trust in the government, greater concern about
another attack was associated with much lower support for civil liberties (Davis and Silver
2004).16. Davis and Silver’s work is unique on this score; though it may not be surprising that
those individuals who place the most trust in the government are the most willing to allow the
government to restrict liberties, to my knowledge, no other scholars have explored the effect of
political trust on civil liberties judgments. There is, however, no reason to believe that the cause
of that fear should be particular to the terrorist attacks of 9/11. Citizens should cede authority to a
trusted actor when they are fearful, no matter the source of that fear.
In 1987, in addition to the civil liberties item and the threat question, the GSS asked
respondents how much they trusted the government.17 Analysis of the relationship among trust,
fear, and civil liberties indicate that in a very different context, using very different measures the
same pattern found by Davis and Silver unfolds. Among those who trust the government, the
effect of feeling threatened in one’s neighborhood increases support for restrictions by nine
percent of the tolerance scale; among those who do not trust the government, being fearful of
one’s neighborhood increases support for restrictions by four percent of the scale, a statistically
significant difference.18
16 Jenkins-Smith and Herron (2006) also find that trust in government is positively related to preferences for security over liberty. However, unlike Davis and Silver the authors do not explore the relationship between trust in government and threat, 17 The GSS trust item reads, “How much of the time do you think you can trust the government in Washington to do what is right – just about always, most of the time only some of the time, or almost never?” This item is identical to one of the two items used by Davis and Silver in their analysis discussed above (the other item read, “Is the government run by a few big interests, or is it run for the benefit of all people?”) 18 Given the potential importance of partisan judgments in determining political trust, I also include party identification as a control variable in this analysis. It should be noted, however, that there appear to be no statistical relationship between trust in government and partisanship at this moment in time (Hetherington 2007).
12
Certainly threat is not only reason that people support restriction on civil liberties. But it
is clear that the effects of threat and trust are part of a more general process that extends beyond
simply the case of a large attack, such as 9/11. Thus in the realm of civil liberties, as in other
aspects of war, it seems that public opinion follows patterns familiar from the ebb and flow of
normal domestic politics.
Civil Liberties after September 11th
As discussed above, the public’s judgments concerning civil liberties were somewhat in
flux in the wake of 9/11. Overall support for civil liberties was lower than it had been before the
attacks. But that picture is a single snapshot (though see Davis 2007).19 To further explore civil
liberties in the wake of 9/11, I turn to a series of polls taken by the Pew Center for the People and
the Press. The Pew Center has asked several questions concerning civil liberties over the last 10
years. Three of these items were asked repeatedly and allow us to trace opinion change over
time. The first question is roughly analogous to Davis and Silver’s general civil liberties item and
reads, “In order to curb terrorism in this country, do you think it will be necessary for the average
person to give up some civil liberties, or not?” This question provides an especially valuable
source of trend data because it was asked by Pew twice before September 11th, in both March
1996 and June 1997. The other Pew questions concerning civil liberties followed a similar
theme, but were worded in slightly different ways. Specifically, Pew asked a second item in 2001
and 2002 which read, “What concerns you more right now? That the government will fail to
enact strong, new anti-terrorism laws, or that the government will enact new anti-terrorism laws
which excessively restrict the average person's civil liberties?” A third item was asked beginning 19 Davis explores change in civil liberties judgments from 2001 to 2004, using panel data. Some of this work is discussed below.
13
in 2004 and read, “What concerns you more about the government’s anti-terrorism policies, that
they have not gone far enough to adequately protect the country or that they have gone too far in
restricting the average person’s civil liberties?”
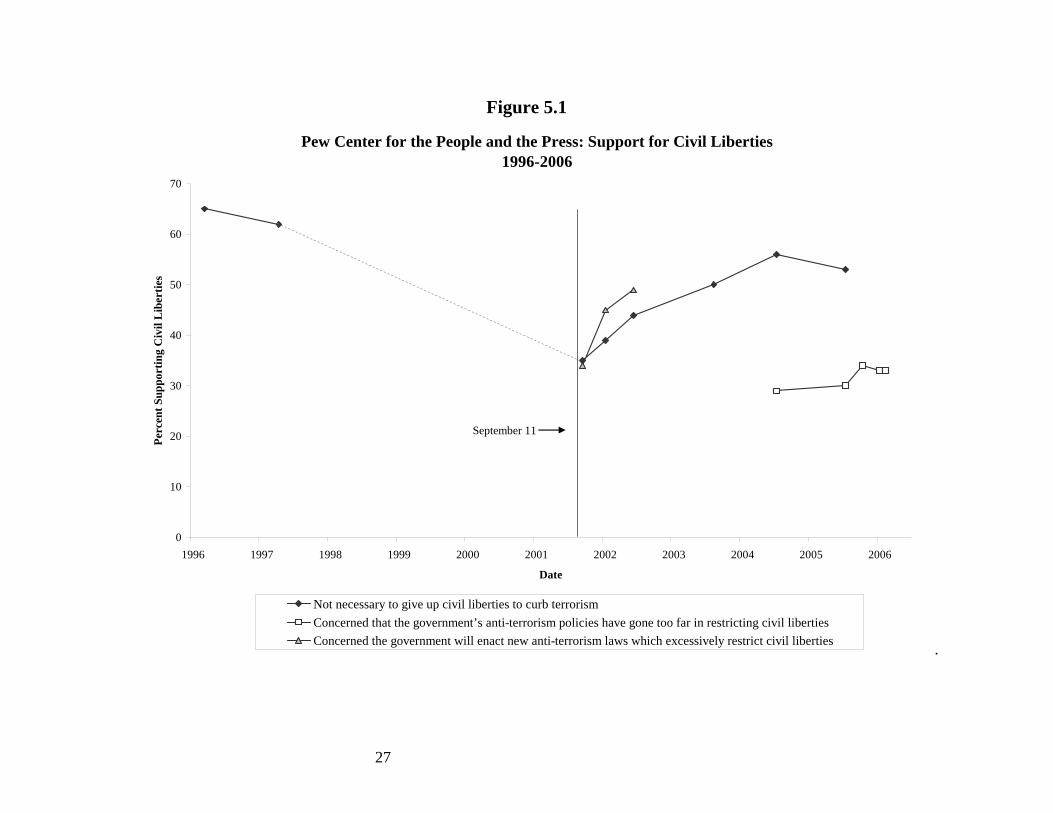
The over-time trends for these questions are presented in Figure 5.1. Before the attacks of
September 11th, a significant majority believed that it would not be necessary to sacrifice civil
liberties to curb terrorism. In the immediate wake of the attack, support for that position dropped
sharply.20 The September 2001 Pew survey also asked about support for a number of other
measures relating to restrictions on civil liberties. While these items differed in form from the
Davis and Silver tradeoff questions, they provide a similar picture of the depth of support for
civil liberties. Several proposed policies restricting civil liberties engendered high support. For
instance, seventy percent of respondents favored a requirement that citizens carry a national
identity card to show to a police officer on request. But respondents did not extend a blank check
to the government. Only 26 percent favored allowing the U.S. government to monitor personal
telephone calls and e-mails. Furthermore, a majority of 57 percent of respondents opposed
“allowing the U.S. government to take legal immigrants from unfriendly countries to internment
camps during times of tension or crisis” (though, echoing the Japanese experience during World
War II, 29 percent supported this position and 14 percent said that they did not know where they
stood on the matter). Thus, the effect of the terrorist attack on support for civil liberties was
clear. For whatever reason – the increased salience of threat, the unified elite positions in the
immediate wake of the attack, or some combination of the two – September 11th changed the 20 The Pew general civil liberties item indicates a lower level of support for the civil liberties position than the Davis and Silver survey described above. Recall that Davis and Silver found majority support for the civil liberties position in the tradeoff between security and civil liberties. The different results for the two surveys might be a result of slight differences in question wording. However, the results might also result from a fluke of the data. Davis and Silver replicated the general civil liberties/security tradeoff question in a 2003 survey. While aggregate support for most of the civil liberties items remained stable across the two surveys (Davis 2007). There was a 10 point drop in the civil liberty position in the general question. This pattern runs counter to both the expected results and the Pew data. Perhaps, then, the initial Davis and Silver results represent something of an outlier.
14
way that the country as a whole thought about civil liberties. Backing for restrictions on civil
liberties – both in the abstract and in specific – rose in the wake of the attack relative to the
peaceful times three years earlier.
Following the immediate aftermath of September 11th, however, the tide quickly turned.
Support for civil liberties climbed significantly, reaching a majority position by August 2003 and
nearing by 2004 the highs found in the late 1990s. The quick recovery in the erosion of support
for the position of protecting civil liberties was mirrored in other poll taken at that time (see
Huddy et al. 2002). Further poll data suggests that support for civil liberties has climbed even
further since that time, as Figure 5.1 demonstrates.21
Not everyone, however, was so quick to embrace the pro-civil liberties position. Cross-
sectional analysis of the Pew data indicates that the effects of threat persisted long after 9/11.
Pew measured threat using both sociotropic and personal threat questions on surveys from 2001
to 2004. Consistent with the findings reported above, sociotropic threat had a larger effect than
personal threat on every survey. Regardless of the measurement strategy, those respondents most
threatened by the possibility of a future attack were most supportive of restricting civil
liberties.22
21 As noted above the question asking “do you think it will be necessary for the average person to give up some civil liberties” was not asked after 2004. However, the parallel item measuring whether “the government has gone too far in restricting civil liberties “followed the same upward trend in support as the general civil liberties question in the time after 9/11. There is therefore reason to think that the third Pew question – which is worded in a manner similar to the government anti-terrorism question asked in 2001 and 2002 – captures general trends in civil liberties. Since support for the civil liberties position has been increasing since 2004, it stands to reason that general support for civil liberties has been rising as well. 22 Interestingly, at the same time that there was a large rise in support for the protection of civil liberties from January 2002 to August 2003, sociotropic threat dropped only marginally. In January 2002, 62 percent of respondents were “very worried” or “somewhat worried” that there would soon be a terrorist attack in the United States. In August 2003, 58 percent of respondents took such a position.
15
The Emergence of Partisanship
The continued effect of threat on opinion was not the only evidence that the familiar
forces of domestic politics shaped the dynamics of civil liberties after 2001. Partisanship has
largely been ignored in the tolerance literature, but it is a predisposition that, as demonstrated in
Chapter 3, is critical for understanding the structure of opinion during wartime.23 Davis (2007)
found that partisanship did not play a role in determining support for civil liberties in the
immediate aftermath of 9/11, arguing that a sense of patriotism in late 2001 was instrumental in
causing Democrats and independents to accept conservative positions. However, as blind
patriotism faded over time, partisanship emerged as an important fault point on civil liberties and
the relationship between partisanship and the civil liberty-security trade-off decision increased.
Pew did not measure party identification in its September 2001 survey, so it is not
possible to independently confirm the nature of partisan divisions in the immediate wake of the
attack. However Pew measured the respondent’s partisanship in ever other survey represented in
Figure 5.1.We can therefore explore trends in the degree of polarization in civil liberty
judgments along party lines. Before September 11, the available evidence suggests that
Democrats and Republicans came to similar judgments regarding the civil liberties/security
tradeoff. Republicans were, in fact, slightly less supportive of civil liberties restrictions, though
this difference was small and statically insignificant. However, Figure 5.2 presents a picture of a
growing partisan gap from 2002 onward, in line with developments on other issues associated
with the Bush administration (Jacobson 2007). In January 2002, relatively small differences
emerged between Democrats and Republicans. These differences have increased tremendously
over time. By 2006, the civil liberties tradeoff question exhibited the same pattern of partisan
23 Sullivan et al. (1982) used partisan attachment to estimate the “least-liked” groups of respondents, but did not explore the direct effects of partisan identification.
16
polarization found in measures of support for the Iraq war discussed in Chapter 3 (see Figure
5.3). Aggregate support for civil liberties grew as 9/11 receded into the past, but partisan
identifiers rejected the security position of that tradeoff at different rates. At the same time, as the
data from the late 1990s suggests, the emergence of the partisan gap on civil liberties judgments
does not represent a return to equilibrium. The gap between Democrats and Republicans instead
represents the emergence of a new fault line mirroring political debate on issues of both war and
peace more generally (Jacobson 2007). The Pew data therefore leads to an important conclusion.
The events of September 11 had an immediate impact on the tradeoff between security and civil
liberties, but public opinion quickly exhibited the contours of normal politics not only in the
levels of support for civil liberties but also in the partisan divisions that mirror the politics of the
day.
Civil Liberties and War
Partisanship and perceived threat are both important determinants of support for war. But
it could be that the state of war might change the overall structure of civil liberties judgments in
certain ways. The question is how attitudes toward the international realm might spill over to
domestic politics and affect civil liberties judgments.
From 2001 to 2006 Pew used different questions to gauge respondents’ willingness to
engage in aggressive foreign action. In the wake of September 11th, Pew asked “Do you favor or
oppose taking military action, including the use of ground troops, to retaliate against whoever is
responsible for the terrorist attacks.”24 Between 9/11 and the U.S. invasion of Iraq in 2003, Pew
24 This question was asked in two ways as part of a questions wording experiment. Half the sample was asked the retaliation question. The other half were asked the same question but with the qualification “even if it means that U.S. armed forces might suffer thousands of casualties?” Including the casualty caveat reduced support for retaliation somewhat, but effect of the retaliation variable on support for civil liberties was the same for both forms. I ran analysis including a dummy for question form and an interaction between form and the question. The coefficients were non-significant and I therefore combined the two for purposes of analysis.
17
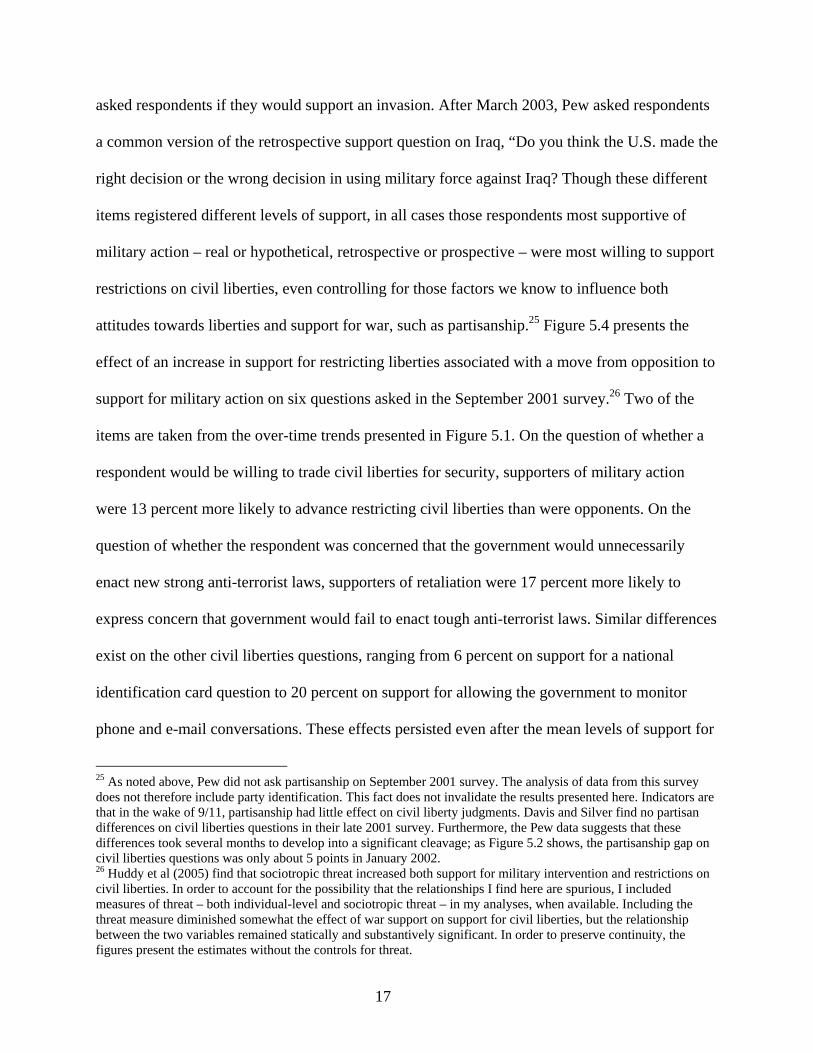
asked respondents if they would support an invasion. After March 2003, Pew asked respondents
a common version of the retrospective support question on Iraq, “Do you think the U.S. made the
right decision or the wrong decision in using military force against Iraq? Though these different
items registered different levels of support, in all cases those respondents most supportive of
military action – real or hypothetical, retrospective or prospective – were most willing to support
restrictions on civil liberties, even controlling for those factors we know to influence both
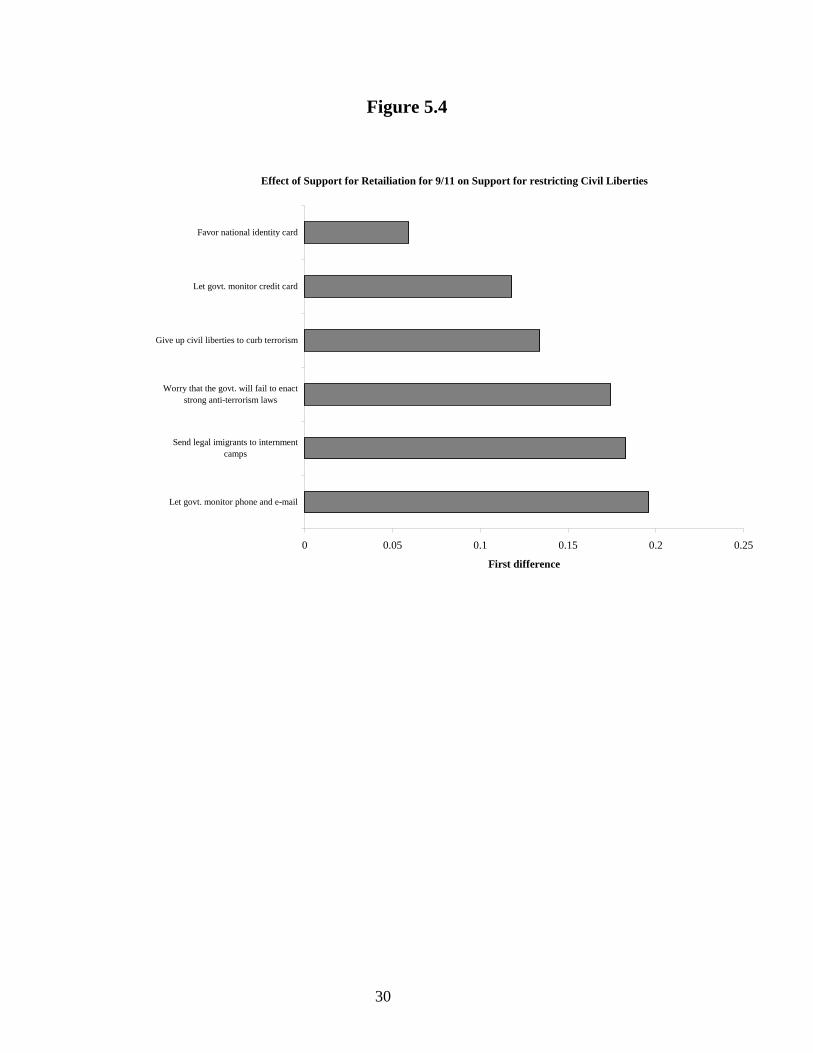
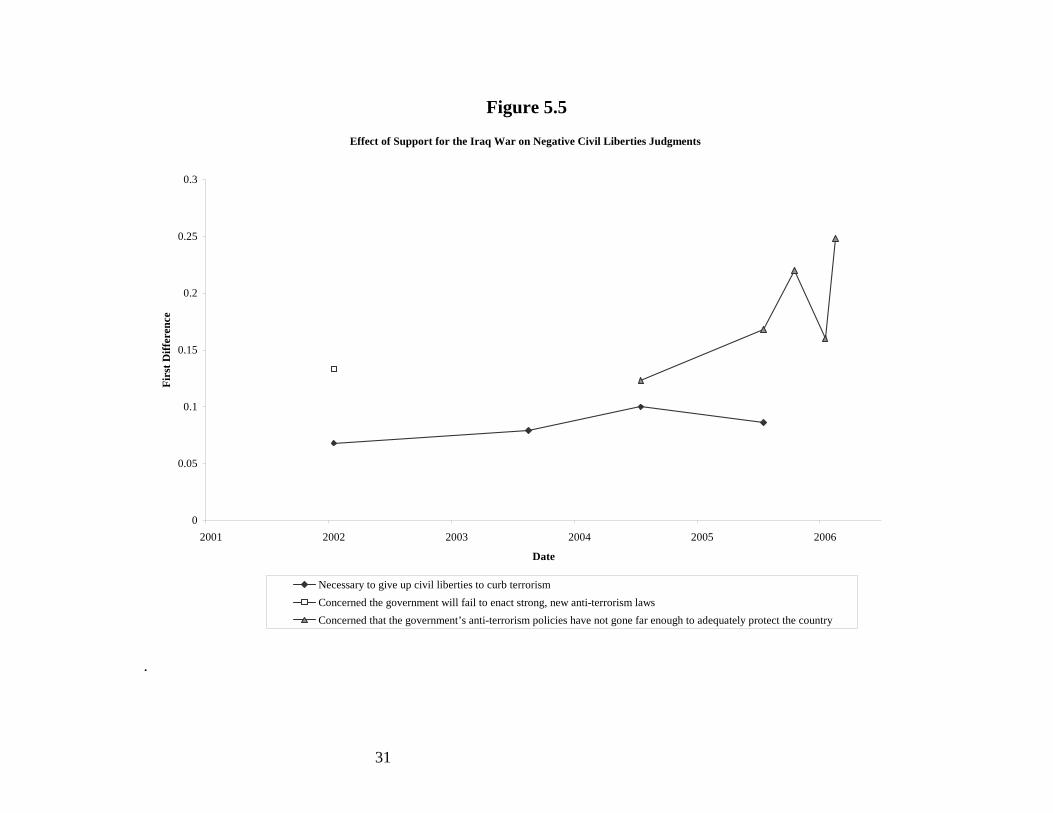
attitudes towards liberties and support for war, such as partisanship.25 Figure 5.4 presents the
effect of an increase in support for restricting liberties associated with a move from opposition to
support for military action on six questions asked in the September 2001 survey.26 Two of the
items are taken from the over-time trends presented in Figure 5.1. On the question of whether a
respondent would be willing to trade civil liberties for security, supporters of military action
were 13 percent more likely to advance restricting civil liberties than were opponents. On the
question of whether the respondent was concerned that the government would unnecessarily
enact new strong anti-terrorist laws, supporters of retaliation were 17 percent more likely to
express concern that government would fail to enact tough anti-terrorist laws. Similar differences
exist on the other civil liberties questions, ranging from 6 percent on support for a national
identification card question to 20 percent on support for allowing the government to monitor
phone and e-mail conversations. These effects persisted even after the mean levels of support for
25 As noted above, Pew did not ask partisanship on September 2001 survey. The analysis of data from this survey does not therefore include party identification. This fact does not invalidate the results presented here. Indicators are that in the wake of 9/11, partisanship had little effect on civil liberty judgments. Davis and Silver find no partisan differences on civil liberties questions in their late 2001 survey. Furthermore, the Pew data suggests that these differences took several months to develop into a significant cleavage; as Figure 5.2 shows, the partisanship gap on civil liberties questions was only about 5 points in January 2002. 26 Huddy et al (2005) find that sociotropic threat increased both support for military intervention and restrictions on civil liberties. In order to account for the possibility that the relationships I find here are spurious, I included measures of threat – both individual-level and sociotropic threat – in my analyses, when available. Including the threat measure diminished somewhat the effect of war support on support for civil liberties, but the relationship between the two variables remained statically and substantively significant. In order to preserve continuity, the figures present the estimates without the controls for threat.
18
civil liberties increased from 2002 to 2006. As figure 5.5 demonstrates, in every survey during
that time, supporters of war were more likely to advocate restricting civil liberties than were
opponents.27
An Aside: Support for the Vietnam War and Civil Liberties
The results concerning the relationship between support for war and support for
restrictions on civil liberties in the present day are strong and robust. It is possible, however, that
these results are particular to the present political climate. In the immediate wake of 9/11, the
link between a desire for an aggressive military response and the adoption of measures designed
to ensure security could have resulted from a sudden shift in elite rhetoric or the existence of a
salient threat to the United States. Over time, however, the political climate changed greatly. As
Figure 5.2 demonstrates, from 2002 onward, a large gap opened between Democrats and
Republicans on questions of adopting restrictions on civil liberties, just as it did on questions of
support for aggressive military action throughout the world. (Jacobson 2007; see Chapter 3). I
can account for the extreme polarization along partisan lines in judgments concerning both
military action and civil liberties judgments by accounting for partisan attachments in my
statistical analyses, as I do above. But perhaps even measures of partisanship cannot fully
capture the polarizing effect of the current political climate. To test the generality of these
findings, we it would be useful to examine the nature of this relationship in a less politically
polarized time.
Such a task is easier said than done. There exists very little individual-level survey data
concerning civil liberties judgments during times of war. Potentially fruitful times, such as the 27 These first differences are generated from logit analysis which control for the partisanship and demographic characteristics of the respondents.
19
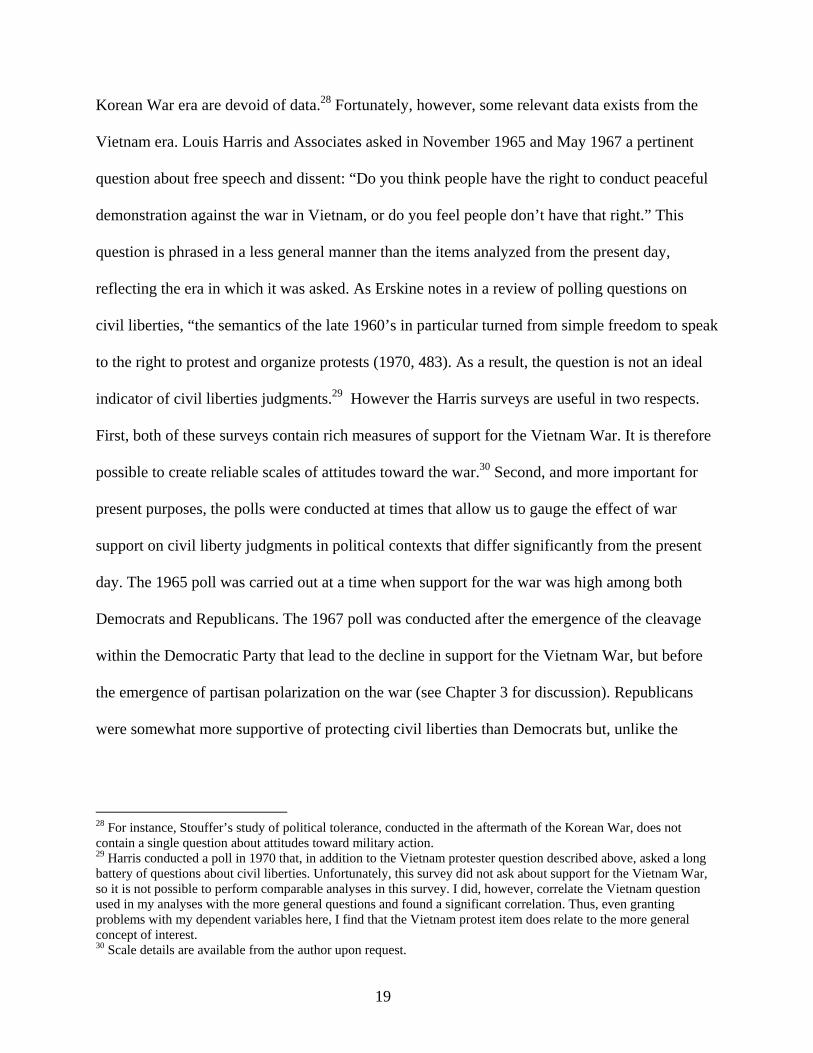
Korean War era are devoid of data.28 Fortunately, however, some relevant data exists from the
Vietnam era. Louis Harris and Associates asked in November 1965 and May 1967 a pertinent
question about free speech and dissent: “Do you think people have the right to conduct peaceful
demonstration against the war in Vietnam, or do you feel people don’t have that right.” This
question is phrased in a less general manner than the items analyzed from the present day,
reflecting the era in which it was asked. As Erskine notes in a review of polling questions on
civil liberties, “the semantics of the late 1960’s in particular turned from simple freedom to speak
to the right to protest and organize protests (1970, 483). As a result, the question is not an ideal
indicator of civil liberties judgments.29 However the Harris surveys are useful in two respects.
First, both of these surveys contain rich measures of support for the Vietnam War. It is therefore
possible to create reliable scales of attitudes toward the war.30 Second, and more important for
present purposes, the polls were conducted at times that allow us to gauge the effect of war
support on civil liberty judgments in political contexts that differ significantly from the present
day. The 1965 poll was carried out at a time when support for the war was high among both
Democrats and Republicans. The 1967 poll was conducted after the emergence of the cleavage
within the Democratic Party that lead to the decline in support for the Vietnam War, but before
the emergence of partisan polarization on the war (see Chapter 3 for discussion). Republicans
were somewhat more supportive of protecting civil liberties than Democrats but, unlike the
28 For instance, Stouffer’s study of political tolerance, conducted in the aftermath of the Korean War, does not contain a single question about attitudes toward military action. 29 Harris conducted a poll in 1970 that, in addition to the Vietnam protester question described above, asked a long battery of questions about civil liberties. Unfortunately, this survey did not ask about support for the Vietnam War, so it is not possible to perform comparable analyses in this survey. I did, however, correlate the Vietnam question used in my analyses with the more general questions and found a significant correlation. Thus, even granting problems with my dependent variables here, I find that the Vietnam protest item does relate to the more general concept of interest. 30 Scale details are available from the author upon request.
20
present day, the gap between the in-party and the out-party was very small.31 These polls
therefore enable us to gauge whether attitudes towards war are correlated with attitudes
concerning civil liberties in a very different time in history.
The majority of respondents on both Harris surveys supported the rights of the protesters.
In November 1965, 58 percent of respondents agreed that individuals should have the right to
conduct peaceful demonstrations and in May 1967, 61 percent took the pro-civil liberties side.
As in the present day, however, this support was tempered among those most supportive of war.
Figure 5.6 presents the effect of levels of war support on the probability of advocating a
restriction on the right of protest. Though the surveys were conducted in different political
contexts and use somewhat different indexes of war support, the results are the same; supporters
of the Vietnam War were the most enthusiastic about restricting the liberties of its opponents. In
1965, moving from an extreme anti-war position to an extreme pro-war position increased the
probability of supporting restrictions on protesters by 20 percent; in 1967 a comparable
movement on the war support scale increased support for restrictions by 28 percent. In sum,
though the measures of commitment to civil liberties may not be as deep or broad as the
measures found in the present day, in both cases, the conclusion regarding the link between
support for military action and commitment to tolerance are the same. Supporters of war are the
most eager to restrict the liberties of others in society.
Civil Liberties during WWII
Following the themes of previous chapters, World War II was not a unique moment in
American history from the standpoint of considering public opinion on civil liberties. The mass 31 Specifically, Republicans were about four percent more supportive than Democrats of the pro-civil liberty position.
21
public reacted in ways similar to Vietnam and the present day, and – more importantly for the
argument in this book – public opinion regarding civil liberties was largely structured in ways
consistent with patterns found in the domestic arena.
Comparable over-time data on support for civil liberties is somewhat thin for the World-
War II era. However, Gallup and OPOR asked several items that directly tapped support for free
speech. The first question concerned support for the rights of Fascists and Communists; a second
item asked about the rights of “radicals.” Both of these questions were first asked in 1938, before
open hostilities began and were then asked at several points during the war.32 These questions, of
course, are problematic in some respects. Most important, they both are affected by the concerns
of comparability raised by the work of Sullivan et al (1982). Public sentiment towards
Communists and radicals undoubtedly changed during the course of the war, as U.S. relations
with Russia developed into an alliance (albeit one of convenience). Before the war began, large
segments of the population viewed Communists as a threat to America – a threat even greater
than fascism. For instance, when Gallup asked in 1939, “Which do you think is the greater
danger to America – the Communists living in this country or the Nazis living in this country?”
49 percent of respondents replied that Communists posed the greater threat compared to the 44
who said Nazis.33 While Gallup did not define the term “radicals,” its historical association with
the Communist party undoubtedly colored respondent’s responses to the second civil liberties
item. With Germany’s attack on Russia in June 1941, the meaning of the target groups changed.
32 These questions were the second stage in a branching question. Gallup first asked, “Do you believe in freedom of speech?” Upwards of 92 percent of respondents said they did believe in free speech. As in the present day, the introduction of specific target groups dropped support greatly. 33 These aggregate data have not yet been weighted according to the procedures outline in Berinsky (2006). Later version of this paper will incorporate the proper weighting procedures, but early analysis indicates that using the weights will not alter the conclusions of the trend analysis.
22
Communists – and perhaps “radicals” – might not have been worthy of embrace, but these
groups were de facto allies of the U.S. in 1941 and formal allies by 1942.
It is, however, possible to indirectly account for the effect of changes in the sentiment
towards the particular groups targeted by the civil liberties question. As noted in Chapter 4, a
common question asked during World War II was, “Do you think Russia can be trusted to
cooperate with us when the war is over?” If we assume that individuals who do not trust Russia
have greater negative affect towards radicals than those who do trust the Soviet Union, this
question can be used as a rough proxy for negative sentiment towards “radicals.”34 I therefore
examine trends in tolerance among both the full sample and the subset of respondents who said
they would not trust Russia after the war.
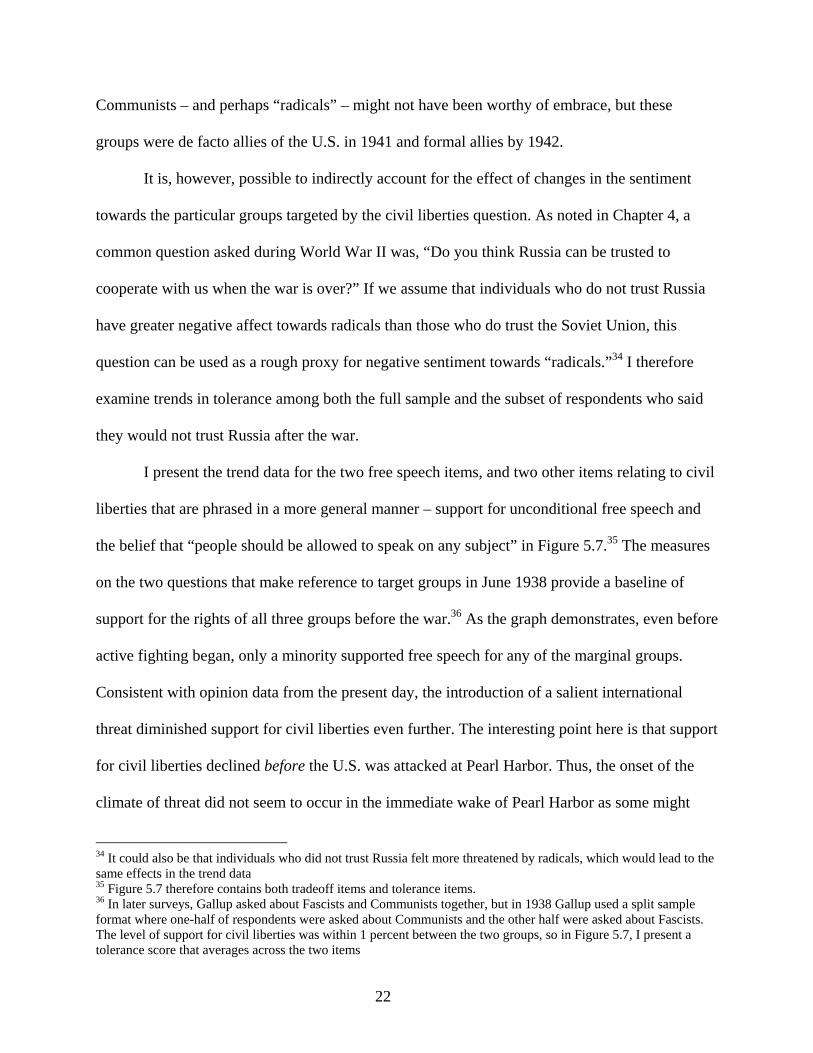
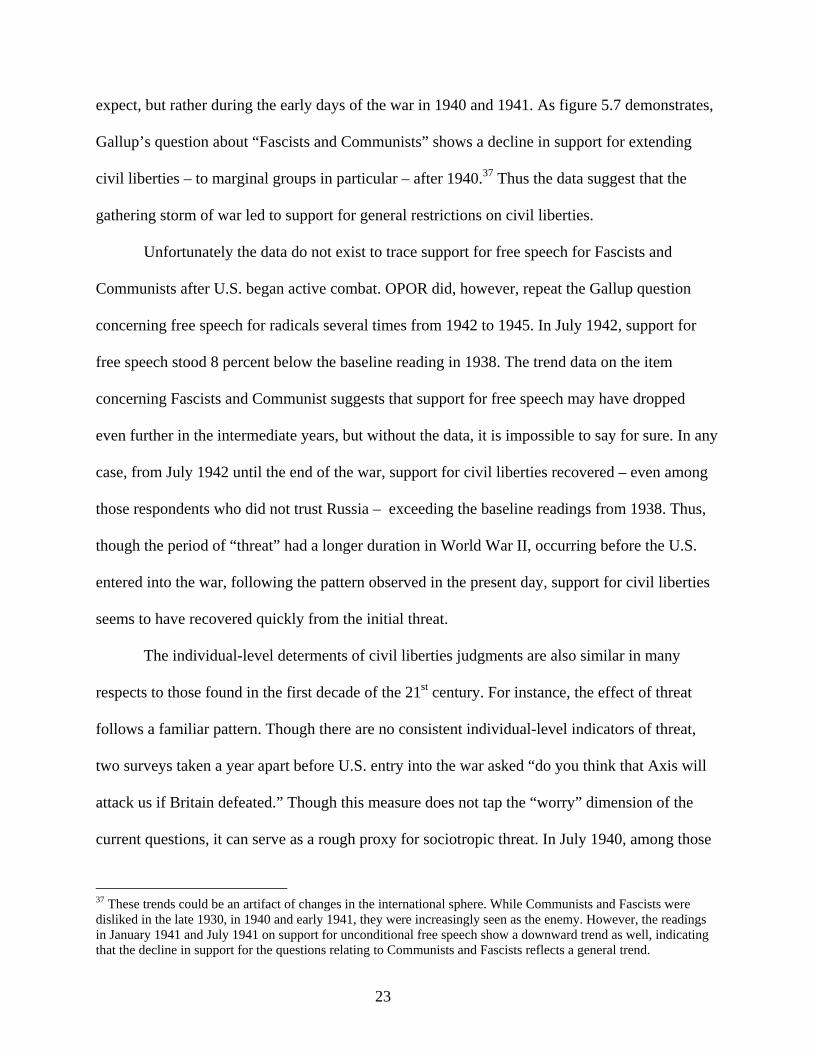
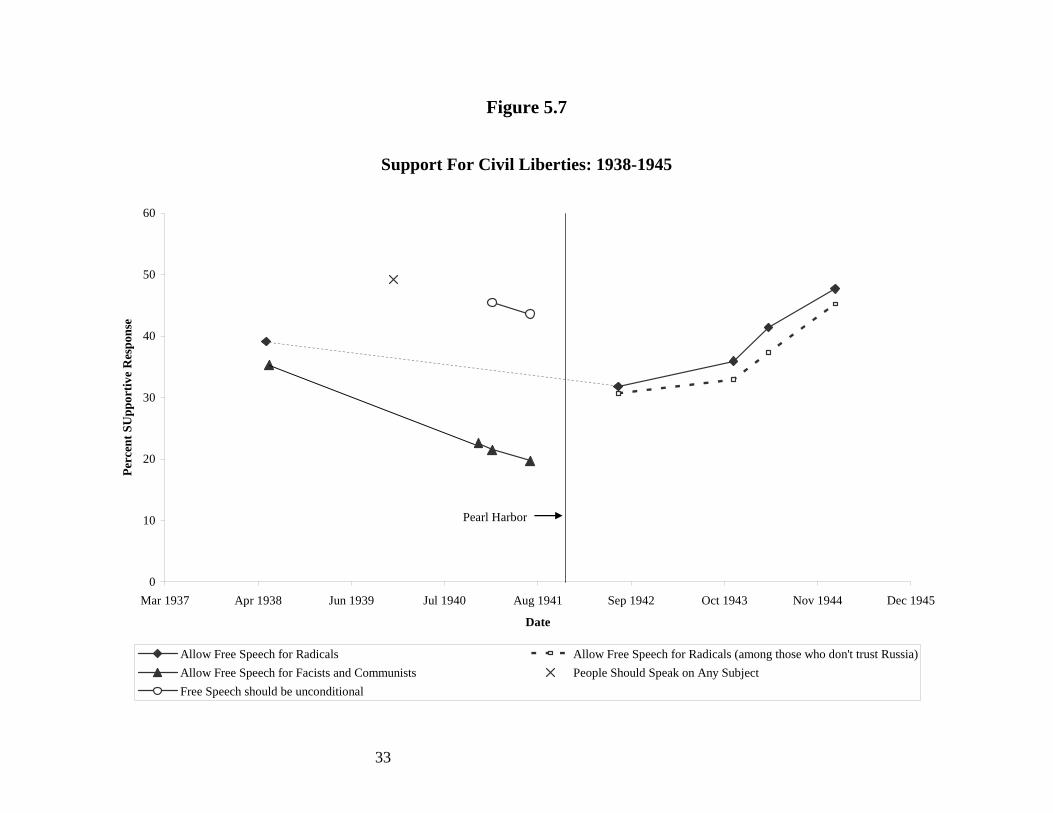
I present the trend data for the two free speech items, and two other items relating to civil
liberties that are phrased in a more general manner – support for unconditional free speech and
the belief that “people should be allowed to speak on any subject” in Figure 5.7.35 The measures
on the two questions that make reference to target groups in June 1938 provide a baseline of
support for the rights of all three groups before the war.36 As the graph demonstrates, even before
active fighting began, only a minority supported free speech for any of the marginal groups.
Consistent with opinion data from the present day, the introduction of a salient international
threat diminished support for civil liberties even further. The interesting point here is that support
for civil liberties declined before the U.S. was attacked at Pearl Harbor. Thus, the onset of the
climate of threat did not seem to occur in the immediate wake of Pearl Harbor as some might
34 It could also be that individuals who did not trust Russia felt more threatened by radicals, which would lead to the same effects in the trend data 35 Figure 5.7 therefore contains both tradeoff items and tolerance items. 36 In later surveys, Gallup asked about Fascists and Communists together, but in 1938 Gallup used a split sample format where one-half of respondents were asked about Communists and the other half were asked about Fascists. The level of support for civil liberties was within 1 percent between the two groups, so in Figure 5.7, I present a tolerance score that averages across the two items
23
expect, but rather during the early days of the war in 1940 and 1941. As figure 5.7 demonstrates,
Gallup’s question about “Fascists and Communists” shows a decline in support for extending
civil liberties – to marginal groups in particular – after 1940.37 Thus the data suggest that the
gathering storm of war led to support for general restrictions on civil liberties.
Unfortunately the data do not exist to trace support for free speech for Fascists and
Communists after U.S. began active combat. OPOR did, however, repeat the Gallup question
concerning free speech for radicals several times from 1942 to 1945. In July 1942, support for
free speech stood 8 percent below the baseline reading in 1938. The trend data on the item
concerning Fascists and Communist suggests that support for free speech may have dropped
even further in the intermediate years, but without the data, it is impossible to say for sure. In any
case, from July 1942 until the end of the war, support for civil liberties recovered – even among
those respondents who did not trust Russia – exceeding the baseline readings from 1938. Thus,
though the period of “threat” had a longer duration in World War II, occurring before the U.S.
entered into the war, following the pattern observed in the present day, support for civil liberties
seems to have recovered quickly from the initial threat.
The individual-level determents of civil liberties judgments are also similar in many
respects to those found in the first decade of the 21st century. For instance, the effect of threat
follows a familiar pattern. Though there are no consistent individual-level indicators of threat,
two surveys taken a year apart before U.S. entry into the war asked “do you think that Axis will
attack us if Britain defeated.” Though this measure does not tap the “worry” dimension of the
current questions, it can serve as a rough proxy for sociotropic threat. In July 1940, among those
37 These trends could be an artifact of changes in the international sphere. While Communists and Fascists were disliked in the late 1930, in 1940 and early 1941, they were increasingly seen as the enemy. However, the readings in January 1941 and July 1941 on support for unconditional free speech show a downward trend as well, indicating that the decline in support for the questions relating to Communists and Fascists reflects a general trend.
24
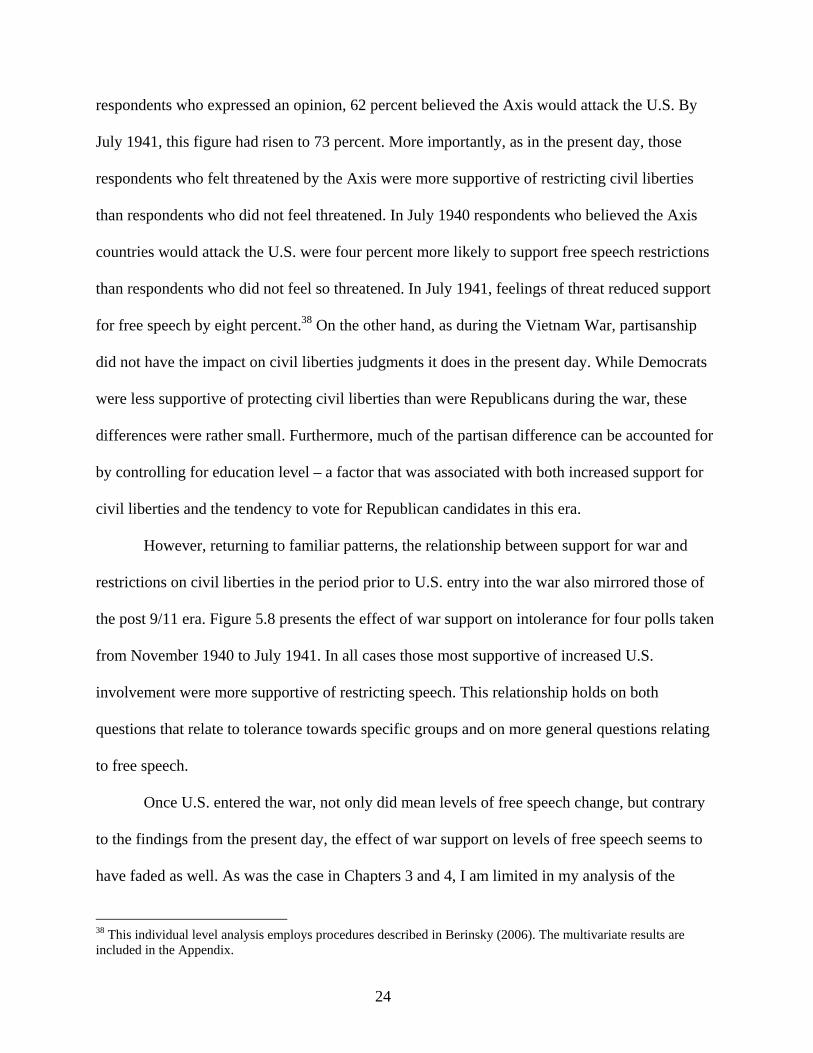
respondents who expressed an opinion, 62 percent believed the Axis would attack the U.S. By
July 1941, this figure had risen to 73 percent. More importantly, as in the present day, those
respondents who felt threatened by the Axis were more supportive of restricting civil liberties
than respondents who did not feel threatened. In July 1940 respondents who believed the Axis
countries would attack the U.S. were four percent more likely to support free speech restrictions
than respondents who did not feel so threatened. In July 1941, feelings of threat reduced support
for free speech by eight percent.38 On the other hand, as during the Vietnam War, partisanship
did not have the impact on civil liberties judgments it does in the present day. While Democrats
were less supportive of protecting civil liberties than were Republicans during the war, these
differences were rather small. Furthermore, much of the partisan difference can be accounted for
by controlling for education level – a factor that was associated with both increased support for
civil liberties and the tendency to vote for Republican candidates in this era.
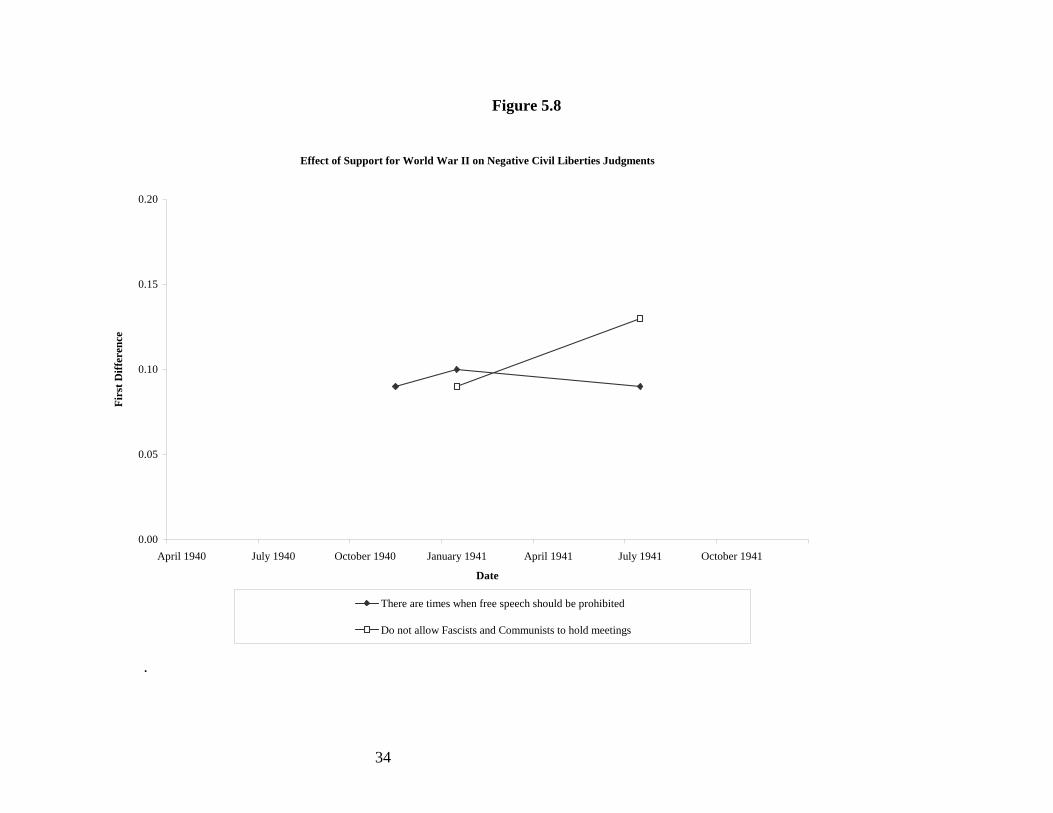
However, returning to familiar patterns, the relationship between support for war and
restrictions on civil liberties in the period prior to U.S. entry into the war also mirrored those of
the post 9/11 era. Figure 5.8 presents the effect of war support on intolerance for four polls taken
from November 1940 to July 1941. In all cases those most supportive of increased U.S.
involvement were more supportive of restricting speech. This relationship holds on both
questions that relate to tolerance towards specific groups and on more general questions relating
to free speech.
Once U.S. entered the war, not only did mean levels of free speech change, but contrary
to the findings from the present day, the effect of war support on levels of free speech seems to
have faded as well. As was the case in Chapters 3 and 4, I am limited in my analysis of the
38 This individual level analysis employs procedures described in Berinsky (2006). The multivariate results are included in the Appendix.
25
effects of war support by the nature of the data. But, as before, I use support for the stated policy
of unconditional surrender as a measure of war support. In the early period of the war, as
expected, opposition to making peace with the German army was positively related to opposition
for free speech. Over time, however, the relationship between the two quantities diminished.
These results are presented in Figure 5.9. In April 1942, the association between the two
variables was reduced by half, and by early 1945, it had reversed sign. One complication with
this analysis is that I am limited in the over-time analysis to a single imperfect measure of war
support. If we look at the refusal to make peace with Hitler item rather than the German army
form of the question as the war support variable in April 1944, the relationship between war
support and civil liberties restrictions tightens. Those least supportive of allowing Hitler to
unconditionally surrender are 8 percent more likely to support restricting the free speech of
radical, and effect 8 times as large as the effect reported in Figure 5.9 for the same time period.
This result does not, however, change my interpretation of the over-time change in the effect of
war support presented in Figure 5.9. During World War II, unlike the present day, an overall rise
in support for civil liberties coincided with a reduction in the difference between those most
supportive of stated U.S. war aims and the rest of the population.
Conclusion
In a democratic society, conditions of war inevitably lead to worries about civil liberties.
As the analysis presented in this chapter demonstrates, such fears may be well-founded. War can
diminish support for civil liberties both directly and indirectly. The environment of fear and
threat created by a state of crisis lead some citizens to support greater restrictions on certain basic
26
democratic rights. Moreover, supporters of military action are generally most willing to suppress
civil liberties.
War, however, does not inevitably threaten the foundations of democracy. Support for
civil liberties may dip with the onset of conflict, but in the aggregate, support for such liberties
recovers quickly. Moreover, the emergence of familiar domestic cleavages may in practice limit
the scope of restrictions on liberties. Such a process can be seen in the post-9/11 era. While
Republicans embraced both the general spirit and the particular provisions of the Patriot Act,
over time Democrats came to reject these measures. As long as the opposition party maintains an
independent position, the government may not be able to run roughshod over individual rights.
Moreover, even in times of partisan consensus there may be checks on the power of government.
During World War II, for instance, the effect of support for aggressive military action on civil
liberties judgments was large initially, but faded over time. In sum, for good and – as the case of
the treatment of Japanese Americans during World War II demonstrates – for bad, civil liberties
during times of war often follow the familiar patterns of civil liberties during times of peace.
27
Figure 5.1
Pew Center for the People and the Press: Support for Civil Liberties1996-2006
Not necessary to give up civil liberties to curb terrorismConcerned that the government’s anti-terrorism policies have gone too far in restricting civil libertiesConcerned the government will enact new anti-terrorism laws which excessively restrict civil liberties
September 11
.
28
Figure 5.2 Pew Center for the People and the Press: Partisan Gap in Support for Civil Liberties
Not necessary to give up civil liberties to curb terrorismConcerned that the government’s anti-terrorism policies have gone too far in restricting civil libertiesConcerned the government will enact new anti-terrorism laws which excessively restrict civil liberties
.
29
Figure 5.3
0
0.1
0.2
0.3
0.4
0.5
0.6
0.7
0.8
0.9
0 1
Political Interest
Prob
abili
ty o
f say
ing
gove
rnm
ent's
ant
i-ter
rori
sm p
olic
ies
have
not
gon
e fa
r en
ough
in r
estr
iting
libe
rtie
s
Democrats Republicans
MinimumInterest
MaximumInterest
Pew Center for the People and the Press: Support for Civil Liberties:January 2006
30
Figure 5.4
Effect of Support for Retailiation for 9/11 on Support for restricting Civil Liberties
0 0.05 0.1 0.15 0.2 0.25
Let govt. monitor phone and e-mail
Send legal imigrants to internmentcamps
Worry that the govt. will fail to enactstrong anti-terrorism laws
Give up civil liberties to curb terrorism
Let govt. monitor credit card
Favor national identity card
First difference
31
Figure 5.5
Effect of Support for the Iraq War on Negative Civil Liberties Judgments
0
0.05
0.1
0.15
0.2
0.25
0.3
2001 2002 2003 2004 2005 2006
Date
Firs
t Diff
eren
ce
Necessary to give up civil liberties to curb terrorismConcerned the government will fail to enact strong, new anti-terrorism lawsConcerned that the government’s anti-terrorism policies have not gone far enough to adequately protect the country
.
32
Figure 5.6
Harris Vietnam Data
0
0.1
0.2
0.3
0.4
0.5
0.6
0 1
War Support
Prob
abili
ty o
f opp
osin
g th
e ri
ght t
o pr
otes
t
November 1965 May 1967
MinimumSupport
MaximumSupport
33
Figure 5.7
Support For Civil Liberties: 1938-1945
0
10
20
30
40
50
60
Mar 1937 Apr 1938 Jun 1939 Jul 1940 Aug 1941 Sep 1942 Oct 1943 Nov 1944 Dec 1945
Date
Perc
ent S
Upp
ortiv
e R
espo
nse
Allow Free Speech for Radicals Allow Free Speech for Radicals (among those who don't trust Russia)Allow Free Speech for Facists and Communists People Should Speak on Any SubjectFree Speech should be unconditional
Pearl Harbor
34
Figure 5.8
Effect of Support for World War II on Negative Civil Liberties Judgments
0.00
0.05
0.10
0.15
0.20
April 1940 July 1940 October 1940 January 1941 April 1941 July 1941 October 1941
Date
Firs
t Diff
eren
ce
There are times when free speech should be prohibited
Do not allow Fascists and Communists to hold meetings
.
35
Figure 5.9
Effect of Support for World War II on Allowing Free Speech for Radicals
-0.05
0.00
0.05
0.10
June 1942 December 1942 June 1943 December 1943 June 1944 December 1944 June 1945
Date
Firs
t Diff
eren
ce
36
Bibliography
Berinsky, Adam. J. 2006. “American Public Opinion in the 1930s and 1940s: The Analysis of
Quota-Controlled Sample Survey Data.” Public Opinion Quarterly 70 (4):499-529. Chong, Dennis. 1993. “How People Think, Reason, and Feel about Rights and Liberties.”
American Journal of Political Science 37 (3): 867-99. Davis, Darren W. 2007. Negative Liberty: Public Opinion And the Terrorist Attacks on America.
New York: Russell Sage Foundation. Davis, Darren W., and Brian D. Silver. 2004. Civil Liberties vs. Security in the Context of the
Terrorist Attacks on America. American Journal of Political Science 48 (1): 28-46 Davis, James. A. 1975. Communism, Conformity, Cohorts, and Categories: American Tolerance
in 1954 and 1972-73. American Journal of Sociology 81 (3):491-513 Erskine, Hazel. 1970. “The Polls: Freedom of Speech.” The Public Opinion Quarterly 34(3):
483-496. Feldman, Stanley and Karen Stenner. 1997. Perceived Threat and Authoritarianism. Political
Psychology. 18: 741-770. Gibson, James L. 1992. Alternative Measures of Political Tolerance: Must Tolerance be “Least-
Liked”? American Journal of Political Science 36 (2):560-577. Gibson, James L. 2005. “On the Nature of Tolerance: Dichotomous or Continuous?” Political
Behavior 27(4): 313-323. Gibson, James L. 2006. “Enigmas of Intolerance: Fifty Years after Stouffer’s Communism,
Conformity, and Civil Liberties.” Perspectives on Politics. 4(1): 21-34. Gibson, James L., and Richard D. Bingham. 1985. Civil liberties and Nazis : the Skokie free
speech controversy. New York: Praeger. Huddy, Leonie, Stanley Feldman. 2006. “Personal Threat, Domestic Security, and the Erosion of
Civil Liberties.” Paper prepared for presentation at the 2006 Annual Meeting of the International Society of Political Psychology, Barcelona, Spain..
Huddy, Leonie, Stanley Feldman, Charles Taber, and Gallya Lahav. 2005. “Threat, Anxiety, and
Support of Antiterrorism Policies.” American Journal of Political Science 49 (3):593-608.
37
Huddy, Leonie, Nadia Khatib, and Theresa Capelos. 2002. The Polls – Trends: Reactions to the Terrorist Attacks of September 11, 2001. Public Opinion Quarterly 66 (3):418-451.
Jacobson, Gary. C. 2007. A Divider, Not A Uniter: George W., Bush and the American People.
New York: Pearson/Longman. Jenkins-Smith, Hank C. and Kerry Herron. “Rock and a Hard Place: Public Willingness to Trade
Civil Rights and Liberties for Greater Security.” Paper prepared for presentation at the 2006 Annual Meeting of the American Political Science Association, Philadelphia, PA.
Marcus, George E., John L. Sullivan, Elizabeth Theiss-Morse, and Sandra L. Wood. 1995. With
malice towards some: how people make civil liberties judgments, Cambridge studies in political philosophy and public opinion. Cambridge; New York, NY, USA: Cambridge University Press.
McClosky, Herbert. 1964. “Consensus and Ideology in American Politics.” The American
Political Science Review 58 (2): 361-82 McClosky, Herbert, and Alida Brill. 1983. Dimensions of Tolerance: What Americans Believe
about Civil Liberties. New York: Russell Sage Foundation. Mondak, Jeffrey J. and Mitchell S. Sanders. 2003. “Tolerance and Intolerance, 1976-1998.”
American Journal of Political Science 47 (3):492-502. Mondak, Jeffrey J. and Mitchell S. Sanders. 2005. “The Complexity of Tolerance and
Intolerance Judgments: A Response to Gibson.” Political Behavior 27(4): 325-337. Mueller, John. 1988. “Trends in Political Tolerance.” Public Opinion Quarterly 52 (1): 1-25 Nunn, Clyde Z., Harry J. Crockett, and J. Allen Williams. 1978. Tolerance for nonconformity.
San Francisco: Jossey-Bass Publishers. Prothro, James W., and Charles M. Grigg. 1960. “Fundamental Principles of Democracy: Bases
of Agreement and Disagreement.” The Journal of Politics 22 (2): 276-94. Schildkraut, Deborah J. 2002. “The More Things Change … American Identity and Mass Elite
Responses to 9/11.” Political Psychology 23 (3): 511-535. Skitka, Linda J., Christopher W. Bauman, and Elizabeth Mullen. 2004. “Political Tolerance and
Coming to Psychological Closure Following the September 11, 2001, Terrorist Attacks: An Integrative Approach.” Personality and Social Psychology Bulletin 30 (6): 743-56.
Sniderman, Paul M., Richard A. Brody, and Philip E. Tetlock. 1991. Reasoning and Choice:
Explorations in Political Psychology. Cambridge, UK: Cambridge University Press
38
Sniderman, Paul M., Joseph F. Fletcher, Peter H. Russell, and Philip E. Tetlock. The clash of rights : liberty, equality, and legitimacy in pluralist democracy. New Haven [Conn.]: Yale University Press.
Stenner, Karen. 2005. The authoritarian dynamic, Cambridge studies in public opinion and
political psychology. Cambridge; New York, NY, USA: Cambridge University Press. Stouffer, Samuel Andrew. 1955. Communism, conformity, and civil liberties; a cross-section of
the Nation speaks its mind. Garden City, N.Y.,: Doubleday. Sullivan, John Lawrence, James Piereson, and George E. Marcus. 1982. Political tolerance and
American democracy. Chicago: University of Chicago Press. Toner, Robin A. and Neil A. Lewis. 2001“A Nation Challenged: Security and Liberty; A
Familiar Battle Fought and Won.” The New York Times. (October 26). p. 5. Zaller, John. 1992. The nature and origins of mass opinion. Cambridge: Cambridge University