25
CK POWER PUBLIC COMPANY LIMITED Corporate Presentation August 2014
0
CK POWER PUBLIC COMPANY LIMITED
Corporate Presentation
August 2014

1
Bangkok
Expressway
Public Company Limited (BECL)
TTW Public
Company Limited (TTW)
Ch. Karnchang
Public Company Limited (CK)
Public
CKP
Hydro Cogeneration Solar
SouthEast Asia
Energy Company Limited (SEAN)
Bangpa-in Cogeneration
Company Limited (BIC)
Nam Ngum 2
Company
Limited (NN2)
Bangkhenchai
Company Limited
Nakorn Ratchasima
Solar Company
Limited (NRS
Chiangrai Solar
Company Limited
(CRS)
56%
75%
65%
100%
30%
30%
Shareholder Strengths Developer Capability (Engineering, EPC)
Financial Strength
Corporate Governance
Check & Balance
Holding Strengths Funding Capability
Investment Channels
Diversified Portfolio
Subsidiaries Strengths
Long - Term Revenue Capability
Professional O&M Capability
Technical Expertise
31.78%
23.22% 25.00%
20.00%
15.15% 19.04%
Business Overview : Comprehensive Capability & Synergy Power
1
2
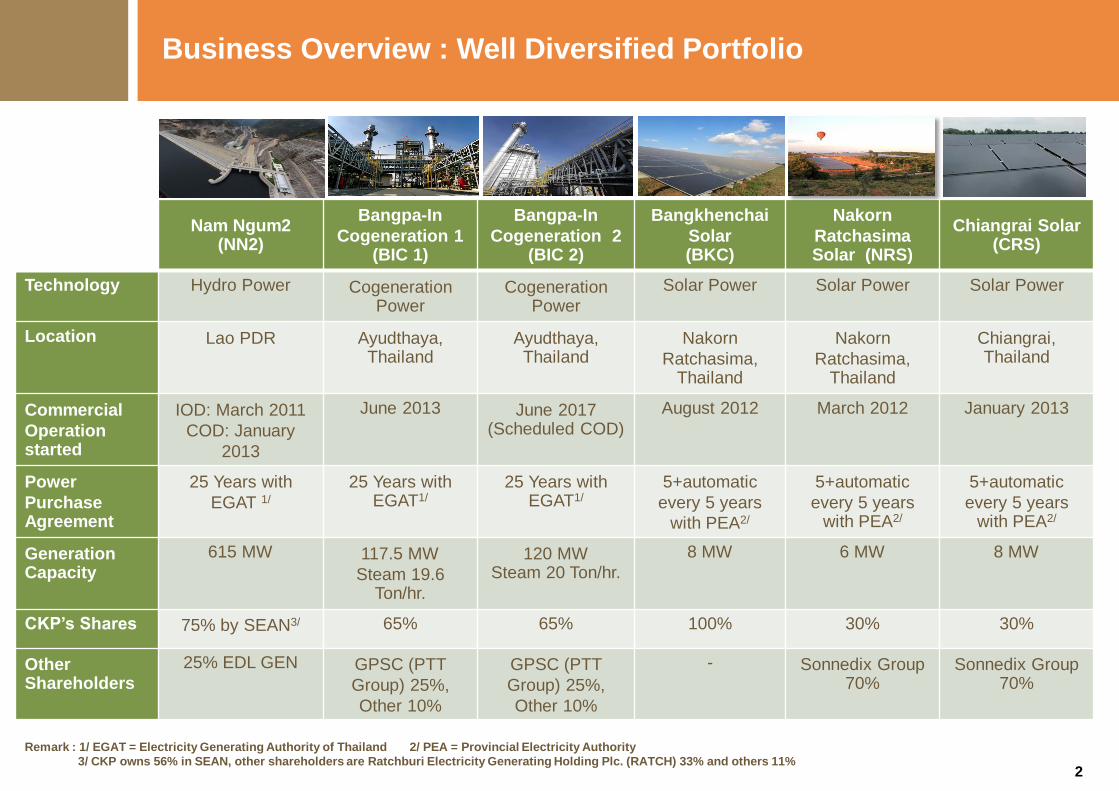
Nam Ngum2 (NN2)
Bangpa-In
Cogeneration 1 (BIC 1)
Bangpa-In
Cogeneration 2 (BIC 2)
Bangkhenchai
Solar (BKC)
Nakorn
Ratchasima Solar (NRS)
Chiangrai Solar (CRS)
Technology Hydro Power Cogeneration Power
Cogeneration Power
Solar Power Solar Power
Solar Power
Location Lao PDR Ayudthaya, Thailand
Ayudthaya, Thailand
Nakorn
Ratchasima, Thailand
Nakorn
Ratchasima, Thailand
Chiangrai, Thailand
Commercial
Operation started
IOD: March 2011
COD: January
2013
June 2013 June 2017 (Scheduled COD)
August 2012 March 2012 January 2013
Power
Purchase Agreement
25 Years with
EGAT 1/
25 Years with EGAT1/
25 Years with EGAT1/
5+automatic
every 5 years
with PEA2/
5+automatic
every 5 years with PEA2/
5+automatic
every 5 years with PEA2/
Generation Capacity
615 MW 117.5 MW
Steam 19.6 Ton/hr.
120 MW Steam 20 Ton/hr.
8 MW 6 MW 8 MW
CKP’s Shares 75% by SEAN3/ 65% 65% 100% 30% 30%
Other Shareholders
25% EDL GEN GPSC (PTT
Group) 25%,
Other 10%
GPSC (PTT
Group) 25%,
Other 10%
- Sonnedix Group 70%
Sonnedix Group 70%
Business Overview : Well Diversified Portfolio
2
Remark : 1/ EGAT = Electricity Generating Authority of Thailand 2/ PEA = Provincial Electricity Authority
3/ CKP owns 56% in SEAN, other shareholders are Ratchburi Electricity Generating Holding Plc. (RATCH) 33% and others 11%
3
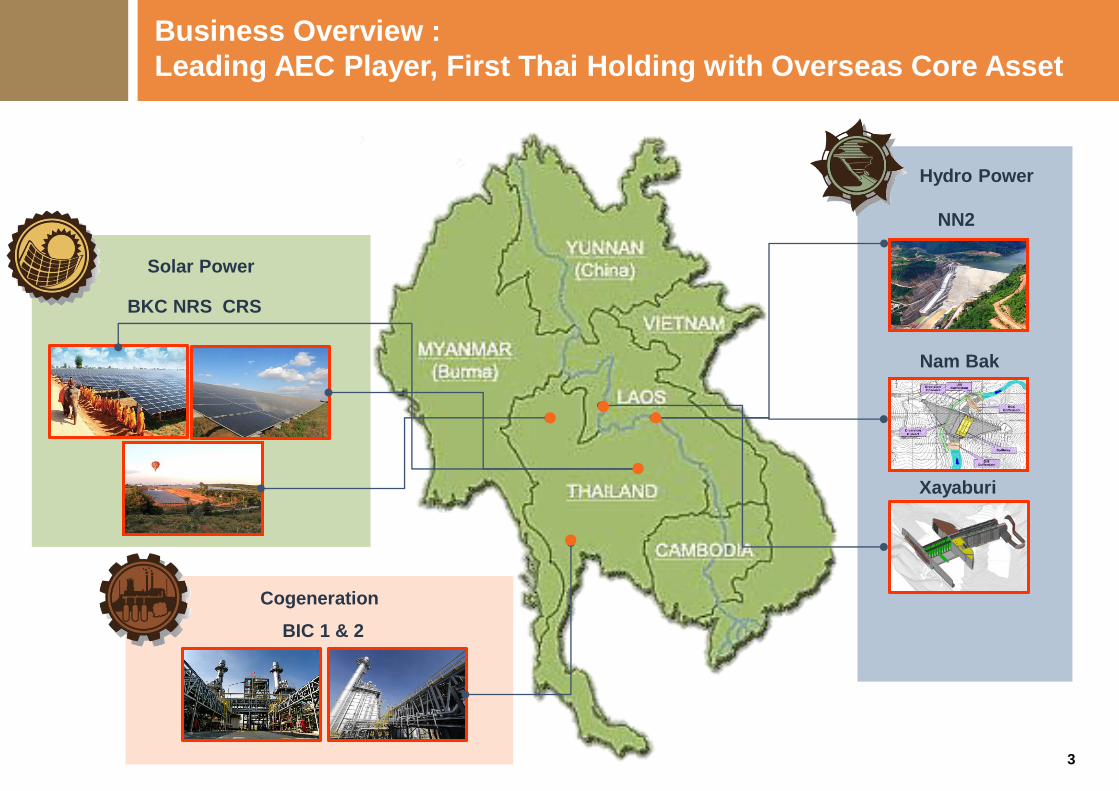
NN2
Nam Bak
Xayaburi
BIC 1 & 2
BKC NRS CRS
Business Overview :
Leading AEC Player, First Thai Holding with Overseas Core Asset
Hydro Power
Cogeneration
Solar Power
3
4
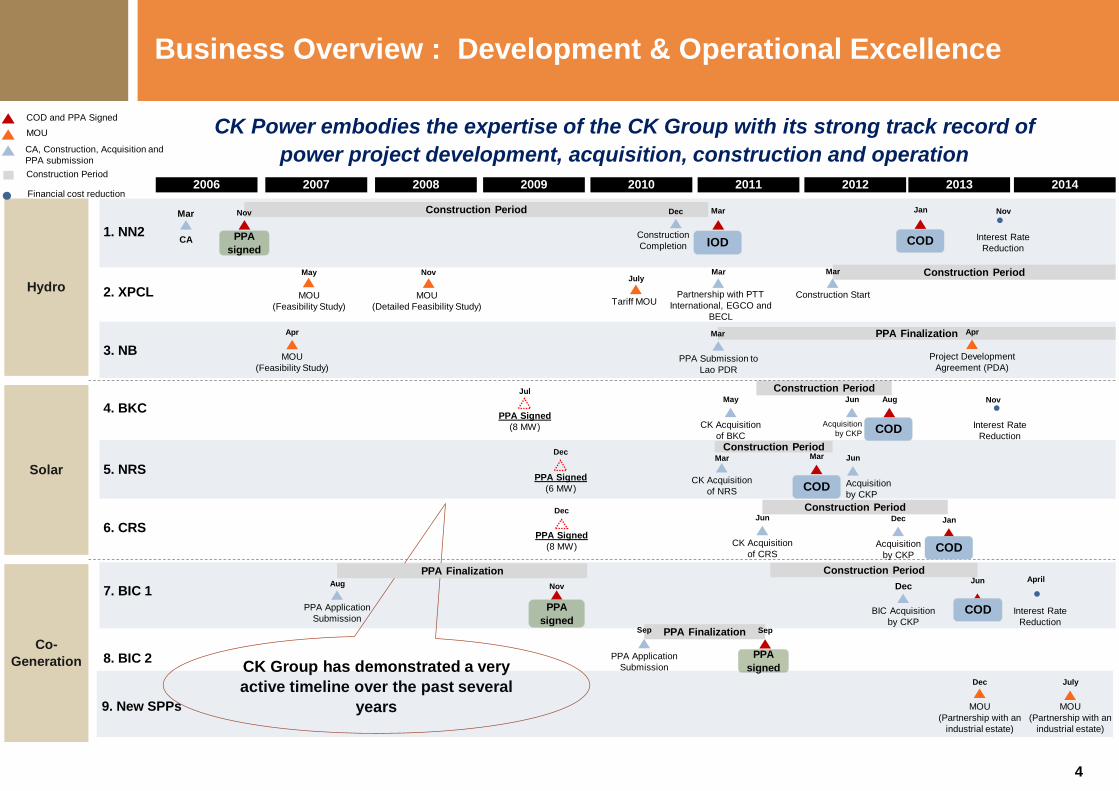
CK Group has demonstrated a very
active timeline over the past several
years
Construction Period
Construction Period
Construction Period
PPA Finalization
PPA Finalization
COD
COD
PPA Finalization
Construction Period
Construction Period
CK Power embodies the expertise of the CK Group with its strong track record of
power project development, acquisition, construction and operation
2006
Solar
Co-
Generation
Hydro
2007 2008 2010 2011 2013 2012 2009
1. NN2
2. XPCL
3. NB
4. BKC
5. NRS
6. CRS
7. BIC 1
CA
Mar
MOU
(Feasibility Study)
May
MOU
(Feasibility Study)
Apr
MOU
(Detailed Feasibility Study)
Nov
Construction
Completion
Dec Mar
Partnership with PTT
International, EGCO and
BECL
Mar
PPA Submission to
Lao PDR
Mar
Construction Start
Mar
Jan
PPA Signed
(8 MW)
Jul Aug
PPA Signed
(6 MW)
Dec
PPA Signed
(8 MW)
Dec
Mar
Jan
PPA Application
Submission
Aug Nov
PPA Application
Submission
Sep Sep
Jun
Acquisition
by CKP
Jun
Acquisition
by CKP
Jun
Acquisition
by CKP
Dec
Nov
8. BIC 2
COD IOD
COD
COD
Construction Period
PPA
signed
PPA
signed
PPA
signed
CK Acquisition
of BKC
May
CK Acquisition
of NRS
Mar
CK Acquisition
of CRS
Jun
BIC Acquisition
by CKP
Dec
COD and PPA Signed
MOU
CA, Construction, Acquisition and
PPA submission
Construction Period
Financial cost reduction
Project Development
Agreement (PDA)
Apr
2014
Tariff MOU
July
9. New SPPs MOU
(Partnership with an
industrial estate)
Dec
MOU
(Partnership with an
industrial estate)
July
Interest Rate
Reduction
Interest Rate
Reduction
Interest Rate
Reduction
Nov
Nov
April
Business Overview : Development & Operational Excellence
4
5
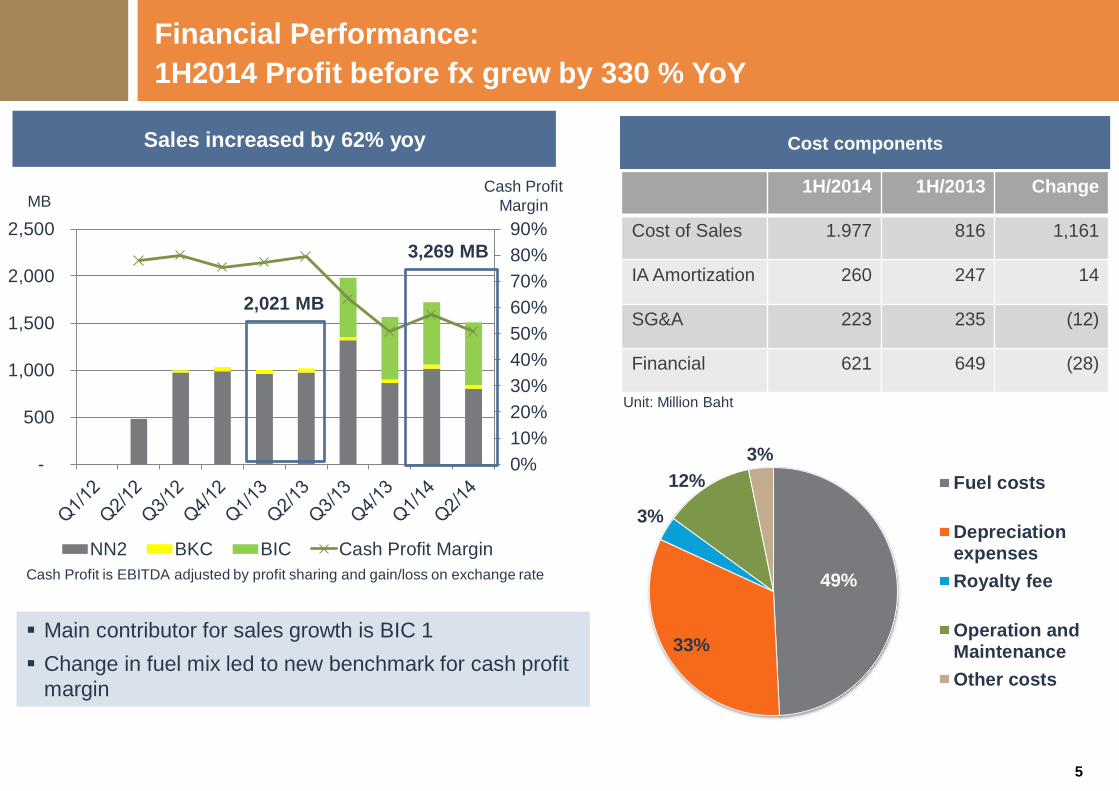
Sales increased by 62% yoy
0%
10%
20%
30%
40%
50%
60%
70%
80%
90%
-
500
1,000
1,500
2,000
2,500
NN2 BKC BIC Cash Profit Margin
3,269 MB
2,021 MB
Cash Profit is EBITDA adjusted by profit sharing and gain/loss on exchange rate
MB
5
Cash Profit
Margin
Main contributor for sales growth is BIC 1
Change in fuel mix led to new benchmark for cash profit
margin
Cost components
49%
33%
3%
12%
3%
Fuel costs
Depreciationexpenses
Royalty fee
Operation andMaintenance
Other costs
1H/2014 1H/2013 Change
Cost of Sales 1.977 816 1,161
IA Amortization 260 247 14
SG&A 223 235 (12)
Financial 621 649 (28)
Unit: Million Baht
Financial Performance:
1H2014 Profit before fx grew by 330 % YoY

6
Leverage Opportunity
25,730
11,328
21,832
485
2,183
31
-
10,000
20,000
30,000
40,000
50,000
60,000
Conso Separate
Current Liabilities
Non-CurrentLiabilities
Equity
0.93 times 0.05 times DE Ratio
MB
CKP 490
SEAN 18,230
BIC 4,028
BKC 597
Total 23,345
Outstanding Loan (MB), As of June 30, 3014
Avg cost of debt: 5.03%
6
Financial Performance:
Healthy Capital Structure with low gearing

7
2014
Operating : 755 MW
2017
Target : 875 MW
2019
Target : 2,320 MW
2020 Onward
Target : 4,280 MW
Additional :
• 120 MW from BIC 2
• Upsides from Domestic
Renewables (Target 100 MW)
Additional :
• 160 MW from Nam Bak
• 1,285 MW from Xayaburi
Additional :
• 1,000 MW from
Cross – Border
• 960 MW from
8 Cogeneration
Projects
CKP Outlooks : Growth Roadmap
Solid Project Pipeline and Strong
Growth Plan with 27% CAGR growth in
Total MW Capacity during 2014 - 2020
7

8
Project Location Capacity SCOD Progress Remarks
Hydro Power Nam Bak (NB)
Xayaburi (XPCL)
New Cross-Border
Project
Lao PDR
Lao PDR
Cross-
Border
160 MW
1,285 MW
Target
1,000 MW
Y.2018
Y.2019
Y.2020
onward
Obtained Project
Development
Agreement
Construction work as
of June 2014 more
than 40 %
Preliminary Studies
Preparing Power
Purchase Agreement
and Concession
Agreement
On schedule
High potentials
CKP strong position
Cogeneration
Bangpa-in
Cogeneration
Project 2 (BIC 2)
New 8 Cogeneration Power Plants
Thailand
Thailand
120 MW
120 x8 MW
Total 960 MW
Y.2017
Y.2020 onward
EPC Contract within
Q4/2014
Identified locations
and 2 MOUs signed
with Industrial Estates
Cost saving from
common facilities
and long-term
shared O&M
Awaiting the
solicitation announcement
Renewable Solar and Wind Power
Thailand Target
100 MW
Y.2014 onward
Identified locations
and preparing
proposals
Monitor for M&A opportunities
Tariff is under
reviewing
New Thailand Power
Development Plan to
emphasize on renewables
CKP Outlooks : Developing Projects
8

9
Thailand’s Installed Capacity will grow more
than 40% in the next decade
Power Development Plan (PDP) indicates
the new additional capacity for each year
Electricity Authority of Thailand (EGAT) is
the major off-taker from Private Power
Companies
0
10,000
20,000
30,000
40,000
50,000
60,000
70,000
2015 2016 2017 2018 2019 2020 2021 2022 2023 2024 2025
Installed Capacity Demand
43,157
30,231
60,477
44,521
MW
Forecasted Thailand Electricity Demand during 2015 – 2025 (PDP 2010 Rev.3)
Political Situation has no negative impact on Power Industry
No change in Power Industry Structure and existing
Power Purchase Agreement (PPA)
Resolutions on pending issues such as Renewable
Power Tariff are expected
New PDP is being prepared with the tendency of
increasing Renewable Energy portion
CKP Outlooks : Domestic Outlooks
Source: Thailand PDP 2010 Revision 3
9

10
EGAT :
10,308 MW Private :
21,651MW
IPP1/ : 7,540 MW
Cogeneration:
4,320 MW
Renewable :
4,939 MW
Cross-Border
Purchasing :
4,852 MW
Monitor the next IPP Bidding
BIC 2 received PPA , COD on 2017
Prepare for new 8 projects total 960 MW
Target 100 MW Renewable, Solar and Wind
Prepare for new Tariff Structure
XPCL received PPA , COD on 2019
Target 1,000MW for Cross-Border and
selling to neighboring countries
CKP ‘s Plan for each segment during 2015-2025
According to the current PDP, the 21,651 MW will be allocated to Private Power Companies during 2015 – 2025
CKP’s BIC 2 and Xayaburi already secure Power Purchase Agreement
Preparing for each segment expansion during 2015 - 2025
CKP Outlooks : Thailand Power Development Plan
1/ IPP = Independent Power Producer with over 100 MW contracted capacity
Additional Capacity during 2015-2025
Source: Thailand PDP 2010 Revision 3
10

11
2013
Electrification Ratio (%)
Population (million)
GDP
2013
(billion US$)
Forecasted
2015 Power
Generation Output (GWh)
Forecasted
2020 Power
Generation Output (GWh)
Forecasted
2035 Power
Generation Output (GWh)
Forecasted 20 Years Growth
Thailand 99 67 425 186,600 219,800 352,700 89%
Vietnam 97 90 156 128,100 174,000 409,800 220%
Myanmar 26 63 57 15,300 26,000 121,300 693%
Cambodia 24 15 16 2,900 4,600 14,200 390%
Laos 78 7 10.3 20,100 24,100 28,700 42%
Source: Energy Outlook for Asia and the Pacific, ADB
CKP Outlooks : Neighboring Countries, the Region of Growth
11

12
Over 13,000 MW Hydro Power Potentials and CKP’s proven track record in project development
Potentials in transmitting to Thailand
River basin
Hydropower
Project
Capacity (MW)
In
Operation Construction Planned
1. Nam Tha Nam Tha 1 168
2. Nam Ou Nam Ou 2,5,7 540
Nam Ou 1,3,4,7 616
3. Nam Ngum Nam Ngum 1 155
Nam Ngum 2 615 Nam Ngum 3,4 511 Nam Ngum 5 120 Nam Lik 100
Nam Mung 3 40
Nam Leuk 60
4. Nam Ngiep Nam Ngiep 1 278
Nam Ngiep 2 180
5. Nam Theun Nam Theun 1 523
Nam Theun 2 1,075 Theun Hinboun 440 Nam Hai 800
6. Xedon Xexet 1,2 121
7. Xekong Xekong 3 105 Xekong 4,5 550
Xepian-
Xenamnoy 319
Houay Ho 155 Xekaman 1,3 540 Xekaman 2,4 850
8. Mekong Xayaburi 1,285 Others (8) 8,769
Total 2,986 2,545 13,384
CKP Outlooks : Lao PDR
Source: www.poweringprogress.org, Mekong River Commission, EDL 12

13
5
4
3
2
1
6
7
8
9
10
In Operation Planned
River Basin No. Hydropower Project Capacity (MW)
In Operation Construction Planned
Salween
1 Upper Thanlwin 2,400
2 Nawngpha 1,000
3
Ta Sang or 7,110
Mong Tong
(7,000)
4 Ywathit 4,000
5 Wei Gyi Dam
(Mae Sarieng 1) *4,800
6 Daywin
(Mae Sarieng 2) *600
7 Hay Gyi 1,360
21,270
Myitnge 8 Yeywa 790
Shweli
9
Shweli 1 600
Shweli 2 460
Shweli 3 360
Dapein
10
Dapein I 168
Dapein II 240
Over 40,000 MW Hydro Power Potential identified by ADB
20,000 MW Hydro Power Potentials in Salween River Alone
Strength in Natural Gas Supply
Potentials in transmitting to Thailand
CKP Outlooks : Myanmar
Source* : EGAT International Company Limited
www.salweenwatch.org
http://www.burmariversnetwork.org 13

14
Project Earliest COD
1) P.Malaysia - Singapore (New) 2018
2) Thailand - P.Malaysia
• Sadao - Bukit Keteri Existing
• Khlong Ngae - Gurun Existing
• Su Ngai Kolok - Rantau Panjang 2015
• Khlong Ngae – Gurun (2nd Phase, 300MW) 2016
3) Batam - Singapore 2015-2017
4) Thailand - Lao PDR
• Roi Et 2 - Nam Theun 2 Existing
• Sakon Nakhon 2 – Thakhek – Then Hinboun (Exp.) Existing
• Udon Thani 3- Nabong – Nam Ngum 2 Existing
• Mae Moh 3 - Nan - Hong Sa 2015
• Ubon Ratchathani 3 – Pakse – Xe Pian Xe Namnoy 2018
• Khon Kaen 4 – Loei 2 – Xayaburi 2019
• Thailand – Lao PDR (New) 2015-2023
5) Lao PDR - Vietnam 2011-2016
6) Thailand - Myanmar 2016-2025
7) Vietnam - Cambodia (New) 2017
8) Lao PDR - Cambodia 2016
9) Thailand - Cambodia (New) 2015-2020
The Status of the Asian Power Grid Project
(Indochina Peninsula)
14 Source : EGAT

15
CK Power is the flagship power development company of CK Group:
Diversified portfolio
AEC Player
Stable stream of income
Experienced management with development and operational excellence
Solid project pipeline
High growth company
Key Takeaways
CKP has unique competitive
advantage :
• Comprehensive capability
from development to EPC
to Operation
• Synergy Power
15

16
Appendix
16
17
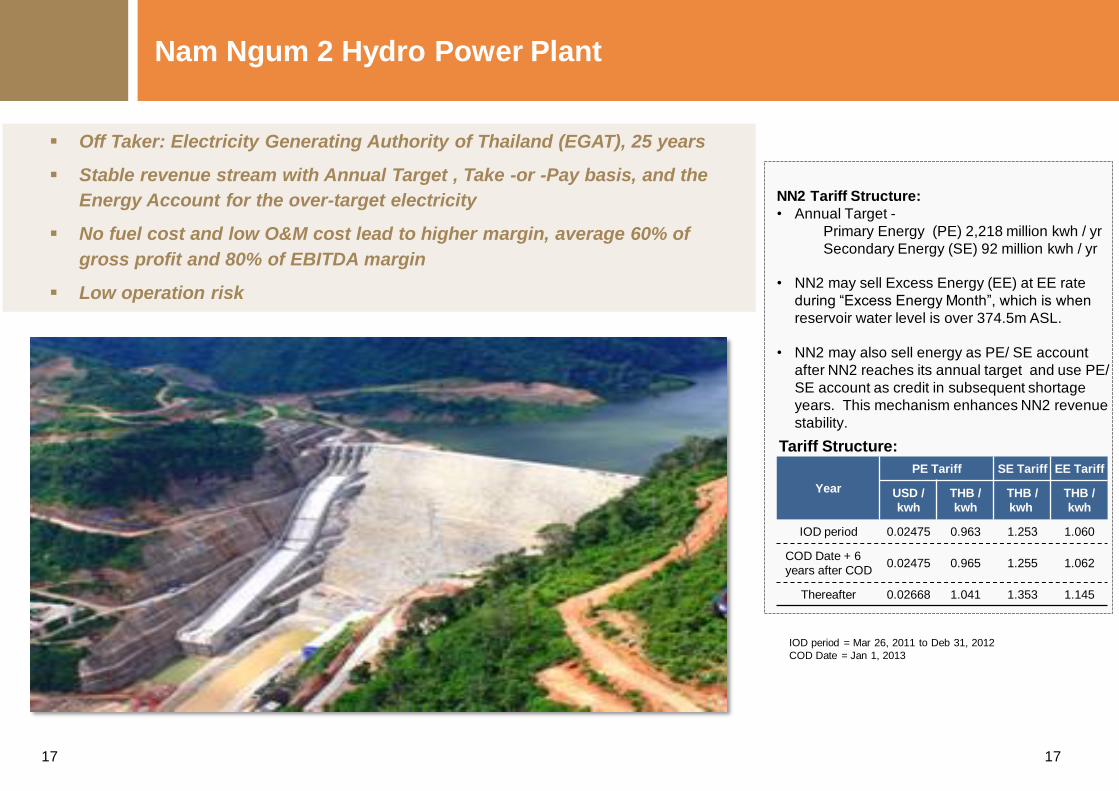
Nam Ngum 2 Hydro Power Plant
17
Year
PE Tariff SE Tariff EE Tariff
USD /
kwh
THB /
kwh
THB /
kwh
THB /
kwh
IOD period 0.02475 0.963 1.253 1.060
COD Date + 6
years after COD 0.02475 0.965 1.255 1.062
Thereafter 0.02668 1.041 1.353 1.145
NN2 Tariff Structure:
• Annual Target -
Primary Energy (PE) 2,218 million kwh / yr
Secondary Energy (SE) 92 million kwh / yr
• NN2 may sell Excess Energy (EE) at EE rate
during “Excess Energy Month”, which is when
reservoir water level is over 374.5m ASL.
• NN2 may also sell energy as PE/ SE account
after NN2 reaches its annual target and use PE/
SE account as credit in subsequent shortage
years. This mechanism enhances NN2 revenue
stability.
Tariff Structure:
IOD period = Mar 26, 2011 to Deb 31, 2012
COD Date = Jan 1, 2013
Off Taker: Electricity Generating Authority of Thailand (EGAT), 25 years
Stable revenue stream with Annual Target , Take -or -Pay basis, and the
Energy Account for the over-target electricity
No fuel cost and low O&M cost lead to higher margin, average 60% of
gross profit and 80% of EBITDA margin
Low operation risk
17
18
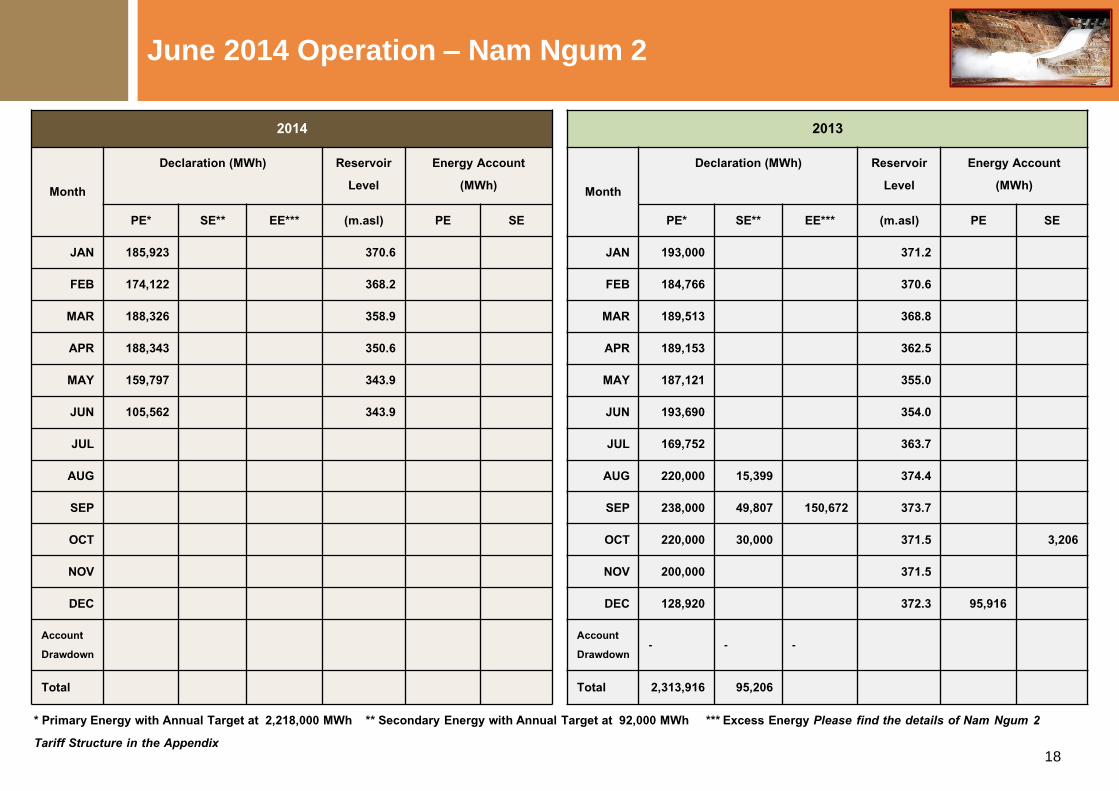
June 2014 Operation – Nam Ngum 2
2013
Month
Declaration (MWh) Reservoir Level
Energy Account (MWh)
PE* SE** EE*** (m.asl) PE SE
JAN 193,000 371.2
FEB 184,766 370.6
MAR 189,513 368.8
APR 189,153 362.5
MAY 187,121 355.0
JUN 193,690 354.0
JUL 169,752 363.7
AUG 220,000 15,399 374.4
SEP 238,000 49,807 150,672 373.7
OCT 220,000 30,000 371.5 3,206
NOV 200,000 371.5
DEC 128,920 372.3 95,916
Account Drawdown
- - -
Total 2,313,916 95,206
* Primary Energy with Annual Target at 2,218,000 MWh ** Secondary Energy with Annual Target at 92,000 MWh *** Excess Energy Please find the details of Nam Ngum 2 Tariff Structure in the Appendix
2014
Month
Declaration (MWh) Reservoir Level
Energy Account (MWh)
PE* SE** EE*** (m.asl) PE SE
JAN 185,923 370.6
FEB 174,122 368.2
MAR 188,326 358.9
APR 188,343 350.6
MAY 159,797 343.9
JUN 105,562 343.9
JUL
AUG
SEP
OCT
NOV
DEC
Account Drawdown
Total
18

19
MWh (m.asl) Electricity Production (MWh) and Reservoir Level (m.asl)
NN2’s Operation decreased month-on-month from seasonal factor and decrease year-on-year due to
less water inflow in 2014
However, NN2 water level as of July 30, 2014 picked up to the planned level
As of June 2014, the PE and SE account was 196,211 and 8,770 MWh respectively
Stable revenue stream with Annual Target , Take -or -Pay basis, and the Energy Account for the over-
target electricity
325
330
335
340
345
350
355
360
365
370
375
380
0
50,000
100,000
150,000
200,000
250,000
300,000
350,000
JAN FEB MAR APR MAY JUN JUL AUG SEP OCT NOV DEC
2014 Electricity 2013 Electricity 2014 Resorvoir Level 2013 Resorvoir Level 2012 Resorvoir Level2
June 2014 Operation – Nam Ngum 2
19
20
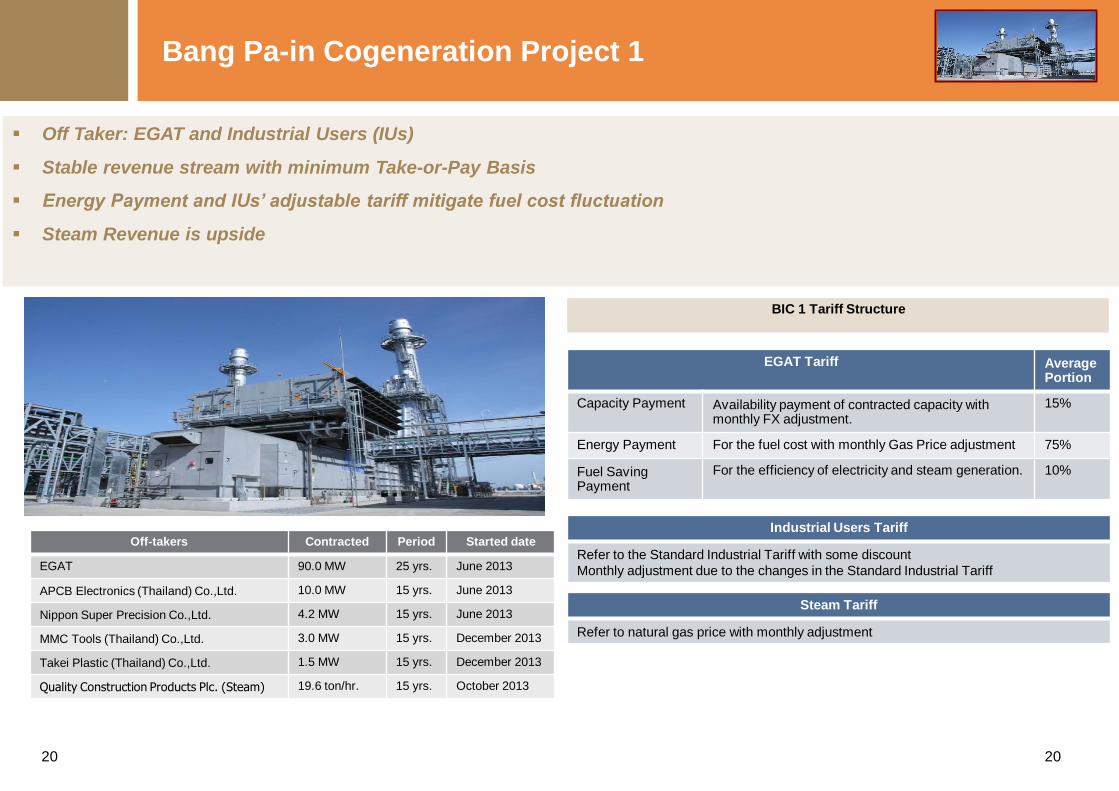
EGAT Tariff Average Portion
Capacity Payment Availability payment of contracted capacity with monthly FX adjustment.
15%
Energy Payment For the fuel cost with monthly Gas Price adjustment 75%
Fuel Saving Payment
For the efficiency of electricity and steam generation. 10%
Industrial Users Tariff
Refer to the Standard Industrial Tariff with some discount
Monthly adjustment due to the changes in the Standard Industrial Tariff
Steam Tariff
Refer to natural gas price with monthly adjustment
Off-takers Contracted Period Started date
EGAT 90.0 MW 25 yrs. June 2013
APCB Electronics (Thailand) Co.,Ltd. 10.0 MW 15 yrs. June 2013
Nippon Super Precision Co.,Ltd. 4.2 MW 15 yrs. June 2013
MMC Tools (Thailand) Co.,Ltd. 3.0 MW 15 yrs. December 2013
Takei Plastic (Thailand) Co.,Ltd. 1.5 MW 15 yrs. December 2013
Quality Construction Products Plc. (Steam) 19.6 ton/hr. 15 yrs. October 2013
BIC 1 Tariff Structure
Off Taker: EGAT and Industrial Users (IUs)
Stable revenue stream with minimum Take-or-Pay Basis
Energy Payment and IUs’ adjustable tariff mitigate fuel cost fluctuation
Steam Revenue is upside
Bang Pa-in Cogeneration Project 1
20 20

21
June 2014 Operation– Bang Pa-in Cogeneration 1
0
2,250
4,500
6,750
9,000
0
17,500
35,000
52,500
70,000
NOV'13 DEC'13 JAN'14 FEB'14 MAR'14 APR'14 MAY'14 JUN'14
EGAT Industrial Users - Electricity Industrial User - Steam
MWh Ton Electricity Production (MWh) and Steam Production (Ton)
BIC1’s Operation increased month-on-month, no unplanned maintenance schedule during June
Stable revenue stream with minimum Take-or-Pay Basis
21

22
Electricity Customers PPA (MW) JAN’14 FEB’14 MAR’14 APR’14 MAY’14 JUN’14
Electricity Produced (MWh) EGAT 90.0 53,918 49,978 57,154 50,858 51,967 54,784 APCB Electronic Thailand Co., Ltd. 12.0 5,052 4,799 5,468 4,605 4,645 4,974 Nippon Super Precision Co.,Ltd. 4.2 1,743 1,724 1,946 1,556 1,447 1,498 MMC Tools (Thailand) Co.,Ltd. (started Dec 1, 2013) 3.0 1,026 1,206 1,494 1,505 1,597 1,554 Takei Plastic (Thailand) Co.,Ltd. (started Dec 8, 2013) 1.5 435 461 565 521 579 566
Heat Rate (BTU/KWh) 7,751 7,758 7,665 7,849 7,781 7,768 Steam Customer – Quality Construction Products Plc. (Q-CON)
Contracted Capacity (Ton/Hr.)
JAN’13 FEB’14 MAR’14 APR’14 MAY’14 JUN’14
Steam Produced (Ton) 19.6 9,159 8,649 8,693 6,089 7,649 7,560
June 2014 Operation– Bang Pa-in Cogeneration 1
22
23
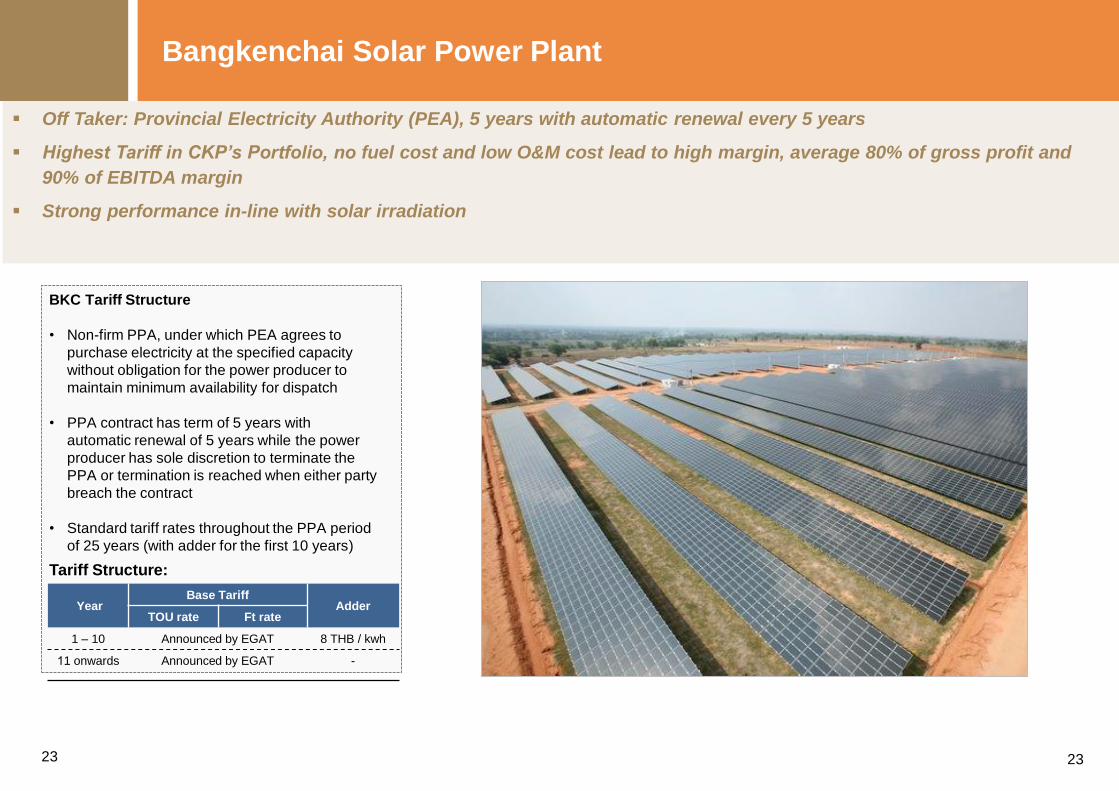
BKC Tariff Structure
• Non-firm PPA, under which PEA agrees to
purchase electricity at the specified capacity
without obligation for the power producer to
maintain minimum availability for dispatch
• PPA contract has term of 5 years with
automatic renewal of 5 years while the power
producer has sole discretion to terminate the
PPA or termination is reached when either party
breach the contract
• Standard tariff rates throughout the PPA period
of 25 years (with adder for the first 10 years)
Tariff Structure:
Year Base Tariff
Adder TOU rate Ft rate
1 – 10 Announced by EGAT 8 THB / kwh
11 onwards Announced by EGAT -
Off Taker: Provincial Electricity Authority (PEA), 5 years with automatic renewal every 5 years
Highest Tariff in CKP’s Portfolio, no fuel cost and low O&M cost lead to high margin, average 80% of gross profit and
90% of EBITDA margin
Strong performance in-line with solar irradiation
Bangkenchai Solar Power Plant
23 23

24
June 2014 Operation– Bangkhenchai Solar
-
20
40
60
80
100
120
140
160
180
200
500.00
600.00
700.00
800.00
900.00
1,000.00
1,100.00
1,200.00
1,300.00
1,400.00
1,500.00
Jan Feb Mar Apr May Jun Jul Aug Sep Oct Nov Dec
Electricity Production and Irradiation
Electricity 2013 Electricity 2014 Solar Irradiation 2013 Solar Irradiation 2014
2013
JAN FEB MAR APR MAY JUN JUL AUG SEP OCT NOV DEC Total Year
2013 Energy production (MWh) 1,200.1
1,141.4
1,316.2
1,258.0 1,317.7 1,160.2 1,088.1 1,192.2 964.5 1,089.6 1,053.8 1,228.9 14,010.8
2014
JAN FEB MAR APR MAY JUN JUL AUG SEP OCT NOV DEC Total Year
2014 Energy production (MWh) 1,439.5 1,131.7 1,271.2 1,178 1,319.6 1,068.1
MWh kWh/m2
24


