11
UK DOC long-term trends in an international perspective Don Monteith CLAD 21 st October 2009
| Date post: | 20-Oct-2014 |
| Category: |
Documents |
| View: | 297 times |
| Download: | 0 times |

UK DOC long-term trends in an international perspective
Don Monteith CLAD 21st October 2009
•S
ecch
i dis
c de
pth
(m)
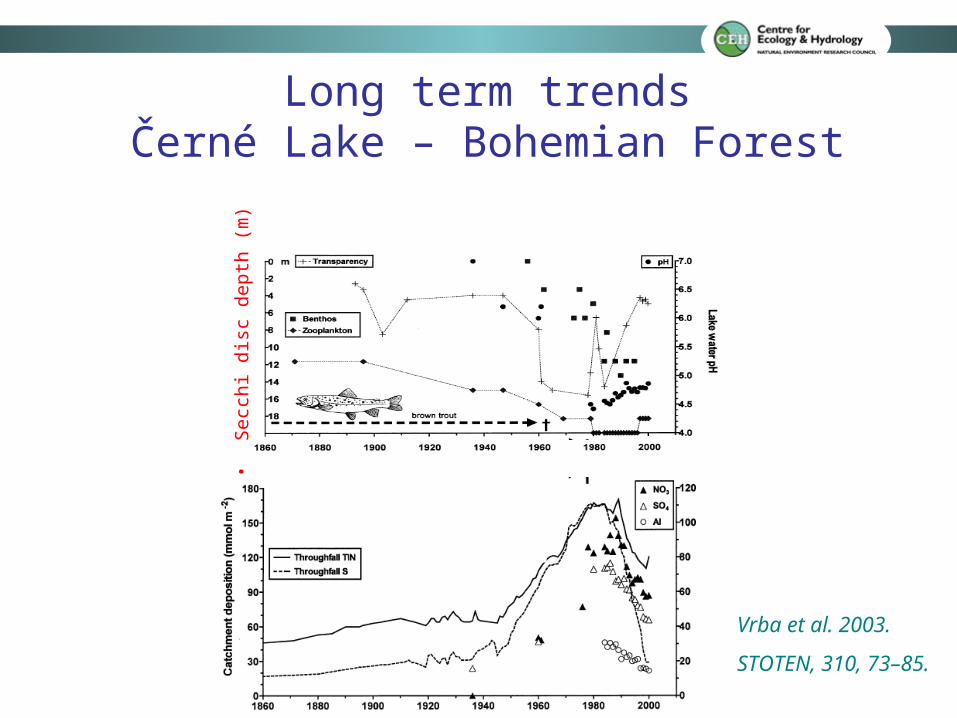
Long term trendsČerné Lake – Bohemian Forest
Vrba et al. 2003.
STOTEN, 310, 73–85.
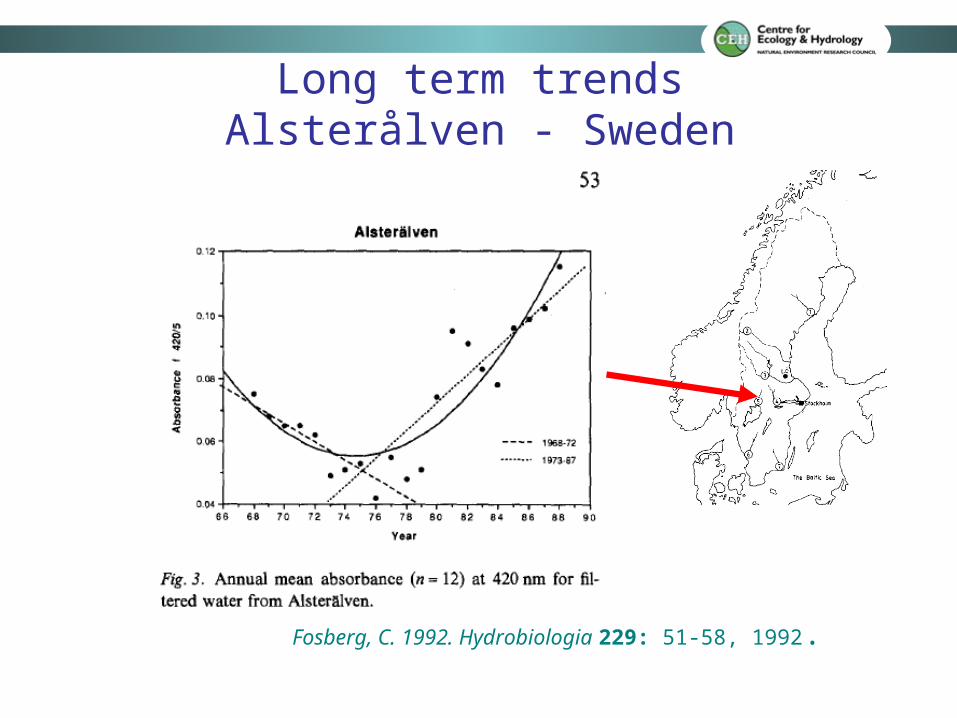
Long term trendsAlsterålven - Sweden
Fosberg, C. 1992. Hydrobiologia 229: 51-58, 1992.
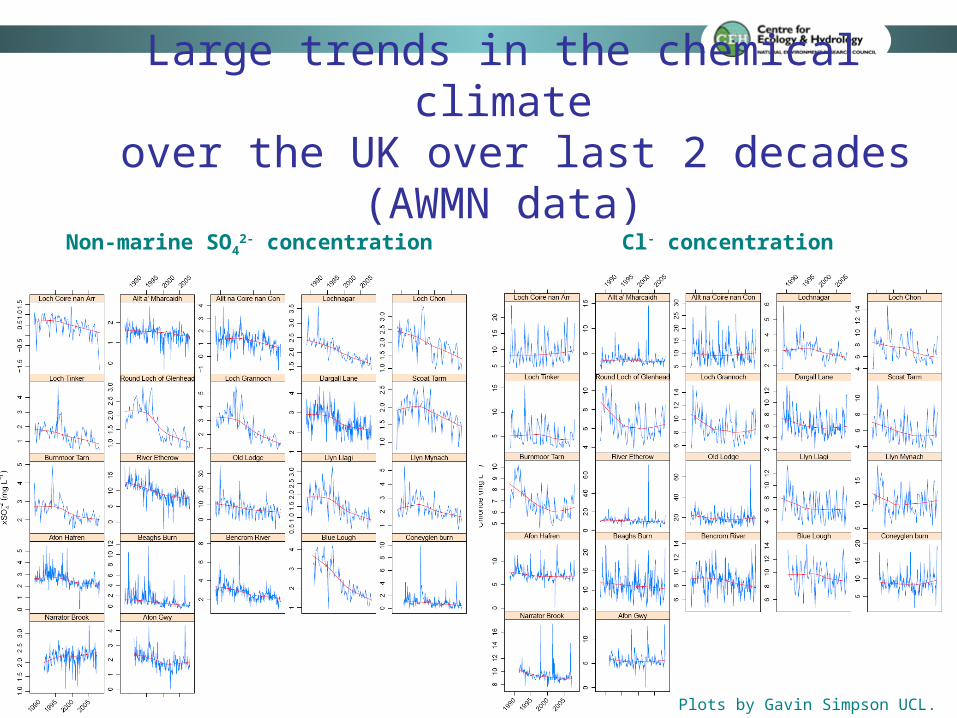
Large trends in the chemical climate over the UK over last 2 decades (AWMN data)
Non-marine SO42- concentration Cl- concentration
Plots by Gavin Simpson UCL.
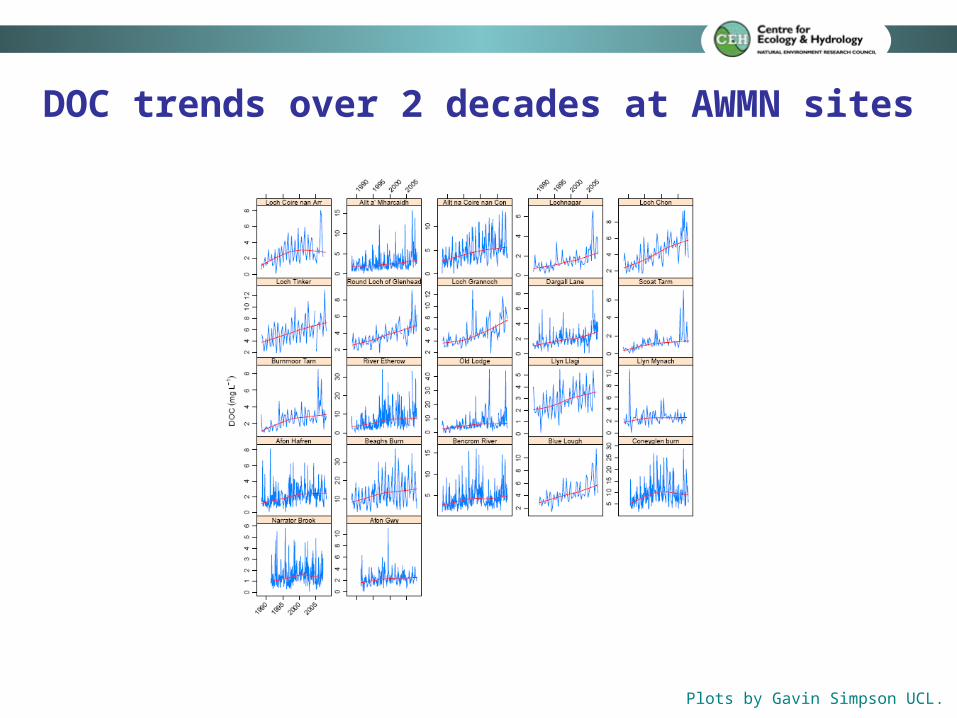
DOC trends over 2 decades at AWMN sites
Plots by Gavin Simpson UCL.
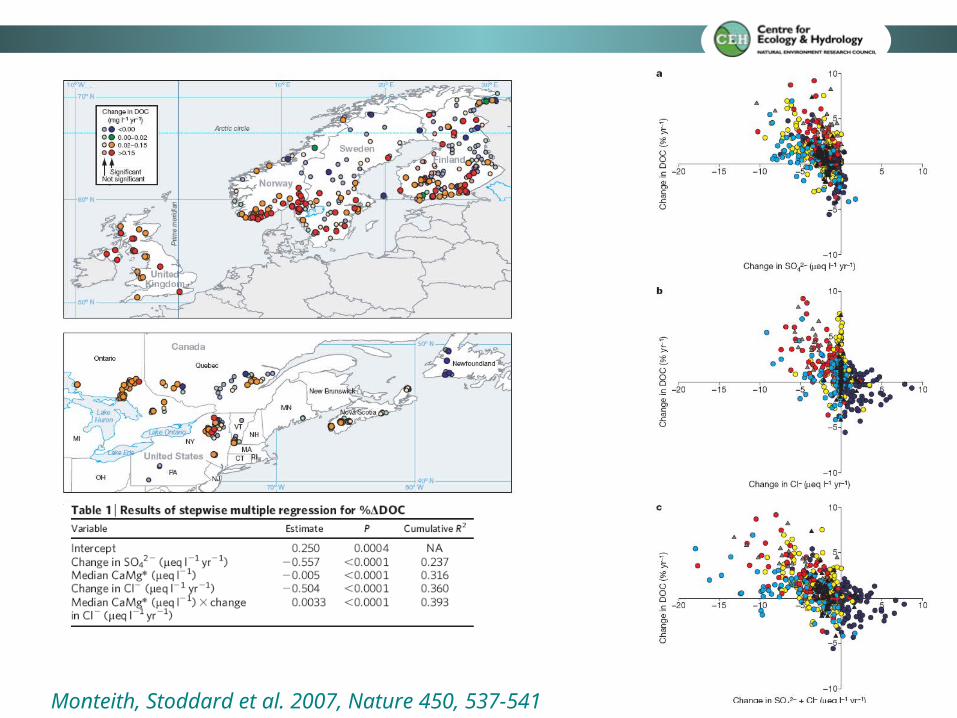
Monteith, Stoddard et al. 2007, Nature 450, 537-541
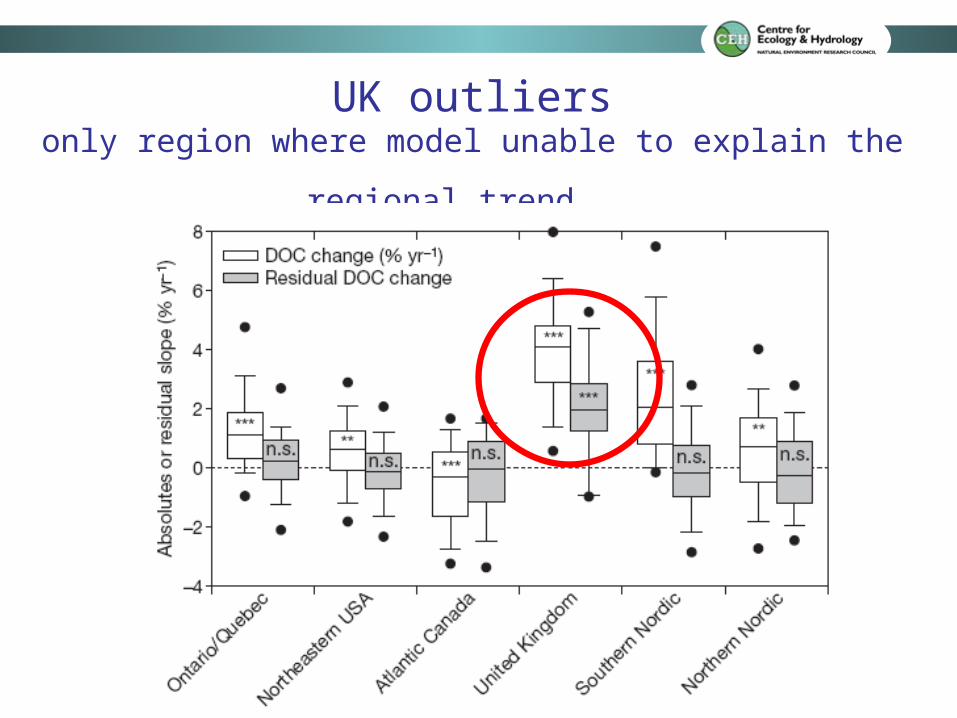
UK outliers
only region where model unable to explain the regional trend
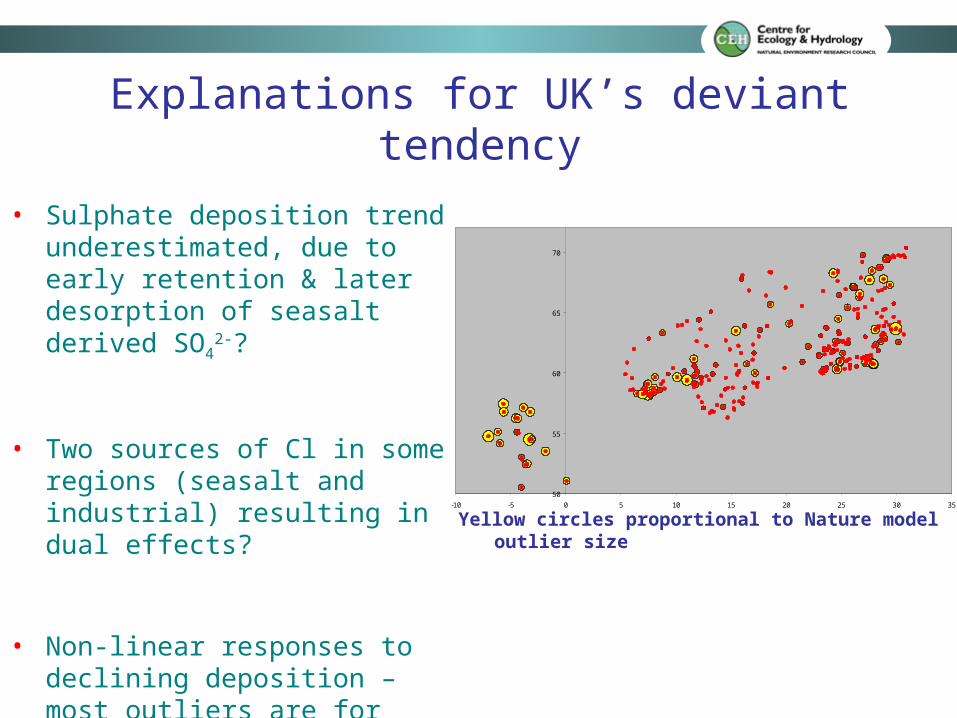
Explanations for UK’s deviant tendency
50
55
60
65
70
-10 -5 0 5 10 15 20 25 30 35
• Sulphate deposition trend underestimated, due to early retention & later desorption of seasalt derived SO4
2-?
• Two sources of Cl in some regions (seasalt and industrial) resulting in dual effects?
• Non-linear responses to declining deposition – most outliers are for sites showing largest %ΔDOC trends?
Yellow circles proportional to Nature model outlier size
0
2
4
6
8
10
12
14
1988 1988 1989 1990 1992 1992 1993 1994 1996 1996 1997 1998 2000 2000 2001 2002 2004 2004 2005 2006 2008
DO
C (
mg
/l)
RLGH
NAGAR
CHON
TINKER
GRANN
SCOAT
BURMOOR
LLAGI
BLUE
-6
-4
-2
0
2
4
6
8
1988 1989 1990 1991 1992 1993 1994 1995 1996 1997 1998 1999 2000 2001 2002 2003 2004 2005 2006 2007
stan
dard
ised
res
idua
ls (f
rom
dep
mod
el)
RLGH_SRES
NAG_SRES
CHON_SRES
TINK_SRES1
GRANN_RESI1
SCOAT_SRES1
BURN_SRES1
LLAGI_SRES1
BLUE_SRES1
[DOC] = [DOC] = αα-(log [SO-(log [SO44]) + ]) + ββ-(log [Cl]) + c-(log [Cl]) + c
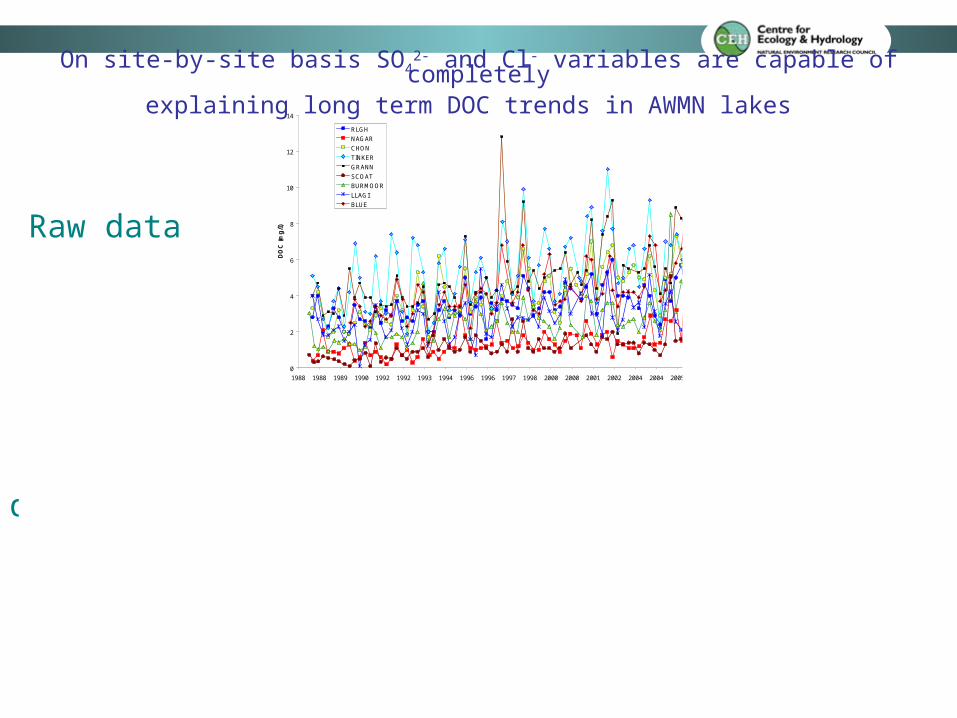
Raw data
deposition model standardised residuals
On site-by-site basis SO42- and Cl- variables are capable of completely
explaining long term DOC trends in AWMN lakes

Upland Water Myths• Evans et al.. (2005) have shown that decreases in SO4 deposition did not begin until the 1980s in
the UK.– Evans et al. (2005) never said this, and S deposition has been falling since the mid 1970s
• Worrall et al. (2003) have shown that increases in DOC flux started in at least the 1960s.– Time series stretch back to 1960s but no indication of inflection until the mid 1970s
• Worrall and Burt (2007) present huge reductions in DOC at all sites within one operational region only - SW England (HMS data) - to illustrate diverging trends within UK.
– Trends not supported by independent time series from same region. Data compromised by insufficiently documented changes in methodology.
• UK DOC trends over last two decades are consistent with other regions of northern Europe and North America that have undergone large reductions in sulphate / and or chloride.
• Relationship suggests a control on DOC solubility by either/or acidity and ionic strength. Work to address this is ongoing.
• There are few, if any, examples of long-term DOC trends in the UK, where high quality sulphate and chloride concentration data are available, where these two variables cannot entirely explain the trend.
• Important to distinguish between this long-term driver and shorter term climatic and land-use drivers. The latter will set the boundaries for DOC variability as sulphur deposition fall background levels.
• Important to determine what is happening to DOC quality.
• Where land-use is largely unaltered, DOC is returning toward pre-acidification levels – but where soil base cation saturation is depleted, will it overshoot?
• Water treatment chlorination was only implemented after DOC had been suppressed by “acid rain”? Is it sustainable?
• What are the consequences for increasing solubility of DOC for the transport of industrial pollutant legacy compounds from catchments?


