William C. Cromer Pty. Ltd. – 74A Channel Highway Taroona, Tasmania 7053 Australia Mob. 0408 122 127 – Fax 03 6227 9456 – www.billcromer.com.au – email [email protected]Clarence City Council Seven Mile Beach township REVIEW OF 2009 FLOODING AND DRAINAGE ISSUES WILLIAM C. CROMER PTY. LTD. ACN 009 531 613 ABN 48 009 531 613 ENVIRONMENTAL, ENGINEERING AND GROUNDWATER GEOLOGISTS C C W
Transcript
William C. Cromer Pty. Ltd. – 74A Channel Highway Taroona, Tasmania 7053 Australia
WILLIAM C. CROMER PTY. LTD. ACN 009 531 613 ABN 48 009 531 613
ENVIRONMENTAL, ENGINEERING AND GROUNDWATER GEOLOGISTS C C W
Clarence City Council: Seven Mile Beach township
Review of 2009 flooding and drainage issues 9 April 2010
William C Cromer Pty Ltd 74A Channel Highway Taroona Tasmania 7053 Environmental, engineering and groundwater geologists Mobile 0408 122 127 email [email protected]
2 C C W
C C W
Cover photo: The mouth of Acton Creek at Seven Mile Beach, 24 February 2010, looking northeast. The creek has not flowed to the sea for at least three months. Its dammed water extends inland for about 500m, and after heavy rain events has hindered upstream drainage as far as the western corner of the Royal Hobart Golf Club. Refer to this report as Cromer, W. C. (2010). Review of 2009 flooding and drainage issues, Seven Mile Beach township. Unpublished report for Clarence City Council by William C. Cromer Pty. Ltd., 9 April 2010; 29 pages). Important Note Permission is hereby given by William C. Cromer as author for this report to be copied and distributed to interested parties, but only if it is reproduced in colour, and only distributed in full. No responsibility is taken for the contents of this report if it is not copied in colour and distributed as a full copy. The Attachments form an integral part of this report and shall not be omitted from copies of it.
Clarence City Council: Seven Mile Beach township
Review of 2009 flooding and drainage issues 9 April 2010
William C Cromer Pty Ltd 74A Channel Highway Taroona Tasmania 7053 Environmental, engineering and groundwater geologists Mobile 0408 122 127 email [email protected]
3 C C W
C C W
SUMMARY The primary cause of the 2009 flooding in Seven Mile Beach township and the Royal Hobart Golf Club was unusually high rainfall, which generally raised the water table in the area, and in low lying parts, raised it above the ground surface. Such high rainfall had not been recorded for at least 35 years. Golf course irrigation had no effect on the water table and did not cause or exacerbate the flooding. Neither did the private damming of a drainage line near the intersection of Estate Drive and Seven Mile Beach Road, nor the stormwater system of pits and slotted pipework installed in some streets by Clarence City Council, nor the stormwater system along Woodhurst Avenue. The flooding of the golf course would have been lessened if a tributary of Acton Creek had been cleaned of obstructing vegetation so as to enhance surface flow. In future, the risk of flooding on the golf course will be reduced if the mouth of Acton Creek is also not blocked by sand at the beach. It is likely, perhaps almost certain, that flood events will recur. In the long term, the frequency and severity of flooding will increase if sea level rises, since this will unavoidably raise the water table in the township and golf club. Nothing can be done to reduce the likelihood of flood events recurring. However, in the short to medium term, the following measures, individually or collectively, will reduce the consequences of flooding:
Improve surface drainage by maintaining a clear channel in Acton Creek and its tributary drains,
Approach the State Government to implement a program to maintain the mouth of
Acton Creek open to the sea,
Raise low lying areas (eg the western end of Woodhurst Road and parts of Winston Avenue) by infilling. Owners of properties can raise low-lying areas by infilling, subject to meeting any necessary approvals.
Undertake a benefit/cost risk assessment investigation of permanent pump
installations or graded outfall pipes where possible in low lying areas which automatically pump out groundwater and attendant surface water to mitigate any impact. Ultimately if sea level and the water table rise, this approach will be increasingly ineffective.
Provide a reticulated sewerage system for the township (with off-site discharge), or
encourage householders to install on-site domestic systems which discharge wastewater to the near-surface rather than via absorption trenches
Clarence City Council: Seven Mile Beach township
Review of 2009 flooding and drainage issues 9 April 2010
William C Cromer Pty Ltd 74A Channel Highway Taroona Tasmania 7053 Environmental, engineering and groundwater geologists Mobile 0408 122 127 email [email protected]
4 C C W
C C W
1 INTRODUCTION 1.1 BACKGROUND Low lying parts of Seven Mile Beach township and the adjacent Royal Hobart Golf Club experienced extended periods of flooding commencing about May-June of 2009, through to about November-December 2009. Areas most affected (Attachments 1 and 2) extended over about half the land area of the golf club, and the western parts of the township including Woodhurst Road between Lewis and Winston Avenues, and along the northwestern part of Winston Avenue. Within the areas directly affected, flooding occurred on roads, access drives and suburban gardens. Indirectly, the flooding affected the operation of some on-site domestic wastewater disposal systems. By September, submersible electric pumps were installed in a stormwater pit on Woodhurst Road, and were pumped more or less continuously until 19 January 2010. An uncertain volume of water – perhaps 10-15 million litres (megalitres, ML) – was discharged to a tributary of Acton Creek. This pumping, coupled with natural groundwater discharge and increased evapotranspiration, restored the flooded areas. Other low-lying parts of the municipality (eg Lauderdale, Cremorne, Clifton Beach) were similarly flooded during the same period. 1.2 GEOLOGY AND GROUNDWATER AT SEVEN MILE BEACH TOWNSHIP The geology and groundwater conditions within the Seven Mile Beach township and golf club (including the area affected by flooding) are well established, and have been summarised by Cromer (2006)1. The area is underlain by Quaternary-age sand to depths of several metres below sea level. The upper surface of the sand body exhibits a series of ridges and swales (“hollows”) aligned subparallel to the present day beach. They are quite evident within the golf course, but have been largely disturbed by residential development within the township. Nevertheless, it was the remnants of swales in the township which flooded during 2009. For example, the western end of Woodhurst Road lies in a swale, about 0.3m lower than the eastern end of the street. The sand body at Seven Mile Beach contains groundwater2, which in the vicinity of the township and golf club is derived from infiltrating rain and ponded surface runoff, domestic wastewater and garden watering, and golf club irrigation. The water table (the upper surface of saturated sand) throughout most of the township (including the flood-affected area) generally stands at an elevation of about 2m AHD3. Considering the hydrogeology of the sand deposits, it is clear that the 2009 flooding was due to a rise in the water table so that it locally intersected the land surface4. This report was commissioned by Clarence City Council. Its intent is to try and assess what causes contributed to the high water table and localised flooding, under what conditions flooding might recur, and what measures might be introduced to reduce its effects.
1 Cromer, W. C. (2006). A hydrogeological review of the Seven Mile Beach spit, southeastern Tasmania. Unpublished report by William C Cromer Pty Ltd for Mineral Resources Tasmania, July 2006. 2 Attachment 4 discusses general groundwater principles. 3 AHD = Australian Height Datum. 0.0m AHD = mean sea level at Hobart and Burnie in 1973. 4 It is important to realise that if (for example) 100mm of rain infiltrated to the water table, the water table would be raised by about 0.4m. This is because only about 25% of the volume of the sand body is open space – the balance is taken up by sand grains.
Clarence City Council: Seven Mile Beach township
Review of 2009 flooding and drainage issues 9 April 2010
William C Cromer Pty Ltd 74A Channel Highway Taroona Tasmania 7053 Environmental, engineering and groundwater geologists Mobile 0408 122 127 email [email protected]
5 C C W
C C W
1.3 POSSIBLE CONTRIBUTORS TO A HIGH WATER TABLE Site inspections during 2009 and 2010, groundwater monitoring in early 2010, discussions with long-term residents, the golf club and Clarence City Council, and a review of the hydrogeology of the area, suggest that contributory causes to a high water table in the township and golf course might include:
unusually high rainfall, particularly when evapotranspiration is low (late autumn, winter and early spring; see Section 1.4),
imported domestic mains water used in the township,
irrigation by the Royal Hobart Golf Club, and
surface water issues, including, for example, the piped stormwater system in the
township, changes to the size of the catchment of Acton Creek, impediments to flow in the creek bed and at the sand bar at its mouth, and water impoundments (eg dams and ponded water) within the catchment.
1.4 MONTHLY RAINFALL AND EVAPOTRANSPIRATION AT SEVEN MILE BEACH Figure 1 summarises mean monthly rainfall and calculated evapotranspiration5 at Seven Mile Beach. The rainfall is the mean monthly rainfall for the period 1985 – 2009 recorded by the Royal Hobart Golf Club6. Two points are important:
Monthly evapotranspiration exceeds mean monthly rain in essentially every month (the two are about equal in April, July and August). Annual evapotranspiration is estimated at about 700mm and exceeds mean annual rain (514mm) by almost 200mm.
Evapotranspiration varies seasonally: it is a minimum (say, 45mm/month or
1.5mm/day) in the winter months, and a maximum (up to about 75mm/month or 2.5mm/day) in the summer months. On any day, the rain available to infiltrate to the subsurface is reduced by the evapotranspiration for that day.
Figure 1. Mean monthly rainfall and evapotranspiration at Seven Mile Beach 5 Evapotranspiration is calculated from mean maximum daily temperature using a Forestry Tasmanian method. For background reading, see: Mount, A. B. (1972). The Derivation and Testing of a Soil Dryness Index using Run-Off Data. Forestry Commission Tasmania Bulletin No. 4. 6 The cooperation of the Royal Hobart Golf Club, and in particular its groundsman Mr. S. Lewis, in providing rainfall and irrigation records, and access to monitoring bores, is gratefully acknowledged.
0
20
40
60
80
100
120
140
160
Jan Feb Mar Apr May Jun Jul Aug Sep Oct Nov Dec
Mon
thly
rain
and
eva
potra
nspi
ratio
n (m
m)
Mean rainfall (mm) Evapotrans (ET, mm)
Shaded columns are monthly rainfall
figures (mm) for 2009
Clarence City Council: Seven Mile Beach township
Review of 2009 flooding and drainage issues 9 April 2010
William C Cromer Pty Ltd 74A Channel Highway Taroona Tasmania 7053 Environmental, engineering and groundwater geologists Mobile 0408 122 127 email [email protected]
6 C C W
C C W
2 REVIEW OF POSSIBLE CAUSES OF A HIGH WATER TABLE The following sections canvas the issues in Section 1.3. 2.1 UNUSUALLY HIGH RAINFALL An automatic weather station at the Royal Hobart Golf Club records rain, evapotranspiration, temperature, wind and humidity. It was installed in late 2007, when the club started supplementing mains irrigation water with treated wastewater. However, daily rainfall has been recorded at the club for decades. Monthly rainfall at the club for the last quarter century is summarised in Table 1, and Figure 27. Note that annual rainfall has decreased (dashed black line) at the rate of about 50mm/25 years, or 2mm/year. The number of rain days for the same period is presented in Figure 3. The annual rain days increased (dashed black line) at the rate of about 30 days/25 years, or a little over one day a year. Table 1. Monthly rainfall at the Royal Hobart Golf Club 1985 – 2009
Total 542 449 463 578 444 540 479 571 323 424 346 694 514 Rainfall in 2009 at 694mm was the highest recorded (35% higher than average) for the last 25 years, and was twice the 2008 total. The June 2009 monthly rainfall of 139mm was the fourth highest recorded for the same period, and was more than four times the June average. More significantly, the four month period June – September was the wettest in at least 25 years, and possibly much longer (the club recorded 349mm for the four months; the next highest rainfall for the same period was 237mm in 2003). 7 The cooperation of the Royal Hobart Golf Club, and in particular its groundsman Mr. S. Lewis, in providing rainfall and irrigation records, and access to monitoring bores, is gratefully acknowledged.
Clarence City Council: Seven Mile Beach township
Review of 2009 flooding and drainage issues 9 April 2010
William C Cromer Pty Ltd 74A Channel Highway Taroona Tasmania 7053 Environmental, engineering and groundwater geologists Mobile 0408 122 127 email [email protected]
7 C C W
C C W
Monthly and annual rainfall, Royal Hobart Golf Club
0
100
200
300
400
500
600
700
800
1985
1986
1987
1988
1989
1990
1991
1992
1993
1994
1995
1996
1997
1998
1999
2000
2001
2002
2003
2004
2005
2006
2007
2008
2009
Rai
nfal
l (m
m)
Jan
Feb
Mar
Apr
May
Jun
July
Aug
Sept
Oct
Nov
Dec
Total
Monthly rain days, Royal Hobart Golf Club
0
20
40
60
80
100
120
140
160
1985
1986
1987
1988
1989
1990
1991
1992
1993
1994
1995
1996
1997
1998
1999
2000
2001
2002
2003
2004
2005
2006
2007
2008
2009
Rai
n da
ys
Jan
Feb
Mar
Apr
May
Jun
July
Aug
Sept
Oct
Nov
Dec
Total
Unusually high rainfall, particularly for the June – September period, is established. Moreover, it was associated with a larger than average number of rain days (Figure 3). Evapotranspiration during June – July averages about 1.5mm/day, rising gradually to perhaps 2mm/day for September. A total of about 200mm or thereabouts is indicated for the four months. Therefore, the net rain available for infiltration to the water table was 349mm less 200mm, or about 150m, during the four months. This amount of rain entering the water table would raise it about 0.6m. Figure 2. Monthly and annual rainfall at the Royal Hobart Golf Club 1985 – 2009
Figure 3. Monthly and annual rain days at the Royal Hobart Golf Club 1985 – 2009
Trend line
Trend line
Clarence City Council: Seven Mile Beach township
Review of 2009 flooding and drainage issues 9 April 2010
William C Cromer Pty Ltd 74A Channel Highway Taroona Tasmania 7053 Environmental, engineering and groundwater geologists Mobile 0408 122 127 email [email protected]
8 C C W
C C W
2.2 IMPORTED DOMESTIC WATER In a typical house with no water-saving fixtures, it is assumed that about 350L/day of reticulated mains water is used domestically per bedroom8. Assume also three bedrooms per house on average, for a total of about 1,000L of water use per house per day. With some 400 houses (give or take), the township imports about 400,000L/day (say, 0.5ML), spread over about 50ha. This is equivalent to a loading of about 1mm/day, which is probably applied mostly via subsurface irrigation or absorption trenches and therefore escapes at least some evapotranspiration. Assume about half is lost to evapotranspiration. Totalled over the four month period June – September, net domestic water use amounts to about 50mm, thereby raising the water table perhaps 0.2m, and therefore about a quarter the effect of the unusually high rainfall for the same period. 2.3 GOLF CLUB IRRIGATION The golf club has irrigated its course since the 1960s. The procedure has been computerised since late 2007, and the irrigation water volume applied during any period is determined by rainfall and evapotranspiration. If the net rain (after evapotranspiration) exceeds grass requirements, irrigation does not occur. Further, should more than 5mm of rain9 be received during an irrigation period, the system shuts down. Figure 4 shows, at the top, daily rainfall recorded at the club since January 2008, and at the bottom, the daily volume of irrigation water applied during the same period. (The number and intensity of rain days from June 2009 to the end of the year contrasts with the same period a year earlier.) In 2009, the club stopped irrigation in the first week of May, and started again in the last week of October, so no irrigation water was applied during the main period of flooding of the golf club and township10. 2.4 SURFACE WATER ISSUES Council’s piped stormwater system Along Woodhurst Road and Lewis Avenue, and in other streets, a series of grated stormwater pits is connected to buried slotted pipework. The pits are open at the bottom, sitting on gravel and sand. They receive runoff from the bitumen roads, which then infiltrates through their bases. If flow into the pits exceeds the infiltration capacity of the bases, the water level rises and flows into the slotted pipework (locally connected to absorption trenches). This system operates to discharge water to groundwater while the water table remains below the inverts of the slotted pipework. It works in reverse when the water table rises above the pipe invert, and groundwater enters. Note, however, that the system does not in itself contribute to a rising water table; it simply transfers water to the subsurface that would have ended up there anyway via infiltration11. There is scope to expand the stormwater system by connecting it to solid pipework which, in the event of high water tables, would discharge groundwater off-site to Seven Mile Beach or Acton Creek. 8 See, for example, Appendix 2.4D of AS/NZS 1547 (2000) On-site domestic-wastewater management, which assumes that under similar conditions each person uses about 180L/day (say, 360L/day/bedroom). 9 The 5mm is set by the club. It could be any desired figure. 10 During the preceding irrigation season (September to April) an average nightly irrigation volume of about 1ML was applied – over a total land area of about 50ha. This is about 2mm/day, but since the irrigation period includes that part of the year when daily evapotranspiration is a maximum (and indeed slightly exceeds 2mm/day), the net addition to the water table is effectively zero. 11 This is not strictly true when rain falling on a bitumen road runs off immediately to the stormwater pits, thus temporarily raising the local water table along the line of connected pits until the effect dissipates through lateral groundwater infiltration.
Clarence City Council: Seven Mile Beach township
Review of 2009 flooding and drainage issues 9 April 2010
William C Cromer Pty Ltd 74A Channel Highway Taroona Tasmania 7053 Environmental, engineering and groundwater geologists Mobile 0408 122 127 email [email protected]
9 C C W
C C W
Figure 4. Computerised records of daily rainfall and irrigation at the Royal Hobart Golf Club, January 2008 to February 2010
1.6
1.5
1.4
1.3
1.2
1.1
1.0
0.9
0.8
0.7
0.6
0.5
0.4
0.3
0.2
0.1
0
32
30 28
26 24 22
20 18 16
14 12
10 8 6 4
2 0
Irrig
atio
n (m
egal
itres
)
1/1/08 1/6/08 1/12/08 1/6/09 1/12/09 1/2/10
1/1/08 1/6/08 1/12/08 1/6/09 1/12/09 1/2/10
34 36 38
Rai
n (m
illim
etre
s)
Daily rainfall, Royal Hobart Golf Club, January 2008 to February 2010
Daily irrigation, Royal Hobart Golf Club, January 2008 to February 2010
Clarence City Council: Seven Mile Beach township
Review of 2009 flooding and drainage issues 9 April 2010
William C Cromer Pty Ltd 74A Channel Highway Taroona Tasmania 7053 Environmental, engineering and groundwater geologists Mobile 0408 122 127 email [email protected]
10 C C W
C C W
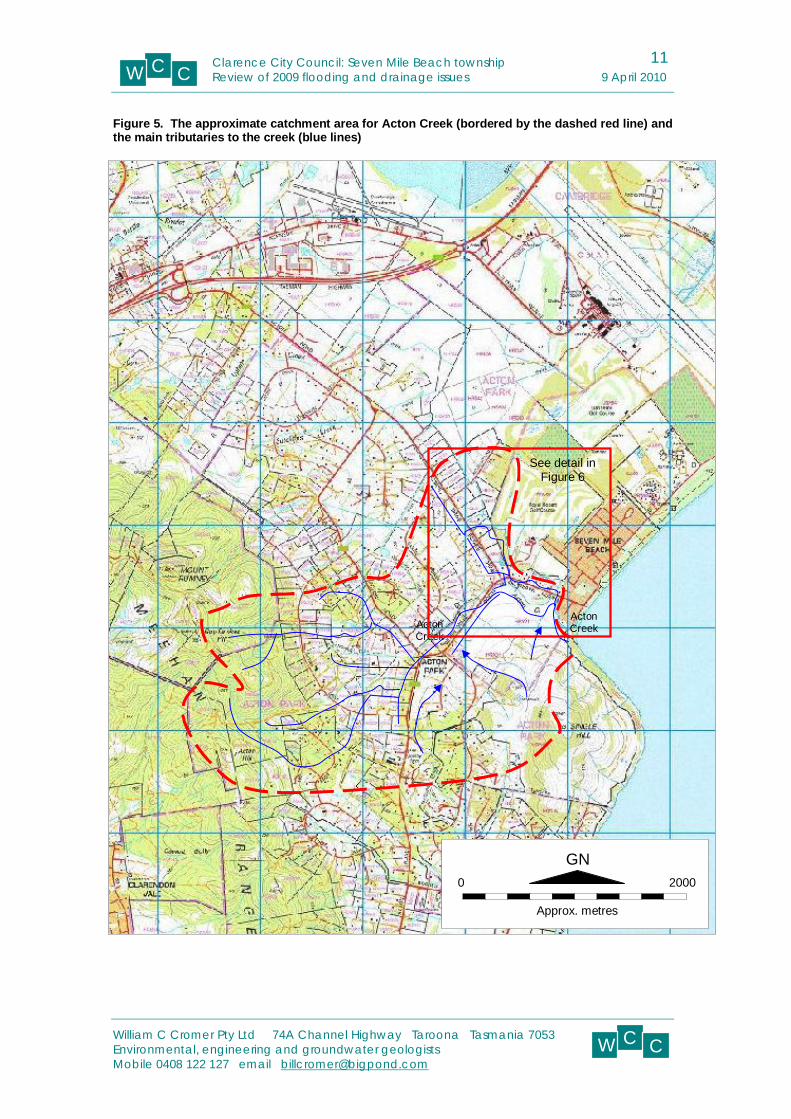
Surface water movement in the Acton Creek catchment The approximate boundary to the Acton Creek catchment, and the creek’s main feeder tributaries, are shown in Figure 5. As far as I am aware, no detailed hydrological study has been done of the catchment, covering about 11km2. Figure 6 is a more detailed map of the watercourses in the catchment in the vicinity of the golf club and township. Most of then are artificial drains. On the golf course, water bodies A, B and C are unlined dug-out “soaks” exposing the underlying groundwater body. Water bodies D and E and plastic-lined dams storing imported treated wastewater and are not in contact with the groundwater beneath. Water body G is a small unlined dam in the artificial drain F-H-I-J. This drain is also fed by at least two others either side of the adjacent practice fairway. Dam N is a private dam fed by drain M and drain O-P. It is presumably unlined, and would be in hydraulic contact with underlying groundwater12. Dam N overflows to point J. From here, water discharges down a largely natural tributary channel of Acton Creek to K, where it crosses in a culvert under Seven Mile Beach Road and joins the main creek channel to its mouth on Seven Mile Beach at L. Upstream, the main channel of Acton Creek is a partly artificial drain which is diverted beneath Seven Mile Beach Road in a culvert at Q; here it joins a drain on the southeastern side of the road, and flows across flat-lying and flood prone land to its main channel near R. Currently, Acton Creek is not flowing at its mouth, where it is blocked by beach sand (formed by natural processes; cover photo). The barrier will be breached if and when wave conditions erode it, or sufficiently heavy rain falls in the catchment, or both. In the meantime, the channel of the creek is flooded as far inland as point K at least. Parts of the channel from K to J are also now under water, but it is not clear whether the ponded water is a continuous body at the same level over the distance J-K-L. It is noted that recent clearing by Clarence City Council has temporarily removed some obstructive vegetation in the channel between J and K. Flood risk in the Acton Creek catchment Overlay SI Sheet 18 (Figure 7) of the Clarence City Council Planning Scheme 2005 shows those parts of the Seven Mile Beach area at risk of inundation due to flooding. The map includes the western corner of the golf club, but no properties within the township itself. Consulting engineers Johnstone, McGee & Gandy recently conducted a flood risk, assessment of the tributary to Acton Creek. Their report13 concludes that for several properties fronting onto Seven Mile Beach Road and including the tributary to Acton Creek (ie centrally between J and K in Figure 6), the 100 year Annual Recurrence Interval (ARI) flood level is 2.39mAHD. This analysis presumably assumed that Acton Creek would run freely to the sea, so that the effects of flooding would be exacerbated if, as is currently the case, the creek is blocked at its mouth by Seven Mile Beach. Flooding in 2009 During 2009, drain F-H-I-J flooded several times following heavy rain events. According to Mr. S. Lewis, groundsman at the Royal Hobart Golf Club, large amounts of water rapidly filled the drain, which, because of impeded flow in watercourse J-K-L, overflowed back into the fairways via the drains on the either side of the practice fairway. Mr. Lewis states that these events were the first he had recorded in 35 years. Flooding of parts of some fairways with surface water would have contributed to the water table, and locally exacerbated the problem, but the surface flooding is not the main contributory factor to the high water table throughout the area during 2009. 12 The rate of infiltration through the floor and downstream wall of dam K is related to the permeability of its construction materials. In any case, all water infiltrated in this manner would report to the open drain on its downstream side and hence down watercourse J-K (ie groundwater flow lines in its vicinity are towards the open watercourses). Because of this, seepage loses from the dam would have no effect on the water table in the township. 13 Seven Mile Beach Flood Plain Mapping for Residences of 37 – 57 Seven Mile Beach Road (Acton Creek tributary). Report by JMG dated February 2009.
Clarence City Council: Seven Mile Beach township
Review of 2009 flooding and drainage issues 9 April 2010
William C Cromer Pty Ltd 74A Channel Highway Taroona Tasmania 7053 Environmental, engineering and groundwater geologists Mobile 0408 122 127 email [email protected]
11 C C W
C C W
Figure 5. The approximate catchment area for Acton Creek (bordered by the dashed red line) and the main tributaries to the creek (blue lines)
Acton Creek
Acton Creek
0 2000
GN
Approx. metres
See detail in Figure 6
Clarence City Council: Seven Mile Beach township
Review of 2009 flooding and drainage issues 9 April 2010
William C Cromer Pty Ltd 74A Channel Highway Taroona Tasmania 7053 Environmental, engineering and groundwater geologists Mobile 0408 122 127 email [email protected]
12 C C W
C C W
Figure 6. Watercourses and water bodies in and near the Royal Hobart Golf Club 2.5 THE CURRENT WATER TABLE IN THE TOWNSHIP AND GOLF COURSE Since early January 2010, a network of groundwater measurement points has been monitored four times to assess the nature of the water table in the township and golf course. The measuring points included Council stormwater pits, existing monitoring bores installed by others, and, at the western end of Woodhurst Road, six new closely spaced monitoring bores. All monitoring points were surveyed into the state grid with an accuracy of better than a few millimetres so that the elevation of the water table with respect to “sea level” could be
0 1,000
Approx. metres
GN
A
J
L
R
I
O
K
H
C
D
E
B
F
G
M
Q
P
N
Clarence City Council: Seven Mile Beach township
Review of 2009 flooding and drainage issues 9 April 2010
William C Cromer Pty Ltd 74A Channel Highway Taroona Tasmania 7053 Environmental, engineering and groundwater geologists Mobile 0408 122 127 email [email protected]
13 C C W
C C W
ascertained. The monitoring dates also spanned two rain events (of 21 and 17mm) which enabled the response of the water table to be measured.
Figure 7. Clarence City Council Planning Scheme 2007 Overlay SI Sheet 18
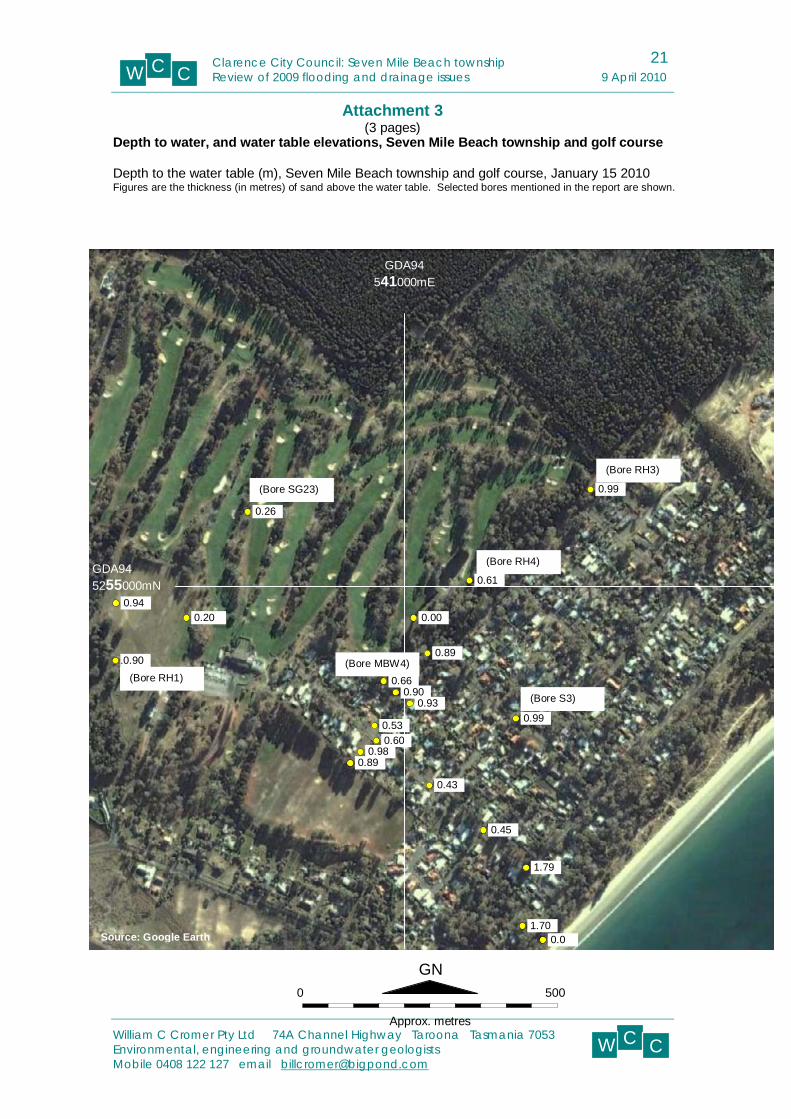
Thickness of sand above the water table in January 2010 The first satellite image in Attachment 3 shows the depth to the water table at various monitoring points on 15 January 2010. The lowest value (of course), is 0.00m in the soak on the golf course. The highest values are near the coast where the water table height decreases towards mean sea level. The western end of Woodhurst Road, which was under at least 0.3m of water during the flooding, was some 0.5m above the water table by mid-January, and ground either side of the road was about a metre or so above the water table. On the golf course, monitoring bore SG23 showed the water table at about 0.25m; this area was flooded several times in 2009 by stormwater from drain F-H-I-J. As stated above, because the effective porosity of the sand beneath the township and golf
Clarence City Council: Seven Mile Beach township
Review of 2009 flooding and drainage issues 9 April 2010
William C Cromer Pty Ltd 74A Channel Highway Taroona Tasmania 7053 Environmental, engineering and groundwater geologists Mobile 0408 122 127 email [email protected]
14 C C W
C C W
course is about 25%, the infiltration of (say) 100mm of water to the water table raises the latter by 100/0.25 = 400mm. So, low-lying parts of the area with a water table shallower than this would likely be flooded should such an event recur. Note, however, that the water table is also falling continuously (see below), so the longer the period between high rainfall events, the deeper the water table and the less chance of flooding. Elevation of the water table in January and February 2010 The water table was measured on 15 January and 15 February 2010 at various monitoring points. The second and third satellite images in Attachment 3 show the elevation of the water table (ie its height above approximate mean sea level, not its depth below the surface) for January and February respectively. Observations are:
January 15 2010: The water table intersects the coast near mean sea level, so that its elevation is zero here. It rises inland, so that near the Seven Mile Beach shop, it was about 1.4m AHD on January 15. Elsewhere within the township and golf course, the elevation of the water table was approximately 2m AHD with only minor variation either side of this value. This means that the water table is almost flat throughout the area, and the groundwater is very slow moving from high to low elevations. The highest point was 2.16 at bore RH4 in the golf course. The lowest point was 1.83m AHD in bore RH1 near drain F-H-I-J.
February 15 2010: The highest point was still bore RH4 in the golf course, but the
water table elevation had fallen 2mm to 2.14m AHD. The lowest point was still bore RH1 near drain F-H-I-J, in which the water table elevation had fallen 11mm to 1.72m AHD. Elsewhere, the water table had generally fallen between 0 and 10mm within the month.
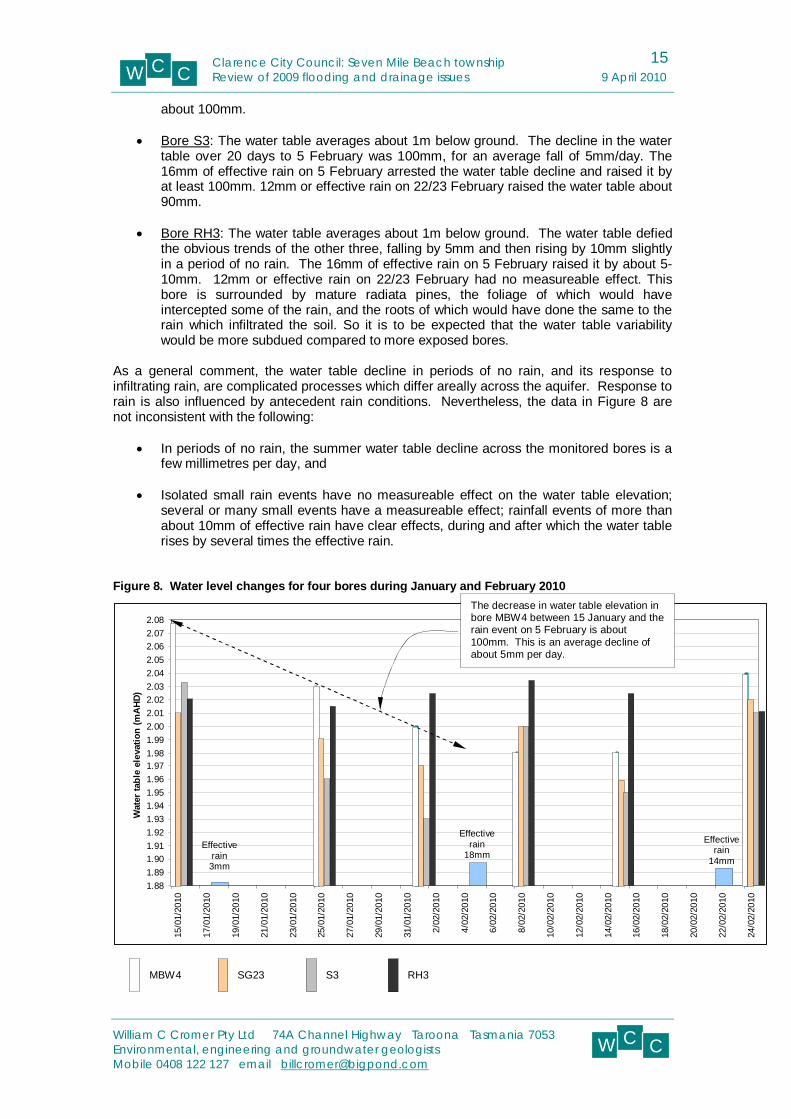
Groundwater flow directions The second and third satellite images in Attachment 3 show that lateral groundwater movement (from high to low elevations) is generally towards the coast at Seven Mile Beach, but also towards the drainage system and the Acton Creek tributary at the western end of the golf course. There may be variations on this as a result of local differences in water table elevation, but none is significant. The water table gradient is very low, and the rate of groundwater movement is also correspondingly very low. Water table response to rain events in January and February 2010 Two fairly significant rainfall events occurred during the monitoring period, when the golf club recorded 21mm on February 5, and 17mm over the night of February 22/23, 2010. From these figures, evapotranspiration should be subtracted to arrive at the effective rainfall. The club’s weather station reported evapotranspiration of 2.7mm and 3.7mm for February 22 and 23 respectively. Assume 3mm, so that as an approximation the effective rain on February 5 and 22/23 would have been about 18mm and 14mm. Figure 8 plots the changes in water table elevation in four bores measured six times in January and February 2010, and shows the two main rain events (a 6mm rain event on 18 January with an effective rain of 3mm is also shown in Figure 8 but it seems not to have affected the water table and so is ignored in this discussion). Bore locations are shown in Attachment 3 (second and third pages). Observations from Attachment 3 and Figure 8 are:
Bore MBW4: The water table averages about 0.75m below ground. In 20 rain-free days between 15 January and 5 February 2010 it fell about 110mm, ie an average of 5mm/day. 16mm of effective rain was recorded on 5 February. This arrested the water table decline and raised it by at least 20mm. 12mm or effective rain on 22/23 February raised the water table about 100mm.
Bore SG23: The water table averages about 0.25m below ground. The decline in the
water table over 20 days to 5 February was 50mm, for an average fall of 2.5mm/day. The 16mm of effective rain on 5 February arrested the water table decline and raised it by at least 40mm. 12mm or effective rain on 22/23 February raised the water table
Clarence City Council: Seven Mile Beach township
Review of 2009 flooding and drainage issues 9 April 2010
William C Cromer Pty Ltd 74A Channel Highway Taroona Tasmania 7053 Environmental, engineering and groundwater geologists Mobile 0408 122 127 email [email protected]
15 C C W
C C W
about 100mm.
Bore S3: The water table averages about 1m below ground. The decline in the water table over 20 days to 5 February was 100mm, for an average fall of 5mm/day. The 16mm of effective rain on 5 February arrested the water table decline and raised it by at least 100mm. 12mm or effective rain on 22/23 February raised the water table about 90mm.
Bore RH3: The water table averages about 1m below ground. The water table defied
the obvious trends of the other three, falling by 5mm and then rising by 10mm slightly in a period of no rain. The 16mm of effective rain on 5 February raised it by about 5-10mm. 12mm or effective rain on 22/23 February had no measureable effect. This bore is surrounded by mature radiata pines, the foliage of which would have intercepted some of the rain, and the roots of which would have done the same to the rain which infiltrated the soil. So it is to be expected that the water table variability would be more subdued compared to more exposed bores.
As a general comment, the water table decline in periods of no rain, and its response to infiltrating rain, are complicated processes which differ areally across the aquifer. Response to rain is also influenced by antecedent rain conditions. Nevertheless, the data in Figure 8 are not inconsistent with the following:
In periods of no rain, the summer water table decline across the monitored bores is a few millimetres per day, and
Isolated small rain events have no measureable effect on the water table elevation;
several or many small events have a measureable effect; rainfall events of more than about 10mm of effective rain have clear effects, during and after which the water table rises by several times the effective rain.
Figure 8. Water level changes for four bores during January and February 2010
The decrease in water table elevation in bore MBW4 between 15 January and the rain event on 5 February is about 100mm. This is an average decline of about 5mm per day.
Clarence City Council: Seven Mile Beach township
Review of 2009 flooding and drainage issues 9 April 2010
William C Cromer Pty Ltd 74A Channel Highway Taroona Tasmania 7053 Environmental, engineering and groundwater geologists Mobile 0408 122 127 email [email protected]
16 C C W
C C W
2.6 LIKELIHOOD OF FUTURE FLOODING IN THE TOWN AND GOLF CLUB The foregoing discussion suggests that, in the absence of management practices to mitigate the consequences, the likelihood of future flooding of low lying parts of the township and golf club should be regarded as within the range Likely to Almost certain14, with indicative values of approximate annual probability in the range 10-2 to 10-1 ie 1% to 10% chance of flooding in any one year. This is in keeping with anecdotal evidence that the 2009 flooding was the first such event for at least 35 years. However, sea level rise (see Section 2.7) in addition to high rainfall will progressively raise the height of the water table (and hence the chance of flooding), so that the assumed likelihood of flooding might be closer to Almost certain. 2.7 EFFECTS OF SEA LEVEL RISE ON THE WATER TABLE AT SEVEN MILE BEACH It is recognised that sea level rise and attendant storm surges pose risks, particularly to areas bordering soft, sensitive coastlines15 (ie Seven Mile Beach). Up to a metre or so rise this century is commonly predicted and should perhaps be conservatively regarded as Likely. Some reports suggest a larger rise, and some scientists refute that a rise will occur at all in the foreseeable future. If sea level rises, shoreline erosion and regression (inland migration) is probable16. Irrespective of the amount of sea level rise, any increase in the frequency or intensity (or both) of storm surges can be expected to flood Acton Creek, and overtop or erode coastal foredunes. (The foredunes along The Esplanade, for example, are relatively low, in the 3.5m – 5mAHD range. Storm surges across this street have reportedly happened previously near Acton Creek, where the foredunes are admittedly absent.) Aside from any direct effects of coastal erosion and storm surges, a sea level rise will result in a water table rise of a similar amount. If no management practices are in place, if sea level rise is more or less as predicted, and if high rainfall events recur, the township and golf club will over coming decades be at increased risk of flooding, and low lying areas increasingly inundated with groundwater. Consequences include flooding on a scale greater than seen in 2009, with loss of amenity, failed wastewater systems, and more and more houses rendered unliveable ie the consequences range from Minor to Major, and the risks from High to Very high17. 14These underlined terms are used advisedly, and are in general keeping with the same terms in Australian Geomechanics Society Subcommittee (2007). Landslide Risk Management. Australian Geomechanics 42(1) March 2007, pp 1– 219. 15 For useful background information, see Sharples, C. (2004). Indicative Mapping of Tasmanian Coastal Vulnerability to Climate Change and Sea Level Rise. Explanatory Report., and Cromer, W. C. (2006). Geotechnical Risk Assessment: Storm surges causing foredune erosion and flooding, Roches Beach, Lauderdale. Unpublished report for Clarence City Council by William C Cromer Pty Ltd, 17 February 2006). 16 The worst-case scenario is the reshaping and tidal inundation of the foreshore and surrounding low-lying areas of Seven Mile Beach (the beach will most likely migrate inland), and the destruction or prior demolition/removal of homes in the affected areas. Other low-lying arts of Tasmania, including (in SE Tasmania) parts of Cremorne and Lauderdale, will be similarly affected. 17 It is up to stakeholders to decide whether any evaluated risk is acceptable or not. A rough guide might be to consider all Very low and Low geotechnical risks as acceptable and not requiring treatment, Moderate risks to be acceptable or tolerable and may require treatment, and High and Very high risks as tolerable or intolerable, and generally requiring treatment. Treatment is designed to reduce risks to acceptable or tolerable levels. It may include Accepting the risk, Avoiding the risk (ie abandoning the project), Reducing the likelihood of the hazard occurring (ie perhaps reducing global greenhouse gas emissions), Reduce the consequences (eg coastal engineering solutions; suitable building design), Monitoring and warning systems (which might help reduce the consequences of the hazard), Transferring the risk (eg requiring another authority to accept the risk or compensate for the risk, such as insurance companies), and Postponing a decision (eg if there is insufficient certainty about the risk, it might be better to do further investigations).
Clarence City Council: Seven Mile Beach township
Review of 2009 flooding and drainage issues 9 April 2010
William C Cromer Pty Ltd 74A Channel Highway Taroona Tasmania 7053 Environmental, engineering and groundwater geologists Mobile 0408 122 127 email [email protected]
17 C C W
C C W
2.8 POSSIBLE MANAGEMENT MEASURES IN RELATION TO FLOODING AT SEVEN MILE BEACH It is suggested that high rainfall events and sea level rise will combine so that it is Almost certain that flooding on a scale similar to that experienced in 2009 will recur at Seven Mile Beach. Stakeholders in relation to flooding hazard include home and business owners, Clarence City Council, state government, insurance companies, emergency services and golf club members. All or some of these may elect to do nothing and accept the risks and presumably responsibility for potential loss of property and/or amenity. Stakeholders may choose to avoid the risks (ie walk away from affected areas, homes and infrastructure). In most instances this is likely to be unacceptable, but it is noted that some residents vacated homes during the 2009 flooding. Clarence City Council commissioned a report18 published last year entitled which examined erosion/recession and inundation hazards for 18 selected areas of the City. One of these areas was Seven Mile Beach. While the report did not specifically deal with the groundwater hazard, the recommendations arising from the inundation analysis are relevant and include:
“Monitor groundwater conditions for salinity and effectiveness of septic tanks. Record water levels to AHD, look at trends and compare to sea level changes, changes in runoff etc."
The report also recommends changes to the Planning Scheme to control development in all inundation hazard zones. Council has developed an amendment to the Planning Scheme that includes two overlays – one relating to inundation and the other to erosion/dune recession hazard. The amendment has been certified by Council for exhibition and is currently with the Tasmanian Planning Commission. For Seven Mile Beach in relation to the groundwater hazard it is the inundation overlay that is critical. The amendment requires all new habitable developments to be built to a minimum design floor level, which is substantially above existing ground levels and as such should mitigate not only the risk of surface water inundation but also the groundwater risk for built structures. Individually or collectively, it is impossible to reduce the likelihood of the flood hazard occurring. This amounts to individually attempting to alter climate. The remaining treatment alternative is to reduce the consequences of the risks, coupled perhaps with monitoring. Consequences of flooding may be reduced by all or some of the following.
Improving surface drainage by maintaining a clear channel in Acton Creek and its tributary drains,
Approaching the State Government to implement a program to maintain the mouth of
Acton Creek open to the sea,
Raise low lying areas (eg the western end of Woodhurst Road and parts of Winston Avenue) by infilling. Owners of properties can raise low-lying areas by infilling, subject to meeting any necessary approvals.
Undertaking a benefit/cost risk assessment investigation of permanent pump
installations or graded outfall pipes where possible in low lying areas which automatically pump out groundwater and attendant surface water to mitigate any
18 Climate Change Impacts on Clarence coastal areas – Final Report April 2009. Report prepared by the Australian Government Department of Climate Change for Clarence City Council. Download the final report from www.ccc.tas.gov.au/webdata/resources/files/CCICCA-Final-Report-A415375.pdf
Clarence City Council: Seven Mile Beach township
Review of 2009 flooding and drainage issues 9 April 2010
William C Cromer Pty Ltd 74A Channel Highway Taroona Tasmania 7053 Environmental, engineering and groundwater geologists Mobile 0408 122 127 email [email protected]
18 C C W
C C W
impact. Ultimately if sea level and the water table rise, this approach will be increasingly ineffective.
Providing a reticulated sewerage system for the township (with off-site discharge), or encouraging householders to install on-site domestic systems which discharge wastewater to the near-surface rather than via absorption trenches
While the erosive and storm surge consequences of sea level rise might be at least partly managed by engineering structures such as sea walls (which will assist in mitigating flooding), the attendant rise in the water table inland of the coast will be unavoidable.
Bill Cromer Principal This report is and must remain accompanied by the following Attachments Attachment 1. Satellite imagery of Seven Mile Beach township and golf course, showing areas directly
affected by flooding in 2009 (1 page) Attachment 2. Elevations (mAHD) in the Seven Mile Beach township and golf course (1 page) Attachment 3. Depth to water, and water table elevations, Seven Mile Beach township and golf course (3 pages) Attachment 4. Groundwater principles (6 pages)
Clarence City Council: Seven Mile Beach township
Review of 2009 flooding and drainage issues 9 April 2010
William C Cromer Pty Ltd 74A Channel Highway Taroona Tasmania 7053 Environmental, engineering and groundwater geologists Mobile 0408 122 127 email [email protected]
19 C C W
C C W
Attachment 1 (1 page)
Satellite imagery of Seven Mile Beach township and golf course, showing areas directly affected by flooding in 2009 Affected areas are enclosed by dashed yellow line (approximate only)
Compare with Attachment 2.
4km
0 1,000
GN
Approx. metres
Only low-lying parts directly
affected
Only low-lying parts directly
affected
Royal Hobart Golf Club
Seven Mile Beach township
Clarence City Council: Seven Mile Beach township
Review of 2009 flooding and drainage issues 9 April 2010
William C Cromer Pty Ltd 74A Channel Highway Taroona Tasmania 7053 Environmental, engineering and groundwater geologists Mobile 0408 122 127 email [email protected]
20 C C W
C C W
Attachment 2 (1 page)
Elevations (mAHD) in the Seven Mile Beach township and golf course Modified from Figure 21 of Climate Change Impacts on Clarence coastal areas – Final Report April 2009. Report
prepared by the Australian Government Department of Climate Change for Clarence City Council.
Land >2.9mAHD
Land 2.5 to 2.9mAHD
Land 2.3 to 2.5mAHD
Land 2.2 to 2.3mAHD
Land 2.0 to 2.2mAHD
Land 1.7 to 2.0mAHD
Land <1.7mAHD
0 1,000
GN
Approx. metres
Key to colours
Clarence City Council: Seven Mile Beach township
Review of 2009 flooding and drainage issues 9 April 2010
William C Cromer Pty Ltd 74A Channel Highway Taroona Tasmania 7053 Environmental, engineering and groundwater geologists Mobile 0408 122 127 email [email protected]
21 C C W
C C W
Attachment 3 (3 pages)
Depth to water, and water table elevations, Seven Mile Beach township and golf course Depth to the water table (m), Seven Mile Beach township and golf course, January 15 2010 Figures are the thickness (in metres) of sand above the water table. Selected bores mentioned in the report are shown.
Source: Google Earth
GDA94 5255000mN
GDA94 541000mE
0.94
0.0 1.70
1.79
0 500
GN
Approx. metres
0.98 0.89
0.60
0.43
0.45
0.53 0.99
.0.90 0.89
0.93
0.99
0.61
0.00
0.26
0.20
0.66 0.90
(Bore SG23)
(Bore RH1)
(Bore RH4)
(Bore MBW4)
(Bore S3)
(Bore RH3)
Clarence City Council: Seven Mile Beach township
Review of 2009 flooding and drainage issues 9 April 2010
William C Cromer Pty Ltd 74A Channel Highway Taroona Tasmania 7053 Environmental, engineering and groundwater geologists Mobile 0408 122 127 email [email protected]
22 C C W
C C W
Water table elevations, Seven Mile Beach township and golf course, 15 January 2010 Figures are water table elevations in mAHD. Selected bores mentioned in the report are shown.
Source: Google Earth
GDA94 5255000mN
GDA94 541000mE
1.95
1.00 1.30
1.41
1.34
0 500
GN
Approx. metres
2.02 1.95
2.05
2.20
2.07
2.04 2.02
1.83 2.08
2.02 2.05
2.02
2.16
2.01
2.01
<1.97
2.08
(Bore SG23)
(Bore RH1)
Shop
(Bore RH4)
(Bore MBW4)
(Bore S3)
(Bore RH3)
Clarence City Council: Seven Mile Beach township
Review of 2009 flooding and drainage issues 9 April 2010
William C Cromer Pty Ltd 74A Channel Highway Taroona Tasmania 7053 Environmental, engineering and groundwater geologists Mobile 0408 122 127 email [email protected]
23 C C W
C C W
Water table elevations, Seven Mile Beach township and golf course, 15 February 2010 Figures are water table elevations in mAHD. Selected bores mentioned in the report are shown.
Source: Google Earth
GDA94 5255000mN
GDA94 541000mE
1.81
N/A N/A
1.33
0 500
GN
Approx. metres
1.91 1.86
2.01
2.00
1.97
1.98 1.95
1.72 2.08
1.97 2.00
2.03
2.14
1.99
1.97
<1.97 1.25
1.98
(Bore RH4)
(Bore S3)
(Bore RH3)
(Bore SG23)
(Bore RH1) (Bore MBW4)
Clarence City Council: Seven Mile Beach township
Review of 2009 flooding and drainage issues 9 April 2010
William C Cromer Pty Ltd 74A Channel Highway Taroona Tasmania 7053 Environmental, engineering and groundwater geologists Mobile 0408 122 127 email [email protected]
24 C C W
C C W
Attachment 4 (6 pages)
Groundwater principles The following comments are drawn largely from Cromer (1993), to provide readers of this report with a basic background to hydrogeological principles.
Origin of groundwater All earth’s water was formed deep underground by magmatic processes, and has over aeons been released at the surface and on ocean floors by volcanism. The mechanism continues today. With the exception of this ‘new’ water, all groundwater is derived from that part of precipitation which, after surface runoff and evaporation, infiltrates the soil. Some of the infiltrating water is transpired by plants, some is drawn upward by capillary action and evaporated, and some remains indefinitely in microscopic voids in the soil profile. During and after continuous and wetting rain, the remainder infiltrates downwards, intermittently and successively saturating the material through which it passes, until the water reaches the zone of saturation. Here, the soil or rock voids (openings) are completely filled with water. The water is then called groundwater, and the unconfined surface of the zone of saturation is known as the water table. The water table is usually a subdued replica of the land surface, being almost flat under gently undulating ground (like at Seven Mile Beach), and deeper and sloping under hills. The proportion of rain infiltrating into the soil is very variable, ranging from a few percent on steep, rocky slopes, to perhaps 50% or more in sandy or gravelly areas with little runoff. The proportion also changes seasonally, and infiltration into sands like those at Seven Mile Beach, for example, would be expected to be a maximum when evaporation is least – at night in winter. Of the water which enters the soil, only a fraction avoids transpiration or retention in soil voids, and infiltrates to the water table. Groundwater is therefore a part of the general hydrological cycle, and is directly related to the surface movement of water.
Unconfined and confined aquifers An aquifer is a body of rock, or unconsolidated material such as sand, capable of supplying useful amounts of groundwater. An aquifer has two purposes: it stores, and transmits, groundwater. The relative importance of each function is determined by the nature of each aquifer. Some aquifers (eg hard sandstone) may store only a small amount of water in a network of thin fractures, but might transmit it freely, and remain reliable suppliers, if the fractures are sufficiently interconnected. Other materials like fine-grained and porous clays may contain larger amounts of water, but yield only small amounts because the water is not transmitted easily through their microscopic voids. Aquifers may be unconfined (like the coastal sands at Seven Mile Beach) or confined. An unconfined or water table aquifer exists in unconsolidated sediments or other materials whenever the water table is in contact with air at atmospheric pressure. Unconfined aquifers therefore receive recharge from infiltrating rain over their full areal extent. Groundwater in a bore tapping an unconfined aquifer remains at the level of the water table. By contrast, a confined aquifer is a saturated, permeable zone bounded above and below by relatively impermeable materials. The aquifer cannot receive recharge by directly infiltrating rain, but must get it from a more elevated recharge area elsewhere, where the permeable zone is exposed at the land surface, and where at least local unconfined conditions exist. The infiltrating groundwater in the zone of recharge moves downslope beneath the confining impermeable layer. The water in confined aquifers is therefore not in contact with the atmosphere, and is at a pressure greater than atmospheric. Water in bores tapping confined aquifers rises up the bore under pressure, and may overflow at the land surface. If the water in the bore rises above the land surface (so that groundwater flows without the need for a pump),
Clarence City Council: Seven Mile Beach township
Review of 2009 flooding and drainage issues 9 April 2010
William C Cromer Pty Ltd 74A Channel Highway Taroona Tasmania 7053 Environmental, engineering and groundwater geologists Mobile 0408 122 127 email [email protected]
25 C C W
C C W
the groundwater (and the bore) are said to be artesian. If the groundwater rises but not sufficiently for the bore to flow, the groundwater is sub-artesian.
Storage capabilities of unconfined coastal sands Unconsolidated sands like those at Seven Mile Beach are reliable aquifers. They have good storage capabilities, and are also relatively good transmitters. The water is stored in voids between the sand grains, and the voids are interconnected (ie the aquifer is intergranular). The voids may constitute from 25% to 35% of the volume of sand (ie the porosity, θ, of the sand is 25% to 35%, or 0.25 to 0.35 expressed as a fraction). Each cubic metre of saturated sand below the water table therefore contains 250L to 350L of groundwater. A proportion of this is held tightly around the sand grains, and cannot easily be removed. A measure of the extractable volume of water in an unconfined aquifer is its specific yield (S), defined as the ratio of (a) the volume of groundwater which the saturated aquifer will yield on gravity drainage to (b) the volume of the aquifer. It is equivalent to the porosity minus the firmly-held water (specific retention), or Porosity = specific yield + specific retention For example, if porosity is 35% (0.35) and specific yield is 25% (0.25), then specific retention is 10% (0.1). A cubic metre of saturated sand would then contain 350L; 250L of which would drain by gravity, leaving 100L held more tightly around sand grains.
Primary and secondary porosity The voids between sand grains in a coastal sand body like that at Seven Mile Beach, or the vesicles in the otherwise hard basalt beneath the sand, constitute primary porosity, because they were formed at the same time as the sand was deposited, or the basalt flowed as lava. As the sand becomes progressively cemented and consolidated in the process of becoming hard rock, the primary porosity is reduced. Most hard rocks have very little remaining primary porosity. However, if the hard rock becomes fractured and otherwise jointed, the fractures constitute secondary porosity.
Groundwater gradient Groundwater is rarely stationary. It moves in response to gravity, and hydrostatic and lithostatic pressures, from recharge areas to discharge zones. Discharge occurs wherever the water table intersects the land surface in springs, swamps, rivers and the sea, provided the water table slopes towards the feature. If the water table is unconfined than the feature, water may flow from the spring or river to the groundwater body. The slope of the water table is called the water table gradient19, which determines the direction and rate at which groundwater moves. The greater the gradient, the more rapid the flow. Groundwater usually flows in the direction of steepest gradient. In coastal sand bodies, the gradient is usually very low (often less than 1:100) so that the groundwater is slow-moving.
Aquifer permeability and transmissivity Permeability (symbol K) is a measure of how readily an aquifer transmits water, and is defined as the rate at which groundwater will flow from a unit area (eg one square metre) of aquifer under a unit gradient (ie the gradient is 1). It is expressed as cubic metres per day per square metre (m3/day/m2, which reduces to m/day). Typical coastal sands have permeabilities in the approximate range 2 to 20 m/day, depending on the size and interconnectedness of the voids between the sand grains, and whether the sand is poorly-sorted or well-sorted. Permeability usually varies horizontally and vertically in an aquifer. Transmissivity (T) is defined as the
19 The gradient is usually expressed as the difference in elevation of the water table between two points, divided by the distance between them. For example, a fall of one metre in water table elevation over a horizontal distance of 50 metres is a gradient of 1:50 (ie 0.02, expressed as a fraction).
Clarence City Council: Seven Mile Beach township
Review of 2009 flooding and drainage issues 9 April 2010
William C Cromer Pty Ltd 74A Channel Highway Taroona Tasmania 7053 Environmental, engineering and groundwater geologists Mobile 0408 122 127 email [email protected]
26 C C W
C C W
product of permeability and saturated aquifer thickness, and is therefore the rate at which groundwater will flow from a vertical, one-metre wide strip of the aquifer under a unit hydraulic gradient.
Volume of groundwater flow The groundwater flow through a unit area (eg one square metre) of an aquifer is determined by the aquifer permeability and the water table gradient, and is calculated from Darcy’s Law: Flow = permeability x gradient20.
Rate of groundwater travel The rate at which groundwater travels through an aquifer is determined by the aquifer permeability, the water table gradient, and the aquifer porosity (expressed as a fraction). Rate of flow = permeability x gradient ⁄ effective porosity21. In coastal sand bodies, therefore, where gradients are low, the rate of groundwater movement is also usually low. Groundwater quality Groundwater acquires soluble matter from the aquifer in which it is stored, and through which it moves. Generally, the longer the water remains in the aquifer, the more soluble constituents it acquires, and the poorer its quality. So, other things being equal, aquifers with relatively high permeability tend to have better quality water than low permeability aquifers. Also, other things being equal, better quality groundwater is found in aquifers in high rainfall areas, where groundwater recharges the aquifer more frequently, and aquifers are “flushed” more often. Unconfined sandy aquifers near coasts also acquire salinity from airborne salts blown inland from sea spray, and leached by rain into the soil. In shallow unconfined aquifers, it is usual to find better quality groundwater near the water table where direct infiltration of rain has occurred. Quality typically decreases with depth. A common measure of groundwater quality (‘salinity’) is its Total Dissolved Solids (TDS), expressed in milligrams per litre (mg/L; essentially the same as the older measure, parts per million, ppm). Typical TDS ranges of waters are: TDS (mg/L Tasmanian rain <50 Tasmanian river water <100 Drinking water starts to have ‘taste’ 250 – 500 Generally accepted desirable unconfined limit for drinking water 1,000 Range of commercially available mineral waters 250 – 1,500 Groundwater in coastal sands 300 – 5,000 Sea water 37,500 The coastal sand aquifer at Seven Mile Beach extends below sea level The sandy aquifer at Seven Mile Beach ranges from about 6 – 12m thick. Since it is only about 2 – 3m above mean sea level, it extends well below sea level, resting on older clay. All of the sandy aquifer, below the water table, is full of ‘fresh’ groundwater. Beneath the tidal zone along the foreshore, the fresh groundwater is in contact with sea water. In fact, all
20 For example, assuming a permeability of 10m3/day/m2 and a gradient of 1:100 (ie 0.01), the flow through a single square metre of sand is 10 x 0.01 = 0.1m3/day (100L/day). If the sand permeability is 2m3/day/m2, and the gradient remained at 0.01, the flow would be 2 x 0.01 = 0.02m3/day (20L/day). On a one hectare property, with a 100m boundary parallel to a beach, the groundwater flow across the boundary would be 100m x 0.02m3/day (ie 2m3/day, for each one metre depth of saturated sand). 21 For example, if the sand permeability is 2m3/day/m2, the gradient is 0.01 and the effective porosity is 0.25, the rate of flow would be 2 x 0.01 ⁄ 0.25 = 0.08m/day (ie 8cm/day).
Clarence City Council: Seven Mile Beach township
Review of 2009 flooding and drainage issues 9 April 2010
William C Cromer Pty Ltd 74A Channel Highway Taroona Tasmania 7053 Environmental, engineering and groundwater geologists Mobile 0408 122 127 email [email protected]
27 C C W
C C W
coastal sands aquifers worldwide exhibit a fresh water – sea water interface at the coast, which is a narrow mixing zone of brackish water dipping inland from beach level. The shape of the interface is mathematically predictable, and depends only on the elevation of the water table, the permeability of the aquifer, and the density difference between the two water types. Because water table gradients are continually changing in response to recharge and discharge, and tidal effects near the coast, the shape and location of the interface is also continually changing. In a static situation, one metre of fresh water above sea level will support a 40m high column of fresh water below sea level22. If the aquifer at any point is at least 40 times thicker than the elevation of the water table, then sea water will exist beneath the fresh groundwater body (Figure 1). At Seven Mile Beach, and all other Tasmanian coastal sands bodies which have been investigated, the aquifer is thin enough, and the elevation of the water table is sufficient, so that more than a short distance inland, the aquifer is completely filled with fresh water.
22 This relationship arises because fresh water is slightly less dense than sea water. The difference is about 0.025, or one-fortieth. To be in hydrostatic equilibrium, the weight of adjacent columns of water in an aquifer must be equal. For example, a column of sea water 40m high weighs the same as a column of fresh water 41m high.
Water table gradient i
Shoreline x
Foredunes
Sea level
Permeability K
Flowlines
h
Dry
Saturated
b = 40h
X0 Land surface
Sea water (density γ1)
γ1 - γ2 = 0.025 = 1/40
Q = Kh2/2γx
X0 = Q/2γK
(a) Flow pattern near a beach in an unconfined aquifer where the aquifer thickness is at least 40 times the elevation of the water table (ie b is at least 40h)
Q
Sea water γ1
Gradient i
Shoreline x
Foredunes
Sea level
Permeability K
Flowlines
h
Dry
Saturated Water table
b < 40h
X0 Land surface
(b) Flow pattern near the beach in the unconfined aquifer where the aquifer thickness is generally less than 40 times the elevation of the water table (ie b is less than 40h)
Q
γ1 - γ2 = 0.025 = 1/40
Q = Kh2/2γx
X0 = Q/2γK
d = b/40i
Tertiary-age clay
d
Fresh water (density γ2)
Sea water (density γ1)
Fresh water (density γ2)
Beach
Unconfined sandy aquifer
Confined basalt aquifer
Figure 1. Cross sections showing the water table, groundwater flow patterns (arrowed lines) and the fresh water – sea water interface in unconfined coastal sands aquifers. The bottom cross section is a schematic for most Tasmanian coastal sand aquifers where a relatively shallow impermeable base is present, and the aquifer is full of fresh water. Figure adapted from Figure 23 of Cromer 1979, in turn from Glover, 1964)
Clarence City Council: Seven Mile Beach township
Review of 2009 flooding and drainage issues 9 April 2010
William C Cromer Pty Ltd 74A Channel Highway Taroona Tasmania 7053 Environmental, engineering and groundwater geologists Mobile 0408 122 127 email [email protected]
28 C C W
C C W
Spear bores as a means of extracting groundwater from coastal sands A spear bore or, simply, a spear, is a (probably uniquely Tasmanian) term for a shallow, small-diameter bore installed in loose, unconfined aquifers. Years ago, a typical spear was a length of 50mm galvanized iron with a fine mesh wrapped around holes drilled near the bottom, and a conical steel tip. The assembly was hammered into the ground, hopefully to depths below the water table. Nowadays, spears are almost exclusively of PVC casing, with a bottom slotted or screened interval, and which is best installed not by brute force but by pre-drilling and then bailing to depths of about 1 – 4m below the water table. A suction tube is then inserted to almost full depth and connected to a surface pump. In relatively permeable, clean sands a properly designed and installed spear may produce groundwater in the range 1,000 – 3,000L/hour. A group of two or more spears, usually connected to a single pump, is called a spear bore array. Spear bores are relatively inexpensive, easy to install, and easily maintained. When any bore, including a spear, is pumped, the water table around the bore is lowered, creating a gradient and inducing further flow towards the bore. The drop in the water level in the bore, and in the aquifer around it, is called the drawdown, and the shape so formed in the water table is called the cone of depression (Figure 2). As pumping continues, the cone widens to encompass more aquifer. The horizontal distance from the bore to the cone’s outer edge is called the radius of influence, beyond which pumping has yet to have a noticeable effect on the original water table. Neighbouring bores interfere if each is located within the other’s radius of influence (Figure 3). Sea water intrusion Sea water intrusion is the physical movement of sea water into an aquifer, caused by a lowering of the water table so that its reduced elevation supports a decreased column of fresh water beneath (Figure 4). In unconfined aquifers, sea water intrusion is more likely close to the coast, and more likely under high or extended extraction rates. There are no known instances of sea water intrusion in Tasmanian unconfined coastal aquifers.
Figure 2. The formation of the cone of depression in an unconfined aquifer. The size and shape of the cone are determined by the aquifer properties of transmissivity, specific yield and porosity. Reproduced from Figure 16 of Cromer (2003).
Original water table
Ground surface
Base of aquifer
Bore with screened or slotted interval
Unsaturated sand
Saturated sand
Drawdown (s)
Aquifer thickness (b) Aquifer properties
T, K, S, θ
Yield (Q)
Cone of depression
Pumping water table
Radial distance (r)
Flow lines
Clarence City Council: Seven Mile Beach township
Review of 2009 flooding and drainage issues 9 April 2010
William C Cromer Pty Ltd 74A Channel Highway Taroona Tasmania 7053 Environmental, engineering and groundwater geologists Mobile 0408 122 127 email [email protected]
29 C C W
C C W
Figure 3. Overlapping cones of depression from neighbouring bores causes additional drawdowns in each. Reproduced from Figure 20 of Cromer (2003).
Original water table
Ground surface
Base of aquifer
Spear bore A
Pumping water table for both spears pumping together
Radius of influence of spear bore A
Spear bore B
Cone of depression
Radius of influence of spear bore B
Pumping water table for spear bore B pumping alone
Pumping water table for spear bore A pumping alone
Shoreline
Sea level
Water table Land surface
Tertiary-age clay
Sea water Fresh water
Greens Beach
Unconfined sandy aquifer
Confined aquifer
Spear bore #1
Spear bore #3
Spear bore #2
Figure 4. Sea water intrusion and its mitigation Spear bore #1 produces sufficient drawdown sufficiently close to the coast to induce sea water intrusion into the base of the aquifer. Spear bore #2 produces less drawdown than #1 and is sufficiently distant from the coast not to induce the effect. Spear bore #3 is ain injection bore which raises the water table and so prevents the effect.