39
Clark: University of Evansville Clark: University of Evansville Strategic Asset Strategic Asset Allocation Allocation The Case for Global The Case for Global Capital Markets Capital Markets
| Date post: | 26-Dec-2015 |
| Category: |
Documents |
| Upload: | elisabeth-jacobs |
| View: | 214 times |
| Download: | 1 times |

Clark: University of EvansvilleClark: University of Evansville
Strategic Asset Strategic Asset AllocationAllocation
The Case for Global The Case for Global
Capital MarketsCapital Markets

Clark: University of EvansvilleClark: University of Evansville
Contact InformationContact Information
Robert A. Clark, Ph.D., CFARobert A. Clark, Ph.D., CFASchroeder Family DeanSchroeder Family DeanSchool of Business AdministrationSchool of Business AdministrationVice President for Strategic Initiatives Vice President for Strategic Initiatives University of EvansvilleUniversity of Evansville1800 Lincoln Ave.1800 Lincoln Ave.Evansville, IN 47722Evansville, IN 47722Telephone: Telephone: (812) 479-2851(812) 479-2851E-mail:E-mail: [email protected] [email protected]

Clark: University of EvansvilleClark: University of Evansville
Tools to become Better Advisers Tools to become Better Advisers

Clark: University of EvansvilleClark: University of Evansville
Global Opportunities/ChallengesGlobal Opportunities/Challenges
Clark: University of EvansvilleClark: University of Evansville
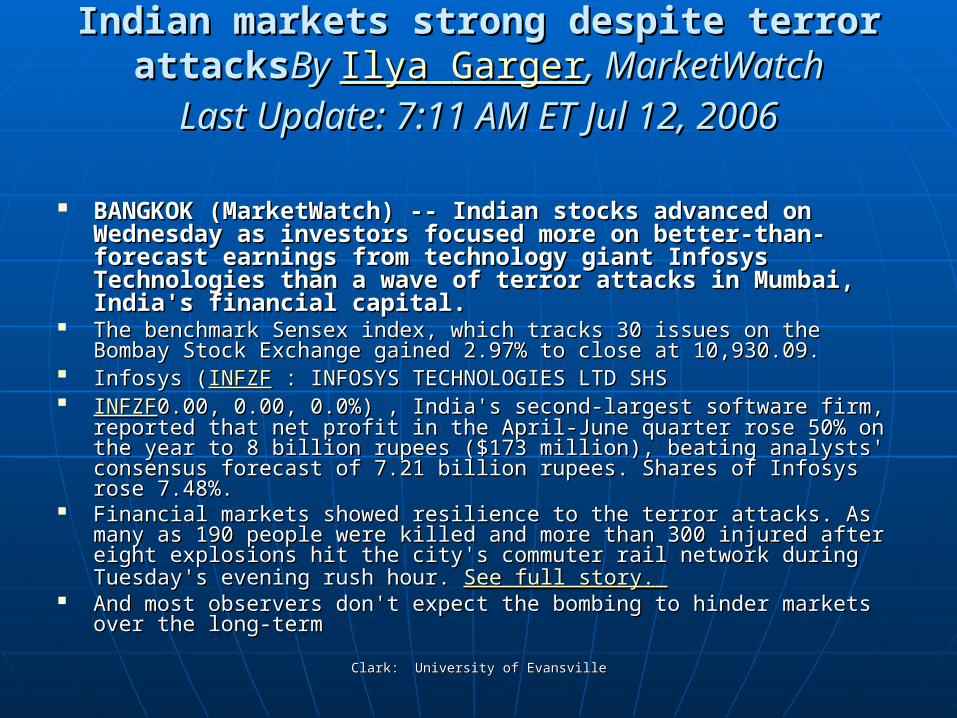
Indian markets strong despite terror attacksIndian markets strong despite terror attacksBy By IlyaIlya GargerGarger, MarketWatch, MarketWatch
Last Update: 7:11 AM ET Jul 12, 2006Last Update: 7:11 AM ET Jul 12, 2006
BANGKOK (MarketWatch) -- Indian stocks advanced on BANGKOK (MarketWatch) -- Indian stocks advanced on Wednesday as investors focused more on better-than-Wednesday as investors focused more on better-than-forecast earnings from technology giant Infosys forecast earnings from technology giant Infosys Technologies than a wave of terror attacks in Mumbai, Technologies than a wave of terror attacks in Mumbai, India's financial capital.India's financial capital.
The benchmark Sensex index, which tracks 30 issues on the Bombay Stock The benchmark Sensex index, which tracks 30 issues on the Bombay Stock Exchange gained 2.97% to close at 10,930.09. Exchange gained 2.97% to close at 10,930.09.
Infosys (Infosys (INFZFINFZF : INFOSYS TECHNOLOGIES LTD SHS : INFOSYS TECHNOLOGIES LTD SHS INFZFINFZF0.00, 0.00, 0.0%) , India's second-largest software firm, reported that 0.00, 0.00, 0.0%) , India's second-largest software firm, reported that
net profit in the April-June quarter rose 50% on the year to 8 billion rupees net profit in the April-June quarter rose 50% on the year to 8 billion rupees ($173 million), beating analysts' consensus forecast of 7.21 billion rupees. ($173 million), beating analysts' consensus forecast of 7.21 billion rupees. Shares of Infosys rose 7.48%. Shares of Infosys rose 7.48%.
Financial markets showed resilience to the terror attacks. As many as 190 Financial markets showed resilience to the terror attacks. As many as 190 people were killed and more than 300 injured after eight explosions hit the people were killed and more than 300 injured after eight explosions hit the city's commuter rail network during Tuesday's evening rush hour. city's commuter rail network during Tuesday's evening rush hour. See full story.See full story.
And most observers don't expect the bombing to hinder markets over the And most observers don't expect the bombing to hinder markets over the long-termlong-term

Clark: University of EvansvilleClark: University of Evansville
Major Challenge to 21st Investing: Understanding the Transformations in Global Business

Clark: University of EvansvilleClark: University of Evansville
Understanding the Challenge

Clark: University of EvansvilleClark: University of Evansville
World’s Financial AssetsWorld’s Financial Assets
$118 trillion* $118 trillion* (and growing)!(and growing)!
(including bank deposits, government debt (including bank deposits, government debt securities and corporate-debt securities, and equity securities and corporate-debt securities, and equity securities)securities)
(*Year end 2003…. Versus $53 trillion in 1993, and (*Year end 2003…. Versus $53 trillion in 1993, and $12 trillion in 1980)$12 trillion in 1980)
Clark: University of EvansvilleClark: University of Evansville
Financial AssetsFinancial Assets
Shift away from banks and Shift away from banks and toward market institutions as toward market institutions as the primary financial the primary financial intermediaries.intermediaries.
1980 banks represented 45 1980 banks represented 45 percent of financial assets, by percent of financial assets, by 2003 they represented only 30 2003 they represented only 30 percent. percent.

Clark: University of EvansvilleClark: University of Evansville
World MarketsWorld Markets
US:US: $44 trillion – dominated $44 trillion – dominated by private debt and by private debt and equity.equity.
Europe: Europe: Banks play a larger role Banks play a larger role in finance.in finance.
Asia: Asia: Financial markets are Financial markets are relatively isolated from relatively isolated from one another and differ one another and differ within the region. within the region.

Clark: University of EvansvilleClark: University of Evansville
Financial Market TrendsFinancial Market Trends
Corporate debt is expanding in both Corporate debt is expanding in both the United States and Europe.the United States and Europe.
Japan growth comes from a huge Japan growth comes from a huge expansion of public debt.expansion of public debt.
China and Eastern Europe all asset China and Eastern Europe all asset classes are growing quickly. classes are growing quickly.

Clark: University of EvansvilleClark: University of Evansville
Educational GainsEducational Gains
19901990 2003*2003*Ghana Ghana Adult LitAdult Lit 58.558.5 73.873.8Ethiopia Ethiopia PrimaryPrimary 31.831.8 66.066.0Thailand Thailand SecondarySecondary 30.830.8 81.481.4ChileChile TertiaryTertiary 21.321.3 42.442.4Kuwait Kuwait PrimaryPrimary 60.260.2 93.693.6
SecondarySecondary 42.942.9 89.389.3TertiaryTertiary 12.112.1 20.920.9
*World Bank (Ed Stats)*World Bank (Ed Stats)

Clark: University of EvansvilleClark: University of Evansville
Developing Nations Now ConstituteDeveloping Nations Now Constitute
40% of the World’s 50 largest 40% of the World’s 50 largest EconomiesEconomies
50% of the 50 Fastest Growing 50% of the 50 Fastest Growing EconomiesEconomies
70% of the 20 Fast Growing in 70% of the 20 Fast Growing in Industrial OutputIndustrial Output
5.5% Annual Growth in Higher 5.5% Annual Growth in Higher Education Grads vs. 1%Education Grads vs. 1%
20% of the 50 Largest R&D Investors20% of the 50 Largest R&D Investors

Clark: University of EvansvilleClark: University of Evansville
International DiversificationInternational Diversification
The goal of international The goal of international diversification is to benefit from the diversification is to benefit from the less-than-perfect correlation among less-than-perfect correlation among various stock markets by forming a various stock markets by forming a portfolio among various stock portfolio among various stock markets by forming a portfolio that markets by forming a portfolio that has lower risk than an otherwise has lower risk than an otherwise well-diversified portfolio of domestic well-diversified portfolio of domestic stocks. stocks.

Clark: University of EvansvilleClark: University of Evansville
Foreign Stock FundsForeign Stock Funds
Note:Note: The average diversified The average diversified international fund holds more than international fund holds more than 10% of its assets in emerging 10% of its assets in emerging markets names at the end of 2001, a markets names at the end of 2001, a bit less in 2002, and a bit more over bit less in 2002, and a bit more over the next four years. the next four years.
Clark: University of EvansvilleClark: University of Evansville
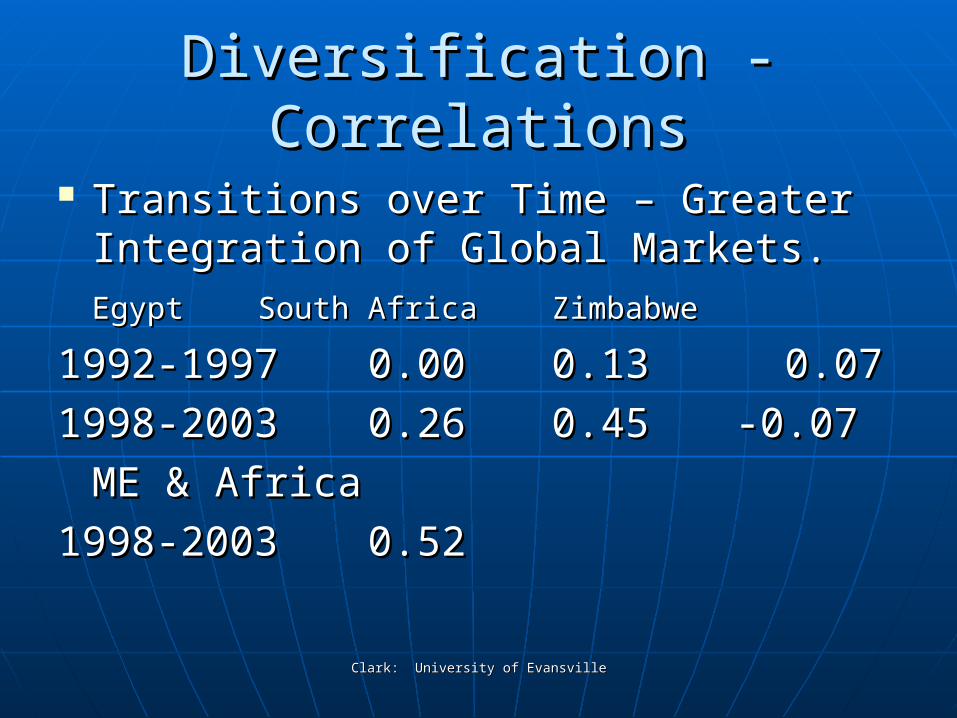
Diversification - CorrelationsDiversification - Correlations
Transitions over Time – Greater Transitions over Time – Greater Integration of Global Markets.Integration of Global Markets.
EgyptEgypt South AfricaSouth AfricaZimbabweZimbabwe
1992-19971992-1997 0.000.000.130.13 0.07 0.07
1998-20031998-2003 0.260.260.450.45-0.07-0.07
ME & AfricaME & Africa
1998-20031998-2003 0.520.52

Clark: University of EvansvilleClark: University of Evansville
A Global ViewA Global View
Clark: University of EvansvilleClark: University of Evansville
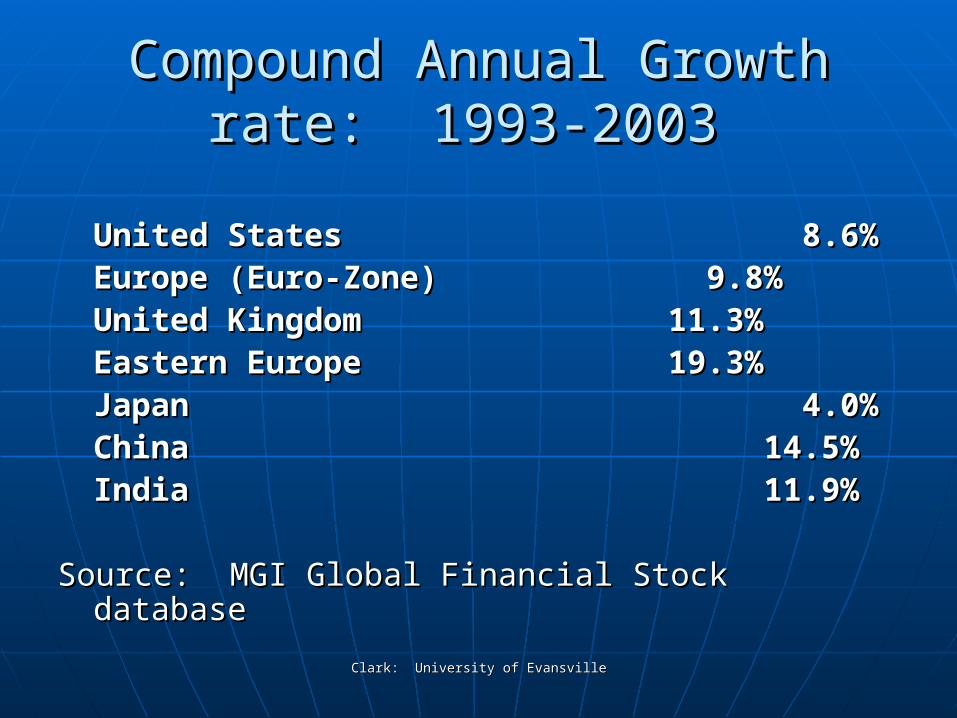
Compound Annual Growth rate: Compound Annual Growth rate: 1993-2003 1993-2003
United StatesUnited States 8.6% 8.6%Europe (Euro-Zone)Europe (Euro-Zone) 9.8% 9.8%United KingdomUnited Kingdom 11.3%11.3%Eastern EuropeEastern Europe 19.3%19.3%JapanJapan 4.0% 4.0%ChinaChina 14.5%14.5%IndiaIndia 11.9%11.9%
Source: MGI Global Financial Stock databaseSource: MGI Global Financial Stock database

Clark: University of EvansvilleClark: University of Evansville
PerformancePerformance
1975-1995: 1975-1995: $1.00 invested$1.00 invested
Africa:Africa: $ $ 0.840.84
S&P 500S&P 500 $13.14$13.14 Composite emerging markets $10.01Composite emerging markets $10.01

Clark: University of EvansvilleClark: University of Evansville
2004 Emerging Market Winners2004 Emerging Market Winners
1.1. UkraineUkraine 170.33%170.33%2.2. Slovak RepublicSlovak Republic 126.91126.913.3. ColumbiaColumbia 126.20126.204.4. JamaicaJamaica 115.21115.215.5. EgyptEgypt 114.00114.006.6. BangladeshBangladesh 107.61107.617.7. RomaniaRomania 100.08100.088.8. HungaryHungary 96.01 96.019.9. EstoniaEstonia 91.52 91.5210.10. Saudi ArabiaSaudi Arabia 90.04 90.04

Clark: University of EvansvilleClark: University of Evansville
2005 Emerging Market Winners2005 Emerging Market Winners
1.1. EgyptEgypt 160.60%160.60%2.2. JordanJordan 120.00120.003.3. Saudi ArabiaSaudi Arabia 115.10115.104.4. ColumbiaColumbia 113.50113.505.5. LebanonLebanon 111.78111.786.6. RussiaRussia 85.70 85.707.7. PakistanPakistan 66.00 66.00 8.8. KenyaKenya 65.38 65.389.9. KoreaKorea 62.60 62.6010.10. RomaniaRomania 61.09 61.09
Clark: University of EvansvilleClark: University of Evansville
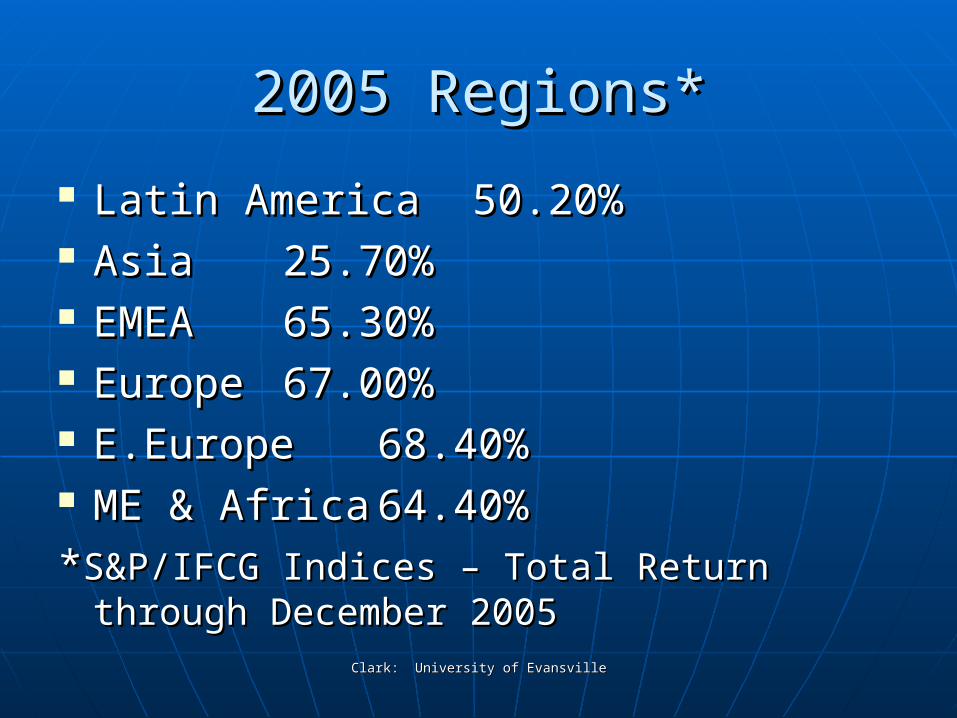
2005 Regions*2005 Regions*
Latin AmericaLatin America 50.20%50.20% AsiaAsia 25.70%25.70% EMEAEMEA 65.30%65.30% EuropeEurope 67.00%67.00% E.EuropeE.Europe 68.40%68.40% ME & AfricaME & Africa 64.40%64.40%
**S&P/IFCG Indices – Total Return through S&P/IFCG Indices – Total Return through December 2005December 2005

Clark: University of EvansvilleClark: University of Evansville
Understanding the MAZE!Understanding the MAZE!

Clark: University of EvansvilleClark: University of Evansville
Country Risk AnalysisCountry Risk Analysis
Even though sectors may be more Even though sectors may be more important than they were 10 years important than they were 10 years ago, countries have not evaporated ago, countries have not evaporated as a significant explanatory element as a significant explanatory element of multi-country portfolio returns.of multi-country portfolio returns.
Clark: University of EvansvilleClark: University of Evansville
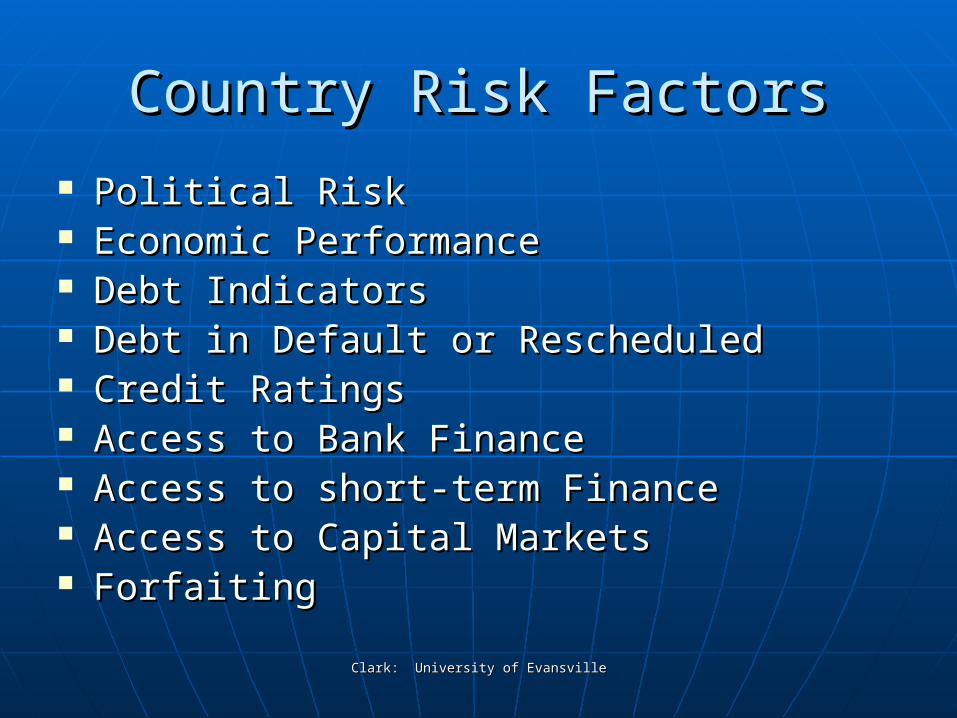
Country Risk FactorsCountry Risk Factors
Political RiskPolitical Risk Economic PerformanceEconomic Performance Debt IndicatorsDebt Indicators Debt in Default or RescheduledDebt in Default or Rescheduled Credit RatingsCredit Ratings Access to Bank FinanceAccess to Bank Finance Access to short-term FinanceAccess to short-term Finance Access to Capital MarketsAccess to Capital Markets ForfaitingForfaiting

Clark: University of EvansvilleClark: University of Evansville
Country vs. Sector AnalysisCountry vs. Sector Analysis
Current research indicates Current research indicates that sector analysis that sector analysis dominates country dominates country analysis in selecting analysis in selecting investment options.investment options.

Clark: University of EvansvilleClark: University of Evansville
Allocation IssuesAllocation Issues
DECOMPOSITION of returns in terms DECOMPOSITION of returns in terms of factor decomposition indicates of factor decomposition indicates that the country factor has declined that the country factor has declined in importance and the sector factor in importance and the sector factor has increased in importance. has increased in importance.
Countries used to be the Countries used to be the predominant explainer of returns, predominant explainer of returns, and sectors were relatively less and sectors were relatively less important.important.

Clark: University of EvansvilleClark: University of Evansville
International Accounting StandardsInternational Accounting Standards
Accepting a valuation Accepting a valuation orientation to investment orientation to investment selection as investors search selection as investors search for emerging market for emerging market opportunities the “quality” of opportunities the “quality” of accounting information is accounting information is critical.critical.

Clark: University of EvansvilleClark: University of Evansville
Emerging-Markets Funds Emerging-Markets Funds
Overall, they’ve posted a 24% Overall, they’ve posted a 24% annualized gain over the 2002-2004 annualized gain over the 2002-2004 period, which is better than all other period, which is better than all other types of mutual funds. types of mutual funds.
Note: They plunged 46% between Note: They plunged 46% between October 1, 1997 and September 30, October 1, 1997 and September 30, 1998, due to local currency and other 1998, due to local currency and other problems. problems.
Clark: University of EvansvilleClark: University of Evansville
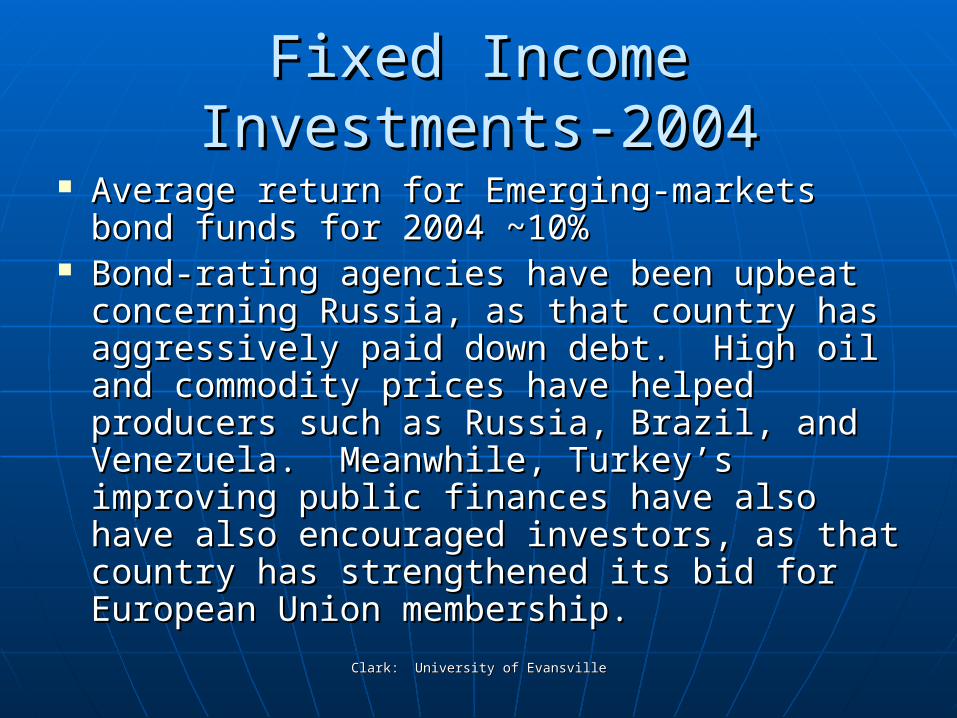
Fixed Income Investments-2004Fixed Income Investments-2004
Average return for Emerging-markets bond Average return for Emerging-markets bond funds for 2004 ~10%funds for 2004 ~10%
Bond-rating agencies have been upbeat Bond-rating agencies have been upbeat concerning Russia, as that country has concerning Russia, as that country has aggressively paid down debt. High oil and aggressively paid down debt. High oil and commodity prices have helped producers commodity prices have helped producers such as Russia, Brazil, and Venezuela. such as Russia, Brazil, and Venezuela. Meanwhile, Turkey’s improving public Meanwhile, Turkey’s improving public finances have also have also encouraged finances have also have also encouraged investors, as that country has strengthened investors, as that country has strengthened its bid for European Union membership. its bid for European Union membership.

Clark: University of EvansvilleClark: University of Evansville
Fixed Income - 2005Fixed Income - 2005
According to Morningstar Inc., returns on According to Morningstar Inc., returns on bonds that invest largely outside of the bonds that invest largely outside of the U.S. ranked as the second worst U.S. ranked as the second worst investments in 2005 with a -3.2% return.investments in 2005 with a -3.2% return.
Emerging market bond funds hit Emerging market bond funds hit record highs in 2005 returning record highs in 2005 returning 12% on average.12% on average.
The dollar rose almost 14.6% against the The dollar rose almost 14.6% against the euro and 15.2% against the yen in 2005. euro and 15.2% against the yen in 2005.

Clark: University of EvansvilleClark: University of Evansville
Fixed Income InvestmentsFixed Income Investments
Sixth consecutive year of double-Sixth consecutive year of double-digit returns. digit returns.
Since the start of the emerging-Since the start of the emerging-markets bond rally in 1999, this markets bond rally in 1999, this category’s average annual return category’s average annual return of 15% Tops those of virtually all of 15% Tops those of virtually all fixed income and equity fixed income and equity categories. categories.

Clark: University of EvansvilleClark: University of Evansville
Emerging Markets Bond Average*Emerging Markets Bond Average*
2004 YTD (%)2004 YTD (%) 10.6510.65
3-Year Return (%)3-Year Return (%) 17.5117.51
5-Year Return (%)5-Year Return (%) 15.2215.22
Expense Ratio (%)Expense Ratio (%) 1.00 1.00
*Source: Morningstar *Source: Morningstar (accessed 2/18/2005)(accessed 2/18/2005)

Clark: University of EvansvilleClark: University of Evansville
Global DiversificationGlobal Diversification
If investors are concerned If investors are concerned about the classic definition of about the classic definition of risk-the volatility of a portfolio risk-the volatility of a portfolio – they can reduce risk by – they can reduce risk by holding more bonds, not by holding more bonds, not by changing the composition of changing the composition of their equity allocations.their equity allocations.
Clark: University of EvansvilleClark: University of Evansville
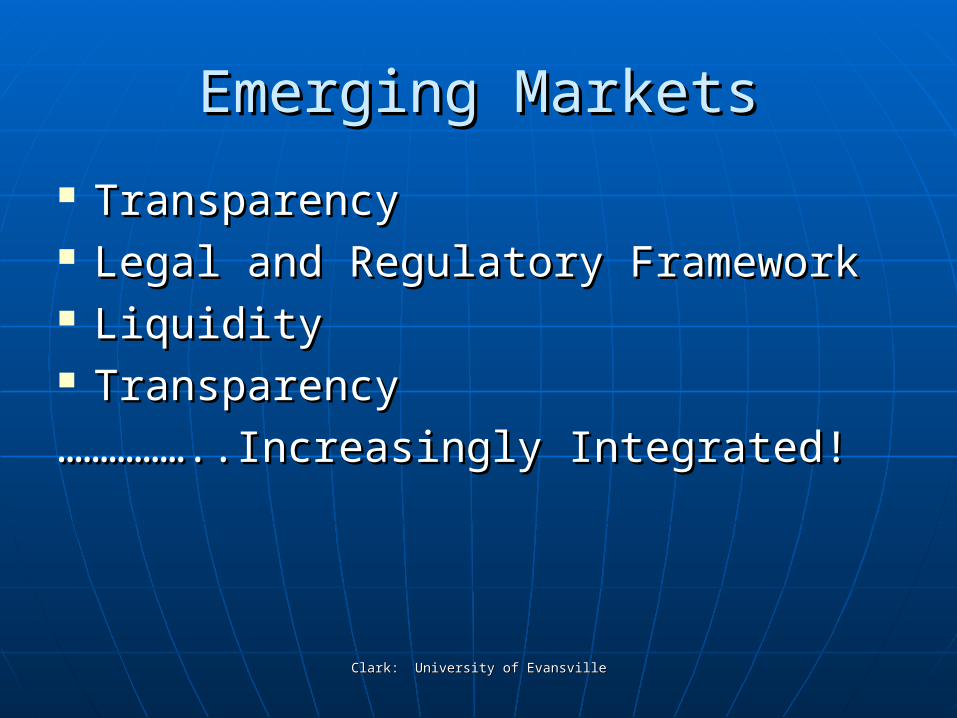
Emerging MarketsEmerging Markets
TransparencyTransparency Legal and Regulatory FrameworkLegal and Regulatory Framework LiquidityLiquidity TransparencyTransparency
…………………………..Increasingly Integrated!..Increasingly Integrated!

Clark: University of EvansvilleClark: University of Evansville
Questions?Questions?

Clark: University of EvansvilleClark: University of Evansville
Conclusion…..Conclusion…..

Clark: University of EvansvilleClark: University of Evansville
Whatever their Objective….Whatever their Objective….

Clark: University of EvansvilleClark: University of Evansville
Investment Strategic Review


