Page 1
Class Discrimination? Evidence From a Racially Homogeneous Labour Market
By NEKEISHA SPENCER, MIKHAIL-ANN URQUHART AND PATRICE WHITELY
By exploiting country demographics, we validate concerns, in audit
studies of racial discrimination, that names assigned to identify race may
also proxy for socioeconomic status. We find evidence of class
discrimination from a predominantly black country, Jamaica. Applicants
with high income sounding names are at least twice as likely to receive a
call back from employers – variations are dependent on applicant
qualifications. We also find some evidence that employers prefer
applicants from high income neighbourhoods. Under the assumption of no
outright racial discrimination, we isolate the effects of discrimination and
find that class discrimination is as important as race.
* Spencer: Department of Economics, Universiity of the West Indies, Mona, Kingston 7, Jamaica (e-mail:
[email protected] ); Urquhart: Department of Economics, Binghampton University, 4400 Vestal Parkway East,
Binghampton, NY, 13902 (email: [email protected] ); Whitely: Department of Economics, University of the
West Indies, Mona, Kingston 7, Jamaica (email: [email protected] ). Karsten Muller, Eric Strobl.
I. Research shows that discrimination in various forms permeates labour market
economies across the world (Petit, 2007; Thorat, 2008; Drydakis, 2009; Kuhn and
Kailing, 2013). Many labour market discrimination studies tend to focus on race
and ethnicity as the factors engendering unfair treatment in the employment
process (Jowell and Prescott-Clarke, 1970; Bertrand and Mullainathan, 2004;
Oreopoulos, 2011; McGinnity et al., 2009; Kaas and Manger, 2012; Nunley et al.,
2014; also see the survey by Bertrand and Duflo, 2016). Focusing on blacks
versus whites, Bertrand and Mullainathan (2004) and Nunley et al. (2014) for
Page 2
example, present evidence of racial discrimination, where blacks received fewer
call backs than whites.
At the forefront of these and other studies lies the issue of discrimination by race.
However, Fryer and Levitt (2004) emphasize a strong association between low
socioeconomic status and black names. It therefore remains a possibility that
individuals with black sounding names are also associated with a lower social
class. While Bertrand and Mullainathan (2004) try to test for this potentially
severe confounding effect in a small sub-sample, labour market correspondence
studies have thus far been unsuccessful in addressing it directly. This raises the
question of whether Bertrand and Mullainathan (2004) and those building on their
work (including Oreopoulos, 2011; Kaas and Manger, 2012; Nunley et al., 2014)
actually measure racial discrimination or discrimination by class.
We propose a solution to this question by studying the labour market of Jamaica,
a relatively racially homogenous country, to disentangle discrimination by race
and class.
Jamaica is arguably a good case study since it is a predominantly black country
(91% based on 2001 Jamaican population census; Minnesota Population Center,
20151
), where labour market outcomes are not driven by outright racial
discrimination. However, there exists a layer of discrimination that features cases
of unequal treatment based on gender (Roberts, 2010; Hotchkiss and Moore,
1996) and – to a lesser extent - complexion (Jamaica Gleaner, 2011). Although
the history of Jamaica’s labour market discrimination is rooted in its colonial
experience with race, class distinctions have developed based on income,
education, social identities, and behaviours (Altink, 2015; Austin-Broos, 1994;
1 The data Jamaican census data is conducted by the Statistical Institute of Jamaica.
Page 3
and Broom 1954). This is idea a familiar anecdote narrative among some who
have seen themselves as being discriminated against are residents of poor inner
city communities (Jamaica Gleaner, 2010). The latter has been at the forefront of
the public discourse where people question whether employers treat job applicants
differently based on their home address.
This sentiment of job applicants being treated unequally on the basis of their
home address is even captured in a popular 2007 song, Wrong Address, by
Jamaican recording artiste Etana. She paints a picture of the issues that someone
living in a volatile location2
would have to deal with when looking for
employment. The lyrics3 of this song still rest on the minds of many who
successfully finish their schooling but have the “wrong address” on their job
applications. This perception of discrimination in the Jamaican labour market
serves as an appropriate driver to explore whether any unfair treatment exists in
the initial stage of the employment process and if any such treatment is related to
social class.
Aligned with the work of Bertrand and Mullainathan (2004), which studies the
employability of white versus African-American names, we conduct a field
experiment where we send out resumes to clerical, administrative, customer
service and sales jobs that are advertised in local newspapers and on local
websites. To capture social class, we use address and name as indicators of
2 These are areas that are generally characterised by unstable social behaviour.
3 ‘Tried to get a job today but…when [they] see the application [they] say…. if this is really where you reside…please step
outside…been through school, passed every test…graduated above the rest….and yet the society still looks down…. they
do this, why? We don’t want no trouble, no day…cause lady where you come from….people die there every day’ – http://www.allmusic.com/song/wrong-address-mt0031377565/lyrics.
Page 4
socioeconomic status. Using address as a proxy for class mirrors the sentiments
expressed in the local media by job applicants. As a result, we separate high
income addresses from low income addresses by linking the former with more
affluent communities and the latter with those from the inner city using secondary
data on well-known areas (Jamaica Gleaner, 2009). In the case of name, we use
the applicants’ first names as a class identifying factor since some types of names,
unique or distinctive, are more likely to be associated with low income
backgrounds, less likely to obtain professional jobs, and are perceived to be less
successful, moral and cheerful (Willis et al, 1982; Levine and Willis, 1994).
Further, we are able to define names as high income sounding or low income
sounding based on primary data collection through a ‘name’ survey while
utilizing neutral last names, only using those not commonly associated with any
particular social class. Thus, the resumes are adjusted to fit fictitious name and
address profiles that are tied to the different social classes, an issue also studied in
India by Thorat and Attewell (2007).
To add further dimensions to our study, we create both high quality and low
quality resumes to see how the quality of resumes affects call back rates.
Typically, a high quality resume has more years of experience, greater academic
achievements and features leadership roles in extracurricular activities. Thus, a
high quality applicant is well-rounded in comparison to an applicant with a low
quality resume. We also explore call back rates based on gender. We email four
high quality and four low quality resumes for each job advertisement over a six
month period keeping phone lines open until three months after we send out the
last set of applications. In total, we send out 1080 resumes in response to 135 job
advertisements.
Looking at the call back rates based on an applicant’s characteristics, we find that
job applicants with low income sounding names have to send out more than twice
Page 5
as many resumes as those with high income sounding names to receive a response
from the employer. Although we receive more call backs for applicants from high
income addresses than those from low income addresses, this gap is not
statistically significant. As a result, we cannot conclude that there is address
discrimination in terms of the resumes sent out. However, using the call back
rates based on employers’ preferences, we find the evidence of address
discrimination. Thus, in terms of location, a greater percentage of employers
prefer applicants from more affluent communities than those who are from the
inner city. Therefore, we find little evidence of discrimination based on an
applicant’s home address. Our results indicate that name is used by employers to
determine who receives a call back, which suggests class discrimination on the
basis of name. One possible explanation for the lack of strong evidence for class
discrimination based on address is offered by Bertrand and Duflo (2016) who
suggest that employers may only be associating names with social classes. Once
employers see particular names, they quickly decide the social class of the
applicant without looking at the address. In essence, it appears that employers are
using name as the instrument for social class with little reliance on address. Thus,
social class, as evident by name, drives the gap between who receives a call back
and who does not.
The minority groups in previous correspondence studies are often less educated,
less qualified and of low income levels, and thus could possibly be perceived as
being within the lower class. Our results suggest that these studies are to a
significant extent picking up a confounding relationship between race and class,
where the latter is driving the former. By inherently holding race constant, we
show that class itself may be the driving force behind the results in earlier work.
This is not to say that racial discrimination does not matter: in fact, the effects of
Page 6
discrimination may well be larger than previously thought, if people are
discriminated against based on both race and class.
In our setting, we also find that males have to send out twice as many resumes
compared to females to receive a response. While this finding may be attributed to
resumes only being sent in response to advertisements for office related support
positions, it highlights the relevance of a name in obtaining employment. More
surprisingly, high quality applicants receive fewer call backs than applicants with
low quality resumes although there is no significant difference in call back rates.
However, a striking result is that although resume quality is important in job
searches, employers appear to use high income sounding names before examining
the quality of resumes. Thus, the chance of receiving a call back is significantly
greater for a high income sounding name, especially in the case of low quality
resumes. This result stands in contrast to Bertrand and Mullainathan (2004) where
white sounding names, which perhaps one can infer to be of high income status,
coupled with high quality resumes have the highest chances of receiving a call
back.
These contrasting results also highlight important differences between labour
markets in large developed racially diverse countries and smaller developing
racially homogeneous countries. The preference for low quality resumes with
high income sounding names suggest two possible interpretations from the
employers’ side. First, employers prefer applicants with less qualifications
(Holzer and Neumark, 1996), perhaps to avoid paying higher salaries. Second,
employers care more about maintaining a social image (Jackson, 2009), thereby
choosing high income sounding name applicants with low quality resumes who
they deem as suitable for employment in their companies.
Page 7
Our study contributes to the literature in several ways. First, it serves as a
response to the Bertrand and Mullainathan (2004) and similar studies that have
been unable to disentangle whether names are associated with socioeconomic
status discrimination or race discrimination. We address this issue by conducting
a similar experiment in a predominantly black country. Second, we provide novel
evidence that social class independent of race has a significant impact on labour
market outcomes. Third, we keep the last names on the resumes constant by
choosing neutral names, ones that cannot be easily identified with any specific
social class. This approach can be applied to study other aspects of discrimination
while keeping one dimension constant; for example, by studying discrimination
along class in a predominantly Muslim country to isolate religion as a
confounding variable. Fourth, although we find little evidence for address being a
social class indicator used by employers, it could be an important result for
developing countries around the world facing rapid urbanization. Cohen (2006)
points out that population growth is likely to be seen in urban areas throughout the
developing world with cities being unable to adequately cater to the needs of
residents. One such need is adequate housing which is a growing problem due to
rural-urban migration, which often results in high rents and in cases where cities
expand, it can become difficult to distinguish geographical borders (Aluko, 2010).
Thus, high rents can influence individuals who relocate to urban areas to choose
reasonably priced housing in the inner city or in close proximity, which may be
difficult to distinguish from areas that are not geographically identified as part of
inner city communities. This choice can result in them facing possible social class
discrimination because of their address (Leonard, 1987).
The remainder of the paper is organized as follows. Section 2 describes the
methodology and model used to investigate employment discrimination. Section 3
discusses the results and Section 4 concludes.
Page 8
II. We conduct a resume audit study among employers in Kingston, Jamaica, with
special emphasis on possible discrimination based on gender and class. Gordon
(1949) defines social class as the horizontal stratification of a population. It is
used to highlight differences in terms of wealth, income, occupation, status, level
of consumption and family background. As previously mentioned, the methods
employed by this resume audit study are similar to those used in Bertrand and
Mullainathan (2004). However, we use existing first names as indicators of an
applicant’s class and gender, rather than race. We also indicate class by using the
address of the fictitious applicant. Finally, binary dependent variable regression
models are used to compare the call back rates based on gender, name and
address.
A. We create a pool of 40 resume and cover letter templates. To narrow the type of
resumes and to ensure quality, we create resumes for four types of positions:
administrative, clerical, customer service, and sales, where the sales category is
further categorized into “highbrow” and “lowbrow” positions based on the
academic requirement as advertised. The “highbrow”4 sales positions advertise a
tertiary degree as being required, while the “lowbrow” sales positions did not
require a tertiary degree. In total, there are five categories of resumes and
templates. Beyond standardization, limiting the applications to these categories
serves two purposes. Firstly, it allows for the comparison of jobs available to
applicants with at least a secondary education and no advanced degrees or
certification. This education level represents most of the educated members of the
labour force in the Kingston Metropolitan Area (KMA) – 60% based on 2001
4 Executive sales positions were not considered.
Page 9
Jamaican population census (Minnesota Population Center, 2015). Secondly, we
are able to obtain a larger pool of comparable job applications because these types
of positions are commonly available.
For each job category, we create eight resumes and accompanying cover letter
templates. Four of the templates are classified as high quality and the other 4 as
low quality. Despite the variation in the quality of the resumes, all resumes are
designed to meet the minimum requirements for the specified job position.
Therefore, even the low quality resumes represent the qualifications of a suitable
applicant. The resumes are standardized by the level of composition, years of
professional experience, educational attainment, and voluntary/extracurricular
activities.
The low quality resumes for the administrative, clerical, customer service, and
“lowbrow” sales positions are designed for an applicant who has three to five
years of general professional experience, has no more than five examination
passes and/or certifications at the secondary or post-secondary level (but without
any scholastic distinctions or education at the bachelors level or higher), and
holds no leadership roles in extracurricular or service activities. In the case of the
“highbrow” sales positions, the educational qualifications for low quality resumes
would include an undergraduate degree in a business related field. The associated
cover letters for the low quality group of resumes use grammatically correct but
plain language, focus on diligence as a key skill, speak to why the applicant wants
to work for the company, and simply state previous job experience.
The high quality resumes for the administrative, clerical, customer service, and
“lowbrow” sales positions indicate that the applicant has more than five years of
professional or relevant experience, has at least eight secondary/post-secondary
level certifications or has an undergraduate tertiary degree, and holds a leadership
Page 10
role in service/extracurricular activities. All the high quality education profiles
(including those for “highbrow” sales positions) show scholastic distinctions in
the form of first class honours undergraduate degrees and post-secondary exam
passes with distinctions. The high quality cover letters for these categories use
more sophisticated language than the low quality resumes, focus on both soft and
hard skills gained from previous experiences, explain why the applicant is suitable
for the company, and indicate how the position fits into the applicant’s long term
goals.
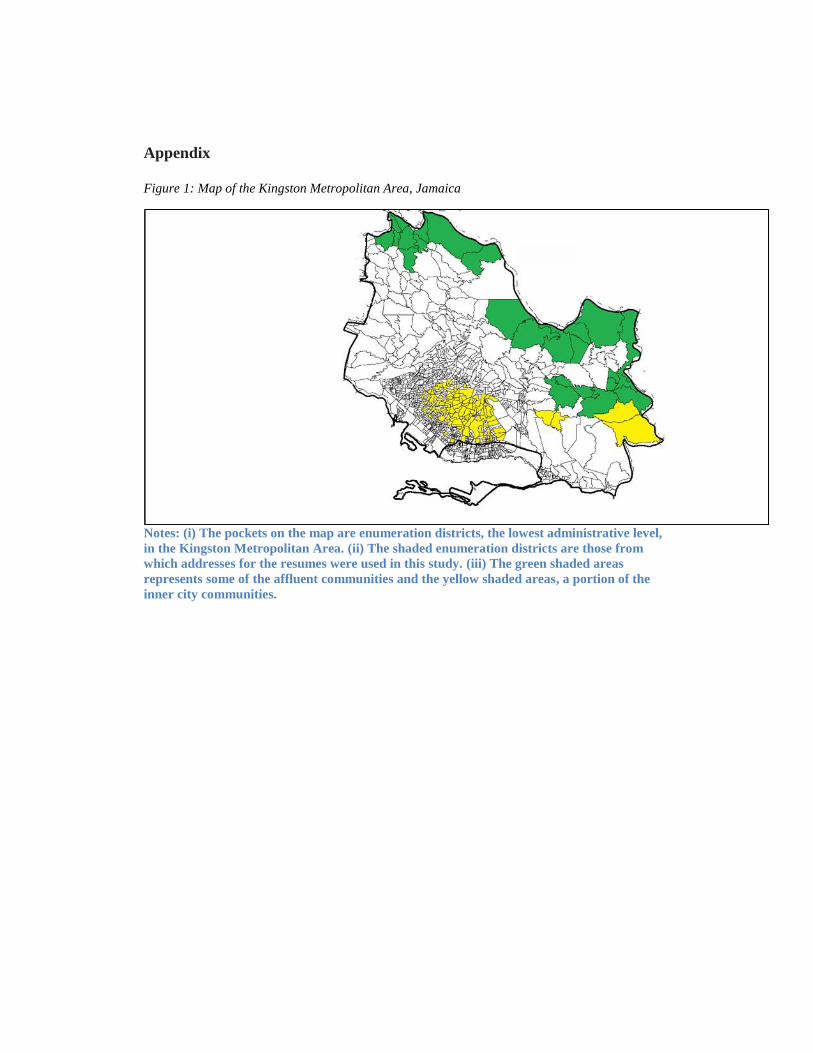
B. The perception of socioeconomic status in Kingston is tied to an individual’s area
of residence. This is commonly observed in the casual use of the terms “uptown”
and “downtown.” The term “uptown” describes the northern, more affluent areas
in Kingston as used in reference to the upper class, while “downtown” is the
location of many inner city communities as used in reference to the lower class.
Figure 1 in the appendix depicts the location of the two income areas used in this
study.
To determine whether the perception of class is an important factor in obtaining a
job in Kingston, we create four categories of applicant profiles by varying the
type of first names and the types of addresses of the potential applicants. The
various profiles are based on a combination of names that are lower or upper class
sounding and addresses from inner city or affluent areas. The four profile
categories are as follows:
i) Upper class sounding name with an affluent address,
ii) Lower class sounding name with an inner city address,
iii) Upper class sounding name with an inner city address,
iv) And lower class sounding names with an affluent address.
Page 11
“Uptown” street addresses are selected from 11 affluent communities in the parish
of St. Andrew: Waterworks, Cherry Gardens, Beverley Hills, Jacks Hill, Mona,
Barbican, Millsborough, Paddington Terrace, Long Mountain, Stony Hill and
Manor Park. These communities are described as “some of St Andrew's most-
desired addresses” and “among some of the preferred addresses of the who's who”
(Jamaica Gleaner, 2009). We collect 80 street names for high income area
addresses for the bank of addresses that we use to build applicant profiles. The
street addresses are chosen from the low income communities of Tivoli, Trench
Town, August Town, Denham Town, and Mountain View. A total of 52 street
names are compiled from these low income communities.5
First names are selected from the Electoral Office of Jamaica voters list for
Kingston and St. Andrew. The voters list contains the names of 92.6% of the
voting age population. A comparison of names from high income versus low
income areas reveals that names that do not appear frequently tend to be
associated with the low income areas. We initially create a pool of 240 names
from the voters list which includes 60 female-sounding and 60 male-sounding
from high income areas, and 60 female sounding and 60 male-sounding names
from low income areas.
One of the weaknesses of a resume audit study is that it is difficult to deliver
visual cues that suggest characteristics of an individual (Pager, 2007). To
circumvent this limitation, we conduct a perception survey to determine the
perceived sex and class of individuals associated with the selected names. To this
end, we randomly survey each of the 240 names 50 times, using members of the
5 The complete list of street names is provided as a supplement to this paper.
Page 12
Jamaican public. The survey was conducted in public areas throughout the KMA
from July to August 2013. To establish gender, survey participants were asked to
identify whether they thought the name belonged to a male or female. To establish
class, participants were asked to identify whether they thought the name belonged
to someone who lived “uptown” or “downtown.” Names having more than a 70%
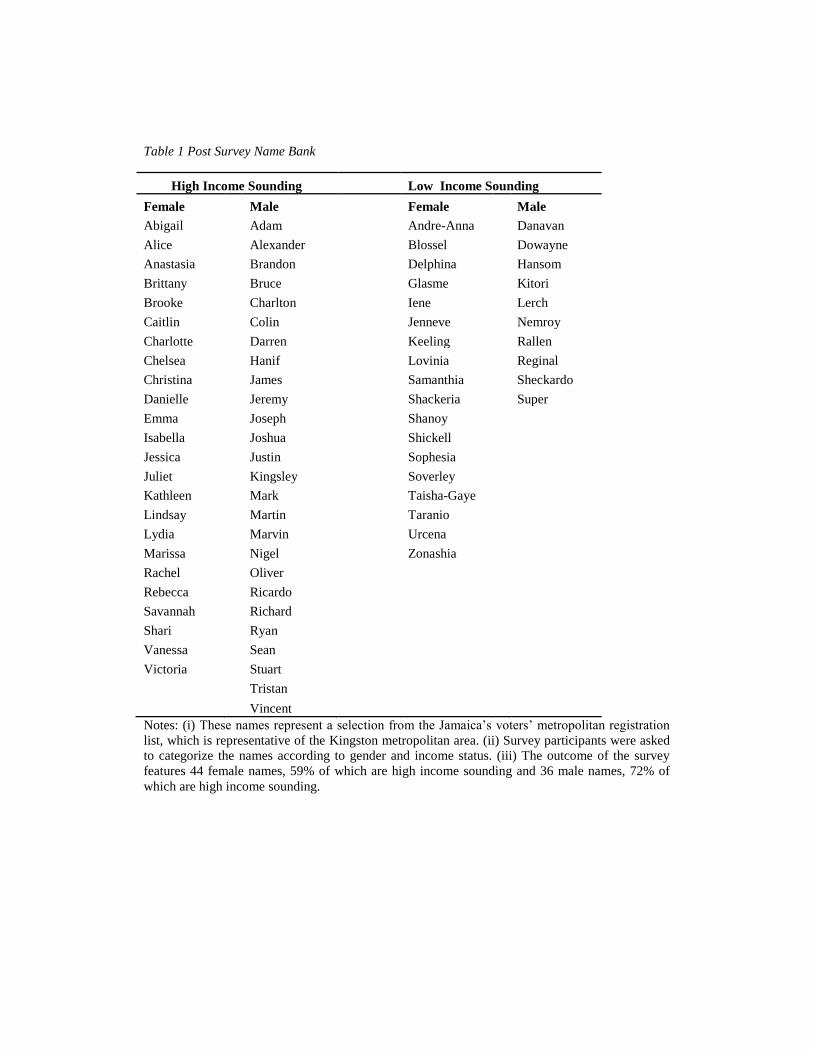
(>35) respondent agreement on class and gender remain in the name bank. The
final name bank contains 24 female upper class sounding names, 26 male upper
class sounding names, 18 female lower class sounding names, and 10 male lower
class sounding names. The complete name bank is shown in Table 1.
We chose common Jamaican last names such as Brown, Black, Grant, Samuels,
Thomas and Walker to complete the fictitious resume identities, which are not
associated with any particular social class.
C. Job vacancies are found using online job sites and newspapers. Applications are
only sent in response to administrative, clerical, customer service, and sales
positions where employers accepted applications by email. Eight customized
applications are sent in response to each vacancy, where four applications are
high quality and four are low quality. Customization of applications for each
advertisement involves: 1) ensuring that the resumes and cover letters meet the
minimum requirements for the job, 2) including contact information and 3) adding
specific name and address profiles.
We adjust all resumes and cover letters to ensure the applicants meet the
minimum skills and qualifications for the job. For example, if the job requires the
respondent be able to drive or speak a second language, then we update the
resume and cover letter templates to reflect these skills. Thus, all of the eight
Page 13
applications are designed to represent candidates that would be suited for the
relevant position.
For each vacancy, the four applicant profiles based on names and addresses
identified in the previous section are applied to each of the high and low quality
applications. Therefore, the eight applications for each job represent individuals
with the following perceived class and qualifications:
i) Upper class sounding name with an affluent address and high quality
resume,
ii) Lower class sounding name with an inner city address and high quality
resume,
iii) Upper class sounding name with an inner city address and high quality
resume,
iv) And lower class sounding names with an affluent address and high quality
resume,
v) Upper class sounding name with an affluent address and low quality
resume,
vi) Lower class sounding name with an inner city address and low quality
resume,
vii) Upper class sounding name with an inner city address and low quality
resume,
viii) And lower class sounding names with an affluent address and low
quality resume.
A specific phone number and email address combination is assigned to each of
the eight aforementioned applicant types so that the contact information remains
consistent for each batch of resumes sent in response to each vacancy. For each
application, the gender of the applicant is randomly chosen. Then an appropriate
Page 14
name and street address is randomly chosen from the name and street banks to
match the applicant profile.
The process of sending out applications began in May 2014 and continued until
November 2014. During this period, we answer 135 job advertisements and send
out 1080 applications. Seventy percent (70.1%; n=94) of the vacancies are for
sales positions, 17.2% (n=23) for customer service positions, 7.5% (n=10) for
administrative positions, and 5.2% (n=8) for clerical positions. We monitor call
backs daily by checking for voicemail messages and email replies. We actively
collect call back information until February 2015. At the end of this time period
we receive a total of 52 call backs, 23 for low income addresses and 29 for high
income addresses. We observe 34 call backs for female sounding names and 18
for male sounding names. Seventeen (17) of the call backs are associated with
names perceived to be lower class sounding names, while 35 are for the upper
class counterparts.
Patterns in the call backs rates were analyzed using equality of proportion tests.
These tests are used to assess the existence of any significant difference of call
back rates based on name, gender, resume quality and the address. We conduct
further analysis to assess whether these characteristics of the applicant impact the
chances of receiving a call back. To this end, we use complementary log-log6 and
probit regression models with the call back response as the left hand side variable
and the discrimination factors as the right hand side variables. The type of job
6 The complementary log-log model is used when the probability of an event is either very large or very common. It The
estimated coefficients approximates to the log of the log of the reverse odds ratio of the positive outcome. That is the fitted
probability of an event is calculated as . This value approximates to the logit model when the
probability of the event is small.
Page 15
position and the required skills were used as controls7. The model we use to run
the regressions is as follows:
(1)
Xi is a vector of dummy variables representing characteristics of the vacancy and the
applicant. Each of the following dummy variables takes on a value of 1 if the applicant
meets the characteristic and zero otherwise: High income address, High income
sounding name, Female and High Quality Resume. It then follows that the reference
group in the analysis are male applicants with low income names and addresses and
who have lower qualifications.
Additionally, the model uses dummy variables to capture the following job
characteristics, taking on the same values previously described. The included
categories for the type of position are Customer Service, Clerical, and
Administrative, while the required skills for the advertised position are listed
captured as Organization, Communication, and Computing. Other relevant
qualifications assessed in the model are the requirement for a tertiary degree and
Experience.
III The results presented in this section reveal evidence of hiring managers
discriminating based on individual characteristics other than qualification. The
frequency of call backs indicates a preference for applicants with high income
names and addresses and with lower qualifications. However, statistical testing
only provides strong, consistent evidence of class discrimination based on name.
Gender also appears to be important to employers.
7No controls were included for the employers’ characteristics because such information was infrequently available from
job advertisements.
Page 16
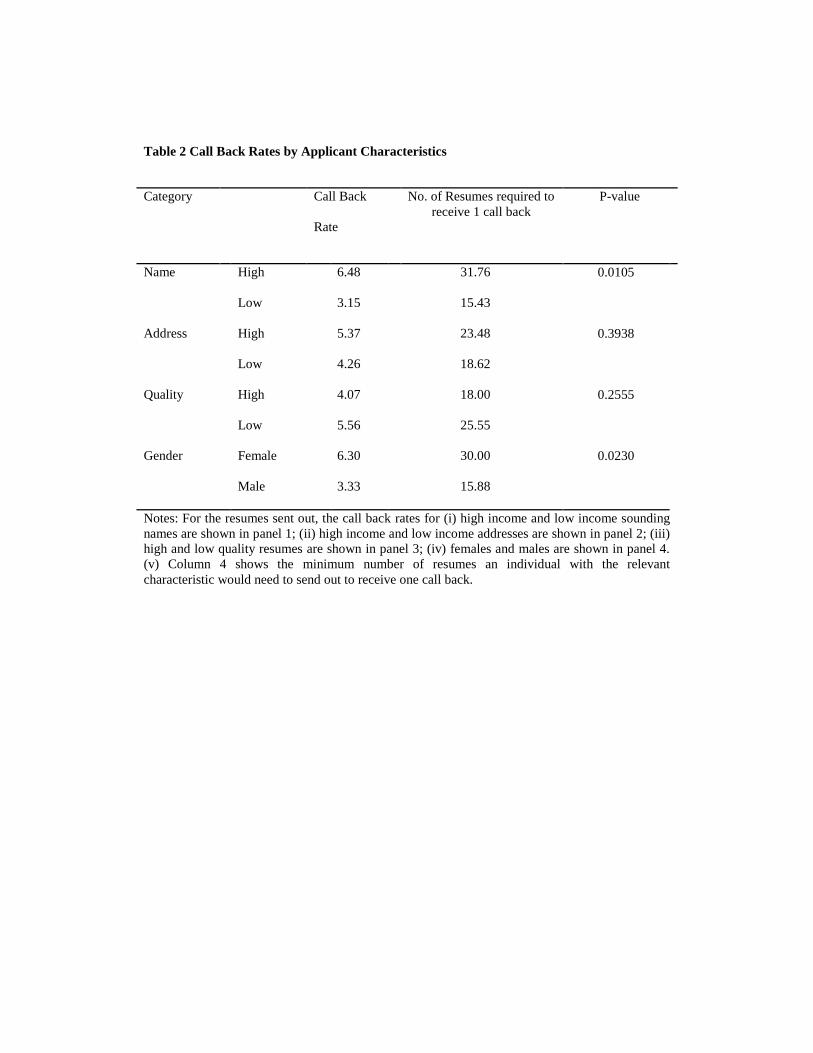
A. Observing the distribution of call backs by name shown in Table 2 (appendix),
reveals that the call back rate for high income names is 6.5% while it is 3.1% for
low income names. This implies that, on average, an applicant with a low income
name would have to send out approximately 32 resumes in order to receive a call
back whereas an applicant with a high income would only have to send out
approximately 15. The results of the test shown in the last column of the table,
suggests there is class discrimination on the basis of name.
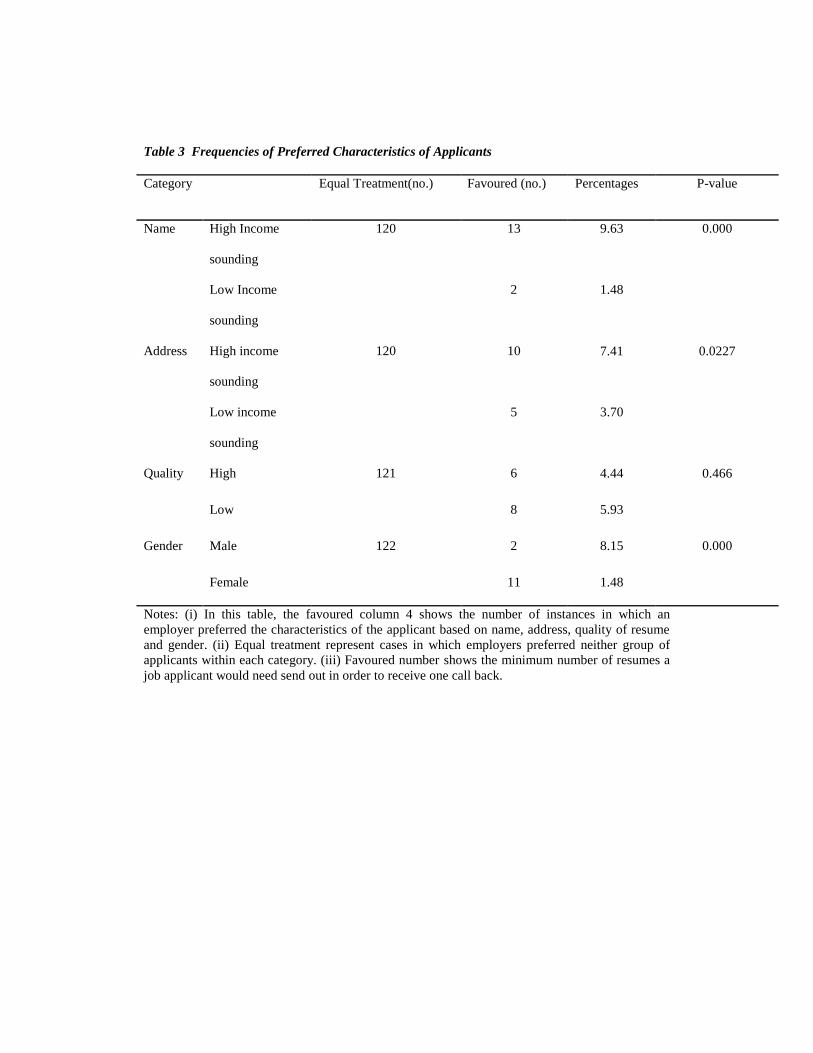
The results of the equality of portions test also support evidence of discrimination
on the basis of name. In Table 3, discrimination is measured by whether the
percentage of employers who favour one type of applicant is significantly
different from the percentage of employers who favour the other type of
applicant. Column 2 in Table 3 shows the number of employers who treat
applicants “equally.” Equal treatment includes the cases where no applicant
received a call back, as well as the cases where equal numbers of each type of
person received a call back. Column 3 shows the number of employers who
“favoured” one type of person over another. This occurs when they send
responses to more applicants of one type than another. The ratio of employers
who offered a call back to an applicant with a high income name is more than six
times the ratio of the employer who called a low income applicant. The first two
rows of Table 3 shows that out of 135 employers, 13 (9.7%) employers favoured
applicants with high income names while only 2 (1.5%) employers prefer
applicants with low income sounding names. The fraction of employers who
favour applicants from high income addresses is significantly different from the
fraction of employers who favour applicants from low income addresses.
The overall call back rate of this study is 4.8%, which limits the models we
estimate using regression analysis. Nonetheless, like Bertrand and Mullainathan
Page 17
(2004), Kaas and Manger (2012), Oreopoulos (2011), McGinnity et al. (2009) and
Thorat and Atwell (2007)8, we use regression analysis to assess the relationship
between the probability of call backs and individual characteristics. Using the
model in Equation 1, we control for variables pertaining to the resume such as
resume quality and type of name, as well as characteristics of the advertisement
such as skills required or the job category, among others.
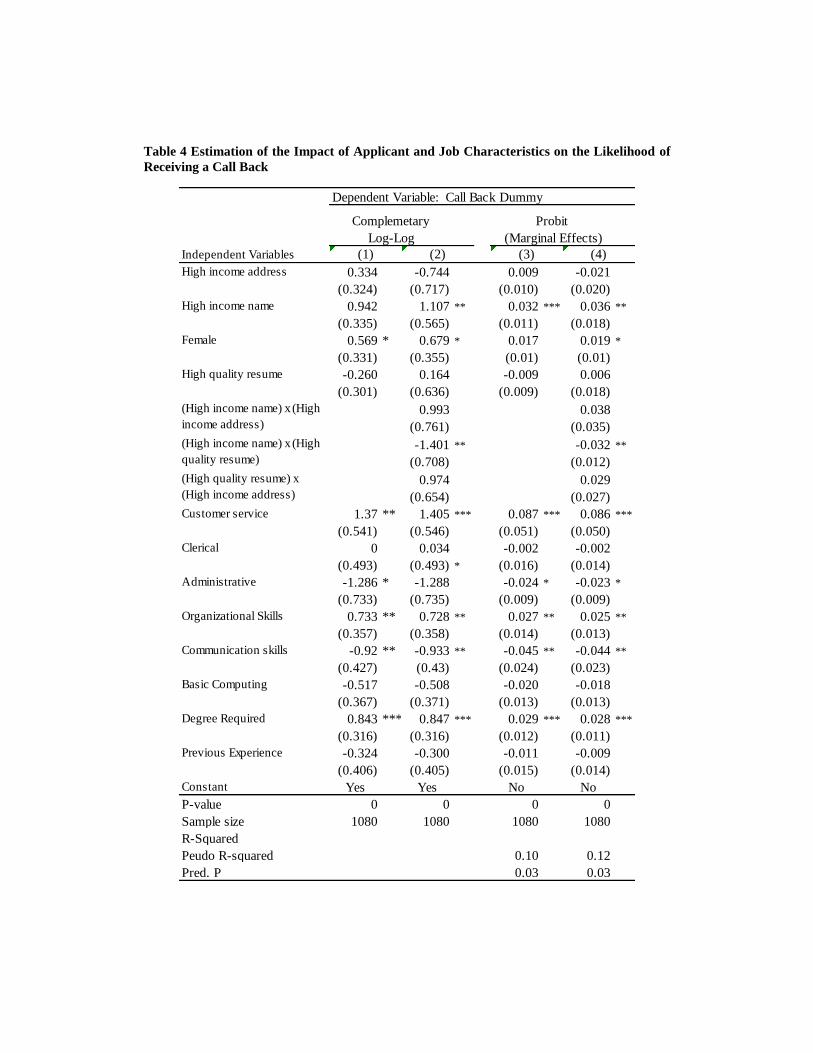
Table 4 reports the results of the regression analysis. Since the dependent variable
is binary (call back dummy variable), complementary log-log and probit models
are estimated.9 The results support the findings obtained from comparing the call
back rates across the different applicant profiles. The findings of all four models
consistently suggest that having a high income name has a positive and significant
impact on the call back rate. Therefore, having a high income name increases the
probability of receiving a call back by around 3-4%.
B. Although we find strong evidence of class discrimination by applicant’s name, we
find only limited evidence that discrimination extends to the applicant’s address.
Interestingly, the call back rate for applicants with high income addresses is 26%
higher than those with low income addresses, but this difference is not statistically
significant (Table 2). Also the coefficients on the high income address dummy
variables are positive in the regression estimations shown in Table 4, but this
relationship between a call back and address shown on the resume is again not
significant.
8 Bertrand and Mullainathan (2004) estimates a probit regression; Kaas and Manger (2012) uses both probit and
multinomial logit regressions; Oreopoulos (2011) uses a linear probability model; McGinnity et al. (2009) utilizes logistic
regression analysis and Thorat and Atwell (2007) uses a random effects logistics model.
9 Estimations for the linear probability model is are available upon request as a supplement to this paper.
Page 18
However, the results of the equal treatment test in Table 3 shows a significant
difference in the instances an employer favours one type of address over another.
The ratio of employers who favoured high income address over low income
addresses is two times that of the ratio of those who prefer low income addresses
to high income addresses.
C. Across all techniques used in this study, we find no significant evidence of
preference based on resume quality. Despite the lack of statistical evidence of
discrimination on the basis of resume quality, we note that the call back rate for
high quality resumes is 4.1% while the call back rate for low quality resumes is
higher at 5.6% (Table 2). Additionally, we observe that employers tend to favour
low quality resumes over high quality resumes (Table 3). It is important to recall
that although all resumes met the minimum advertised requirements, they differed
according to the level of writing sophistication, as well as the qualifications
presented. Since both types of resumes satisfied the minimum requirements for
the job, a potential explanation is that employers may prefer applicants with low
quality resumes because they assume that they are willing to accept a lower wage.
Another possibility may be that applicants with lower quality resumes are more
likely to remain in the advertised position longer. Therefore, a candidate with
lower, but satisfactory qualifications may be viewed as a less costly hire.
Looking at the estimation of the models with interaction terms shown in Columns
(2) and (4) of Table 4, there is a negative coefficient on the interaction term with
high quality resume and high income name. An applicant with both a high quality
resume and a high income name will have lower call back rates than an applicant
with a low quality resume and/or a low income name. From the estimation of the
probit model in Column (4), the significant marginal effect of a high income name
and low quality resume is 0.036, while the significant marginal effect of having a
Page 19
high income name and high quality resume is only 0.004. Having a high quality
resume reduces the increased likelihood a high income name applicant receiving a
call back from 3.6% to 0.4%. From the complementary lol-log model in Column
(2), we see that having a high quality resume with a high income converts the
positive relationship to a negative with the chance of receiving a call back. To
further this point, the beta coefficient for high income name is 0.2513 and -0.2648
for the high income name and high quality resume interaction term (see Table 5).
The negative effect of the interaction term on receiving a call back, is greater than
the positive effect of having a high income name.
Page 20
D. Although the tests do not reveal evidence of discrimination based on
qualifications, there is evidence that employers base their preference on another
characteristic determined by the applicant’s name, gender. The call back rate for
females of 6.3% is significantly differently from the 3.3% call back for male
applicants (Table 2). This implies that a male applicant would have to send out,
on average, approximately twice as many resumes in order to receive a call back
than a female applicant.
The second to last row of Table 3 shows that two employers favoured male
applicants. Of the 122 employers who displayed equal treatment in terms of
gender, five of them responded to equal numbers of male and female applicants
while 117 of them did not send a response to any of the applicants. The
percentage of employers that prefer female applicants (8.1%) is significantly
different from the percentage of employers that prefer male applicants (1.5%).
Regression analysis also supports a gender bias. The regression coefficients on the
female dummy variable is positive, implying that being a female increases the
likelihood on the call back rate (Table 4). This relationship however, seems to
have a marginal impact, if any, since that variable is significant only at the 10%
level in the complementary log-log and the probit that includes the interaction
terms.
E. The analysis shows consistent evidence of discrimination on the basis of name
and reasonable evidence of gender discrimination. In fact, we find that females
with high income names have a higher probability of receiving a call back than
their male counterparts with low income names. This suggests that Jamaican
employers discriminate against applicants with names that suggest that they are
from the lower class. The discrimination uncovered in favour of women is
Page 21
probably an indication that employers prefer females for jobs that are in the sales,
customer service, clerical, and administrative fields. This result is not surprising
and is in fact assumed to some extent in Bertand and Mullainathan (2004). They
use both female and male names for sales jobs but used only female names for
administrative and clerical positions to increase call back rates.
Finding that employers have a preference based on gender emphasizes the
importance of the applicant’s name. Still, the standardized beta coefficients
estimated from the probit regressions suggest that the class component of name
discrimination outweighs the gender component. Table 5 shows that the beta
coefficients for the high income name dummy is approximately twice as large the
relevant values for the dummy variable for an applicant being female.
Distinguishing between the forms of discrimination that occur from the name,
highlights the employers’ use of names to form assumptions about the class and
gender of an applicant. So our results suggest that employers use the first line of
the resume, prominently displaying the name of the applicant as a sorting
mechanism to root out candidates deemed to be unsuitable. On this merit, it is not
necessarily surprising that there is little evidence of discrimination on the basis of
address and no evidence preference based on resume quality.
We also found no evidence to suggest that quality was independently significant,
but observed that there is a significant interaction between high quality resumes
and high income names. The other interaction terms are not significant.10
Therefore, the call back rates for applicants with high income names or high
quality resumes are not impacted by an applicant’s address.
10 The models with gendered interaction terms were estimated, but yielded no significant results. This suggests the gender
discrimination is not influenced by other the applicant characteristics identified in this study. These results are available
upon request.
Page 22
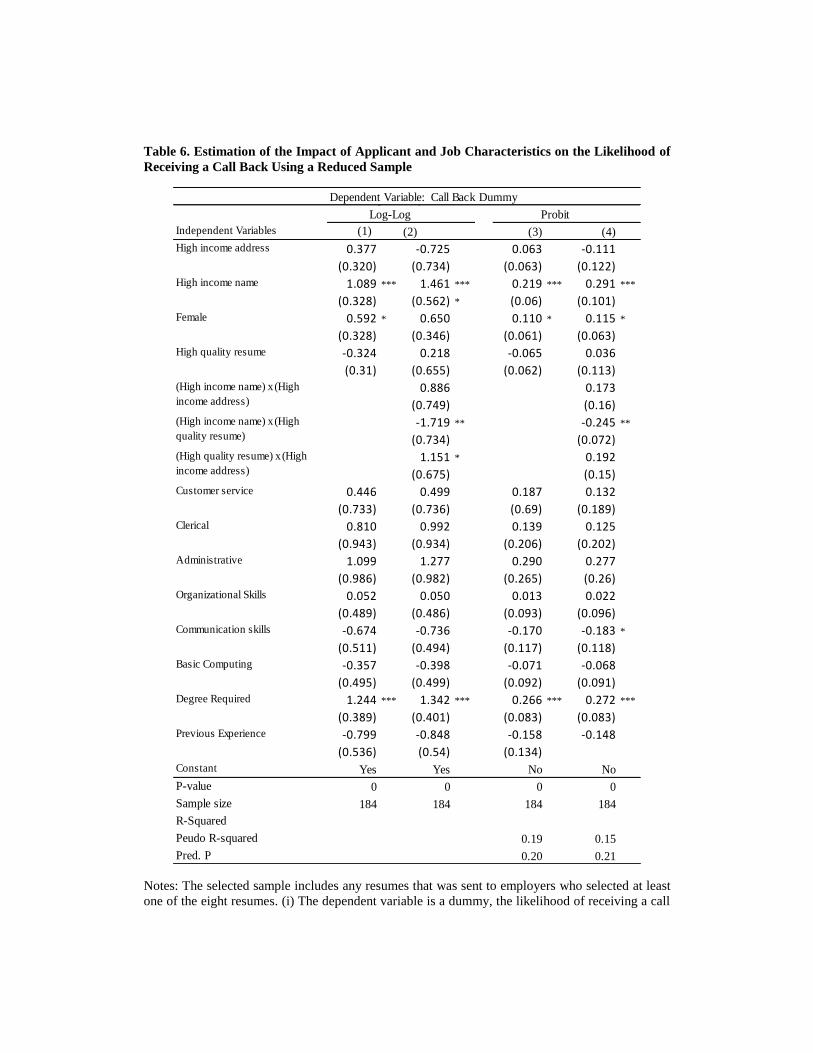
F. To verify the findings previous discussed, we estimated the probit and
complementary log-log models using a reduced sample. The estimated models
which only uses observations from employees who responded to at least one of
the 8 resumes they received are shown in Table 6. The findings are similar to
those found in the previous model. Candidates with high income names have a
higher probability of receiving a call back while the female dummy variable is
significant at the 10% level except in the complementary log-log model with
interactions. It follows that address and resume quality have no individual impact
on the call back rate. We also continue to see that having a high quality resume
reduces the likelihood of receiving a call back for those with high income
sounding names. Overall, the size of the coefficients tends to be higher for the
reduced sample, but this is expected since the sample only focussed on the firms
that sent out any call backs. The larger sample gives a more accurate picture of
the true size of the impact.
To summarize the results, we persistently see strong evidence of discrimination
against applicants with low income sounding names across all methods of
analysis. The results also consistently indicate that female applicants have a
higher probability of receiving a call back. Observing gender discrimination
reinforces the importance of how applicants’ names influence their chance of
receiving a call back. There is very weak support for discrimination on the basis
of address, as indicated by the results of the test for equal treatments shown in
Table 3. Finally, the regression results also imply that having a high quality
resume reduces the likelihood that an applicant with a high income name will
receive a call back. This suggests that having a high income name only increases
the probability of receiving a call back for applicants with low quality resumes.
Page 23
IV. We run a correspondence study in a racially homogeneous middle-income country
to disentangle the effects of discrimination on the basis of race versus
socioeconomic status. Matching applications that display different socioeconomic
class indicators are sent in response to advertisements for clerical, customer
service, sales and administration vacancies in the Kingston Metropolitan Area of
Jamaica. The distinguishing factors we use to identify various applicant
characteristics are resume quality, gender, name and address, where the latter two
serve as indicators of class.
We find ample evidence that call back rates are higher for applicants with high
income sounding names than for low income sounding names, and limited
evidence that address plays a large role in influencing employers to respond to job
applications. Overall, our results suggest that discrimination by class is a
potentially severe confounding variable in previous correspondence studies using
race-specific names to analyse race discrimination. Thus, the evidence found in
these studies, Bertrand and Mullainathan (2004) being the pioneer work, may to a
significant effect be driven by discrimination by class, rather than race.
Importantly, this does not imply that existing evidence on racial discrimination is
spurious. To the contrary, our results should be interpreted as complementary, in
the sense that race and class may exert independent effects on employer decisions.
This suggests that previous findings may indeed underestimate the discrimination
experienced by applicants from a particular race (e.g. blacks) if they are also from
a lower class background. We also find that gender plays a role in call back
receipts in our sample, where females are more likely than males to be on the
employers call back list. Note, however, that although this provides evidence of
gender discrimination, social class discrimination is a more important factor in
making the call back list. Finally, our findings reveal that employers appear to be
Page 24
more interested in applicants with high income sounding name and low quality
resumes, possibly in an attempt to negotiate lower wages.
While the findings of this study help to quantify the impact of class discrimination
in the Jamaican labour market, there are some limitations that should be carefully
considered. Firstly, this study only considers the impact of employment
discrimination at one stage of the employment process. Secondly, this is a resume
study and as such, we must assume that the resume profiles are perceived as
expected by the hiring personnel. We cannot be sure that an employer perceives
the names in a way that will match the categories specified in our name bank.
Although, the name survey should reduce some of this subjectivity, it is worth
mentioning as we have little information about the persons reading and selecting
the applications. This raises a broader point: comparing information on employers
is restricted by the availability of information. Some of the information on the
employers is hard to ascertain as not all job advertisements provided the name and
contact number for the company. Because of this, we are unable to ascertain
whether call back rates are in fact impacted by the address and industry of the
hiring company. Future research should look into these important issues.
Page 25
REFERENCES
Altink, H. (2015). Facilitator or hindrance to social change? The Westminster
model and racial discrimination on the Jamaican labour market, 1944–1980.
Commonwealth & Comparative Politics, 53(1), 29-48.
Aluko, O. E. (2010). The Impact of Urbanization on Housing Development: The
Lagos Experience, Nigeria. Ethiopian Journal of Environmental Studies and
Management, 3(3).
Austin-Broos, D. J. (1994). Race/class: Jamaica's discourse of heritable identity.
NWIG: New West Indian Guide/Nieuwe West-Indische Gids, 68(3/4), 213-233.
Bertrand, M. and Mullainathan, S. (2004). Are Emily and Greg more employable
than Lakisha and Jamal? A field experiment on labor market discrimination.
American Economic Review, 94:4, 991-1014.
Bertrand, M., and Duflo, E. (2016). Field experiments on discrimination (No.
w22014). National Bureau of Economic Research.
Broom, L. (1954). The social differentiation of Jamaica. American Sociological
Review, 19(2), 115-125.
Cohen, B. (2006). Urbanization in developing countries: Current trends, future
projections, and key challenges for sustainability. Technology in society, 28(1),
63-80.
Drydakis, N. (2009). Sexual orientation discrimination in the labour market.
Labour Economics 16, 362-372.
Fryer Jr, R. G., and Levitt, S. D. (2004). The causes and consequences of
distinctively black names. The Quarterly Journal of Economics, 767-805.
Gordon, M. (1949). Social Class in American Sociology. American Journal of
Sociology, 55:3, 262-268
Heckman, J. J., and Siegelman, P. (1993). The urban institute audit studies: their
methods and findings," in M. Fix and R. Struyk, eds. clear and convincing
evidence: measurement of discrimination in America Urban Institute Press.
Hotchkiss, J. and Moore, R. (1996). Gender compensation differentials in
Jamaica. Economic Development and Cultural Change, 44:3, 657-676.
Page 26
Jackson, M. (2009). Disadvantaged through discrimination? The role of
employers in social stratification1. The British Journal of Sociology, 60(4), 669-
692.
Jamaica Gleaner (2009). Best places to live ... Upper St Andrew, retrieved August
6, 2013 from http://old.jamaica-gleaner.com/gleaner/20090308/out/out5.html.
Jamaica Gleaner (2010). Wrong address – many Jamaicans still denied jobs and
services because of where they live. Retrieved from: http://jamaica-
gleaner.com/gleaner/20100307/lead/lead9.html
Jamaica Gleaner (2011). Labor minister probes workplace discrimination.
Retrieved from: http://jamaica-gleaner.com/power/31866
Jamaica Observer (2014b). Income inequality breeds resentment. Retrieved from:
http://www.jamaicaobserver.com/editorial/Income-inequality-breeds-
resentment_16492815, August 12, 2015.
Jowell, R. and Prescott-Clarke, P. (1970). Racial discrimination and white-collar
workers in Britain. Race & Class, 11:4, 397-417.
Holzer, H., & Neumark, D. (1996). Are affirmative action hires less qualified?
Evidence from employer-employee data on new hires (No. w5603). National
Bureau of Economic Research.
Kaas, L. and Manger, C (2012). Ethnic discrimination in Germany’s labour
market: a field experiment. German Economic Review, 13:1, 1-20.
Kuhn, P. and Kailing, S. (2013). Gender discrimination in job ads: evidence from
China. Quarterly Journal of Economics, 128:1, 287-336.
Leonard, J. S. (1987). The interaction of residential segregation and employment
discrimination. Journal of Urban Economics, 21:3, 323-346.
Levine, M. B., & Willis, F. N. (1994). Public reactions to unusual names. The
Journal of Social Psychology, 134(5), 561-568.
McGinnity, F., Nelson, J., Lunn, P. and Quinn, E. (2009). Discrimination in
recruitment: evidence from a field experiment. Dublin. The Equality Authority.
Minnesota Population Center (2015). Integrated Public Use Microdata Series,
International: Version 6.4 [Machine-readable database]. Minneapolis: University
of Minnesota.
Page 27
Nunley, J. M., Pugh, A., Romero, N., and Seals, R. A. (2014). An Examination of
Racial Discrimination in the Labor Market for Recent College Graduates:
Estimates from the Field (No. auwp2014-06). Department of Economics, Auburn
University.
Oreopoulos, P. (2011). Why do skilled immigrants struggle in the labor market?
A field experiment with thirteen thousand resumes. American Economic Journal:
Economic Policy, 3:4, 148-171.
Petit, P. (2007). The effects of age and family constraints on gender hiring
discrimination: a field experiment in the French financial sector. Labour
Economics, 14:3, 371-391.
Pager, D. (2007). The use of field experiments for studies of employment
discrimination: contributions, critiques, and directions for the future. Annals of
the American Academy of Political and Social Science Vol. 609, Race, Ethnicity,
and Inequality in the U.S. Labor Market: Critical Issues in the New Millennium,
104-133.
Roberts, D. (2010). Jobs for growth: the contribution of the labour market in
economic expansion. Labour Market Forum, Planning Institute of Jamaica.
Stoll, M. A. (1999). Spatial mismatch, discrimination and male youth
employment in the washington, dc area: implications for residential mobility
policies. Journal of Policy Analysis and Management, 18:1, 77-98.
Thorat, S. and Attewell, P. (2007). The legacy of social exclusion: a
correspondence study of job discrimination in India. Economic and Political
Weekly, 42: 41, 4141-4145.
Thorat, S. (2008). Labour market discrimination: concept, forms and remedies in
the Indian situation. The Indian Journal of Labour Economics, 51:1.
Willis, F. N., Willis, L. A., & Gier, J. A. (1982). Given names, social class, and
professional achievement. Psychological Reports, 51(2), 543-549.
Page 28
Appendix
Figure 1: Map of the Kingston Metropolitan Area, Jamaica
Notes: (i) The pockets on the map are enumeration districts, the lowest administrative level,
in the Kingston Metropolitan Area. (ii) The shaded enumeration districts are those from
which addresses for the resumes were used in this study. (iii) The green shaded areas
represents some of the affluent communities and the yellow shaded areas, a portion of the
inner city communities.
Page 29
Table 1 Post Survey Name Bank
High Income Sounding Low Income Sounding
Female Male Female Male
Abigail Adam Andre-Anna Danavan
Alice Alexander Blossel Dowayne
Anastasia Brandon Delphina Hansom
Brittany Bruce Glasme Kitori
Brooke Charlton Iene Lerch
Caitlin Colin Jenneve Nemroy
Charlotte Darren Keeling Rallen
Chelsea Hanif Lovinia Reginal
Christina James Samanthia Sheckardo
Danielle Jeremy Shackeria Super
Emma Joseph Shanoy
Isabella Joshua Shickell
Jessica Justin Sophesia
Juliet Kingsley Soverley
Kathleen Mark Taisha-Gaye
Lindsay Martin Taranio
Lydia Marvin Urcena
Marissa Nigel Zonashia
Rachel Oliver
Rebecca Ricardo
Savannah Richard
Shari Ryan
Vanessa Sean
Victoria Stuart
Tristan
Vincent
Notes: (i) These names represent a selection from the Jamaica’s voters’ metropolitan registration
list, which is representative of the Kingston metropolitan area. (ii) Survey participants were asked
to categorize the names according to gender and income status. (iii) The outcome of the survey
features 44 female names, 59% of which are high income sounding and 36 male names, 72% of
which are high income sounding.
Page 30
Table 2 Call Back Rates by Applicant Characteristics
Category Call Back
Rate
No. of Resumes required to
receive 1 call back
P-value
Name High 6.48 31.76 0.0105
Low 3.15 15.43
Address High 5.37 23.48 0.3938
Low 4.26 18.62
Quality High 4.07 18.00 0.2555
Low 5.56 25.55
Gender Female 6.30 30.00 0.0230
Male 3.33 15.88
Notes: For the resumes sent out, the call back rates for (i) high income and low income sounding
names are shown in panel 1; (ii) high income and low income addresses are shown in panel 2; (iii)
high and low quality resumes are shown in panel 3; (iv) females and males are shown in panel 4.
(v) Column 4 shows the minimum number of resumes an individual with the relevant
characteristic would need to send out to receive one call back.
Page 31
Table 3 Frequencies of Preferred Characteristics of Applicants
Category Equal Treatment(no.) Favoured (no.) Percentages P-value
Name High Income
sounding
120 13 9.63 0.000
Low Income
sounding
2 1.48
Address High income
sounding
120 10 7.41 0.0227
Low income
sounding
5 3.70
Quality High 121 6 4.44 0.466
Low 8 5.93
Gender Male 122 2 8.15 0.000
Female 11 1.48
Notes: (i) In this table, the favoured column 4 shows the number of instances in which an
employer preferred the characteristics of the applicant based on name, address, quality of resume
and gender. (ii) Equal treatment represent cases in which employers preferred neither group of
applicants within each category. (iii) Favoured number shows the minimum number of resumes a
job applicant would need send out in order to receive one call back.
Page 32
Table 4 Estimation of the Impact of Applicant and Job Characteristics on the Likelihood of
Receiving a Call Back
Dependent Variable: Call Back Dummy
Independent Variables
High income address 0.334 -0.744 0.009 -0.021
(0.324) (0.717) (0.010) (0.020)
High income name 0.942 1.107 ** 0.032 *** 0.036 **
(0.335) (0.565) (0.011) (0.018)
Female 0.569 * 0.679 * 0.017 0.019 *
(0.331) (0.355) (0.01) (0.01)
High quality resume -0.260 0.164 -0.009 0.006
(0.301) (0.636) (0.009) (0.018)
0.993 0.038
(0.761) (0.035)
-1.401 ** -0.032 **
(0.708) (0.012)
0.974 0.029
(0.654) (0.027)
Customer service 1.37 ** 1.405 *** 0.087 *** 0.086 ***
(0.541) (0.546) (0.051) (0.050)
Clerical 0 0.034 -0.002 -0.002
(0.493) (0.493) * (0.016) (0.014)
Administrative -1.286 * -1.288 -0.024 * -0.023 *
(0.733) (0.735) (0.009) (0.009)
Organizational Skills 0.733 ** 0.728 ** 0.027 ** 0.025 **
(0.357) (0.358) (0.014) (0.013)
Communication skills -0.92 ** -0.933 ** -0.045 ** -0.044 **
(0.427) (0.43) (0.024) (0.023)
Basic Computing -0.517 -0.508 -0.020 -0.018
(0.367) (0.371) (0.013) (0.013)
Degree Required 0.843 *** 0.847 *** 0.029 *** 0.028 ***
(0.316) (0.316) (0.012) (0.011)
Previous Experience -0.324 -0.300 -0.011 -0.009
(0.406) (0.405) (0.015) (0.014)
Constant Yes Yes No No
P-value 0 0 0 0
Sample size 1080 1080 1080 1080
R-Squared
Peudo R-squared 0.10 0.12
Pred. P 0.03 0.03
(High quality resume) x
(High income address)
Complemetary
Log-Log
Probit
(Marginal Effects)
(High income name) x (High
income address)
(High income name) x (High
quality resume)
(1) (2) (3) (4)
Page 33
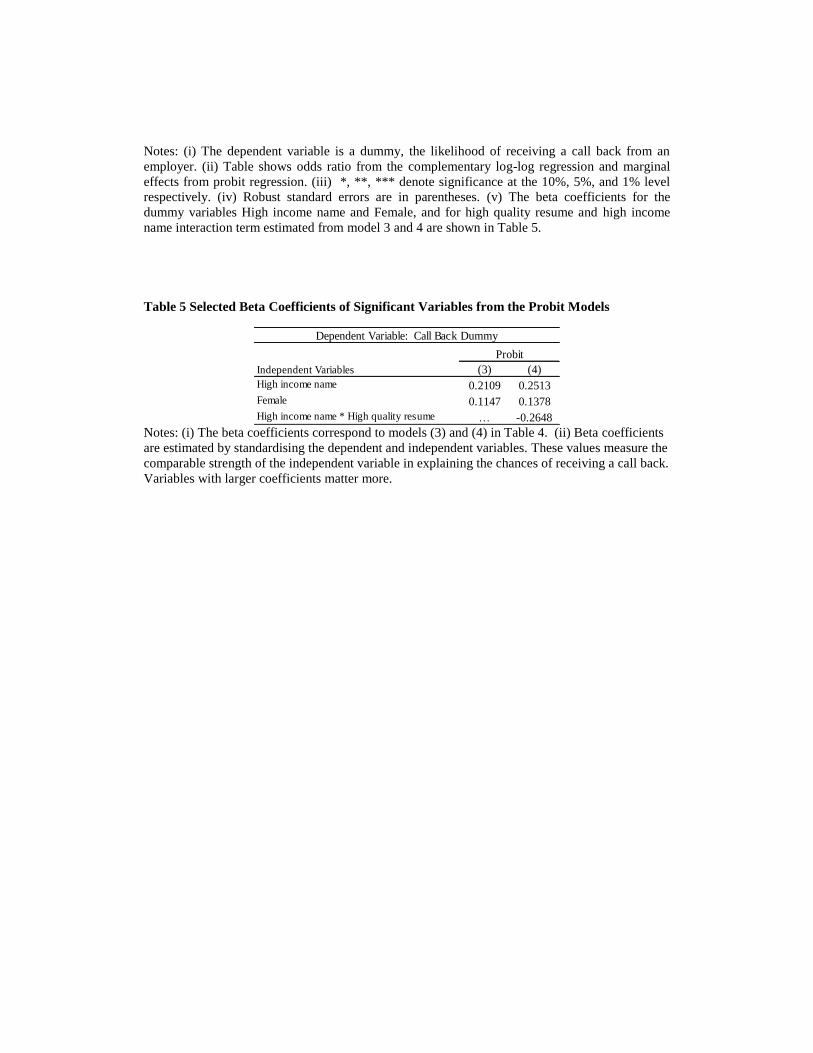
Notes: (i) The dependent variable is a dummy, the likelihood of receiving a call back from an
employer. (ii) Table shows odds ratio from the complementary log-log regression and marginal
effects from probit regression. (iii) *, **, *** denote significance at the 10%, 5%, and 1% level
respectively. (iv) Robust standard errors are in parentheses. (v) The beta coefficients for the
dummy variables High income name and Female, and for high quality resume and high income
name interaction term estimated from model 3 and 4 are shown in Table 5.
Table 5 Selected Beta Coefficients of Significant Variables from the Probit Models
Independent Variables (3) (4)
High income name 0.2109 0.2513
Female 0.1147 0.1378
High income name * High quality resume … -0.2648
Probit
Dependent Variable: Call Back Dummy
Notes: (i) The beta coefficients correspond to models (3) and (4) in Table 4. (ii) Beta coefficients
are estimated by standardising the dependent and independent variables. These values measure the
comparable strength of the independent variable in explaining the chances of receiving a call back.
Variables with larger coefficients matter more.
Page 34
Table 6. Estimation of the Impact of Applicant and Job Characteristics on the Likelihood of
Receiving a Call Back Using a Reduced Sample
Dependent Variable: Call Back Dummy
Independent Variables (2) (3) (4)
High income address 0.377 -0.725 0.063 -0.111
(0.320) (0.734) (0.063) (0.122)High income name 1.089 *** 1.461 *** 0.219 *** 0.291 ***
(0.328) (0.562) * (0.06) (0.101)Female 0.592 * 0.650 0.110 * 0.115 *
(0.328) (0.346) (0.061) (0.063)High quality resume -0.324 0.218 -0.065 0.036
(0.31) (0.655) (0.062) (0.113)
0.886 0.173
(0.749) (0.16)
-1.719 ** -0.245 **
(0.734) (0.072)
1.151 * 0.192
(0.675) (0.15)Customer service 0.446 0.499 0.187 0.132
(0.733) (0.736) (0.69) (0.189)Clerical 0.810 0.992 0.139 0.125
(0.943) (0.934) (0.206) (0.202)Administrative 1.099 1.277 0.290 0.277
(0.986) (0.982) (0.265) (0.26)Organizational Skills 0.052 0.050 0.013 0.022
(0.489) (0.486) (0.093) (0.096)Communication skills -0.674 -0.736 -0.170 -0.183 *
(0.511) (0.494) (0.117) (0.118)Basic Computing -0.357 -0.398 -0.071 -0.068
(0.495) (0.499) (0.092) (0.091)Degree Required 1.244 *** 1.342 *** 0.266 *** 0.272 ***
(0.389) (0.401) (0.083) (0.083)Previous Experience -0.799 -0.848 -0.158 -0.148
(0.536) (0.54) (0.134)Constant Yes Yes No No
P-value 0 0 0 0
Sample size 184 184 184 184
R-Squared
Peudo R-squared 0.19 0.15
Pred. P 0.20 0.21
(1)
Probit
(High income name) x (High
income address)
(High income name) x (High
quality resume)
(High quality resume) x (High
income address)
Complemetary
Log-Log
Notes: The selected sample includes any resumes that was sent to employers who selected at least
one of the eight resumes. (i) The dependent variable is a dummy, the likelihood of receiving a call
Page 35
back from an employer. (ii) Table shows odds ratio from the complementary log-log regression
and marginal effects from probit regression. (iii) *, **, *** denote significance at the 10%, 5%,
and 1% level respectively. (iv) Robust standard errors are in parentheses.