Class-specific Anchoring Proposal for 3D Object Recognition in LIDAR and RGB Images Amir Hossein Raffiee School of Mechanical Engineering, Purdue University araffi[email protected]Humayun Irshad Figure Eight Technology Inc humayun.irshad@figure-eight.com Abstract Detecting objects in a two-dimensional setting is often in- sufficient in the context of real-life applications where the surrounding environment needs to be accurately recognized and oriented in three-dimension (3D), such as in the case of autonomous driving vehicles. Therefore, accurately and effi- ciently detecting objects in the three-dimensional setting is becoming increasingly relevant to a wide range of industrial applications, and thus is progressively attracting the attention of researchers. Building systems to detect objects in 3D is a challenging task though, because it relies on the multi-modal fusion of data derived from different sources. In this paper, we study the effects of anchoring using the current state-of- the-art 3D object detector and propose Class-specific Anchor- ing Proposal (CAP) strategy based on object sizes and as- pect ratios based clustering of anchors. The proposed anchor- ing strategy significantly increased detection accuracy’s by 7.19%, 8.13% and 8.8% on Easy, Moderate and Hard setting of the pedestrian class, 2.19%, 2.17% and 1.27% on Easy, Moderate and Hard setting of the car class and 12.1% on Easy setting of cyclist class. We also show that the cluster- ing in anchoring process also enhances the performance of the regional proposal network in proposing regions of inter- ests significantly. Finally, we propose the best cluster num- bers for each class of objects in KITTI dataset that improves the performance of detection model significantly. Introduction Nowadays, the object detection and recognition task is car- ried out widely using convolutional neural networks (CNN). In this regard, many models have been developed to detect 2D objects in RGB images based on the extraction of fea- tures of the image using CNNs (Girshick 2015; Girshick et al. 2014; Liu et al. 2016; Redmon et al. 2016). While these models are capable of achieving significant perfor- mance in object detection and recognition in many areas, but these models are unable to show reasonable performance in few areas, particularly in object detection in 3D autonomous driving. For instance, in order to allow safe motion planning for self-driving cars, the surrounding environment must be rec- ognized in a 3D manner; additionally, information about the location, size and orientation of the surrounding objects Copyright c 2019, Association for the Advancement of Artificial Intelligence (www.aaai.org). All rights reserved. should also be provided. For the purpose of the recognition, various types of information can be used such as depth in- formation and distance information from other sources like 3D point cloud. The work presented in (Kehl et al. 2017) used RGB image to localize and estimate the orientation of the objects. Furthermore, RGB-D images can also be used, allowing the models to fuse the depth information with a RGB image (Song and Xiao 2016; 2014) leading to a sub- stantial performance gain compared to the models that solely use RGB images. However, with the recent improvements in LIDAR (Light Detection And Ranging) technology, predic- tive models have been developed to estimate the 3D bound- ing boxes using point clouds produced by LIDAR sensors (Qi et al. 2017a; Chen et al. 2017; Zhou and Tuzel 2017; Yang, Luo, and Urtasun 2018; Simon et al. 2018). Because the point cloud is an unstructured collection of points in a 3D space, it is difficult to apply standard convo- lutional operations. Hence, different approaches have been proposed to deal with this problem. In this regard, the point cloud can be represented in a 3D voxel grid space where the value of each cell is either a scalar or a vector variable repre- senting the hand-crafted features of the points falling in that grid. In this approach, 3D convolutions can be applied to extract the high-level features of the point cloud that lead to high computation due to the high dimensionality of the prob- lem. Furthermore, the point cloud can be projected into mul- tiple planes (Engelcke et al. 2017; Wang and Posner 2015; Li, Zhang, and Xia 2016). Another approach is the projection of the point cloud onto a 2D plane such as birds-eye-view plane and then its dis- cretization into equally spaced grid cells. The value of the grid cells is determined by using hand-crafted features such as density, maximum height and intensity. This way, the 3D point cloud is transformed into a 2D image-based data on which 2D convolution can be applied for feature extraction. Two problems associated with this method are (i), the loss of information during the projection of points from 3D to 2D and ii), the need to manually craft features to represent them in an image-based fashion (Chen et al. 2017; Ku et al. 2017; Yang, Luo, and Urtasun 2018). (Chen et al. 2017) proposes to fuse the information from the 2D-projected point cloud on birds-eye-view and front map with RGB camera data to compensate for that loss of information. In order to avoid the need for hand-crafted fea- arXiv:1907.09081v1 [cs.CV] 22 Jul 2019
Transcript
Class-specific Anchoring Proposal for 3D Object Recognition in LIDAR and RGBImages
Amir Hossein RaffieeSchool of Mechanical Engineering, Purdue University
Detecting objects in a two-dimensional setting is often in-sufficient in the context of real-life applications where thesurrounding environment needs to be accurately recognizedand oriented in three-dimension (3D), such as in the case ofautonomous driving vehicles. Therefore, accurately and effi-ciently detecting objects in the three-dimensional setting isbecoming increasingly relevant to a wide range of industrialapplications, and thus is progressively attracting the attentionof researchers. Building systems to detect objects in 3D is achallenging task though, because it relies on the multi-modalfusion of data derived from different sources. In this paper,we study the effects of anchoring using the current state-of-the-art 3D object detector and propose Class-specific Anchor-ing Proposal (CAP) strategy based on object sizes and as-pect ratios based clustering of anchors. The proposed anchor-ing strategy significantly increased detection accuracy’s by7.19%, 8.13% and 8.8% on Easy, Moderate and Hard settingof the pedestrian class, 2.19%, 2.17% and 1.27% on Easy,Moderate and Hard setting of the car class and 12.1% onEasy setting of cyclist class. We also show that the cluster-ing in anchoring process also enhances the performance ofthe regional proposal network in proposing regions of inter-ests significantly. Finally, we propose the best cluster num-bers for each class of objects in KITTI dataset that improvesthe performance of detection model significantly.
IntroductionNowadays, the object detection and recognition task is car-ried out widely using convolutional neural networks (CNN).In this regard, many models have been developed to detect2D objects in RGB images based on the extraction of fea-tures of the image using CNNs (Girshick 2015; Girshicket al. 2014; Liu et al. 2016; Redmon et al. 2016). Whilethese models are capable of achieving significant perfor-mance in object detection and recognition in many areas, butthese models are unable to show reasonable performance infew areas, particularly in object detection in 3D autonomousdriving.
For instance, in order to allow safe motion planning forself-driving cars, the surrounding environment must be rec-ognized in a 3D manner; additionally, information aboutthe location, size and orientation of the surrounding objects
should also be provided. For the purpose of the recognition,various types of information can be used such as depth in-formation and distance information from other sources like3D point cloud. The work presented in (Kehl et al. 2017)used RGB image to localize and estimate the orientation ofthe objects. Furthermore, RGB-D images can also be used,allowing the models to fuse the depth information with aRGB image (Song and Xiao 2016; 2014) leading to a sub-stantial performance gain compared to the models that solelyuse RGB images. However, with the recent improvements inLIDAR (Light Detection And Ranging) technology, predic-tive models have been developed to estimate the 3D bound-ing boxes using point clouds produced by LIDAR sensors(Qi et al. 2017a; Chen et al. 2017; Zhou and Tuzel 2017;Yang, Luo, and Urtasun 2018; Simon et al. 2018).
Because the point cloud is an unstructured collection ofpoints in a 3D space, it is difficult to apply standard convo-lutional operations. Hence, different approaches have beenproposed to deal with this problem. In this regard, the pointcloud can be represented in a 3D voxel grid space where thevalue of each cell is either a scalar or a vector variable repre-senting the hand-crafted features of the points falling in thatgrid. In this approach, 3D convolutions can be applied toextract the high-level features of the point cloud that lead tohigh computation due to the high dimensionality of the prob-lem. Furthermore, the point cloud can be projected into mul-tiple planes (Engelcke et al. 2017; Wang and Posner 2015;Li, Zhang, and Xia 2016).
Another approach is the projection of the point cloud ontoa 2D plane such as birds-eye-view plane and then its dis-cretization into equally spaced grid cells. The value of thegrid cells is determined by using hand-crafted features suchas density, maximum height and intensity. This way, the 3Dpoint cloud is transformed into a 2D image-based data onwhich 2D convolution can be applied for feature extraction.Two problems associated with this method are (i), the loss ofinformation during the projection of points from 3D to 2Dand ii), the need to manually craft features to represent themin an image-based fashion (Chen et al. 2017; Ku et al. 2017;Yang, Luo, and Urtasun 2018).
(Chen et al. 2017) proposes to fuse the information fromthe 2D-projected point cloud on birds-eye-view and frontmap with RGB camera data to compensate for that loss ofinformation. In order to avoid the need for hand-crafted fea-
arX
iv:1
907.
0908
1v1
[cs
.CV
] 2
2 Ju
l 201
9
tures in the representation of the point cloud, the authors of(Qi et al. 2017b; 2017c) developed networks that treat thepoint cloud in 3D space directly without the need to trans-form them into another space.
In (Ku et al. 2017), the authors present the aggregateview object detection (AVOD) model powering the currentstate-of-the-art 3D object detector on the KITTI data set,the 3D object detection benchmark (Geiger et al. 2013). Inthe current paper, we set to use the AVOD framework inorder to evaluate the performance improvement in 3D ob-ject detection using class-specific anchoring proposals. Thisframework is composed of three consecutive networks: (i)encoder-decoder network which extracts feature maps forLIDAR points and RGB images, (ii) 3D Region ProposalNetwork (RPN) that includes a region-based fusion networkwhich combined RGB and BEV feature maps to compensatefor the information loss occurring during the 2D transfor-mation phase of the point cloud and select a list of top pro-posed regions and (iii) final detection and pose estimationnetwork that regresses the modification and orientation ofselected regions and categorizes the classification label forselected regions. In our proposed study, we are extendingAVOD framework by adding class-specific anchoring pro-posal to improve the anchoring strategy by addressing theissue of classes which have objects with large variations insizes and aspect ratios.
Due to the variety of sizes and aspect ratios of the objectsin the class of cyclist and pedestrian in KITTI data set, thecurrent object detectors have poor performance in propos-ing appropriate anchor size that leads to poor performancein the final object detection. As a remedy, inspired by 2Dobject detectors we used K−mean and Gaussian MixtureModel clustering methods to have better prior informationabout the object sizes in which we can set the number clus-ters. This capability can be used for the class of objects thathas large variance in their size and aspect ratio which helpsthe framework to gain performance in detection for thoseobjects.
Related WorksThe F-PointNet (Qi et al. 2017a) achieves notable perfor-mance for 3D object detection and birds-eye-view detectionon cars, pedestrians and cyclists on the KITTI benchmarksuite. This method uses a 2D Faster RCNN object detectorto find 2D boxes including the object on RGB camera im-age. Subsequently, the detected boxes are extruded to iden-tify the point cloud falling into the frustum correspondingto the boxes. The discovered point cloud is classified in abinary fashion to separate the points constructing the objectof interest and 3D regression is conducted on the separatedpoints. The main drawback of this method comes from thefact that the accuracy of the model is highly dependent onthe accuracy of the 2D object detector on RGB image. Forinstance, if the 2D detector misses the object on RGB image,the second Network is not able to localize the missed objectin the 3D space. Furthermore, the consecutive nature of thismodel (2D detector Network followed by 3D detector) ex-tends the inference time, which is a noteworthy issue in the
context of numerous applications, including autonomous ve-hicles.
Multi-view 3D (Chen et al. 2017) (MV3D) is a 3D ob-ject detector that fuses the information from three separatesources: the projected point cloud on birds-eye-view, thefront-view map and the RGB camera image. In this method,the LIDAR points are mapped in voxel grids, and hand-crafted features such as maximum height and density areused to convert unordered point clouds to the voxel gridmap. The input feature maps are fed into the 3D RegionProposal Network that uses the combined information fromthese three sources in order to achieve higher recall com-pared to the cases where only one of the sources is used. Themain challenge with this method is the high cost of compu-tation which also increases the inference time.
MethodologyIn this study, we explore the effect of Class-specific An-choring Proposal on AVOD algorithm (Ku et al. 2017) for3D object recognition with the use of RGB images andpoint cloud data illustrated in Figure 1. The framework takestwo inputs (RBG image and corresponding 3D point cloud)and predicts 3-dimensional bounding boxes and classifiesthe objects into three classes of cyclist, pedestrian and car.The main components of the framework are Bird-Eye-View(BEV) map generation, class-specific anchoring proposal(CAP) strategy and AVOD model which contains three net-works: encoder-decoder network, Region Proposal Network(RPN) and final detection and pose estimation network.
BEV Map GenerationFollowing (Chen et al. 2017), 2D representation of LI-DAR data points is used to generate the BEV map. Inthis process, the 3D data points are projected onto a se-ries of planes parallel to the ground plane. Each plane isdiscretized with the resolution of 0.1m in X and Z direc-tions (X and Z aligns with the camera 0 coordinates (Geigeret al. 2013) in KITTI dataset) to create 2D voxel grids.The voxel grid value is encoded by the maximum height ofthe LIDAR point trapped in that grid. The resulting tensorrepresents the height map of the point cloud in 3D spacescene. Furthermore, the density of the points in each gridis computed and concatenated to the height map of LIDARpoints to construct the BEV map. Hence, the input tensorfed to the model is of the shape of (H,W,C + 1) whereH and W represents the height and the width of the 2Dvoxel grid and C is the number of planes that data pointare projected (Chen et al. 2017; Yang, Luo, and Urtasun2018) plus one channel that contains point density infor-mation computed per cell as min(1.0, log(N+1)
log 16 ). It shouldbe noted that the points are cropped at [-40,40] × [0,80]meter in X and Z directions, respectively, which encloseslarger area compared to previous works (Chen et al. 2017;Ku et al. 2017). We noticed that significant number of ob-jects (particularly objects belonging to the cyclist and pedes-trian classes) falls outside the area considered in their modelwhich affects the the model performance negatively and in-creases the number of missed objects.
Figure 1: Architecture of Class-specific Anchoring Proposal (CAP)-AVOD used for 3D objects recognition.
Class-specific Anchoring Proposal (CAP)The AVOD model show acceptable performance on detect-ing cars (Ku et al. 2017), while its performance drops signif-icantly when there is a large variations in size and aspect ra-tios between objects such as cyclists and pedestrians. In thiswork, we are exploring the effect of anchoring on the per-formance of the model for detecting objects in three classesof cyclist, pedestrian and car.
For AVOD model, we study the effect of proposed anchor-ing on the performance of the two networks; RPN which se-lects anchors and produces Regions of Interest (ROI) andfinal detection and pose estimation network which recog-nizes and localizes objects in proposed ROIs. In multi-stageobject detectors, the anchors’ size are considered as prior in-formation about the size of the desired objects to be detectedby the model. Hence, having an appropriate prior informa-tion about the size of the objects improves the performanceof the model significantly. In this strategy, class specific an-chors are generated based on each class prior information.The number of the anchors proposed per frame is approxi-mately 80 to 100K for AVOD and CAP-AVOD.
In order to find appropriate sizes for class specific an-chors, we use K-mean clustering and Gaussian MixtureModel (GMM) methods. As we know, the size of the ob-jects in 3D can be represented by length (L), width (W ) andheight (H). Therefore, each object in particular class is con-sidered as a vector x with three features (L,H,W ). In thismethod, the objects in each class are clustered into specificnumber of groups (n) and the mean values of each group isconsidered as the size of the proposed anchors. Each objectin class C is represented by xic = (Lic, Hic,Wic). Hence,givenm objects for class C in training data we can representall the objects in this class as:
Xc = (x1c, x2c, ..., xmc) (1)
Using K-mean clustering method, we try to find clusters
Sjc (j ∈ [1, n]) for each class of objects (C) by minimizingthe variance in each cluster as follow:
argminSjc
n∑j=1
∑xic∈Sjc
||xic − µjc||2 (2)
where µjc is the mean of data points belonging into Sjc clus-ter.
In the second method, Expectation Maximization (EM)techniques is exploited for GMM to find the best clustersin the training data. In this technique, πjc, µjc and
∑jc that
denote weight, mean vector and covariance matrix of a givenj-th cluster for class C, respectively, are updated iterativly inthe following steps:
γjc(x) =πjcN(x|µjc,
∑jc)∑n
i=1 πicN(x|µic,∑
ic)(3)
µjc =
∑Nc
i=1 γjc(xi)xi∑Nc
i=1 γjc(xi)(4)
∑jc
=
∑Nc
i=1 γjc(xi)(xi − µjc)(xi − µjc)T∑Nc
i=1 γjc(xi)(5)
πjc =
∑Nc
i=1 γjcNc
(6)
where Nc shows the number of objects in class C.
CAP-AVOD frameworkThe CAP-AVOD framework contains three networks; (i)encoder-decoder network, (ii) Region Proposal Network(RPN) and (iii) final detection and pose estimation network.We trained two encoder-decoder networks (Lin et al. 2017)which output two feature maps, one for RGB image andone for BEV map. The use of bottom-up decoder for fea-ture extraction enables the generated feature map to retain
the global and local information of the input tensor. Similarto multi-stage 2D object detectors, the RPN is also fed byproposed anchors. The proposed anchors are cropped andresized from the RGB and BEV feature maps and the re-sulted tensors are fused to maintain the information fromtwo sources. Based on the proposed anchors, RPN generatesRegion Of Interests (ROIs). The selected ROIs cover the re-gions which contains the desired objects to be detected. Thefinal detection and pose estimation network regresses theoffset of selected ROIs and determines the class categoriesof each ROI. The architecture of CAP-AVOD is illustratedin Figure 1.
Model evaluationThe evaluation of the model is conducted in three aspects.First, we evaluate the anchoring process and compute howwell the proposed anchors cover the objects of interest. Sec-ond, the performance of RPN is evaluated by computing therecall number based on the selected ROIs and ground truthobjects. Third, the overall performance of the model is stud-ied according to 3D Average Precision (AP ). As it is noted,the proposed anchors fed into the model is modified in theRPN to cover the objects in the 3D space. This process indi-cates the significance of anchor proposal method for objectdetection task. If the proposed anchors cover a good portionof objects in the 3D space, the RPN modifies the anchors ef-ficiently with small amount of offset and the probability ofmissing objects reduces remarkably.
In order to evaluate the anchoring of the 3D space, thefraction of ground truth object overlapped by the anchors iscomputed. According to Figure 2, the overlapped area Equa-tion .7 is calculated by division of maximum overlapped areaof the ground truth object (Amax) by the entire area of theground truth object (AGT ). The area of the objects and an-chors are computed in 2D as they are considered in BEV.
Overlapped Area =Amax
AGT(7)
Ground Truth
Amax
Anchor
Figure 2: Overlapped area of ground truth box and proposedanchor.
Results and DiscussionThe KITTI training data set is split into a training set anda validation set (using roughly a 50-50 split) following theprocess mentioned in (Xu, Anguelov, and Jain 2017; Chenet al. 2017). All the evaluation of proposed CAP and AVODframework is performed on validation set.
Anchoring evaluationThe anchoring process in multi-stage object detectors pro-poses the potential locations of the objects that is tuned bythe RPN to focus the attention of the last network to thoseregions. Therefore, the model does not need to explore theentire area to detect the objects which significantly reducesthe computational cost. Hence, proposing anchors that cov-ers descent portion of the objects enables the RPN and finaldetection and pose estimation network to predict and clas-sify objects more accurately and regress the ROIs more ef-ficiently (Ren et al. 2015; He et al. 2017). Accordingly, forthe proposed anchors fed to RPN that does not significantlycover the object of interest the model can not detect the ob-jects in the later stages. This effect shows that the multi-stage object detector requires an efficient and smart anchor-ing process which reduces the computational cost allowingreal-time inference and also reduces the probability of miss-ing objects leading to the improvement in recall of the 3DRegion Proposal Network.
In order to evaluate the anchoring effect we have com-puted the overlapped area of ground truth and anchors pro-posal by the proposed CAP in the validation set for vari-ous number of cluster n used in K-mean clustering method.Figure 3 illustrates the normalized distribution of the over-lapped area of ground truth and proposed anchors for differ-ent numbers of clusters in the classes of cyclist and pedes-trian. In this Figure, we calculated the overlapped area ofground truth objects in the validation set according to Equa-tion 7 and plotted its histogram distribution for each class.As it can be noted, the distribution in Figure 3 (a) shows thatthe proposed anchors for n = 1 mostly overlapped 50% to65% of the ground truth objects which makes it more dif-ficult for RPN and final detection network to capture theobjects. However, this trend changes significantly as we in-crease the number of groups (n) in K-mean clustering algo-rithm. Figure 3 (d) and (e) show the overlapped area distri-bution for n = 4 and n = 5, respectively. The results showthat significant amount of proposed anchors and objects areoverlapped above 85% with high number of clusters duringanchoring process that reduces the probability of the missedobjects by the model. This effect can also be observed onrecall number of RPN and Average Precision of the entiremodel in next sections.
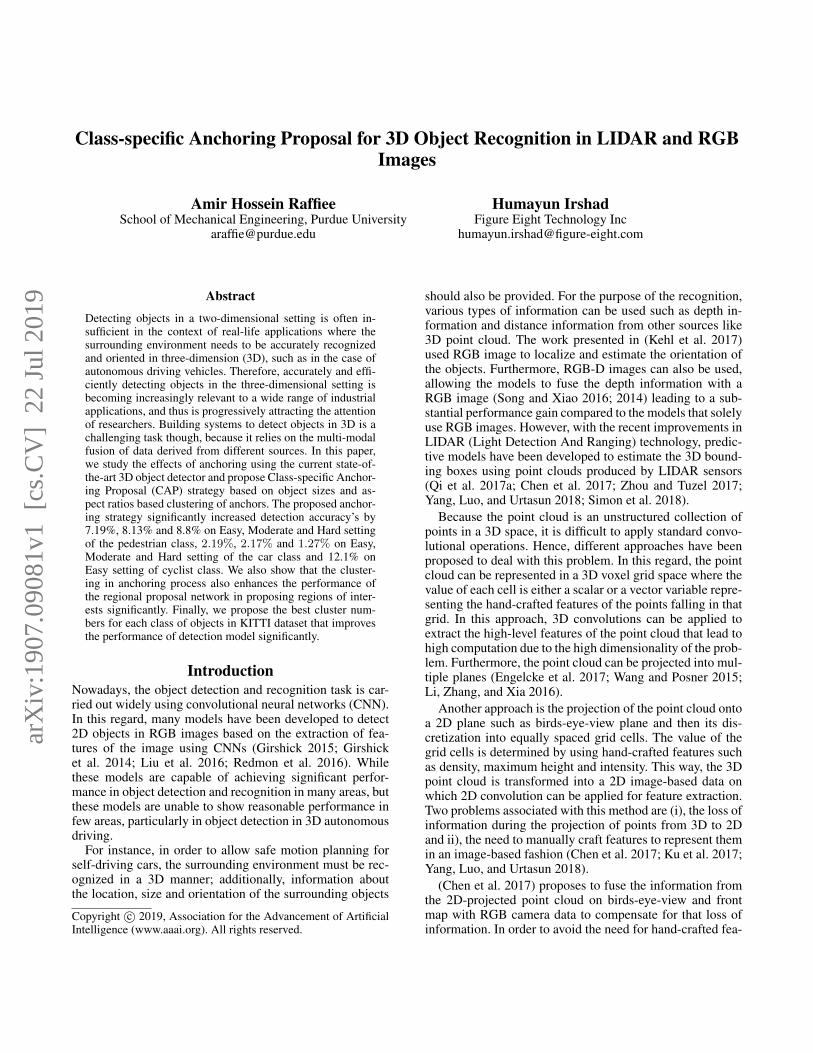
Region Proposal Network EvaluationAs it was mentioned before, the RPN modifies and adjuststhe proposed anchors to bring the attention of the last net-work toward the areas where the desired objects are located.Hence, for the object which is missed in the CAP the RPNfails to propose the ROI that contains that object and conse-quently the last network also fails to detect it. Therefore, it isextremely important that the ROIs proposed by the RPN cap-ture the potential areas where the desired objects are locatedwhich allows the last network to modify and offset the ROIseasier and detect the objects accurately. Figure 4 shows 3Dproposed ROIs by the RPN for cyclist and pedestrians in theimage. In this regard, the performance of the RPN is evalu-ated by computing the recall according to the proposed ROIsand the ground truth objects.
(a) 1 Cluster of K-Mean Clustering (n=1)
(b) 2 Clusters of K-Mean Clustering (n=2)
(c) 3 Clusters of K-Mean Clustering (n=3)
(d) 4 Clusters of K-Mean Clustering (n=4)
(e) 5 Clusters of K-Mean Clustering (n=5)
Figure 3: Histogram distribution of overlapped area betweenground truth box and anchor proposal for Cyclist and Pedes-trian objects for different number of K-Mean Clusters as (a)n = 1, (b) n = 2, (c) n = 3, (d) n = 4 and (e) n = 5 wheren is the number of clusters/groups for K-mean clusteringmethod. The x-axis represent the percentage overlapped areabetween ground truth box and anchor proposal.
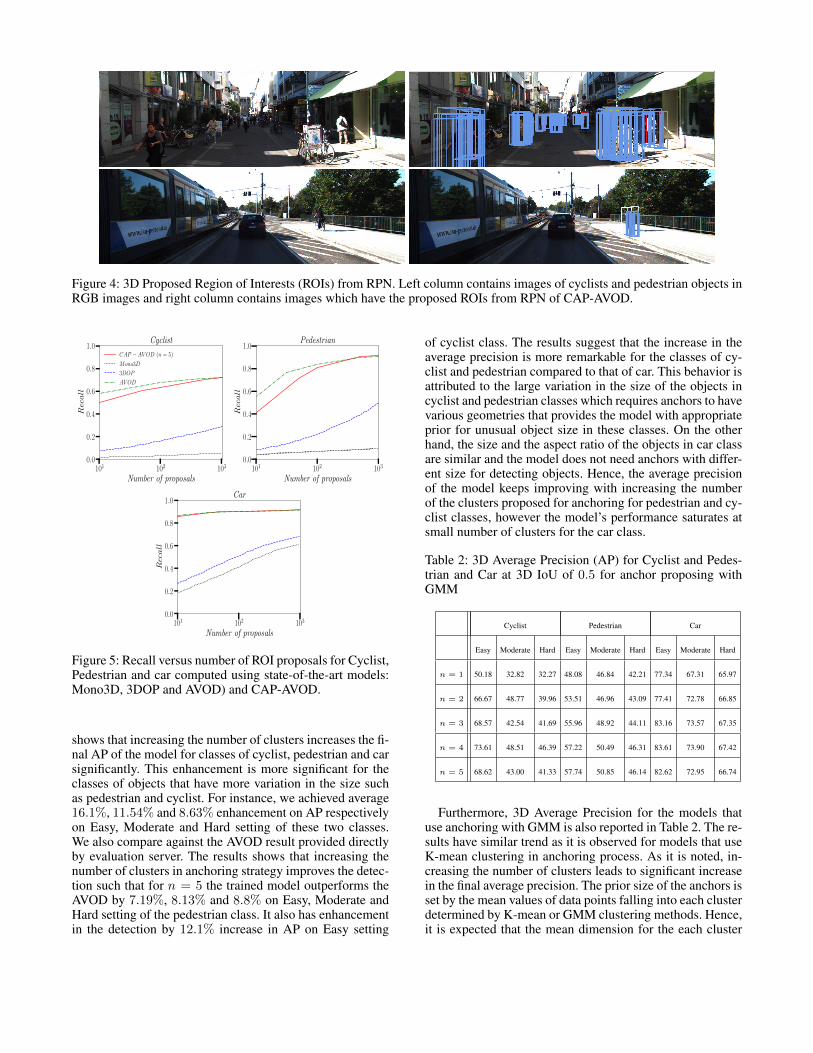
Figure 5 shows recall as function of ROI proposals num-ber by RPN for Mono3D (Chen et al. 2016), 3DOP (Chenet al. 2015), AVOD and CAP-AVOD framwork. For com-puting recall of CAP-AVOD, we set the number of clustersto 5 (n = 5) in anchoring process. The recall is computedbased on 0.5 3D Intersection-Over-Union (IoU) thresholdfor classes of cyclist, pedestrian and car.
According to this figure, there is a significant gap betweenrecall numbers of CAP-AVOD and Mono3D and 3DOP. Forinstance, recall for Cyclist class reaches to 49.8% at 10 pro-posals of CAP-AVOD, while the recall for 3DOP is 29% at1000 proposals. Similar trend exists for the class of Pedes-trian in which the maximum recall that 3DOP achieves at1000 proposals can be gained with AVOD with 10 proposals.Furthermore, the RPN in CAP-AVOD reaches to the recallof 90.5% at 1024 proposals for pedestrian which shows thesignificant enhancement in proposing ROIs in CAP-AVOD.The significant improvement of the recall for the class of thecar is also observed in this figure where the recall reaches91.3% at 1024 ROIs. Comparison between AVOD and CAP-AVOD indicates that at low number of ROI proposals stillAVOD has higher recall for class of cyclist and pedestrians,while with 1024 ROI proposals the recall of the CAP-AVODis higher than the AVOD by 2% for cyclist and have thesame value for pedestrian and car classes.
Object Detection EvaluationAs it has been shown in above sections, increasing the num-ber of clusters in CAP strategy, improved the overlappedarea of proposed regions with the ground truth objects andrecall of the RPN significantly. In this section we report theresult of 3D object detection with CAP-AVOD and com-pare with other state-of-the-art methods (F-PointNet(Qi etal. 2017c), VoxelNet(Zhou and Tuzel 2017) and AVOD(Kuet al. 2017)). Table 1 shows the Average Precision (AP) of3D object detection for pedestrian, cyclist and car for an-chor proposing using K-mean clustering method. The result
Table 1: 3D Average Precision (AP) for Cyclist and Pedes-trian and Car at 3D IoU of 0.5
Cyclist Pedestrian Car
Easy Moderate Hard Easy Moderate Hard Easy Moderate Hard
Figure 4: 3D Proposed Region of Interests (ROIs) from RPN. Left column contains images of cyclists and pedestrian objects inRGB images and right column contains images which have the proposed ROIs from RPN of CAP-AVOD.
101 102 103
Number of proposals
0.0
0.2
0.4
0.6
0.8
1.0
Rec
all
Cyclist
CAP − AV OD (n = 5)
Mono3D
3DOP
AV OD
101 102 103
Number of proposals
0.0
0.2
0.4
0.6
0.8
1.0
Rec
all
Pedestrian
101 102 103
Number of proposals
0.0
0.2
0.4
0.6
0.8
1.0
Rec
all
Car
Figure 5: Recall versus number of ROI proposals for Cyclist,Pedestrian and car computed using state-of-the-art models:Mono3D, 3DOP and AVOD) and CAP-AVOD.
shows that increasing the number of clusters increases the fi-nal AP of the model for classes of cyclist, pedestrian and carsignificantly. This enhancement is more significant for theclasses of objects that have more variation in the size suchas pedestrian and cyclist. For instance, we achieved average16.1%, 11.54% and 8.63% enhancement on AP respectivelyon Easy, Moderate and Hard setting of these two classes.We also compare against the AVOD result provided directlyby evaluation server. The results shows that increasing thenumber of clusters in anchoring strategy improves the detec-tion such that for n = 5 the trained model outperforms theAVOD by 7.19%, 8.13% and 8.8% on Easy, Moderate andHard setting of the pedestrian class. It also has enhancementin the detection by 12.1% increase in AP on Easy setting
of cyclist class. The results suggest that the increase in theaverage precision is more remarkable for the classes of cy-clist and pedestrian compared to that of car. This behavior isattributed to the large variation in the size of the objects incyclist and pedestrian classes which requires anchors to havevarious geometries that provides the model with appropriateprior for unusual object size in these classes. On the otherhand, the size and the aspect ratio of the objects in car classare similar and the model does not need anchors with differ-ent size for detecting objects. Hence, the average precisionof the model keeps improving with increasing the numberof the clusters proposed for anchoring for pedestrian and cy-clist classes, however the model’s performance saturates atsmall number of clusters for the car class.
Table 2: 3D Average Precision (AP) for Cyclist and Pedes-trian and Car at 3D IoU of 0.5 for anchor proposing withGMM
Cyclist Pedestrian Car
Easy Moderate Hard Easy Moderate Hard Easy Moderate Hard
Furthermore, 3D Average Precision for the models thatuse anchoring with GMM is also reported in Table 2. The re-sults have similar trend as it is observed for models that useK-mean clustering in anchoring process. As it is noted, in-creasing the number of clusters leads to significant increasein the final average precision. The prior size of the anchors isset by the mean values of data points falling into each clusterdetermined by K-mean or GMM clustering methods. Hence,it is expected that the mean dimension for the each cluster
Figure 6: Result of 3D Object Detection using RGB images and LIDAR Point Cloud with AVOD and CAP-AVOD frameworks.Left column contains images which show 3D detected object with AVOD framework (Ku et al. 2017). Right column containsimages which show 3D detected objects with CAP-AVOD framework.
is far from the dimensions of the objects with abnormal sizeand aspect ratio. Therefore, these objects are missed in thefinal detection. This behavior is attributed to the presence ofthe objects with abnormal sizes in cyclist class which are notsimilar to the majority of objects in this class. It explains thedrop in the AP on moderate and hard setting of cyclist classfor n = 5 compared to that of AVOD model. Furthermore,if we want to have anchors with similar size to those withunusual dimensions we should set larger number of clustersin clustering method which increases the number of the an-chors significantly leading to higher computation. Further-more, we show the performance of the model on the class ofcar. As it is noted, the AP increases by 2.19%, 2.17% and1.27% on Easy, Moderate and Hard settings of car class,respectively. This maximum AP occurs for n = 2 that iscaused by the fact that the size distribution of the objects incar class can be clustered better with n = 2 compared toother number of clusters. Figure 6 shows the effect of an-choring on the final detection. According to this figure thedetection of the pedestrians and cyclist has been improvedsignificantly. Hence, our results suggest that n = 2 is an ap-propriate cluster number for proposing anchors for the classof the cars, while n = 5 is the best cluster number for theclasses of cyclist and pedestrian as it enables the model toboost its performance significantly.
Conclusions and Future WorkIn this paper, we propose class specific anchoring proposalstrategy to improve the 3D object detection with AVODframework. The proposed anchoring strategy used K-Meanand GMM clustering for each class of object which in-creased the AP of 3D object detection in combined RGBand point cloud data set (KITTI) by 7.19%, 8.13% and 8.8%
on Easy, Moderate and Hard setting of the pedestrian classand 12.1% on Easy setting of cyclist class. We also illus-trate that the clustering in anchoring process also enhancesthe performance of the RPN in proposing ROIs significantly.We conclude that n = 2 is an appropriate cluster number inproposing anchors for the class of the cars, while n = 5 isthe best cluster number for the classes of cyclist and pedes-trian as it enables the model to boost its performance signif-icantly. In future work, we intend to study the performanceof single-stage object detectors and compare them to multi-stage object detectors with the hope to further improve theAP.
ReferencesChen, X.; Kundu, K.; Zhu, Y.; Berneshawi, A. G.; Ma, H.;Fidler, S.; and Urtasun, R. 2015. 3d object proposals foraccurate object class detection. In Advances in Neural In-formation Processing Systems, 424–432.
Chen, X.; Kundu, K.; Zhang, Z.; Ma, H.; Fidler, S.; andUrtasun, R. 2016. Monocular 3d object detection for au-tonomous driving. In Proceedings of the IEEE Conferenceon Computer Vision and Pattern Recognition, 2147–2156.
Chen, X.; Ma, H.; Wan, J.; Li, B.; and Xia, T. 2017. Multi-view 3d object detection network for autonomous driving.In IEEE CVPR, volume 1, 3.
Engelcke, M.; Rao, D.; Wang, D. Z.; Tong, C. H.; and Pos-ner, I. 2017. Vote3deep: Fast object detection in 3d pointclouds using efficient convolutional neural networks. InRobotics and Automation (ICRA), 2017 IEEE InternationalConference on, 1355–1361. IEEE.
Geiger, A.; Lenz, P.; Stiller, C.; and Urtasun, R. 2013. Vision
meets robotics: The kitti dataset. The International Journalof Robotics Research 32(11):1231–1237.Girshick, R.; Donahue, J.; Darrell, T.; and Malik, J. 2014.Rich feature hierarchies for accurate object detection and se-mantic segmentation. In Proceedings of the IEEE confer-ence on computer vision and pattern recognition, 580–587.Girshick, R. 2015. Fast r-cnn. In Proceedings of the IEEEinternational conference on computer vision, 1440–1448.He, K.; Gkioxari, G.; Dollar, P.; and Girshick, R. 2017.Mask r-cnn. In Computer Vision (ICCV), 2017 IEEE In-ternational Conference on, 2980–2988. IEEE.Kehl, W.; Manhardt, F.; Tombari, F.; Ilic, S.; and Navab, N.2017. Ssd-6d: Making rgb-based 3d detection and 6d poseestimation great again. In Proceedings of the InternationalConference on Computer Vision (ICCV 2017), Venice, Italy,22–29.Ku, J.; Mozifian, M.; Lee, J.; Harakeh, A.; and Waslander,S. 2017. Joint 3d proposal generation and object detectionfrom view aggregation. arXiv preprint arXiv:1712.02294.Li, B.; Zhang, T.; and Xia, T. 2016. Vehicle detection from3d lidar using fully convolutional network. arXiv preprintarXiv:1608.07916.Lin, T.-Y.; Dollar, P.; Girshick, R. B.; He, K.; Hariharan, B.;and Belongie, S. J. 2017. Feature pyramid networks forobject detection. In CVPR, volume 1, 4.Liu, W.; Anguelov, D.; Erhan, D.; Szegedy, C.; Reed, S.; Fu,C.-Y.; and Berg, A. C. 2016. Ssd: Single shot multiboxdetector. In European conference on computer vision, 21–37. Springer.Qi, C. R.; Liu, W.; Wu, C.; Su, H.; and Guibas, L. J. 2017a.Frustum pointnets for 3d object detection from rgb-d data.arXiv preprint arXiv:1711.08488.Qi, C. R.; Su, H.; Mo, K.; and Guibas, L. J. 2017b. Point-net: Deep learning on point sets for 3d classification and seg-mentation. Proc. Computer Vision and Pattern Recognition(CVPR), IEEE 1(2):4.Qi, C. R.; Yi, L.; Su, H.; and Guibas, L. J. 2017c. Point-net++: Deep hierarchical feature learning on point sets in ametric space. In Advances in Neural Information ProcessingSystems, 5099–5108.Redmon, J.; Divvala, S.; Girshick, R.; and Farhadi, A. 2016.You only look once: Unified, real-time object detection. InProceedings of the IEEE conference on computer vision andpattern recognition, 779–788.Ren, S.; He, K.; Girshick, R.; and Sun, J. 2015. Faster r-cnn:Towards real-time object detection with region proposal net-works. In Advances in neural information processing sys-tems, 91–99.Simon, M.; Milz, S.; Amende, K.; and Gross, H.-M. 2018.Complex-yolo: Real-time 3d object detection on pointclouds. arXiv preprint arXiv:1803.06199.Song, S., and Xiao, J. 2014. Sliding shapes for 3d objectdetection in depth images. In European conference on com-puter vision, 634–651. Springer.
Song, S., and Xiao, J. 2016. Deep sliding shapes for amodal3d object detection in rgb-d images. In Proceedings of theIEEE Conference on Computer Vision and Pattern Recogni-tion, 808–816.Wang, D. Z., and Posner, I. 2015. Voting for voting in on-line point cloud object detection. In Robotics: Science andSystems, volume 1.Xu, D.; Anguelov, D.; and Jain, A. 2017. Pointfusion: Deepsensor fusion for 3d bounding box estimation. arXiv preprintarXiv:1711.10871.Yang, B.; Luo, W.; and Urtasun, R. 2018. Pixor: Real-time3d object detection from point clouds. In Proceedings of theIEEE Conference on Computer Vision and Pattern Recogni-tion, 7652–7660.Zhou, Y., and Tuzel, O. 2017. Voxelnet: End-to-end learningfor point cloud based 3d object detection. arXiv preprintarXiv:1711.06396.