14
| Date post: | 21-Dec-2015 |
| Category: |
Documents |
| View: | 215 times |
| Download: | 2 times |


Classical tree view of cell cycle data
(Spellman, et al. 1998. MolBiolCell 9, 3273)

VxInsight topography of cell-cycle data
G1
SM

Strong similarities show relationships among clusters

Genome-scale datasets available in Genome-scale datasets available in yeast:yeast:
•Essential genes
•Essential genes since 1998•Several microarray datasets
•Protein-protein interactions
How can we learn How can we learn more from this more from this analysis?analysis?

Stationary-phase genes are not essential
Essential genes Newly identified essential genes
Ribosome ridge
Essential genes as a function of gene expression: Essential genes as a function of gene expression: what does it tell us?what does it tell us?
Assumptions; biases; potentially new, useful targets, how cells “protect” themselves; evolution, etc.

Are G1-regulated genes clustered during exit from stationary phase?
Comparison of gene-expression datasetsto test hypotheses
Cell cycle Exit from stationary phase

What might this say?
Exit from stationary phase is either:
1) not a synchronous process with respect to the cell cycle. 2) a cell-cycle process that requires a subset of cell-cycle genes
Exit from stationary phase
Cell cycle
•If this is true, the two processes may be sensitive to different toxins.
•This has important implications in treatment of infectious diseasesif the infectious agent spends a great deal of time in the quiescent state
•This may also help us understand why unculturable microorganisms can’t exitstationary phase

Protein -interaction networks as a function of gene expressionProtein -interaction networks as a function of gene expression
Schwikowski’s data Ito full dataset
Interactions common to both Genes common to both
Conclusions:1. Interactions do not generally
follow expression patterns2. Few interactions common to
both datasets3. Need to look at specific clusters,
known interactions to determine whether one dataset should be accepted or whether the data should be combined

A B
Interactions in ribosome ridgeC
Similarity in gene expressionExit from stationary phase’Ribosome ridge. 290 genes
Conclusion:Two-hybrid methods don’t “see” interactions between ribosomal proteinsIn fact, there may not be many interactions among ribosomal proteins – so this may be the strongest evidence for the lack of false positives in this analysis

Summary:Summary:
Visualization of the datasets enables a more Visualization of the datasets enables a more intuitive approach and speeds hypothesis intuitive approach and speeds hypothesis developmentdevelopment
Visual comparison of genome-scale datasets supports:Visual comparison of genome-scale datasets supports:
Identification of biases and assumptions in our methodsIdentification of biases and assumptions in our methods
Faster and broader evaluation of the datasetsFaster and broader evaluation of the datasets
Novel insights into biological processes Novel insights into biological processes new and more new and more focused questions focused questions

The Biological Process: the yeast cell cycle
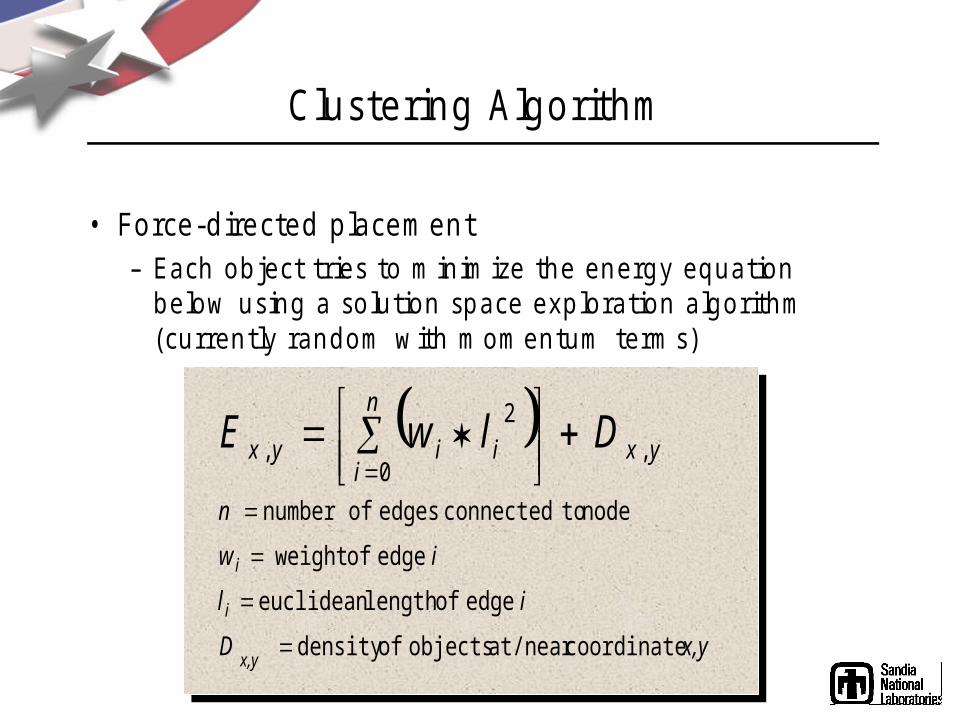
Clustering Algorithm
• Force-directed placement– Each object tries to minimize the energy equation
below using a solution space exploration algorithm (currently random with momentum terms)
coordinateat/near objects ofdensity
edge oflength euclidean
edge of weight
node toconnected edges ofnumber
,0
2
,
x,yD
il
iw
n
yx
n
iiiyx
x,y
i
i
DlwE

Ribosome ridge
Stationary-Phase genes
VxInsight clustering of exit from stationary phase data:T=0, 15, 30, 45, and 60 minutes after re-feeding


