Classification and Simulation based Design of 3D Junctions in Castings D Joshi S G S Institute of Technology and Science, Indore, MP, India B Ravi Indian Institute of Technology, Bombay, India Copyright 2009 American Foundry Society ABSTRACT Many casting defects, which cannot be eliminated by changes to tooling and process parameters, can be attributed to poor design of the part with respect to manufacturability. One such common defect is shrinkage porosity occurring at casting junctions. We present a generic classification of 3D casting junctions in terms of the number, thickness and cross-section of converging elements (walls), and the angle between pairs of elements. These junctions have been modeled, and simulated for solidification to predict the extent of shrinkage porosity defect using Vector Element Method. The results are shown for 'L' junctions with varying fillet radius (both inner and outer) and validated by experiments, followed by parametric analysis to formulate design for manufacture guidelines. Finally, a benchmark part with 3D junctions is presented to show how simulation can be used to predict and prevent the defect by modifying the junction design. INTRODUCTION A casting junction is an abrupt increase in local thickness caused by meeting of two or more elements (walls) resulting in regions of high thermal concentration. Molten metal at the junction cools slowly, leading to shrinkage porosity defects. The size and extent of defect region depends on the thickness and number of elements, and the angle between them, all of which affect the rate of heat transfer from the casting. The defect can be avoided by method design changes such as placing a riser above the junction, or a chill below the junction. These however, add to the cost of production and may not always be feasible owing to other constraints in tooling design. A better alternative is to modify the junctions to minimize such problems before freezing the part design, assuming its functional requirements are satisfied. Fig. 1 Porosity defects in standard junctions and guidelines for minimizing the defect 1 Solidification problems in junctions and design guidelines to reduce them have been reported for more than four decades. Casting Design Handbook 1 illustrates the potential of reducing the shrinkage porosity defect in 'L', 'V', 'T', 'Y’, and 'X' junctions by minor changes to design (Figure 1). These include adding fillets, reducing the number or thickness of elements, and placing a central cored hole. Caine established relationships between fillet radius, stress concentration and thermal gradients and derived fourteen rules for minimum stress concentration and maximum castability for casting shapes varying from a straight junction (abrupt change in cross-section area) to complex junctions such as ‘X-T’. 2 Kotshi and Loper extended Chvorinov’s modulus approach for determining the sequence of solidification, important for feeder placement close
Transcript
Classification and Simulation based Design of 3D Junctions in Castings
D Joshi S G S Institute of Technology and Science, Indore, MP, India
B Ravi
Indian Institute of Technology, Bombay, India
Copyright 2009 American Foundry Society ABSTRACT Many casting defects, which cannot be eliminated by changes to tooling and process parameters, can be attributed to poor design of the part with respect to manufacturability. One such common defect is shrinkage porosity occurring at casting junctions. We present a generic classification of 3D casting junctions in terms of the number, thickness and cross-section of converging elements (walls), and the angle between pairs of elements. These junctions have been modeled, and simulated for solidification to predict the extent of shrinkage porosity defect using Vector Element Method. The results are shown for 'L' junctions with varying fillet radius (both inner and outer) and validated by experiments, followed by parametric analysis to formulate design for manufacture guidelines. Finally, a benchmark part with 3D junctions is presented to show how simulation can be used to predict and prevent the defect by modifying the junction design. INTRODUCTION A casting junction is an abrupt increase in local thickness caused by meeting of two or more elements (walls) resulting in regions of high thermal concentration. Molten metal at the junction cools slowly, leading to shrinkage porosity defects. The size and extent of defect region depends on the thickness and number of elements, and the angle between them, all of which affect the rate of heat transfer from the casting. The defect can be avoided by method design changes such as placing a riser above the junction, or a chill below the junction. These however, add to the cost of production and may not always be feasible owing to other constraints in tooling design. A better alternative is to modify the junctions to minimize such problems before freezing the part design, assuming its functional requirements are satisfied.
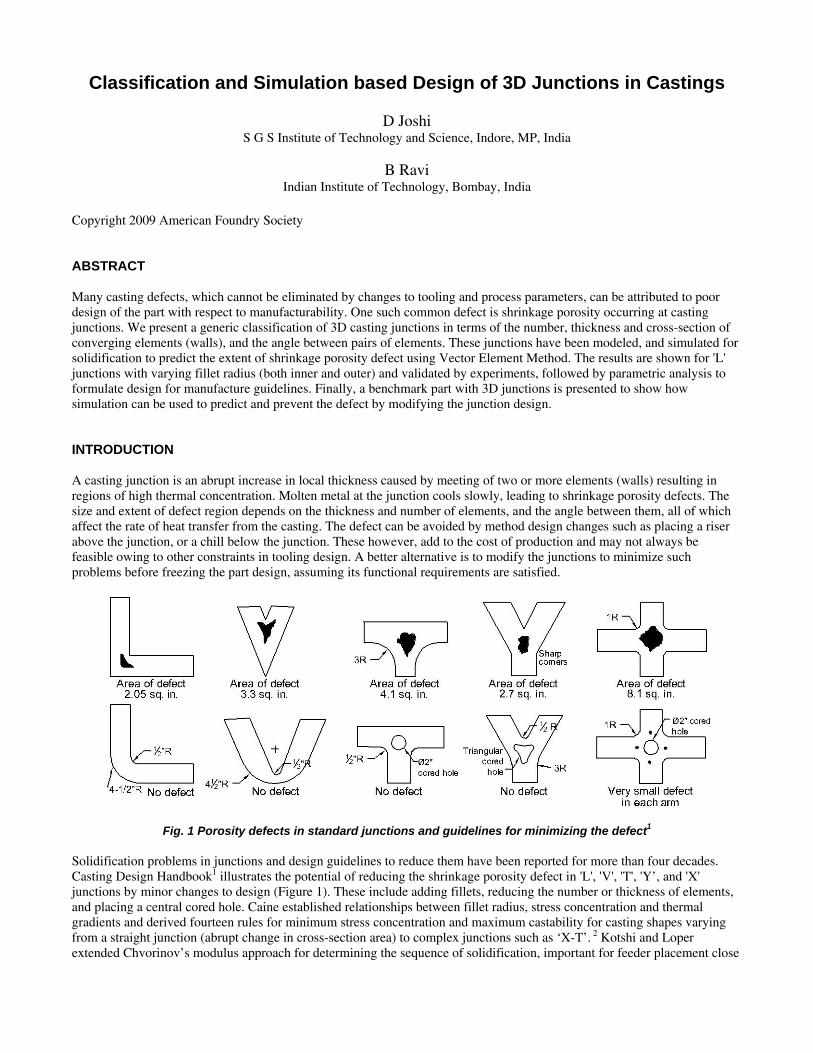
Fig. 1 Porosity defects in standard junctions and guidelines for minimizing the defect1 Solidification problems in junctions and design guidelines to reduce them have been reported for more than four decades. Casting Design Handbook1 illustrates the potential of reducing the shrinkage porosity defect in 'L', 'V', 'T', 'Y’, and 'X' junctions by minor changes to design (Figure 1). These include adding fillets, reducing the number or thickness of elements, and placing a central cored hole. Caine established relationships between fillet radius, stress concentration and thermal gradients and derived fourteen rules for minimum stress concentration and maximum castability for casting shapes varying from a straight junction (abrupt change in cross-section area) to complex junctions such as ‘X-T’. 2 Kotshi and Loper extended Chvorinov’s modulus approach for determining the sequence of solidification, important for feeder placement close
to the last solidifying region. They generated plots depicting solidification sequence for 'L',' T', and 'X' junctions. They also constructed these charts for varying fillet radius and considering the effect of chills.3,4 Experimental analysis of solidification front was conducted by Kim, which included a series of castings with V-junctions by decanting the liquid at various stages of solidification. They showed that progress in solidification front is faster with increasing interior angle of V-junction.5 The reported DFM guidelines are mainly applicable to 2D and 2.5D (axi-symmetric) castings with simple junctions listed above. Castings with complex shapes require numerical simulation of solidification sequence to predict the location and extent of shrinkage porosity defects. Finite element method, finite difference method, and boundary element methods have been employed for this purpose. 6 In general, solidification simulation is employed by tooling and foundry engineers to optimize the method design (feeding and gating design). The programs require a good understanding of CAD and numerical modeling, and the results are sensitive to even minor changes in material properties and meshing techniques. 7 This limits its usage by design engineers. An alternate technique for predicting shrinkage porosity defects has been reported by Ravi and Srinivasan.8,9 This is based on determining the direction of the largest thermal gradient at any point inside the casting, given by the vector sum of flux vectors from the point in all directions. The Vector Element Method (VEM) has been validated by a number of industrial case studies. It is found to be faster as well as easier to use compared to other simulation methods. 10-12 This work explores the application of VEM-based casting solidification simulation for improving junction designs to minimize shrinkage porosity defects. A generic classification of casting junctions is presented, applicable to both axi-symmetric and 3D shapes, considering section attributes, section orientation and additional geometrical features. The influence of minor changes in junction geometry on shrinkage porosity defect is analyzed by solidification simulation of L-junction castings with varying fillet radii. This is validated by experimental castings followed by radiography tests. A framework for evaluating junction designs is presented, including DFM guidelines for a 3D junction. A benchmark part with a 3D junction is taken up to illustrate the proposed methodology. CLASSIFICATION OF CASTING JUNCTIONS A general characterization of junctions with N number of elements (or walls) is proposed here, based on section attributes, section orientation, additional geometric features, and feedability properties (Figure 2). These are described here. (a) Section attributes (for each element)
• L - Length of element • t - Thickness of element • h - Height • r - Fillet radius
(b) Section orientation (for each element)
• θ, Φ - Angular references
(c) Additional geometric features
• A - Cross-section area • h/t - Extent of contact between adjacent element: • Cross-section type: (R) rectangular, (C) circular, (O) oval, (FF) freeform • Central hole (if present): shape, surface area • Plane orthogonal to junction: Number of such planes and their section properties, offset of such planes from junction
and their orientation
Fig. 2 Junction parameters and types
Fig. 3 Junction classification
From the above definition, junctions of two sections (‘V’ or ‘L’), three sections (‘Y’ or ’T’), and four sections (‘X’ or ‘K’) can be derived. Further, two dimensional variations with unequal thickness, unequal and non-orthogonal angles, fillet radius, and bar elements, as well as three dimensional variations with an additional element or with rotational geometry can be derived as shown in Figure 3. VECTOR ELEMENT METHOD Casting simulation is carried out using the Vector Element Method, which traces the feed metal paths in reverse to pinpoint the location of hot spots (Figure 4). It is based on the principle that the direction of the highest temperature gradient (feed metal path) at any point inside the casting is given by the vector sum of individual thermal flux vectors in all directions around the point. Multiple hot spots, if present, are detected by starting from several seed points.9
Fig. 4 VEM applied to L-junction
The method is based on determining the feed path passing through any point inside the casting and following the path back to the local hot spot. The feed path is assumed to lie along the maximum thermal gradient. The gradient can be determined from Fourier’s law of heat conduction as follows:
sTAKq ΔΔ−= Equation 1
( )wKG 1−= Equation 2
Where, sTG ΔΔ= / is the thermal gradient and, Aqw /= is the heat flux at given point inside the casting, in given
direction. The gradient (as well as the heat flux) is zero in a tangential direction to the isotherm passing through the point, and the maximum in perpendicular direction. The magnitude and direction of the maximum thermal gradient at any point inside the casting is proportional to the vector resultant of thermal flux vectors in all directions originating from that point. The casting volume is divided into a number of pyramidal sectors originating from the given point, each with a small solid
angle .β For each sector, the heat content (proportional to volume iV ) and cooling surface area iA are determined to
compute the flux vector ig .
i
ii A
Vgπβ
23
−= Equation 3
∑−=i
igG Equation 4
We take a step along the resultant flux vector, reach a new location and repeat the computation, until the resultant flux vector
G is less than a specified error limit. The final location is the hot spot. The locus of points along which iterations are carried
out is the feed path. The individual length of a resultant flux vector lying along the feed path denotes the thermal gradient at that location13. The average length of all flux vectors around a point denotes the temperature at that location.
The rates of heat transfer though different portions of casting/mould interface may not be the same. It is influenced by the presence of core, chill, insulating and exothermic sleeve and cover, re-entrant corner in mould and placement of gates. The
influence of the above parameters is considered by associating the affected surface with extension factor ef .
mm
bbe C
Cfρρ
= Equation 5
Where, bb C,ρ , mm C,ρ are density and specific heat of the adjacent body (core, chill etc.) and the mould, respectively. The
flux vector incorporating the extension factor is given by
i
iei A
Vfgπβ
23
= Equation 6
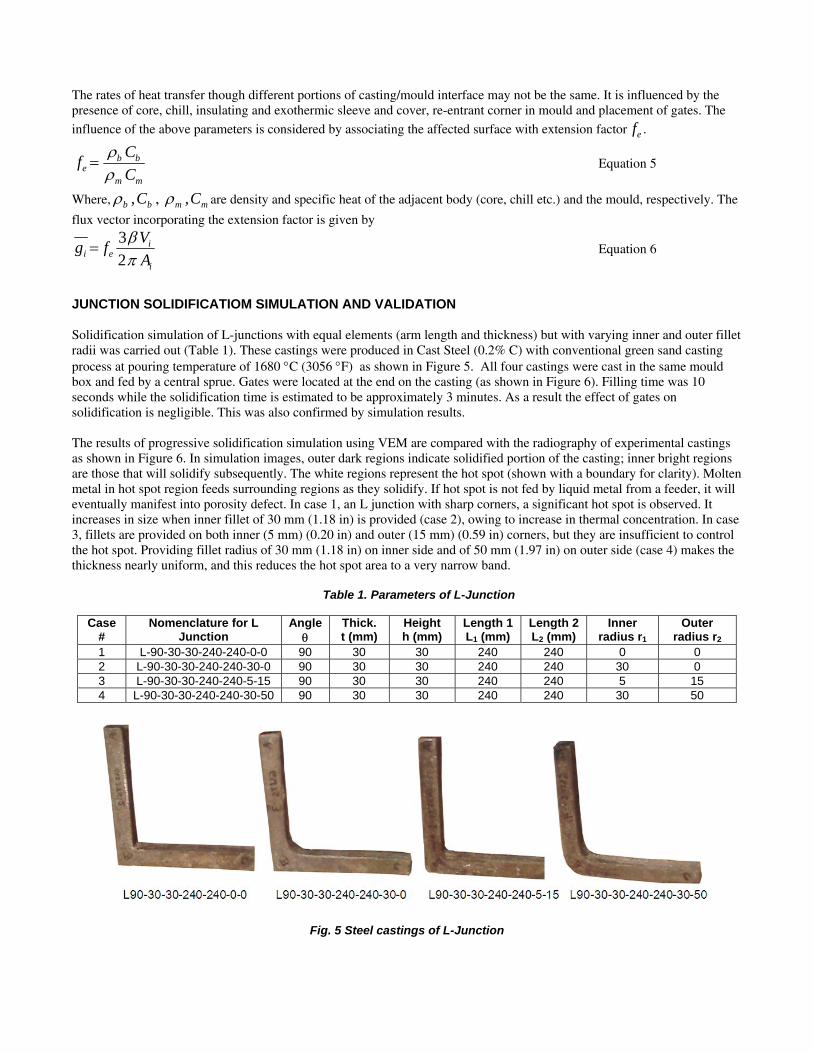
JUNCTION SOLIDIFICATIOM SIMULATION AND VALIDATION Solidification simulation of L-junctions with equal elements (arm length and thickness) but with varying inner and outer fillet radii was carried out (Table 1). These castings were produced in Cast Steel (0.2% C) with conventional green sand casting process at pouring temperature of 1680 °C (3056 °F) as shown in Figure 5. All four castings were cast in the same mould box and fed by a central sprue. Gates were located at the end on the casting (as shown in Figure 6). Filling time was 10 seconds while the solidification time is estimated to be approximately 3 minutes. As a result the effect of gates on solidification is negligible. This was also confirmed by simulation results. The results of progressive solidification simulation using VEM are compared with the radiography of experimental castings as shown in Figure 6. In simulation images, outer dark regions indicate solidified portion of the casting; inner bright regions are those that will solidify subsequently. The white regions represent the hot spot (shown with a boundary for clarity). Molten metal in hot spot region feeds surrounding regions as they solidify. If hot spot is not fed by liquid metal from a feeder, it will eventually manifest into porosity defect. In case 1, an L junction with sharp corners, a significant hot spot is observed. It increases in size when inner fillet of 30 mm (1.18 in) is provided (case 2), owing to increase in thermal concentration. In case 3, fillets are provided on both inner (5 mm) (0.20 in) and outer (15 mm) (0.59 in) corners, but they are insufficient to control the hot spot. Providing fillet radius of 30 mm (1.18 in) on inner side and of 50 mm (1.97 in) on outer side (case 4) makes the thickness nearly uniform, and this reduces the hot spot area to a very narrow band.
The defect area in radiography images of experimental castings is measured using CAD (AutoCAD®) software. The images are scaled with known dimensions, followed by tracing the defect boundary by spline curves and measuring its enclosed area. It is observed from the radiography images that the L-junction with sharp corners (case 1) results in porosity defect of 88 mm2 (0.136 in2) along with a crack. L-junction with 30 mm (1.18 in) inner radius and 0 mm outer radius (case 2) results in a larger defect area of 123 mm2 (0.190 in2). With inner fillet radius of 5 mm (0.20 in) and outer fillet radius of 15 mm (0.59 in), the defect area reduces to 61 mm2 (0.094 in2). There is only a small centerline porosity with inner fillet radius of 30 mm (1.18 in) and outer fillet radius of 50 mm (1.97 in) (case 4), the defect area reduced to 42 mm2 (0.065 in2). The location of shrinkage porosity defect predicted by solidification simulation matches those observed in all four experimental castings (radiography images). This also confirms that minor changes in junction geometry can help in minimizing the extent of porosity defect.
Fig. 6 Comparison of solidification simulation with radiography of castings
INFLUENCE OF JUNCTION PARAMETERS After establishing the reliability of solidification simulation using VEM, sensitivity analysis is presented here for the influence of individual junction parameters on the hot spot area measured in the junction region. The area of hot spot is the temperature range 1485-1650 °C (2705 - 3002 °F) (Figure 6). To understand the influence of a parameter, other parameters are kept at their nominal values (given below). Parameters considered are: (1) inner radius ‘r1’ (2) outer radius ‘r2’ (3) thickness ‘t’ (4) angle ‘θ’, and (5) length of junction ‘L’. These are indicated in Figure 7. Their nominal values are set as r1=0, r2=0, t=30 mm (1.18 in), θ=0°, and L=240 mm (9.45 in). The height h is set at 30 mm (1.18 in).
Fig. 7 Parameters of L junction
INNER RADIUS Inner radius (r1) is varied in steps of 15 mm (0.59 in) as 0, 15 mm (0.59 in), 30 mm (1.18 in), 45 mm (1.77 in) and 60 mm (2.36 in), keeping other parameters at nominal values mentioned above. The results of solidification simulation are shown in Figure 8. Hot spot area is calculated and given in Table 2. Figure 9 shows the variation of hot spot area as influenced by the inner radius. Larger the inner radius, more is the hot spot area. The area of hot spot can be estimated using second order polynomial equation obtained by curve fitting of the results (shown as dotted line in Figure 9). Y (hot spot area, mm2) = 0.075 r1
2 + 4.427 r1 + 73.54 Equation 7
Fig. 8 Solidification simulation with varying inner radius
Table 2. Hotspot Area with Varying Inner Radius
S. No. Inner radius 'r'1 (mm) Hot spot area (mm2)01 0 84 02 15 136 03 30 275 04 45 447 05 60 602
Fig. 9 Influence of inner radius on hot spot area OUTER RADIUS Outer radius r2 is varied in steps of 15 mm as 0 mm, 15 mm (0.59 in), 30 mm (1.18 in), 45 mm (1.77 in) and 60 mm (2.36 in), keeping other parameters at nominal values. The results of solidification simulation are shown in Figure 10. Hot spot area is calculated and given in Table 3. Figure 11 shows the variation of hot spot area as influenced by the outer radius. Larger the outer radius, lower is the hot spot area. The area of hot spot can be estimated using linear equation obtained by curve fitting of the results (shown as dotted line in Figure 11). Y (hot spot area in mm2) = - 1.406 r2 + 81.2 Equation 8
Fig. 10 Solidification simulation with varying outer radius
Table 3. Hotspot Area with Varying Outer Radius
S. No. Outer Radius 'r'2 (mm) Hot spot area (mm2)01 0 84 02 15 59 03 30 36 04 45 16 05 60 0
Fig. 11 Influence of outer radius on hot spot area
THICKNESS Thickness (t) is varied in steps of 6 mm (0.24 in) as 30 mm (1.18 in), 36 mm (1.42 in), 42 mm (1.65 in), 48 mm (1.89 in), 54 mm (2.13 in) and 60 mm (2.36 in), keeping other parameters at nominal values. The results of solidification simulation are shown in Figure 12. Hot spot area is calculated and given in Table 4. Figure 13 shows the variation of hot spot area as influenced by the thickness. Larger the thickness more is the hot spot area. The area of hot spot can be estimated using second order polynomial equation obtained by curve fitting of the results (shown as dotted line in Figure 13). Y (hot spot area in mm2) = 0.228 t2 – 12.91 t + 270.5 Equation 9
Fig. 12 Influence of thickness on hot spot area
Table 4. Hotspot Area with Varying Thickness
S. No. Thickness ‘t’ (mm) Hot spot area (mm2)01 30 84 02 36 107 03 42 136 04 48 170 05 54 234 06 60 321
Fig. 13 Influence of thickness on hot spot area
ANGLE Angle (θ) is varied in steps of 30 degrees as 30°, 60°, 90°, 120° and 150°, keeping other parameters at nominal values. The results of solidification simulation are shown in Figure 14. Hot spot area is calculated and given in Table 5. Figure 15 shows the variation of hot spot area as influenced by the angle ‘θ’. Larger the angle less is the hot spot area. The area of hot spot can be estimated using third order polynomial equation obtained by curve fitting of results (shown as dotted line in Figure 15). Y (defect area in mm2) = -0.0003 θ3 + 0.1153 θ2 – 13.9778 θ + 642.4 Equation 10
Fig. 14 Influence of angle on hot spot area
Table 5. Hotspot Area with Varying Angle
S. No. Angle ‘θ’ (°) Hot spot area (mm2)
01 30 319 02 60 143 03 90 84 04 120 50 05 150 26
Fig. 15 Influence of angle on hot spot area
LENGTH Length (L) is varied as 5 mm (0.20 in), 10 mm (0.39 in), 20 mm (0.79 in), 30 mm (1.18 in), 60 mm (2.36 in), and 90 mm (3.54 in), keeping other parameters at nominal values. The results of solidification simulation are shown in Figure 16. Hot spot area is calculated and given in Table 6. Figure 17 shows the variation of hot spot area as influenced by the length. A longer side results in larger hot spot area, but the effect is negligible if length is more than three times thickness. The area of hot spot can be estimated using fourth order polynomial equation obtained by curve fitting of results (shown as dotted line in Figure 17). Y (hot spot area in mm2) = -2.58E-06 L4 + 7.78E-04 L3 - 8.48E-02 L2 + 4.13 L - 2.32E-01 Equation 11
Fig. 16 Influence of length on hot spot
Table 6. Hotspot Area with Varying Length S. No. Angle ‘L’ (mm) Hot spot area (mm2)
Fig. 17 Influence of length on hot spot area The relative influences of various parameters can be compared using the ratio of percentage change in hot spot area (HSA) to the percentage change in volume of junction. Effectiveness of design change = % change in HSA / % change in volume of junction Equation 12 The design change that gives a high reduction in HSA for a low change in volume will be preferred (Table 7). Inner radius has the highest efficacy (up to 173) because even a small change in fillet radius affects the thermal concentration considerably. The efficacy of outer radius is up to 83, somewhat similar to inner radius. The efficacy of length is also high (75) but it sharply reduces and becomes steady after a value of 12, when section length exceeds three times thickness. Increase in thickness increases hot spot area, but this is associated with a large increase in volume as well; hence its efficacy is less (3-6). Similarly, the efficacy of angle is also less (between 3 and 4).
DFM GUIDELINES FOR 3D JUNCTIONS The conclusions of above analyses along with established guidelines can be used in a framework proposed for DFM of 3D junctions (Figure 18). A given junction is first classified (Figure 2 and 3) to identify the type of junction. Then VEM based solidification simulation is carried out and temperature contours are obtained. The hot spot area is measured and compared against a predefined limit (depending on the desired quality level). If the HSA is more than the set limit, junction DFM rule given in Table 8 are applied to modify the junction design, subject to functional requirements of the part being satisfied. The process is repeated.
Table 8. Junction DFM Rules
No DFM rule 01 Reduce the number of elements meeting at junction 02 Make thickness uniform for elements 03 Reduce inner fillet radius and inner chamfers 04 Increase interior angles (from acute to 90° or more) 05 Provide outer fillet radius or outer chamfer 06 Reduce the length of elements 07 Place a core at the middle of junction
Fig. 18 Junction redesign framework As an example, consider a 3D box corner junction (Figure 19). The original design consists of three plate elements meeting at a junction. Thicknesses of these elements are 50 mm (2.36 in), 30 mm (1.18 in) and 15 mm (0.59 in). Length of plates for all these elements is 240 mm (9.45 in). The material is aluminium LM-25. Solidification simulation is performed using VEM. The first revised design of box corner junction has uniform walls of 30mm (1.18 in) leading to over 90% reduction in HSA. This is associated with a volumetric change 14.21%. The effectiveness of this rule is 6.43. For seeking further improvement, three more designs of revised box corner junction are considered. These are: (1) uniform thickness along with a corner chamfer equal to thickness of plate, (2) uniform thickness along with a fillet radius equal to 50% thickness of plate, and (3) uniform thickness along with a fillet radius equal to 75% thickness of plate. These designs and their solidification simulations are shown in Figure 19. Highest effectiveness of 6.77 is obtained with box corner junction design having uniform thickness along with a corner chamfer (equal to the thickness of plate). Hence this design is proposed as the most effective DFM guideline for box corner junction design.
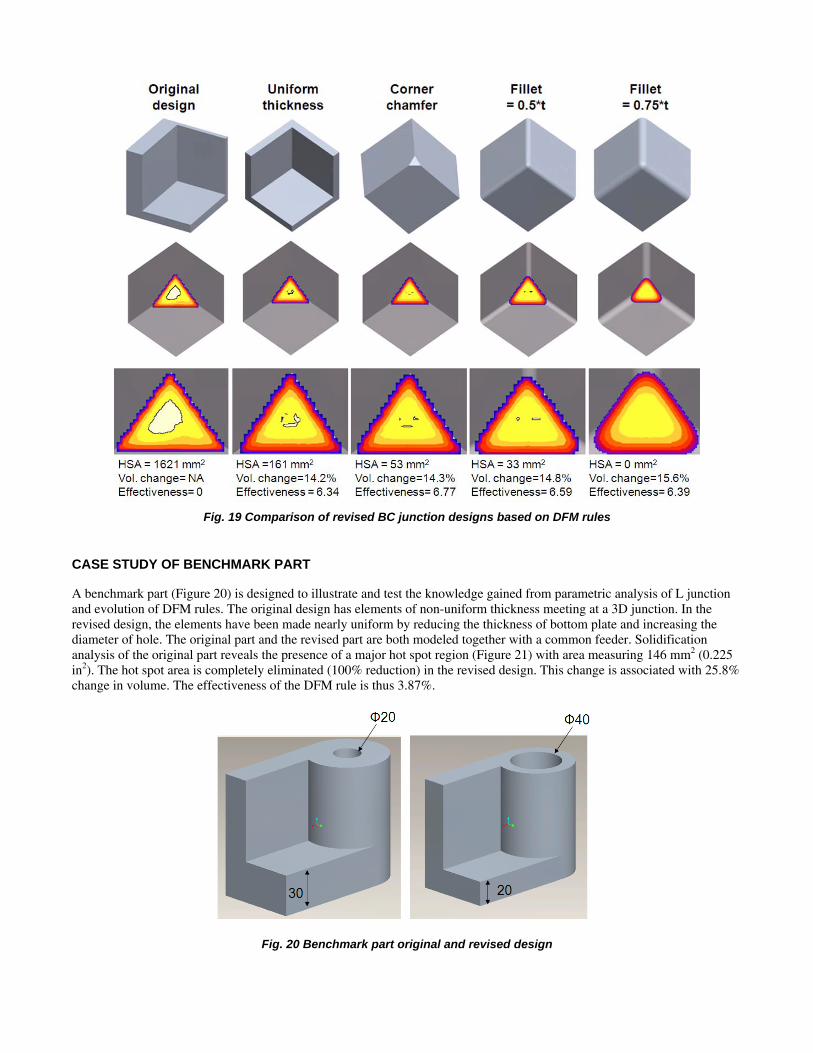
Fig. 19 Comparison of revised BC junction designs based on DFM rules CASE STUDY OF BENCHMARK PART A benchmark part (Figure 20) is designed to illustrate and test the knowledge gained from parametric analysis of L junction and evolution of DFM rules. The original design has elements of non-uniform thickness meeting at a 3D junction. In the revised design, the elements have been made nearly uniform by reducing the thickness of bottom plate and increasing the diameter of hole. The original part and the revised part are both modeled together with a common feeder. Solidification analysis of the original part reveals the presence of a major hot spot region (Figure 21) with area measuring 146 mm2 (0.225 in2). The hot spot area is completely eliminated (100% reduction) in the revised design. This change is associated with 25.8% change in volume. The effectiveness of the DFM rule is thus 3.87%.
Fig. 20 Benchmark part original and revised design
Fig. 21 Solidification analysis showing hotspot region in original part To validate the above results, castings were made of the original benchmark part and its revised version in cast steel (0.2% C) in the same mould box (Figure 22). The pouring temperature was 1680 °C (3056 °F). The shrinkage porosity defect is observed in the original part at the location of hot spot (Figure 23). The porosity is completely eliminated in the revised design (Figure 24) as predicted.
Fig. 22 Casting of benchmark part original and its revised version
Fig. 23 Hot spot and actual defect in casting for original design of benchmark part
Fig. 24 Revised casting with no shrinkage porosity defect
CONCLUSIONS Most of the castings can be viewed as an assemblage of junctions. 3D modeling and analysis of junctions helps in solving feeding problems in castings. Knowledge derived from the analysis of influence of geometrical parameters on hot spot area has been employed to formulate DFM guidelines for junctions. The ratio of percentage change is hot spot area to percentage change in volume is proposed for evaluating the effectiveness of various DFM rules. While comparing the alternative DFM rules for 3D box corner junction, the rule of uniform thickness combined with corner chamfer equal to the thickness of plate is shown to minimize the problem of shrinkage porosity. The methodology was further established by the taking up a benchmark part and validating the design improvement with experimental casting. In general, all junctions in a casting should be identified, classified and re-designed using the applicable DFM rules. Further work can be taken up to formulate and evaluate DFM guidelines for other 3D junctions. This will enable product designers to create cast parts that are designed to achieve high quality and yield even before they are sent for manufacturing in a foundry. REFERENCES
1. ASM, Casting Design Handbook, American Society of Metals, Ohio (1962) 2. Caine, J.B., Design of Ferrous Castings, American Foundrymen's Society (1979) 3. Kotshi, R. M. Loper, C. R., "Design of T and X Sections for Castings", AFS Transactions, vol. 82, p535-542 (1974) 4. Kotshi, R. M. Loper, C. R., "Effect of Chills and Cores on the Design of Junction in Castings", AFS Transactions,
vol. 84, p631-640 (1976) 5. Kim, M. H., Loper, C. R., Kang, C.S., "Experimental Analysis of Wavefront in Standard Casting Sections and in
Finned Casting", AFS Transactions, vol. 93, p463-474 (1985) 6. ASM Metal Handbook Volume 15 Casting, American Society of Metals (1998) 7. Viswanathan, S., Duncan, A.J., Sabau, A.S., Han, Q., Porter, W.D., Riemer, B.W., "Modeling of Solidification and
Porosity in Aluminum Alloy Castings", AFS Transactions, vol. 106, p411-417, (1998) 8. Ravi, B, Srinivasan, M. N., "Hot Spots in Castings: Computer-Aided Location and Experimental Validation", AFS
Transactions, vol. 9, vol. 98, p353-357 (1990) 9. Ravi, B, Srinivasan, M. N., "Casting Solidification Analysis by Modulus Vector Method", International Journal of
Cast Metals Research, vol. 9, p1-7 (1996) 10. Ravi, B., Creese, R. C., and Ramesh, D., “Design for Casting - A New Paradigm for Preventing Potential Problems”,
AFS Transactions, vol. 107, p197-202, (1999) 11. Ravi, B., Joshi, D. “Feedability Analysis and Optimization Driven by Casting Simulation”, Indian Foundry
Journal, vol. 53(6), p71-78, (2007) 12. Ravi, B., Joshi, D., Singh, K., “Part, Tooling and Method Optimization Driven by Simulation and Cost Model”,
Proceedings of World Foundry Congress, Chennai, India, p261-266, (Feb 7-10, 2008) 13. Ravi, B., Metal Casting-Computer Aided Design and Analysis, Prentice Hall India (2005)