CLASSIFICATION OF FOOD AND AGRICULTURAL POLICIES: OBJECTIVES, INSTRUMENTS, AND PERFOID·ffiHCE INDICATORS Earl R. Swanson November 1975 WP-75-151 Working Papers are not intended for distribution outside of IIASA, and are solely for discussion and information purposes. The views expressed are those of the author, and do not neces- sarily reflect those of IIASA.
Transcript
CLASSIFICATION OF FOOD AND AGRICULTURAL POLICIES:OBJECTIVES, INSTRUMENTS, AND PERFOID·ffiHCE INDICATORS
Earl R. Swanson
November 1975 WP-75-151
Working Papers are not intended fordistribution outside of IIASA, and aresolely for discussion and informationpurposes. The views expressed arethose of the author, and do not necessarily reflect those of IIASA.
Classification of Food and AgricJltural Policies:
Objectives, Instruments, and Performance Indicators
Larl R. Swansor
This paper attempts to clarify the aaning of "policy" in
the context of food and aqriC'ulture thro'lgh i.1 sj"lple classification
with examples. It is hoped that such a~lassificationwill
facilitate comparisons of methodology an'l results of the various
efforts to use formal systems analytic Ie .~thOC:3 to evaluate policy.
It is not likely that any specific cystems analytic model
will be sufficiently general to embrace ~he range of food and
agriculture policies discussed. Nevert~;~less, in model construc
tion it may be prudent to anticipate the need to evaluate policies
other than the specific ones for which tne model is intended.
A classification may thus also assist in anticipating subsequent
modification of a specific policy-evaluRtion model by taking into
account common elements of a larger set c)f policies at the time
of initial model construction.
A policy for food and agriculture P ty be viewed as having
three components: general objectives or .Joals, a more speci fic
set of objectives which may be called p(~formanc0 indicators, and
a set of instruments or means of achievj(ig policy qoals [13].
The general relationships among these el:ments are sketched in
Figure 1. This paper deals wi th the inr'lts to and outputs from
a national or regional agricultural poli.sy analysis model (center
of Figure 1). A few examples of such maJels using the simulation
approach are listed in the Reference section of this paper. [3,
5, 7, 8, 11, 12, and 14]. Macro-applicotions of the simulation
of agricultural systems are reviewed in ~ stnte-of-the-art article
by Anderson [1,pp.29-30]. The applications of mathematical
programming, chiefly linear programming, to national agricultural
policy analysis are too numerous to reCC\Int in this paper.
3.0
Po
licy
Instr
um
en
ts
Po
licy
An
aly
sis
Ho
del
2.0
Perf
orm
an
ce
Ind
icato
rs
I N I
Sta
bil
ity
Eff
icie
ncy
Dis
trib
uti
on
1•
0!;
en
era
lP
oli
cy
Go
als
/
\
\'-
-l\
I\
I\
I I I I I I I
I I I I I I I I I I I-------
__
J
2.2
2.3
2.
1
Effi
cie
ncy
InIJ
uts
Pro
du
c
tio
n
Pro
ces
sin
']
Co
nsu
r.1
p
tio
n
Dis
tri
bu
tio
n
nati
on
al
Sy
ster
.1
Fo
od
an
dA
gri
cu
ltu
reS
\Tst
en
Dis
tri-
--\--
bu
tio
n--- I I" I I I I
/1
/
/~S
tab
i1
ity
rI -, I I I
Inte
rnati
on
al
Sv
ste
nI
---------.-----
-...
...:
..-
-----
-...1
--{
]
~-
1__
-
I I I I I I ----------------------------------
Pro
cess
Po
liti
cal
•-----
.........
inp
uts
toan
do
utp
uts
fro
mp
oli
cy
an
alv
sis
mo
del
rela
tio
nsh
ips
ass
um
ed
toex
ist,
bu
tn
ot
an
aly
zed
Fig
ure
1.
Cla
ssif
icati
on
of
foo
dan
daC
Jri
cu
ltu
rep
oli
cie
s.
-3-
Samples may be found in a book of readi_'1gs edited by Judge and
Takayama [6] and in ~he proceedings of an East-West conference
on the use of quantitative methods in agricultural planning [4].
A comprehensive analysis of food and agricultural policy
should take into account the process of policy formation (Figure
1, left-hand side), and also the links between the performance
indicators and general policy goals (Figure 1, right-hand side).
However, this paper ~bstracts from these aspects and focuses on
policy instruments and indicators of accomplishment. A success
ful policy-analysis model (center of Figure 1) must, at the
minimum, be able to assess the impact of the choice and level
of intensity of the selected set of policy instruments on the
performance indicators.
The institutional arrangements by I.,hich policy objectives
are determined and the instruments selected may have substantial
intrinsic value, that is, the way in which policy is formed may
be of equal importance to its consequences. We do not analyze
the important feature of the formation of policy in food and
agriculture but merely indicate (Figure 1) that the political
process is the source of the goal-setting and that feed-back to
the political process from the set of performance indicators is
one element in the process of policy fo~mation. Even though we
abstract from the political process, the examples of policy
objectives and instruments given below ~ould, in principle, be
generated from a diversity of political processes [2 and 10].
In a very general way, policy objectives may be viewed in
terms of their emphasis on levels and r~tes of growth in (a)
efficiency in resource use in agricultural production and pro
cessing, (b) equity considerations relating to distribution among
individuals or groups of the resources used in agriculture, the
products generated by agriculture, and the rewards received by
the various participants in the system. In the broader context
of a total society including the economic, social, and political
institutions, Okun [9] has noted the tensions that arise when
rights and privileges are distributed wore equally than economic
goods.
-4-
Since the general objectiv~s relating to efficiency and
distribution must be viewed in a temporsl framework, the concept
of the planning horizon and estimation of the rates of movement
toward specific goals are important aspects of policy evaluation.
Along with the consideration of the time paths of variables in
the food and agricultural system, a third general policy ob
jective (c) emerges, that of stability. These three objectives
will be discussed in somewhat more detail in Section 1.0 below.
Two examples will serve to show the importance of consid
ering the time dimension in policy evaluation. Whether an
agricultural development policy should first emphasize redis
tribution of assets used in production and then turn attention
to production-increasing activities or vice versa or some com
bination of both is an important development policy question
which, in principle, could be investigated by the use of an
appropriately designed systems analysis model.
A second example deals with a problem frequently found in
a developed country~ The choice of policy instruments which
attempt to achieve, in some sense, an equality between per-capita
farm income and per-capita non-farm income will depend, in part,
on the speed with which the adjustment is desired. Policy
instruments designed to stimulate the out-flow of labor from
agriculture require a longer period for their results to be
perceived than, for example, provision of direct income supp-.lements to farmers.
The scope of the analysis of food and agriculture policy
will depend on the specific nature of the policy considered.
One might generally expect a correspondence between the adminis
trative unit (national, provincial, regional, etc.) and the
unit of analysis. The discussion in this paper assumes agri
cultural policy analysis at the national level. For most
national agricultural policy evaluations it is essential to
place the agricultural sector in the context of the total
national economy and for many evaluations also in the world
economy (Figure 1). For other policies, analysis at a regional
level is adequate.
-5-
1.0 General Policy Objectives
The goal-setting performed in the ~olitical process will,
in effect, establish relative weights for the i~portance of
each of these three general objectives. This is a dynamic
process which will be affected not only by the feedback from
performance indicators, but also by factors exogenous to the
food and agriculture sector. It is li~ely that information on
the trade-offs among performance indicators gained by experience
with different policy instruments will affect the weights
assigned to the "preferred" combination of the goals dealing
with efficiency, distribution, and stability. That is, improved
knowledge of what is achievable will condition the goal structure
generated by the political process.
1.1 Efficiency or Production-increasing Objectives
Policies in this class are aimed primarily at (a) the
use of the resources presently allocated to the food and
agriculture sector in a more efficient manner and (b) invest
ment of additional resources, including new techniques of
production, into the food and agriculture sector. Again,
the time shape of achievement of these objectives is an
important component of their content.
1.2 Distributi ~Je Objectives
These policy objectives deal "'i th the way in which
resources used in agricultural production and processing,
goods and services, and income to ~he factors of production
are distributed among nations, grO'..lps \"i thin nations, and
individuals within groups. Performance indicators related
to this general objective may cover a range (see 2.2 below),
but one might expect distributive objectives to call, in
general, for less inequality in th~ distribution of the item
under consideration. Exceptions are, for example, the
protectionist or self-sufficiency policies of individual
nations or groups of nations. As another example, it has
been argued that to induce additional investment, tax rates
on high-income individuals need to be lowered. This
-6-
represents the use of a policy insLrument to increase
the inequality of income distribution in order to achieve
an efficiency objective.
1.3 Stability Objectives
We need only to think of the impact of weather on
crop yields or the consequences of drought on food supplies
to recognize the importance of sta:)ility as a separate
general policy goal. Adjusting to fluctuating levels of
food supply may involve extensive loss of human life as
well as damage from malnutrition for the survivors.
In the production sector, fluctuations in returns may
have serious consequences for the viability of the individual
production units, chiefly in terms of their capability to
maintain control over the necessary resources to continue
production. Consequently, a degree of stability in the major
components of the food and agriculture system appears to
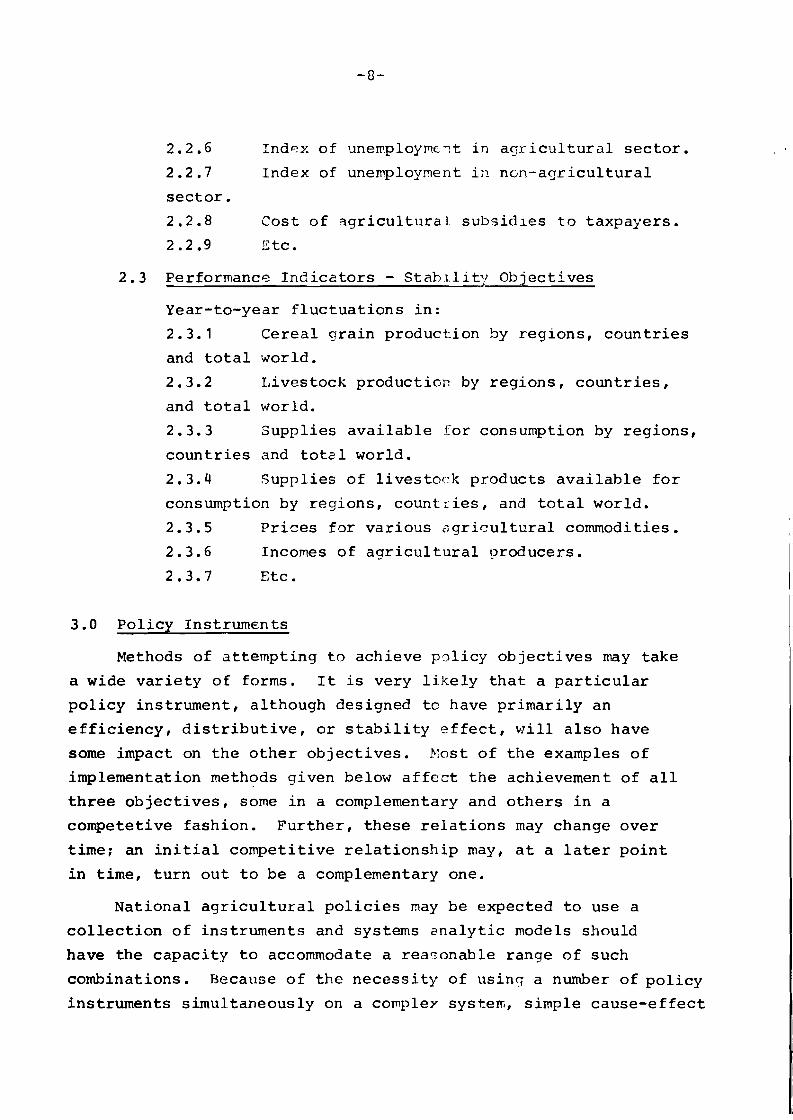
2.3.1 Cereal grain production by regions, countries
and total world.
2.3.2 Livestock production by regions, countries,
and total world.
2.3.3 Supplies available for consumption by regions,
countries and total world.
2.3.4 Supplies of livestock products available for
consumption by regions, countries, and total world.
2.3.5 Prices for various agricultural commodities.
2.3.6 Incomes of agricultural producers.
2.3.7 Etc.
3.0 Policy Instruments
Methods of attempting to achieve pGlicy objectives may take
a wide variety of forms. It is very likely that a particular
policy instrument, although designed to have primarily an
efficiency, distributive, or stability effect, will also have
some impact on the other objectives. Most of the examples of
implementation methods given below affect the achievement of all
three objectives, some in a complementary and others in a
competetive fashion. Further, these relations may change over
time; an initial competitive relationship may, at a later point
in time, turn out to be a complementary one.
National agricultural policies may be expected to use a
collection of instruments and systems cnalytic models should
have the capacity to accommodate a reasonable range of such
combinations. Because of the necessity of using a number of policy
instruments simultaneously on a compleY system, simple cause-effect
-9-
relationships (e.g. tax-incidence analy:,is) do D0t often
provide an adequate analysis of policy 2lternatives. Again, we
note the need for systems analytic procedures.
Although there may be a wide range among nations in depend
ence on the market mechanism in the organization of the food
and agriculture sector [2 and 10], the separation of policy
instruments into those that deal with (a) the factor market and
(b) the product market appears to be a useful one (Figure 1).
Prices and quantities of resources and prices and quantities of
products are the four sets of important variables in such a
system. Thus, we classify policy instr\wents first by whether
government intervention into the system is directed toward
manipulation of variables in the factor market or in the product
market. (A more refined classification might distinguish among
subcomponents of these markets.)
Although we again stress that policies are implemented with
collections of instruments, a subclassification of separate
instruments within the factor and product markets appears ap
propriate in considering how instrumental variables are to be
integrated into a policy evaluation model.
Within the factor market and the product market, instruments
may take essentially two different forms depending on the re
liance placed on responses of persons within the system to
economic incentives. We shall term those instruments which rely
primarily on economic incentives as "~ndirect". Instruments in
this class include those which control cr regulate prices in
both the factor and product market. Price, wage, and rent
controls (maxima and/or minima), as well as taxes, tariffs,
duties, and subsidies are instruments of this type. Examples
Of specific agricultural policy instruments are given below.
A second class of instruments includes the "direct" ones
which are oriented toward the quantities of factors or products
in the system. Rationing of production factors and consumer
goods, export embargoes, import quotas, and other types of
quantity-oriented regulations fall into this class. Specific
agricultural examples are given below.
-10-
Referring to these two types of instruments as "direct" and
"indirect" by no means implies a corresponding nature of the
relationship between the instrument and the performance indicators.
These latter relationships are normally expected to be complex
and indirect.
Again we emphasize that a policy will, in general, consist
of a collection of instruments, often a combination of direct
and indirect ones, in both the factor and the product markets.
3.1 Factor Market
3.1.1 Indirect Instruments
3.1.1.1 Tax incentives to increase invest
ment in agricultural structures.
3.1.1.2 Subsidization of soil-conservation
practices to decrease lesources needed for
production in some future time period.
3.1.1.3 Public sponsorship of programs that
facilitate increased control over resources by
producers through reducing the effective price
of funds for invest~ent (e.g. lower interest
rates and longer repayment periods than in
the market) •
3.1.1.4 Pension plans for farmers to induce
earlier retirement.
3.1.1.5 Payments to farmers to withdraw land
from production (see 3.2.1.1).
3.1.1.6 Export or imr~·ort tari ffs or subsidies
on inputs such as fertilizer, fuel, machinery.
3.1.1.7 Market for "rights" to use pollution
generating chemicals. (This also involves a
direct instrument in the form of entitlements
or certificates.)
3.1.1.8 Tax incentives to encourage location
of agriculturally-related industries (input
or product) in regions ~"ith "development"
potential.
-11-
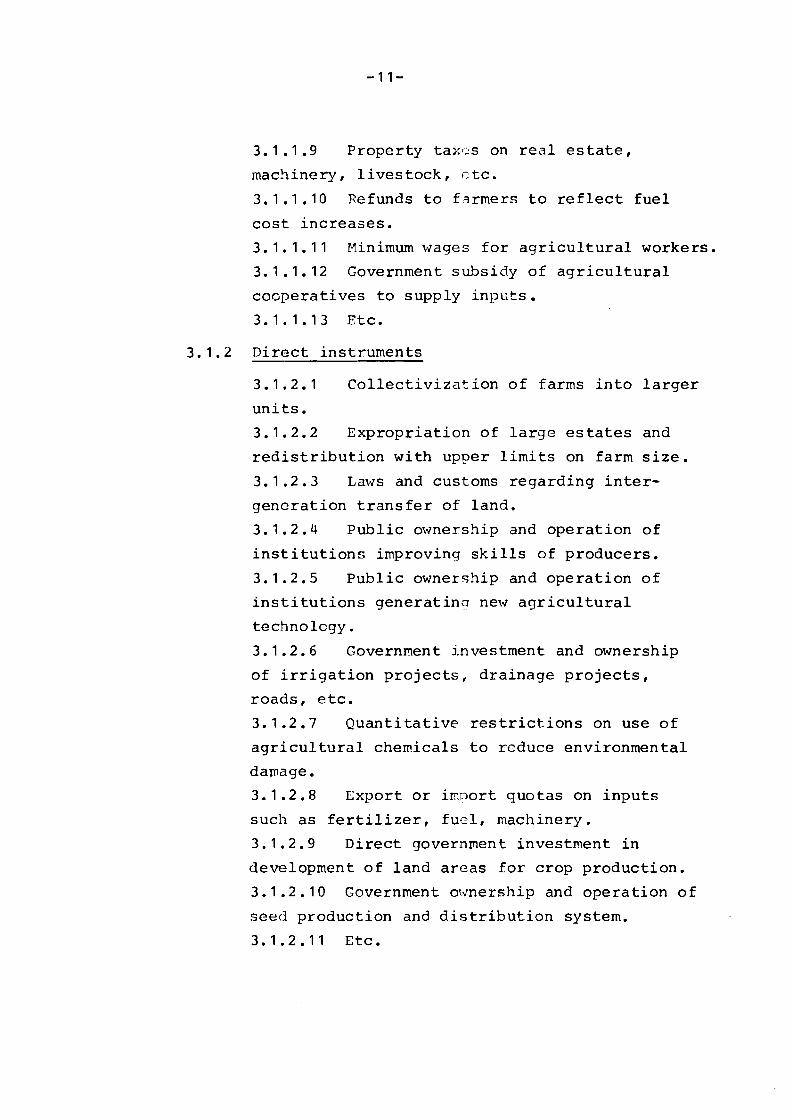
3.1.1.9 Property taxss on real estate,
machinery, livestock, ~tc.
3.1.1.10 Refunds to f3rmers to reflect fuel
cost increases.
3.1.1.11 Minimum wages for agricultural workers.
3.1.1.12 Government subsidy of agricultural
cooperatives to supply inputs.
3.1.1.13 Etc.
3.1.2 Direct instruments
3.1.2.1 Collectivization of farms into larger
units.
3.1.2.2 Expropriation of large estates and
redistribution with upper limits on farm size.
3.1.2.3 Laws and customs regarding inter
generation transfer of land.
3.1.2.4 Public ownership and operation of
institutions improving skills of producers.
3.1.2.5 Public ownership and operation of
institutions generating new agricultural
technology.
3.1.2.6 Government investment and ownership
of irrigation projects, drainage projects,
roads, etc.
3.1.2.7 Quantitative restrictions on use of
agricultural chemicals to reduce environmental
damage.
3.1.2.8 Export or i~port quotas on inputs
such as fertilizer, fU0l, machinery.
3.1.2.9 Direct government investment in
development of land areas for crop production.
3. 1 .2. 10 Government o\vnership and operation of
seed production and distribution system.
3. 1 . 2 • 11 Etc.
-12-
3.2 Product Market
3.2.1 Indirect instruments
3.2.1.1 Price-supports for farm products
(may be combined with government purchases
of farm commodities and/or quantitative re
striction on input use, both of which are
direct instruments.)
3.2.1.2 Crop-yield insurance sponsored by
government.
3.2.1.3 Price subsidies for food products to
lower prices to consumers.
3.2.1.4 Price ceilings for food products to
cor.trol inflation.
3.2.1.5 Government operation of "fair-price"
shops. (Also involves direct instrument of
purchase of products.)
3.2.1.6 Export or import tariffs or sub
sidies on products.
3.2.1.7 Consumer income supplements to in
crease demand and/or in~rove diets.
3.2.1.8 Differential taxation of certain
agricultural products (tobacco and alcoholic
beverages) •
3.2.1.9 Etc.
3.2.2 Direct instruments
3.2.2.1 Assignment of production quotas
(obligatory deliveries) to production units.
3.2.2.2 Purchase of food by government for
distribution to selected populations within
or outside the nation.
3.2.2.3 Export or import quotas on agricul
tural commodities.
3.2.2.4 Government operations of buffer stocks
of agricultural commodities.
3.2.2.5 Trade agreements for agricultural
commodities emphasizing amounts, with prices
determined on world market.
3.2.2.6 Etc.
-13-
4.0 Concluding Cownent
The above classification scheme do0.s not, of course, provide
an assessment of the likely contribution of any of the policy
instruments to the performance indicators. This is precisely
the task of the policy analysis model and this paper has at
tempted only to systematize the instrumental variables and the
desired output of such a model.
-14-
References
[1]. Anderson, Jock R. Simulation: Me~hodology and Applicationin Agricultural Economics. Review of ~larketing andAgricultural Economics, 42(1) :3-55, March 1974.
(3] de Haen, Hartwig. Systems Models to Simulate StructuralChange in Agriculture. ~ur0pean Review of Agricultural Economics 1(4) :367-389, 1974.
(4] Heady, Earl O. ed. Economic flodels and QuantitativeMethods for Decisions and Pl~nning in Agriculture.Iowa State University Press, Ames, Iowa, 1971.
(5] Herdt, Robert I~. and Earl D. Kellogg. The Impact ofAlternative Policy Strategies on Punjab Agriculture:A Simulation Analysis •.AERR-123, Department ofAgricultural Economics, University of Illinois,Urbana-Champaign, Illinois, November 1973.
(6] Judge, George G. and T. Takayama.Planning over Space and Time.Amsterdam, 1974.
Studies in EconomicNorth-Holland,
(7] Lins, David A. A Simulation Model of Farm Sector SocialAccounts with Projections to 1980. Technical BulletinNo. 1486, Economic Research Service, U.S. Departmentof Agr. 1973.
(8] Manetsch, Thomas J. and Glenn L. Johnson. A GeneralizedSimulation Approach to Agric11ltural Sector Analysis:With Special Reference to Ni;eria. Hichigan StateUniversity, East Lansing, Mich. 1971.
(9] Okun, A.M. Equality and Efficiency: The Big Tradeoff.Brookings Institution, Washington, D.C., 1975.
(10] Organisation for Economic co-operation and Development.Agricultural Policy Reports (separate reports havebeen issued, with various dates, for each of the25 OECD member countries and one for the EEC).2, rue Andre Pascal, Paris 1G.
-15-
[11] Ray, Daryll E. and Earl O. Heady. Simulated Effects ofAlternative Policy and Econo~ic Environments onU.S. Agriculture. CARD Report 46T, Iowa StateUniversity, Ames, Iowa, t-1arch 1974.
[12] Rossmiller, G.E. et.al. Korean Agricultural SectorAnalysis and Recommended Development Strategies.1971-1975. Dept. of Agr. Econ. Michigan StateUniversity, East Lansing, Mich. 1972.
[13] Tinbergen, J. On the Theory of rconomic Policy. NorthHolland, Amsterdam, Sixth Printing 1975.
[14] Tyner, Fred H. and Luther G. Tweeten. Simulation as aMethod of Appraising Farm Programs. AmericanJournal of l\.gricultural Economics 50(1) :66-81, 1968.