Classification of Select Category A and B Bacteria by Fourier Transform Infrared Spectroscopy ALAN C. SAMUELS, A. PETER SNYDER,* DARREN K. EMGE, DIANE ST. AMANT, JENNIFER MINTER, MARK CAMPBELL, and ASHISH TRIPATHI ECBC, Research and Technology Directorate, Edgewood Area, Aberdeen Proving Ground, Maryland 21010-5424 (A.C.S., A.P.S., D.K.E.); Camber Corporation, Edgewood Area, SFAE-CBD-GN-C, Aberdeen Proving Ground, Maryland 21010-5424 (D.S.A.); Science and Technology Corporation, Edgewood, Maryland 21040 (J.M., M.C.); and Science Applications International Corporation, Research and Technology Directorate, Aberdeen Proving Ground, Maryland 21010-5424 Fourier transform infrared (FT-IR) spectroscopy historically is a powerful tool for the taxonomic classification of bacteria by genus, species, and strain when they are grown under carefully controlled conditions. Relatively few reports have investigated the determination and classifica- tion of pathogens such as the National Institute of Allergy and Infectious Diseases (NIAID) Category A Bacillus anthracis spores and cells (BA), Yersinia species, Francisella tularensis (FT), and Category B Brucella species from FT-IR spectra. We investigated the multivariate statistics classification ability of the FT-IR spectra of viable pathogenic and non- pathogenic NIAID Category A and B bacteria. The impact of different growth media, growth time and temperature, rolling circle filter of the data, and wavelength range were investigated for their microorganism differentiation capability. Viability of the bacteria was confirmed by agar plate growth after the FT-IR experimental procedures were performed. Principal component analysis (PCA) was reduced to maps of two PC vectors in order to distill the FT-IR spectral features into manageable, visual presentations. The PCA results of the strains of BA, FT, Brucella, and Yersinia spectra from conditions of varying growth media and culture time were readily separable in two-dimensional (2D) PC plots. FT spectra were separated from those of the three other genera. The BA pathogenic spore strains 1029, LA1, and Ames were clearly differentiated from the rest of the dataset. Yersinia rhodei, Y . enterocolitica, and Y . pestis species were distinctly separated from the remaining dataset and could also be classified by growth media. Different growth media produced distinct subsets in the FT, BA, and Yersinia spp. regions in the 2D PC plots. Various 2D PC plots provided differential degrees of separation with respect to the four viable bacterial genera including the BA sub-categories of pathogenic spores, vegetative cells, and nonpathogenic vegetative cells. This work provided evidence that FT-IR spectroscopy can indeed separate the four major pathogenic bacterial genera of NIAID Category A and B biological threat agents including details according to the growth conditions and statistical parameters. Index Headings: Fourier transform infrared spectroscopy; FT-IR spec- troscopy; Bacteria discrimination; Yersinia; Bacillus anthracis; Brucella; Francisella tularensis; Principal component analysis; PCA; Biological discrimination; Growth media; Growth times; Wavelength ranges; Rolling circle filter; Spores. INTRODUCTION The application of infrared (IR) spectroscopy to the study of collections of whole microbial cells has attracted a significant amount of attention in recent years due to the application of multivariate analysis (MVA) on the IR spectra of whole bacterial cells and spores. 1–5 The MVA method has had a relative degree of success in the classification of microbial samples with respect to agreement with conventional taxo- nomic schemes. In the case of pure biochemicals, IR spectroscopy often yields spectra consisting of few features and peaks since the bonds and functional groups of a particular molecular structure are often adequately peculiar to afford a relatively simple, unique, and reliable spectral fingerprint. In the case of microbial samples, the IR spectrum is a composite of the IR vibrations associated with literally thousands of molecular components in the microbe. These molecular components (e.g., proteins, nucleic acids, and phospholipids) are common to all materials of biological origin and result in composite spectra from whole microbial samples that are not nearly as unique and peculiar as those associated with their pure biochemical compounds. However, researchers have repeatedly demonstrated the power of multivariate statistical analysis techniques to extract subtle details from the IR spectra of whole microbial samples and have successfully correlated nearest neighbor genera and species along appropriate taxa. 6–14 Naumann and co-workers pioneered the study of microbes using IR spectroscopy. 15–18 They demonstrated that when combined with statistical data processing, IR spectroscopy can accurately assign microorganisms into categories that parallel taxonomic classification. The details of some recent Fourier transform infrared (FT-IR) studies on bacteria, the chemo- metric approach applied, and summaries of results are outlined in Table I. A noteworthy review of the literature and methods for microbial identification by FT-IR spectroscopy and chemometrics was published by Mariey et al. in 2001. 34 The current work focuses on the application of FT-IR spectroscopy and multivariate analysis methods to the characterization and classification of microbial pathogens associated with biological warfare agents. To this end, we have established a database of IR spectra of several strains of etiologic Category A and B bacterial pathogens as classified by the National Institute of Allergy and Infectious Diseases (NIAID) 35 and a few of their avirulent nearest neighbors for comparison. EXPERIMENTAL Bacillus Species Cultivation. Stock preparations of B. anthracis (BA) strains LA1, 1029, Ames, Pasteur, Sterne, and Delta Sterne were removed from freezer storage, streaked onto Nutrient agar, incubated at 35 8C for 1 to 2 days, and the cells were harvested. Secondary cultures of all organisms were streaked onto multiple plates of Sheep’s Blood Agar (Tryptic Soy Agar (TSA) with 5% sheep’s blood, SBA), and TSA for 1 to 2 days. The Pasteur, Sterne, and Delta Sterne strains also were grown at 24 8C (ambient temperature) for 1 to 2 days Received 16 January 2008; accepted 5 November 2008. * Author to whom correspondence should be sent. E-mail: peter.snyder@ us.army.mil. Current address: US Department of Agriculture, Athens, GA 30605. 14 Volume 63, Number 1, 2009 APPLIED SPECTROSCOPY 0003-7028/09/6301-0014$2.00/0 Ó 2009 Society for Applied Spectroscopy
Transcript
Classification of Select Category A and B Bacteria by FourierTransform Infrared Spectroscopy
ALAN C. SAMUELS, A. PETER SNYDER,* DARREN K. EMGE, DIANE ST. AMANT,JENNIFER MINTER, MARK CAMPBELL,� and ASHISH TRIPATHIECBC, Research and Technology Directorate, Edgewood Area, Aberdeen Proving Ground, Maryland 21010-5424 (A.C.S., A.P.S., D.K.E.);
The application of infrared (IR) spectroscopy to the study ofcollections of whole microbial cells has attracted a significantamount of attention in recent years due to the application ofmultivariate analysis (MVA) on the IR spectra of wholebacterial cells and spores.1–5 The MVA method has had arelative degree of success in the classification of microbialsamples with respect to agreement with conventional taxo-
nomic schemes. In the case of pure biochemicals, IRspectroscopy often yields spectra consisting of few featuresand peaks since the bonds and functional groups of a particularmolecular structure are often adequately peculiar to afford arelatively simple, unique, and reliable spectral fingerprint. Inthe case of microbial samples, the IR spectrum is a compositeof the IR vibrations associated with literally thousands ofmolecular components in the microbe. These molecularcomponents (e.g., proteins, nucleic acids, and phospholipids)are common to all materials of biological origin and result incomposite spectra from whole microbial samples that are notnearly as unique and peculiar as those associated with theirpure biochemical compounds. However, researchers haverepeatedly demonstrated the power of multivariate statisticalanalysis techniques to extract subtle details from the IR spectraof whole microbial samples and have successfully correlatednearest neighbor genera and species along appropriate taxa.6–14
Naumann and co-workers pioneered the study of microbesusing IR spectroscopy.15–18 They demonstrated that whencombined with statistical data processing, IR spectroscopy canaccurately assign microorganisms into categories that paralleltaxonomic classification. The details of some recent Fouriertransform infrared (FT-IR) studies on bacteria, the chemo-metric approach applied, and summaries of results are outlinedin Table I. A noteworthy review of the literature and methodsfor microbial identification by FT-IR spectroscopy andchemometrics was published by Mariey et al. in 2001.34
The current work focuses on the application of FT-IRspectroscopy and multivariate analysis methods to thecharacterization and classification of microbial pathogensassociated with biological warfare agents. To this end, wehave established a database of IR spectra of several strains ofetiologic Category A and B bacterial pathogens as classified bythe National Institute of Allergy and Infectious Diseases(NIAID)35 and a few of their avirulent nearest neighbors forcomparison.
EXPERIMENTAL
Bacillus Species Cultivation. Stock preparations of B.anthracis (BA) strains LA1, 1029, Ames, Pasteur, Sterne, andDelta Sterne were removed from freezer storage, streaked ontoNutrient agar, incubated at 35 8C for 1 to 2 days, and the cellswere harvested. Secondary cultures of all organisms werestreaked onto multiple plates of Sheep’s Blood Agar (TrypticSoy Agar (TSA) with 5% sheep’s blood, SBA), and TSA for 1to 2 days. The Pasteur, Sterne, and Delta Sterne strains alsowere grown at 24 8C (ambient temperature) for 1 to 2 days
Received 16 January 2008; accepted 5 November 2008.* Author to whom correspondence should be sent. E-mail: [email protected].
� Current address: US Department of Agriculture, Athens, GA 30605.
14 Volume 63, Number 1, 2009 APPLIED SPECTROSCOPY0003-7028/09/6301-0014$2.00/0
� 2009 Society for Applied Spectroscopy
before they were harvested. Secondary cultures of BA LA1,1029, and Ames were grown only at 35 8C for 1 to 2 days.
All BA strains also were grown in Tryptic Soy Broth (TSB)and Brain Heart Infusion Broth (BHI) for 1 to 2 days andharvested. The Pasteur, Sterne, and Delta Sterne strains weregrown at 24 8C (ambient temperature) and 35 8C, while strainsLA1, 1029, and Ames were grown only at 35 8C.
The BA Ames strain was acquired from the Naval MedicalResearch Institute, Silver Spring, Maryland; the LA1, Pasteur,1029, Sterne, and Delta Sterne strains were acquired from theUnited States Army Medical Research Institute for InfectiousDiseases, Aberdeen Proving Ground, Maryland.
The SBA was purchased directly from Culture Media andSupplies (Oswego, IL). Nutrient sporulation medium (NSM)
TABLE I. Recent FT-IR studies of bacteria.a
Bacteria species Statistical analysis Summary
Staphylococcus aureus First derivative, peak-heightnormalized/SVD, PCA, KNN
97% classification of methicillin-resistant strains.11 Improvedperformance in the 2868–2888 cm�1 region rather than theentire spectrum for in-species strain separation.12
S. aureus First derivative/HCA Discriminated between normal bacteria and small colonyvariant phenotypes.6
Salmonella spp. SIMCA Serovar differentiation compared by transmission on ZnSeand disposable polyethylene membranes, and attenuated totalreflectance.8
S. epidermidis HCA, PCA, LDA Combined IR and Raman data to elucidate metabolic processes.5
Thermophilic vs. mesophilic bacteria HCA Thermophilic bacteria exhibited higher protein-to-lipid ratiosand saturated lipids, lower amounts of unsaturated acylchains, and lower cellular DNA content than mesophilicbacteria.19
Bordetella pertussis – Monitored bacterial biofilms in real time and their maturationfrom the increase of carbohydrate/protein ratios.20
Investigated performance of spectral preprocessing forbacterial classification. Improved performance for targetedspectral ranges vs. whole spectrum analyses.21
Legionella spp., Bacillus spp., Candida spp. Chemical interpretation of IR spectra Observed significant heterogeneity within a colony.22
Non-tuberculous Mycobacteria HCA Accurate classification into species-specific clusters andstrain-specific sub-clusters.14
Salmonella enterica PCA 900–1300 cm�1 and three selective growth media discriminatedsix serovars.13
Pseudomonas, Streptococcus, Staphylococcus Chemical interpretation of IR spectra Quantified polysaccharides by comparing the area of the 970and 1182 cm�1 regions and either the protein amide IIbands (1530–1560 cm�1) or the CH stretch bands(2820–3020 cm�1).23
B. atrophaeus, B. subtilis, B. thuringiensis PCA Differentiation of spores, vegetative bacteria, and ambientbackground particles; taxonomic classification.4
B. amyloliquefaciens, B. sphaericus, andClostridium tyrobutyricum
PLS Inactivation by thermal processing, pressure-assisted thermalprocessing, and autoclaving. Established viability of thebacterial spores from the spectral information.24
B. cereus, S. enterica, E. coli, and Listeria spp. PCA 700–1700 cm�1 region to classify with .94% accuracy.25
Lactobacillus and related strains Pearson correlation function Genus and species level identification.26–28
Lactobacillus isolates from kefir grains HCA with Pearson’s product-momentcorrelation coefficient and Ward’salgorithm
Small variations in temperature and growth time did notaffect the differentiation of the isolates; two growth mediaaffected the relative multivariate dataspace separation ofthe bacteria at the species level without affecting thediscrimination capability.7
Pathogenic bacteria in food ANN Identified and classified food-borne pathogens against fourfood matrices.29
Food-borne bacteria ANN Quantitative analysis of undefined, geographically separated,smear cheese microbial consortia without producing a pureculture.30
Mycobacterium bovis HCA Isolates of ten major spoligotypes found in the UnitedKingdom could be differentiated.10
Campylobacter coli and C. jejuni species Two ANN architectures: multilayerperception and probabilistic neuralnetwork
Correctly classified 26 isolates with 99.16% accuracy.31
Escherichia coli and Alicyclobacillus spp. PCA Inoculated spp. from apple juice, with 75% and 88.3%classification accuracy for the individual and mixed strainsusing the 900–1800 cm�1 spectral region.3
Pseudomonas aeruginosa and E. coli spp. Second derivative, PCA Pure and mixed cultures in drinking water were classifiedwith 83–88% accuracy using the 900–1800 cm�1 spectralregion.32
C. jejuni PLS regression Extensive correlation study comparing FT-IR to DNAmicroarray using PLS. Stress response information wasrevealed that was not observed in gene expression tests.9
Listeria spp. HCA, ANN 96% accuracy for Listeria isolates and 99.2% accuracy forcorrect L. monocytogenes.33
a HCA, hierarchical cluster analysis; PCA, principal component analysis; ANN, artificial neural network; PLS, partial least squares; SVD, singular valuedecomposition; LDA, linear discriminant analysis; KNN, K-nearest neighbors; SIMCA, soft independent modeling of class analogy.
APPLIED SPECTROSCOPY 15
was prepared using 23 g/L of Nutrient Agar (DF0001) plus 2 g/L of Bacto Agar (DF0140), 3 g/L of Bacto Yeast Extract(DF2109), 3 g/L of Bacto Tryptone (DF0123) (all DFcomponents were purchased from Becton Dickinson, Cockeys-ville, MD), and 0.1% of a 1% manganese chloride�4H2Osolution, pH adjusted to 7.0 6 0.2. This formula was mixedand autoclaved at 121 8C at 15 psi for 20 minutes. Afterpreparation and pouring, all media were checked for sterilityand stored at 2–8 8C until use.
Two to three plates for each organism were harvested (wheregrowth was present) at 1, 2, 3, 4, 5, and 7 days and includedvegetative cells, vegetative cells undergoing sporulation, andmature spores. Harvested cells were washed three times inphosphate buffered saline (PBS) and resuspended as a stocksuspension in sterile distilled water to a concentration ofapproximately 108 colony forming units per milliliter (cfu/mL).
Brucella Species. Brucella abortus vaccine strains S19 andRB51 were obtained from the Ted Hadfield, Armed ForcesInstitute of Pathology, Washington, D.C. The bacteria werecultured on SBA and TSA at 35 8C, and the cells wereharvested at approximately 48 and 72 hours. The Brucellaspecies were also grown in Brain Heart Infusion broth (BHI)and Tryptic Soy Broth (TSB) at 35 8C for 16 to 48 hours.
Yersinia Species. Y. pestis ATCC A1122, Y. rhodei ATCC43380, and Y. enterocolitica ATCC 9610 were obtained fromthe American Type Culture Collection (ATCC) (Manassas,VA) and were grown at 24 8C (ambient temperature) and 35 8Cfor 48 to 96 hours on TSA and SBA. The cells were harvestedat 2- and 4-day intervals.
Francisella tularensis Live Vaccine Strain. F. tularensisLVS (live vaccine strain, stock cultures from Aberdeen ProvingGround, MD, (FT)) was grown at 35 8C on Chocolate Agar(CHOC), TSB containing 1.0g/L cysteine, and BHI agarcontaining 1.0 g/L cysteine. Cells were harvested at 5 and 7days after plates were streaked with primary culture fromfreezer stocks. Cells were grown at 35 8C in TSB and BHIbroths and were harvested 1 and 2 days after inoculation.
Post-Harvest Processing of Bacterial Samples. Forsamples grown on solid media, two 10 lL loopfuls (intriplicate) were transferred and resuspended into each of threevials containing 80 lL of sterile distilled water. For samplesgrown in liquid medium, organisms were plated onto theappropriate agar. After satisfactory growth was achieved, twoto four isolated colonies were transferred to 6 to 8 mL of brothin a 15 mL polypropylene conical tube. Three 1-mL sampleswere obtained at selected growth time intervals and washed.Each sample was centrifuged at 9000 g at room temperature.After centrifugation, the supernatant was removed and thepellets were resuspended into 1 mL of PBS. The pellets werecentrifuged and washed two more times and resuspended in 80lL of sterile distilled water to a concentration of approximately1 3 108 cfu/mL in sterile, distilled water.
BioSafety Level 3 Safety Procedures. The microbiologicaland analytical work was conducted under Biosafety Level 3(BSL-3) conditions. Personnel who entered the BSL-3laboratory removed their street clothes, donned scrub clothing,and then suited with full-body Tyvek water resistant attire, shoecovers, and a hood connected to a Powered Air PurifyingRespirator. A double layer of gloves was worn; the first layerwas secured to the Tyvek suit so that no skin was exposed.
All microbiological sample manipulations and analyticalspectroscopy procedures were performed in a Class 2, Type B2
BioSafety Cabinet (BSC). Materials moved in and out of theBSC were decontaminated with bleach. The BioSafety cabinetwas lined with absorbent pads, and all generated waste waspackaged and secured in the BSC before removal. Allorganisms were double-contained including transport to andfrom incubators, refrigerators, and centrifuges.
Samples were spotted onto a window region on the ZnSewheel. Samples were dried in a shallow secondary container. AKBr window was secured onto the ZnSe wheel in the BSC. Thesample wheel was then sealed in a secondary container in theBSC and placed on a cart for transport to the FT-IRspectrometer. The ZnSe wheel was placed into the appropriatecompartment in the spectrometer. After sample analysis wascomplete, the wheel was removed from the spectrometer,placed back in a secondary container, and transported back tothe BSC for decontamination where the KBr window wasremoved.
When samples were concentrated before analysis, they weredouble contained upon removal from the BSC and transportedto a bench-top centrifuge. When the centrifuge cycle wascompleted, the entire rotor was removed from the centrifugeand placed into the BSC for sample removal.
Instrumentation and Sample Preparation. The Bruker(Billerica, MA) IFS 28/B Fourier transform IR spectrometerwas used to measure the IR transmission through thin films ofthe microbes deposited onto an IR-transparent ZnSe substrate.The thin films were prepared by suspending the live spores orcells harvested from the growth media in 80 lL of distilledsterile water, vortexing the suspension for uniformity, and thendepositing approximately 35 lL of the suspension onto one ofthe window regions on the IFS 28/B ZnSe sample wheel. Threeseparate bacterial suspensions were prepared from bacterialgrowth on solid and/or liquid media. One to three separatebacterial suspensions were prepared from bacterial growth onagar plates. Three aliquots were taken from each bacterialsuspension and dried as a film on the ZnSe windows on thesample wheel. The sample wheel was dried in a vacuumdessicator for one hour, removed from the dessicator, sealedwith a KBr window, and placed into the IR spectrometer formeasurement. The IFS 28/B is equipped with a roomtemperature deuterated triglycine sulfate (DTGS) detector.The default interferogram acquisition parameters, consisting ofa Mertz phase correction and a Blackman–Harris three-termapodization function with a zero-fill factor of four, were usedfor all spectral data collections. A total of 64 scans werecollected for each sample at a resolution of 2 cm�1. A blankarea of the ZnSe substrate wheel was automatically used as thebackground for the FT-IR spectra.
Organism Viability. The viability of the FT cells afterdeposition, drying, and collecting the spectra was investigatedby recovering the thin film residue from the ZnSe surface.Gram-negative FT is known to be a fragile microbial species.Thirty-five microliters of PBS were added to the dried filmresidue, and the residue was allowed to soak for about 15minutes. The suspension was repeatedly withdrawn andredeposited onto the ZnSe surface of the sample window usinga pipette. We rinsed the spot two more times using a 35 lLvolume of PBS and pooled the three volumes. The 105 lLsuspension was plated onto CHOC agar and incubated for 48hours at 35 8C. This complete procedure was done two moretimes for an additional two experiments on ZnSe substrates. A
16 Volume 63, Number 1, 2009
full lawn of growth with no individually discernable coloniesresulted for all three CHOC agar plates.
Data Analysis. All the spectral data files were convertedfrom the SPC format into the ASCII data format. All the ASCIIconverted spectral data files were unfiltered and also processedusing a rolling circle filter (RCF) routine (vide infra). Twoprincipal component analyses (PCA) were conducted for theRCF-processed and unfiltered data. The first dataset wasextracted from the spectral data points in the 600–1800 cm�1
region. The resulting dataset comprised 1245 wavenumberdimensions. The second dataset comprised the spectral datapoints in the 499–1800, 2800–3000, and 3200–3700 cm�1
regions, and consisted of 2077 wavenumber dimensions. Allthe data in the remaining wavenumber regions was neglected.In addition, any wavenumber dimensions that exhibited zerointensity were neglected from further analyses. The spectralintensities of an extracted and filtered spectrum in both datasetswere normalized by dividing all the intensities by themaximum intensity in that spectrum. For multivariate dataanalysis, we generated a matrix by concatenating the individualmeasurements as rows and the selected wavenumber values ascolumns. The spectral intensity for each measurement–wavenumber combination made up the matrix elements. Eachspectral dimension was autoscaled by dividing the entries ineach column by the standard deviation of all the entries in thatcolumn. This autoscaling preprocessing step levels theinformation content presented by weak and strong infraredabsorption bands and sets the standard deviation value of eachcolumn to unity. The PCA was performed using thePRINCOMP function in the statistics toolbox. The MATLABcomputational environment (The MathWorks, Inc., Natick,MA) was employed for performing the PCA for each dataset.
Dendrogram analysis was also performed with the Chemo-metrics Toolbox code. An input dataset was generated from thePCs in Table II. A standardized Euclidean distance matrix wasevaluated that contained the distances between pairs ofprocessed spectra. A hierarchical linkage matrix was evaluatedfrom the distance matrix. The shortest distance or ‘‘single’’linkage approach between the spectral points was used. Adendrogram plot of the hierarchical cluster matrix wasconstructed.
Rolling Circle Filter. The RCF is a curve and consists of ahemisphere of a circle that rolls under a spectral curve whilemaintaining at least one point of contact with that curve.36,37
The curve travels under spectral features while makingtangential contact with the spectrum at one or more points. Asegmented straight line connecting consecutive, tangentialpoints of contact is considered as the baseline. This baseline isthen subtracted from the spectral curve. The result is aspectrum devoid of broad spectral features or low-order trends.
The process can be loosely characterized as a high pass filter,where smaller hemisphere diameters allow narrow spectralfeatures or high frequency components to pass whileattenuating the broad spectral features or low-frequencycomponents. Lower frequencies (i.e., broader features) areallowed to pass as the RCF diameter increases. As applied toFT-IR peaks, the smaller diameters will isolate and pass narrowpeaks. As an example, consider the BA spore spectrum in the600 to 800 cm�1 wavenumber region (Fig. 1a). There are fournarrow spectral features obscured by a broad spectral feature. Arelatively smaller diameter hemisphere will enhance thosenarrow spectral features while attenuating the broader feature(Fig. 1f). A relatively small rolling circle diameter will allowrelatively narrow spectral peaks to be retained while suppress-ing the broader features. As the rolling circle diameter isincreased, both the narrow and broad peaks will pass throughthe filter.
RESULTS AND DISCUSSION
Infrared absorption spectra were obtained from one CategoryB and three Category A bacterial pathogens as classified by theNational Institute of Allergy and Infectious Diseases(NIAID),35 and a number of strains of each were used. TheIR spectra were compared for differentiation purposes withmultivariate statistics. In addition, the growth media, temper-ature, and time were varied in order to assess the impact ofdifferent growth conditions on the IR spectroscopic classifica-tion. The viable pathogens and non-pathogens (Table III) weregrouped into six categories: FT LVS cells, three strains ofpathogenic BA spores (1029, Ames, and LA1), three strains ofpathogenic vegetative BA cells (1029, Ames, and LA1), threestrains of non-pathogenic vegetative BA cells (Sterne, deltaSterne, and Pasteur), and two and three strains of Brucella andYersinia species, respectively.
Relatively few reports can be found in the literature on thesewhole, viable, intact bacteria with respect to IR spectrosco-py.1,2,38–40 To the best of the authors’ knowledge, this is thefirst effort to compare and contrast the IR spectra of viableCategory A and B bacterial pathogens amongst themselves,their avirulent nearest neighbor species, and the influence ofkey growth conditions.
Fourier Transform Infrared Absorption Spectra. Thevariability in the IR absorption spectra was investigated withrespect to the permutations of bacterial strain, growth media,growth temperature, and growth time. A total of 154 differentIR experiments were conducted, each consisting of an averageof three to nine replicate spectral measurements on a givensample of each bacterium. Each culture was replicated threetimes and three films were prepared and measured by FT-IRspectroscopy. The concept of using a single spectrum to
TABLE II. Principal component vectors for bacterial discrimination.
represent a dispersion of replicate spectra is not unprecedented;a number of previous reports have made use of this concept andyielded meaningful, concrete results.41,42 Oral Streptococciisolates41 and food-borne yeasts42 provided significant group-ings of related species and strains for multivariate clusteranalyses and dendrogram analyses.
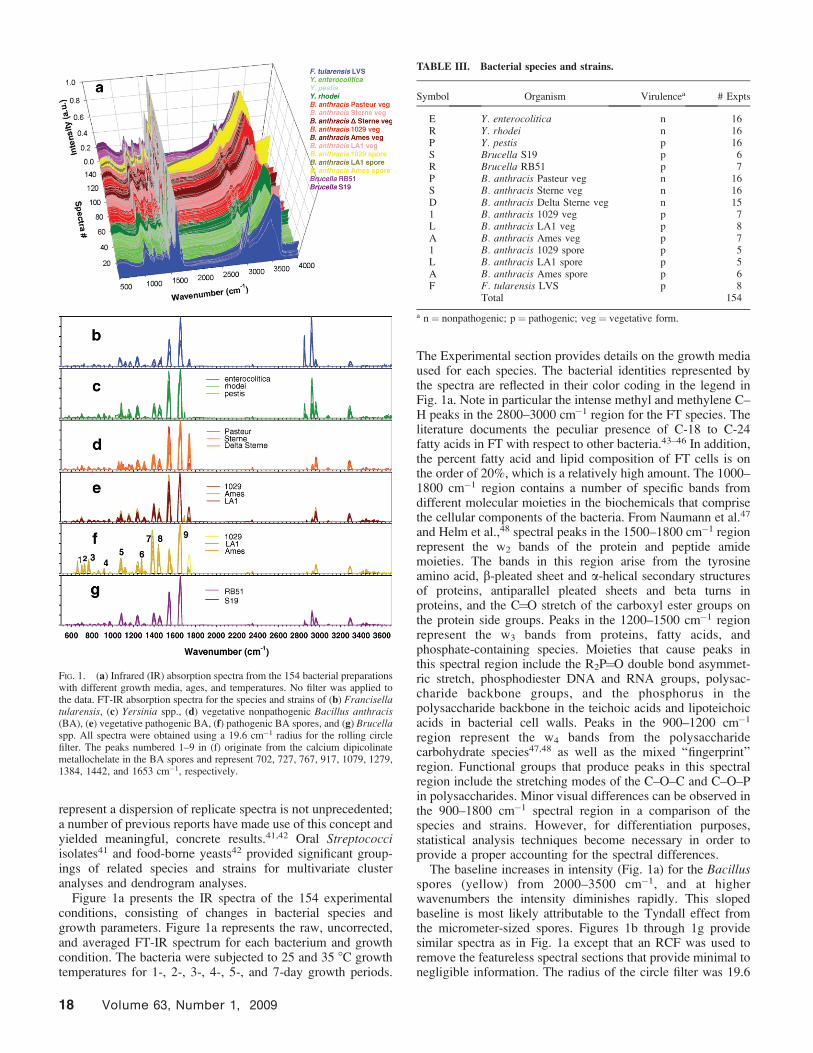
Figure 1a presents the IR spectra of the 154 experimentalconditions, consisting of changes in bacterial species andgrowth parameters. Figure 1a represents the raw, uncorrected,and averaged FT-IR spectrum for each bacterium and growthcondition. The bacteria were subjected to 25 and 35 8C growthtemperatures for 1-, 2-, 3-, 4-, 5-, and 7-day growth periods.
The Experimental section provides details on the growth mediaused for each species. The bacterial identities represented bythe spectra are reflected in their color coding in the legend inFig. 1a. Note in particular the intense methyl and methylene C–H peaks in the 2800–3000 cm�1 region for the FT species. Theliterature documents the peculiar presence of C-18 to C-24fatty acids in FT with respect to other bacteria.43–46 In addition,the percent fatty acid and lipid composition of FT cells is onthe order of 20%, which is a relatively high amount. The 1000–1800 cm�1 region contains a number of specific bands fromdifferent molecular moieties in the biochemicals that comprisethe cellular components of the bacteria. From Naumann et al.47
and Helm et al.,48 spectral peaks in the 1500–1800 cm�1 regionrepresent the w2 bands of the protein and peptide amidemoieties. The bands in this region arise from the tyrosineamino acid, b-pleated sheet and a-helical secondary structuresof proteins, antiparallel pleated sheets and beta turns inproteins, and the C¼O stretch of the carboxyl ester groups onthe protein side groups. Peaks in the 1200–1500 cm�1 regionrepresent the w3 bands from proteins, fatty acids, andphosphate-containing species. Moieties that cause peaks inthis spectral region include the R2P¼O double bond asymmet-ric stretch, phosphodiester DNA and RNA groups, polysac-charide backbone groups, and the phosphorus in thepolysaccharide backbone in the teichoic acids and lipoteichoicacids in bacterial cell walls. Peaks in the 900–1200 cm�1
region represent the w4 bands from the polysaccharidecarbohydrate species47,48 as well as the mixed ‘‘fingerprint’’region. Functional groups that produce peaks in this spectralregion include the stretching modes of the C–O–C and C–O–Pin polysaccharides. Minor visual differences can be observed inthe 900–1800 cm�1 spectral region in a comparison of thespecies and strains. However, for differentiation purposes,statistical analysis techniques become necessary in order toprovide a proper accounting for the spectral differences.
The baseline increases in intensity (Fig. 1a) for the Bacillusspores (yellow) from 2000–3500 cm�1, and at higherwavenumbers the intensity diminishes rapidly. This slopedbaseline is most likely attributable to the Tyndall effect fromthe micrometer-sized spores. Figures 1b through 1g providesimilar spectra as in Fig. 1a except that an RCF was used toremove the featureless spectral sections that provide minimal tonegligible information. The radius of the circle filter was 19.6
TABLE III. Bacterial species and strains.
Symbol Organism Virulencea # Expts
E Y. enterocolitica n 16R Y. rhodei n 16P Y. pestis p 16S Brucella S19 p 6R Brucella RB51 p 7P B. anthracis Pasteur veg n 16S B. anthracis Sterne veg n 16D B. anthracis Delta Sterne veg n 151 B. anthracis 1029 veg p 7L B. anthracis LA1 veg p 8A B. anthracis Ames veg p 71 B. anthracis 1029 spore p 5L B. anthracis LA1 spore p 5A B. anthracis Ames spore p 6F F. tularensis LVS p 8
Total 154
a n ¼ nonpathogenic; p ¼ pathogenic; veg¼ vegetative form.
FIG. 1. (a) Infrared (IR) absorption spectra from the 154 bacterial preparationswith different growth media, ages, and temperatures. No filter was applied tothe data. FT-IR absorption spectra for the species and strains of (b) Francisellatularensis, (c) Yersinia spp., (d) vegetative nonpathogenic Bacillus anthracis(BA), (e) vegetative pathogenic BA, (f) pathogenic BA spores, and (g) Brucellaspp. All spectra were obtained using a 19.6 cm�1 radius for the rolling circlefilter. The peaks numbered 1–9 in (f) originate from the calcium dipicolinatemetallochelate in the BA spores and represent 702, 727, 767, 917, 1079, 1279,1384, 1442, and 1653 cm�1, respectively.
18 Volume 63, Number 1, 2009
cm�1. The bacterial species and strains for each genus aresuperimposed and provide a clear visual depiction of thespectra. The Bacillus spore region (Fig. 1f, yellow color)provides significant peak intensities in the 600–800 and 1360–1440 cm�1 spectral regions compared to the other spectra. Theintensity distribution of the three peaks in the 1360–1560 cm�1
region is significantly different than that of the other fiveorganisms. In addition, a relatively low intensity peak at 1280cm�1 appears unique to the Bacillus spp. with respect to theother pathogens. The peaks labeled 1–9 in Fig. 1f originatepredominately from the calcium dipicolinate (CaDPA) speciesin the BA spores, and they represent 702, 727, 767, 917, 1079,1279, 1384, 1442, and 1653 cm�1, respectively. Both BAvegetative preparations appear to contain a fairly unique peakof significant intensity at 1740 cm�1,13 most likely attributableto the carbonyl (C¼O) stretch from fatty acids.46 FT andYersinia species contain intense peaks in the 2840–3000 cm�1
region. These are most likely due to the 21%44 and 4.5%49
abundance of fatty acids and lipids in FT and Yersinia,respectively, compared to that in the BA (2%)50 and Brucella(1.3%)51 species.
Statistical Analysis Procedures for Bacterial Differenti-ation. The main objective of this study was to assess thecapability of IR absorption spectroscopy to speciate CategoryB Brucella spp. and three Category A bacterial pathogens,notwithstanding minor variations in growth media, time, andtemperature. Table III identifies the bacterial genus, species,strain, their symbols for the PC analyses, and the number ofdifferent bacterial preparations for each strain. A total of 154separate experiments on strains of the four bacterial genera(Table III) were conducted by using selected levels of threemicrobiological growth parameters. These experiments wereconducted to investigate the variations in the microbiological(growth media, time, and temperature), RCF value, and twowavenumber range parameters on the multivariate analysis ofbacterial IR absorption spectra for taxonomic classification.
All 154 experiments were subjected to six different RCFs inorder to find a compromise between removing backgroundnoise and the differential loss of IR absorption peaks. Six RCFswere used: 0.0 (no filter), 19.6, 49.0, 73.5, 98.0, and 147.0cm�1 radii. In addition, two separate wavenumber ranges ofdata were used for PC analyses: 600–1800 cm�1 and thecombined ranges of 500–1800, 2800–3000, and 3200–3700cm�1. The latter three wavenumber ranges are abbreviated as500–3700 cm�1. A total of 12 combinations of RCF andwavenumber ranges resulted, and each combination wassubjected to PCA. The first five PCs were retained in each ofthe 12 multivariate data analyses. All pairs of the five PCs werevisually analyzed for bacterial discrimination and microbio-logical growth parameter effects on microbial classification.Each of the twelve combinations of RCFs and wavenumberparameters yields ten two-dimensional (2D) PC plots, and all
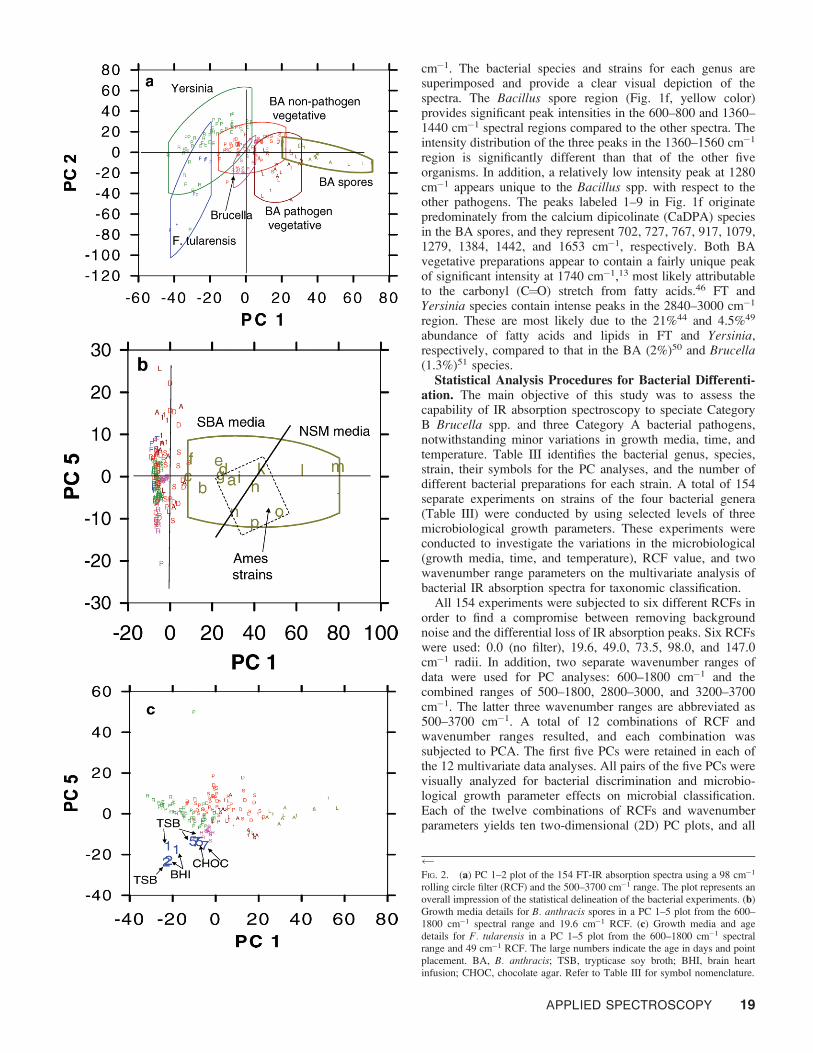
FIG. 2. (a) PC 1–2 plot of the 154 FT-IR absorption spectra using a 98 cm�1
rolling circle filter (RCF) and the 500–3700 cm�1 range. The plot represents anoverall impression of the statistical delineation of the bacterial experiments. (b)Growth media details for B. anthracis spores in a PC 1–5 plot from the 600–1800 cm�1 spectral range and 19.6 cm�1 RCF. (c) Growth media and agedetails for F. tularensis in a PC 1–5 plot from the 600–1800 cm�1 spectralrange and 49 cm�1 RCF. The large numbers indicate the age in days and pointplacement. BA, B. anthracis; TSB, trypticase soy broth; BHI, brain heartinfusion; CHOC, chocolate agar. Refer to Table III for symbol nomenclature.
APPLIED SPECTROSCOPY 19
twelve combinations resulted in 120 different 2D PC plotrepresentations of the 154 spectra. A down-selection andfurther data reduction were performed (vide infra).
Bacterial Analysis: FT and BA Pathogens. The 120 2DPC projections were analyzed visually for information content,and Table II presents the visual data reduction results based onmaximal bacterial separation with respect to RCF, wavenumberrange, and PC vectors. Eleven 2D PC graphical presentations,consisting of 18 individual PC vectors, were chosen from the120 2D PC graphs. The criteria used for PC determination(Table II) consisted of the following: (a) the PC had to separateat least one of the six genera group of points, and (b) the PCcould not split a genus into two separate groups of points.Selected 2D PC plots are presented herein for analytical IRspectroscopic analysis and classification of the four bacterialpathogens.
Figure 2a presents a plot of PC 1 and 2 from an RCF of 98cm�1 and the 500–3700 cm�1 spectral region, and Table IIIprovides the legend as an aid for identification of the dispersionof bacterial points. The algorithm and explanatory text for thecalculation of the 95% confidence limit boundaries for eachgroup of points has been presented elsewhere.52 The percentvariance for PC 1 and 2 are 26.0 and 20.6, respectively.Important observations are apparent. The 2D view in Fig. 2aprovides a satisfactory accounting of the overlapping tenden-cies of the entire dataset. An analysis using different 2Dprojections will be presented with respect to partitioning of thedata by quadrants. Further resolution of some bacteria generaare provided from additional selected multivariate dataspaceplots. The 16 different experiments of the pathogenic BAspores essentially cluster in quadrants 1 and 4 and are found onthe positive side of PC 1 and both positive and negative sidesof PC 2. The points have relatively high loadings on PC 1 andlow loadings on PC 2. Twenty-one of the 22 pathogenic BAvegetative preparations (dark red points) are found in quadrant4, bounded by the positive side of PC 1 and the negative side ofPC 2. Only one point is found in quadrant 1. In addition, thereare four and zero (of 48 total) Yersinia spp. points in quadrants1 and 4, respectively. There are 15 and 7 (of 47 total)nonpathogenic vegetative BA points in quadrants 1 and 4,respectively. The nonpathogenic vegetative BA sub-cluster isalmost completely separated from the pathogenic vegetativeand spore BA bacteria in quadrant 1. Eight of 47 total pointsencroach into the Bacilli regions. Quadrants 1 and 4 containfour and two Brucella spp. points (of 13 total), respectively,and they possess relatively low loadings on both PC axes.
Quadrant 4 characterizes the pathogenic spore and vegeta-tive strains of BA to a large extent. This is significant, becausean explanation cannot be based solely on the presence ofCaDPA. The CaDPA organometallic chelate occurs uniquelyin the spore forms of Bacillus and Clostridium species.53,54 Thechelate compound produces fairly narrow IR peaks in the 600–1700 cm�1 region,55–59 and the latter are labeled in Fig. 1f. Asatisfactory explanation for the partitioning of the pathogenicBA species from the rest of the organisms may include IRspectral contributions from the proteins, transfer RNA,messenger RNA, ribosomal synthesis of peptides and proteins,mitochondria, plasmid material, and other biological macro-molecules that are necessary in the manufacture of the lethalproteinaceous biological molecules and CaDPA in the cell,60–65
as well as the lethal products and CaDPA chelate themselves.These biological components distinguish the two pathogenic
Bacilli from the three Gram-negative organisms and nonpatho-genic vegetative BA. Except for CaDPA, both pathogenicBacillus species possess no specific or unique peak or peaks intheir IR absorption spectra (Figs. 1e and 1f). Instead, thebiological components responsible for the pathogenicity in theBA species add their spectral contributions to that of the rest ofthe cellular machinery, because their IR absorption peak(s) arenonspecific in nature in comparison to the spore CaDPAcomponent.
Figure 2a shows that the second quadrant, bounded by thenegative side of PC 1 and the positive side of PC 2, contains noBrucella spp. points and 19 of the 47 total points of thenonpathogenic vegetative strains of BA.
The second quadrant also contains a majority of the Yersiniaspecies (37 of 48 points). The Brucella spp. points display acluster that can be found in quadrant 3 and close to the origin inthe PC plot. Only six of the 47 spectral points of thenonpathogenic vegetative BA species are found in the thirdquadrant. The latter BA points are dispersed about the origin,where quadrants 1, 2, 3, and 4 contain 15, 19, 6, and 7 points,respectively. There are no apparent growth media or age trendsin the dispersion of the nonpathogenic vegetative BA points.
In summary, it appears that the positive side of PC 1 includesall of the Gram-positive pathogenic BA strains and approxi-mately half (22 of 47) the points of the nonpathogenicvegetative BA strains. The negative side of PC 1 describes 25of 47 total points for the Gram-positive nonpathogenicvegetative BA strains and 59 of 69 total points of the Gram-negative pathogenic and nonpathogenic bacteria.
The spore component in Fig. 2a can be magnified in detailby another 2D representation of the multivariate dataspace inFig. 2b. The percent variance of PC 1 and 5 are 21.1 and 4.7,respectively. Figure 2b presents a PC 1–5 plot consisting of the600–1800 cm�1 range and 19.6 RCF, and the spore componentis clearly distinguished from the rest of the bacteria. The BAspore set occupies the positive side of PC 1 and both positiveand negative sides of PC 5. The remaining points on thepositive side of PC 1 have very low loadings with respect to thespore data and therefore display relatively low intensities in aspectral loading plot compared to that of the spores (data notshown). These remaining points include 11 of a total of 47nonpathogenic vegetative BA points and three pathogenicvegetative BA points. The information in quadrants 1 and 4 forthe pathogenic BA spores (Fig. 2b) shows that the 1029 andLA1 strains are somewhat dispersed about the right and leftsides of the outlined spore region. The letters refer to eachexperiment as listed in Table IV, and they constitutepermutations of the pathogenic strain, growth media, andgrowth time. Experiments a through i in Fig. 2b lie on the leftside of the spore cluster, and experiments j through p lie on theright side of the cluster. The growth medium in this caseseparates the spores into two clearly distinguishable groups.Bacterial experiments a–i used SBA as the growth medium,and bacterial experiments j–p used NSM as the growthmedium. Both sets of growth media are represented by 2, 4,and 7 days of bacterial incubation time (Table IV). Also notethat the Ames strain (points g, h, i, n, o, and p) forms a sub-cluster (dashed enclosure) in the center of the spore cluster.However, one point from the BA 1029 strain (point a) is foundin the Ames sub-cluster.
The FT organism is split into two closely spaced groups inquadrant 3 with four experiments in each group (Fig. 2c). The
20 Volume 63, Number 1, 2009
analytical parameters consisted of the 600–1800 cm�1 spectralrange and an RCF of 49 cm�1. The percent variances of PC 1and 5 are 23.9 and 5.9, respectively. The numbers refer to theage of the preparations (1, 2, 5, and 7 days). It appears thatthere is some separation with respect to the one- and two-dayage periods, and the TSB and BHI growth media have less ofan effect on the spectral features with respect to differentiation.These points are well separated from the rest of the organisms.The 5- and 7-day mature timeframe was investigated for FTwith CHOC and TSB growth media. A combination of theseparameters shifted the spectra relatively closer to the origin ofthe PC plot, and the four spectral points lie in close proximityto each other. The separation between the 1- and 2- and the 5-and 7-day FT samples in Figs. 2c could be due to age, differentgrowth medium, or a combination of both parameters. All eightFT spectra essentially lie outside of the clusters of the otherorganisms (Fig. 2c). Visual differences are observed betweenthe IR absorption spectra of FT (Fig. 1b) and the other bacteria(Figs. 1c–1g), and these differences are such that the FT spectraare relatively isolated to the periphery of the clusters of theother bacterial points.
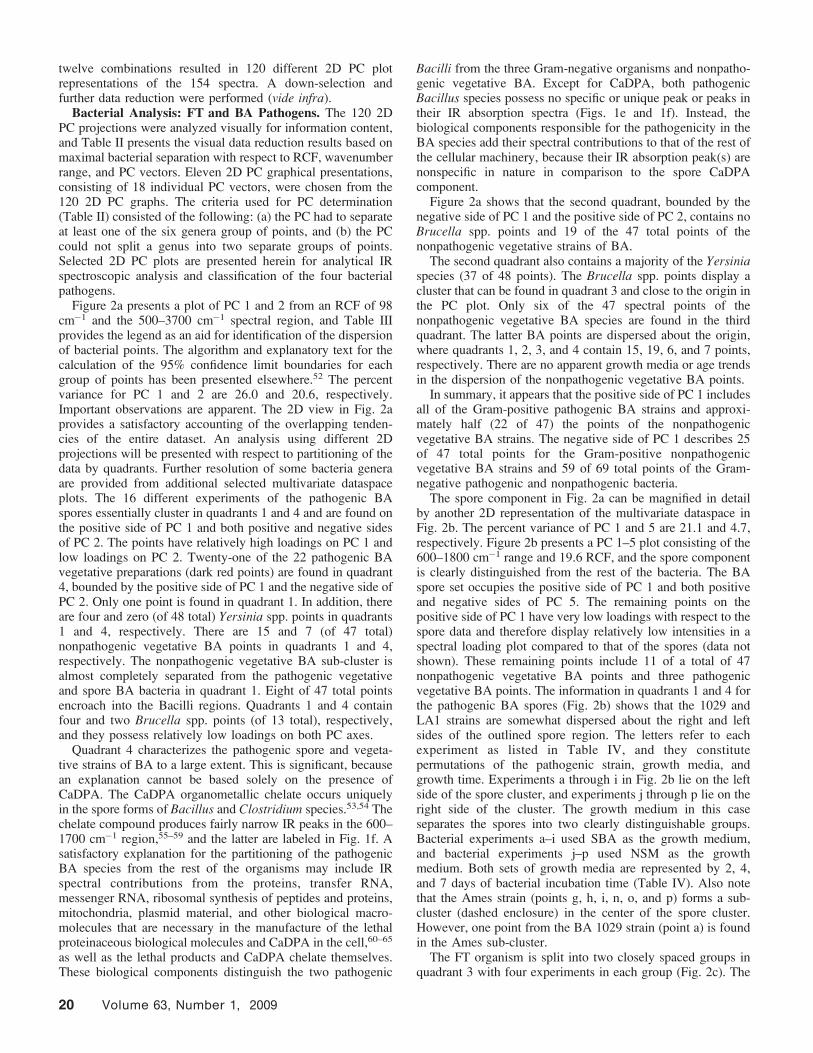
Bacterial Analysis: Yersinia Species. Two PC plots havebeen selected that provide Yersinia spp. information using a 49cm�1 RCF. Depending on the 2D projection, greater clarity canbe achieved with respect to Yersinia spp. grown in differentmedia. Figure 3a portrays a PC 1–3 projection of the bacterialdata using the 600–1800 cm�1 wavelength range. The percentvariance of PCs 1 and 3 are 23.9 and 13.1, respectively. Allthree strains (Table III) of Yersinia spp. grown in BHI media(red points) and TSB media (green points) partition into thered-colored 95% confidence limit region (Fig. 3a). Most of theremainder of the Yersinia spp. points are in the blue-colored95% confidence limit region grown in TSA (blue points) andNSM media (tan points). Essentially, the three Yersinia speciescan be differentiated by their growth media conditions using IRabsorption spectroscopy. This is a significant observation; theTSA/NSM grown organisms can be considered as a subset ofthe organisms grown in BHI/TSB as shown in Fig. 3a. Extracare was taken to ensure that the growth media componentswere removed by multiple washings and centrifugation.Having established a general separation of Yersinia speciesbased on visual analysis, additional PC aspects were sought fora further degree of separation.
Figure 3b shows a PC 1–4 graph from a 49 cm�1 RCF and
the 600–1800 cm�1 wavelength range, and the percent varianceof PC 4 is 8.0. The Yersinia spp. points are virtually all presentin the third quadrant. A minimal number of points from theother genera are present in quadrant 3. Five nonpathogenicvegetative BA and five Brucella spp. points lie near the originof the Yersinia spp. cluster in the third quadrant. However, onlyfour BA and two Brucella spp. points are contained in bothYersinia spp. boundaries. The Yersinia spp. cluster canessentially be partitioned into two regions according to thegrowth media as shown in Fig. 3b. The left sub-cluster, withthe red- and green-colored symbols, contains the rhodei,enterocolitica, and pestis species grown in BHI and TSBmedia, and the right sub-cluster, containing the blue- and tan-colored symbols, represents those three species grown in NSMand TSA media. Age of suspension had no effect, because the1-, 2-, 3-, and 4-day-old suspensions were randomly dispersedwithin the entire Yersinia spp. cluster. The two 95% boundariesof the Yersinia spp. points show a small degree of overlap.However, one is not a subset of the other to the extent of that inFig. 3a. Only a relatively minor amount of encroachment byother bacteria is observed in the Yersinia spp. 95% confidencelimit regions in quadrant 3. Only four Yersinia spp. pointsgrown in BHI/TSB media reside in the second quadrant, andthese points extend the BHI/TSB boundary into the secondquadrant. No other bacterial genus points reside in the TSA/NSM Yersinia spp. boundary.
Gram-Positive and Gram-Negative Delineation. Thevegetative and spore forms of BA are categorized as Gram-positive organisms, while the other three genera are Gram-negative. The primary difference between the two Gramdistinctions is how the bacteria retain dyes that are appliedduring a staining procedure. The cell wall of a Gram-positiveorganism contains 90% more peptidoglycan than the cell wallof Gram-negative organisms. In addition, Gram-negativebacterial cell walls contain a layer of lipopolysaccharide.During the staining process, crystal violet is first applied to acell preparation. Iodine is applied afterwards, and then adecolorizing agent such as acetone is applied. The crystal violetand iodine form a complex (CV-I) that is larger than just thecrystal violet molecule that entered the cell. In Gram-positivecells, the acetone cannot leach out the CV-I complex becausethe peptidoglycan is not disrupted or modified by the acetone.In Gram-negative cells, the acetone disrupts the lipopolysac-charide outer membrane and allows the CV-I complex to bewashed out of the relatively thin peptidoglycan layer.
Figure 4 provides a 2D PC projection of the entiremultivariate dataset that dramatically distinguishes and pro-vides a correlation between separation tendencies and the Gramstain reaction. A very small amount of overlap exists betweenthe two broad 95% confidence limit regions of the Gram-positive (Gþ) and Gram-negative (G�) organisms in Fig. 4.Thus, PC 1–3, from a 19.6 RCF in the 500–3700 cm�1 spectralrange (Fig. 4), provides a satisfactory delineation of the twogroups of bacteria. The percent variance of PC 1 and 3 are 17.8and 11.0, respectively. This separation appears to significantlycorrelate with their Gram classification.
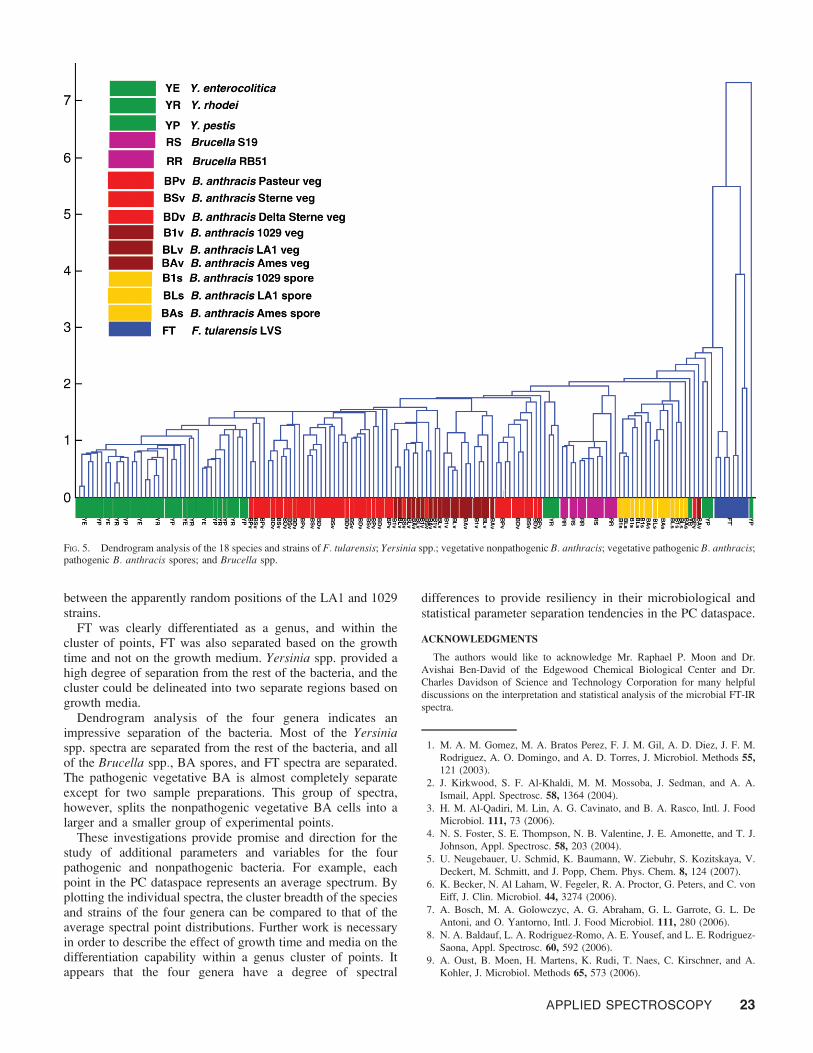
Dendrogram Analysis. The 18 PC vectors in Table II wereused as the basis for the dendrogram in Fig. 5. A dendrogramconverts multiple PC vectors into a one-dimensional depictionof the linkage distance between individual points in the PCdataspace. The shorter the vertical lines (light blue) thatconnect any two individual spectra (two points on the
TABLE IV. B. anthracis spore growth media and age conditions.
Symbol (Fig. 2b) Strain Growth mediuma Time (days)
a SBA, sheep’s blood agar; NSM, nutrient sporulation medium.
APPLIED SPECTROSCOPY 21
abscissa), the closer those two points are in the PC multivariatedataspace.
Significant degrees of delineation are observed where 39 ofthe 48 Yersinia spp. points (green) form their own cluster at thefar left in the dendrogram. This observation is mirrored in theprincipal components plot in Figs. 3a and 3b. All the Brucellaspp. points cluster together and 33 of the 47 points for thenonpathogenic vegetative BA cluster together (light red).Eleven of the remaining nonpathogenic vegetative BA pointscoalesce into a cluster separated by the pathogenic vegetativeBA species (dark red) and a small cluster of four Yersiniapoints. One nonpathogenic vegetative BA point (‘‘outlier’’) liesclose and to the right of the BA spore cluster. Fifteen of the 22
pathogenic vegetative BA points (dark red) cluster together.Six of the remaining seven points are found to the left and veryclose to the main 15-point cluster. All of the pathogenic BAspore points cluster together. The spectra of the nonpathogenicvegetative BA (light red) species essentially bracket or‘‘enclose’’ the pathogenic vegetative BA cluster of points (darkred). This indicates a similarity in the spectra of the pathogenicand nonpathogenic bacterial vegetative forms. However, thespore form produces spectral elements so as to shift its positionin the dendrogram further away from the vegetative forms. TheBA spore spectra provide a uniform, homogeneous cluster(yellow) situated between Brucella on the left side (pinkpoints) and the few ‘‘outlier’’ Yersinia and vegetative BAspectra on the right side. The inherent biomolecules that conferpathogenicity to BA, whether in the spore or vegetative state,provide sufficient distinguishing spectral elements to allow fora relatively straightforward statistical separation. All eight FT(blue) points in Fig. 5 cluster together at the far right of thedendrogram.
CONCLUSION
Fourier transform infrared spectroscopy has been shown toprovide a degree of differentiation for cultures of a number ofhuman pathogenic bacteria. In addition, a number ofmicrobiological and statistical variables were included to testthe versatility and resiliency of the multivariate analysisdifferentiation capabilities of the bacterial FT-IR spectra. BAspores were well separated from the remaining genera anddespite the two growth media, 2-, 4-, and 7-day growth times,and three strains, all spectra clustered together in a number of2D PC views as well as in the dendrogram. Interestingly, thespores partitioned within the cluster according to growthmedium, and all Ames strain spectra, clustered together
FIG. 4. PC 1–3 plot of the 154 FT-IR absorption spectra using a 19.6 RCF;data were utilized in the 500–3700 cm�1 range. The two major boundariesdelineate the Gram-positive Bacilli (Gþ) and Gram-negative (G�) Yersinia,Brucella, and Francisella genera. Refer to Table III for symbol nomenclature.
FIG. 3. (a) PC 1–3 plot of the 154 FT-IR absorption spectra using a 49 cm�1
RCF; data were utilized in the 600–1800 cm�1 range. TSA, trypticase soy agar;NSM, nutrient sporulation medium; BHI, brain heart infusion; TSB, trypticasesoy broth. (b) PC 1–4 plot of the 154 IR absorption spectra with a 49 cm�1
rolling circle filter; data were utilized in the 600–1800 cm�1 range. Refer toTable III for symbol nomenclature.
22 Volume 63, Number 1, 2009
between the apparently random positions of the LA1 and 1029strains.
FT was clearly differentiated as a genus, and within thecluster of points, FT was also separated based on the growthtime and not on the growth medium. Yersinia spp. provided ahigh degree of separation from the rest of the bacteria, and thecluster could be delineated into two separate regions based ongrowth media.
Dendrogram analysis of the four genera indicates animpressive separation of the bacteria. Most of the Yersiniaspp. spectra are separated from the rest of the bacteria, and allof the Brucella spp., BA spores, and FT spectra are separated.The pathogenic vegetative BA is almost completely separateexcept for two sample preparations. This group of spectra,however, splits the nonpathogenic vegetative BA cells into alarger and a smaller group of experimental points.
These investigations provide promise and direction for thestudy of additional parameters and variables for the fourpathogenic and nonpathogenic bacteria. For example, eachpoint in the PC dataspace represents an average spectrum. Byplotting the individual spectra, the cluster breadth of the speciesand strains of the four genera can be compared to that of theaverage spectral point distributions. Further work is necessaryin order to describe the effect of growth time and media on thedifferentiation capability within a genus cluster of points. Itappears that the four genera have a degree of spectral
differences to provide resiliency in their microbiological andstatistical parameter separation tendencies in the PC dataspace.
ACKNOWLEDGMENTS
The authors would like to acknowledge Mr. Raphael P. Moon and Dr.
Avishai Ben-David of the Edgewood Chemical Biological Center and Dr.
Charles Davidson of Science and Technology Corporation for many helpful
discussions on the interpretation and statistical analysis of the microbial FT-IR
spectra.
1. M. A. M. Gomez, M. A. Bratos Perez, F. J. M. Gil, A. D. Diez, J. F. M.
Rodriguez, A. O. Domingo, and A. D. Torres, J. Microbiol. Methods 55,121 (2003).
2. J. Kirkwood, S. F. Al-Khaldi, M. M. Mossoba, J. Sedman, and A. A.
Ismail, Appl. Spectrosc. 58, 1364 (2004).
3. H. M. Al-Qadiri, M. Lin, A. G. Cavinato, and B. A. Rasco, Intl. J. Food
Microbiol. 111, 73 (2006).
4. N. S. Foster, S. E. Thompson, N. B. Valentine, J. E. Amonette, and T. J.
Johnson, Appl. Spectrosc. 58, 203 (2004).
5. U. Neugebauer, U. Schmid, K. Baumann, W. Ziebuhr, S. Kozitskaya, V.
Deckert, M. Schmitt, and J. Popp, Chem. Phys. Chem. 8, 124 (2007).
6. K. Becker, N. Al Laham, W. Fegeler, R. A. Proctor, G. Peters, and C. von
Eiff, J. Clin. Microbiol. 44, 3274 (2006).
7. A. Bosch, M. A. Golowczyc, A. G. Abraham, G. L. Garrote, G. L. De
Antoni, and O. Yantorno, Intl. J. Food Microbiol. 111, 280 (2006).
8. N. A. Baldauf, L. A. Rodriguez-Romo, A. E. Yousef, and L. E. Rodriguez-
Saona, Appl. Spectrosc. 60, 592 (2006).
9. A. Oust, B. Moen, H. Martens, K. Rudi, T. Naes, C. Kirschner, and A.
Kohler, J. Microbiol. Methods 65, 573 (2006).
FIG. 5. Dendrogram analysis of the 18 species and strains of F. tularensis; Yersinia spp.; vegetative nonpathogenic B. anthracis; vegetative pathogenic B. anthracis;pathogenic B. anthracis spores; and Brucella spp.
APPLIED SPECTROSCOPY 23
10. C. L. Winder, S. V. Gordon, J. Dale, R. G. Hewinson, and R. Goodacre,Microbiol. 152, 2757 (2006).
11. N. M. Amiali, M. R. Mulvey, J. Sedman, A. E. Simor, and A. A. Ismail, J.Microbiol. Methods 69, 146 (2007).
12. N. M. Amiali, M. R. Mulvey, J. Sedman, Marie Louie, A. E. Simor, and A.A. Ismail, J. Microbiol. Methods 68, 236 (2007).
13. N. A. Baldauf, L. A. Rodriguez-Romo, A. Maennig, A. E. Yousef, and L.E. Rodriguez-Saona, J. Microbiol. Methods 68, 106 (2007).
14. C. A. Rebuffo-Scheer, C. Kirschner, M. Staemmler, and D. Naumann, J.Microbiol. Methods 68, 282 (2007).
15. D. Helm, H. Labischinski, and D. Naumann, J. Microbiol. Methods 14,127 (1991).
16. D. Naumann, D. Helm, and C. Schultz, ‘‘Characterization and Identifica-tion of Micro-organisms by FT-IR Spectroscopy and FT-IR Microscopy,’’in Bacterial Diversity and Systematics, F. G. Priest, A. R. Cormenzana,and B. J. Tindall, Eds. (Plenum Press, New York, 1994), pp. 67–85.
17. D. Naumann, ‘‘FT-IR and FT-Raman Spectroscopy in BiomedicalResearch’’, in Infrared and Raman Spectroscopy of Biological Materials,H.-U. Gremlich and B. Yan, Eds. (Marcel Dekker, New York, 2001),Chap. 9, pp. 323–378.
18. D. Naumann, ‘‘Infrared Spectroscopy in Microbiology’’, in Encyclopediaof Analytical Chemistry: Applications, Theory, and Instrumentation;Biomedical Spectroscopy, R. A. Meyers, Ed. (John Wiley and Sons,Chichester, 2000), vol. 1, pp. 102–131.
19. S. Garip, F. Bozoglu, and F. Severcan, Appl. Spectrosc. 61, 186 (2007).20. D. Serra, A. Bosch, D. M. Russo, M. E. Rodriguez, A. Zorreguieta, J.
Schmitt, D. Naumann, and O. Yantorno, Anal. Bioanal. Chem. 387, 1759(2007).
21. O. Preisner, J. A. Lopes, R. Guiomar, J. Machado, and J. C. Menezes,Anal. Bioanal. Chem. 387, 1739 (2007).
22. N. A. Ngo Thi and D. Naumann, Anal. Bioanal. Chem. 387, 1769 (2007).23. L. Marcotte, G. Kegelaer, C. Sandt, J. Barbeau, and M. Lafleur, Anal.
Biochem. 361, 7 (2007).24. A. Subramanian, J. Ahn, V. M. Balasubramaniam, and L. Rodriguez-
Saona, J. Agric. Food Chem. 54, 10300 (2006).25. M. A. Al-Holy, M. Lin, H. Al-Qadiri, A. G. Cavinato, and B. A. Rasco, J.
Rapid Methods Autom. Microbiol. 14, 189 (2006).26. B. Dziuba, A. Babuchowski, D. Nalecz, and M. Niklewicz, Intl. Dairy J.
17, 183 (2006).27. B. Dziuba, A. Babuchowski, M. Dziuba, and D. Nalecz, Milchwissenschaft
62, 28 (2007).28. B. Dziuba, A. Babuchowski, M. Niklewicz, and B. Brzozowski,
Milchwissenschaft 61, 146 (2006).29. M. J. Gupta, J. M. Irudayaraj, Z. Schmilovitch, and A. Mizrach, Tran.
ASABE 49, 1249 (2006).30. M. Wenning, V. Theilmann, and S. Scherer, Environ. Microbiol. 8, 848
(2006).31. D. J. M. Mouwen, R. Capita, C. Alonso-Calleja, J. Prieto-Gomez, and M.
Prieto, J. Microbiol. Methods 67, 131 (2006).32. H. M. Al-Qadiri, M. A. Al-Holy, M. Lin, N. I. Alami, A. G. Cavinato, and
B. A. Rasco, J. Agric. Food Chem. 54, 5749 (2006).33. C. A. Rebuffo, J. Schmitt, M. Wenning, F. von Stetten, and S. Scherer,
Appl. Environ. Microbiol. 72, 994 (2006).34. L. Mariey, J. P. Signolle, C. Amiel, and J. Travert, Vib. Spectrosc. 26, 151
36. I. K. Mikhailyuk and A. P. Razzhivin, Instrum. Exp. Tech. 46, 42 (2003).37. N. N. Brandt, O. O. Brovko, A. Y. Chikishev, and O. D. Paraschuk, Appl.
Spectrosc. 60, 288 (2006).38. A. Wig, E. T. Arakawa, A. Passian, T. L. Ferrell, and T. Thundat, Sens.
Actuators, B 114, 206 (2006).39. T. A. Alexander, Proc. SPIE-Int. Soc. Opt. Eng. 5085, 101 (2003).40. T. A. Alexander, Proc. SPIE-Int. Soc. Opt. Eng. 4574, 100 (2002).41. H. C. van der Mei, D. Naumann, and H. J. Busscher, Arch. Oral Biol. 38,
1013 (1993).42. M. Kummerle, S. Scherer, and H. Seiler, Appl. Environ. Microbiol. 64,
2307 (1998).43. E. Jantzen, B. P. Berdal, and T. Omland, J. Clin. Microbiol. 10, 928
(1979).44. P. D. Nichols, W. R. Mayberry, C. A. Antworth, and D. C. White, J. Clin.
Microbiol. 21, 738 (1985).45. R. Anderson and A. R. Bhatti, Lipids 21, 669 (1986).46. F. Basile, M. B. Beverly, K. J. Voorhees, and T. L. Hadfield, Trends Anal.
Chem. 17, 95 (1998).47. D. Naumann, D. Helm, H. Labischinski, and P. Giesbrecht, ‘‘The
Characterization of Microorganisms by Fourier-Transform IR Spectrosco-py (FT-IR),’’ in Modern Techniques for Rapid Microbiological Analysis,W. H. Nelson, Ed. (VCH Publishers Inc., New York, 1991), Chap. 3, pp.43–96.
48. D. Helm, H. Labischinski, G. Schallehn, and D. Naumann, J. Gen.Microbiol. 137, 69 (1991).
49. T. G. Tournabene, Biochim. Biophys. Acta 306, 173 (1973).50. D. Lawrence, S. Heitefuss, and H. S. H. Seifert, J. Clin. Microbiol. 29,
1508 (1991).51. R. A. Bobo and R. G. Eagon, Can. J. Microbiol. 14, 503 (1968).52. A. P. Snyder, T. T. Wang, and D. B. Greenberg, Appl. Environ. Microbiol.
51, 969 (1986).53. R. S. Breed, E. G. D. Murray, and N. R. Smith, Eds., Bergey’s Manual of
Determinative Bacteriology (The Williams and Wilkins Co., Baltimore,MD, 1957), 7th ed., pp. 295–305.
54. G. W. Gould and A. Hurst, Eds., The Bacterial Spore (Academic Press,New York, 1969).
55. D. Helm and D. Naumann, FEMS Microbiol. Lett. 126, 75 (1995).56. A. P. Esposito, C. E. Talley, T. Huser, C. W. Hollars, C. M. Schaldach, and
S. M. Lane, Appl. Spectrosc. 57, 868 (2003).57. D. L. Perkins, C. R. Lovell, B. V. Bronk, B. Setlow, and M. L. Myrick,
Appl. Spectrosc. 58, 749 (2004).58. S. Farquharson, L. Grigely, V. Khitrov, W. Smith, J. F. Sperry, and G.
Fenerty, J. Raman Spectrosc. 35, 82 (2004).59. D. L. Perkins, C. R. Lovell, B. V. Bronk, B. Setlow, P. Setlow, and M. L.
Myrick, Appl. Spectrosc. 59, 893 (2005).60. P. C. B. Turnbull, J. Appl. Microbiol. 87, 237 (1999).61. E. Helgason, O. A. Okstad, D. A. Caugant, H. A. Johansen, A. Fouet, M.
Mock, I. Hegna, and A.-B. Kolsto, Appl. Environ. Microbiol. 66, 2627(2000).
62. L. Baillie and T. D. Read, Curr. Opin. Microbiol. 4, 78 (2001).63. R. Bhatnagar and S. Batra, Crit. Rev. Microbiol. 27, 167 (2001).64. M. J. Jedrzejas and W. J. M. Huang, Crit. Rev. Biochem. Mol. Biol. 38,
173 (2003).65. M. Gohar, N. Gilois, R. Graveline, C. Garreau, V. S. Sanchis, and D.


![Infrared Spectroscopy[1]](https://static.documents.pub/doc/80x56/5415f1617bef0a7f3f8b49ff/infrared-spectroscopy1.jpg)


