j ourna l homepage: www.e lsev ie r .com/ locate / jappgeo
Clay content evaluation in soils through GPR signal processing
Fabio Tosti a,⁎, Claudio Patriarca b, Evert Slob b, Andrea Benedetto a, Sébastien Lambot c
a Department of Engineering, University Roma Tre, Via Vito Volterra 62, 00146 Rome, Italyb Department of Geoscience & Engineering, TU Delft, Stevinweg 1, 2628 CN, Delft, The Netherlandsc Earth and Life Institute, Université catholique de Louvain, Croix du Sud 2 Box L7.05.02, B-1348 Louvain-la-Neuve, Belgium
The mechanical behavior of soils is partly affected by their clay content, which arises some important issuesin many fields of employment, such as civil and environmental engineering, geology, and agriculture. Thiswork focuses on pavement engineering, although the method applies to other fields of interest. Clay contentin bearing courses of road pavement frequently causes damages and defects (e.g., cracks, deformations, andruts). Therefore, the road safety and operability decreases, directly affecting the increase of expectedaccidents. In this study, different ground-penetrating radar (GPR) methods and techniques were used tonon-destructively investigate the clay content in sub-asphalt compacted soils. Experimental layout providedthe use of typical road materials, employed for road bearing courses construction. Three types of soils classi-fied by the American Association of State Highway and Transportation Officials (AASHTO) as A1, A2, and A3were used and adequately compacted in electrically and hydraulically isolated test boxes. Percentages ofbentonite clay were gradually added, ranging from 2% to 25% by weight. Analyses were carried out for eachclay content using two different GPR instruments. A pulse radar with ground-coupled antennae at 500 MHzcentre frequency and a vector network analyzer spanning the 1–3 GHz frequency range were used. Signalswere processed in both time and frequency domains, and the consistency of results was validated by theRayleigh scattering method, the full-waveform inversion, and the signal picking techniques. Promising resultswere obtained for the detection of clay content affecting the bearing capacity of sub-asphalt layers.
The evaluation of clay content in soils is significant formany applica-tions such as agriculture (Robinson and Phillips, 2001), construction(Miqueleiz et al., 2012), geotechnical stability analyses (Abushararand Han, 2011), and the assessment of the bearing capacity of soils forstructural foundations. Generally, the presence of clay in cohesive soilsis strictly related to moisture, by virtue of its strong hygroscopiccapacity (Sdiri et al., 2011). This co-action, along with the variabilityof climatic and seasonal environmental conditions, is the main causeof instability behavior of soils under load.
Traditionally, the hydrodynamic behavior of plastic soils is modeledduring wetting–drying cycles (Dudoignon et al., 2007). The propertiesof clayey soils under compressive or drying stress cycles are greatlyinfluenced by particle arrangements and their mineralogical nature(Richard et al., 2001). Beroya et al. (2009) demonstrated that the cyclicbehavior of silt–clay mixtures is mainly governed by clay mineralsabundance. In particular, given the same amount of clay/clay mineraland/or the same value of plasticity index, the montmorillonitic soils
have higher cyclic strength than the illitic and kaolinitic soils. Therefore,the clay fraction and plasticity index are unreliable indicators of theliquefaction susceptibility of cohesive soils, without considering theclay mineralogy and its different adhesive bond strength exerted onthe boundary particles. Model-scale tests are generally used to assessthe volumetric changes of clay materials in gravimetric moisturedomains within the liquidity limit (WL) and the shrinkage limit (WS)(Chertkov and Ravina, 2000). In the unsaturated domain, the shrinkagecurves and the associated size of cracks vary with respect to the scale ofinvestigation (Voltz and Cabidoche, 1995). Therefore, in-situ conse-quences of clayey soils drying typically are: development of shrinkagecracks with associated vertical prism-like structure (Chertkov, 2005),and subsidence effects (Hallaire, 1987).
In pavement engineering, driving safety is strictly related to pave-ment surface conditions (Tighe et al., 2000). Cracks, potholes, andsurface deformations generate sudden vertical accelerations on thevehicle tires, decreasing the effective friction between tires and pave-ment. Such road damages are mostly related to a reduction of thebearing ratio of the sub-base and sub-grade courses (Diefenderferet al., 2005). Previous researches demonstrated that structuraldamage in road pavement depends on the moisture percentage insub-asphalt courses (Benedetto and Pensa, 2007). In particular, inthe case of clayey unbound courses, the infiltration of water throughthe pavement causes the transport of plastic materials. This type of
70 F. Tosti et al. / Journal of Applied Geophysics 97 (2013) 69–80
damage is classified as pumping and it is caused by several factors, suchas inadequate compaction during construction, poor mix design, highwater table, and poor drainage (Al-Qadi et al., 2004; Tosti andBenedetto, 2012).
Different procedures are carried out to constrain the effects of claycontent in soils for both road construction and rehabilitation. Abdi et al.(2009) investigated the possibility of strength improvement of claysreinforced with geogrids embedded in thin layers of sand. Treatmentsof soils with additives such as cement, lime, fly ash, and chemicals arealso widely used (Pakbaz and Alipour, 2012). Moreover, the use ofextra reinforcing steel to foundations and slabs is widespread, as wellas earthmoving operations to remove the unstable cohesive material(Wood et al., 1995). Core sampling is the most used technique to evalu-ate the clay content in soils. This method is characterized by a high accu-racy, although it is invasive, expensive, and time-consuming. Moreover,the significance of such kind of punctual analysis is low for road pur-poses, due to the large area to be surveyed.
Several non-destructive methods can be applied to indirectlymonitor the clay fractions in soils. Measurements can be providedby the light falling weight deflectometer (LFWD) (Benedetto et al.,2012a) and the time domain reflectometry (TDR) minor destructivesystem. LFWD is used to evaluate the resilient modulus of soils, anddifferent correlations with fine-grained and cohesive soils are provid-ed (George, 2000). Researches have been carried out with the TDRsystem for monitoring the water content in clayey soils (Robinsonet al., 2003). Several other methods have been developed to directlyassess clay fractions in soils, on the basis of advanced veryhigh-resolution radiometer (AVHRR) (Odeh and McBratney, 2000),electromagnetic induction (EMI) (Triantafilis and Lesch, 2005), andvis–NIR spectroscopy data (Viscarra Rossel et al., 2009). However,most of these non-destructive tools for direct and indirect assessmentof clay content are not time-efficient and not effective for wide roadsinspection and maintenance, since they provide only localmeasurements.
To collect representative data, large-scale effective measurementsare needed. In that respect, ground-penetrating radar (GPR) is awidely used diagnostic non-destructive tool that allows collectingdata rapidly on the field (Benedetto et al., 2012b; Saarenketo andScullion, 2000). With GPR it is possible to infer the physical condi-tions of subsurface layers through the transmission/reception of elec-tromagnetic waves in a given frequency band (Daniels, 2004; Van derKruk and Slob, 2004). Most recent technological advances (Slob et al.,2010) lead to consider such instrument as the most flexible of all thegeophysical detection tools, with employment in a range of manyapplication areas, such as planetary exploration, cultural heritage,agriculture, civil engineering, and geosciences.
In pavement engineering, the applications include the assessmentof pavement courses thicknesses (Al-Qadi and Lahouar, 2004), voidsdetection underneath pavements (Lau et al., 1992), delaminationand reinforcing bars detection (Huston et al., 1999), location of buriedobjects (Ayala-Cabrera et al., 2011), asphalt stripping (Scullion et al.,1994), and bridges inspection (Benedetto et al., 2012c). Traditionally,the benefits of GPR are demonstrated for wide-ranging applicationson the basis of dielectric permittivity estimates (Davis and Annan,1989). In this sense, GPR is largely used for inferring the volumetricwater content of soils in unsaturated porous media, assuming thatin three-phase mixtures the dielectric constant of water providesthe main contribution to the value of the bulk permittivity. In that re-spect, Topp et al. (1980) proposed a general empirical correlationsuitable to many types of soils. More recently, various theoretical ap-proaches relate soil moisture and permittivity through dielectricmixing models (Fiori et al., 2005; Huisman et al., 2003; Tran et al.,2012).
Thesemethods depend on the evaluation of the relative permittivity,generally assessed from the delay time of pulses reflections (Benedetto,2004) or from the amplitudes and arrival times of the transmitted and
reflected signals (Al-Qadi et al., 2004; Lambot et al., 2006). In any case,these approaches require preventive calibration to evaluate the EMwave velocity into the medium; hence, the use of core sampling isneeded to define characteristics and conditions of materials. Nowadays,enhanced and self-consistent approaches are spreading out based on theGPR signal processing in the frequency domain, with the main objectiveto raise both the efficiency and effectiveness of sub-surfaces surveys.Lambot et al. (2004) studied the imaginary part of the dielectric permit-tivity as a function of the frequency of investigation, to assess the electri-cal properties of soils. In particular, the GPR response in the frequencyand time domains is processed using Green's functions combined withan intrinsic antenna model in a full-wave inversion framework. Thevalidation of this method demonstrated an excellent agreement be-tween the GPR-derived values and reference TDRmeasurements of per-mittivity. In addition, this technique also showed high effectiveness fornon-destructive testing for building materials (Patriarca et al., 2011).Another approach provides the use of a non-linear inversion algorithmin the frequency domain for the evaluation of the shallow soil properties(Oden et al., 2008). In particular, the early-time arrivals of signals wereanalyzed, based on their amplitude and shapemodulationwith differentconfigurations of antenna standoff and soil dielectric characteristics(Pettinelli et al., 2007). More recently, Benedetto (2010) presentedanother self-consistent method for the direct evaluation of watercontent. The signal was herein analyzed in the frequency domain, andthe method is focused on the Rayleigh scattering of the signal accordingto the Fresnel theory. The procedure was validated on different typesof soils. The predicted value of water content is a function of boththe peak of frequency extracted from the frequency spectrum of thebackscattered signal, and a couple of regression coefficients values,case by case.
2. Methodology and objectives
In this paper, the ability of GPR to evaluate clay content in soils isanalyzed using different signal processing techniques. Three types ofsoils classified by AASHTO as A1, A2, and A3 were used and bentoniteclay was gradually added from 2% to 25% by weight. The consistencyof results was validated by the Rayleigh scattering method, the full-waveform inversion, and the signal picking techniques.
The main objectives of this work are to provide a contributionto road safety, preventing the risk of severe damage of pavement,which is induced by clay content in sub-asphalt layers, and toimprove the operations of rehabilitation and maintenance throughan effective inspection.
The specific objective of the research is the evaluation of clay con-tent with GPR, through different signal processing techniques. Thesemethods are applied in sub-grade and sub-base soil samples usingdifferent GPR systems.
3. Theoretical background
3.1. Time-domain signal picking
The GPR method operates on the basis of an electromagnetic (EM)impulse transmitted into the soil and reflected back to a receivingantenna(s). Theoretically, it is possible to approximate the receivedsignal y(t) as the sum of successive scaled and delayed replicas relatedto the transmitted pulse signal, with the addition of noise. This modelis described by the following equation (Wu et al., 1999):
y tð Þ ¼XI
i¼1
aih t−τið Þ þ e tð Þ ð1Þ
where h(t) is the transmitted signal, and y(t) is the received signal. y(t)computes I replicas of h(t), characterized by different amplitudes{ai}i = 1,I and delays {τi}i = 1,I, and e(t) as the random additive noise.
71F. Tosti et al. / Journal of Applied Geophysics 97 (2013) 69–80
Maxwell's equations describe the EM wave propagation in a con-ductive (lossy) medium, such as soils, and the solution is representedby a harmonic plane wave, expressed as a function of the electric fieldintensity E0, and the complex propagation factor k. This is described ask ¼ ω
=ωεr ′ is the losstangent expressed as a function of the electrical conductivity σ, thepermittivity of free space ε0, the real part of the relative permittivityεr′, and the imaginary part of the relative permittivity εr″.
Considering ω ≫ σ′ and ω ≫ σ″ and ε″ ≪ ε′, it is possible toexpress the approximation v ¼ c=
ffiffiffiffiffiffiεr ′
p, where c is the propagation
velocity in free space, and v is the propagation velocity in the medium.Therefore, the time delays between the pulses reflectionsΔt depend onthe medium thickness r, according to r = (vΔt)/2.
3.2. Full-waveform inversion technique
3.2.1. The radar modelIn the intrinsic far-field antenna model of Lambot et al. (2004),
which applies to planar layered media, a local plane wave fielddistribution is assumed for the backscattered field over the antennaaperture, and hence, an equivalent single electric dipole approximationholds for describing the antenna radiation properties. Relying onthe linearity of Maxwell's equations, wave propagation between thepoint source or field point and the radar transmission line referenceplane is accounted for by means of complex, frequency-dependentglobal reflection, and transmission coefficients. These reflection andtransmission coefficients determine the antenna and transmissionline internal transmissions and reflections, and thereby antenna–medium interactions are inherently accounted for. The radar equationexpressing the relation between the radar-measured field and the3-D layered medium Green's functions is described in the frequencydomain as follows (Lambot et al., 2004):
S11 ωð Þ ¼ b ωð Þa ωð Þ ¼ Ri ωð Þ þ T ωð ÞG↑
xx ωð Þ1−Rs ωð ÞG↑
xx ωð Þ ð2Þ
where S11(ω) denotes the raw radar signal expressed here as the ratiobetween the backscattered field b(ω) and incident field a(ω) at theradar transmission line reference plane, with ω being the angularfrequency, Ri(ω) is the global reflection coefficient of the antenna infree space, T(ω) = Ti(ω)Ts(ω) with Ti(ω) being the global transmissioncoefficient for fields incident from the radar reference plane onto thepoint source and Ts(ω) being the global transmission coefficient forfields incident from the field point onto the radar reference plane,Rs(ω) is the global reflection coefficient for the field incident from thelayeredmedium onto the field point, and Gxx
↑ (ω) is the layered mediumGreen's function. The Green's function is defined as the scatteredx-directed electric field Ex(ω) at the field point for a unit-strengthx-directed electric source Jx(ω) at the source point. The Green's functioncan be derived using a recursive scheme to compute the global reflec-tion coefficients of the multilayered medium in the spectral domain.The transformation back to space domain is performed by evaluatingthe semi-infinite integral with a fast numerical procedure (Lambot etal., 2007). The antenna characteristic coefficients can be determinedby solving a system of equations similar to Eq. (2) with differentknown Green's functions corresponding to different configurations forwhich the radar measurements are performed (e.g., measurementswith the antenna at different heights over a copper sheet). It is worthnoting that once the antenna characteristic functions are known, theantenna effects can be fully filtered out from the raw radar dataS11(ω) to derive the measured medium Green's function Gxx
↑ (ω).
3.2.2. Model inversion and objective functionsThe application of inverse modeling for subsurface parameter
assessment is a problem of non-linear optimization, with the maingoal to find the parameter vector b = [εn, σn, hn], n = 1,…, N,
where N is the number of medium layers, by the minimization of anobjective function φ(b). Regarding the components of vector b, thecombination of them for the nth layer includes εn as the dielectric per-mittivity, σn [S m−1] as the electrical conductivity, and hn [m] as thethickness of the layer. In particular, the electrical conductivity σ isfrequency-dependent assuming a linear relationship, valid if thebandwidth is not too large (Lambot et al., 2005):
σ fð Þ ¼ σ f minþ a f−f minð Þ ð3Þ
where σfminis the reference apparent electrical conductivity at the
minimum frequency, and the medium-specific constant a is the linearvariation rate of σ(f).
The objective function φ(b) to minimize can be defined as:
φ bð Þ ¼
Xf max
f min
G�↑xx−G↑
xx
��� ���2Xf max
f min
G�↑xx
��� ���2
0BBBBB@
1CCCCCA
12
ð4Þ
where Gxx*↑=Gxx*↑(ω) and Gxx↑ = Gxx*↑(ω b) are the vectors accounting,
respectively, the observed and simulated Green's functions. Thenon-linearity of the problem usually lead to multiple local minima,therefore the solution is found by using the global multilevelcoordinate search (GMCS, Huyer and Neumaier, 1999) sequentiallycombined with the Nelder–Mead Simplex algorithm (Lambot et al.,2002).
3.3. Rayleigh scattering method
The approach is focused on the Rayleigh scattering of the signal onthe basis of the Fresnel theory (Benedetto, 2010), with the main goalto evaluate the water content in unsaturated soils. Scattering aregenerated by singularities or non-homogeneities in electromagneticimpedance. The process occurs when the dimensions of these non-uniformities are much smaller than the wavelength of the EM wave.Analytically, it is possible to define the size of a scattering particleby the ratio x = 2πr / λ, where r is the radius of the particle, and λis the wavelength of the signal. Rayleigh scattering can be definedas scattering in the small size parameter regime x ≪ 1. Scatteringfrom larger spherical particles is explained by Mie (1908) for an arbi-trary size parameter x. For small values of x, the Mie theory reduces tothe Rayleigh approximation.
Several assumptions on the three-phase porous medium proper-ties and simplifications of the physics led to define the following for-mulation (Benedetto, 2010):
I θ; vð Þ ¼ I0 vð Þ1þ cos2θ2R2
2πvc0
ffiffiffiffiffiffiffiffiffiffiffiffiffiffiffiffiffiffiffiffiffiffiffiffiffiffiffiffiffiffiffiffiffiffiffiffiffiffiffiffiffiμr ε∞ þ Δε
1þ v2τ2
� �s" #4 μr ε∞ þ Δε1þv2τ2
� −1
μr ε∞ þ Δε1þv2τ2
� þ 2
24
352
d2
� �6
ð5Þ
where R is the distance between the observer and the particle, θ is theangle of scattering, ν is the frequency of the EM signal, c0 is the veloc-ity of free space, μr is the magnetic permeability, ε∞ is the dielectricconstant of the full-polarized medium at an infinite frequency EMfield, Δε = εstatic − ε∞ is the difference between the permittivitiesof a steady and an infinite frequency EM field, τ is the relaxationtime, and d is the diameter of the particle. This method provides theprocessing of the signal in the frequency domain. The scattering pro-duces a non-linear modulation of the electromagnetic signal, as afunction of the moisture content. According to Eq. (5), the various fre-quency components of the frequency spectra are differently scattered,depending on the soil type and water content.
72 F. Tosti et al. / Journal of Applied Geophysics 97 (2013) 69–80
Several correlations were provided between the shift of the peakand the water content for different types of soils. The general expres-sion proposed to predict the moisture content w [%] is defined as(Benedetto, 2010):
w ¼ A−f Pð Þ=B ð6Þ
where A and B are regression coefficients calibrated using the exper-imental data from different soil samples, and fp [Hz × 108] is thevalue of the peak of frequency.
In the present paper, the Rayleigh scattering method was appliedto evaluate clay content in soils under dry conditions, according to re-cent researches on the behavior of clay particles in atmospheric air,under the application of an external EM field (Rozynek et al., 2012).
4. Experimental framework
4.1. Experimental design
The experimental design is aimed to obtain a reliable evaluation ofclay content in sub-asphalt soils. Typical road material for sub-baseand sub-grade construction was used. Clay was gradually added indifferent known contents.
Preliminary procedures were carried out for adequately mixing andcompacting the investigated soil samples. Themixing protocol providesthe use of a known quantity of iron filings, mixed with the undisturbedsoil at different time steps, and randomly sampled to assess the homo-geneity of the mixture. Tests showed that a clay initial rate at 2% byweight was uniformly distributed into the investigated volume. More-over, different time steps of vibration were carried out to analyze thegrade of compaction of the samples. The obtained values of densityshowed that compaction remains fairly constant beyond the 60 s ofvibration. Further comparisons with the values of compaction by Stan-dard Proctor tests (American Society for Testing and Materials, 2007),demonstrated a high consistency of the outcomes from the mixingprocedure with those arising from the modified Proctor with largemold. The bulk density of each soil sample was collected, as well asthe real density of the mixtures, for cross checking. The measurements
Fig. 1. GPR devices and equipment: (a) vector network analyzer; (b) p
were carried out using two different GPR instruments, as will bedescribed later.
4.2. Test devices and equipment
Different GPR systemswere used for the analyses. An ultrawideband(UWB) stepped frequency continuous wave (SFCW) radar was set-upusing a vector network analyzer (VNA) manufactured by HewlettPackard (8753C, 300 kHz–3 GHz) (Fig. 1a). The antenna used was alinear polarized double-ridged broadband TEM horn (BBHA 9120 A,Schwarzbeck Mess-Elektronik), in a monostatic configuration. A highquality SMA-type 50 Ω coaxial cable connected the VNA to the antennathrough an SMA-N adaptor. Antenna dimensions are 220 mm lengthand the aperture area is 142 mm2 × 245 mm2; its nominal frequencyrange is 0.8 GHz–5 GHz, with an isotropic gain ranging from 6 dBi–14 dBi. The feasibility of far-field measurements is allowed by thesmall 3-dB beamwidth of the antenna. The VNA was calibrated at theconnection between the antenna feed point and the cable. Measure-ments were collected as the frequency-dependent complex ratio S11 ofEq. (2) between the returned and emitted signals. Data were acquiredin a bandwidth from 1 GHz to 3 GHz. The signal was sampled in thefrequency domain at 1282 frequencies with a ~1.56 MHz frequencystep. The VNA calibration at the connection cable–antenna feed pointwas carried out with the Open-Short-Match calibration kit hp85033c.
Another radar with ground-coupled antennae (pulseEKKO PROmanufacturedby Sensors andSoftware Inc., Canada)was used in a bistaticconfiguration and common offset for the GPR analyses (Fig. 1b). Thetransmitter and receiver were linked by optic fiber electronic modulesand operated at 500 MHz centre frequency. Data were acquired in thetime domain, in a 40 ns time window with a time step of 5 × 10⁻² ns.
Radar measurements were carried out under controlled laboratoryconditions (Laboratory temperature 19 °C ± 2.5 °C; relative humidity45% ± 15%; absolute pressure about 1 atm). The soil samples werelocated in electrically and hydraulically isolated boxes that measure0.45 m long × 0.55 m wide × 0.12 m deep, so that their referencedimensions are 0.40 m long × 0.47 m wide × 0.105 m deep. Beneaththe soil sample, a perfect electric conductor (PEC) consisting of acopper sheet, allowed to completely reflect the waves propagatingthrough the investigated material. In particular, this small layer
ulseEKKO PRO ground-coupled radar (500 MHz centre frequency).
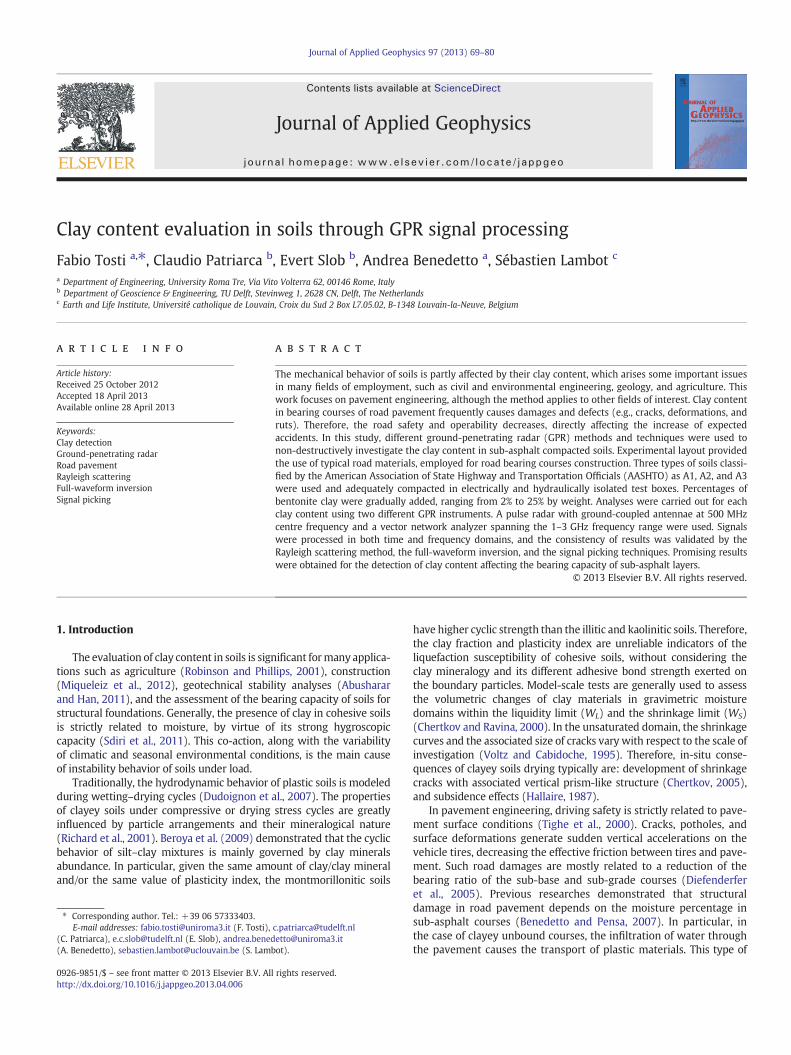
Fig. 2. Typical road materials used for the tests: (a) A1 gravel; (b) A2 coarse sand; (c) A3 fine sand; (d) bentonite clay.
73F. Tosti et al. / Journal of Applied Geophysics 97 (2013) 69–80
prevents from the propagation of the EM waves through the floor, thuspreventing noise or disturbances that may arise from undesired reflec-tions of the underneath concrete and its embedded reinforcement bars.
4.3. Materials and laboratory testing
Road material, typically employed for sub-grade and sub-basecourses was used. In particular, three different soil types, classifiedby the AASHTO Soil Classification System (American Association ofState Highway and Transportation Officials, 2011) as A1, A2, and A3were tested. Fig. 2(a, b, and c) shows, respectively, gravel (A1AASHTO group, grain size 4–8 mm), coarse sand (A2 AASHTOgroup, grain size 1–2 mm), and fine sand (A3 AASHTO group, grainsize 0.125–0.250 mm).
Bentonite clay (Fig. 2d) was gradually added from 2% to 25% byweight, at 2% and 5% steps. The mineralogy of this clay is mainly com-posed by smectite, whose mineral consists of silica (62% by weight)and alumina (21% by weight) sheet-like units, tied together. Moreover,
Table 1Main physical properties, grade, and classification of the bentonite clay used for the experi
Material Granulometric analysis Main p
P0.125[%]
P0.090[%]
P0.063[%]
ρs106 ×
Bentonite clay 98 95 88 2.410
a chemical analysis showed a considerable rate of crystal water (5.5% byweight). Water intrusion between the sheets causes the separation ofthe mineral thin units, therefore bentonites present sudden dispersionin water, in the form of small particles. Table 1 summarizes the mainphysical properties (assuming ρs as the particle density, and ρbulk asthe bulk density of materials, both expressed in [106 × g/m3]), andthe grade of the bentonite clay.
Totally, 27 tests were carried out, under dry conditions. Consider-ing each soil type, increasing steps at 2% by weight of clay were grad-ually added, from 0% up to 10% by weight. Subsequently, 5% by weightof this material was added, up to the final investigated rate of 25% byweight. At the end of the mixing and compacting procedures, the bulkdensity of each soil sample was collected. Moreover, the particle den-sity of the samples was evaluated through a gas pycnometer (Ultrapycnometer 1000 manufactured by Quantachrome). Table 2 liststhe main physical properties (assuming n and e, respectively, as theporosity [%] and the void ratio [%]), grade references, and classifica-tions of the tested soil samples.
74 F. Tosti et al. / Journal of Applied Geophysics 97 (2013) 69–80
5. Results and discussion
5.1. Clay content estimation from the Rayleigh scattering method
The radar signal was processed for each test. In order to removenoise from the signal, low-pass and high-pass electronic filters were
Fig. 3.Measured frequency peak values extracted from the spectra of each tested soil samplesample15 (A2, 10% clay).
used. Thus, a fast Fourier Transform (FFT) was employed to extractthe frequency spectrum. The frequency peak of the spectrum fP,which is the element of the signal characterized by the largest inten-sity, was measured at different clay contents. To improve the accuracyof the processing, an average value of the frequency peaks fP aver wasconsidered in case of non-unique values extracted from the FFT in
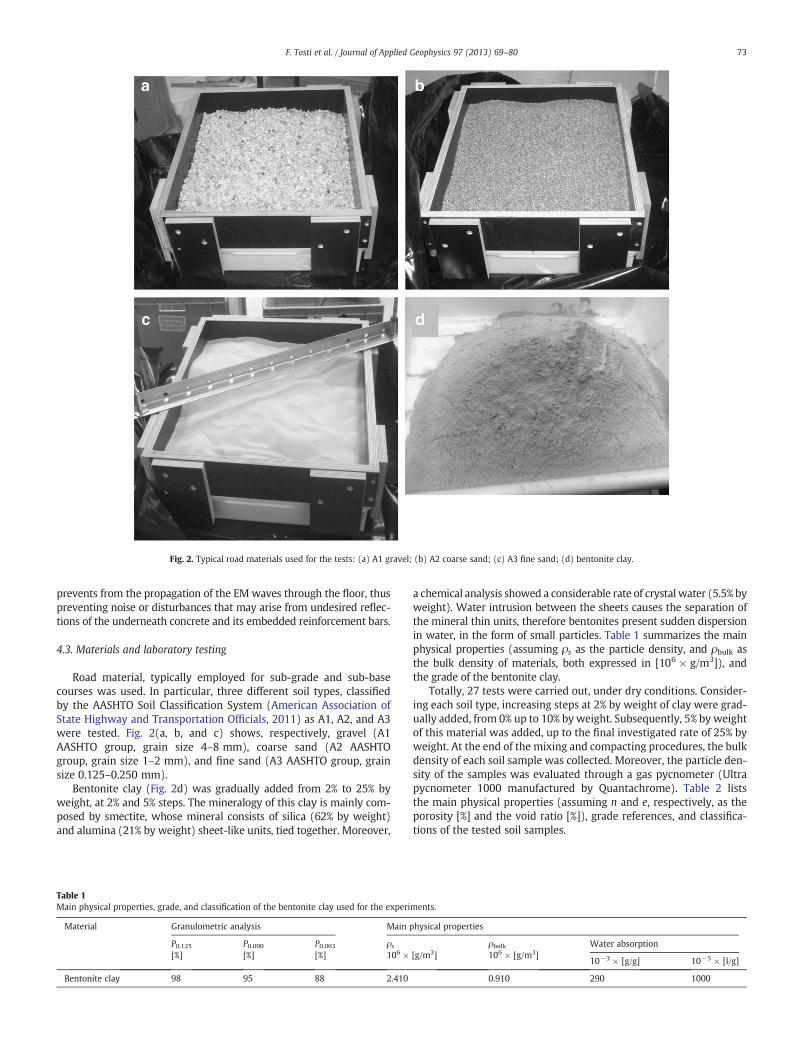
Fig. 4. Modulation of the normalized frequency spectra with the change of clay content for A1 (a), A2 (b), and A3 (c) soil samples.
75F. Tosti et al. / Journal of Applied Geophysics 97 (2013) 69–80
the same test, sample by sample. This operation can be described asfollows:
f P aver ¼1n
Xni¼1
f Pi ð7Þ
where n is the total amount of i replicas (i spectra), collected for eachsoil sample, and fPi is the frequency peak of the ith spectrum. Fig. 3(a–b)illustrates two cases of stable (Fig. 3a) and unstable domain (Fig. 3b)values for the measured spectra.
The analyses of the measured data demonstrated that this vari-ability of frequency peak values within the same test measurement,generally occurs in the boundary of two different and consecutivesteps of frequency, wherein the shift of the spectrum approaches tobe sensitive to the increase of clay content. Hence, a problem of sam-pling resolution of the FFT occurs. In that respect, a further numericalenhancement of the resolution of GPR spectra is presented in thisissue (Benedetto and Tosti, 2013-in this issue).
Fig. 4(a–c) shows the frequency modulations of the normalizedspectra for the three investigated soils at different clay contentsranging from 0% (undisturbed soil) to 25% by weight.
It is evident that a systematic shift of the frequency peak to lowervalues of frequency occurs for all the types of surveyed soils. In
particular, an important negative correlation between the shift ofthe peak and the clay content is observed.
Table 3 lists the measured values of frequency peak, case by case.The highest range of frequency peaks variation ΔfP for these threetypes of soils is observed in the case of material with maximumparticle size. In fact, ΔfP equals 0.97 × 10⁸ Hz for gravel A1, and0.78 × 108 Hz for both coarse sand A2 and fine sand A1.
Fig. 5 shows that the value of fP decreases as the clay intrusionincreases. The mean squares fitting linear curves are characterizedby high correlation coefficients R2, greater than 0.85. The lowest fitis founded for the gravel A1, with a more scattered distribution ofthe points. Moreover, a steeper slope of the regression linear curveconfirms a more remarked shift of frequency peaks in the case ofcoarser grade materials. The calibrated regression coefficients arelisted in Table 4.
According to the main physical properties in Table 2 and to thevalues of frequency peak in Table 3, the frequency dependence ofthe surveyed soil samples in dry conditions is mostly related to thecombination of clay rate and porosity of the mixture, whereas themeasured bulk density is not consistent with the increase of claycontent. In this sense, the greater porosity of gravel A1 along withthe increase of clay, causes the highest measured interval ΔfP in therange of 0%–15% of clay content, compared with that observed forthe other soil types. Moreover, results highlight an attenuation of the
Table 5Values of relative dielectric permittivity εr from laboratory measurements using thefull-waveform inversion and the time-domain signal picking techniques.
76 F. Tosti et al. / Journal of Applied Geophysics 97 (2013) 69–80
peaks shift for clay rates greater than 15% for all the tested soils, whichbecomes zero over the 20%. This can be related to a higher concentra-tion of clay particles within the voids of the porous material, causing ajamming transition of charges among the aggregate surfaces, whenthe EM field is applied. Following the research of Rozynek et al.(2012), it was demonstrated that the mechanism of the polarizationin clays occurs along their silica sheets, and it is mainly due to theouter surface charges, rather than to the bulk density. Moreover, alarge heterogeneity of clay particles (10 μm b d b 100 μm) contraststheir alignment with their longest axis along the EM field direction.This was sharpened at high concentrations of clay particles, whereinseveral particle aggregates were not able to completely re-orient withtheir longest axial dimension along the EM field lines, due to jamming.Therefore, a lowering of the value of the nematic order parameter wasobserved.
Fig. 5. Frequency of the spectrum peak fP for increasing rates of clay content.
Analogously, the shift of the frequency spectrum results highlyand sufficiently sensitive, respectively, to lower percentages (clay[%] b 10), and to intermediate rates (clay [%] b 20) of clay content.On the contrary, high clay contents (clay [%] > 20) raise both thecomplexity and the concentration of the clay particles system withinthe volumetric void fraction of the soil mixture, reducing the polariza-tion of these particles as the EM field is applied. In these cases, the mea-sured value of frequency peak remains constant. In fact, as theundisturbed gravel A1 is characterized by the highest measured poros-ity (e.g., Table 2), it is possible to consider a lower concentration of clayaggregate particles into the air voids of the mixture, thus a greater sen-sitivity of the clay particles dipolar ordering to the application of an ex-ternal EM field.
5.2. Clay content estimation from the full-waveform inversion and thetime-domain signal picking techniques
5.2.1. Permittivity estimation using the full-waveform inversion techniqueThis method is applied to consider the frequency dependence of the
electromagnetic parameters. Inversions for the dielectric permittivity
77F. Tosti et al. / Journal of Applied Geophysics 97 (2013) 69–80
and the electrical conductivity were carried out for all the tested soils.For each soil sample, a constant value of the dielectric permittivityand a linear behavior of the conductivity are assumed to generate theimpulse responses.
Inversions performed for the electrical conductivity revealed anegligible sensitivity with respect to this parameter (order of magni-tude for σ1 GHz b 1 × 10⁻¹² S m−1). Concerning the permittivityvalues, a frequency dependence was observed on the considered fre-quency range (Patriarca et al., 2013-this issue). Table 5 lists the valuesof relative dielectric permittivity εr and the corresponding normalizedobjective function φ(b) for all the tested soils. As can be easily ob-served, results in terms of permittivity are highly consistent with thegrowth of clay percentage. In particular, the highest values are regis-tered for the coarse sand A2, whereas the gravel A1 is characterizedby the smallest relative permittivities. The overall normalized per-centages of objective function range from approximately 26.5% and55%, showing both more contained values and the lowest variabilityfor the A1 gravel samples.
In general, it is possible to accurately evaluate the geometricalparameters by a preventive and accurate measure of the geometry ofthe model, such as the test box thickness, and the antenna height. A rela-tively large parameter space (2 ≤ εr ≤ 6;−3 ≤ logσ1 GHz ≤ −1 S m−1;−13 ≤ logα ≤ −1 S m−1; 0.25 ≤ h0 ≤ 0.35 m) was used for runningthe inversions. The reference parameters were selected according tothe expected values. The average distance from the antenna apertureto the soil sample surfacewas 32 × 10−2 m.Moreover, the distance be-tween the soil surface and the antenna phase center was accounted for
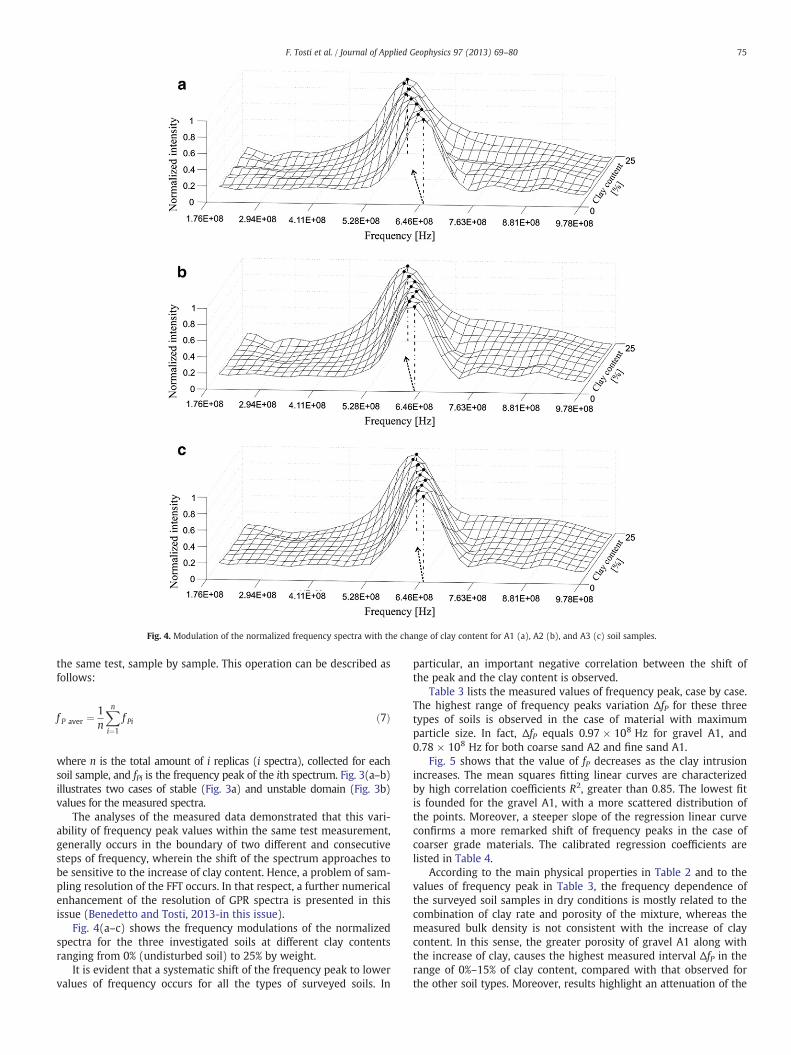
in the data inversions. The equivalent point source of the antenna is lo-cated at ~7 × 10⁻² m. In this paragraph, the measured and modeledGreen's functions are depicted in the frequency domain (Fig. 6a–b).Graphs related to these functions in time domain will be subsequentlypresented.
In these configurations, the propagation of electromagnetic wavescan be described as simultaneous wave reflections occurring in the airlayer, in the top layer, and in the bottom layer. In both cases of thisFig. 6(a–b), it is shown a good description of the phase, except locallyat lower frequencies. The overall trend of the Green's function ampli-tude is well reproduced by the forward model, although some dis-crepancies due to noise can be observed, especially in the range of1 GHz–1.6 GHz. The relatively good quality of the fits can also dependon edge effects related to the size of the investigated medium. In ad-dition, uncertainties can be caused by impedance mismatches withinthe set up elements, showing superimposed ripples on the measureddata. In the |GXX
↑ | plots, no linear behavior at higher frequencies isshown, due to a contained contrast between the air layer and thesoil layer for these analyzed clay contents. The amplitude for soil A2(Fig. 6a) is characterized by a higher value compared to that observedfor soil A3 (Fig. 6b). Moreover, soil A3 presents more regular and flat-tened oscillations.
5.2.2. Permittivity estimation using the time-domain signalpicking technique
In this paragraph, the inverse Fourier transform gxx↑ of the mea-
sured and modeled responses in the frequency domain is applied.
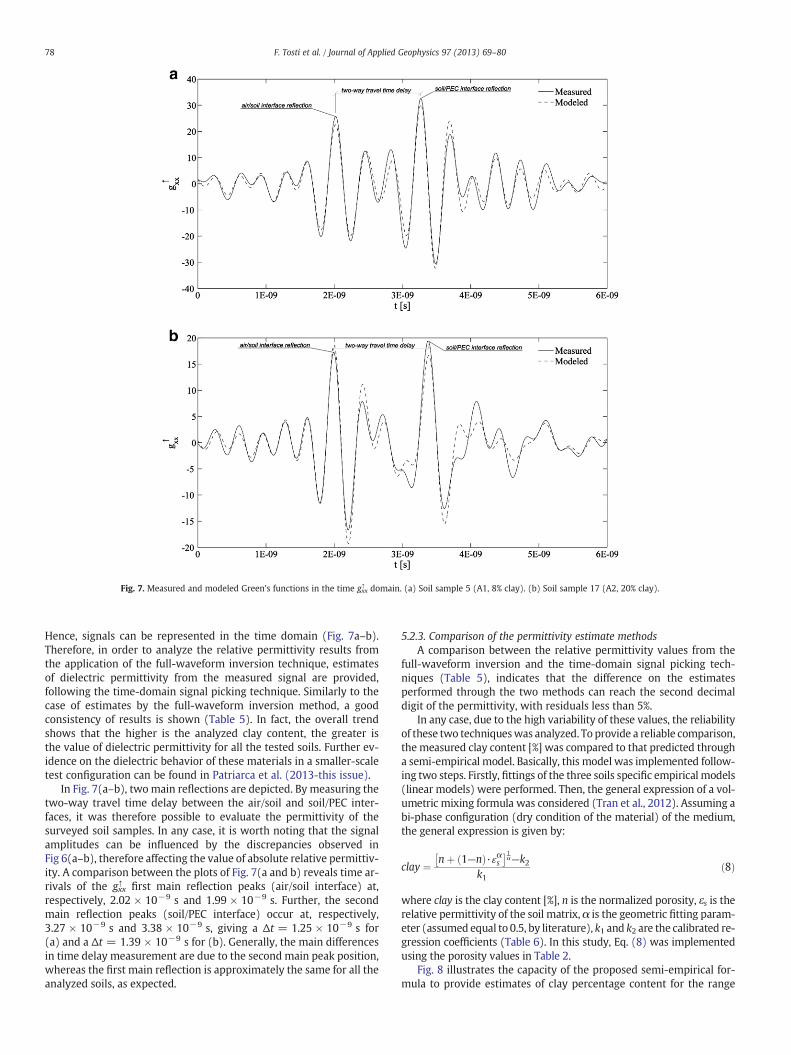
Fig. 7. Measured and modeled Green's functions in the time gxx↑ domain. (a) Soil sample 5 (A1, 8% clay). (b) Soil sample 17 (A2, 20% clay).
78 F. Tosti et al. / Journal of Applied Geophysics 97 (2013) 69–80
Hence, signals can be represented in the time domain (Fig. 7a–b).Therefore, in order to analyze the relative permittivity results fromthe application of the full-waveform inversion technique, estimatesof dielectric permittivity from the measured signal are provided,following the time-domain signal picking technique. Similarly to thecase of estimates by the full-waveform inversion method, a goodconsistency of results is shown (Table 5). In fact, the overall trendshows that the higher is the analyzed clay content, the greater isthe value of dielectric permittivity for all the tested soils. Further ev-idence on the dielectric behavior of these materials in a smaller-scaletest configuration can be found in Patriarca et al. (2013-this issue).
In Fig. 7(a–b), two main reflections are depicted. By measuring thetwo-way travel time delay between the air/soil and soil/PEC inter-faces, it was therefore possible to evaluate the permittivity of thesurveyed soil samples. In any case, it is worth noting that the signalamplitudes can be influenced by the discrepancies observed inFig 6(a–b), therefore affecting the value of absolute relative permittiv-ity. A comparison between the plots of Fig. 7(a and b) reveals time ar-rivals of the gxx
↑first main reflection peaks (air/soil interface) at,
respectively, 2.02 × 10⁻⁹ s and 1.99 × 10⁻⁹ s. Further, the secondmain reflection peaks (soil/PEC interface) occur at, respectively,3.27 × 10−9 s and 3.38 × 10⁻⁹ s, giving a Δt = 1.25 × 10⁻⁹ s for(a) and a Δt = 1.39 × 10⁻⁹ s for (b). Generally, the main differencesin time delay measurement are due to the second main peak position,whereas the first main reflection is approximately the same for all theanalyzed soils, as expected.
5.2.3. Comparison of the permittivity estimate methodsA comparison between the relative permittivity values from the
full-waveform inversion and the time-domain signal picking tech-niques (Table 5), indicates that the difference on the estimatesperformed through the two methods can reach the second decimaldigit of the permittivity, with residuals less than 5%.
In any case, due to the high variability of these values, the reliabilityof these two techniqueswas analyzed. To provide a reliable comparison,the measured clay content [%] was compared to that predicted througha semi-empirical model. Basically, this model was implemented follow-ing two steps. Firstly, fittings of the three soils specific empirical models(linear models) were performed. Then, the general expression of a vol-umetric mixing formula was considered (Tran et al., 2012). Assuming abi-phase configuration (dry condition of the material) of the medium,the general expression is given by:
clay ¼ nþ 1—nð Þ·ɛαs� �1
α—k2k1
ð8Þ
where clay is the clay content [%], n is the normalized porosity, εs is therelative permittivity of the soil matrix, α is the geometric fitting param-eter (assumed equal to 0.5, by literature), k1 and k2 are the calibrated re-gression coefficients (Table 6). In this study, Eq. (8) was implementedusing the porosity values in Table 2.
Fig. 8 illustrates the capacity of the proposed semi-empirical for-mula to provide estimates of clay percentage content for the range
79F. Tosti et al. / Journal of Applied Geophysics 97 (2013) 69–80
of soil textures considered in this study, using the full-waveform in-version and the time-domain signal picking techniques. The formulais assumed to be valid for soils with a minimum content of clay(clay > 0% by weight). The overall distribution of the plotted pointsshows that the best fit is provided for lower clay contents (clay b 8%by weight), therefore greater misfits are registered for increasingamount of clay wherein the regression formulae mainly over-predictthe expected clay percentages. More in depth, this behavior is depen-dent on the soil texture. As it is shown in Table 6, the root mean squareerror (RMSE) is considerably higher for the A1 soil than that calculatedfor the A2 and A3 soils. Moreover, the prediction is very accurate for thesoil type with the lowest grain size. Concerning the applied techniques,the RMSE indexes show that the time-domain signal picking methodyields slightly more accurate estimates of the soil clay content thanthose obtained through the full-waveform inversion technique.
6. Conclusion
In this study, GPR signal processing was carried out to evaluateclay content in soils. Different GPR methods and techniques wereused. Laboratory tests were carried out on different types of soils, dif-ferently classified by AASHTO as A1, A2, and A3.
Firstly, results were analyzed using the Rayleigh scattering tech-nique. Considering the Fresnel theory and some recent innovative re-searches, it was experimentally showed the frequency dependence of
Fig. 8. Correlation between clay content observed and predicted by fitting the permit-tivity estimates from the full-waveform inversion and the time-domain signal pickingtechniques (A1, A2, and A3 soil types).
clay content in heterogeneous soils. It was demonstrated that the var-iation in clay content affects the shift of the frequency spectra peaks.As the clay content increases, the peak of the frequency shifts to lowervalues. On the basis of the outcomes of laboratory tests and accordingto the theoretical framework, an empirical approach to predict thepresence of clay from the frequency analysis was investigated. Verypromising results in terms of regression coefficients were obtained.The main benefit of this self-consistent method is that any preventivecalibration, such as core sampling, can be avoided. In any case, to im-prove the reliability of this technique in accurately measuring the claycontent, further research, such as stochastic approaches, can be used.
Analogously, full-waveform inversion and time-domain signalpicking techniques were used to estimate the relative dielectric per-mittivity of the investigated soils. Both methods showed a high con-sistency of the results. In particular, increasing rates of clay led toincreasing values of dielectric permittivity, as expected. Finally, thereliability of the outcomes from these two techniques was analyzed,using a semi-empirical approach. In particular, a typical volumetricmixing formula was optimized using empirical parameters from soilspecific curve fitting. Results show high reliable estimates of claycontent in fine sand-textured soils, as well as an overall promisingprediction for all the tested soils at lower percentages of clay forboth the methods. In this sense, further research is needed both forgathering larger amount of data and for best focusing on the use ofmore accurate predictive models.
Concerning the applicability of such signal processing methods onreal data, it is worth noting that the proper horizontal data samplingneeds to be related to the scale of variation of clay content in soils. Inthat respect, recent GPR inspections in real road environment suggestto consider the values of horizontal sampling within 3 × 10⁻¹ mmaximum.
Acknowledgments
The research was supported by the ASTRI project, financed byRoma Tre University under the Framework Program for “Progetto diinternazionalizzazione della ricerca e della formazione della ricerca”.A strong supportwas also provided by the Delft University of Technology,for the use of facilities, materials, and laboratory sites. We also thankDr. Karl-Heinz Wolf for permission to use the laboratory sites, as wellas Ing. Karel Heller and Ing. Wim Verwaal for their valuable help.
References
Abdi, M.R., Sadrnejad, A., Arjomand, M.A., 2009. Strength enhancement of clay by en-capsulating geogrids in thin layers of sand. Geotextiles and Geomembranes 27,447–455.
Abusharar, S.W., Han, J., 2011. Two-dimensional deep-seated slope stability analysis ofembankments over stone column-improved soft clay. Engineering Geology 120,103–110.
Al-Qadi, I.L., Lahouar, S., 2004. Use of GPR for thickness measurement and quality con-trol of flexible pavements. Journal of the Association of Asphalt Paving Technolo-gists 73, 501–528.
American Association of State Highway and Transportation Officials (AASHTO), 2011.Roadside Design Guide, fourth ed. Washington, DC.
American Society for Testing and Materials, 2007. Ground Penetrating Radar, 2nd Edi-tion. ASTM D698-07e1 Standard Test Methods for Laboratory Compaction Charac-teristics of Soil Using Standard Effort, USA.
Ayala-Cabrera, D., Herrera, M., Izquierdo, J., Pérez-García, R., 2011. Location of buriedplastic pipes using multi-agent support based on GPR images. Journal of AppliedGeophysics 75, 679–686.
Benedetto, A., 2004. Theoretical approach to electromagnetic monitoring of road pave-ment. Proceedings of 10th International Conference on Ground Penetrating Radar.Delft, The Netherlands.
Benedetto, A., 2010. Water content evaluation in unsaturated soil using GPR signalanalysis in the frequency domain. Journal of Applied Geophysics 71, 26–35.
Benedetto, A., Pensa, S., 2007. Indirect diagnosis of pavement structural damages usingsurface GPR reflection techniques. Journal of Applied Geophysics 62, 107–123.
Benedetto, F., Tosti, F., 2013. GPR spectral analysis for clay content evaluation by thefrequency shift method. Journal of Applied Geophysics 97, 89–96 (in this issue).
80 F. Tosti et al. / Journal of Applied Geophysics 97 (2013) 69–80
Benedetto, A., Tosti, F., Di Domenico, L., 2012a. Ellipticmodel for prediction of deflections in-duced by a Light FallingWeight Deflectometer. Journal of Terramechanics 49 (1), 1–12.
Benedetto, A., Benedetto, F., Tosti, F., 2012b. GPR applications for geotechnical stabilityof transportation infrastructures. Nondestructive Testing and Evaluation 27 (3),253–262.
Benedetto, A., Manacorda, G., Simi, A., Tosti, F., 2012c. Novel perspectives in bridges in-spection using GPR. Nondestructive Testing and Evaluation 27 (3), 239–251.
Beroya, M.A.A., Aydin, A., Katzenbach, R., 2009. Insight into the effects of clay mineralogyon the cyclic behavior of silt–clay mixtures. Engineering Geology 106, 154–162.
Chertkov, V.Y., 2005. The shrinkage geometry factor of a soil layer. Soil Science Societyof America Journal 69, 1631–1683.
Chertkov, V.Y., Ravina, I., 2000. Shrinking–swelling phenomenon of clay soils attributedto capillary-crack network. Theoretical and Applied Fracture Mechanics 34, 61–71.
Davis, J.L., Annan, A.P., 1989. Ground-penetrating radar for high resolution mapping ofsoil and rock stratigraphy. Geophysical Prospecting 37, 531–551.
Diefenderfer, B.K., Galal, K., Mokarem, D.W., 2005. Effect of subsurface drainage on thestructural capacity of flexible pavement. VTRC 05-R35. Project 66818. 29.
Dudoignon, P., Causseque, S., Bernard, M., Hallaire, V., Pons, Y., 2007. Vertical porosityprofile of a clay-rich marsh soil. Catena 70, 480–492.
Fiori, A., Benedetto, A., Romanelli, M., 2005. Application of the effective medium ap-proximation for determining water contents through GPR in coarse-grained soilmaterials. Geophysical Research Letters 32, L09404. http://dx.doi.org/10.1029/2005GL022555.
George, K.P., 2000. Subgrade characterization for highway pavement design. FinalReport MS-DOT-RD-00-131. University of Mississippi, Mississippi, MS.
Hallaire, V., 1987. Retrait vertical d'un sol argileux au cours du dessèchement. Mesuresde l'affaissement et conséquence structurales. Agronomie 7 (8), 631–637.
Huisman, J.A., Hubbard, S.S., Redman, J.D., Annan, A.P., 2003. Measuring soil water con-tent with ground penetrating radar: a review. Vadose Zone Journal 2, 476–491.
Huston, D.R., Hu, J., Maser, K., Weedon, W., Adam, C., 1999. Ground penetrating radar forconcrete bridge health monitoring applications. Proceedings of SPIE 1355, 170–179.
Huyer, W., Neumaier, A., 1999. Global optimization by multilevel coordinate search.Journal of Global Optimization 14, 331–355.
Lambot, S., Javaux, M., Hupet, F., Vanclooster, M., 2002. A global multilevel coordinatesearch procedure for estimating the unsaturated soil hydraulic properties. WaterResources Research 38 (11), 1224. http://dx.doi.org/10.1029/2001WR001224.
Lambot, S., Slob, E.C., van den Bosch, I., Stockbroeckx, B., Vanclooster, M., 2004. Model-ing of ground-penetrating radar for accurate characterization of subsurface electricproperties. IEEE Transactions on Geoscience and Remote 42, 2555–2568.
Lambot, S., van den Bosch, I., Stockbroeckx, B., Druyts, P., Vanclooster, M., Slob, E.C.,2005. Frequency dependence of the soil electromagnetic properties derived fromground-penetrating radar signal inversion. Subsurface Sensing Technologies andApplications 6, 73–87.
Lambot, S., Weihermüller, L., Huisman, J.A., Vereecken, H., Vanclooster, M., Slob, E.C.,2006. Analysis of air-launched ground-penetrating radar techniques to measurethe soil surface water content. Water Resources Research 42, W11403. http://dx.doi.org/10.1029/2006WR005097.
Lambot, S., Slob, E.C., Vereecken, H., 2007. Fast evaluation of zero-offset Green's func-tion for layered media with application to ground-penetrating radar. GeophysicalResearch Letters 34, L21405. http://dx.doi.org/10.1029/2007GL031459.
Lau, C.L., Scullion, T., Chan, P., 1992. Modeling of ground-penetrating radar wave prop-agation in pavement systems. Transportation Research Record 1355, 99–107.
Mie, G., 1908. Beiträge zur Optik trüber Medien, speziell kolloidaler Metallösungen.Annalen der Physik 330, 377.
Miqueleiz, L., Ramirez, F., Seco, A., Nidzam, R.M., Kinuthia, J.M., Abu Tair, A., Garcia, R.,2012. The use of stabilised Spanish clay soil for sustainable construction materials.Engineering Geology 133–134, 9–15.
Odeh, I.O.A., McBratney, A.B., 2000. Using AVHRR images for spatial prediction of claycontent in the lower Namoi Valley of eastern Australia. Geoderma 97, 237–254.
Oden, C.P., Olhoeft, G.R., Wright, D.L., Powers, M.H., 2008. Measuring the electricalproperties of soil using a calibrated ground-coupled GPR system. Vadose ZoneJournal 7 (1), 171–183.
Pakbaz, M.S., Alipour, R., 2012. Influence of cement addition on the geotechnical prop-erties of an Iranian clay. Applied Clay Science 67–68, 1–4.
Patriarca, C., Lambot, S., Mahmoudzadeh, M.R., Minet, J., Slob, E.C., 2011. Reconstructionof sub-wavelength fractures and physical properties of masonry media using full-waveform inversion of proximal penetrating radar. Journal of Applied Geophysics74, 26–37.
Patriarca, C., Tosti, F., Velds, C., Benedetto, A., Slob, E., Lambot, S., 2013. Frequency de-pendent electric properties of homogeneous multi-phase lossy media in theground-penetrating radar frequency range. Journal of Applied Geophysics 97,81–88 (this issue).
Pettinelli, E., Vannaroni, G., Di Pasquo, B., Mattei, E., DiMatteo, A., De Santis, A., Annan,P.A., 2007. Correlation between near-surface electromagnetic soil parameters andearly time GPR signals: an experimental study. Geophysics 72 (2), A25–A28.
Richard, G., Cousin, I., Sillon, J.F., Bruand, A., Guérif, J., 2001. Effect of compaction on theporosity of a silty soil: influence on unsaturated hydraulic properties. EuropeanJournal of Soil Science 52, 49–58.
Robinson, D.A., Phillips, C.P., 2001. Crust development in relation to vegetation and ag-ricultural practice on erosion susceptible, dispersive clay soils from central andsouthern Italy. Soil and Tillage Research 60, 1–9.
Robinson, D.A., Jones, S.B., Wraith, J.M., Or, D., Friedman, S.P., 2003. A review of ad-vances in dielectric and electrical conductivity measurement in soils using timedomain reflectometry. Vadose Zone Journal 2, 444–475.
Rozynek, Z., Mauroy, H., Castberg, R.C., Knudsen, K.D., Fossum, J.O., 2012. Dipolar orderingof clay particles in various carrier fluids. Revista Cubana de Física 29, 1E37.
Scullion, T., Lau, C.L., Chen, Y., 1994. Pavement evaluations using ground penetratingradar. Proceedings of the 5th International Conference on Ground PenetratingRadar, Kitchener, Ontario, Canada, pp. 449–463.
Sdiri, A., Higashia, T., Hattab, T., Jamoussic, F., Tasea, N., 2011. Evaluating the adsorptivecapacity of montmorillonitic and calcareous clays on the removal of several heavymetals in aqueous systems. Chemical Engineering Journal 172, 37–46.
Slob, E., Sato, M., Olhoeft, G., 2010. Surface and borehole ground-penetrating-radar de-velopments. Geophysics 75, A103–A120.
Tighe, S., Li, N., Falls, L.C., Haas, R., 2000. Incorporating road safety into pavement man-agement. Transportation Research Record 1699, 1–10.
Topp, G.C., Davis, J.L., Annan, A.P., 1980. Electromagnetic determination of soil watercontent: measurements in coaxial transmission lines. Water Resources Research16 (3), 574–582.
Tosti, F., Benedetto, A., 2012. Pavement Pumping Prediction using Ground PenetratingRadar. Proceedings of the 5th International Congress on Sustainability of Road In-frastructures, Rome, Italy, 53, pp. 1045–1054.
Tran, A.P., Ardekani, M.R.M., Lambot, S., 2012. Coupling of dielectric mixing modelswith full-wave ground-penetrating radar signal inversion for sandy-soil-moistureestimation. Geophysics 77, H33–H44.
Triantafilis, J., Lesch, S.M., 2005. Mapping clay content variation using electromag-netic induction techniques. Computers and Electronics in Agriculture 46,203–237.
Van der Kruk, J., Slob, E.C., 2004. Reduction of reflections from above surface objects inGPR data. Journal of Applied Geophysics 55, 271–278.
Viscarra Rossel, R.A., Cattle, S.R., Ortega, A., Fouad, Y., 2009. In situ measurements of soilcolour, mineral composition and clay content by vis–NIR spectroscopy. Geoderma150, 253–266.
Voltz, M., Cabidoche, Y.M., 1995. Non-uniform volume and water content change inswelling clay soil: I. Theoretical analysis. European Journal of Soil Science 46,333–343.
Wood, G.S., Osborne, J.R., Forde, M.C., 1995. Soil parameters for estimating the rollingresistance of earthmoving plant on a compacted silty cohesive soil. Journal ofTerramechanics 32 (1), 27–41.
Wu, R., Li, J., Liu, Z.S., 1999. Super resolution time delay estimation via MODEWRELAX.IEEE Transactions on Aerospace and Electronic Systems 35 (1), 294–307.