24
0

0

1
COVER SHEET
1 5 2 6 6 1 SEC Registration Number
C I T Y & L A N D D E V E L O P E R S , I N C .
(Company’s Full Name)
1 5 6 H . V . D E L A C O S T A S T . , ,
S A L C E D O V I L L A G E , M A K A T I C I T Y (Business Address: No. Street City/Town/Province)
Rufina C. Buensuceso 893 – 6060 Contact Person Company Telephone Number
1 2 3 1 1 7 - Q (A) Month Day FORM TYPE Month Day
Fiscal Year Annual Meeting
(Secondary License Type, If Applicable)
C F D Dept. Requiring this Doc. Amended Articles Number / Section
Total Amount of Borrowings
Total No. of Stockholders Domestic Foreign
----------------------------------------------------------------------------------------------------------------------- To be accomplished by SEC Personnel concerned
File Number LCU
Document ID Cashier
S T A M P S
Remarks = pls. use black ink for scanning purposes

1
SECURITIES AND EXCHANGE COMMISSION
SEC FORM 17- Q
QUARTERLY REPORT PURSUANT TO SECTION 17
OF THE SECURITIES REGULATION CODE AND SECTION 141
OF THE CORPORATION CODE OF THE PHILIPPINES
1. For the fiscal year ended March 31, 2012
2. SEC Identification Number 152661 3. BIR Tax Identification No. 000-444-840
4. Exact name of issuer as specified in its charter CITY & LAND DEVELOPERS, INC.
5. Makati City, Philippines 6. (SEC Use Only)
Province, country or other jurisdiction Industry Classification Code
of incorporation
7. 3/F Cityland Condominium 10 Tower 1,
#156 H.V. Dela Costa St., Salcedo Village, Makati City 1226 Address of Principal Office Postal Code
8. 632-893-6060
Issuer's telephone number, including area code
9. Former name, former address and former fiscal year, if changed since last report N/A
10. Securities registered pursuant to Sections 8 and 12 of the SRC, or Sec. 4 and 8 of the RSA
Title of Each Class Number of Shares of Common Stock
Outstanding
Unclassified Common Shares 676,042,298
11. Are any or all of these securities listed on a Stock Exchange.
Yes [ x ] No [ ]
If yes, state the name of such stock exchange and the classes of securities listed therein:
Stock Exchange Title of Each Class
Philippine Stock Exchange Unclassified Common Shares
12. Check whether the issuer:
(a) Has filed all reports required to be filed by Section 17 of the Code and SRC Rule 17 thereunder
or Sections 11 of the RSA and RSA Rule 11(a)-1 thereunder, and Sections 26 and 141 of the
Corporation Code of the Philippines; during the preceding twelve (12) months (or for such
shorter period that the registrant was required to file such reports):
Yes [ x ] No [ ]
(b) Has been subject to such filing requirements for the past 90 days.
Yes [ x ] No [ ]

2
PART I – FINANCIAL INFORMATION
Item 1. Financial Statements
The financial statements and accompanying notes are filed as part of this form (pages 6 to 22).
Item 2. Management's Discussion and Analysis of Financial Condition and Results of Operation
The Manila Residences Bocobo, a 34-storey office, commercial and residential condominium located in Jorge
Bocobo St., Ermita, Manila City is ready for occupancy by June 2012, a year in advance from its promised date
of turnover to clients.
Internal sources of liquidity come from sales of condominiums and real estate projects, collection of installment
receivables, maturing short-term investments while external sources come from SEC-registered commercial
papers and Home Guaranty Corporation’s guaranteed promissory notes.
The Company has three prime lots for future development. The latest acquisition is located at EDSA corner
Lanutan Alley, Brgy. Veterans Village, Quezon City. The other lots are located along Roxas Boulevard and
Samar Ave, Quezon City.
Financial Condition (March 31, 2012 vs. December 31, 2011)
Total assets amounted to P=2.267B as of the first quarter of 2012 as compared with the previous year’s ending
balance of P=2.221B. Collection from sales of real estate properties and maturity of short term cash
investments increased cash and cash equivalents account. This was partially offset by the decrease in
installment contracts receivable and real estate properties for sale.
On the liabilities side, the slight decrease was due to payment of accounts payable and accrued expenses and
loans and notes payable. Total stockholders’ equity now stands at P=1.503B as of March 2012, higher by
8.75% from 2011 year end balance due to net income of P=58.39M.
As a result of the foregoing, acid test ratio, current ratio and asset to equity ratio were recorded at 1.54:1,
2.14:1 and 1.51:1 as of March 2012, as compared with 1.26:1, 2.00:1 and 1.54:1 in December 2011,
respectively. Debt-equity ratio remained stable at 0.21:1 in March 2012, as compared with 0.27:1 in the same
quarter of the previous year while interest rate coverage ratio was at 30.05:1 in March 2012 as compared with
37.60:1 in the same period of the previous year.
Results of Operation (March 31, 2012 vs. March 31, 2011)
Total revenues reached P=206.44M as compared with last year’s figure of P=313.42M. The decrease can be
attributed to lower sales due to the decrease in inventory of Grand Emerald Tower. This project was already
sold at 86.50% last year. On the cost side, lower sales decreased cost of sales, operating expenses and income
tax. As a result, net income for the first quarter of 2012 reached P=58.39M as compared with P=71.20M of the
same period last year. Altogether this translated to earnings per share and return on equity (both annualized)
of 0.35:1 and 15.54% as compared to previous year of 0.42:1 and 22.30%, respectively.
Financial Ratios
March 2012 December 2011 March 2011
Earnings per share * 0.35 P=0.47 P=0.42
Return on equity * 15.54% 21.95% 22.30%
Interest Rate Coverage Ratio 30.05 36.95 37.60
Asset to Equity Ratio 1.51 1.54 1.58
Current ratio 2.14 2.00 2.16
Acid-test ratio 1.54 1.26 1.44
Debt-equity ratio 0.21 0.22 0.27
*annualized
Note: Earnings per share is after retroactive effect of 20% stock dividends in 2011.

3
Manner of calculations:
Earnings per share = Net Income/ Average Number of Shares Issued and Outstanding
Return on equity = Net Income/ Total Stockholders' Equity
Current ratio = Total Current Assets / Total Current Liabilities
Interest rate coverage ratio = Net Income before tax + Interest Expense +Depreciation Expense
Interest Expense
Asset to equity ratio = Total Assets
Stockholder’s Equity (net of Net Changes in Fair Value of AFS Investment)
Acid – test ratio = Cash and cash equivalents + Short-term Cash Investments + Available-for-
Sale Investments + Financial Assets at Fair Value Through Profit and Loss +
Installment Contracts Receivable + Other Receivables
Total Current Liabilities
Debt- Equity ratio = Loans & Notes Payable
Total Stockholders' Equity (net of Net Changes in FV of Investments)
Items affecting assets, liabilities, equity, net income, or cash flows that are unusual because of their
nature, size or incidents
There are no unusual items affecting assets, liabilities, equity, net income or cash flows.
Any changes in estimates of amounts reported in prior interim periods of the current financial year or
changes in estimates of amounts reported in prior financial years that have a material effect in the
current interim period
There are no changes in estimates of amounts reported in prior interim periods of the current financial year
or changes in estimates of amounts reported in prior financial years that have a material effect in the current
interim period.
Any issuances, repurchases, and repayments of debt and equity securities
The Company issued SEC-Registered Short-Term Commercial Papers during the period. The outstanding
balance is P=138.5 million as of March 31, 2012.
Any material events subsequent to the end of the interim period that have not been reflected in the
financial statements for the interim period
There are no material events subsequent to the end of the interim period that have not been reflected in the
financial statements for the interim period.
Effect of changes in the composition of the issuer during the interim period, including business
combinations, acquisition or disposal of subsidiaries and long-term investments, restructuring, and
discontinuing operations.
There are no changes in the composition of the issuer during the interim period, including business
combinations, acquisition or disposal of subsidiaries and long-term investments, restructuring, and
discontinuing operations.
Any changes in contingent liabilities or contingent assets since the last annual balance sheet date
There are no changes in the contingent liabilities or contingent assets since the last annual balance sheet date.
Any Known Trends, Events or Uncertainties (Material impact on liquidity)
There is no known trends, events or uncertainties that has a material effect on liquidity.
Internal and External Sources of Liquidity
Internal sources come from sales of condominium and real estate projects, collection of installment
receivables and maturing short-term investments. External sources come from bank loans.

4
Any Material Commitments for Capital Expenditures and Expected Sources of Funds of such
Expenditures
The estimated development cost of P=293.40 million as of March 31, 2012 representing the cost to
complete the development of real estate projects sold will be sourced through:
a. Sales of condominium and real estate projects
b. Collection of installment receivables
c. Maturing short-term investments
d. Issuance of commercial papers
Any Known Trend or Events or Uncertainties (Material Impact on Net Sales or Revenues or
Income from Continuing Operations)
There is no known trend, event or uncertainties that has a material effect on the net sales, revenues
or income from continuing operations.
Any Significant Elements of Income or Loss that did not arise from Registrant’s Continuing
Operations
There are no significant elements of income or loss that did not arise from registrant’s continuing
operations.
Causes for any Material Changes from Period to Period in One or More Line of the
Registrants Financial Statements.
a. Increase in Cash and Cash Equivalents was due to collection and maturities of short-term cash
investments.
b. Decrease in Short-term Cash Investments was due to maturity of placements.
c. Increase in Available for Sale Securities was due to increase in market value of stocks.
d. Decrease in Other Receivables was due to decrease in accrued interest from short term liquid
investments.
e. Decrease in Real Estate Properties for Sales (net) was due to sales of real estate properties.
f. Increase in Other Assets was due to Meralco refundable deposits.
g. Increase in Income Tax Payable was due to first quarter income tax – net of prepaid tax.
h. Increase in Net Changes in Fair Value of Investments was due to increase in market value of
stocks.
i. Increase in Retained Earnings was due to first quarter net income.
j. Decrease in Sales of Real Estate was due to lower inventory of units available for sale of Grand
Emerald Tower.
k. Increase in Rent Income was due to increase in units available for lease.
l. Increase in Other Revenue was due to increase in miscellaneous income.
m. Decrease in Cost of Sales was due to sales.
n. Decrease in Operating Expenses was due to sales.
o. Decrease in Financial Expenses was due to lower loans and notes payable balance as compared
to the same period of the previous year.
p. Decrease in Provision for Income Tax was due to lower income tax
q. Decrease in Net Income was due to lower revenues.

5

6
CITY & LAND DEVELOPERS, INC.
BALANCE SHEETS
UNAUDITED March 2012 December 2011
ASSETS
Cash and cash equivalents (Note 4) 658,838,725 311,540,443
Short-term Cash Investments -- 211,500,000
Available-for-sale financial assets (Note 5) 1,151,819 960,623
Installment contracts receivable (Note 6) 856,259,611 871,354,650
Other receivables (Note 7) 8,778,418 9,262,850
Real estate properties for sale (Note 8) 314,775,680 391,691,341
Real estate properties for future development 238,285,775 236,780,497
Investment properties (Note 9) 182,481,966 183,160,682
Other assets 6,455,879 5,174,222
TOTAL ASSETS 2,267,027,873 2,221,425,308
LIABILITIES AND STOCKHOLDERS’ EQUITY
Accounts payable and accrued expenses (Note 10) 363,051,888 374,198,278
Loans and notes payable (Note 11) 319,103,197 322,020,561
Income tax payable 11,544,453 7,952,956
Deferred tax liabilities 70,763,157 73,272,398
Total Liabilities 764,462,695 777,444,193
Stockholders’ Equity
Capital stock – P1 par value
Authorized – 700,000,000 shares
Issued – 676,042,298 shares 676,042,298 676,042,298
Additional paid-in capital 105,136 105,136
Net changes in fair value of investments 881,906 690,710
Retained earnings (Note 13)
Appropriated 100,000,000 100,000,000
Unappropriated 725,535,838 667,142,971
Total Stockholders’ Equity 1,502,565,178 1,443,981,115
TOTAL LIABILITIES & STOCKHOLDERS’ EQUITY 2,267,027,873 2,221,425,308

7
CITY & LAND DEVELOPERS, INC.
STATEMENTS OF INCOME
UNAUDITED
For the 3-month
ending March 2012
For the 3-month
ending March 2011
REVENUES
Sales of real estate 162,471,131 270,041,090
Financial income (Note 14) 41,486,975 42,149,397
Rent income 1,153,293 176,441
Other income 1,330,108 1,050,245
206,441,507 313,417,173
EXPENSES
Cost of real estate sales 98,360,260 176,432,158
Operating expenses (Note 15) 39,926,262 45,759,738
Financial expenses (Note 17) 2,314,605 2,585,053
140,601,127 224,776,949
INCOME BEFORE INCOME TAX 65,840,380 88,640,224
PROVISION FOR INCOME TAX (Note 19) 7,447,513 17,441,230
NET INCOME 58,392,867 71,198,994
Earnings per share 0.086 0.105
* After retroactive effect of 20% stock dividends in 2011.
8
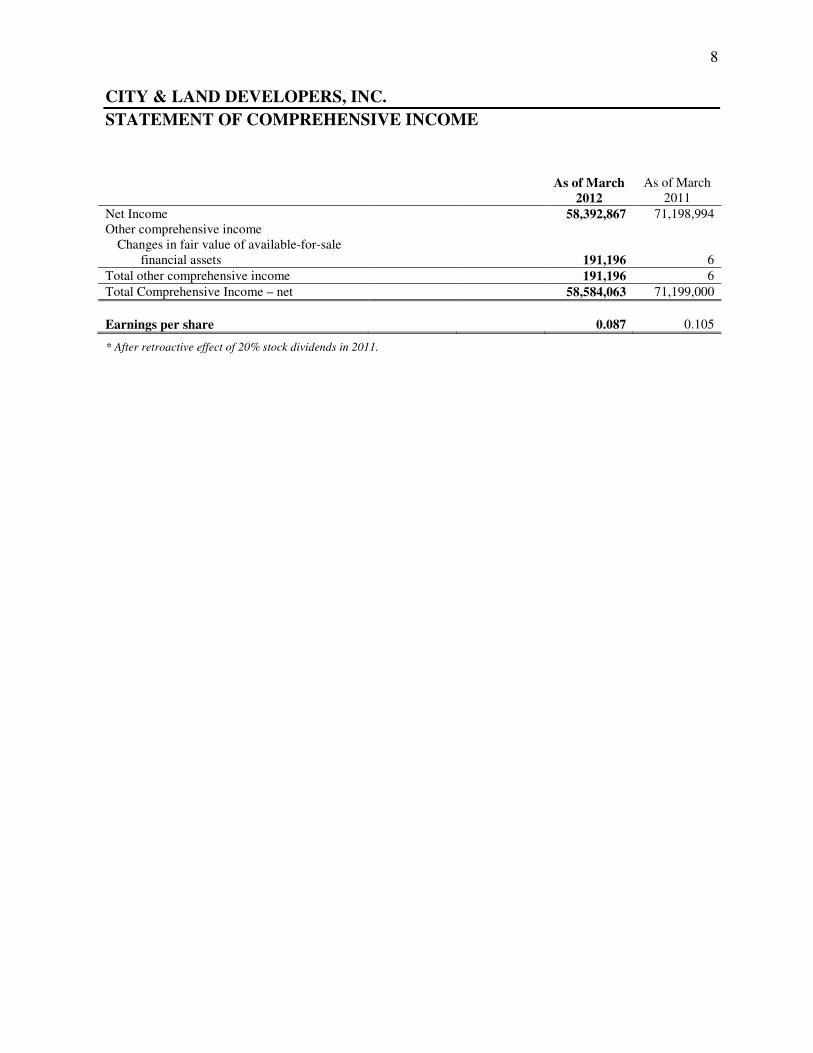
CITY & LAND DEVELOPERS, INC.
STATEMENT OF COMPREHENSIVE INCOME
As of March
2012
As of March
2011
Net Income 58,392,867 71,198,994
Other comprehensive income
Changes in fair value of available-for-sale
financial assets 191,196 6
Total other comprehensive income 191,196 6
Total Comprehensive Income – net 58,584,063 71,199,000
Earnings per share
0.087
0.105
* After retroactive effect of 20% stock dividends in 2011.

9
CITY & LAND DEVELOPERS, INC
STATEMENTS OF CHANGES IN STOCKHOLDERS’ EQUITY
Capital stock
Additional
paid-in capital
Net changes in fair
value of investments
Retained earnings
Total Appropriated Unappropriated
Beginning balance, January 2012 676,042,298 105,136 690,710 100,000,000 667,142,971 1,443,981,115
Total comprehensive income -- -- 191,196 -- 58,392,867 58,584,063
Ending balance, March 2012 676,042,298 105,136 881,906 100,000,000 725,535,838 1,502,565,178
Capital stock
Additional
paid-in capital
Net changes in fair
value of investments
Retained earnings
Total Appropriated Unappropriated
Beginning balance, January 2011 563,368,825 105,136 711,958 100,000,000 541,704,324 1,205,890,243
Total comprehensive income -- -- 6 -- 71,198,994 71,199,000
Ending balance, March 2011 563,368,825 105,136 711,964 100,000,000 612,903,318 1,277,089,243

10
CITY & LAND DEVELOPERS, INC.
STATEMENTS OF CASH FLOWS
UNAUDITED
As of
March 2012
As of
March 2011
CASH FLOW FROM OPERATING ACTIVITIES
Income before income tax 65,840,380 88,640,224
Adjustments for:
Interest expense – net of amounts capitalized 2,289,705 2,440,242
Interest income (41,483,776) (42,147,461)
Dividend income (3,199) (1,936)
Depreciation 678,716 678,716
Changes in operating assets and liabilities
Decrease (increase) in:
Installment Contracts Receivable 15,095,039 (77,053,162)
Other receivables (483,342) (1,618,397)
Real estate properties for sale 76,915,661 94,446,054
Real estate properties for future development (1,505,278) (577,871)
Other assets (1,281,657) (109,200)
Increase (decrease) in accounts payable and
accrued expenses
(11,713,926)
32,032,125
Cash from (used in) operations 104,348,323 96,729,334
Interest received 42,451,550 42,714,629
Income taxes paid (6,365,256) (8,836,413)
Net cash flows from (used in) operating activities 140,434,617 130,607,550
CASH FLOWS FROM INVESTING ACTIVITIES
Dividends received 3,199 1,936
Proceeds from (purchase of) short-term cash investment 211,500,000 99,500,000
Net cash from (used in) investing activities 211,503,199 99,501,936
CASH FLOWS FROM FINANCING ACTIVITIES
Interest paid (1,984,725) (3,770,891)
Cash dividends and fractional shares paid 262,555 (739)
Net proceeds from (payments of) notes payable (2,917,364) (7,949,825)
Net cash flows from (used in) financing activities (4,639,534) (11,721,455)
NET INCREASE (DECREASE) IN CASH AND
CASH EQUIVALENTS 347,298,282 218,388,031
CASH AND CASH EQUIVALENTS AT
BEGINNING OF PERIOD 311,540,443 93,589,832
CASH AND CASH EQUIVALENTS
AT END OF THE PERIOD 658,838,725 311,977,863

11
CITY & LAND DEVELOPERS, INC.
NOTES TO FINANCIAL STATEMENTS
1. Corporate Information
City & Land Developers, Incorporated (the Company) was incorporated in the Philippines on June 28, 1988.
Its primary purpose is to establish an effective institutional medium for acquiring and developing suitable land
sites for residential, office, commercial, institutional and industrial uses primarily, but not exclusively, in
accordance with the subdivision, condominium, and cooperative concepts of land-utilization and land-
ownership. The average number of employees was 69 as of March 31, 2012 and 70 as of December 31,
2011. The Company’s registered office and principal place of business is 3rd
Floor, Cityland Condominium
10, Tower I, 156 H. V. de la Costa Street, Ayala North, Makati City.
The Company is 49.73% owned by Cityland Development Corporation (CDC), a publicly listed company
incorporated and domiciled in the Philippines. The Company’s ultimate parent is Cityland, Inc. (CI), a
company incorporated and domiciled in the Philippines, which prepares consolidated financial statements and
that of its subsidiaries.
2. Summary of Significant Accounting and Financial Reporting Policies
Basis of Preparation
The financial statements of the Company have been prepared using the historical cost basis, except for
available-for-sale financial assets which are carried at fair values. The financial statements are presented in
Philippine peso (Peso), which is the Company’s functional currency, and rounded to the nearest Peso except
when otherwise indicated.
Statement of Compliance
The financial statements have been prepared in compliance with Philippine Financial Reporting Standards
(PFRS).
Changes in Accounting Policies
The accounting policies adopted are consistent with those of the previous financial year except for the
adoption of the following new and amended Philippine Accounting Standards (PAS), PFRS and new
Philippine Interpretations based on International Financial Reporting Interpretations Committee (IFRIC)
interpretations effective in 2011. The adoption of the following revised PAS is relevant but does not have a
significant impact on the financial statements:
• Revised PAS 24, Related Party Disclosures, simplifies the identification of related party relationships,
particularly in relation to significant influence and joint control. The amendment emphasizes a
symmetrical view on related party relationships as well as clarifies in which circumstances persons and
key management personnel affect the related party relationships of an entity. The amendment also
introduces an exemption from the general related party disclosure requirements, for transactions with a
government and entities that are controlled, jointly controlled or significantly influenced by the same
government as the reporting entity. The adoption of the amendment did not have any impact on the
financial position and performance of the Company.
The adoption of the following new and amended PFRS, PAS and Philippine Interpretations are either not
relevant to or have no significant impact on the financial statements:
• Amended PAS 32, Financial Instruments: Presentation - Clarification of Rights Issues
• Amended IFRIC 14, Prepayments of a Minimum Funding Requirement
• Philippine Interpretation IFRIC 19, Extinguishing Financial Liabilities with Equity Instruments

12
Improvements to PFRS
The annual improvements process has been adopted by the International Accounting Standards Board (IASB)
to deal with non-urgent but necessary amendments to PFRS. The following summarizes the amendments that
are effective on or after January 1, 2011. The adoption of the following amendments is relevant but does not
have a significant impact on the financial statements:
• PFRS 7, Financial Instruments Disclosures, emphasizes the interaction between quantitative and
qualitative disclosures and the nature and extent of risks associated with financial instruments.
• PAS 1, Presentation of Financial Statements, clarifies that an entity will present an analysis of other
comprehensive income for each component of equity, either in the statement of changes in equity or in
the notes to the financial statements.
• PAS 34, Interim Financial Reporting, provides guidance to illustrate how to apply disclosure principles
in PAS 34 and requires additional disclosures on: (a) the circumstances likely to affect fair values of
financial instruments and their classification, (b) transfers of financial instruments between different
levels of the fair value hierarchy, (c) changes in the classification of financial assets and (d) changes in
contingent liabilities and assets.
Other amendments resulting from the 2011 improvements to PFRS, PAS and Philippine Interpretations to the
following standards did not have any significant impact on the accounting policies, financial position or
performance of the Company.
• PFRS 3, Business Combinations
• PAS 27, Consolidated and Separate Financial Statements
• Philippine Interpretation IFRIC 13, Customer Loyalty Programmes
Revenue and Costs Recognition
Revenue is recognized to the extent that it is probable that the economic benefit will flow to the Company
and the amount of revenue can be reliably measured. Revenue is measured at the fair value of the
consideration received excluding VAT. The Company assesses its revenue arrangements against specific
criteria in order to determine if it is acting as principal or agent. The Company has concluded that it is
acting as a principal in all of its revenue arrangements. The following specific recognition criteria must
also be met before revenue is recognized:
Sale of real estate properties
Sales of condominium units and residential houses where the Company has material obligations under the
sales contract to provide improvements after the property is sold are accounted for under the percentage
of completion method. Under this method, revenue on sale is recognized as the related obligations are
fulfilled.
Revenue from sales of completed residential lots and housing units, where a sufficient down payment has
been received, the collectability of the sales price is reasonably assured, the refund period has expired, the
receivables are not subordinated and the seller is not obliged to complete improvements, is accounted for
under the full accrual method. If the criterion of full accrual method was not satisfied, any cash received
by the Company is included in “Accounts payable and accrued expenses” in the balance sheet until all the
conditions for recording a sale are met.
Costs of Real Estate Sales
Costs of real estate sales are recognized consistent with the revenue recognition method applied. Cost of
condominium units sold before the completion of the development is determined on the basis of the
acquisition cost of the land plus its full development costs, which include estimated costs for future
development works as determined by the Company’s in-house technical staff.
In addition, cost of real estate sales of 100% completed projects represents the proportionate share of the
sold units to the total of the development cost which includes land, direct materials, labor cost and other
indirect costs related to the project. If the project is still under construction, the cost of real estate sales of
the sold units is multiplied by the percentage of completion. The cost referred to is the same total

13
development costs and not only actual expenditures. The percentage of completion is based on the
technical evaluation of the project engineers as well as management’s monitoring costs, progress and
improvements of the projects.
Future Changes in Accounting Policies
The Company will adopt the following standards and interpretations when these become effective subsequent
to 2011. Except as otherwise indicated, the Company does not expect the adoption of these new, and
amended and improvements to PFRS, PAS and Philippine Interpretations to have significant impact on the
financial statements.
Effective in 2012
• PFRS 7, Financial Instruments: Disclosures - Enhanced Derecognition Disclosure Requirements,
requires additional disclosure about financial assets that have been transferred but not derecognized to
enable the user of the Company’s financial statements to understand the relationship with those assets that
have not been derecognized and their associated liabilities.
• Amended PAS 12, Income Taxes - Deferred Taxes: Recovery of Underlying Assets, introduces a
rebuttable presumption that deferred tax on investment properties measured at fair value will be
recognized on a sale basis, unless an entity has a business model that would indicate the investment
property will be consumed in the business. If consumed, an own use basis must be adopted
Effective in 2013
• PFRS 7, Financial Instruments: Disclosures - Offsetting Financial Assets and Financial Liabilities,
requires an entity to disclose information about rights of set-off and related arrangements (such as
collateral agreements). The new disclosures are required for all recognized financial instruments that are
offset in accordance with PAS 32.
• PFRS 10, Consolidated Financial Statements, replaces the portion of PAS 27 that addresses the
accounting for consolidated financial statements. The changes introduced by PFRS 10 will require
management to exercise significant judgment to determine which entities are controlled, and therefore,
are required to be consolidated by a parent, compared with the requirements that were in PAS 27.
• PFRS 11, Joint Arrangements, replaces PAS 31, Interests in Joint Ventures and SIC-13, Jointly-
controlled Entities – Non-monetary Contributions by Ventures. PFRS 11 removes the option to account
for jointly controlled entities (JCEs) using proportionate consolidation. Instead, JCEs that meet the
definition of a joint venture must be accounted for using the equity method.
• PFRS 12, Disclosure of Interests with Other Entities, includes all of the disclosures that were previously
in PAS 27 related to consolidated financial statements, as well as all of the disclosures that were
previously included in PAS 31 and PAS 28. These disclosures relate to an entity’s interests in
subsidiaries, joint arrangements, associates and structured entities. A number of new disclosures are also
required.
• PFRS 13, Fair Value Measurement, establishes a single source of guidance under PFRS for all fair value
measurements. PFRS 13 does not change when an entity is required to use fair value, but rather provides
guidance on how to measure fair value under PFRS when fair value is required or permitted.
• PAS 1, Financial Statements Presentation - Presentation of Items of Other Comprehensive Income,
changes the grouping of items presented in other comprehensive income (OCI). Items that would be
reclassified (or recycled) to profit or loss at a future point in time (e.g., upon derecognition or settlement)
would be presented separately from items that will never be reclassified. The amendment only affects the
presentation and has therefore no impact on the Company’s financial position or performance.
• Revised PAS 19, Employee Benefits, includes a number of amendments that range from fundamental
changes to simple clarifications and re-wording.

14
• PAS 27, Separate Financial Statements (Revised). As a consequence of the new PFRS 10 and PFRS 12
what remains of PAS 27 is limited to accounting for subsidiaries, jointly controlled entities, and
associates in separate financial statements.
• PAS 28, Investments in Associates and Joint Ventures. As a consequence of the new
PFRS 11 and PFRS 12, PAS 28 has been renamed PAS 28, Investments in Associates and Joint Ventures,
and describes the application of the equity method to investments in joint ventures in addition to
associates.
• Philippine Interpretation IFRIC 20, Stripping Costs in the Production Phase of a Surface Mine, applies to
waste removal costs that are incurred in surface mining activity during the production phase of the mine
(“production stripping costs”) and provides guidance on the recognition of production stripping costs as
an asset and measurement of the stripping activity asset.
Effective in 2014
• Amendments to PAS 32, Financial Instruments: Presentation - Offsetting Financial Assets and
Financial liabilities, clarifies the meaning of “currently has a legally enforceable right to set-off” and also
clarify the application of the PAS 32 offsetting criteria to settlement systems (such as central clearing
house systems) which apply gross settlement mechanisms that are not simultaneous.
Effective in 2015
• PFRS 9, Financial Instruments - Classification and Measurement, as issued reflects the first phase on the
replacement of PAS 39 and applies to classification and measurement of financial assets and financial
liabilities as defined in PAS 39. The Company will quantify the effect in conjunction with the other
phases, when issued, to present a comprehensive picture.
After consideration of the result of its impact evaluation, the Group has decided not to early adopt either
PFRS 9 (2009) of PFRS 9 (2010) for its 2012 financial reporting, thus the interim report as of March 31,
2012 does not reflect the application of the requirements and does not contain a qualitative and
quantitative discussion of the result of the company’s impact evaluation.
Standard Issued but not yet Effective
• Philippine Interpretation IFRIC 15, Agreements for the Construction of Real Estates, covers accounting
for revenue and associated expenses by entities that undertake the construction of real estate directly or
through subcontractors. The interpretation requires that revenue on construction of real estate be
recognized only upon completion, except when such contract qualifies as construction contract to be
accounted for under PAS 11, Construction Contracts, or involves rendering of services in which case
revenue is recognized based on stage of completion. Contracts involving provision of services with the
construction materials and where the risks and reward of ownership are transferred to the buyer on a
continuous basis will also be accounted for based on stage of completion. The SEC and the Financial
Reporting Standards Council (FRSC) have deferred the effectivity of this interpretation until the final
Revenue standard is issued by IASB and an evaluation of the requirements of the final Revenue standard
against the practices of the Philippine real estate industry is completed. The Company will quantify the
effect when the final Revenue standard is issued.
Additional disclosures required by these amendments will be included in the financial statements when these
amendments are adopted.
Events After the Balance Sheet Date
Post year-end events that provide additional information about the Company’s position at the end of reporting
period (adjusting events) are reflected in the financial statements. Post year-end events that are not adjusting
events are disclosed in the notes to the financial statements when material.
Segment Reporting
The Company’s operating business are organized and managed separately according to the nature of the
products and services provided, with each segment representing a strategic business unit that offers different
products and serves different markets. The Company’s asset-producing revenues are located in the Philippines
(i.e., one geographical location). Therefore, geographical segment information is no longer presented.

15
3. Significant Accounting Judgments, Estimates and Assumptions
The preparation of the financial statements requires management to make judgments, estimates and
assumptions that affect the amounts reported in the financial statements and accompanying notes. In the
opinion of management, these financial statements reflect all adjustments necessary to present fairly the
results for the periods presented. Actual results could differ from such estimates.
4. Cash and Cash Equivalents
March 2012 Dec. 2011
Cash on hand and in banks 4,838,725 6,040,443
Cash equivalents 654,000,000 305,500,000
658,838,725 311,540,443 Cash in banks earn interest at the respective bank deposit rates. Short-term investments are made for varying
periods of up to three months depending on the immediate cash requirements of the Company, and earn
interest at the respective short-term investment rates.
Short-term cash investments amounting to P=211.50 as of December 31, 2011 are investments in banks with
maturities of more than three months to one year from the dates of acquisition and earn interest at the
prevailing market rates.
5. Available-for-Sale Investments
Available-for-sale investments pertain to the fair value of the investments in equity securities amounting to P=
1.15 million and P=0.96 million as of March 31, 2012 and December 31, 2011, respectively. The recovery
(decline) in value of these securities is presented as Net changes in fair values of available-for-sale
investments in the stockholder’s equity section of the balance sheet.
6. Installment Contracts Receivable
This account consists of installment contracts receivable arising from the sale of real estate properties. The
installment contracts receivable on sales of real estate are collectible in monthly installments for periods
ranging from one (1) to ten (10) years and bear monthly interest rates of 0.67% to 2% computed on the
diminishing balance.
The portion due within one year (net of current portion of unrealized gross profit, estimated development
costs for unsold units, and deferred vat) amounted to P=137.55 million in March 2012 and P=150.22 million in
December 2011.
7. Other Receivables
March 2012 Dec. 2011
Advances to customers 3,942,651 2,101,579
Accrued interest 1,133,805 3,821,367
Retention 990,200 920,200
Others 2,711,762 2,419,704
8,778,418 9,262,850
The portion due within one year amounted to P=7.28 million in March 2012 and P=8.07 million in December
2011.

16
8. Real Estate Properties for Sale and Held for Future Development
Real estate properties for sale consist of cost incurred in the development of condominium units and
residential houses for sale amounting to P=314.77 million and P=391.69 million as of March 31, 2012 and
December 31, 2011, respectively.
Condominium units and residential houses for sale accounts include borrowing costs incurred in connection
with the development of the properties amounting to P=0.56 million as of March 2012 and P=2.11 million as of
December 2011. The capitalization rate used to determine the amount of borrowing costs eligible for
capitalization was 3.90% in March 2012 and 3.86% in December 2011.
In 2011, the Company acquired a parcel of land amounting to P=109.81 million for future development.
9. Investment Properties
Investment properties are rented out at different rates generally for a one-year term renewable every year.
These investment properties were appraised by independent firms of appraisers at various dates.
10. Accounts Payable and Accrued Expenses
March 2012 Dec. 2011
Trade payables 26,006,109 28,764,654
Deposits 10,861,532 10,062,434
Accrued expenses:
Development costs 293,398,345 311,228,188
Director’s fee 17,816,860 14,841,537
Interest 1,648,668 1,343,688
Taxes, premiums, others 4,202,063 769,561
Withholding taxes 1,025,334 2,279,132
Dividends 1,323,332 1,060,777
Others 6,769,645 3,848,307
363,051,888 374,198,278
The portion due within one year amounted to P=193.4 million in March 2012 and P=209.9 million in December
2011.
11. Loans and Notes Payable
March 2012 Dec. 2011
Short-term commercial papers (STCP) with various
maturities and interest rate ranging from 2.94% to
4.84% as of March 2012 and 3.50% to 4.77% in
Dec. 2011
138,500,000
139,450,000
Short-term promissory notes enrolled with HGC
with various maturities and interest rate ranging
from 2.30% to 3.40% as of March 2012 and
1.70% to 3.40% in Dec. 2011
180,603,197
182,570,561
319,103,197 322,020,561 On September 12, 2011 and September 3, 2010, the Philippine Securities and Exchange Commission (SEC)
authorized the Company to issue P=200.00 million worth of STCP registered with the SEC in both years, in
accordance with the provision of the Securities Regulation Code and its implementing rules and regulations,
the Code of Corporate Governance and other applicable laws and orders.

17
In 2011 and 2010, the Company entered into a contract of guaranty under a Revolving Cash Guaranty Line with
HGC in the amount of P=200.00 million coverage on the Company’s STCP. The guaranty covers the unpaid
principal due on the outstanding STCP and unpaid interest thereon of 10% per annum. The guaranty premium
paid was 0.90% per annum based on enrolled commercial papers in 2011 and 2010.
12. Related Party Disclosures
Parties are considered to be related if one party has the ability to control, directly or indirectly, the other party
or exercise significant influence over the other party in making financial and operating decisions. It includes
companies in which one or more of the directors and/or shareholder of the Company either has a beneficial
controlling interest or are in a position to exercise significant influence therein.
The Company discloses the nature of the related party relationship and information about the transactions and
outstanding balances necessary for an understanding of the potential effect of the relationship on the financial
statements, including, as a minimum, the amount of outstanding balances and its terms and conditions
including whether they are secured, and the nature of the consideration to be provided in settlement.
The following transactions have been entered into with related parties in the normal course of business:
Related Party
Interest
Income for
Advances to
Related Parties(s)
Interest
Expense for
Advances from
Related Parties(a)
Amounts
Owed by Related
Parties(b)
Amounts
Owed to Related
Parties(b)
Cityland Development Mar. 2012 6,205 -- -- 39,533
Corporation (Parent company) Dec. 2011 98,217 72,204 -- 1,060,034
Cityland Inc. (Ultimate parent company) Mar. 2012 2,675 -- -- 413,831
Dec. 2011 60,112 29,551 -- 954,663
Cityplans, Inc. (Affiliate under common Mar. 2012 -- -- -- --
control) Dec. 2011 -- -- 23,182 --
Mar. 2012 8,880 -- -- 453,364
Dec. 2011 158,329 101,755 23,182 2,014,697 (a) Accrued interest on interest-bearing advances. (b) Non-interest bearing advances for reimbursable expenses.
13. Stockholders’ Equity
Dividends declared and paid by the Company from retained earnings were as follows:
Cash dividends:
Stockholders of
Date Approved Per share Record Date Date Paid
June 03, 2011 P=0.14 June 17, 2011 July 13, 2011
June 07, 2010 P=0.05 July 07, 2010 August 02, 2010
June 05, 2009 P=0.07 June 22, 2009 July 16, 2009
June 06, 2008 P=0.10 June 23, 2008 July 17, 2008
Stock dividends:
Stockholders of
Date Approved Percentage Record Date Date Issued
May 2, 2011 20% July 14, 2011 September 9, 2011
April 30, 2010 20% June 18, 2010 July 14, 2010
May 28, 2009 20% June 26, 2009 July 22, 2009
On May 28, 2009, the Securities and Exchange Commission (SEC) approved the Company’s Amended
Articles of Incorporation on the application for increase in capital stock from P=400,000,000 to P=700,000,000
with par value of P=1 each. The SEC also authorized the issuance of 20% stock dividends declared by the
BOD on April 30, 2008 and ratified by the stockholders on June 10, 2008.

18
On May 10, 2011, the Board of Directors authorized the transfer of appropriated retained earnings for the
development cost of Grand Emerald Tower, which was 100% completed to appropriated retained earnings to
finance the development costs of Manila Residences Bocobo has the same amount of P=100.00 million.
Manila Residences Bocobo is 96.36% complete as of March 31, 2012.
As of March 31, 2012, the unappropriated retained earnings include the remaining balance of deemed cost
adjustment amounting toP=11.83 million, net of related deferred tax of P=5.07 million, related to real estate
properties for lease which rose when the Company transitioned to PFRS in 2005. This amount has yet to be
absorbed through sales and is restricted for the payment of dividends.
The Company’s objectives in capital management is to maintain an optimal capital structure by ensuring that
debt and equity capital are mobilized efficiently and to provide returns for stockholders and benefit for other
stakeholders.
The Company manages its capital structure and makes adjustments to it, in the light of changes in economic
conditions. It monitors capital using leverage ratios on both gross debt and net debt basis.
14. Financial Income
March 2012 March 2011
Interest income 41,483,776 42,147,461
Dividend income 3,199 1,936
41,486,975 42,149,397
15. Operating Expenses
March 2012 March 2011
Personnel (see Note 16) 14,783,510 21,342,234
Taxes and licenses 14,271,937 12,280,025
Professional fees 3,576,690 3,053,190
Insurance Expense 2,262,056 3,724,946
Membership dues 1,307,353 134,035
Brokers’ commission 917,256 645,495
Depreciation 678,716 678,716
Outside services 537,238 832,994
Advertising and promotion 451,170 879,334
Postage, telephone and telegraph 195,739 282,419
Transportation 101,064 155,289
Power, light and water 55,163 --
Repairs and Maintenance 1,065 164,432
Office supplies -- 223,684
Others 787,305 1,362,945
39,926,262 45,759,738
Revenue Regulations (RR) No. 10-2002 defines expenses to be classified as entertainment, amusement and
recreation (EAR) expenses and sets a limit for the amount that is deductible for tax purposes. EAR expenses
are limited to 0.5% of net sales for sellers of goods or properties or 1% of net revenues for sellers of services.
For sellers of both goods or properties and services, an apportionment formula is used in determining the
ceiling on such expenses.

19
16. Personnel Expenses
March 2012 March 2011
Salaries and wages 6,253,500 8,609,112
Employee Benefits and Commissions 8,006,999 12,012,341
Benefits and other social expenses 523,011 720,781
14,783,510 21,342,234
17. Financial Expense
March 2012 March 2011
Interest expense – net of amounts capitalized 2,289,705 2,440,242
Finance Charge 24,900 144,811
2,314,605 2,585,053
18. Retirement Plan
The Company, jointly with affiliated companies, has a funded, noncontributory defined benefit retirement
plan covering all of its permanent employees.
19. Income Taxes
Provision for income tax consists of:
March 2012 March 2011
Current 8,615,129 13,578,836
Deferred (2,509,240) 2,767,183
Final tax on interest income 1,341,624 1,095,211
7,447,513 17,441,230
20. Earnings Per Share
Earnings per share amounts were computed as follows:
March 2012 March 2011
a. Net income 58,392,867 71,198,994
b. Weighted average number of shares 676,042,298 676,042,298
c. Earnings per share (a/b) 0.086 0.105
*After retroactive effect of 20% stock dividends in 2011.
21. Financial Instruments
Financial Risk Management Objectives and Policies
The Company’s principal financial instruments comprise of loans and notes payable, cash and cash
equivalents, and short-term cash investments. The main purpose of these financial instruments is to finance
the Company’s operations. The Company’s other financial instruments, which include available-for-sale
investments, are held for investing purposes. The Company has various other financial assets and liabilities
such as trade receivables and trade payables, which arise directly from its operations.
It is, and has been throughout the year under review, the Company’s policy that no trading in financial
instruments shall be undertaken. The Company has no investment in foreign securities.

20
The main risks arising from the Company’s financial instruments are cash flow interest rate risks, credit risk,
foreign currency risks, equity price risk and liquidity risk. The Board of Directors is mainly responsible for
the overall risk management approach and for the approval of risk strategies and principles of the Company
and they are summarized as follows:
Cash flow interest rate risk
The Company’s exposure to the risk for changes in market interest rates relates primarily to the Company’s
short-term and long-term loans payable all with floating interest rates. This means that the Company assumes
the concurrent movements in interest rates and parallel shift in the yield curves.
The Company manages its interest rate risk by maintaining credit lines with financial institutions and limiting
borrowings to the Company’s cash requirements.
A sensitivity analysis to a reasonable change in the interest rates (with all other variables held constant) of
0.0485% higher or lower, would increase or decrease the Groups’ income before income tax of P=154,765.
Credit risk
The Company trades only with recognized, creditworthy third parties. It is the Company’s policy that all
customers that wish to trade on credit terms are subject to credit verification procedures. In addition,
receivable balances are monitored on an on-going basis with the result that the Company’s exposure to bad
debts is not significant.
The table below shows the Company exposure to credit risk for the components of the balance sheet. The
exposure as of March 31, 2012 is shown at gross, before taking the effect of mitigation through the use of and
collateral agreements and at net, after taking the effect of mitigation through the use of collateral agreements.
Gross Net
Loans and receivables:
Cash and cash equivalents, excluding cash on hand 658,817,725 227,697,418
Installment contract receivables 856,259,611 --
Other receivables 8,154,907 1,958,960
Total credit risk exposure 1,523,232,243 229,656,378
The following table summarizes the aging analysis of receivables and the credit quality of the receivables as
of March 31, 2012:
Current
> One Year
Past Due But Not Impaired
Total < 30days 31 - 60 days 61 – 90 days > 90 days
Installment contracts rec. 133,547,655 718,714,049 1,800,638 748,291 1,448,978 - 856,259,611
Other receivables:
Accrued interest 1,133,805 - - - - - 1,133,805
Customers 2,104,623 - - 4,137 139,824 1,694,067 3,942,651
Retention - 870,000 - - - 120,200 990,200
Others 2,087,519 - 732 - - - 2,088,251
138,873,602 719,584,049 1,801,370 752,428 1,588,802 1,814,267 864,414,518
The table below shows the credit quality by class of asset for loan-related balance sheet lines as of March 31,
2012, based on the Company’s credit rating system.
Medium** Past due but
High Grade* Grade not impaired Total
Cash and cash equivalents
(excluding cash on hand)
658,817,725 -- -- 658,817,725
Installment contract receivables 852,261,704 -- 3,997,907 856,259,611
Other receivables 6,160,576 35,371 1,958,960 8,154,907
1,517,240,005 35,371 5,956,867 1,523,232,243
* High Grade - financial assets with reputable counterparties and which management believes to be reasonably assured to be
recoverable.
** Medium Grade - financial assets for which there is low risk on default of counterparties.

21
The main considerations for impairment assessment include whether any payments are overdue or if there are
any known difficulties in the cash flows of the counterparties. The Company assesses impairment into two
areas: individually assessed allowances and collectively assessed allowances.
The Company determines allowance for each significant receivable on an individual basis. Among the items
that the Company considers in assessing impairment is the inability to collect from the counterparty based on
the contractual terms of the receivables. The Company also considers the fair value of the real estate
collateralized in computing the impairment of the receivables. Receivables included in the specific
assessment are those receivables under the installment contracts receivable accounts.
Because the Company holds the title to the real estate properties with outstanding installment contracts
receivable balance and can repossess such real estate properties upon default of the customer in paying the
outstanding balance, the Company does not provide for allowance for impairment of its installment contracts
receivable.
For collective assessment, allowances are assessed for receivables that are not individually significant and for
individually significant receivables where there is not yet objective evidence of individual impairment.
Impairment losses are estimated by taking into consideration the age of the receivables, past collection
experience and other factors that may affect collectibility.
Concentration Risk
The Company’s policy is to enter into transactions with a diversity of creditworthy parties to mitigate any
significant concentration of risk.
Foreign currency risk
The Company’s transactional currency exposures arise from purchases in currencies other than its functional
currency. However, the Company’s exposure to foreign currency risk is minimal. There are no outstanding
foreign currency-denominated assets and liabilities.
Equity Price Risk
Equity price risk is the risk that the fair values of equities decrease as a result of changes in the market value
of individual stock. The Company is exposed to equity securities price risk because of investments held by the
Company, which are classified on the balance sheets as available-for-sale investments.
A sensitivity analysis to a reasonable change in the equity price (with all other variables held constant) of P=
0.24 higher or lower, would increase or decrease the equity by P=278,564.
Liquidity risk
Liquidity is defined as the risk that the Company could not be able to settle or meet its obligations on time or
at a reasonable price. The Company’s objective is to maintain a balance between continuity of funding and
flexibility through the use of bank loans.
The table below summarizes the maturity analysis of the Company’s financial liabilities as of March 31, 2012:
Up to
One Year
Above
One Year
Total
Accounts payable and accrued expenses * 187,225,729 169,646,950 356,872,679
Notes payable** 331,563,858 -- 331,563,858
518,789,587 169,646,950 688,436,537 * Excludes statutory liabilities amounting to P=6,179,209 and P=2,343,105 as of March 2012 and December 2011, respectively.
** Includes interest expense amounting to P=12,460,661.

22
Fair Values
As defined in PAS 39, the fair value of the financial instruments approximate the carrying amounts of
recorded financial assets and liabilities as of March 31, 2012 and December 31, 2011.
March 31, 2012 December 31, 2011
Carrying value Fair value Carrying value Fair value
Financial assets
Cash and cash equivalents 658,838,725 658,838,725 311,540,443 311,540,443
Short-term cash investments - - 211,500,000 211,500,000
Available-for-sale investments 1,151,819 1,151,819 960,623 960,623
Installment contracts receivable 856,259,611 856,259,611 871,354,650 871,354,650
Other receivables 8,154,907 8,154,907 8,873,868 8,873,868
1,524,405,062 1,524,405,062 1,404,229,584 1,404,229,584
Financial liabilities
Accounts payable & accrued
expenses *
356,872,679
356,872,679
371,855,173
371,855,173
Loans and notes payable 319,103,197 319,103,197 322,020,561 322,020,561
675,975,876 675,975,876 693,875,734 693,875,734 * Excludes statutory liabilities amounting to P=6,179,209 and P=2,343,105 as of March 2012 and December 2011, respectively.
Cash and cash equivalents, short-term cash investments, other receivables, and accounts payable and accrued
expenses
Due to the short-term nature of the transactions the fair value of cash and cash equivalents, short-term cash
investments, other receivables, and accounts payable and accrued expenses, approximate amount of
consideration at the time of initial recognition.
Available-for-sale investments
Available-for-sale investments are stated at fair value based on quoted market prices.
Installment contracts receivable
The fair value of installment contracts receivable cannot be reasonably estimated due to the significant
volume of transactions and the varied terms and maturities.
Loans and notes payable
Due to the monthly/quarterly repricing of interest, loans and notes payable are stated at fair value.
22. Business Segments
The Company derives its revenues primarily from the sale and lease of real estate properties. The Company
does not have any major customers and all sales and leases of real estate properties are made to external
customers.
Segment Revenues and Expenses:
March 2012 March 2011
Sales of real estate 197,230,607 95.54% 306,668,756 97.85%
Rental income 1,153,293 0.56% 176,441 0.05%
Others 8,057,607 3.90% 6,571,976 2.10%
206,441,507 100.00% 313,417,173 100.00%
The Company’s real estate projects, investments, and properties under lease are primarily located in Metro
Manila.


