28
Clean Coal Technology in Future Energy Supply September. 10 th , 2014 Masayoshi Kitamura President J-POWER (Electric Power Development Co., Ltd.)

Clean Coal Technology in Future Energy Supply
September. 10th, 2014
Masayoshi Kitamura
President J-POWER
(Electric Power Development Co., Ltd.)
2
1.About J-POWER
2. To Supply Stable and Cheap Electricity
3.World-Leading Clean Coal Technology
~solution for both of climate change and economical growth~
4.R&D for Next-generation Technology
~ challenge for the future of coal-fired power generation ~
Table of Contents

3
1.About J-POWER
J-POWER’s Facilities in Japan
Tokyo
60Hz 50Hz
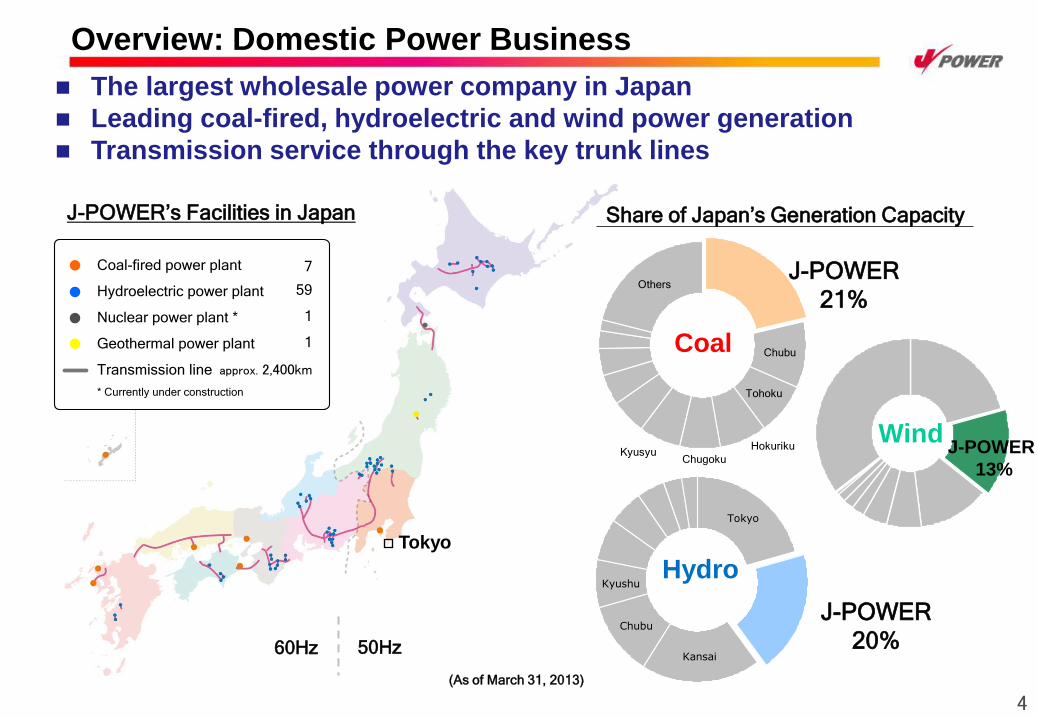
The largest wholesale power company in Japan
Leading coal-fired, hydroelectric and wind power generation
Transmission service through the key trunk lines
Share of Japan’s Generation Capacity
Chubu
Tohoku
Others
KyusyuChugoku
Hokuriku
Kansai
Chubu
Kyushu
Tokyo
Coal
Hydro
J-POWER
21%
J-POWER
20%
Wind J-POWER
13%
Coal-fired power plant
Hydroelectric power plant
Nuclear power plant *
Geothermal power plant
Transmission line
7
59
1
1
* Currently under construction
approx. 2,400km
(As of March 31, 2013)
Overview: Domestic Power Business
4
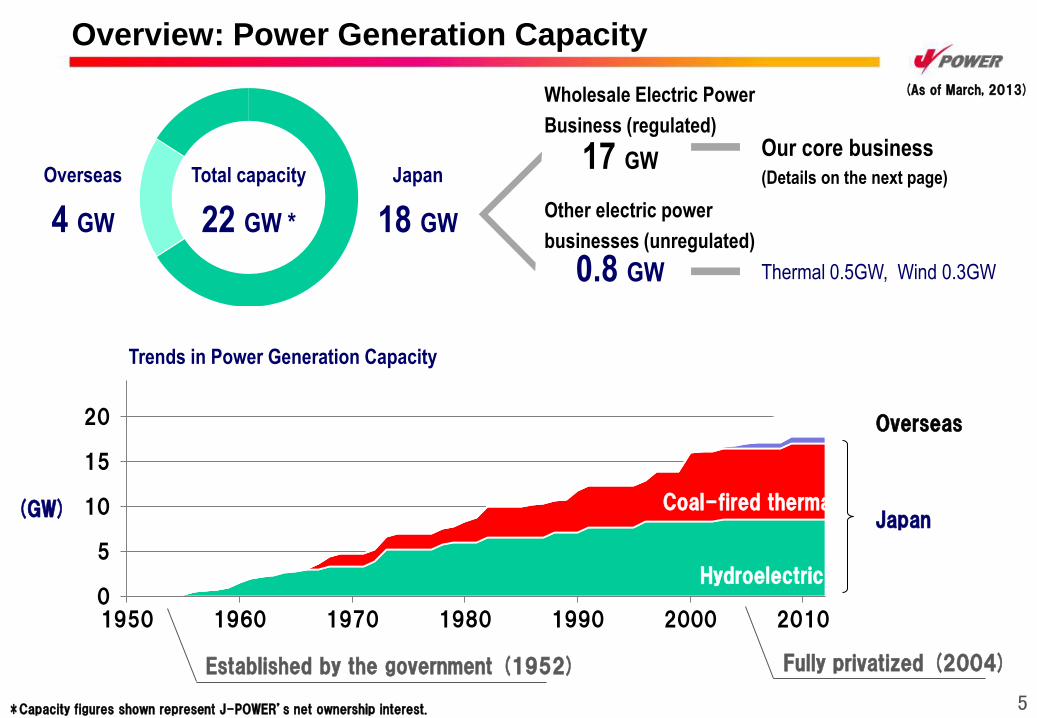
Overview: Power Generation Capacity
Total capacity
22 GW *
Overseas
4 GW
Japan
18 GW
17 GW
0.8 GW Thermal 0.5GW, Wind 0.3GW
0
5
10
15
20
1950 1960 1970 1980 1990 2000 2010
Established by the government (1952) Fully privatized (2004)
Hydroelectric
Coal-fired thermal
Overseas
Trends in Power Generation Capacity
(GW)
Our core business (Details on the next page)
Japan
Wholesale Electric Power
Business (regulated)
Other electric power
businesses (unregulated)
(As of March, 2013)
* Capacity figures shown represent J-POWER’s net ownership interest. 5

6
Overview: Coal-Fired Power Generation
The current generation capacity is 8,412 MW (of which 4,300 MW is USC). Matsushima PS is Japan’s
first large-scale imported coal fired power plant, and Matsuura PS Unit 2 is the first ultra super critical
(USC) coal-fired power plant .
Takasago (Hyogo)
1# 250MW(1968)
2# 250MW(1969)
Isogo (Kanagawa)
New 1# 600MW(2002)
New 2# 600MW(2009)
Tachibanawan (Tokushima)
1# 1,050MW(2000)
2# 1,050MW(2000)
Sub-critical
Super critical
Ultra super critical (USC)
Takehara (Hiroshima)
1# 250MW(1967)
2# 350MW(1995)
3# 700MW(1983)
Ishikawa (Okinawa)
1# 156MW(1986)
2# 156MW(1987)
Matsuura (Nagasaki)
1# 1,000MW(1990)
2# 1,000MW(1997)
Matsushima(Nagasaki)
1# 500MW(1981)
2# 500MW(1981)

7
2.To Supply Stable and Cheap Electricity

0
2,000
4,000
6,000
8,000
10,000
12,000
1952
1955
1960
1965
1970
1971
1972
1973
1974
1975
1976
1977
1978
1979
1980
1981
1982
1983
1984
1985
1986
1987
1988
1989
1990
1991
1992
1993
1994
1995
1996
1997
1998
1999
2000
2001
2002
2003
2004
2005
2006
2007
2008
2009
2010
2011
2012
2013
新エネ等
石油等
LNG
一般水力・揚水
石炭
原子力
(億kWh)
(年度)
原子力1.0%
石油等14.9%
LNG43.%
石炭30.3%
一般水力
揚水8.5%
新エネ等2.2%
(TWh)
Other RE
Oil
LNG
Hydro & Pumped Storage
Coal
Nuclear
8
Japan’s Electricity Supply by Energy Resources
After the oil crises in 1970s, Japan’s energy policy has aimed an well balanced energy portfolio and was about to realize it in 2010, then Fukushima disaster happened.
Challenge for Japan is to achieve a balanced energy portfolio while reducing nuclear energy.
J-POWER Matsushima PS
・ Commissioned in Jan. 1981
・ 1st laege scale imported coal-fired
power plant carried out in combination
with development of coal mine
Other Renewables
1.4 ⇒ 1.6 ⇒ 2.2%
Oil & Petro
14.4 ⇒ 18.3 ⇒ 14.9%
LNG
39.5 ⇒ 42.5 ⇒ 43.0%
Hydro & Pumped Storage
9.0 ⇒ 8.4 ⇒ 8.5%
Coal
25.0 ⇒ 27.6 ⇒ 30.3%
Nuclear
10.7 ⇒ 1.7 ⇒ 1.0%
Source: Energy White Paper 2013,
The Federation of Electric Power Companies of Japan (http://www.fepc.or.jp/english/index.html) (Fiscal Year)
[2011 ⇒ 2012⇒2013]
9
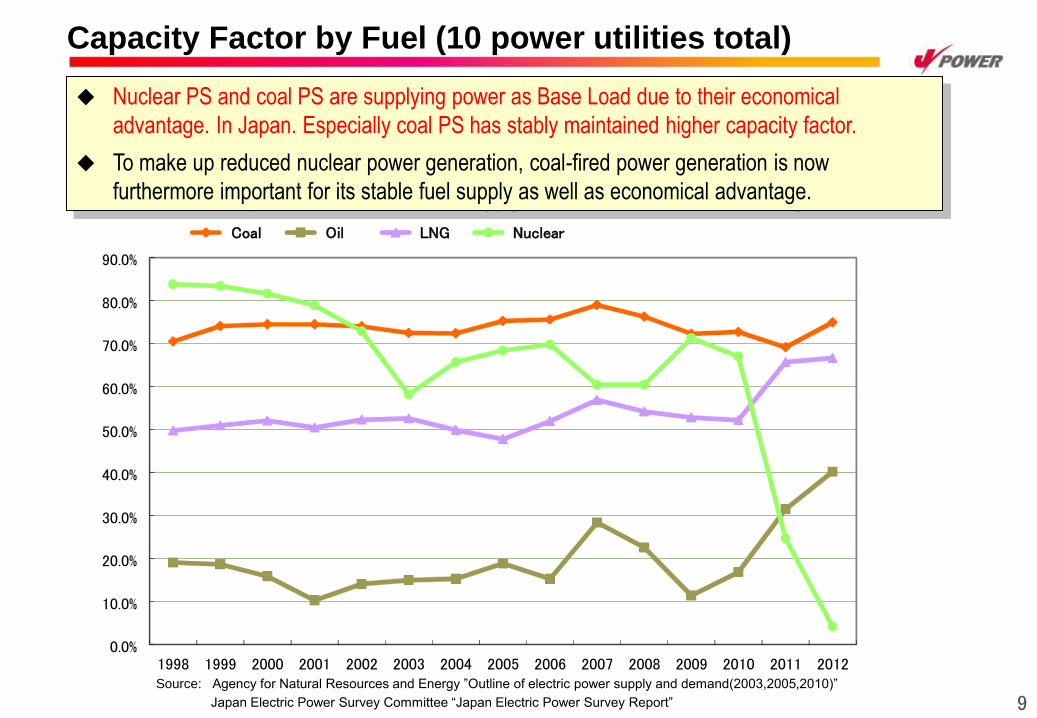
Capacity Factor by Fuel (10 power utilities total)
Nuclear PS and coal PS are supplying power as Base Load due to their economical
advantage. In Japan. Especially coal PS has stably maintained higher capacity factor.
To make up reduced nuclear power generation, coal-fired power generation is now
furthermore important for its stable fuel supply as well as economical advantage.
Source: Agency for Natural Resources and Energy ”Outline of electric power supply and demand(2003,2005,2010)”
Japan Electric Power Survey Committee “Japan Electric Power Survey Report”
Coal Oil LNG Nuclear
0.0%
10.0%
20.0%
30.0%
40.0%
50.0%
60.0%
70.0%
80.0%
90.0%
1998 1999 2000 2001 2002 2003 2004 2005 2006 2007 2008 2009 2010 2011 2012

0 2 4 6 8 10 12 14 16 18 20 22 240 2 4 6 8 10 12 14 16 18 20 22 24
Peak
Middle
Base
Change in Power Stations’ Operation
LNG (Middle Load)
Coal (Base Load)
Nuclear (Base Load)
Oil (Peak Load)
Hydro Power
Consumption for
pumping-up
Pumped Storage
Run-off River, Geothermal
Coal (Base Load) reduced
to zero
Before Fukushima Accident, LNG was used for the middle load and oil for the peak.
After Fukushima Accident, LNG is also used for the base, and oil for the middle, as nuclear for the base
load has disappeared.
before Fukushima after Fukushima
Run-off River, Geothermal
10
LNG (Base and Middle )
Oil (Middle and Peak)

11
Characteristics of Energy Resources for Power Generation
Energy resource portfolio for power generation is planned in balanced manner to achieve long term,
stable, economical and clean supply of electricity considering pros and cons of each energy resource.
It is necessary to understand not only the strong points but also possible weaknesses of each energy
resource when discussing the energy portfolio of power generation.
Energy Resource Fuel Supply
Security Economics
Global
Warming
Flexibility
of Power
Generation
Note
Pump Storage / Dam Hydro △ △ ○ ○
Possible to accommodate rapid change of Power Demand
Oil △ △ △ ○ Production is concentrated in Politically unstable countries.
Natural Gas(LNG) △ △ ○ ○
Caution is required to Global demand growth and competition. Require Large Discharging Facilities and Pipelines.
Coal ○ ○ △ ○
Working to reduce CO2 emission such as CO2 Capture and Gasification.
Dispersive construction of large plants are possible.
Nuclear ○ ○ ○ △ Necessary to upgrade safety measures and increase national acceptance.
Geothermal ○ ○ ○ △ Too small compared with Fossil Fuel Generation.
Anticipated to grow under Renewal Energy Law. Run of River Hydro △ ○ ○ △
PEAK
MIDDLE
BASE

12
3.World-Leading Clean Coal Technology
~solution for both of climate change and economical growth~
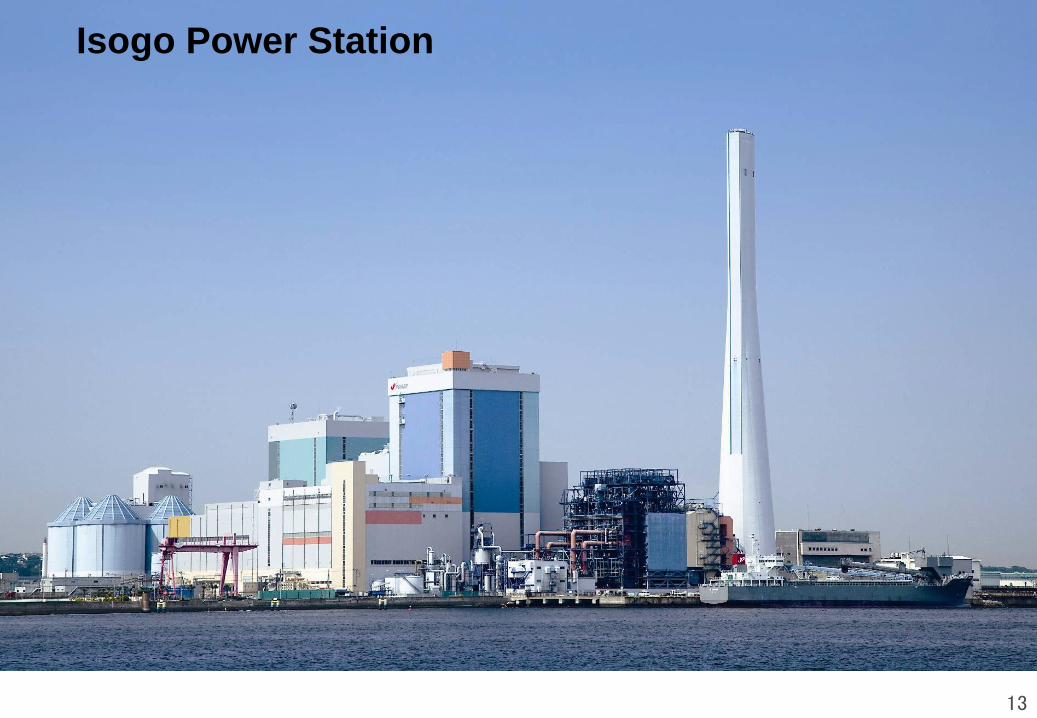
Isogo Power Station
13
14
0.50
0.75
1.00
1998 1999 2000 2002 2003 2004 2005 2006 2007Fisical year
Em
issio
n F
acto
r (k
g-C
O2/kW
h,n
et)
30
35
40
45
Energ
y E
ffic
iency(%
)
New unit 1
Old unit 1&2
Emission Factor
gross efficiency
net efficiency
Emission Factor
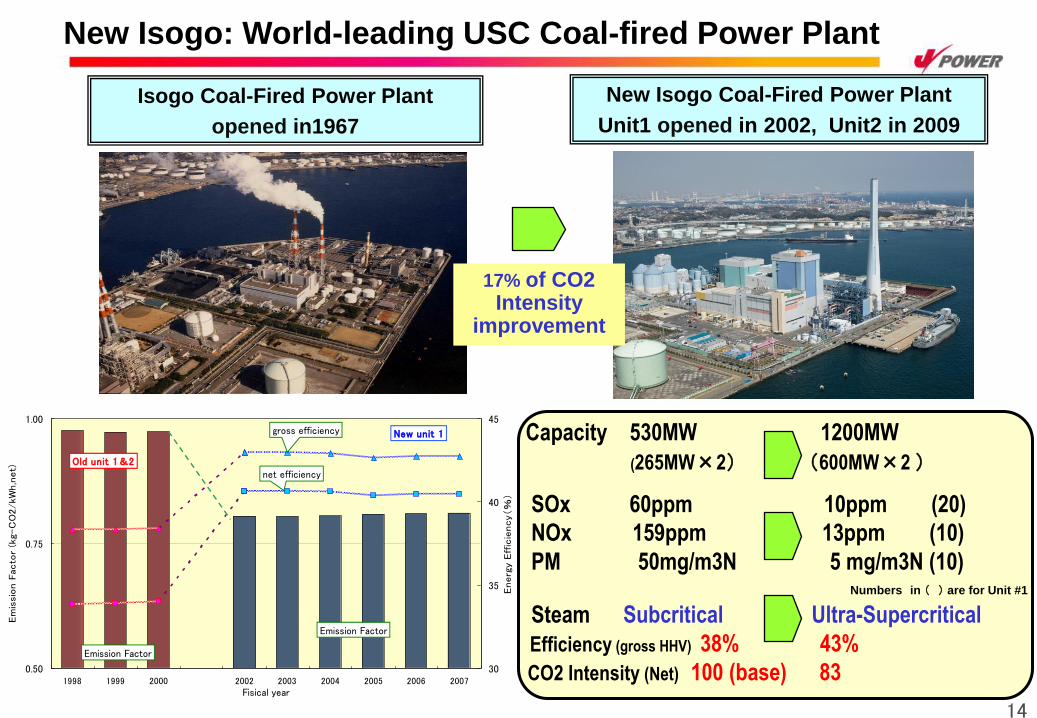
New Isogo: World-leading USC Coal-fired Power Plant
Isogo Coal-Fired Power Plant
opened in1967
Numbers in ( ) are for Unit #1
New Isogo Coal-Fired Power Plant
Unit1 opened in 2002, Unit2 in 2009
17% of CO2 Intensity
improvement
Capacity 530MW 1200MW
(265MW×2) (600MW×2 )
SOx 60ppm 10ppm (20)
NOx 159ppm 13ppm (10)
PM 50mg/m3N 5 mg/m3N (10)
Steam Subcritical Ultra-Supercritical
Efficiency (gross HHV) 38% 43%
CO2 Intensity (Net) 100 (base) 83

History of J-POWER’s Energy Efficiency Improvements
We achieved the world’s highest level of thermal efficiency at Isogo PS unit 2 as a result of our
continuous R&D for energy efficiency improvement for decades.
Takehara No.1
(250MW)
566 / 538℃
16.6MPa
Matsushima
(500MW x 2 Units)
538 / 538℃
24.1MPa
Matsuura No.1
(1,000MW)
538 / 566℃
24.1MPa
Tachibanawan
(1,050MW x 2 Units)
600 / 610℃
25.0MPa
Isogo New No.2*
(600MW)
600 / 620℃
25.0MPa
Sub-critical Super-critical (SC) Ultra-supercritical (USC)
Measures for improving generation efficiency
Improve steam conditions
Enlarge plant scale
Isogo New No.1*
(600MW)
600 / 610℃
25.0MPa
Trends in capacity per unit
45%
40%
35%
1965 1970 1975 1980 1985 1990 1995 2000 2005 2010
Takasago
(250MW x 2 Units)
566 / 538℃
16.6MPa
Takehara No.3
(700MW)
538 / 538℃
24.1MPa
Ishikawa
(15.6MW x 2 Units)
566 / 566℃
14.6MPa
Matsuura No.2
(1,000MW)
593 / 593℃
24.1MPa [Legend]
Power plant names
(Capacity, number of units)
Steam temperature / Reheat steam temperature
Main steam turbine pressure
* Isogo No.1 (started operation in 1967) and No.2 (1969) have been replaced with cutting-edge units.
500MW
(1981)
1,000MW
(1990)
1,050MW
(2000) Inst
alle
d g
ross
therm
al effic
iency
(%, base
d o
n H
HV)
15
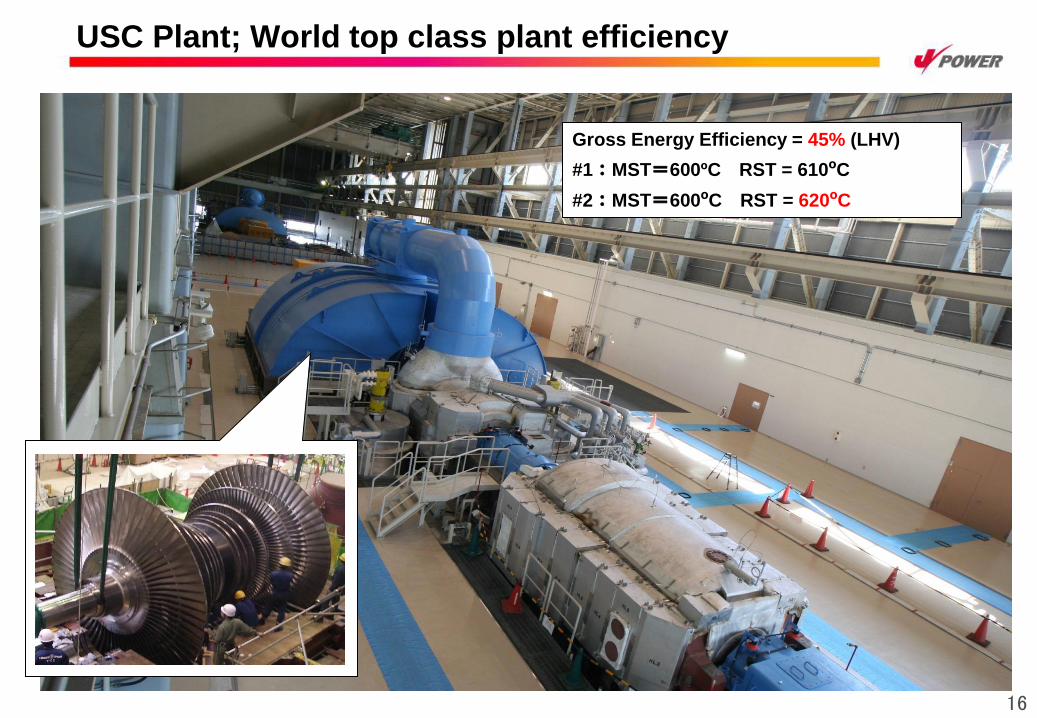
USC Plant; World top class plant efficiency
Gross Energy Efficiency = 45% (LHV)
#1:MST=600ºC RST = 610ºC
#2:MST=600ºC RST = 620ºC
16

17
Japanese Clean Coal Technology : Energy Efficiency
Energy efficiency of Japan’s coal-fired power generation is higher in comparison with other
countries including China, India and USA. Isogo PS marks the highest level in the world.
磯子火力
25%
27%
29%
31%
33%
35%
37%
39%
41%
43%
45%
1990 1992 1994 1996 1998 2000 2002 2004 2006 2008
Gro
ss T
herm
al E
ffic
iency (
%,
LH
V)
Isogo
J-POWER (total)
JAPAN
Nordic countries
Germany
USA
China
India
Thermal efficiency of coal-fired power generation in major countries (1990-2009)
Source: Ecofys “International Comparison of Fossil Power Efficiency and CO2 Intensity”

Dry type DeSOx system
Activated cokes feed
Activated cokes outlet
Processed gas outlet
Exhaust gas inlet
18
Merit of Dry-type DeSox System compared
to conventional Wet Scrubber
-Nearly 100% SOx removal possible
-Smaller water usage (<1/10)
-Smaller waste water to treat (<1/4)
-Space-saving for waste water treatment
19
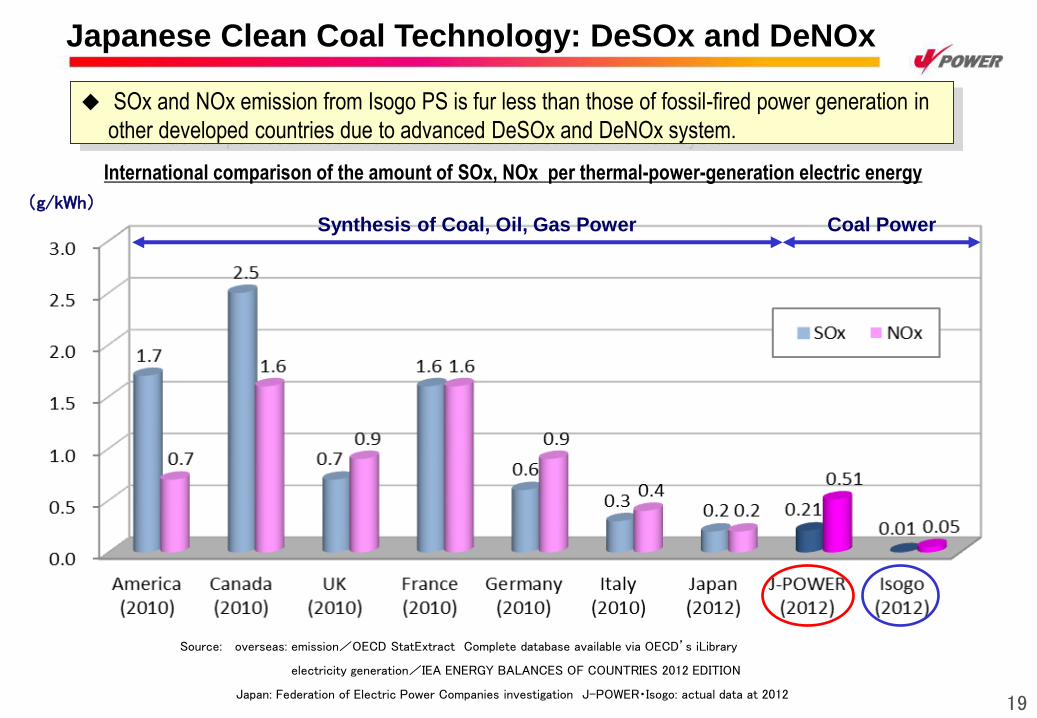
Source: overseas: emission/OECD StatExtract Complete database available via OECD’s iLibrary
electricity generation/IEA ENERGY BALANCES OF COUNTRIES 2012 EDITION
Japan: Federation of Electric Power Companies investigation J-POWER・Isogo: actual data at 2012
SOx and NOx emission from Isogo PS is fur less than those of fossil-fired power generation in
other developed countries due to advanced DeSOx and DeNOx system.
Coal Power Synthesis of Coal, Oil, Gas Power
International comparison of the amount of SOx, NOx per thermal-power-generation electric energy
(g/kWh)
Japanese Clean Coal Technology: DeSOx and DeNOx

0
50
100
150
200
250
300
350
Dus
t Em
issi
on (m
g/m
3N)
DeSOx+DeNOx+ESP:Coal DeSOx+LowNOx+ESP:Coal ESP:Coal DeSOx+LowNOx+ESP:Lignite ESP:Lignite
20 Source: “Preparation of the review relating to the Large Combustion Plant Directive”, prepared for European Commission Environment DG, July 2005
Dust Emission from Coal/Lignite-fired Power Plants in Europe and Isogo PS
by Type of Environmental Control Facility
Japanese Clean Coal Technology : Dust Removal
Dust emission from Isogo PS is fur less than those of coal/lignite-fired power plant in Europe
due to triple-stage environmental control system; Dry DeSOx + DeNOx + ESP.
* Other than Isogo, each power station is shown in reference number in the source (no plant name nor country identified)
* LowNOx means conventional NOx abatement measures including low NOx burner, air staging or flue gas recirculation without NOx removal facility

21
Coal is supplying 41%, the largest share of world total power generation.
Especially in China, India and USA, countries with greater energy demand, coal has higher share..
Even in renewable energy conscious Germany and Denmark, coal has the largest share more than 40%.
In Japan, coal is supplying 27% of total power generation.
Power Generation Portfolio in Selected Countries(2011)
Source: IEA ”World Energy Outlook2013”, IEA ”Electricity Information 2013”
Japan
Russia
EU
UK
World
Germany
Denmark
US
India
China
Coal Oil Gas Nuclear Hydro Bio+waste Wind Other RE
22
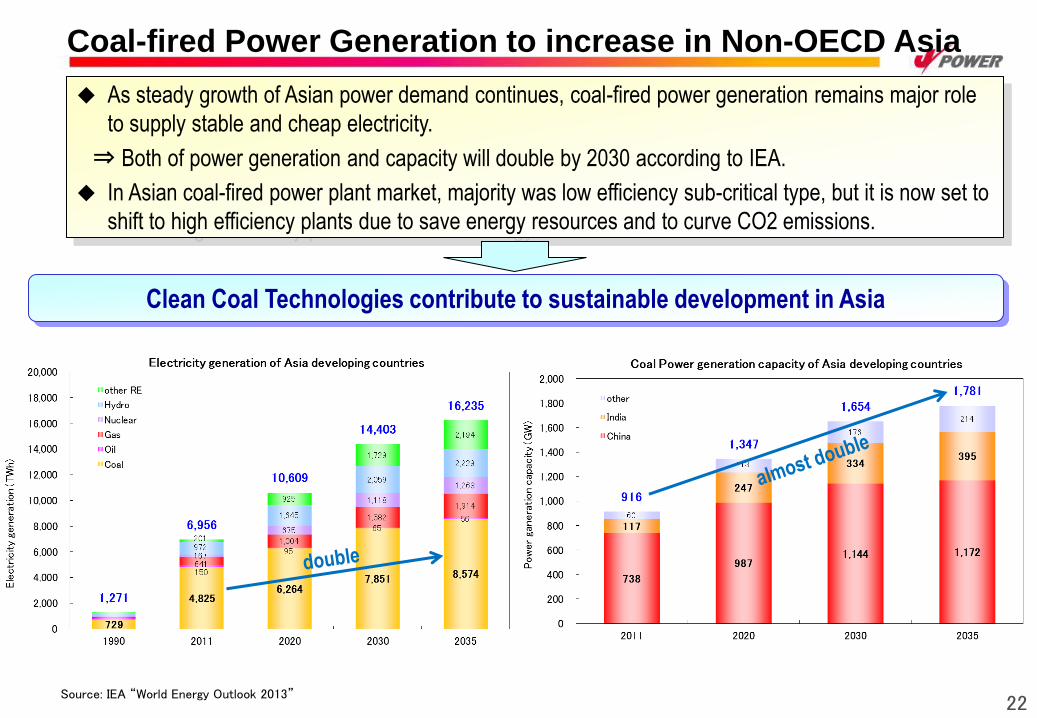
Coal-fired Power Generation to increase in Non-OECD Asia
As steady growth of Asian power demand continues, coal-fired power generation remains major role
to supply stable and cheap electricity.
⇒ Both of power generation and capacity will double by 2030 according to IEA.
In Asian coal-fired power plant market, majority was low efficiency sub-critical type, but it is now set to
shift to high efficiency plants due to save energy resources and to curve CO2 emissions.
Clean Coal Technologies contribute to sustainable development in Asia
Source: IEA “World Energy Outlook 2013”

Proven CCTs with
Preferred Finance,
Technical Transfer,
Joint Venture etc.
Wide
deployments
of latest CCTs
Coal saving and
CO2 emissions
reduction
CCTs
Commercialization
Further
Development of
CCTs
CO2 Credit etc.
Developing
Countries
Developed
Countries
CCTs Contribute to Global CO2 Reduction
Deploy latest proven CCTs to newly-built plants and the replacements
for old/low efficiency power plants so that energy saving and CO2
reduction can be achieved.
Clean coal technologies could effectively contribute to such rapid growing infrastructure building
and climate change mitigation in Asia through its CCTs and financial support.
23
24
4.R&D for Next-generation Technology
~ challenge for the future of coal-fired power generation ~

Development of Next Generation Coal-fired Power Plant
We aim to significantly increase energy efficiency and reduce CO2 emissions through the application of
oxygen-blown integrated coal gasification combined cycle.
Pulverized coal-fired Coal Gasification
<Aging plants>
Sub-critical
<Latest plants>
Ultra Super Critical
Advanced-USC
Integrated Coal
Gasification Combined
Cycle
Integrated Coal
Gasification Fuel Cell
Combined Cycle
(USC) (A-USC) (IGCC) (IGFC)
Efficiency*1: 36% 41% 46% 46% to 48% 55% or more
Steam temperature:
approx. 560℃ Approx. 600℃ Approx. 700℃
Gas temperature:
approx. 1500℃
Approx. 1500℃
or more
建設状況 (2013年1月現在)
*1 Net efficiency, based on HHV *2 Actual results through the replacement of J-POWER’s Isogo Thermal Power Plant
ST
Boiler
Next generation technologies Existing technologies
ST: Steam Turbine, GT: Gas Turbine, FC: Fuel Cell
25
STGasifier
GT
STGasifier
GT
FC

Development of Oxygen-blown IGCC
EAGLE project
1995
|
2013
Development of Japanese oxygen-blown entrained bed coal
gasifier
Establishment of gas clean-up technology
Coal type expansion
Establishment of CO2 capture technology (chemical absorption
and physical absorption)
Results
Developed coal gasifier with the world’s top-grade efficiency of
gasification.
Cut CO2 capture energy consumption by 30% (2 points up in power
generation efficiency) compared to conventional technology
(chemical absorption).
Osaki CoolGen project (170MW-class IGCC power plant)
Objective Verifying reliability, economy and operation of oxygen-blown
IGCC power plant for practical application.
2009 – 2012 Environmental assessment and feasibility study
2012 – 2016 Design and construction
2016 – 2018 Demonstration of IGCC
2019 – 2020 Demonstration of IGCC & CO2 capture
After 2020 Demonstration of IGFC & CO2 capture
Area of facilities for CO2 separate & capture trials
Area of facilities for IGCC trials
EAGLE pilot plant
(Fukuoka prefecture)
Construction site
(Hiroshima prefecture)
26
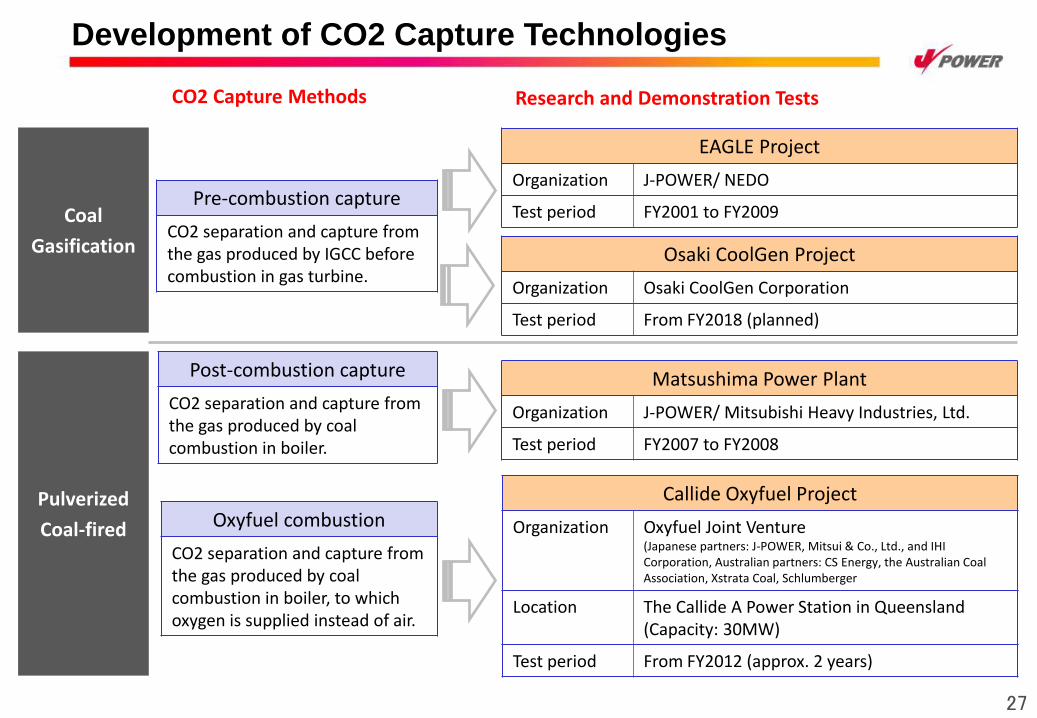
Development of CO2 Capture Technologies
Research and Demonstration Tests CO2 Capture Methods
Pre-combustion capture
CO2 separation and capture from the gas produced by IGCC before combustion in gas turbine.
Post-combustion capture
CO2 separation and capture from the gas produced by coal combustion in boiler.
Oxyfuel combustion
CO2 separation and capture from the gas produced by coal combustion in boiler, to which oxygen is supplied instead of air.
Coal
Gasification
Pulverized
Coal-fired
EAGLE Project
Organization J-POWER/ NEDO
Test period FY2001 to FY2009
Osaki CoolGen Project
Organization Osaki CoolGen Corporation
Test period From FY2018 (planned)
Matsushima Power Plant
Organization J-POWER/ Mitsubishi Heavy Industries, Ltd.
Test period FY2007 to FY2008
Callide Oxyfuel Project
Organization Oxyfuel Joint Venture (Japanese partners: J-POWER, Mitsui & Co., Ltd., and IHI Corporation, Australian partners: CS Energy, the Australian Coal Association, Xstrata Coal, Schlumberger
Location The Callide A Power Station in Queensland (Capacity: 30MW)
Test period From FY2012 (approx. 2 years)
27

Thank you for your attention.
http://www.jpower.co.jp/english/index.html


