Page 1
Page 1
Clean Corona Ionization Technology
Peter Gefter
Simco-Ion
phone: (1) 510-217-0614
email: [email protected]
Jack Menear
Jack Menear Associates
phone: (1) 831-462-9338
email: [email protected] )
Abstract - A need for clean corona ionizers has been long recognized (but unrealized)
within the semiconductor, disk drive, and photonics industries. Particle-ion mobility
separation provides the solution. Lower-weight ions reach the target; higher-weight
particles are trapped. Cleanliness matches X-ray and nuclear ionizers with lower cost,
less maintenance, and fewer installation/safety barriers.
I. SUMMARY
Clean (particle free) corona ionizers for static charge neutralization are an
understood need, particularly for semiconductor processing, disk drive, photonics and
other critical technologies . The semiconductor industry is expanding operation in
noble and electropositive gases like argon and nitrogen to avoid oxidation of sensitive
objects (products).
Super clean conductive gas streams are ideal solutions for many static related
problems [1, 2]. Protection of an ion emitter from ambient air with a dry air or nitrogen
sheath is an effective method to decrease debris buildup. However, that method cannot
protect ion emitter from corona/plasma related erosion or sputtering [3]. That means
corona generated particle will move to the product by the same protective CDA/
nitrogen gas streams.
The technique to achieve corona ionizer cleanliness in the nanoparticle range,
especially for electro-positive gases, has been elusive for two reasons.
First, ion balance control of bipolar corona discharge in electro-positive
gases is forced to operate within an extremely tight range to prevent
negative (electrons) current avalanches [3,4]. Corona feedback is
optimized to maintain that tight ion current range.
Page 2
Page 2
Second, corona ionization is highly energetic, and the ion emitter surface is
under continuous electron/ ion bombardment [1, 2]. Ion emitter reactions
eventually generate particles in the 10-100 nm range. Some particle
generation within a corona discharge is currently considered unavoidable.
Clean corona ionizers are designed for operation in facilities, mini-environments
and equipment, where compliance with ISO 14644 Class 1 (at 0.1 micron) and
extended ISO Class 1 (at 10 nm) is specified.
II. SEPARATING PARTICLES FROM IONS VIA ELECTRICAL MOBILITY
Corona generated particles can be separated from charge carriers, like ions and
electrons, using electrical mobility differences and vacuum. This separation occurs within
the ion/electron generation plasma zone, which is close to the corona emitter tip. For
example, diatomic nitrogen ions weigh 28 amu, and move quickly from the ion
generation zone toward a reference (non-ionizing electrode). Then the ions continue
moving toward a charged target via electrostatic repulsion.
Particles are much heavier than nitrogen ions, move slower in an electric field, and are
removed from the ionization zone with an internal vacuum strategy. In short, ions move
toward the target of charge neutralization. In contrast, particles move away from the
target (and toward the vacuum port), where they are captured with an internal filter.
Ionization frequency, service gas flow rate, ionization zone dimensions, and
vacuum flow rate are balanced to optimize performance. It should be noted that neither
an external vacuum source nor an external filter is needed.
The following diagram figure 1 visualizes concept the ion/particle separation.
Fig. 1. In- line ionizer structure visualizing concept of the ion/particle separation
IONSPARTICLES
Voltage
Particles
to vacuum
and filter
Nitrogen
flow
IONSPARTICLES
Voltage
Particles
to vacuum
and filter
Nitrogen
flow
Page 3
Page 3
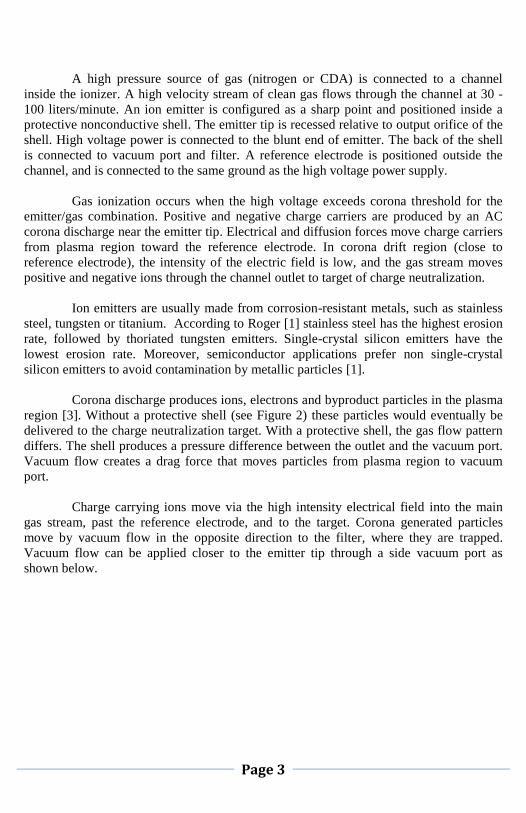
A high pressure source of gas (nitrogen or CDA) is connected to a channel
inside the ionizer. A high velocity stream of clean gas flows through the channel at 30 -
100 liters/minute. An ion emitter is configured as a sharp point and positioned inside a
protective nonconductive shell. The emitter tip is recessed relative to output orifice of the
shell. High voltage power is connected to the blunt end of emitter. The back of the shell
is connected to vacuum port and filter. A reference electrode is positioned outside the
channel, and is connected to the same ground as the high voltage power supply.
Gas ionization occurs when the high voltage exceeds corona threshold for the
emitter/gas combination. Positive and negative charge carriers are produced by an AC
corona discharge near the emitter tip. Electrical and diffusion forces move charge carriers
from plasma region toward the reference electrode. In corona drift region (close to
reference electrode), the intensity of the electric field is low, and the gas stream moves
positive and negative ions through the channel outlet to target of charge neutralization.
Ion emitters are usually made from corrosion-resistant metals, such as stainless
steel, tungsten or titanium. According to Roger [1] stainless steel has the highest erosion
rate, followed by thoriated tungsten emitters. Single-crystal silicon emitters have the
lowest erosion rate. Moreover, semiconductor applications prefer non single-crystal
silicon emitters to avoid contamination by metallic particles [1].
Corona discharge produces ions, electrons and byproduct particles in the plasma
region [3]. Without a protective shell (see Figure 2) these particles would eventually be
delivered to the charge neutralization target. With a protective shell, the gas flow pattern
differs. The shell produces a pressure difference between the outlet and the vacuum port.
Vacuum flow creates a drag force that moves particles from plasma region to vacuum
port.
Charge carrying ions move via the high intensity electrical field into the main
gas stream, past the reference electrode, and to the target. Corona generated particles
move by vacuum flow in the opposite direction to the filter, where they are trapped.
Vacuum flow can be applied closer to the emitter tip through a side vacuum port as
shown below.
Page 4
Page 4
Fig. 2. Ion emitter protective shell with vacuum port.
III. Testing Clean Corona Ionizers
A. Simultaneous Measurements of Particles, Discharge Time and Ion Balance
The test apparatus employed for simultaneous measurements is shown in Figure 3.
+
- +
-
+-
vacuum
and filter
TargetNitrogen++
-- ++
--
++--
vacuum
and filter
TargetNitrogen
Page 5
Page 5
Fig. 3. Test setup for simultaneous monitoring ionizer performance and particle emission.
In this test setup, the Monroe Model 280 CPM was 12 inches below the ionizer. Two
particle counter probes were 6 inches below outlet of the ionizer - between the ionizer
and the CPM. One laser particle counter had measuring sensitivity ≥ 100 nm. One Hach
Model 1104 CNC particle counter had measuring sensitivity ≥ 10 nm.
The main reason for this experimental setup is to collect data on particles and
performance stability simultaneously. There is an option to turn on and of ionizer and
monitor particles and performance during start up periods.
This setup is efficient and allows a valid long term test. But naturally, discharge times are
longer because particle probes are positioned between the CPM plate and the ionizer
outlet.
ion
ize
r
CPM
filter
12 in
che
s
90-105 feet/minute
Re
lay
& T
ime
r
(ON
/OF
F c
on
tro
l)
LPC CNC
6 in
che
s
DAC / Computer
DAC / Computer
DAC / Computer
ion
ize
r
CPM
filter
12 in
che
s
90-105 feet/minute
Re
lay
& T
ime
r
(ON
/OF
F c
on
tro
l)
LPC CNC
6 in
che
s
DAC / Computer
DAC / Computer
DAC / Computer
Page 6
Page 6
B. Long Term Discharge Times and Balance
An example graph of discharge time (upper section of the graph) and ion balance
(lower section of the graph) stability shown in Figure 4. Data was collected using the
test setup in Figure 3. Ionizer was connected to Dewar with liquid nitrogen at 99.999 %
purity.
Fig. 4. Discharge time and ion balance long term test results in nitrogen for clean corona
ionizer.
C. Shorter Performance Term Tests (without Particle Counts)
To measure discharge times without interference from particle probes, Figure 3 was
modified. The particle probes were removed, and the CPM was centered directly below
the ionizer. The distance between ionizer and CPM was changed from 12 inches to 6
inches.
As expected, much shorter discharge times are recorded. See Table 1 as an example.
-5
0
5
10
15
20
25
30
0
= positive discharge time
= negative discharge time
= balance
Dis
charg
e T
ime (
Seconds)
or
Bala
nce (
Volts)
Time
Discharge Time and Balance versus Time for Beta 4214 in Mini-environment #2
Readings above 20 are associated
with experimental changes
• 40 lpm nitrogen
• Model 280A CPM, 12 inches below 4214
(with particle count probes at 6 inches)
Power cycled ON and OFF.
Only ON cycle is plotted.
Plotted points are
hourly averages
233 Hours-5
0
5
10
15
20
25
30
0
= positive discharge time
= negative discharge time
= balance
= positive discharge time
= negative discharge time
= balance
Dis
charg
e T
ime (
Seconds)
or
Bala
nce (
Volts)
Time
Discharge Time and Balance versus Time for Beta 4214 in Mini-environment #2
Readings above 20 are associated
with experimental changes
Readings above 20 are associated
with experimental changes
• 40 lpm nitrogen
• Model 280A CPM, 12 inches below 4214
(with particle count probes at 6 inches)
Power cycled ON and OFF.
Only ON cycle is plotted.
Power cycled ON and OFF.
Only ON cycle is plotted.
Plotted points are
hourly averages
Plotted points are
hourly averages
233 Hours233 Hours
Page 7
Page 7
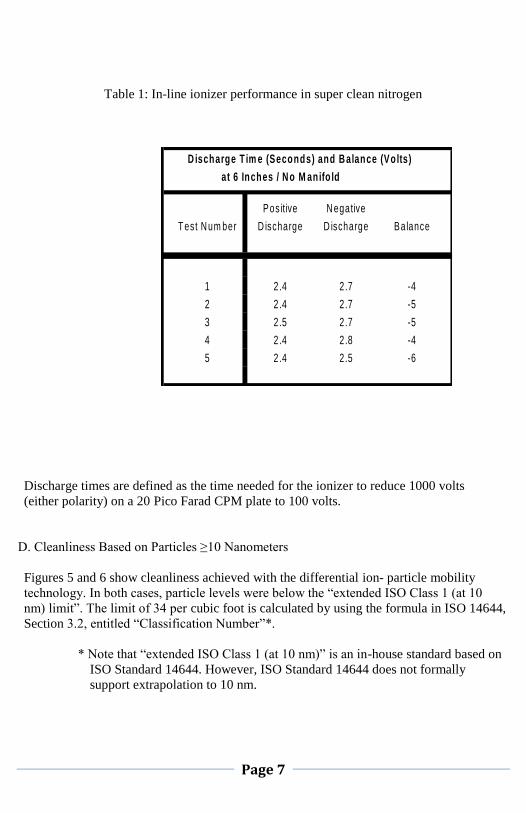
Table 1: In-line ionizer performance in super clean nitrogen
D ischarge T im e (Seconds) and B alance (Volts)
at 6 Inches / N o M anifo ld
Positive N egative
T est N um ber D ischarge D ischarge Balance
1 2.4 2.7 -4
2 2.4 2.7 -5
3 2.5 2.7 -5
4 2.4 2.8 -4
5 2.4 2.5 -6
Discharge times are defined as the time needed for the ionizer to reduce 1000 volts
(either polarity) on a 20 Pico Farad CPM plate to 100 volts.
D. Cleanliness Based on Particles ≥10 Nanometers
Figures 5 and 6 show cleanliness achieved with the differential ion- particle mobility
technology. In both cases, particle levels were below the “extended ISO Class 1 (at 10
nm) limit”. The limit of 34 per cubic foot is calculated by using the formula in ISO 14644,
Section 3.2, entitled “Classification Number”*.
* Note that “extended ISO Class 1 (at 10 nm)” is an in-house standard based on
ISO Standard 14644. However, ISO Standard 14644 does not formally
support extrapolation to 10 nm.
Page 8
Page 8
Fig. 5. In-line ionizer cleanness test results in nitrogen with cycled power on and off.
0
5
10
15
20
25
30
35
40
45
50
Time
Pa
rticle
s p
er
Cu
bic
Foot of
Nitrog
en
≥1
0 n
m
10 nm Particle Counts versus Time for Beta 4214 in Mini-environment #2
• 40 lpm nitrogen
• CNC probe was 6 inches below 4214.
Power cycled ON and OFF.
Data points may mix
ON and OFF conditions.
Plotted points are
hourly averages
Extended ISO Class 1 limit = 34
Measurements made after
a firmware change to V1.0.
70 Hours
0
5
10
15
20
25
30
35
40
45
50
Time
Pa
rticle
s p
er
Cu
bic
Foot of
Nitrog
en
≥1
0 n
m
10 nm Particle Counts versus Time for Beta 4214 in Mini-environment #2
• 40 lpm nitrogen
• CNC probe was 6 inches below 4214.
Power cycled ON and OFF.
Data points may mix
ON and OFF conditions.
Power cycled ON and OFF.
Data points may mix
ON and OFF conditions.
Plotted points are
hourly averages
Plotted points are
hourly averages
Extended ISO Class 1 limit = 34Extended ISO Class 1 limit = 34
Measurements made after
a firmware change to V1.0.
Measurements made after
a firmware change to V1.0.
70 Hours70 Hours
Page 9
Page 9
Fig. 6. In-line ionizer cleanness test results with high flow rate of super clean nitrogen
gas.
Ionizers in Figures 5 and 6 used single crystal silicon emitters. Ionization voltage at
nominally 40 kHz was applied to the emitter. Voltage amplitude was optimized to
minimize emitter erosion, to minimize particle generation, and to deliver robust ion
output. Tests were performed in ISO 14644 Class 1 (at 0.1 micron) clean rooms.
Temperature and humidity were monitored, but not controlled.
The differential mobility cleanliness strategy reduced 10 nm particles by a factor of 261
when vacuum flow was between 3 and 10 liters/minute. In one example without vacuum
applied, 10 nm particles averaged 1226 per cubic foot. With vacuum applied, 10 nm
particles averaged dropped to 4.7 per cubic foot (refer to Figure 6).
0
10
20
30
40
50
60
Pa
rtic
les p
er
Cu
bic
Foo
t of
Ion
ize
d N
itro
gen
6 I
nche
s b
elo
w O
utle
t
21.75 Hours
Extended ISO Class 1 Limit for 10 nm Particles = 34
340 Extended ISO Class 2 Limit for 10 nm Particles = 340
• 100 nm particles/ft3 averaged 0.011. The ISO Class 1 limit is 0.283.
• 10 nm particles/ft3 averaged 4.7. The extended ISO Class 1 limit is 34.
• Balance (not plotted) ranged from 0 to -3 volts.
Ionizer flow rate
was 90 liters/minute = 10 nm particles
= 100 nm particles
0
10
20
30
40
50
60
Pa
rtic
les p
er
Cu
bic
Foo
t of
Ion
ize
d N
itro
gen
6 I
nche
s b
elo
w O
utle
t
21.75 Hours21.75 Hours
Extended ISO Class 1 Limit for 10 nm Particles = 34
340 Extended ISO Class 2 Limit for 10 nm Particles = 340
• 100 nm particles/ft3 averaged 0.011. The ISO Class 1 limit is 0.283.
• 10 nm particles/ft3 averaged 4.7. The extended ISO Class 1 limit is 34.
• Balance (not plotted) ranged from 0 to -3 volts.
Ionizer flow rate
was 90 liters/minute
Ionizer flow rate
was 90 liters/minute = 10 nm particles
= 100 nm particles
Page 10
Page 10
E. Particles ≥ 100 Nanometers
Particles ≥ 100 nm averaged 0.011 per cubic foot of air. This is well below the ISO Class
1 (at 0.1 micron) of 0.283 per cubic foot.
IV. PARTICLE MEASUREMENT EQUIPMENT AND PARAMETERS
A. Particles ≥ 100 nm were measured with a Hach [Met One] Model 2100C laser particle
counter. The Model 2100C samples air or nitrogen at a rate of 1 cubic foot per minute.
Each sample period was 10 minutes with a 5 minute hold period between samples. For
data reduction, particle counts in each 10-minute sample period were divided by 10 to
get average particles per cubic foot.
B. Particles ≥ 10 nm were measured with a Hach [Met One] Model 1104 CNC particle
counter. The Model 1104 samples air or nitrogen at a rate of 0.1 cubic foot per
minute.
Each sample period was 10 minutes with a 5 minute hold period between samples.
Particle counts in each 10-minute sample period represent the particles per cubic foot.
No division is needed.
V. DISPERSION NOZZLE FOR LARGE AREA DISCHARGE
Because the ions are created close to the ionizer’s delivery tube, addition of a
fast-through dispersion nozzle or manifold allows to cover wide area static charges
neutralization [8]. With an ionizer 500 mm from a target plane, a 1000 mm by 400 mm
rectangle era can be discharged within useful time periods.
VI. EDUCTOR FOR INTERNAL VACUUM / CONSERVATION OF NITROGEN
An on-board eductor captures some of the energy of incoming pressurized
nitrogen/ CDA to generate the particle removal vacuum. External vacuum is not
needed. Nitrogen (or other gas) is not lost in the filtration process. After particles are
removed by filtration, evacuated nitrogen is returned to the main nitrogen flow.
Page 11
Page 11
VII. OPERATION WITH CDA OR HIGH PURITY NITROGEN / CLEANLINESS
TARGETS
The above information focuses on application to a nitrogen/argon environment.
However, the technology is adaptable to CDA (clean dry air). Corona discharge in
CDA further generates byproducts like ozone and nitrogen oxides. Vacuum flow in
plasma zone significantly reduces all corona byproducts. In both electropositive and
negative gases, particle concentrations in the ionized gas are below the quality control
specification of 34 particles per cubic foot of gas ≥ 10 nm.
REFERENCES
1. W.W. Roger at al “Contamination and ESD control in high-technology
manufacturing”, book, p.p. 86-88. Wiley - Inter Science publication, 2006.
2. K. D. Murray at al. “Clean Corona Ionization” EOS/ESD Technology Dec.
1991/Jan 1992.
3. R.P. Donovan “Particle control for semiconductor manufacturing”, book,
Marcel Dekker, Inc,
1990.
4. A. S. Biris at al. “Corona generation and deposition of metal nanoparticles on
conductive surfaces and their effect on the substrate surface texture and
chemistry”. Particulate Science and Technology, An International Journal, vol.
22, Issue 4, 2004.
5. F. J. Romay at al. “A sonic jet corona ionizer for electrostatic discharge and
aerosol neutralization”. Aerosol Science and Technology, 20:1, p.p. 31-41, 1994.
6. C.G.Noll “Balanced static elimination in variable ion mobility environments”.
Journal of Electrostatics vol. 49, Issues 3-4, 2000, p.p. 169-194.
7. C.G.Noll at al. “Charge-carrier extraction from air and nitrogen gas streams that
entrain charge from a radioactive ionizer” Journal of Electrostatics vol. 54,
Issues 3-4, 2002, p. p.283-291.
8. P.Gefter at al “Covering wide areas with ionized gas streams” US patent
application number 20100925519.