PROJECT DESIGN DOCUMENT FORM (CDM PDD) - Version 02 CDM – Executive Board page 1 This template shall not be altered. It shall be completed without modifying/adding headings or logo, format or font. CLEAN DEVELOPMENT MECHANISM PROJECT DESIGN DOCUMENT FORM (CDM-PDD) Version 02 - in effect as of: 1 July 2004) CONTENTS A. General description of project activity B. Application of a baseline methodology C. Duration of the project activity / Crediting period D. Application of a monitoring methodology and plan E. Estimation of GHG emissions by sources F. Environmental impacts G. Stakeholders’ comments Annexes Annex 1: Contact information on participants in the project activity Annex 2: Information regarding public funding Annex 3: Baseline information Annex 4: Monitoring plan
Transcript
PROJECT DESIGN DOCUMENT FORM (CDM PDD) - Version 02 CDM – Executive Board page 1
This template shall not be altered. It shall be completed without modifying/adding headings or logo, format or font.
CLEAN DEVELOPMENT MECHANISM PROJECT DESIGN DOCUMENT FORM (CDM-PDD)
Version 02 - in effect as of: 1 July 2004)
CONTENTS A. General description of project activity B. Application of a baseline methodology C. Duration of the project activity / Crediting period D. Application of a monitoring methodology and plan E. Estimation of GHG emissions by sources F. Environmental impacts G. Stakeholders’ comments
Annexes Annex 1: Contact information on participants in the project activity Annex 2: Information regarding public funding Annex 3: Baseline information
Annex 4: Monitoring plan
PROJECT DESIGN DOCUMENT FORM (CDM PDD) - Version 02 CDM – Executive Board page 2
This template shall not be altered. It shall be completed without modifying/adding headings or logo, format or font.
SECTION A. General description of project activity A.1 Title of the project activity:
Installation of co-generation project at sugar manufacturing unit of Mawana Sugars Limited, Titawi
Version 01
Date: 07/07/2006
A.2. Description of the project activity:
Mawana Sugars Limited (MSL) is the seventh largest private sector sugar manufacturer in India and
accounts for more than 5% of sugar production in the state of Uttar Pradesh in India. MSL has three sugar
manufacturing units viz. Mawana Sugar Works, Titawi Sugar Complex and Nanglamal Sugar Complex,
all located in state of Uttar Pradesh, India.
Under present arrangement, heat and power requirement at the Titawi Sugar Complex is being met by low
pressure boilers and turbo-generators (TG). There are three boilers and four turbo generators to meet the
process steam and electricity requirement of the sugar unit. Bagasse generated by sugar mill is used for
operating the existing units. Boilers produce total 141 ton per hour (TPH) steam at 42 kg/cm2. Some
portion of this steam is passed though Pressure Reducing Desuperheating Valve (PRDS) to reduce its
pressure for utilisation in process.
MSL has the option to continue the prevailing practice; however, based on anticipated benefits from Clean
Development Mechanism, MSL has decided to install 8 MW backpressure turbine in place of the PRDS
system thereby converting useful thermal energy into electrical energy, which was wasted in pre-project
scenario.
Total electricity generated by project activity would be exported to the grid. The emission reductions from
the project activity comes from the avoidance of carbon dioxide emissions from power plants supplying
electricity to the Northern regional grid which is dominated by fossil fuel based power plants.
Contribution to Sustainable Development
Being a renewable energy project activity, it supports India’s national policy to promote clean power. The
government’s clean power diversification strategy includes a multi-pronged strategy focusing on reducing
wastage of energy combined with the optimum use of renewable energy (RE) sources, as adopted by the
project activity.
PROJECT DESIGN DOCUMENT FORM (CDM PDD) - Version 02 CDM – Executive Board page 3
This template shall not be altered. It shall be completed without modifying/adding headings or logo, format or font.
The project activity substitutes, and hence decreases the future need, for primarily fossil fuel based power
generation by the grid, thereby reducing carbon dioxide (CO2) emissions from the Indian electricity sector.
The project activity has contributed to the local job and income creation in rural area. It would further
create steady and higher value jobs for skilled workers at the cogeneration facility. In summary, the
project’s sustainable development benefits and issues include:
Ø Export of power, thereby reducing GHG emissions through displacement of same quantity of power by grid, which is dominated by conventional fossil fuels;
Ø Decreasing the growth in demand for precious fossil fuels, and making them available for higher-value economic applications;
Ø Contributing to an increase in the local employment in the area of skilled jobs for operation and maintenance of the cogeneration equipment.
Ø More efficient use of thermal energy available
A.3. Project participants: >> Name of Party involved ((host) indicates a host Party)
Private and/or public entity(ies) project participants(as applicable)
Kindly indicate if the Party involved wishes to be considered as project participant (Yes/No)
India Mawana Sugars Limited. No A.4. Technical description of the project activity: A.4.1. Location of the project activity: >> A.4.1.1. Host Party(ies):
India
A.4.1.2. Region/State/Province etc.:
Uttar Pradesh
A.4.1.3. City/Town/Community etc:
Village Titawi, District Muzaffarnagar
A.4.1.4. Detail of physical location, including information allowing the unique identification of this project activity (maximum one page):
PROJECT DESIGN DOCUMENT FORM (CDM PDD) - Version 02 CDM – Executive Board page 4
This template shall not be altered. It shall be completed without modifying/adding headings or logo, format or font.
The project activity is being implemented at one of the sugar manufacturing unit of MSL viz. Titawi Sugar
Complex located in Titawi. Titawi is a small village situated in Muzaffarnagar District of Uttar Pradesh.
The site is easily accessible by rail and road.
PROJECT DESIGN DOCUMENT FORM (CDM PDD) - Version 02 CDM – Executive Board page 5
This template shall not be altered. It shall be completed without modifying/adding headings or logo, format or font.
A.4.2. Category(ies) of project activity:
The project activity falls under the Sectoral Scope 1: Energy industries (renewable - / non-renewable
sources) as per the sectoral scopes related approved methodologies and DOEs.
A.4.3. Technology to be employed by the project activity: Project is a grid-connected cogeneration power plant with high-pressure steam turbine.
The plant is designed to operate with 8.0 MW backpressure turbine having inlet steam configuration of 42
kg / cm2 and 410 oC.
The power would be generated at 11.0 kV and stepped up to 132 kV and paralleled with the Uttar Pradesh
Power Corporation Limited (UPPCL) grid at the sub-station located at Lalukheri near Shamli.
A.4.4. Brief explanation of how the anthropogenic emissions of anthropogenic greenhouse gas (GHGs) by sources are to be reduced by the proposed CDM project activity, including why the emission reductions would not occur in the absence of the proposed project activity, taking into account national and/or sectoral policies and circumstances:
The crushing season of 180 days is envisaged for project activity operation. The project activity would not
operate during non-crushing / off-season period. The project activity would generate 8.0 MW power.
Without the project activity, the same energy load would have been taken-up by grid mix and emission of
CO2 would have occurred due to combustion of conventional fossil fuels. Considering the export of clean
electricity to the fossil fuel dominated grid by the project activity there will be continuous GHG reductions,
as it would avoid equivalent GHG emissions.
Conventional energy equivalent of approximately 293,760 MWh for a period of 10 years in grid would be
replaced by electricity generated from the project activity, with CO2 emission reduction of 274,370 tonnes
over a 10 year credit period.
A.4.4.1. Estimated amount of emission reductions over the chosen crediting period: >>
Years Annual estimation of emission reductions in tonnes of CO2 e
Total number of crediting years 10 years Annual average over the crediting
period of estimated reductions ((tonnes of CO2 e)
27437
A.4.5. Public funding of the project activity:
No public funding as part of project financing from parties included in Annex I of the convention is
involved in the project activity.
PROJECT DESIGN DOCUMENT FORM (CDM PDD) - Version 02 CDM – Executive Board page 7
This template shall not be altered. It shall be completed without modifying/adding headings or logo, format or font.
SECTION B. Application of a baseline methodology B.1. Title and reference of the approved baseline methodology applied to the project activity: Title: Consolidated baseline methodology for grid-connected electricity generation from biomass residues
B.1.1. Justification of the choice of the methodology and why it is applicable to the project activity:
The said methodology is applicable to grid-connected and biomass residue fired electricity generation
project activities, including cogeneration plants.
Project activity is a cogeneration plant utilising steam generated by bagasse, which is a biomass residue
from cane crushing process. Also project activity would supply electricity to grid and hence meets the said
applicability criteria.
As per the methodology, the project activity may include:
“The installation of a new biomass power generation unit, which is operated next to existing power
generation capacity fired with either fossil fuels or the same type of biomass residue as in the project plant
(power capacity expansion projects)”
Project activity involves installation of new cogeneration project, which would be operated next to existing
cogeneration units fired with bagasse.
The project activity may be based on the operation of a power generation unit located in an agro-industrial
plant generating the biomass residues or as an independent plant supplied by biomass residues coming from
the nearby area or a market.
The project activity is a cogeneration unit located in the sugar manufacturing facility, Titawi Sugar
Complex, which generates bagasse.
Further, the project activity meets the applicability criteria of consolidated methodology as under:
Criteria 1: No other biomass types than biomass residues, as defined above, are used in the project
plant and these biomass residues are the predominant fuel used in the project plant (some fossil fuels
may be co-fired)
PROJECT DESIGN DOCUMENT FORM (CDM PDD) - Version 02 CDM – Executive Board page 8
This template shall not be altered. It shall be completed without modifying/adding headings or logo, format or font.
The project plant uses steam generated by bagasse only (a biomass residue).
Criteria 2: For projects that use biomass residues from a production process (e.g. production of
sugar or wood panel boards), the implementation of the project shall not result in an increase of the
processing capacity of raw input (e.g. sugar, rice, logs, etc.) or in other substantial changes (e.g.
product change) in this process
Implementation of the project activity would not result in increase of processing capacity of sugar
manufacturing process.
Criteria 3: The biomass used by the project facility should not be stored for more than one year.
The project activity would operate during 180 day crushing season only, using the steam generated by
bagasse produced during this period.
Criteria 4: No significant energy quantities, except from transportation of the biomass, are required
to prepare the biomass residues for fuel combustion, i.e. projects that process the biomass residues
prior to combustion (e.g. esterification of waste oils) are not eligible under this methodology.
The bagasse produced from the sugar mill is directly fired in the boilers at site and no fuel preparation or
processing is required.
B.2. Description of how the methodology is applied in the context of the project activity:
The methodology is only applicable for the specific combinations of baseline scenarios.
Identification of baseline scenario
As per the methodology, identification of the most plausible baseline scenario among all realistic and
credible alternative(s) is to be carried out. Steps 2 and/or 3 of the latest approved version of the “tool for
the determination and assessment of additionality” should be used to assess which of these alternatives
should be excluded from further consideration (e.g. alternatives where barriers are prohibitive or which are
clearly economically unattractive). Where more than one credible and plausible alternative remains, as a
conservative assumption, the alternative baseline scenario would be the one that results in the lowest
baseline emissions as the most likely baseline scenario.
As per the methodology, realistic and credible alternatives should be separately determined regarding:
§ How power would be generated in the absence of the CDM project activity;
§ What would happen to the biomass in the absence of the project activity; and
PROJECT DESIGN DOCUMENT FORM (CDM PDD) - Version 02 CDM – Executive Board page 9
This template shall not be altered. It shall be completed without modifying/adding headings or logo, format or font.
§ In case of cogeneration projects: how the heat would be generated in the absence of the project
activity
For power generation, the realistic and credible alternatives may include:
Baseline scenario
for power
generation
Description Comments
P1 The proposed project activity not
undertaken as a CDM project activity
Proposed project activity faces barriers
as discussed in section B.3 hence, it
cannot be taken as baseline scenario.
P2 The proposed project activity
(installation of a power plant), fired with
the same type of biomass but with a
lower electrical energy efficiency
Installation of project with lower
electrical energy efficiency would be
economically unattractive hence, it
cannot be taken as baseline scenario.
P3 The generation of power in an existing
plant, on-site or nearby the project site,
using only fossil fuels
Use of coal for power generation would
be economically unattractive and would
lead to higher baseline emissions hence,
it cannot be taken as baseline scenario.
P4 The generation of power in existing
and/or new grid-connected power plants
In absence of project activity, the
equivalent power exported by project
activity would be generated in existing
and/or new grid-connected power plants.
Hence, it is one of the credible baseline
scenario.
P5 The continuation of power generation in
an existing power plant, fired with the
same type of biomass as in the project
activity, and implementation of the
project activity, not undertaken as a
CDM project activity, at the end of the
lifetime of the existing plant
In absence of existing units, the project
activity would not be able to meet even
the electricity demand of the plant and
hence, export to grid would be
impossible. Hence, this is not a credible
baseline scenario.
P6 The continuation of power generation in Replacement of existing plant with new
PROJECT DESIGN DOCUMENT FORM (CDM PDD) - Version 02 CDM – Executive Board page 10
This template shall not be altered. It shall be completed without modifying/adding headings or logo, format or font.
an existing power plant, fired with the
same type of biomass as (co-)fired in the
project activity and, at the end of the
lifetime of the existing plant,
replacement of that plant by a similar
new plant
plant would be economically unattractive
since there would be no export of power.
Hence, it cannot be taken as baseline
scenario.
As the proposed project activity is a cogeneration project so alternatives for heat generation will also have
to be identified. For heat generation, realistic and credible alternatives may include:
Baseline scenario
for power
generation
Description Comments
H1 The proposed project activity not
undertaken as a CDM project activity
Proposed project activity faces barriers
as discussed in section B.3 hence, it
cannot be taken as baseline scenario.
H2 The proposed project activity
(installation of a cogeneration power
plant), fired with the same type of
biomass but with a lower thermal energy
efficiency
Installation of project with lower thermal
energy efficiency would be economically
unattractive hence, it cannot be taken as
baseline scenario.
H3 The generation of heat in an existing
cogeneration plant, on-site or nearby the
project site, using only fossil fuels
Use of coal for heat generation would be
economically unattractive and would lead
to higher baseline emissions hence, it
cannot be taken as baseline scenario.
H4 The generation of heat in boilers using
the same type of biomass residues
It is one of the credible baseline scenario.
H5 The continuation of heat generation in an
existing cogeneration plant, fired with
the same type of biomass as in the
project activity, and implementation of
The project activity cannot replace the
existing cogeneration units. Hence, this is
not a credible baseline scenario.
PROJECT DESIGN DOCUMENT FORM (CDM PDD) - Version 02 CDM – Executive Board page 11
This template shall not be altered. It shall be completed without modifying/adding headings or logo, format or font.
the project activity, not undertaken as a
CDM project activity, at the end of the
lifetime of the existing plant
H6 The generation of heat in boilers using
fossil fuels
Use of coal for heat generation would be
economically unattractive and would lead
to higher baseline emissions hence, it
cannot be taken as baseline scenario.
H7 The use of heat from external sources,
such as district heat
There is no district heating system in the
region hence, it cannot be taken as
baseline scenario.
H8 Other heat generation technologies Installation of other technologies for heat
generation only, would be economically
unattractive hence, it cannot be taken as
baseline scenario.
For the use of biomass, the realistic and credible alternative(s) may include:
Baseline scenario
for power
generation
Description Comments
B1 The biomass is dumped or left to decay
or burned in an uncontrolled manner
without utilizing it for energy purposes
Bagasse generated by sugar mills in the
region is a useful resource and is not
dumped or left to decay or burned in an
uncontrolled manner. Hence, it cannot be
taken as baseline scenario.
B2 The biomass is used for heat and/or
electricity generation at the project site
In absence of project activity, biomass
would have been used for heat generation
only, in the boilers. Hence, can be
considered as one of the credible baseline
scenario.
B3 The biomass is used for power
generation, including cogeneration, in
The biomass is used in the boilers at site
for process steam generation. Hence, it
PROJECT DESIGN DOCUMENT FORM (CDM PDD) - Version 02 CDM – Executive Board page 12
This template shall not be altered. It shall be completed without modifying/adding headings or logo, format or font.
other existing or new grid-connected
power plants
cannot be considered as one of the
credible baseline scenario.
B4 The biomass is used for heat generation
in other existing or new boilers at other
sites
The biomass is used in the boilers at site
for process steam generation. Hence, it
cannot be considered as one of the
credible baseline scenario.
B5 The biomass is used for other energy
purposes, such as the generation of
biofuels
The biomass is used in the boilers at site
for process steam generation. Hence, it
cannot be considered as one of the
credible baseline scenario.
B6 The biomass is used for non-energy
purposes
The biomass is used in the boilers at site
for process steam generation. Hence, it
cannot be considered as one of the
credible baseline scenario.
Among all the identified alternatives, the most credible and realistic alternatives that results in the lowest
baseline emissions are:
Power –P4
Heat – H4
Biomass - B2
Thus the above alternative forms the baseline scenario. This specific combination of baseline scenario is
defined for scenario 12, which states that:
“The project activity involves the installation of a new cogeneration unit, which is operated next to (an)
existing biomass power generation unit(s). The existing unit(s) are only fired with biomass and continue to
operate after the installation of the new power unit. The power generated by the new power unit is fed into
the grid or would in the absence of the project activity be purchased from the grid. The biomass would in
the absence of the project activity be used for heat generation in boilers at the project site. This may apply,
for example, where the biomass has been used for heat generation in boilers at the project site prior to the
project implementation.”
PROJECT DESIGN DOCUMENT FORM (CDM PDD) - Version 02 CDM – Executive Board page 13
This template shall not be altered. It shall be completed without modifying/adding headings or logo, format or font.
B.3. Description of how the anthropogenic emissions of GHG by sources are reduced below those that would have occurred in the absence of the registered CDM project activity: >> According to the selected methodology, the project proponent is required to establish that the GHG
reductions due to project activity are additional to those that would have occurred in absence of the project
activity as per the ‘Tool for the demonstration and assessment of additionality’ Annex-1 to EB 16 Report.
Step 0. Preliminary Screening based on the starting date of the project activity
Since, MSL wishes to have the crediting period starting after the registration of their project activity this
step is not applicable.
Step 1. Identification of alternatives to the project activity consistent with current laws and
regulations
Sub-step 1a. Define alternatives to the project activity
Alternative scenarios complying with regulations in India have been discussed in section B.2.
Sub-step 1b. Enforcement of applicable laws and regulations
All the credible options available to MSL are in compliance with legal and regulatory requirements of the
host country.
Step 2. Investment analysis OR
Step 3. Barrier analysis.
MSL proceeds to establish project additionality by conducting the Step 3: Barrier Analysis.
It is required to determine whether the project activity faces barriers that:
(a) Prevent the implementation of this type of proposed project activity; and
(b) Do not prevent the implementation of at least one of the alternatives through the following sub-
steps:
Sub-step 3a. Identify barriers that would prevent the implementation of type of the proposed project
activity
Barrier due to Prevailing Practice
Uttar Pradesh has a potential of more than 1000 MW for Bagasse based Cogeneration Plants and the
installed capacity was around 100 MW in 2004-05, which was likely to increase to 150 MW by the end of
the 2005-2006. In terms of power procurement from these sources, UPPCL is currently purchasing around
170 MUs from cogeneration plants out of its total power consumption of around 41000 MUs, which works
PROJECT DESIGN DOCUMENT FORM (CDM PDD) - Version 02 CDM – Executive Board page 14
This template shall not be altered. It shall be completed without modifying/adding headings or logo, format or font.
out to around 0.43 only%1. This substantiates the fact that practice of sale of power to grid from bagasse
based cogeneration projects has not penetrated in the region.
Other Barriers
Institutional Barriers:
(a) MSL has signed Power Purchase Agreement (PPA) with UPPCL. Project earnings are dependent
on the payment from UPPCL against the sale of electricity to the grid. It is known that the financial
condition of electricity boards in India was not very healthy in the recent past. As per the data
available till 2003-04, UPPCL was incurring heavy technical and commercial losses. The aggregate
technical and commercial loss for UPPCL (off-taker) in the year 2003-04 was INR 32.82 billion2.
Although the fiscal condition of state electricity board has improved considerably in present year,
dealing with UPPCL has associated risks.
Also UPPCL is purchasing power at an average rate of INR 1.66/kWh from various sources.
However, the purchase of power from cogeneration projects has been fixed as INR 2.98/kWh by
UPERC, which is much higher than average cost at which UPPCL purchases power. Hence,
likelihood of the PPA being renegotiated at later stage cannot be ruled out in the future.
(b) Imbalances in the Northern Region grid have been increasing over the years. In the year 2005-06
the grid failed twice. Similar failures in the future cannot be ruled out, which would lead to tripping
of the project activity plant.
(c) Till 2004-05 the rate of purchase of power by UPPCL from similar projects was INR 2.25/kWh
for base year 1999-2000 with annual escalation of 5 %. This would have made the tariff as INR
3.16/kWH in the year 2006-2007, however MSL would sale power at INR 2.98 with annual
escalation of INR 0.04/kWh only, as per the recent order by UPERC. Also the the validity of the
power purchase rate has been kept only for a period of 5 years3. Hence, possibility of further
reduction in rate of power purchase after 5 years cannot be ruled out.
(d) As per the policy that existed till year 2004-05, UPPCL and MSL would have shared the cost of
transmission lines on equal basis. However, as per the recent orders by UPERC, MSL is required to
bear the entire cost for laying the transmission lines form project plant to sub-station.
1 http://www.uperc.org/Copy%20of%20Order%20-UPERC%20NCE%20Policy%20FINAL%20DT.18-7-2005.pdf 2 UPERC, Tariff Order 2004-2005 3 http://www.uperc.org/final%20review%20order%20dated%2015.9.05%20(SUO-MOTO).pdf
Project activity would supply power to Uttar Pradesh state grid, which is a part of Northern regional grid.
Hence, calculation of baseline emission factor has been done for Northern regional grid.
Flow chart and project boundary is illustrated in the following Figure:
PROJECT DESIGN DOCUMENT FORM (CDM PDD) - Version 02 CDM – Executive Board page 18
This template shall not be altered. It shall be completed without modifying/adding headings or logo, format or font.
B.5. Details of baseline information, including the date of completion of the baseline study and the name of person (s)/entity (ies) determining the baseline:
Please refer Annex 3 for details of baseline information.
Date of completing the final draft of this baseline section (DD/MM/YYYY):
07/07/2006
Name of person/entity determining the baseline:
Mawana Sugars Limited has determined the baseline for the project activity. The entity is a project
participant listed in Annex-I where the contact information has also been provided.
Emission Generated
Emission Sequestered
Electricity to End-user
Bagasse from Sugar Plant
Bagasse Storage
Existing Cogeneration
Units
New Cogeneration
unit Electricity to Grid
Project Boundary
PROJECT DESIGN DOCUMENT FORM (CDM PDD) - Version 02 CDM – Executive Board page 19
This template shall not be altered. It shall be completed without modifying/adding headings or logo, format or font.
SECTION C. Duration of the project activity / Crediting period C.1 Duration of the project activity: C.1.1. Starting date of the project activity:
February 2006
C.1.2. Expected operational lifetime of the project activity:
20 years
C.2 Choice of the crediting period and related information:
The project activity uses fixed crediting period
C.2.1. Renewable crediting period C.2.1.1. Starting date of the first crediting period:
PROJECT DESIGN DOCUMENT FORM (CDM PDD) - Version 02 CDM – Executive Board page 20
This template shall not be altered. It shall be completed without modifying/adding headings or logo, format or font.
SECTION D. Application of a monitoring methodology and plan D.1. Name and reference of approved monitoring methodology applied to the project activity: Title: Consolidated monitoring methodology for grid-connected electricity generation from biomass residues
The monitoring methodology requires monitoring of the following:
§ Electricity generation from the proposed project activity;
This would be monitored
§ Data needed to recalculate the operating margin emission factor, if needed, based on the choice of
the method to determine the operating margin (OM), consistent with “Consolidated baseline
methodology for grid-connected electricity generation from renewable sources” (ACM0002);
Project activity would use the simple OM, which is calculated as full generation-weighted average
for the most recent 3 years for which data are available at the time of PDD submission (ex-ante).
Hence data needed to calculate OM need not be monitored.
§ Data needed to recalculate the build margin emission factor, if needed, consistent with
“Consolidated baseline methodology for grid-connected electricity generation from renewable
sources” (ACM0002);
Project activity would use the build margin, which is calculated ex-ante based on the most recent
information available on plants already built for sample group m at the time of PDD submission.
Hence data needed to calculate BM need not be monitored.
PROJECT DESIGN DOCUMENT FORM (CDM PDD) - Version 02 CDM – Executive Board page 21
This template shall not be altered. It shall be completed without modifying/adding headings or logo, format or font.
§ Data needed to calculate, if applicable, carbon dioxide emissions from fuel combustion due to co-
firing fossil fuels used in the project plant or in boilers operated next to the project plant or in
boilers used in the absence of the project activity;
There would be no fossil fuel co-firing in the cogeneration plants at site hence associated data need
not be monitored.
§ Where applicable, data needed to calculate methane emissions from natural decay or burning of
biomass in the absence of the project activity;
§ In absence of project activity, biomass is not left to decay hence, it is not required to monitor data
needed to calculate methane emissions.
§ Where applicable, data needed to calculate carbon dioxide emissions from the transportation of
biomass to the project plant;
§ There is no transportation of biomass to the project plant hence, it is not required to monitor data
needed to calculate carbon dioxide emissions from transportation.
§ Where applicable, data needed to calculate methane emissions from the combustion of biomass in
the project plant;
§ These emissions are not included in the project boundary hence, it is not required to monitor data
needed to calculate methane emissions from combustion of biomass.
§ Where applicable, data needed to calculate leakage effects from fossil fuel consumption outside the
project boundary;
There is no anticipated consumption of fossil fuel outside the project boundary due to project
activity, since there is no extra bagasse consumption in project activity.
PROJECT DESIGN DOCUMENT FORM (CDM PDD) - Version 02 CDM – Executive Board page 22
This template shall not be altered. It shall be completed without modifying/adding headings or logo, format or font.
D.2. 1. Option 1: Monitoring of the emissions in the project scenario and the baseline scenario D.2.1.1. Data to be collected in order to monitor emissions from the project activity, and how this data will be archived: ID number (Please use numbers to ease cross-referencing to D.3)
Data variable
Source of data
Data unit
Measured (m), calculated (c) or estimated (e)
Recording frequency
Proportion of data to be monitored
How will the data be archived? (electronic/ paper)
Comment
D.2.1.2. Description of formulae used to estimate project emissions (for each gas, source, formulae/algorithm, emissions units of CO2 equ.)
Not applicable
D.2.1.3. Relevant data necessary for determining the baseline of anthropogenic emissions by sources of GHGs within the project boundary and how such data will be collected and archived : ID number (Please use numbers to ease cross-referencing to table D.3)
Data variable Source of data
Data unit Measured (m), calculated (c), estimated (e),
Recording Frequency
Proportion of data to be monitored
How will the data be archived?
(electronic/ paper)
Comment
PROJECT DESIGN DOCUMENT FORM (CDM PDD) - Version 02 CDM – Executive Board page 23
This template shall not be altered. It shall be completed without modifying/adding headings or logo, format or font.
1. EGproject
plant, y Net quantity of electricity generated in the project plant during the year y
Metering records
MWh M Continuous 100% Electronic
2. EG total, y Total quantity of electricity generated at the project site (Including the project plant and any other plant at site existing at the start of the project activity)
Metering records
MWh M Continuous 100% Electronic
3.BFi,y Quantity of Biomass type i combusted in the project plant during year y
Metering records
ton M Continuous 100% Electronic
4. NCVi Net calorific value of biomass
MWh/ton M Annually 100 % Electronic
PROJECT DESIGN DOCUMENT FORM (CDM PDD) - Version 02 CDM – Executive Board page 24
This template shall not be altered. It shall be completed without modifying/adding headings or logo, format or font.
5. Q project
plant, y Net quantity of heat generated from firing biomass in the project plant
Metering records
MWh M Continuous 100 % Electronic
6. E boiler Average net energy efficiency of heat generation in the boiler that is operated next to the project plant
Metering records
- M Quarterly 100 % Electronic
D.2.1.4. Description of formulae used to estimate baseline emissions (for each gas, source, formulae/algorithm, emissions units of CO2 equ.)
yyelectricityyyelectricit EFEGER ,, ×= Where ERelectricity, y - are the emission reductions due to displacement of electricity during the year y in tons of CO2,
EGy - is the net quantity of increased electricity generation as a result of the project activity (incremental to baseline generation) during the year y in MWh,
EFelectricity, y - is the CO2 emission factor for the electricity displaced due to the project activity during the year y in tons CO2/MWh
Calculation of CO2 emission factor for the electricity displaced
PROJECT DESIGN DOCUMENT FORM (CDM PDD) - Version 02 CDM – Executive Board page 25
This template shall not be altered. It shall be completed without modifying/adding headings or logo, format or font.
The electricity baseline emission factor (EFelectricity, y) is calculated as a combined margin (CM), consisting of the combination of Operating Margin (OM) and
Build Margin (BM) factors according to the following three steps. Calculations for this combined margin is based on data from an official source and made
publicly available.
STEP 1. Calculate the Operating Margin emission factor(s)
Out of the four methods mentioned in ACM0002, simple OM approach has been chosen for calculations since the low-cost/must run resources constitute less
than 50% of the total grid generation in the Northern region grid mix. Simple OM factor is calculated as under.
yjj
jiyjiji
ysimpleOM GENCOEFFEF ,,,,,
,, / ∑∑ ×=
Where
COEFi, j - is the CO2 emission coefficient of fuel i (t CO2 / mass or volume unit of the fuel), calculated as given below and
GENj, y - is the electricity (MWh) delivered to the grid by source j
Fi, j, y - is the amount of fuel i (in a mass or volume unit) consumed by relevant power sources j in year(s) y, calculated as given below
j - refers to the power sources delivering electricity to the grid, not including low-operating cost and must-run power plants
The CO2 emission coefficient COEFi is obtained as
iiCOii OXIDEFNCVCOEF ××= ,2
Where
NCVi -is the net calorific value (energy content) per mass or volume unit of a fuel i
EFCO2,i -is the CO2 emission factor per unit of energy of the fuel i
PROJECT DESIGN DOCUMENT FORM (CDM PDD) - Version 02 CDM – Executive Board page 26
This template shall not be altered. It shall be completed without modifying/adding headings or logo, format or font.
OXIDi -is the oxidation factor of the fuel
The Simple OM emission factor (EFOM,simple,y) has been calculated separately for the most recent three years (2002-2003, 2003-2004 and 2004-2005) and an
average value has been considered as the OM emission factor for the baseline (EFOM,y) (ex-ante).
3/,,, ysimpleOMy
yOM EFEF ∑=
where y represents the years.
STEP 2. Calculation of the Build Margin emission factor (EF BM, y)
It is calculated as the generation-weighted average emission factor (t CO2/MWh) of a sample of power plants m of grid, as follows:
ymm
miymimi
yBM GENCOEFFEF ,,,,,
, / ∑∑ ×=
Where
F i, m, y, COEF i ,m and GEN m, y - are analogous to the variables described for the simple OM method above for plants m.
Calculations for the Build Margin emission factor EF BM, y has been done as ex ante based on the most recent information available on plants already built for
sample group m of Northern region grid at the time of PDD submission. The sample group m consists of the 20 % of power plants supplying electricity to grid
that have been built most recently, since it comprises of larger annual power generation. (Refer Annex 3)
Further, none of the power plant capacity additions in the sample group have been registered as CDM project activities.
STEP 3. Calculate the electricity baseline emission factor (EFy)
It is calculated as the weighted average of the Operating Margin emission factor (EF OM, y) and the Build Margin emission factor (EF BM, y):
PROJECT DESIGN DOCUMENT FORM (CDM PDD) - Version 02 CDM – Executive Board page 27
This template shall not be altered. It shall be completed without modifying/adding headings or logo, format or font.
yBMBMyOMOMyyelectricit EFWEFWEF ,,, ×+×=
where the weights w OM and w BM, by default, are 50% (i.e., WOM = WBM = 0.5), and EFOM, y and EFBM, y are calculated as described in Steps 1 and 2 above and
are expressed in t CO2/MWh.
Calculation of net quantity of increased electricity generation
−=
3
min3,
,
,
yrhistoricytotal
ynyprojectpla
y EGEG
EG
EG
Where EGproject plant, y - is the net quantity of electricity generated in the project plant during the year y in MWh,
EGtotal, y - is the net quantity of electricity generated in all power units at the project site, generated from firing the same type(s) of biomass as in the project
plant, including the new power unit installed as part of the project activity and any previously existing units, during the year y in MWh.
EGhistoric, 3yr - is the net quantity of electricity generated during the most recent three years in all power plants at the project site, generated from firing the same
type(s) of biomass as in the project plant, in MWh,
D. 2.2. Option 2: Direct monitoring of emission reductions from the project activity (values should be consistent with those in section E). D.2.2.1. Data to be collected in order to monitor emissions from the project activity, and how this data will be archived:
PROJECT DESIGN DOCUMENT FORM (CDM PDD) - Version 02 CDM – Executive Board page 28
This template shall not be altered. It shall be completed without modifying/adding headings or logo, format or font.
ID number (Please use numbers to ease cross-referencing
to table D.3)
Data variable
Source of data
Data unit
Measured (m), calculated (c), estimated (e),
Recording frequency
Proportion of data to
be monitored
How will the data be archived? (electronic/
paper)
Comment
D.2.2.2. Description of formulae used to calculate project emissions (for each gas, source, formulae/algorithm, emissions units of CO2 equ.):
Not applicable
D.2.3. Treatment of leakage in the monitoring plan D.2.3.1. If applicable, please describe the data and information that will be collected in order to monitor leakage effects of the project activity ID number (Please use numbers to ease cross-referencing to table D.3)
Data variable
Source of data Data
unit
Measured (m), calculated (c) or estimated (e)
Recording frequency
Proportion of data to be monitored
How will the data be archived? (electronic/ paper)
Comment
D.2.3.2. Description of formulae used to estimate leakage (for each gas, source, formulae/algorithm, emissions units of CO2 equ.)
Not applicable
PROJECT DESIGN DOCUMENT FORM (CDM PDD) - Version 02 CDM – Executive Board page 29
This template shall not be altered. It shall be completed without modifying/adding headings or logo, format or font.
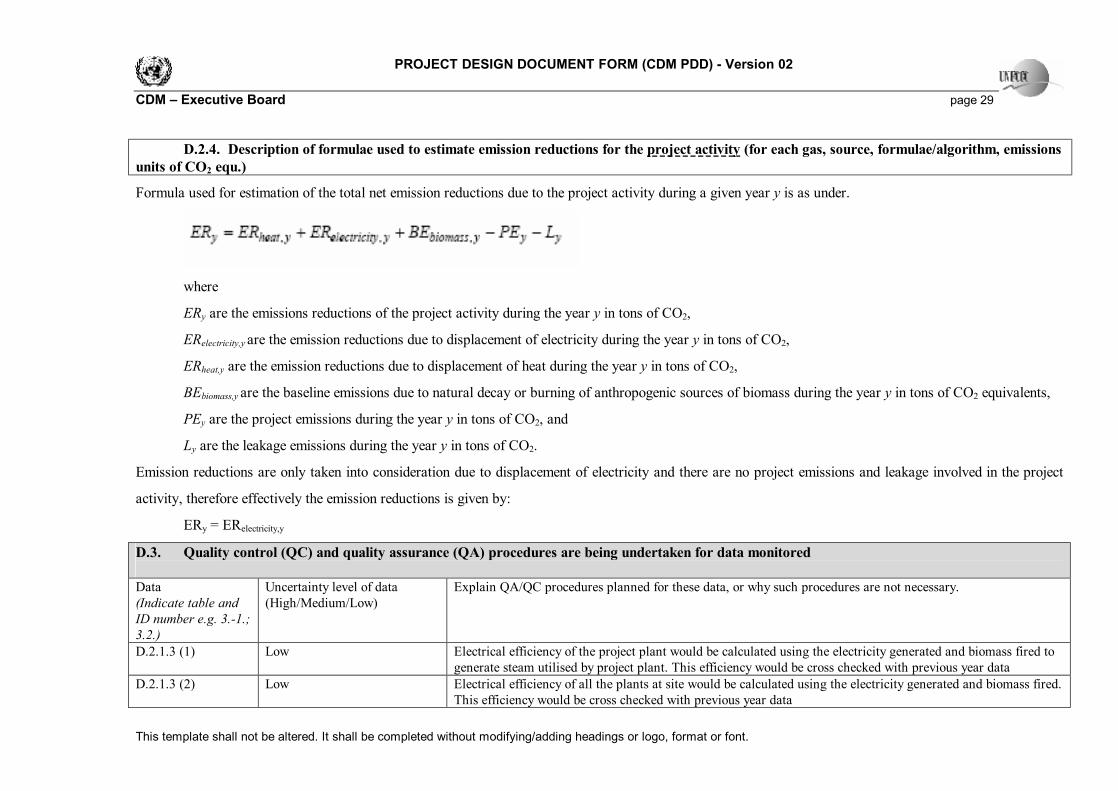
D.2.4. Description of formulae used to estimate emission reductions for the project activity (for each gas, source, formulae/algorithm, emissions units of CO2 equ.)
Formula used for estimation of the total net emission reductions due to the project activity during a given year y is as under.
where
ERy are the emissions reductions of the project activity during the year y in tons of CO2,
ERelectricity,y are the emission reductions due to displacement of electricity during the year y in tons of CO2,
ERheat,y are the emission reductions due to displacement of heat during the year y in tons of CO2,
BEbiomass,y are the baseline emissions due to natural decay or burning of anthropogenic sources of biomass during the year y in tons of CO2 equivalents,
PEy are the project emissions during the year y in tons of CO2, and
Ly are the leakage emissions during the year y in tons of CO2.
Emission reductions are only taken into consideration due to displacement of electricity and there are no project emissions and leakage involved in the project
activity, therefore effectively the emission reductions is given by:
ERy = ERelectricity,y
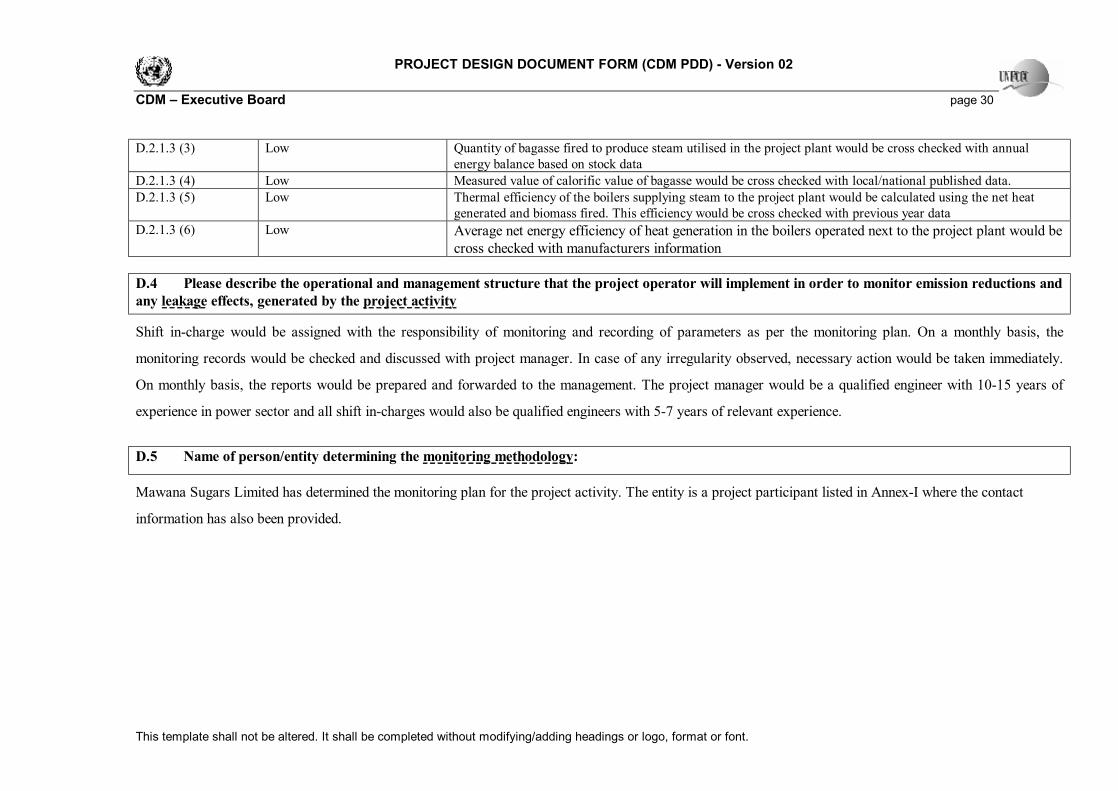
D.3. Quality control (QC) and quality assurance (QA) procedures are being undertaken for data monitored Data (Indicate table and ID number e.g. 3.-1.; 3.2.)
Uncertainty level of data (High/Medium/Low)
Explain QA/QC procedures planned for these data, or why such procedures are not necessary.
D.2.1.3 (1) Low Electrical efficiency of the project plant would be calculated using the electricity generated and biomass fired to generate steam utilised by project plant. This efficiency would be cross checked with previous year data
D.2.1.3 (2) Low Electrical efficiency of all the plants at site would be calculated using the electricity generated and biomass fired. This efficiency would be cross checked with previous year data
PROJECT DESIGN DOCUMENT FORM (CDM PDD) - Version 02 CDM – Executive Board page 30
This template shall not be altered. It shall be completed without modifying/adding headings or logo, format or font.
D.2.1.3 (3) Low Quantity of bagasse fired to produce steam utilised in the project plant would be cross checked with annual energy balance based on stock data
D.2.1.3 (4) Low Measured value of calorific value of bagasse would be cross checked with local/national published data. D.2.1.3 (5) Low Thermal efficiency of the boilers supplying steam to the project plant would be calculated using the net heat
generated and biomass fired. This efficiency would be cross checked with previous year data D.2.1.3 (6) Low Average net energy efficiency of heat generation in the boilers operated next to the project plant would be
cross checked with manufacturers information D.4 Please describe the operational and management structure that the project operator will implement in order to monitor emission reductions and any leakage effects, generated by the project activity
Shift in-charge would be assigned with the responsibility of monitoring and recording of parameters as per the monitoring plan. On a monthly basis, the
monitoring records would be checked and discussed with project manager. In case of any irregularity observed, necessary action would be taken immediately.
On monthly basis, the reports would be prepared and forwarded to the management. The project manager would be a qualified engineer with 10-15 years of
experience in power sector and all shift in-charges would also be qualified engineers with 5-7 years of relevant experience.
D.5 Name of person/entity determining the monitoring methodology:
Mawana Sugars Limited has determined the monitoring plan for the project activity. The entity is a project participant listed in Annex-I where the contact
information has also been provided.
PROJECT DESIGN DOCUMENT FORM (CDM PDD) - Version 02 CDM – Executive Board page 31
This template shall not be altered. It shall be completed without modifying/adding headings or logo, format or font.
SECTION E. Estimation of GHG emissions by sources E.1. Estimate of GHG emissions by sources:
As discussed in earlier sections, there would be no anthropogenic emissions by sources of greenhouse gases
of the project activity within the project boundary.
E.2. Estimated leakage:
As discussed in earlier sections, there would be no net change of anthropogenic emissions by sources of
greenhouse gases, which occurs outside the project boundary, and that is measurable and attributable to the
project activity.
E.3. The sum of E.1 and E.2 representing the project activity emissions:
Net emission by project activity (E1+E2) is zero tonnes of CO2.
E.4. Estimated anthropogenic emissions by sources of greenhouse gases of the baseline:
yyelectricityyyelectricit EFEGER ,, ×=
EFelectricity, y – has been estimated as 0.934 ton CO2/MWh.
−=
3
min3,
,
,
yrhistoricytotal
ynyprojectpla
y EGEG
EG
EG
EGproject plant, y – 29,376 MWh,
EGtotal, y – 62,523 MWh.
EGhistoric, 3yr – 33,091 MWh,
EGproject plant, y is less.
EGy – 29,376 MWh
ERelectricity, y = 29376 x 0.934
ERelectricity, y = 27,437 ton CO2
Since fuel used for heat generation (bagasse) and quantity of heat generation is same in the baseline as in
the project activity, ERheat, y = 0
E.5. Difference between E.4 and E.3 representing the emission reductions of the project activity:
Since project activity emissions are zero, emission reductions are equal to baseline emissions.
PROJECT DESIGN DOCUMENT FORM (CDM PDD) - Version 02 CDM – Executive Board page 32
This template shall not be altered. It shall be completed without modifying/adding headings or logo, format or font.
ERy = ERelectricity,y
E.6. Table providing values obtained when applying formulae above: Year Estimation of
project activity emission (tonnes
of CO2 e)
Estimation of baseline emission (tonnes of CO2
e)
Estimation of
leakage (tonnes
of CO2 e)
Estimation of emission reductions (tonnes of CO2 e)
PROJECT DESIGN DOCUMENT FORM (CDM PDD) - Version 02 CDM – Executive Board page 33
This template shall not be altered. It shall be completed without modifying/adding headings or logo, format or font.
SECTION F. Environmental impacts F.1. Documentation on the analysis of the environmental impacts, including transboundary impacts: S.No. Impact Identified Mitigation Measures/Remarks
1. Air Quality: During the construction phase there may be
additional dust in the air but that is a temporary impact considering the long term benefits.
------
2. Water: There shall be no significant effect on surface
water quality and hydrology. -------
3. Noise: Additional noise will be produced once the
project activity is in operation stage but that will still be below the prescribed levels.
Though the impact on the noise level is minimal and will be in the permissible limits of 60dbA, plantation is done in and around the mill and mufflers would be distributed to the workers.
4. Land: No additional land acquisition is required since
the project activity is carried out within the premises. About 1 TPD of domestic refuse would be given out at the colony of factory staff.
No rehabilitation program is required. The domestic refuse would be composted and given to the farmers.
5. Socio-Economic: Implementation of the project activity would not
have any adverse impact on the socio economic aspects of the life of people residing in the village in core zone.
--------
6. Flora and Fauna: There will a negligible effect on the flora and
fauna of the region due to increase in industrial and domestic activity.
--------
F.2. If environmental impacts are considered significant by the project participants or the host Party, please provide conclusions and all references to support documentation of an environmental impact assessment undertaken in accordance with the procedures as required by the host Party:
As discussed above, the project activity would not have any adverse environmental impacts.
The project activity does not fall under the purview of the Environmental Impact Assessment (EIA)
notification of the Ministry of Environment and Forest, Government of India. Hence, not required by the
host party.
PROJECT DESIGN DOCUMENT FORM (CDM PDD) - Version 02 CDM – Executive Board page 34
This template shall not be altered. It shall be completed without modifying/adding headings or logo, format or font.
Also, No Objection Certificate (NOC) has been issued by the State Pollution Control Board for the proposed project activity.
PROJECT DESIGN DOCUMENT FORM (CDM PDD) - Version 02 CDM – Executive Board page 35
This template shall not be altered. It shall be completed without modifying/adding headings or logo, format or font.
SECTION G. Stakeholders’ comments >> G.1. Brief description how comments by local stakeholders have been invited and compiled:
MSL organised stakeholder consultation meetings with identified stakeholders in the area with the objective
to inform the interested stakeholders on the environmental and social impacts of the project activity and
discuss their concerns regarding the project activity. Invitation for stakeholder consultation meeting was
sent out requesting the members of village panchayat and local governing bodies to participate and
communicate any suggestions/objections regarding the project activity in writing. On the day of meeting,
MSL representatives presented the salient features of the company and the project activity to the
participants and requested their suggestions/objections. The opinions expressed by them were recorded and
are available. The other stakeholders identified for the project activity are as under:
1. Uttar Pradesh Pollution Control Board (UPPCB)
2. Uttar Pradesh Power Corporation Limited (UPPCL)
Other stakeholders were involved in the project activity at appropriate stages of the project development, to
get their comments.
G.2. Summary of the comments received:
In view of various direct and indirect benefits (social, economical, environmental) no concerns were raised
during the consultation with local stakeholders.
UPPCB have issued NOC to the project activity under the provisions of Water (Prevention and Control of
Pollution) Act, 1974 / Air (Prevention and Control of Pollution) Act, 1981.
MSL has already signed Power Purchase Agreement (PPA) with UPPCL.
G.3. Report on how due account was taken of any comments received:
Since no concerns were raised during the consultation with local stakeholders, it is not required to take due
account of the comments.
PROJECT DESIGN DOCUMENT FORM (CDM PDD) - Version 02 CDM – Executive Board page 36
This template shall not be altered. It shall be completed without modifying/adding headings or logo, format or font.
Annex 1
CONTACT INFORMATION ON PARTICIPANTS IN THE PROJECT ACTIVITY Organization: Mawana Sugars Limited Street/P.O.Box: 19, Rajendra Place Building: 6th Floor, Kirti Mahal City: New Delhi State/Region: Delhi Postfix/ZIP: 110008 Country: India Telephone: 91 11 25739103 FAX: 91 11 25743659/25743849 E-Mail: [email protected] URL: http://www.mawanasugars.com/ Represented by: Title: General Manager Salutation: Mr. Last Name: Agrawal Middle Name: N First Name: G Department: - Mobile: 91 9810677059 Direct FAX: - Direct tel: - Personal E-Mail: [email protected]
The generation data collected and used is presented further in Table 1.
Power generation Mix of Northern Region for five years Energy Source 2000-01 2001-02 2002-03 2003-04 2004-05 Total Power Generation (MU) 134492.7 140515.2 154544.34 168109.84 172681.58
Total Thermal Power Generation 99766.38 104339.7 115985.83 122955.41 126341.00
Total Low Cost Power Generation 34726.33 36175.51 37723.02 44681.92 46340.58
Thermal % of Total grid generation
74.18 74.26 75.05 73.14 73.16
Low Cost % of Total grid generation
25.82 25.74 24.41 26.58 26.84
% of Low Cost generation out of Total grid generation - Average of the five most recent years
The OM factor for Northern region grid taking average of recent three years is calculated as 1.131 kg
CO2/kWh
Table2: Power plants considered for calculating build margin
Plants supplying power to Northern grid are arranged in descending order of date of commissioning Total generation for 2004-05 = 172681.585 20 % of total generation = 34536.32