+ All Categories
Home > Documents > CLEAN DEVELOPMENT MECHANISM … (version 02) CDM – Executive Board page 1 CLEAN DEVELOPMENT...

CLEAN DEVELOPMENT MECHANISM … (version 02) CDM – Executive Board page 1 CLEAN DEVELOPMENT...

Date post: 12-Jul-2019
Category:
Upload: dinhtuyen
View: 221 times
Download: 0 times
Share this document with a friend
33
CDM-SSC-PDD (version 02) CDM – Executive Board page 1 CLEAN DEVELOPMENT MECHANISM SIMPLIFIED PROJECT DESIGN DOCUMENT FOR SMALL-SCALE PROJECT ACTIVITIES (SSC-CDM-PDD) Version 02 CONTENTS A. General description of the small-scale project activity B. Baseline methodology C. Duration of the project activity / Crediting period D. Monitoring methodology and plan E. Calculation of GHG emission reductions by sources F. Environmental impacts G. Stakeholders comments Annexes Annex 1: Information on participants in the project activity Annex 2: Information regarding public funding Annex 3: Summary of Biomass assessment conducted for the project activity Annex 4: Grid Emission Factor
Transcript

CDM-SSC-PDD (version 02)

CDM – Executive Board page 1

CLEAN DEVELOPMENT MECHANISM

SIMPLIFIED PROJECT DESIGN DOCUMENT

FOR SMALL-SCALE PROJECT ACTIVITIES (SSC-CDM-PDD)

Version 02

CONTENTS

A. General description of the small-scale project activity

B. Baseline methodology

C. Duration of the project activity / Crediting period

D. Monitoring methodology and plan

E. Calculation of GHG emission reductions by sources

F. Environmental impacts

G. Stakeholders comments

Annexes

Annex 1: Information on participants in the project activity

Annex 2: Information regarding public funding

Annex 3: Summary of Biomass assessment conducted for the project activity

Annex 4: Grid Emission Factor

CDM-SSC-PDD (version 02)

CDM – Executive Board page 2

Revision history of this document

Version Number

Date Description and reason of revision

01 21 January

2003

Initial adoption

02 8 July 2005 • The Board agreed to revise the CDM SSC PDD to reflect

guidance and clarifications provided by the Board since version

01 of this document.

• As a consequence, the guidelines for completing CDM SSC

PDD have been revised accordingly to version 2. The latest

version can be found at

<http://cdm.unfccc.int/Reference/Documents>.

CDM-SSC-PDD (version 02)

CDM – Executive Board page 3

SECTION A. General description of the small-scale project activity

A.1. Title of the small-scale project activity:

“Grid connected 13 MW biomass power project in Maharashtra”

Version: 1.0

Date: 01.08.2006

A.2. Description of the small-scale project activity:

The proposed project activity is a 13MW renewable energy based power project from GAPS Power &

Infrastructure Pvt. Ltd. Cotton stalk (other biomass such as Maize / Red gram stalks, and Juliflora etc

would also be utilized) which is a renewable biomass available in the region would be utilized for power

generation. The project activity will be located in Shendra Maharastra Industrial Development

Corporation (MIDC) in Aurangabad District in the state of Maharashtra, India. The power generated in

the plant would be exported to Maharashtra State Electricity Distribution Company Limited (MSEDCL)

through Maharashtra State Electricity Transmission Company Limited (MSETCL), which is a part of

Western Region (WR) Grid. The WR Grid is primarily based on fossil fuel. The displacement of

equivalent power in the grid would result in emission reduction linked with fossil fuel combustion in

power generation.

Though the biomass availability in the region is abundant however there is no proper collection &

delivery network in place, hence project promoter would also have to develop a logistic network for

biomass collection & delivery. It has also been observed (in many Indian states such as Punjab, Uttar

Pradesh, and Andhra Pradesh etc) that biomass prices escalate substantially with increased usage. CERs

from this project shall also be utilized in mitigating the fuel risks and to make investments in developing

dedicated fuel sources.

The proposed project shall use the conventional Rankine cycle. The project activity would comprise of

one boiler of 60 TPH @ 45 kg/cm2 and 440 deg C and one condensing turbine of capacity 13 MW. The

pressure and temperature are less than other more efficient rankine cycle plants (operating at 87 Kg/Cm2

or 105 Kg/Cm2 and 550 degree C). This lower pressure and temperature technology has been chosen to

facilitate the use of 100% cotton stalk as fuel which is a difficult fuel to use for power generation thus

compromising on steam output efficiency. To minimize the possibilities of corrosion in the Boiler the

size of the furnace has been enlarged which has resulted in increased project cost. Registering the project

under Clean Development Mechanism of UNFCC and availing CERs will compensate lower efficiency

and higher project cost as well as lower Plant Load Factor (PLF) of the plant compared to normal fossil

fuel fired power plants.

The project activity has a number of sustainability aspects associated with it–

1. The project activity is renewable power project and would result in GHG emission reduction for

the equivalent power in the WR grid, which is primarily based on fossil fuels.

2. The fuels proposed in the project are biomass residues from the area. This will provide a distinct

source of revenue to the local farmers and other people from sale and transportation of these

biomass residues.

CDM-SSC-PDD (version 02)

CDM – Executive Board page 4

3. The project activity would generate employment during construction and operation of the power

project1

4. The power project would help in achieving regional energy security by bridging power demand

supply gap in the state.

5. Use of biomass in power generation would lead to conservation of natural resources such as coal,

oil etc.

6. The project activity would provide the desired impetus to other industries to come up with

similar projects in the region and elsewhere.

7. More efforts and resources would be put into R&D in technologies to suit the similar project

activities. Cotton stalk is a very difficult fuel to use for power generation, success of the project

activity shall lead to implementation of more cotton stalk based power projects.

A.3. Project participants:

Name of Party involved (*)

((host) indicates a host Party)

Private and/or public

entity(ies)

Project participants (*)

(as applicable)

Kindly indicate if the party

involved wishes to be

considered as project

participant (yes/no)

Government of India GAPS Power & Infrastructure

Pvt. Ltd. (GAPS Power )

No

A.4. Technical description of the small-scale project activity:

A.4.1. Location of the small-scale project activity:

A.4.1.1. Host Party(ies):

Country: India

A.4.1.2. Region/State/Province etc.:

State: Maharashtra

A.4.1.3. City/Town/Community etc:

Area: Maharashtra Industrial Development Corporation (MIDC)

Village: Shendra

District: Aurangabad

State: Maharashtra

A.4.1.4. Detail of physical location, including information allowing the unique identification of this

small-scale project activity(ies):

1 Projected direct employment generation-80 people, and in-direct employment for 800 people. At the time of plant

construction approx 350 people would be employed.

CDM-SSC-PDD (version 02)

CDM – Executive Board page 5

The proposed 13 MW biomass based power plant will be located in Shendra MIDC, Aurangabad district

in the state of Maharashtra. Aurangabad district is located at Northern latitude between 19° & 20° and its

East longitude between 74° & 76°. Shendra MIDC is located at a distance of about 20 km from

Aurangabad city and about 40 km from Jalna. The geographic location in which the project activity is

shown in the map below:

Maharashtra

CDM-SSC-PDD (version 02)

CDM – Executive Board page 6

A.4.2. Type and category(ies) and technology of the small-scale project activity:

Jalna

Aurangabad

CDM-SSC-PDD (version 02)

CDM – Executive Board page 7

The project is a small scale CDM project activity and is based on Appendix B (Version 07, Date: 28

November 2005) of the simplified modalities and procedures for small-scale CDM project activities. The

project activity conforms to the following category-

TYPE I: Renewable Energy Projects & Category ID: “Grid connected renewable electricity

generation”

This category comprises renewable energy generation units, such as photovoltaics, hydro, tidal/wave,

wind, geothermal, and renewable biomass, that supply electricity to and/or displace electricity from an

electricity distribution system that is or would have been supplied by at least one fossil fuel fired

generating unit.

Reference: Version 9, Scope 1, dated 28/07/2006

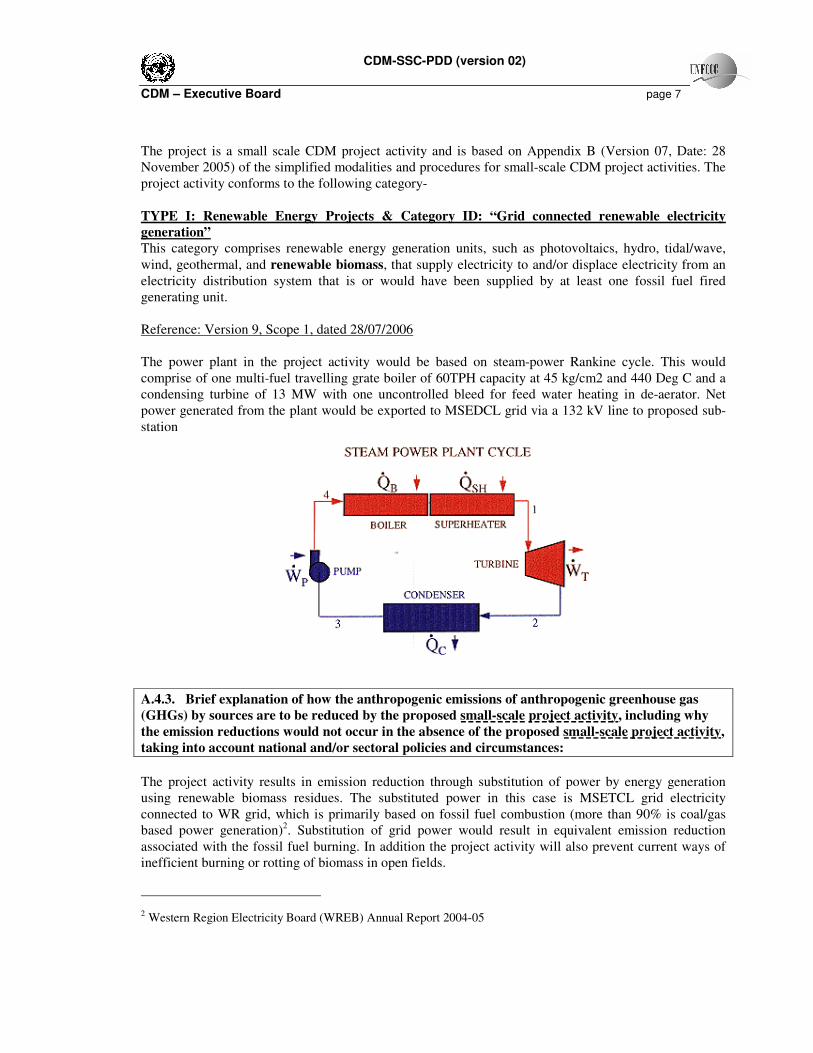
The power plant in the project activity would be based on steam-power Rankine cycle. This would

comprise of one multi-fuel travelling grate boiler of 60TPH capacity at 45 kg/cm2 and 440 Deg C and a

condensing turbine of 13 MW with one uncontrolled bleed for feed water heating in de-aerator. Net

power generated from the plant would be exported to MSEDCL grid via a 132 kV line to proposed sub-

station

A.4.3. Brief explanation of how the anthropogenic emissions of anthropogenic greenhouse gas

(GHGs) by sources are to be reduced by the proposed small-scale project activity, including why

the emission reductions would not occur in the absence of the proposed small-scale project activity,

taking into account national and/or sectoral policies and circumstances:

The project activity results in emission reduction through substitution of power by energy generation

using renewable biomass residues. The substituted power in this case is MSETCL grid electricity

connected to WR grid, which is primarily based on fossil fuel combustion (more than 90% is coal/gas

based power generation)2. Substitution of grid power would result in equivalent emission reduction

associated with the fossil fuel burning. In addition the project activity will also prevent current ways of

inefficient burning or rotting of biomass in open fields.

2 Western Region Electricity Board (WREB) Annual Report 2004-05

CDM-SSC-PDD (version 02)

CDM – Executive Board page 8

In the absence of the project activity, equivalent power would have generated in the WR Grid primarily

based on fossil fuels. The project activity faces a number of barriers such as Investment barrier, technical

barrier, and risks associated with biomass logistics & price etc (details in section B.3 of the document).

The project activity is also one & first of its kinds in the state. Due to these barriers the project activity

would not happen without CDM benefits. GAPS Power envisages supporting the project and mitigating

the risk with CDM backed revenues.

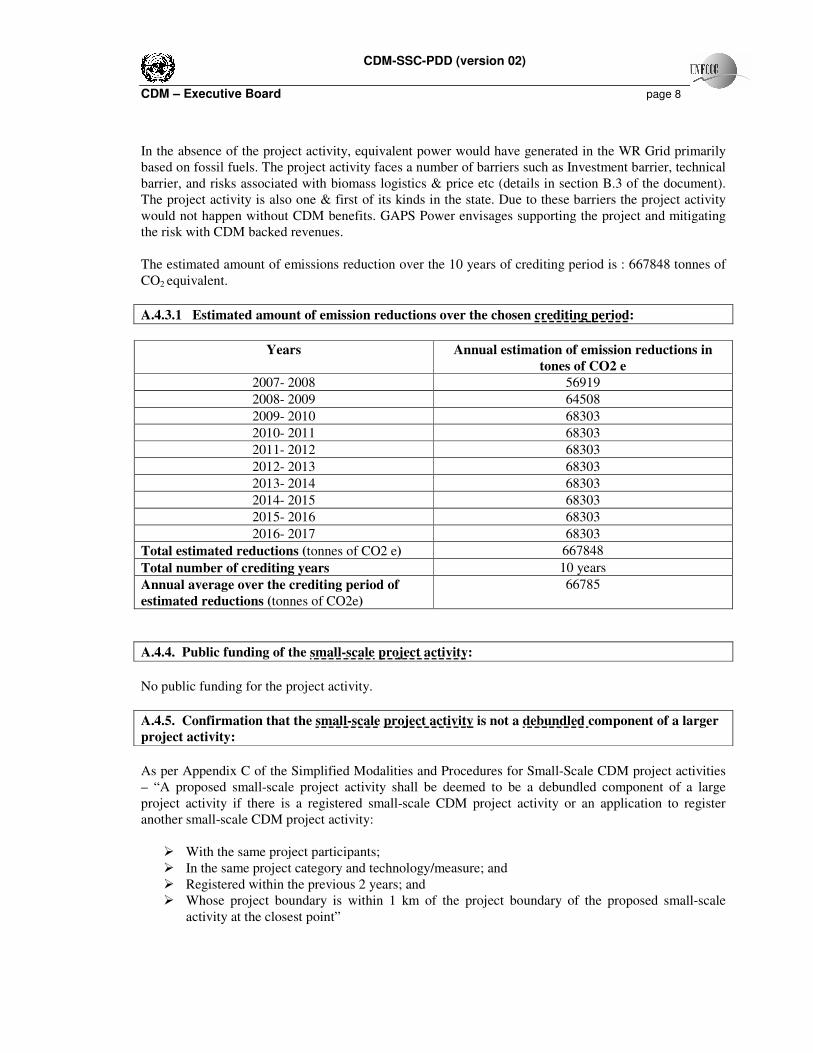
The estimated amount of emissions reduction over the 10 years of crediting period is : 667848 tonnes of

CO2 equivalent.

A.4.3.1 Estimated amount of emission reductions over the chosen crediting period:

Years Annual estimation of emission reductions in

tones of CO2 e

2007- 2008 56919

2008- 2009 64508

2009- 2010 68303

2010- 2011 68303

2011- 2012 68303

2012- 2013 68303

2013- 2014 68303

2014- 2015 68303

2015- 2016 68303

2016- 2017 68303

Total estimated reductions (tonnes of CO2 e) 667848

Total number of crediting years 10 years

Annual average over the crediting period of

estimated reductions (tonnes of CO2e)

66785

A.4.4. Public funding of the small-scale project activity:

No public funding for the project activity.

A.4.5. Confirmation that the small-scale project activity is not a debundled component of a larger

project activity:

As per Appendix C of the Simplified Modalities and Procedures for Small-Scale CDM project activities

– “A proposed small-scale project activity shall be deemed to be a debundled component of a large

project activity if there is a registered small-scale CDM project activity or an application to register

another small-scale CDM project activity:

� With the same project participants;

� In the same project category and technology/measure; and

� Registered within the previous 2 years; and

� Whose project boundary is within 1 km of the project boundary of the proposed small-scale

activity at the closest point”

CDM-SSC-PDD (version 02)

CDM – Executive Board page 9

The project activity is not a de-bundled component of a large project activity as –

There is no small scale CDM project activity or an application registered by GAPS Power in the same

project category in the last two years within 1 km of the project boundary of the proposed small-scale

project activity.

SECTION B. Application of a baseline methodology:

B.1. Title and reference of the approved baseline methodology applied to the small-scale project

activity:

The project is a small scale CDM project activity. It is based on “TYPE ID: Grid connected renewable

electricity generation” of Appendix B of the simplified modalities and procedures for small-scale CDM

project activities.

Reference: Version 9, Scope 1, dated 28/07/2006

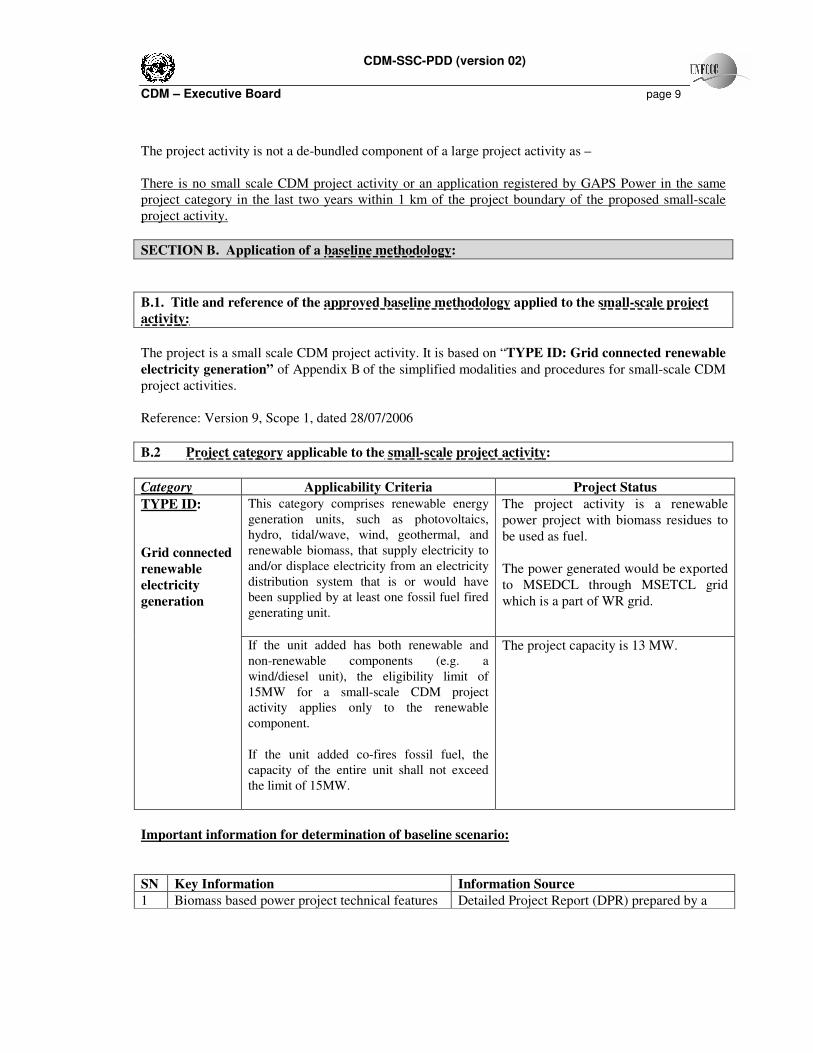
B.2 Project category applicable to the small-scale project activity:

Category Applicability Criteria Project Status

This category comprises renewable energy

generation units, such as photovoltaics,

hydro, tidal/wave, wind, geothermal, and

renewable biomass, that supply electricity to

and/or displace electricity from an electricity

distribution system that is or would have

been supplied by at least one fossil fuel fired

generating unit.

The project activity is a renewable

power project with biomass residues to

be used as fuel.

The power generated would be exported

to MSEDCL through MSETCL grid

which is a part of WR grid.

TYPE ID:

Grid connected

renewable

electricity

generation

If the unit added has both renewable and

non-renewable components (e.g. a

wind/diesel unit), the eligibility limit of

15MW for a small-scale CDM project

activity applies only to the renewable

component.

If the unit added co-fires fossil fuel, the

capacity of the entire unit shall not exceed

the limit of 15MW.

The project capacity is 13 MW.

Important information for determination of baseline scenario:

SN Key Information Information Source

1 Biomass based power project technical features Detailed Project Report (DPR) prepared by a

CDM-SSC-PDD (version 02)

CDM – Executive Board page 10

well known consulting firm

2 Biomass availability Assessment done by a third party

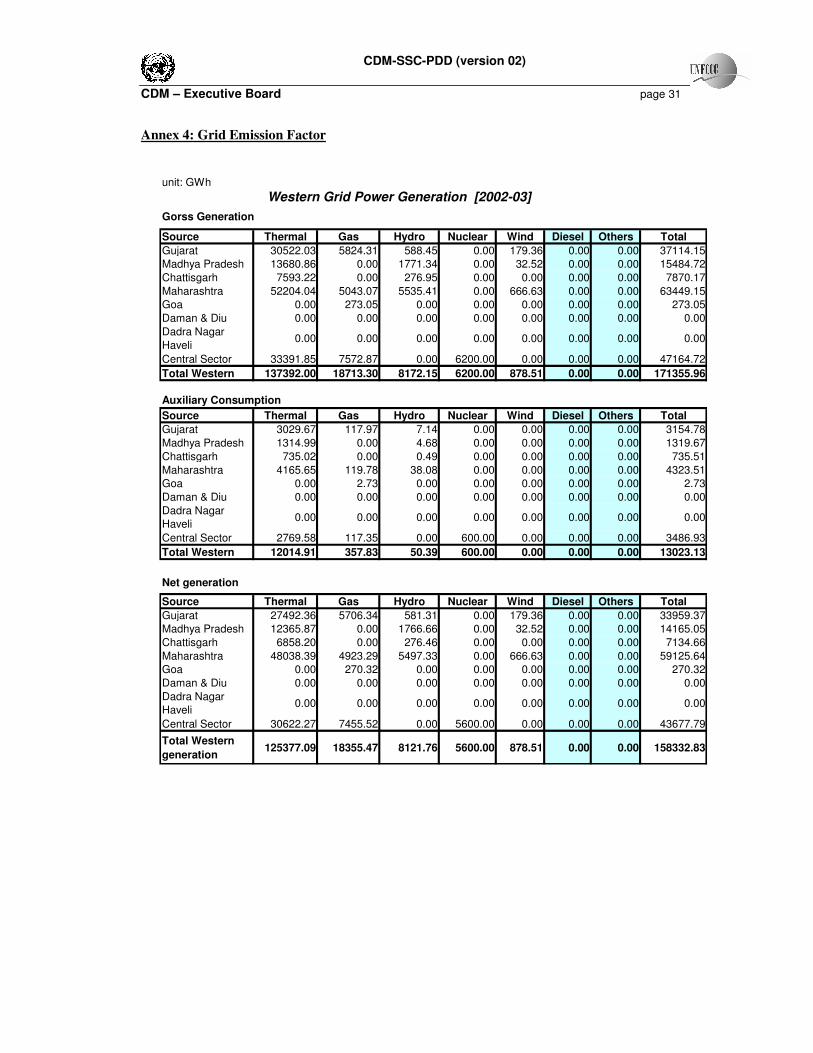
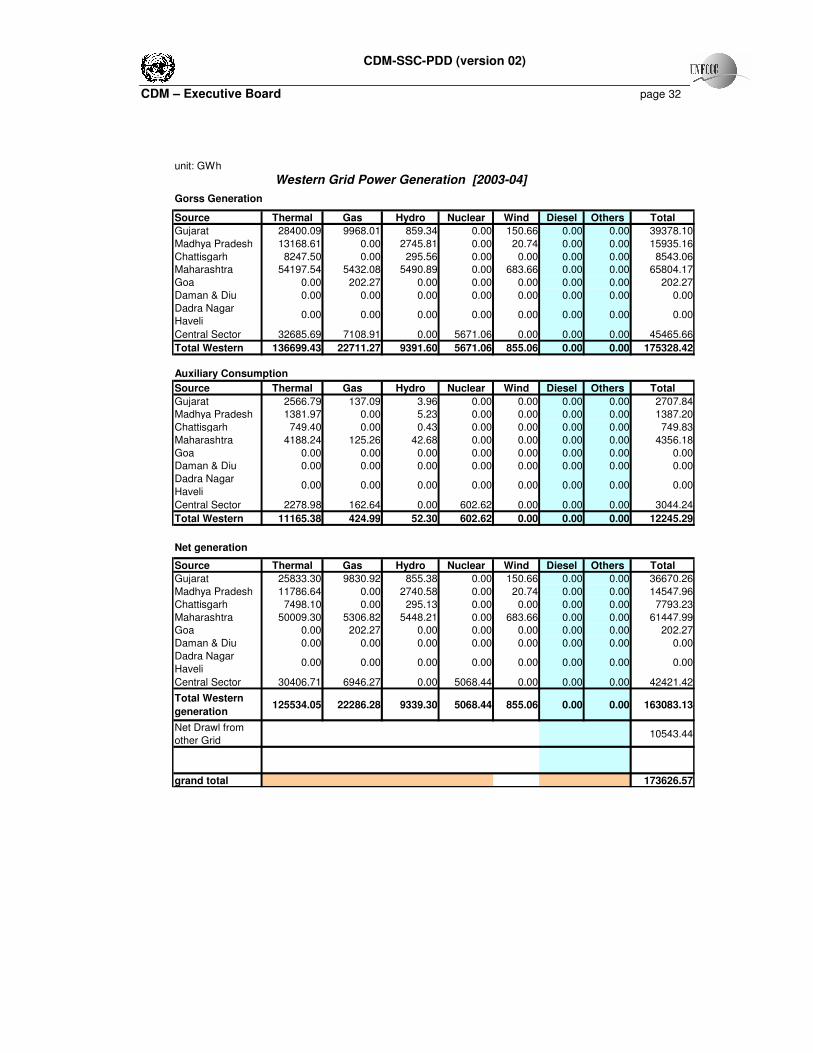
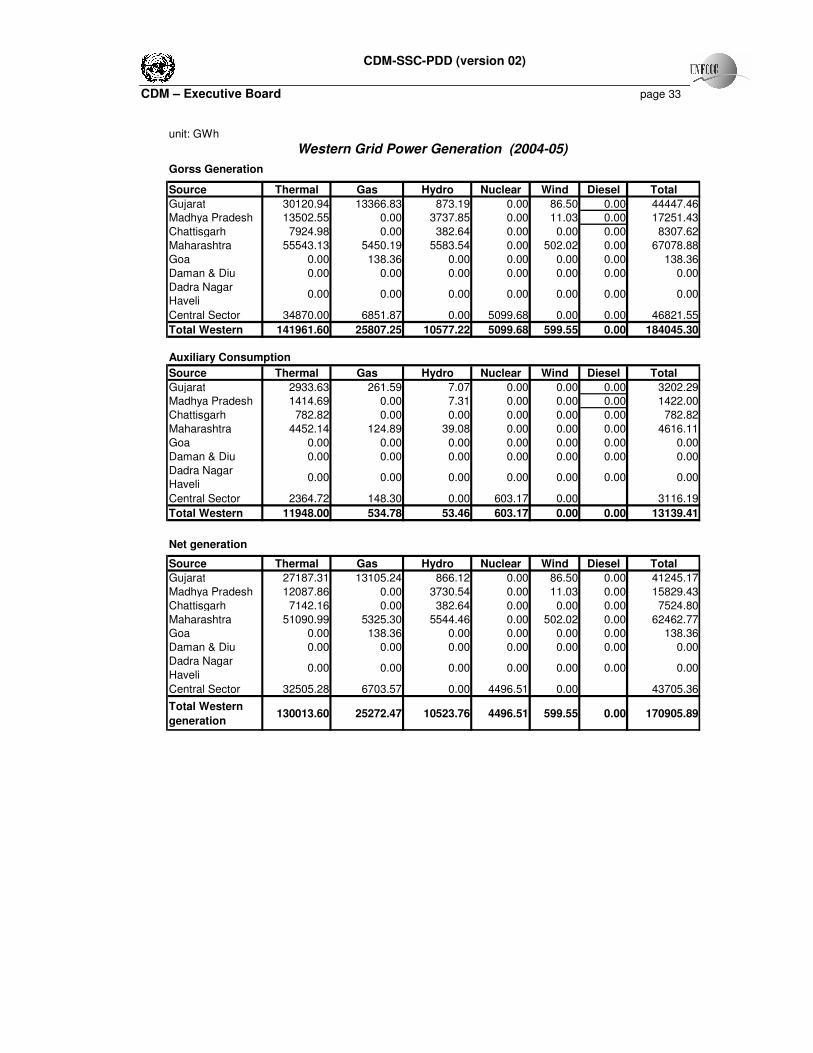
3 Grid Emission factor Western Region Electricity Board (WREB)

Annual Reports, Central electricity authority

(CEA) and IPCC data

Grid emission factor estimation details provided in section B.5, Annex-4

B.3. Description of how the anthropogenic emissions of GHG by sources are reduced below those

that would have occurred in the absence of the registered small-scale CDM project activity:

Proposed project activity is eligible to use simplified methodologies as

� It conforms to project category in “Appendix B of the simplified modalities & procedures for small

scale CDM-project activities under AMS TYPE ID– “Grid connected renewable electricity

generation”

� The power project capacity is 13 MW (<15 MW).

� It is not a debundled component3 of a larger project activity, as it qualifies guidelines in “appendix C

to the simplified M&P for the small-scale CDM project activities for guidance on how to determine

whether the proposed project activity is not a debundled component of a larger project activity”

Project Additionality Analysis:

The additionality of the project activity is analysed using barrier analysis as per Attachment A of the

simplified modalities & procedures for small scale CDM-project activities (version 06/30 September

2005).

A: Investment Barrier

Low Returns from the project

At this step it has been determined whether the project activity is economically or financially viable and

attractive without the sale of Certified Emissions Reduction (CER).

The project activity entails high capital cost investments. An investment analysis of the project activity

was done based on the Internal Rate of Return as the financial indicator. ‘IRR’ is one of the known

financial indicators used by banks, financial institutions and project developers for making investment

decisions. The equity IRR was then compared with RRR4 for the project activity.

The project activity is highly investment intensive. The total investment made by GAPS Power on the

power project implementation would be approx INR ~590 million5. So project activity could not have

3 Refer section A.4.5

4 The RRR (14%) was calculated as Required Rate of Return for the project activity. Capital asset pricing model

(CAPM) is used.

5 This is based on DPR projected cost and equipment quotations received by GAPS power at the time of PDD

submission.

CDM-SSC-PDD (version 02)

CDM – Executive Board page 11

been possible if CDM benefits were not taken into account, which makes IRR of the project activity

viable.

Summary of Financial analysis of project

Capacity 13 MW

Debt Equity Ratio 70 % : 30 %

Interest Rate on term loan 12.25 %

Plant Load factor 75 % in First year, then moving up-to 90 % in the

third year of operations

Auxiliary Power Consumption 10%

Operating period 330 days/24 hours

Project IRR without CERs 11.986 %

Cotton Stalk Calorific Value 3490 Kcal/Kg (as per sample testing done by well

known Laboratory in India)

Fuel Cost Rs 1000/ton

Station Heat Rate 3701

Project IRR with CERs 15.08 %

Required Rate of Return (RRR) 14.05 %

Tariff As per MERC tariff policy for similar kinds of

projects

Sensitivity Analysis

A detailed sensitivity analysis of the project activity was done to test the project feasibility with varying

project parameters. The project activity feasibility is dependent on the following parameters.

� Annual export to MSEDCL

� Fuel Prices

Sensitivity Table showing impact of variations in key factors on IRR without CDM revenue:

(a) Variation in Annual Export of power-

SN Parameters Variation IRR % Change Comments

+5 % 15.11 % +26.12 % The probability of a 10% increase

in annual export to MSEB is not

very high as PLF considered for

IRR estimation is anyways 90% in

the third year of operations

1

Annual Export to

MSEDCL

-5 % 8.64 % -27.88 % The IRR of the project activity is

very low in comparison of RRR

benchmark.

(b) Variation in Fuel Prices-

6 Financial analysis is done by a well known financial consulting firm with experience in biomass based power

projects

CDM-SSC-PDD (version 02)

CDM – Executive Board page 12

SN Parameters Variation IRR % Change Comments

+5 % 5.54 % -53.75 % The IRR of the project activity is

lower than the RRR benchmark

i.e. 14%;

2 Fuel Prices

variations

-5 % 15.87 % +32.47 % Due to extremely low margin

Price reduction possibilities are

very low.

It has been concluded that proposed project activity is unlikely to be the most financially attractive.

Difficulties in Financial Closure

Getting financial closure for biomass based project is a difficult task in India. These type of projects are

assessed to be risky by financial institutions due to risks of crop failure, crop pattern changes, risk of

plant closure in case of biomass unavailability, lack of biomass delivery & collection network, risks of

sudden fuel price rise, higher project costs as compared to coal based plant (and particularly for the

project activity due to low efficiency and technical problems as well) etc7. Also given low IRR arranging

equity participation for the project was difficult. Therefore the Promoters have approached a foreign

investor (M/s Hampton Investment Group Limited) who is willing to provide part equity participation in

the project against share of CERs generated from the project activity. Hence project promoters are

proposing to remove the main barrier i.e. investment barrier (Financial closure and improvement in the

project IRR) by registering the project activity as CDM project.

B: Technological Barrier

The primary fuel to be used in the project activity is Cotton Stalk, which is considered to be a difficult

fuel to burn in the boiler due to following reason.

♦ Cotton stalk contains chlorine and potassium and presence of these substances makes it

unsuitable for high pressure and high temperature combustion as potassium chloride has melting

point of 500 Deg C and at this temperatures it starts fusing. This leads to build up on boiler tubes

and consequent failure of boiler tubes. To avoid this GAPS Power have planned to install

comparatively a low pressure and low temperature (45 kg/ cm2 and 440 Deg C) boiler, which has

lower efficiency, compared to other similar high pressure and high temperature power systems.

♦ Cotton stalk has very high alkali content and hence firing of cotton stalk results in generation of

high alkali gas which generally has the characteristic of frothing and foaming at a higher

temperature. Due to this characteristic, an oil coating is formed on the super heater coil which

reduces the heat transfer co-efficient in due course. This aspect needs special attention while

designing a Boiler for firing cotton stalks. If 100% cotton stalk is used in the boiler, there will be

a coating formation in the super heater coils leading to rapid reduction of super heat temperature

and needing frequent shut down of boiler for cleaning of super heater coils. Although soot

blowers are provided for steam cleaning the super heater, the efficacy of even frequent steam

cleaning can be inadequate in getting rid of such coating. Hence, usage of 100% cotton stalk is

7 This is evident by the queries raised by FIs/Banks regarding barriers associated with the project activity. Also FIs

recommended 35% equity participation to cover up for the risks in the project (as against 30% norm considered by

MERC) by the promoter which was a difficult proposition given high cost of the project.

CDM-SSC-PDD (version 02)

CDM – Executive Board page 13

generally avoided when super heater temperature exceeds 485 Deg. C to 500 Deg. C. However

in order to sustain usage of 100% cotton stalk under such difficult conditions the Boiler furnace

size has been increased, which has led to higher costs as compared to similar rating Boilers using

other types of fuels

♦ The cotton stalk structure is also fibrous in nature. Fibrous fuels do not permit usage of screw

feeder or drag chain feeder which is generally used for feeding other bio mass fuels. Hence, for

firing a boiler with cotton stalks, over bed firing feeder with rotating drum feeding arrangement

has to be provided & the conveyor should continuously run for feeding this drum feeder; there

should be provision for continuous feed to the conveyor to avoid any variations in steam

generation.

All the above listed problems with Cotton stalk as a fuel require significant design changes (low

pressure/temperature & larger size furnace), which in turn increase the project costs and also lead to

lower efficiency (as compared to high pressure & high temp systems). Higher cost and low efficiency

makes the project activity less financially attractive and is therefore additional8.

C: Operational barrier:

Biomass Logistics and Price Risk

Biomass, though abundant in supply, doesn’t have proper logistics network for collection and delivery. In

normal practice it is burned inefficiently or is left to rot in the field. This is a fuel availability risk, and to

ensure continuous & economical fuel supply, Project Proponents will have to develop a viable fuel

collection mechanism.

This is the first project of its kind in the district where the project is located. Hence there is no past

history of prices for bio-mass for a situation where it is regularly used for commercial power generation.

However it has also been observed in other parts of India that biomass prices increase significantly over

the time as the bio-mass usage increases due to demand in bio-mass based power plants in the region.

This happens due to lack of proper collection mechanism and delivery of biomass. This leads to short-

term shortage and thus increased prices. Prices move up from low of ~Rs 800-900/T to Rs 2000-2200/ton

as seen in areas such as Punjab, Uttar Pradesh and Andhra Pradesh etc. To overcome this type of problem

and for long term strategy, GAPS Power is proposing to acquire waste land in the region to grow energy

plantation. This would require further investment which has not been provided for in the already

constrained resources.

Cotton crop (source of main fuel for the project activity) in Maharashtra is essentially rain-fed and major

regions are characterized by scanty and uncertain rainfall. Only 3 percent of the cotton area is irrigated

while 97 percent depends upon rainfall. It has also been observed in the region that farmers are prone to

change crop pattern every few years, leading to uncertainty in availability of cotton stalk which is the

main fuel for power plant. The same is evident in the following table showing area under cotton

cultivation for Aurangabad & Jalna districts (two main areas from where biomass would be procured).

Thus availability of biomass residue carries an inherent risk which is beyond the control of project

proponent.

8 These problems have also been described in technical consultant’s report, communications with equipment

suppliers & industry experts and technical papers

CDM-SSC-PDD (version 02)

CDM – Executive Board page 14

1995-96 1996-97 1997-98 1998-99 1999-00 2000-01 2001-02 2002-03

Area 1019 1100 1397 1526 1595 1324 1413 1355

Production 683 961 820 1483 1132 552 915 755

Yield 114 149 100 165 221 71 110 95

Area 1550 1541 1520 1626 1703 1382 1572 1449

Production 1169 1512 1027 1734 1216 936 1834 2000

Yield 128 167 115 181 121 115 198 235

District

Aurangabad

Jalna

Source: Indira Gandhi Institute of Development Research, Mumbai January 2006

The uncertainty related to main fuel availability necessitates modifications in design of boiler

compromising efficiency so that variety of fuels can be used in case cotton stalk is not available. These

design changes have led to increased project cost and lower power generation efficiency.

Summary:

As per a report from MNES, Ministry of Non-conventional Energy Sources 2004-05, only one project of

3.5 MW capacity has been installed based on Biomass as fuel as against potential of 302 MW in the state

as on 31st March 2005. This is expected to be the first operational plant in India based on 100% Cotton

Stalks as a fuel. Therefore the Promoters have assumed a considerable risk.

The project activity is additional to the baseline scenario as it reduces emissions below baseline level and

faces many barriers which prohibit its implementation. CERs will help bridge the profitability gap, as

well as provide financial support for investing in development of dedicated biomass collection &

delivery network, thus reducing the impact of some of the barriers.

B.4. Description of how the definition of the project boundary related to the baseline methodology

selected is applied to the small-scale project activity:

As per the Appendix B of simplified modalities & procedures for small-scale CDM-project activities, the

project boundary is “The physical, geographical site of the renewable energy generating unit and the

equipment that uses the electricity produced delineates the project boundary.”

Power Generation House

Air

Water Power O/P to

Grid

Biomass Storage

Transportation

Biomass Sources

Auxiliary fuel

Exhaust

CDM-SSC-PDD (version 02)

CDM – Executive Board page 15

B.5. Details of the baseline and its development:

As per the methodology AMS-ID the “the baseline is the kWh produced by the renewable generating unit

multiplied by an emission coefficient (measured in kg CO2equ/kWh) calculated in a transparent and

conservative manner as:

(a) A combined margin (CM), consisting of the combination of operating margin (OM) and build

margin (BM) according to the procedures prescribed in the approved methodology ACM0002.

Any of the four procedures to calculate the operating margin can be chosen.

OR

(b) The weighted average emissions (in kg CO2equ/kWh) of the current generation mix. The data of

the year in which project generation occurs must be used.

The GEF has been fixed (using ex-ante option for both OM and BM) and calculated using option (a)

(ACM0002/version 06/19May2006). The procedure followed to calculate combined margin is as follows:

Step I: Calculate the Operating Margin (EFOM) emission factor(s) based on one of the four following

methods:

a. simple OM

b. simple adjusted OM

c. dispatch data OM or

d. Average OM

In India due to non availability of dispatch data, simple OM is used. Simple OM is fixed ex-ante and

calculated as the generation-weighted average emissions per electricity unit (tCO2/MWh) of all

generating sources serving the system, not including low-operating cost and must-run power plants (low

cost/must run plants contribute to less than 10% of overall capacity). In this case generation data for

recent most three years is used to calculate OM.

Step II: Calculate Build Margin emission Factor (EFBM)

Build margin is the generation-weighted average emission factor (tCO2/MWh) of a sample of power plants.

There are two options to calculate Build margin as explained:

Option 1: Calculate the Build Margin emission factor fixed ex-ante based on the most recent information

available on plants already built for sample group m at the time of PDD submission. The sample group m

consists of either the five power plants that have been built most recently or the power plant capacity

additions in the electricity system that comprise 20% of the system generation and that have been built

most recently. Project participants should use from these two options that sample group that comprises

the larger annual generation.

Option 2: For the first crediting period, the Build Margin emission factor must be updated annually ex-

post for the year in which actual project generation and associated emissions reductions occur. For

subsequent crediting periods, should be calculated ex-ante, as described in option 1 above. The sample

CDM-SSC-PDD (version 02)

CDM – Executive Board page 16

group m consists of either the five power plants that have been built most recently or the power plant

capacity additions in the electricity system that comprise 20% of the system generation and that have

been built most recently. Project participants should use from these two options that sample group that

comprises the larger annual generation.

The approach followed for OM is ax-ante; thereby we choose option 1 to calculate BM.

Step II: Calculate Baseline emission Factor (EFBL). Emission factor is calculated as weighted average of

Operating Margin and build Margin emission Factors.

As in Methodology ACM0002, the weightage for OM is 0.50 and for BM is 0.50 in case of Biomass

based energy projects

EFBL = (0.50 X EFOM) + (0.50 X EFBM)

Vintage of data used: For the years 2002-03, 2003-04, 2004-059

Parameter Source Remarks

Gross Power generation from

power plants in Western Grid

WREB data for 2003-04, 2004-

05 and CEA Data for 2002-03

For estimation of Current

Generation Mix for respective

years

Auxiliary Power Consumption in

power generation in western Grid

WREB data for 2003-04, 2004-

05 and CEA Data for 2002-03

For estimation of Current

Generation Mix for respective

years

Design Heat Rate for Coal based

power plants

Performance Review of Thermal

Power stations 2004-05; Central

Electricity Authority data;

http://www.cea.nic.in/god/opm/T

hermal_Performance_Review/04

05/CEA_Thermal%20Performan

ce%20Review0405/SECTION-

13.pdf

For estimation of fuel

consumption in power generation

Design Heat Rate for Gas based

power plants

Central Electricity Regulatory

Commission (CERC) petition

For estimation of fuel

consumption in power generation

NCV - Coal IPCC default value For estimation of fuel

consumption in power generation

NCV – Gas IPCC default value For estimation of fuel

consumption in power generation

Emission Factor – Coal IPCC default value For estimation of emissions in

power generation

Emission Factor – Gas IPCC default value For estimation of emissions in

power generation

9 Data for year 2005-06 is not available at the time of PDD submission

CDM-SSC-PDD (version 02)

CDM – Executive Board page 17

Date: 01/08/2006

Developed by:

GAPS Power & Infrastructure Pvt. Ltd. (Project Participant) and their consultants

Metro Estate, 178 CST Road

Kalina, Santa Cruz(E)

Mumbai 400098

Telephone: + 91 22 26527625

SECTION C. Duration of the project activity / Crediting period:

C.1. Duration of the small-scale project activity:

C.1.1. Starting date of the small-scale project activity:

20/05/2006

C.1.2. Expected operational lifetime of the small-scale project activity:

25 years

C.2. Choice of crediting period and related information:

C.2.1. Renewable crediting period:

NA

CDM-SSC-PDD (version 02)

CDM – Executive Board page 18

C.2.1.1. Starting date of the first crediting period:

C.2.1.2. Length of the first crediting period:

C.2.2. Fixed crediting period:

C.2.2.1. Starting date:

01/09/2007

C.2.2.2. Length:

10 years

SECTION D. Application of a monitoring methodology and plan:

D.1. Name and reference of approved monitoring methodology applied to the small-scale project

activity:

The project is a small scale CDM project activity. It is based on “TYPE ID: Grid connected renewable

electricity generation” of Appendix B of the simplified modalities and procedures for small-scale CDM

project activities.

Reference: Version 9, Scope 1, dated 28/07/2006

D.2. Justification of the choice of the methodology and why it is applicable to the small-scale

project activity:

The monitoring of the project activity is in line with the monitoring requirement stipulated in the small

scale methodology AMS ID: “Grid connected renewable electricity generation”.

D.3 Data to be monitored:

ID

numbe

r

Data

variable

Data

unit

Measured

(m),

calculated

© or

estimated

(e)

Recordin

g

frequenc

y

How will the

data be

archived?

(electronic/

paper)

Comment

1.1 NETy :

Net power

export to

the grid

kWh M Daily Electronic/

paper

Based on the meter at substation of

MSEDCL. This meter would be

used by MSEDCL for monthly

billing purposes.

1.2 Gross

Power

generation

in project

kWh M Daily Electronic/

paper

CDM-SSC-PDD (version 02)

CDM – Executive Board page 19

plant

1.3 Auxiliary

Power

Consumpti

on

kWh M Daily Electronic/

paper

1.4 Quantity of

biomass i

combusted

Tonnes M Daily Electronic/

paper As per order passed by MERC

Order 8th August 2005, all biomass

based power projects are required

to furnish monthly details of all

kinds of fuel purchased and used in

the plant.

These reports will also be useful for

CDM monitoring as well.

1.5 Calorific

Value of

biomass

fuel i used

Kcal/K

g

M Every

Quarter

Electronic/

paper

This will be done at a Government

approved independent laboratory.

In case it is not available IPCC

default values would be used.

1.6 QFF y

Quantity of

fossil fuel i

combusted

in the

project

plant

Tonnes M Daily Electronic/

paper

1.7 Calorific

Value of

fossil fuel i

used

Kcal/K

g

M Every

Quarter

Electronic/

paper

This will be done at a Government

approved independent laboratory. In

case it is not available IPCC default

values would be used.

1.8 FEFCO2:

Emission

factor for

fossil fuel i

in the

project

plant

tCO2e/

tonne

C Yearly Electronic/

paper Calculated using IPCC default

emission factor for type of fossil

fuel used

1.9 GEF: Grid

Emission

Factor

T

CO2/M

Wh

E Once at

the time

of PDD

submissi

on

Electronic/Paper Grid Emission factor is fixed ex-

ante at the time of PDD

submission.

D.4. Qualitative explanation of how quality control (QC) and quality assurance (QA) procedures

are undertaken:

Data

(Indicate table

and ID number

e.g. 3.-1.; 3.2.)

Uncertainty level of data

(High/Medium/Low)

Explain QA/QC procedures planned for these data, or why such

procedures are not necessary.

CDM-SSC-PDD (version 02)

CDM – Executive Board page 20

1.1-1.3 Low Net power exported to grid would be based on the meter at

substation of MSEDCL This meter would be used by MSEDCL for

monthly billing purposes. Bills would be used for CERs estimation.

Also data related to net power export could be cross-checked with

meters installed in plant (for gross and auxiliary)

Meters used in the measuring the data would be calibrated as

descried in the monitoring plan.

1.4, 1.6 Low Meters used in the measuring the data would be regularly calibrated.

1.5-1.7 Low Fuel calorific values are either lab tested or IPCC default values

1.8, 1.9 Low IPCC default emission factor for fuel used

Publicly available information used for GEF estimation.

D.5. Please describe briefly the operational and management structure that the project

participant(s) will implement in order to monitor emission reductions and any leakage effects

generated by the project activity:

GAPS Power proposes following monitoring plan for monitoring, recording and quality assurance of the

data required for the project activity.

Company structure

GAPS Power, proposed to have operation, maintenance, purchase, stores, finance, accounts and

laboratory sections. Each section will be headed by one Section Head supported by shift-in-charge and

support staff i.e. operators. The overall responsibility of the department functioning will be with the

respective section heads. Maintenance sections will include mechanical, electrical and instrumentation

departments. These will be responsible for the overall upkeep of plant machinery and instruments.

GAPS Power also proposes following procedures to ensure the completeness and correctness of the data

needed to be monitored for CDM project activity.

Formation of CDM Team:

A CDM project team would be constituted with participation from relevant departments. People would

be trained on CDM concept and monitoring plan. This team will be responsible for data collection and

archiving.

This team will meet periodically (as per internal audit plant) to review CDM project activity, check

collected data, emissions reduction etc. In case of any irregularity observed by any of the CDM team

members, it will be informed to the concerned person for necessary actions. These reports would be kept

for verification purposes.

Responsibility:

Plant Head: Overall responsibility of compliance with the CDM monitoring plan

Section In-charge: Responsibility for completeness of data, reliability of data (calibration of meters),

and monthly report generation

Shift In-charge: Responsibility of daily report generation

Training of CDM team personnel:

CDM-SSC-PDD (version 02)

CDM – Executive Board page 21

The training of the CDM team and plant personnel will be carried out on CDM principles, CDM

activities, monitoring of data and record keeping through a planned schedule made in advance and a

record of various training programmes undertaken would be kept for verification.

For normal plant operations & maintenance, people will be trained by equipment suppliers.

Day to day data collection and record keeping:

Plant data shall be collected on operation under the supervision of the respective Shift-in-charge and

record would be kept in daily logs.

Archiving of data:

The data shall be kept for a period of two years after the crediting period.

Reliability of data collected:

The reliability of the meters will be checked by testing the meters on yearly basis. Documents pertaining

to testing of meters shall be maintained. The metering equipment will consist of Main and Check Meters

and these shall be identical in make, technical standards of 0.5 % accuracy class and calibration and

comply with the requirements of Electricity Rules.

Frequency:

The frequency for data monitoring shall be as per the monitoring details in Section D of this document.

Calibration of instruments:

GAPS Power would have procedures well defined for the calibration of instruments. A log of calibration

records would be maintained. Instrumentation department in the company would be responsible for the

upkeep of instruments in the plant.

As per PPA, MSEDCL shall be doing testing of meters used for net power export once in a year and if

any inconsistency or errors are found, these would be corrected immediately.

Maintenance of instruments and equipments used in data monitoring:

The operation department shall be responsible for the proper functioning of the equipments/ instruments

and shall inform the concerned department for corrective action if found not operating as required.

Corrective action shall be taken by the concerned department and a report on corrective action taken shall

be maintained as done time to time along with the details of problems rectified.

Checking data for its correctness and completeness:

The CDM team would have the overall responsibility of checking data for its completeness and

correctness. The data collected from daily logs is forwarded to the team after verification from respective

departments.

Internal audits of CDM project compliance:

CDM audits shall be carried out to check the correctness of procedures and data monitored by the

internal auditing team entrusted for the work. Report on internal audits done, faults found and corrective

action taken shall be maintained and kept for external auditing.

Emergency preparedness:

The project activity does not result in any unidentified activity that can result in substantial emissions

from the project activity. No need for emergency preparedness in data monitoring is visualized.

CDM-SSC-PDD (version 02)

CDM – Executive Board page 22

Report generation on monitoring:

After verification of the data and due diligence on corrective ness if required an annual report on

monitoring and estimations shall be maintained by the CDM team and record to this effect shall be

maintained for verification.

Environment Management Plan

GAPS Power management proposes to have a separate and adequate budgetary allocation of environment

management and laboratory. The management proposes to routinely air and water quality both at source

and in the ambient at the plant site to be done regularly as per Central Pollution Control Board (CPCB)

guidelines after, the plant is commissioned. If the results indicate any deviation from normal values

necessary corrective measures will be promptly initiated. As part of its environmental management, the

factory proposes to develop a scientifically designed green belt in and around the factory site (33% of the

total area of the plot) to mitigate air and noise pollution impacts on the surroundings.

Sustainable Development Aspects

The project provides an opportunity for the local people to get employment directly or indirectly and

helps in the upliftment of the socioeconomic status of the area. The project proponents propose to

involve in social activities of the surrounding community by planning the betterment of neighbouring

social conditions through awareness and welfare programs will ensure an improved relation. The

commitment of management can include upliftment of social, health, basic needs of drinking water

supply and provision of educational facilities. Many of the beneficiaries of such programs shall include

own employees as well. The good will of the local populace can never be ignored. The channels

employed may vary either through direct contact or by means of local organizations. Another important

fact of social environment identified by the project proponents is a green appearance; hence the

management will develop a green belt towards aesthetic beautification, as the same is necessary to be

considered as a responsible, social neighbour.

D.6. Name of person/entity determining the monitoring methodology:

Mr. Sumeet Nindrajog

GAPS Power & Infrastructure Pvt. Ltd.

Metro Estate, 178 CST Road

Kalina, Santa Cruz(E)

Mumbai 400098

Telephone: + 91 22 26527625

SECTION E.: Estimation of GHG emissions by sources:

E.1. Formulae used:

E.1.1 Selected formulae as provided in appendix B:

NA

CDM-SSC-PDD (version 02)

CDM – Executive Board page 23

E.1.2 Description of formulae when not provided in appendix B:

E.1.2.1 Describe the formulae used to estimate anthropogenic emissions by sources of GHGs due to

the project activity within the project boundary:

Carbon dioxide emissions from on-site consumption of fossil fuels

The proper and efficient operation of the biomass power plant may require using some fossil fuels, e.g. for

start-ups or during rainy season (when biomass humidity is high).

PEy = ∑ QFF, y X FEFCO2

Where

PEy : Project emissions from on-site fuel combustion in year y, tCO2e

QFF y : Quantity of fossil fuel combusted in the project plant in year y, tonne

FEF CO2 : Carbon emission factor for fossil fuel

E.1.2.2 Describe the formulae used to estimate leakage due to the project activity, where required,

for the applicable project category in appendix B of the simplified modalities and procedures for

small-scale CDM project activities

No leakage due to competing use of biomass in the region is expected as biomass is available in abundance

and has not much commercial/household use10

.

E.1.2.3 The sum of E.1.2.1 and E.1.2.2 represents the small-scale project activity emissions:

PEy = ∑ QFF, y X FEFCO2

E.1.2.4 Describe the formulae used to estimate the anthropogenic emissions by sources of GHGs in

the baseline using the baseline methodology for the applicable project category in appendix B of

the simplified modalities and procedures for small-scale CDM project activities:

BEy = NETy X GEF

Where

BEy : Baseline emissions in the year y, tCO2e

NETy : Net electricity export to the grid in year y, MWh

GEF : Grid emission factor, tCO2e/ MWh

E.1.2.5 Difference between E.1.2.4 and E.1.2.3 represents the emission reductions due to the

project activity during a given period:

ERy = BEy – PEy

Where

10 Annex-3 Summary of Biomass assessment

CDM-SSC-PDD (version 02)

CDM – Executive Board page 24

ERy : Emissions reduction in year y, tCO2e

BEy : Baseline emissions in year y, tCO2e

PEy : Emissions due to project activity in year y, tCO2e

E.2 Table providing values obtained when applying formulae above:

SECTION F.: Environmental impacts:

F.1. If required by the host Party, documentation on the analysis of the environmental impacts of

the project activity:

Following are the effects expected from the project activity and also measures towards management of

these effects.

CONSTRUCTION PHASE

The project activity shall ensure to keep the pollution potential level in the construction phase to a

minimum. Wherever applicable, detailed procedures will be developed for control of pollution during

project execution phase. The following are few important parameters to be appropriately managed to

minimize the pollution load.

♦ Site Preparation

During the site preparation considerable amount of soil movement is involved due to site levelling

operations which will carry out. During the dry season it is necessary to control uplift of dust during the

excavation, levelling and transportation by spraying water in the paths, and along the temporary roads.

♦ Sanitation

The facilities like toilets, drinking water and proper shelter for the persons staying in the construction site

will be provided with utmost importance. The toilets will be attached to septic tank so as to minimize the

percolation and to control the subsequent impact on the environment. These facilities will be properly

designed and maintained to ensure minimum environmental impact.

♦ Waste from Construction equipments

The construction activity may involve movement of heavy vehicles for earth moving and to move the

equipment like dozers and cranes etc. The vehicles will be maintained properly so as to minimize the

emissions from exhaust

POST CONSTRUCTION PHASE

CDM-SSC-PDD (version 02)

CDM – Executive Board page 25

The major pollution from the proposed biomass based power plant will be in the form of air, water and

soil waste. The source of pollution and treatment plan are described in the following sections.

♦ Waste water management

Strict in-plant measures would be initiated to reduce the concentrations of pollutants and flow rates of

waste water streams. Waste water discharges would be kept to the minimum and the same would be

treated properly before disposing for horticultural purposes. Domestic effluent would be sent to ETP and

after treatment same will be utilized for gardening.

♦ Air Environment

As the boiler is fired with biomass, which is considered as environmental friendly, as the ash content in

the biomass is less than 10% compared to coal which will have ash content of about 45%. Also the SOx

emission will be very low in biomass fired boiler when compared with coal fired boiler. The site

preparation would not lead to cutting of trees as the site is covered with bushes and shrubs. However, a

green belt would be developed which will enhance environmental quality through; mitigation of fugitive

emissions, attenuation of noise levels, balancing Eco-environment, consumption of treated effluent,

prevention of soil erosion, and creation of aesthetic environment.

♦ Noise Environment

Noise absorbing materials will be used in the construction of Roofs, walls, floors, and in the generators.

Safety equipment for noise like ear muffs and other protective devises will be provided to the staff

working near noise generation source. The green belt proposed will also help in the reduction of noise

levels outside the plant.

SECTION G. Stakeholders’ comments:

G.1. Brief description of how comments by local stakeholders have been invited and compiled:

Stakeholders identified for the project activity are –

a) Local community

b) Maharashtra State Electricity Distribution Company Ltd (MSEDCL)

c) Maharashtra Pollution control Board (MPCB)

d) Ministry of Environment and Forest (MoEF)

e) Maharashtra Energy Development Agency (MEDA)

f) Sources of biomass residues

The project activity has obtained all necessary approvals for setting up the power plants, and meets all

regulatory requirements as mandated by Government agencies.

To collect feedback from local community following process was adopted

- One to one discussion regarding project activity: Pre designed questionnaires are canvassed in 100

villages selected equally from 11 talukas (6 talukas in Aurangabad district and 5 talukas from Jalna

district). This assessment was done as part of biomass availability study in the region during May-June

2005. To ensure fairness and transparency, these discussions were conducted by an independent

consulting firm.

CDM-SSC-PDD (version 02)

CDM – Executive Board page 26

- Meetings with local people: Meetings were held with people in nearby areas (Panchayat members and

local community people) during June-July 2006 to discuss about project, impact on the local community

& environment. Local community has expressed their consent for such type of project. Additional

employment generation and Cleaner environment were considered to be the most important outcome of

this project.

G.2. Summary of the comments received:

Following were the positive points as expressed by the local community

� Employment Generation (in the plant, and biomass procurement)

� Additional income source for farmers for sale of biomass to the project

� Better electricity supply in the region, as pressure on grid would be eased

� Less GHG emissions

� Infrastructure development in the region

Meeting with suppliers for biomass were also held. Their views have been taken while estimating

biomass availability in the region. As per these interactions, biomass is abundantly available in the region

and has no significant commercial/household use for the same.

G.3. Report on how due account was taken of any comments received:

No adverse comment received, hence no corrective action required.

CDM-SSC-PDD (version 02)

CDM – Executive Board page 27

Annex 1

CONTACT INFORMATION ON PARTICIPANTS IN THE PROJECT ACTIVITY

Organization: Gaps Power & Infrastructure Pvt. Ltd.

Street/P.O.Box: 178 C.S.T Road, Kalina, Santa Cruz (E)

Building: Metro Estate

City: Mumbai

State/Region: Maharashtra

Postfix/ZIP: 400098

Country: India

Telephone: + 91 22 26527625

FAX: + 91 22 26522653

E-Mail: [email protected],[email protected]

URL:

Represented by:

Title: Mr.

Salutation:

Last Name: Nindrajog

Middle Name:

First Name: Sumeet

Department:

Mobile: + 91 9867015044

Direct FAX: + 91 22 26522653

Direct tel: + 91 22 26527625

Personal E-Mail:

CDM-SSC-PDD (version 02)

CDM – Executive Board page 28

Annex 2

INFORMATION REGARDING PUBLIC FUNDING

No public funding for the project activity is envisaged.

CDM-SSC-PDD (version 02)

CDM – Executive Board page 29

Annex 3: Summary of Biomass assessment conducted for the project activity

Biomass assessment was done by an independent consultant. The scope of this study included estimation

of biomass availability in the region, current usage of biomass, surplus biomass availability for the

project activity, collection & delivery network and price etc.

Primary and secondary data were collected for the assessment. Following are the sources for secondary

data collection. Government departments such as Agriculture department, Forest department, Census

department Electricity board, Taluka offices, Civil Supply department, Veterinary and Animal

Husbandry department etc.

In Aurangabad district in total and within a radial distance of 75 Kms from proposed plant location at

MIDC, Shendra, pre designed questionnaires are canvassed in 100 villages selected equally from 11

talukas (6 talukas in Aurangabad district and 5 talukas from Jalna district) for collection of primary data

on generation, consumption and surplus aspects.

Following are the key points of the assessment

♦ The major surplus residues found in the study area are cotton stalks, maize stalks & cobs, sugarcane

tops & trash and red gram stalks, which are presently being disposed by way of burning or mulching

in the fields.

♦ Biomass is available in abundance for the project activity. Total surplus available in the study area is

more than 2.5 times the total annual biomass requirement in the power plant. Hence no leakage due

to competing use of biomass is predicted due to implementation of the project activity.

♦ In respect of crop residues also, price and collection mechanism is not established, since, there were

no commercial transactions. In addition, residues are generated in a particular season and

consumption is throughout the year. Hence an organized mechanism has to be developed for

collection and transportation and storage.

Gross Surplus % of Generation Residue Source

Aurangabad

District

Within 75

Kms

Aurangabad

District

Within 75

Kms

Agriculture

Activity

228640 279760 21 24

Agro-Industries 0 0 0 0

Non-Forest

lands

0 11852 0 3

Agro-Forestry/

energy

Plantation

0 0 0 0

Total 228640 291612 16 18

CDM-SSC-PDD (version 02)

CDM – Executive Board page 30

Biomass Collection & Delivery Mechanism

In respect of crop residues, price and collection mechanism is not established, since, there is no

commercial application of the same in the region. Following is a plan for biomass collection & delivery

for the project activity.

For efficient and sustainable operations of power plant, to carry out collection from dispersed sources of

residue generation and fuel preparation, a consortium will be formed with different agencies such as

producers, government agencies, NGOs, Banks and unemployed youth. As in the case of Sugarcane or

Milk collection and transportation, a society or collection network shall be established at various

geographical locations based on availability of residues and accessibility to the source. As the use of crop

residue will create employment to local people and provide additional income generation source, local

government agencies and financial institutions can be involved in forming societies or networking

agencies and fixation of remuneration.

Biomass thus collected would be stored in a few common collection centers/storage sites. These sites

will be managed by biomass collection heads in respective regions. From these common storage sites,

biomass would be delivered to plant site as per requirements.

.

CDM-SSC-PDD (version 02)

CDM – Executive Board page 31

Annex 4: Grid Emission Factor

unit: GWh

Source Thermal Gas Hydro Nuclear Wind Diesel Others Total

Gujarat 30522.03 5824.31 588.45 0.00 179.36 0.00 0.00 37114.15

Madhya Pradesh 13680.86 0.00 1771.34 0.00 32.52 0.00 0.00 15484.72

Chattisgarh 7593.22 0.00 276.95 0.00 0.00 0.00 0.00 7870.17

Maharashtra 52204.04 5043.07 5535.41 0.00 666.63 0.00 0.00 63449.15

Goa 0.00 273.05 0.00 0.00 0.00 0.00 0.00 273.05

Daman & Diu 0.00 0.00 0.00 0.00 0.00 0.00 0.00 0.00

Dadra Nagar

Haveli0.00 0.00 0.00 0.00 0.00 0.00 0.00 0.00

Central Sector 33391.85 7572.87 0.00 6200.00 0.00 0.00 0.00 47164.72

Total Western 137392.00 18713.30 8172.15 6200.00 878.51 0.00 0.00 171355.96

Source Thermal Gas Hydro Nuclear Wind Diesel Others Total

Gujarat 3029.67 117.97 7.14 0.00 0.00 0.00 0.00 3154.78

Madhya Pradesh 1314.99 0.00 4.68 0.00 0.00 0.00 0.00 1319.67

Chattisgarh 735.02 0.00 0.49 0.00 0.00 0.00 0.00 735.51

Maharashtra 4165.65 119.78 38.08 0.00 0.00 0.00 0.00 4323.51

Goa 0.00 2.73 0.00 0.00 0.00 0.00 0.00 2.73

Daman & Diu 0.00 0.00 0.00 0.00 0.00 0.00 0.00 0.00

Dadra Nagar

Haveli0.00 0.00 0.00 0.00 0.00 0.00 0.00 0.00

Central Sector 2769.58 117.35 0.00 600.00 0.00 0.00 0.00 3486.93

Total Western 12014.91 357.83 50.39 600.00 0.00 0.00 0.00 13023.13

Source Thermal Gas Hydro Nuclear Wind Diesel Others Total

Gujarat 27492.36 5706.34 581.31 0.00 179.36 0.00 0.00 33959.37

Madhya Pradesh 12365.87 0.00 1766.66 0.00 32.52 0.00 0.00 14165.05

Chattisgarh 6858.20 0.00 276.46 0.00 0.00 0.00 0.00 7134.66

Maharashtra 48038.39 4923.29 5497.33 0.00 666.63 0.00 0.00 59125.64

Goa 0.00 270.32 0.00 0.00 0.00 0.00 0.00 270.32

Daman & Diu 0.00 0.00 0.00 0.00 0.00 0.00 0.00 0.00

Dadra Nagar

Haveli0.00 0.00 0.00 0.00 0.00 0.00 0.00 0.00

Central Sector 30622.27 7455.52 0.00 5600.00 0.00 0.00 0.00 43677.79

Total Western

generation125377.09 18355.47 8121.76 5600.00 878.51 0.00 0.00 158332.83

Western Grid Power Generation [2002-03]

Gorss Generation

Auxiliary Consumption

Net generation

CDM-SSC-PDD (version 02)

CDM – Executive Board page 32

unit: GWh

Source Thermal Gas Hydro Nuclear Wind Diesel Others Total

Gujarat 28400.09 9968.01 859.34 0.00 150.66 0.00 0.00 39378.10

Madhya Pradesh 13168.61 0.00 2745.81 0.00 20.74 0.00 0.00 15935.16

Chattisgarh 8247.50 0.00 295.56 0.00 0.00 0.00 0.00 8543.06

Maharashtra 54197.54 5432.08 5490.89 0.00 683.66 0.00 0.00 65804.17

Goa 0.00 202.27 0.00 0.00 0.00 0.00 0.00 202.27

Daman & Diu 0.00 0.00 0.00 0.00 0.00 0.00 0.00 0.00

Dadra Nagar

Haveli0.00 0.00 0.00 0.00 0.00 0.00 0.00 0.00

Central Sector 32685.69 7108.91 0.00 5671.06 0.00 0.00 0.00 45465.66

Total Western 136699.43 22711.27 9391.60 5671.06 855.06 0.00 0.00 175328.42

Source Thermal Gas Hydro Nuclear Wind Diesel Others Total

Gujarat 2566.79 137.09 3.96 0.00 0.00 0.00 0.00 2707.84

Madhya Pradesh 1381.97 0.00 5.23 0.00 0.00 0.00 0.00 1387.20

Chattisgarh 749.40 0.00 0.43 0.00 0.00 0.00 0.00 749.83

Maharashtra 4188.24 125.26 42.68 0.00 0.00 0.00 0.00 4356.18

Goa 0.00 0.00 0.00 0.00 0.00 0.00 0.00 0.00

Daman & Diu 0.00 0.00 0.00 0.00 0.00 0.00 0.00 0.00

Dadra Nagar

Haveli0.00 0.00 0.00 0.00 0.00 0.00 0.00 0.00

Central Sector 2278.98 162.64 0.00 602.62 0.00 0.00 0.00 3044.24

Total Western 11165.38 424.99 52.30 602.62 0.00 0.00 0.00 12245.29

Source Thermal Gas Hydro Nuclear Wind Diesel Others Total

Gujarat 25833.30 9830.92 855.38 0.00 150.66 0.00 0.00 36670.26

Madhya Pradesh 11786.64 0.00 2740.58 0.00 20.74 0.00 0.00 14547.96

Chattisgarh 7498.10 0.00 295.13 0.00 0.00 0.00 0.00 7793.23

Maharashtra 50009.30 5306.82 5448.21 0.00 683.66 0.00 0.00 61447.99

Goa 0.00 202.27 0.00 0.00 0.00 0.00 0.00 202.27

Daman & Diu 0.00 0.00 0.00 0.00 0.00 0.00 0.00 0.00

Dadra Nagar

Haveli0.00 0.00 0.00 0.00 0.00 0.00 0.00 0.00

Central Sector 30406.71 6946.27 0.00 5068.44 0.00 0.00 0.00 42421.42

Total Western

generation125534.05 22286.28 9339.30 5068.44 855.06 0.00 0.00 163083.13

Net Drawl from

other Grid10543.44

grand total 173626.57

Gorss Generation

Auxiliary Consumption

Net generation

Western Grid Power Generation [2003-04]

CDM-SSC-PDD (version 02)

CDM – Executive Board page 33

unit: GWh

Source Thermal Gas Hydro Nuclear Wind Diesel Total

Gujarat 30120.94 13366.83 873.19 0.00 86.50 0.00 44447.46

Madhya Pradesh 13502.55 0.00 3737.85 0.00 11.03 0.00 17251.43

Chattisgarh 7924.98 0.00 382.64 0.00 0.00 0.00 8307.62

Maharashtra 55543.13 5450.19 5583.54 0.00 502.02 0.00 67078.88

Goa 0.00 138.36 0.00 0.00 0.00 0.00 138.36

Daman & Diu 0.00 0.00 0.00 0.00 0.00 0.00 0.00

Dadra Nagar

Haveli0.00 0.00 0.00 0.00 0.00 0.00 0.00

Central Sector 34870.00 6851.87 0.00 5099.68 0.00 0.00 46821.55

Total Western 141961.60 25807.25 10577.22 5099.68 599.55 0.00 184045.30

Source Thermal Gas Hydro Nuclear Wind Diesel Total

Gujarat 2933.63 261.59 7.07 0.00 0.00 0.00 3202.29

Madhya Pradesh 1414.69 0.00 7.31 0.00 0.00 0.00 1422.00

Chattisgarh 782.82 0.00 0.00 0.00 0.00 0.00 782.82

Maharashtra 4452.14 124.89 39.08 0.00 0.00 0.00 4616.11

Goa 0.00 0.00 0.00 0.00 0.00 0.00 0.00

Daman & Diu 0.00 0.00 0.00 0.00 0.00 0.00 0.00

Dadra Nagar

Haveli0.00 0.00 0.00 0.00 0.00 0.00 0.00

Central Sector 2364.72 148.30 0.00 603.17 0.00 3116.19

Total Western 11948.00 534.78 53.46 603.17 0.00 0.00 13139.41

Source Thermal Gas Hydro Nuclear Wind Diesel Total

Gujarat 27187.31 13105.24 866.12 0.00 86.50 0.00 41245.17

Madhya Pradesh 12087.86 0.00 3730.54 0.00 11.03 0.00 15829.43

Chattisgarh 7142.16 0.00 382.64 0.00 0.00 0.00 7524.80

Maharashtra 51090.99 5325.30 5544.46 0.00 502.02 0.00 62462.77

Goa 0.00 138.36 0.00 0.00 0.00 0.00 138.36

Daman & Diu 0.00 0.00 0.00 0.00 0.00 0.00 0.00

Dadra Nagar

Haveli0.00 0.00 0.00 0.00 0.00 0.00 0.00

Central Sector 32505.28 6703.57 0.00 4496.51 0.00 43705.36

Total Western

generation130013.60 25272.47 10523.76 4496.51 599.55 0.00 170905.89

Western Grid Power Generation (2004-05)

Gorss Generation

Auxiliary Consumption

Net generation


Recommended