34
2015 LEAGUE TABLES Clean Energy & Energy Smart Technologies Jonathan Gardiner 14 January 2016
| Date post: | 07-Feb-2018 |
| Category: |
Documents |
| Upload: | trinhduong |
| View: | 218 times |
| Download: | 0 times |

2015 LEAGUE TABLES
Clean Energy & Energy Smart
Technologies
Jonathan Gardiner
14 January 2016
1
CLEAN ENERGY & EST LEAGUE TABLES
CONTENTS
1. Introduction
2. League table role coverage
3. Overview of 2015
4. Asset finance
Lead arrangers
Syndicated lenders
Sponsors
Legal advisers
Financial advisers
Tax equity
13. M&A
Acquirers
16. Venture capital & private equity
Investors
Investors (by count)
19. Acquisition advisers
M&A and VC/PE financial advisers
M&A and VC/PE legal advisers
23. Public markets
Lead managers
Co-lead managers
Legal advisers
28. Warehouse Financing
Bloomberg New Energy Finance (BNEF) Clean Energy & Energy Smart Technology
League Tables are the most transparent and comprehensive benchmarks for
identifying active clean energy investors, project financiers, investment banks and
law firms.
The tables in this report cover deals across asset finance, M&A, venture
capital / private equity and public markets that have been reported as
completed in 2015.
BNEF subscribers can access live league tables and apply filters to focus the
results at the link below:
www.bnef.com/LeagueTable If you are not a subscriber and would like to hear more about the BNEF products,
please contact: [email protected].
Due to the dynamic nature of the BNEF online product, league table rankings may
vary between this publication and data found on the BNEF website following the
release date. BNEF Clean Energy League Tables represent only transactions that
are executed and notified to BNEF at the time of writing.
BNEF does all it can to guarantee the accuracy of deal input data. Organisations
are recommended to contact the league table team directly prior to quarterly
publication to ensure that all applicable deals are correctly reflected in the BNEF
database.
For league table data submissions or calculation queries, please contact:

2
LEAGUE TABLE ROLE COVERAGE
CLASS LEAGUE TABLE ROLE COVERAGE
ASSET FINANCE
Lead arrangers Mandated lead arrangers
Syndicated lenders Syndicated lenders
Sponsors Financial sponsors or acquirers
Legal advisers Legal adviser to equity sponsors and to lenders
Financial advisers Financial adviser to equity sponsors, lenders and sellers
Tax equity Tax equity investors
M&A, VENTURE
CAPITAL & PRIVATE
EQUITY (VC/PE)
M&A – acquirers Acquirers
VCPE – investors Lead and non-lead investor
VC/PE/M&A – financial advisers Adviser to M&A acquirer, M&A target, VC/PE investor, and VC/PE target
VC/PE/M&A – legal advisers Legal adviser to M&A acquirer, M&A target, VC/PE investor, and VC/PE target
PUBLIC MARKETS
Lead managers Global coordinator
Co-lead managers Co-lead manager
Legal advisers Legal adviser to issuer and to underwriter
The BNEF Clean Energy & EST League Tables cover a variety of activities in the clean energy and energy smart technology investment
space. An overview of the roles covered and the tables covering each role are given below.

3
OVERVIEW >> TOP ORGANISATIONS 2015
ASSET FINANCE>>
Wind dominated the Asset Financing tables in 2015, with eight of the top ten deals (in
debt and total value) being for offshore projects and offshore transmissions facilities.
Lead Arrangers: Topping the 2015 Lead Arranger table is Banco Santander, with a total credit of
$3,158.5m and a table share of 6.26% for an impressive 53 deals. Their most notable deals
included the 336MW Galloper Offshore Wind Farm as well as the 402MW Veja Mate Offshore
Wind Farm.
Syndicated Lenders: Securing pole position in the Syndicated Lenders table is EKF, with a total
credit of $624.7m and a table share of 8.06% for 3 deals, including the above mentioned Veja
Mate Offshore Wind Farm.
Sponsors: Climbing 12 places to top the Sponsors table is TerraForm Power, with a table credit
of $3,148.4m and deal count of 12, including the Invenergy North American Wind Portfolio
acquisition.
Legal Advisers: Returning to first position in the Legal Advisers table is Linklaters, rising two
places from Q3. They secured a table share of 10.95% for 14 deals and a $5,539m credit. They
advised, most notably, on the Galloper Offshore Wind Farm.
Financial Advisers: Climbing six places to top the Financial Advisers table is Citigroup, with 4
deals and a total credit of $2,805.6m, including the above mentioned Galloper Offshore Wind
Farm.
Tax Equity: Securing first place in the Tax Equity table is Bank of America, with 12 deals and a
table credit of $1,252.6m. This resulted in a table share of 34.65%
M&A>>
Acquirers: Retaining first place in the M&A acquirers table is Macquarie with
$2,731m credit and a table share of 16.47% for acquiring Spanish and
Portuguese assets from E.ON, the Düsseldorf-based electric utility.
VC/PE>>
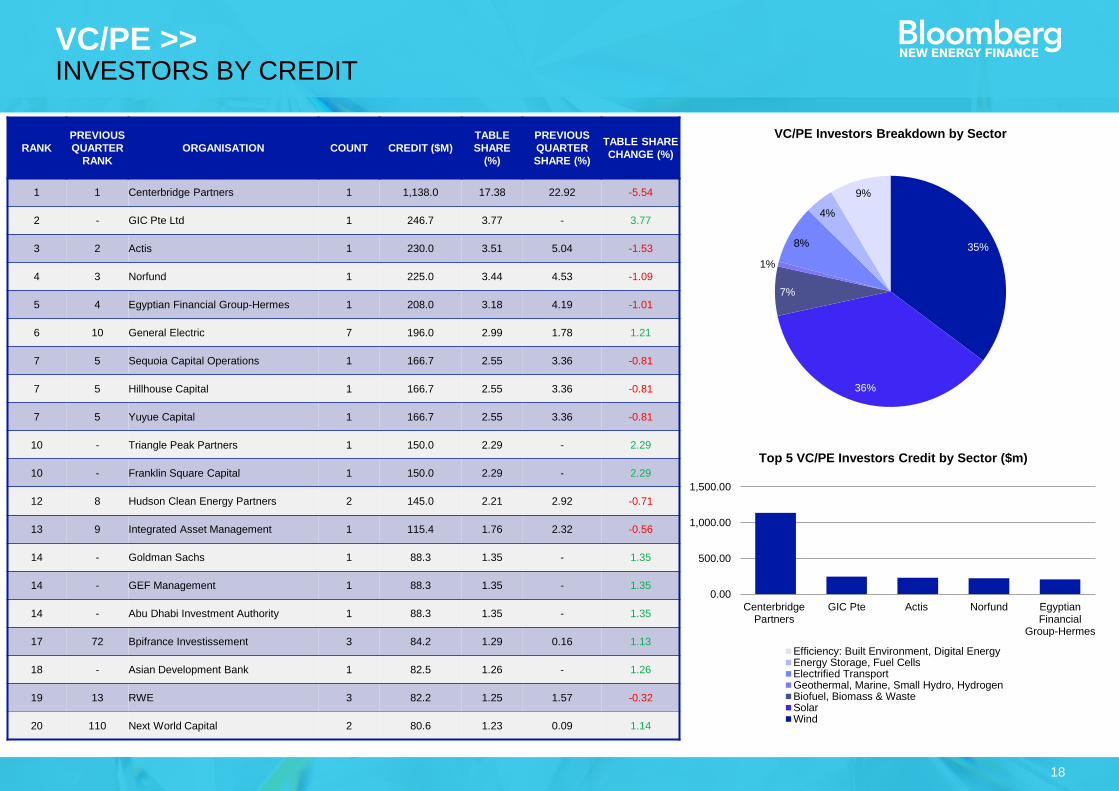
Investors (credit): Retaining pole position in the VC/PE Investors table is Centerbridge Capital
Partners with a $1,138m credit and a table share of 17.38% for their acquisition of Senvion, a
Hamburg-based wind-turbine manufacturer.
Investors (deal count): Securing first place in the investor deal count table is 350 Investment
Partners with a total of 14 deals and $3.7m credit .
ACQUISITION ADVISERS>>
M&A and VC/PE Financial Advisers: Retaining first place in the 2015 M&A and VC/PE financial
adviser table is JPMorgan Chase with $2,552m credit and a table share of 14.08% for advising
Ormat Technologies on the acquisition of Ormat Industries. It also advised Macquarie on the
acquisition of assets from E.ON.
M&A and VC/PE Legal Advisers: Retaining the number one position in the Legal Adviser table is
Linklaters for advising Macquarie on the acquisition of assets from E.ON.
PUBLIC MARKETS>>
Solar dominated the Public Market tables in 2015 with eight of the top ten deals occurring
in the solar sector.
Lead Managers: Remaining in first place in the 2015 Lead Manager table is Goldman Sachs with
$3,272.8m credit, most notably for leading the secondary share placement of Tesla Motors.
Co-Lead Managers: Securing pole position in the Co-Lead Managers Table is Bank of America,
with $1,166.1m credit for 14 deals and a table share of 11.06%
Legal Advisers: Topping the Legal Adviser table is Latham & Watkins with $4,529.2m credit for
advising on 11 deals to secure a table share of 24.3%.
4
ASSET FINANCE

5
ASSET FINANCE >> TOP 10 DEALS – BY TOTAL DEBT
RANK ASSET CLOSE SECTOR DEBT VALUE ($M) LEAD ARRANGERS ($M CREDIT) SYNDICATED LENDERS ($M CREDIT)
1 Galloper Offshore Wind Farm 30/10/2015 Wind 2,113.9
Natixis SA (162.6); BNP Paribas (162.6); ABN AMRO Bank
NV (162.6); Sumitomo Mitsui Financial Group (162.6); Societe
Generale (162.6); ING (162.6); Lloyds (162.6); Banco Santander
(162.6); Mitsubishi UFJ Financial (162.6); Credit Agricole CIB
(162.6)
EIB (162.6)
2 NOORo STEG Portfolio 23/05/2015 Solar 1,797.4 African Development Bank (131.9); World Bank (440.4); KFW
(720.2); Climate Investment Funds (262.1) None Disclosed
3 Veja Mate Offshore Wind Farm 26/06/2015 Wind 1,426.7
Natixis SA (241.0); Commerzbank (241.0); KFW (446.8);
Deutsche Bank (128.4); Banco Santander (241.0); Sumitomo
Mitsui Financial Group (128.4)
Rivage Investment SAS (152.3); Societe Generale
(152.3); SCOR Investment Partners SE (152.3); EKF
(207.9); NRW Bank (152.3); Shinsei Bank Ltd (152.3);
BayernLB (152.3); CaixaBank SA (152.3);
Sparkassen Finanzgruppe Hessen-Thueringen
(152.3)
4 TenneT DolWin Transmission
Facilities Portfolio 28/05/2015 Wind 1,094.8
ING (219.0); Lloyds (219.0); Royal Bank of Scotland
(219.0); HSBC (219.0); Rabobank (219.0) None Disclosed
5
MeerWind Sud und Ost
Offshore Wind Farm Phase I
Refinancing
16/12/2015 Wind 1,067.2 Jefferies International (1,067.2) None Disclosed
6 Nordsee 1 Offshore Wind
Farm 19/03/2015 Wind 890.7
Natixis SA (89.1); Commerzbank (89.1); ABN AMRO Bank
NV (89.1); Sparkassen Finanzgruppe Hessen-Thueringen
(89.1); Export Development Canada (89.1); National Bank of
Canada (89.1); KFW (89.1); Bank of Montreal (89.1); Rabobank
(89.1); Mitsubishi UFJ Financial (89.0)
None Disclosed
7 Lincs Offshore Wind Farm
Refinancing 30/04/2015 Wind 859.7 ING (61.0) None Disclosed
8 Guris Efeler Geothermal
Project 29/06/2015 Geothermal 716.8
European Bank for Reconstruction & Development (200.7);
Turkiye Sinai Kalkinma Bankasi AS (129.0); Turkiye Is
Bankasi (322.5)
Black Sea Trade & Development Bank (64.5)
9 Longyuan Haian Jiangjiasha
Offshore Wind Farm 08/08/2015 Wind 685.4 None Disclosed None Disclosed
10
Datang Renewable & Jiangsu
Guoxin Investment Binhai
Offshore Wind Farm
31/07/2015 Wind 675.1 None Disclosed None Disclosed

6
ASSET FINANCE >> LEAD ARRANGERS
60%
34%
3% 3%
Asset Finance Lead Arranger Breakdown by Sector RANK
PREVIOUS
QUARTER
RANK
ORGANISATION COUNT CREDIT $M) TABLE
SHARE (%)
PREVIOUS
QUARTER
SHARE (%)
TABLE SHARE
CHANGE (%)
1 2 Banco Santander 53 3,158.5 6.26 5.72 0.54
2 3 Mitsubishi UFJ Financial 40 2,639.1 5.46 4.74 0.72
3 1 KFW 16 2,356.2 4.87 6.76 -1.89
4 4 Sumitomo Mitsui Financial Group 31 1,884.6 3.90 3.37 0.53
5 12 Rabobank 39 1,881.8 3.86 2.38 1.48
6 9 Mizuho Financial 29 1,560.9 3.23 2.53 0.70
7 11 Nord/LB 36 1,510.2 3.12 2.47 0.65
8 15 BNDES 20 1,461.9 3.02 2.05 0.97
9 10 HSBC 8 1,272.7 2.63 2.50 0.13
10 17 ING 18 1,127.0 2.33 1.90 0.43
11 5 Deutsche Bank 16 1,125.6 2.33 3.10 -0.77
12 - Jefferies International 1 1,067.2 2.21 - 2.21
13 14 KeyCorp 16 1,050.2 2.17 2.20 -0.03
14 6 Not Reported 10 1,005.8 2.08 2.96 -0.88
15 7 Overseas Private Investment
Corp 7 952.9 1.97 2.80 -0.83
16 13 BayernLB 27 923.2 1.91 2.32 -0.41
17 19 Natixis SA 10 912.0 1.89 1.52 0.37
18 8 Barclays 11 888.3 1.84 2.61 -0.77
19 36 BNP Paribas 12 820.9 1.70 0.85 0.85
20 31 HSH Nordbank 24 785.4 1.62 0.94 0.68
0.00
500.00
1,000.00
1,500.00
2,000.00
2,500.00
3,000.00
3,500.00
BancoSantander
MitsubishiUFJ Financial
KFW SumitomoMitsui
FinancialGroup
Rabobank
Top 5 Lead Arranger Credit by Sector ($m)
Wind Solar
Biofuel, Biomass & Waste Geothermal, Marine, Small Hydro

7
ASSET FINANCE >> SYNDICATED LENDERS
RANK
PREVIOUS
QUARTER
RANK
ORGANISATION COUNT CREDIT ($M) TABLE
SHARE (%)
PREVIOUS
QUARTER
SHARE (%)
TABLE SHARE
CHANGE (%)
1 2 EKF 3 624.7 8.06 6.54 1.52
2 1 Royal Bank of Scotland 4 428.4 5.53 7.42 -1.89
3 3 Mitsubishi UFJ Financial 2 334.6 4.32 5.93 -1.61
4 4 Investec 2 330.3 4.26 5.85 -1.59
5 5 KeyCorp 2 312.5 4.03 5.54 -1.51
6 6 Sumitomo Mitsui Financial Group 1 260.2 3.36 4.61 -1.25
7 - Garanti-instituttet for eksportkreditt 1 255.5 3.30 - 3.30
8 7 ING 1 250.0 3.23 4.43 -1.20
9 27 EIB 2 233.1 3.01 1.25 1.76
10 - Banco BPI 1 214.0 2.76 - 2.76
10 - Caixa Geral de Depositos 1 214.0 2.76 - 2.76
10 - Banco Comercial Portugues 1 214.0 2.76 - 2.76
13 - Banco Nacional de Comercio Exterior 1 211.8 2.73 - 2.73
14 25 KFW 5 205.4 2.65 1.74 0.91
15 8 Development Bank of Southern Africa 3 204.1 2.63 3.62 -0.99
16 9 Allianz SE 1 172.8 2.23 3.06 -0.83
17 10 Shinsei Bank 2 171.7 2.22 3.04 -0.82
18 11 Chugoku Bank 3 165.6 2.14 2.71 -0.57
19 12 Caixa Bank 2 152.3 1.97 2.70 -0.73
19 12 Societe Generale 1 152.3 1.97 2.70 -0.73
63%
32%
3%
2%
Asset Finance Syndicated Lender Breakdown by Sector
0.00
100.00
200.00
300.00
400.00
500.00
600.00
700.00
EKF Royal Bank ofScotland
Mitsubishi UFJFinancial
Investec PLC KeyCorp
Top 5 Syndicated Lender Credit by Sector ($m)
Wind Solar
Biofuel, Biomass & Waste Geothermal, Marine, Small Hydro

8
ASSET FINANCE >> TOP 10 DEALS – BY TOTAL VALUE
RANK ASSET CLOSE SECTOR DEBT VALUE ($M) SPONSORS ($M CREDIT)
1 Galloper Offshore Wind Farm 30/10/2015 Wind 2,314.46 RWE (578.6); Green Investment Bank (578.6); Siemens (578.6); Macquarie
Capital (578.6)
2 Veja Mate Offshore Wind Farm 26/06/2015 Wind 2,140.54 Siemens (920.2); Copenhagen Infrastructure Partners K/S (0.2); Laidlaw Capital Group
(1219.9)
3 E.ON Rampion Offshore Wind Farm 18/05/2015 Wind 2,034.75 E.ON SE (1664.4); Green Investment Bank (370.3)
4 Invenergy North American Wind
Portfolio TerraForm Acquisition 16/12/2015 Wind 2,000.00 TerraForm Power (2000.0)
5 Nordsee 1 Offshore Wind Farm 19/03/2015 Wind 1,279.04 RWE AG (191.9); Northland Power (1087.2)
6 Ilangalethu Karoshoek Solar Valley
STEG Plant 20/02/2015 Solar 1,116.59
ACS Actividades de Construccion y Servicios SA (223.3); Industrial Development Corp
of South Africa (223.3); Public Investment Corp (223.3); Emvelo Holdings (167.5)
7 MeerWind Sud und Ost Offshore Wind
Farm Phase I Refinancing 16/12/2015 Wind 1,067.22 Blackstone Group (853.8)
8
Benedict First State Investment
Portugal Wind Farm Portfolio
Acquisition
26/11/2015 Wind 1,012.20 First State Wind Energy Investments (1012.2)
9 Xina Solar One STEG Plant 13/03/2015 Solar 887.96 Industrial Development Corp of South Africa (177.6); Inversion
Corporativa IC SA (355.2); Public Investment Corp (177.6)
10 Gode Wind I Offshore Wind Farm GIP
Acquisition 10/09/2015 Wind 879.87 Global Infrastructure Partners (879.9)

9
ASSET FINANCE >> SPONSORS
RANK
PREVIOUS
QUARTER
RANK
ORGANISATION COUNT CREDIT ($M) TABLE
SHARE (%)
PREVIOUS
QUARTER
SHARE (%)
TABLE SHARE
CHANGE (%)
1 13 TerraForm Power 12 3,148.4 2.79 1.30 1.49
2 1 China Guodian Corp 50 2,816.5 2.49 2.79 -0.30
3 3 China General Nuclear Power
Corp 25 2,365.9 2.09 2.24 -0.15
4 2 China Huaneng Group 34 2,192.5 1.94 2.42 -0.48
5 5 State Power Investment Corp 58 1,989.9 1.76 1.77 -0.01
6 9 Enel SpA 14 1,718.1 1.52 1.45 0.07
7 4 E.ON SE 4 1,695.2 1.50 1.96 -0.46
8 89 Sharp Corp 7 1,630.2 1.44 0.26 1.18
9 15 Green Investment Bank 8 1,620.8 1.44 1.20 0.24
10 7 China Datang Corp 27 1,509.5 1.34 1.67 -0.33
11 19 Siemens 3 1,498.8 1.33 1.06 0.27
12 6 NextEra Energy 13 1,462.1 1.29 1.69 -0.40
13 8 Shenhua Group 10 1,421.6 1.26 1.64 -0.38
14 16 NextEra Energy Partners 5 1,357.8 1.20 1.12 0.08
15 20 China Resources National Corp 20 1,306.7 1.16 1.05 0.11
16 10 United Photovoltaics Group 24 1,295.6 1.15 1.41 -0.26
17 11 Laidlaw Capital 1 1,219.9 1.08 1.41 -0.33
18 12 Northland Power 2 1,188.9 1.05 1.37 -0.32
19 17 China Three Gorges Corp 28 1,115.7 0.99 1.12 -0.13
20 14 Brookfield Asset Management 5 1,084.0 0.96 1.25 -0.29
63%
33%
3%
1%
Asset Finance Sponsor Breakdown by Sector
0.00
500.00
1,000.00
1,500.00
2,000.00
2,500.00
3,000.00
3,500.00
TerraFormPower Inc
ChinaGuodian Corp
ChinaGeneralNuclear
Power Corp
ChinaHuaneng
Group
State PowerInvestment
Corp
Top 5 Sponsor Credit by Sector ($m)
Wind Solar
Biofuel, Biomass & Waste Geothermal, Marine, Small Hydro

10
ASSET FINANCE >> LEGAL ADVISERS
RANK
PREVIOUS
QUARTER
RANK
ORGANISATION COUNT CREDIT ($M) TABLE
SHARE (%)
PREVIOUS
QUARTER
SHARE (%)
TABLE SHARE
CHANGE (%)
1 3 Linklaters 14 5,539.0 10.95 6.74 4.21
2 1 Clifford Chance 16 4,372.1 8.65 9.96 -1.31
3 2 Norton Rose Fulbright 24 4,012.6 7.94 9.73 -1.79
4 5 Milbank Tweed Hadley & McCloy 20 3,498.3 6.92 4.60 2.32
5 9 Chadbourne & Parke 9 3,427.4 6.78 3.30 3.48
6 4 CMS Hasche Sigle Verwaltungs 1 2,140.5 4.23 6.34 -2.11
7 25 White & Case 4 1,686.4 3.34 1.29 2.05
8 10 Watson Farley & Williams 8 1,622.3 3.21 3.17 0.04
9 6 Ashurst 6 1,451.3 2.87 3.63 -0.76
10 12 Latham & Watkins 5 1,244.5 2.46 3.13 -0.67
11 36 Skadden Arps Slate Meagher & Flom 2 1,180.4 2.33 0.53 1.80
12 7 Herbert Smith Freehills 7 1,172.8 2.32 3.47 -1.15
13 57 Orrick Herrington & Sutcliffe 3 1,141.4 2.26 0.00 2.26
14 8 Cliffe Dekker Hofmeyr 1 1,116.6 2.21 3.31 -1.10
15 10 Kromann Reumert 1 1,070.3 2.12 3.17 -1.05
16 17 Jones Day 2 1,016.6 2.01 2.42 -0.41
17 19 Eversheds 12 890.1 1.76 1.90 -0.14
18 13 Edward Nathan Sonnenbergs 1 888.0 1.76 2.63 -0.87
19 14 Webber Wentzel 3 872.3 1.73 2.58 -0.85
20 20 Stikeman Elliott 4 835.1 1.65 1.87 -0.22
73%
23%
4%
0%
Asset Finance Legal Adviser Breakdown by Sector
0.00
1,000.00
2,000.00
3,000.00
4,000.00
5,000.00
6,000.00
Linklaters CliffordChance
Norton RoseFulbright LLP
MilbankTweed Hadley
& McCloy
Chadbourne &Parke
Top 5 Legal Adviser Credit by Sector ($m)
Wind Solar
Biofuel, Biomass & Waste Geothermal, Marine, Small Hydro

11
ASSET FINANCE >> FINANCIAL ADVISERS
RANK
PREVIOUS
QUARTER
RANK
ORGANISATION COUNT CREDIT ($M) TABLE
SHARE (%)
PREVIOUS
QUARTER
SHARE (%)
TABLE SHARE
CHANGE (%)
1 7 Citigroup 4 2,805.6 12.92 6.04 6.88
2 1 Green Giraffe Capital Partners 3 2,453.1 11.30 18.38 -7.08
3 - BNP Paribas 1 2,314.5 10.66 - 10.66
4 2 Macquarie 11 2,302.8 10.60 17.25 -6.65
5 3 Ernst & Young 1 2,140.5 9.86 16.04 -6.18
6 5 Morgan Stanley 3 1,946.0 8.96 7.09 1.87
7 6 Goldman Sachs 2 1,838.0 8.46 6.28 2.18
8 4 Fieldstone Private Capital 1 1,116.6 5.14 8.36 -3.22
9 7 PricewaterhouseCoopers 2 1,031.1 4.75 6.04 -1.29
10 9 Marathon Capital 7 577.5 2.66 4.33 -1.67
11 - Dexia SA 2 443.4 2.04 - 2.04
12 - Temporis Capital 1 371.3 1.71 - 1.71
13 10 Evercore Partners 1 346.0 1.59 2.59 -1.00
14 11 Allianz SE 1 320.6 1.48 2.40 -0.92
15 - Credit Suisse 1 255.1 1.17 - 1.17
16 20 KeyCorp 2 209.0 0.96 0.00 0.96
16 - JPMorgan Chase 1 209.0 0.96 - 0.96
18 12 UBS Group 2 175.0 0.81 1.31 -0.50
19 13 Intercontinental Exchange 1 158.8 0.73 1.19 -0.46
20 18 KPMG 3 143.1 0.66 0.17 0.49
85%
13%
2%
Asset Finance Financial Adviser Breakdown by Sector
0.00
500.00
1,000.00
1,500.00
2,000.00
2,500.00
3,000.00
Citigroup Green GiraffeCapital
Partners BV
BNP Paribas Macquarie Ernst & Young
Top 5 Financial Adviser Credit by Sector ($m)
Wind Solar
Biofuel, Biomass & Waste Geothermal, Marine, Small Hydro

12
ASSET FINANCE >> TAX EQUITY
RANK
PREVIOUS
QUARTER
RANK
ORGANISATION COUNT CREDIT ($M) TABLE
SHARE (%)
PREVIOUS
QUARTER
SHARE (%)
TABLE SHARE
CHANGE (%)
1 2 Bank of America 12 1,252.6 34.65 29.42 5.23
2 1 Credit Suisse 4 950.0 26.28 35.70 -9.42
3 3 Citigroup 6 460.8 12.75 13.96 -1.21
4 4 Berkshire Hathaway 2 304.5 8.42 11.44 -3.02
5 5 Not Reported 7 284.6 7.87 3.49 4.38
6 9 General Electric 4 134.1 3.71 0.72 2.99
7 - Bank of New York 1 78.0 2.16 - 2.16
8 6 Mitsubishi UFJ Financial 4 68.5 1.90 2.20 -0.30
9 7 Cathay General Bancorp 1 37.5 1.04 1.41 -0.37
10 8 Seminole Finance 1 25.0 0.69 0.94 -0.25
11 9 Google 2 19.1 0.53 0.72 -0.19
12 11 MetLife 2 0.0 0.00 0.00 0.00
12 - US Bank 2 0.0 0.00 - 0.00
12 11 National Consumer Cooperative
Bank 1 0.0 0.00 0.00 0.00
12 11 Morgan Stanley 1 0.0 0.00 0.00 0.00
12 - Zions Bancorporation 1 0.0 0.00 - 0.00
12 11 Gardner Capital 1 0.0 0.00 0.00 0.00
50% 50%
Asset Finance Tax Equity Breakdown by Sector
0.00
200.00
400.00
600.00
800.00
1,000.00
1,200.00
1,400.00
Bank ofAmerica
Credit Suisse Citigroup BerkshireHathaway
Not Reported
Top 5 Tax Equity Credit by Sector ($m)
Wind Solar
Biofuel, Biomass & Waste Geothermal, Marine, Small Hydro

14
M&A >> TOP 10 DEALS
RANK TARGET CLOSE SECTOR VALUE ($M) ACQUIRERS ($M CREDIT)
1 E.ON 25/03/2015 Wind 2,731.0 Macquarie (2731.0)
2 First Wind Holdings 29/01/2015 Wind 1,898.0 SunEdison Inc (1898.0); TerraForm Power (1898.0)
3 Ormat Industries 15/02/2015 Geothermal 1,641.7 Ormat Technologies (1641.7)
4 NRG Energy 05/01/2015 Wind 1,226.0 NRG Energy (1226.0)
5 Finerge-Gestao de Projectos
Energeticos 26/11/2015 Wind 956.2 First State Wind Energy Investments (956.2)
6 Crystal Trust 22/05/2015 Biomass & Waste 575.5 Keppel Infrastructure Trust (575.5)
7 REC Solar 31/08/2015 Solar 462.0 China National Chemical Corp (462.0)
8 EGPNA Renewable Energy Partners 31/03/2015 Wind 440.0 General Electric (440.0)
9 Infigen Energy 29/10/2015 Wind 274.4 Primary Wind Power (274.4)
10 Recurrent Energy 31/03/2015 Solar 265.0 Canadian Solar (265.0)

15
M&A >> ACQUIRERS
64% 9%
7%
10%
3% 4% 3%
M&A Acquirers Breakdown by Sector
0.00
500.00
1,000.00
1,500.00
2,000.00
2,500.00
3,000.00
Macquarie SunEdison TerraFormPower
OrmatTechnologies
NRG Energy
Top 5 M&A Acquirer Credit by Sector ($m)
Efficiency: Built Environment, Digital Energy
Energy Storage, Fuel Cells
Electrified Transport
Geothermal, Marine, Small Hydro, Hydrogen
Biofuel, Biomass & Waste
Solar
Wind
RANK
PREVIOUS
QUARTER
RANK
ORGANISATION COUNT CREDIT ($M) TABLE
SHARE (%)
PREVIOUS
QUARTER
SHARE (%)
TABLE SHARE
CHANGE (%)
1 1 Macquarie 1 2,731.0 16.47 18.81 -2.34
2 2 SunEdison 3 1,898.0 11.44 13.07 -1.63
2 2 TerraForm Power 2 1,898.0 11.44 13.07 -1.63
4 4 Ormat Technologies 1 1,641.7 9.90 11.31 -1.41
5 5 NRG Energy 1 1,226.0 7.39 8.44 -1.05
6 - First State Wind Energy Investments 1 956.2 5.77 - 5.77
7 8 General Electric 3 605.0 3.65 3.03 0.62
8 6 Keppel Infrastructure Trust 1 575.5 3.47 3.96 -0.49
9 7 China National Chemical 1 462.0 2.79 3.18 -0.39
10 - Primary Wind Power 1 274.4 1.65 - 1.65
11 9 Canadian Solar 1 265.0 1.60 1.83 -0.23
12 10 Acuity Brands 1 255.3 1.54 1.76 -0.22
13 11 Zhongmin Energy 1 235.5 1.42 1.62 -0.20
14 12 First Wind Holdings 1 223.3 1.35 1.54 -0.19
15 13 Engie 2 222.7 1.34 1.53 -0.19
16 14 China Baoan 1 210.1 1.27 1.45 -0.18
17 15 Tianjin Binhai Hi-tech Industrial
Development 1 200.0 1.21 1.38 -0.17
17 15 Beijing State Research Information
Technology 1 200.0 1.21 1.38 -0.17
19 17 CHS 1 196.0 1.18 1.35 -0.17
20 18 Sembcorp Industries 1 170.1 1.03 1.17 -0.14

16
● For data submissions or queries, please contact:
VENTURE CAPITAL/
PRIVATE EQUITY VENTURE CAPITAL/
PRIVATE EQUITY

17
VC/PE >> TOP 10 DEALS
RANK TARGET CLOSE SECTOR VALUE ($M) INVESTORS ($M CREDIT)
1 Senvion 22/01/2015 Wind 1,138.00 Centerbridge Partners (1138.0)
2 NextEV 17/09/2015 Electrified Transport 500.00 Hillhouse Capital Management (166.7); Sequoia Capital Operations (166.7);
Yuyue Capital (166.7)
3 TerraForm Global 09/06/2015 Solar 403.00
Glenview Capital Management (67.2); Baron Capital (67.2); IBERIABANK Asset
Management (67.2); Capricorn Investment Group (67.2); Zimmer Partners (67.2);
General Electric (67.2)
4 Sunnova Energy 22/10/2015 Solar 300.00 Triangle Peak Partners (150.0); Franklin Square Capital Partners (150.0)
5 Suzlon Energy 13/02/2015 Wind 289.00 None Disclosed
6 ReNew Power Ventures 27/10/2015 Wind 265.00 GEF Management Corp (88.3); Abu Dhabi Investment Authority (88.3); Goldman
Sachs (88.3)
7 Greenko 20/11/2015 Wind 246.70 GIC (246.7)
8 Ostro Energy 11/02/2015 Wind 230.00 Actis (230.0)
9 EREN Renewable Energy 12/10/2015 Solar 228.00 Next World Capital (76.0); Tikehau Capital Advisors SAS (76.0); Bpifrance
nvestissement (76.0)
10 Globeleq Generation 02/03/2015 Wind 225.00 Norfund (225.0)
18
VC/PE >> INVESTORS BY CREDIT
35%
36%
7%
1%
8%
4%
9%
VC/PE Investors Breakdown by Sector RANK
PREVIOUS
QUARTER
RANK
ORGANISATION COUNT CREDIT ($M)
TABLE
SHARE
(%)
PREVIOUS
QUARTER
SHARE (%)
TABLE SHARE
CHANGE (%)
1 1 Centerbridge Partners 1 1,138.0 17.38 22.92 -5.54
2 - GIC Pte Ltd 1 246.7 3.77 - 3.77
3 2 Actis 1 230.0 3.51 5.04 -1.53
4 3 Norfund 1 225.0 3.44 4.53 -1.09
5 4 Egyptian Financial Group-Hermes 1 208.0 3.18 4.19 -1.01
6 10 General Electric 7 196.0 2.99 1.78 1.21
7 5 Sequoia Capital Operations 1 166.7 2.55 3.36 -0.81
7 5 Hillhouse Capital 1 166.7 2.55 3.36 -0.81
7 5 Yuyue Capital 1 166.7 2.55 3.36 -0.81
10 - Triangle Peak Partners 1 150.0 2.29 - 2.29
10 - Franklin Square Capital 1 150.0 2.29 - 2.29
12 8 Hudson Clean Energy Partners 2 145.0 2.21 2.92 -0.71
13 9 Integrated Asset Management 1 115.4 1.76 2.32 -0.56
14 - Goldman Sachs 1 88.3 1.35 - 1.35
14 - GEF Management 1 88.3 1.35 - 1.35
14 - Abu Dhabi Investment Authority 1 88.3 1.35 - 1.35
17 72 Bpifrance Investissement 3 84.2 1.29 0.16 1.13
18 - Asian Development Bank 1 82.5 1.26 - 1.26
19 13 RWE 3 82.2 1.25 1.57 -0.32
20 110 Next World Capital 2 80.6 1.23 0.09 1.14
0.00
500.00
1,000.00
1,500.00
CenterbridgePartners
GIC Pte Actis Norfund EgyptianFinancial
Group-Hermes
Top 5 VC/PE Investors Credit by Sector ($m)
Efficiency: Built Environment, Digital EnergyEnergy Storage, Fuel CellsElectrified TransportGeothermal, Marine, Small Hydro, HydrogenBiofuel, Biomass & WasteSolarWind

19
VC/PE >> INVESTORS BY DEAL COUNT
35%
36%
7%
1%
8%
4%
9%
VC/PE Investors Breakdown by Sector RANK ORGANISATION COUNT CREDIT ($M)
TABLE
SHARE
(%)
PREVIOUS
QUARTER
SHARE (%)
TABLE SHARE
CHANGE (%)
1 350 Investment Partners 14 3.7 0.06 0.03 0.03
2 Demeter Partners 10 10.1 0.15 0.14 0.01
3 General Electric 7 196.0 2.99 1.78 1.21
4 Chrysalix Energy 6 15.2 0.23 0.31 -0.08
5 RockPort Capital Partners 5 27.3 0.42 0.25 0.17
5 Engie SA 5 23.6 0.36 0.47 -0.11
5 DBL Investors 5 20.1 0.31 0.30 0.01
8 Kleiner Perkins Caufield & Byers 4 32.6 0.50 0.52 -0.02
8 Total 4 30.4 0.47 0.61 -0.14
8 E.ON SE 4 21.9 0.33 0.36 -0.03
11 Bpifrance Investissement 3 84.2 1.29 0.16 1.13
11 RWE 3 82.2 1.25 1.57 -0.32
11 Generation Investment Management 3 27.9 0.43 0.04 0.39
11 Tsing Capital 3 23.5 0.36 0.25 0.11
11 Sofinnova Partners 3 15.5 0.24 0.31 -0.07
11 Khosla Ventures 3 13.2 0.20 0.05 0.15
11 I2BF Capital Advisors 3 9.8 0.15 0.20 -0.05
11 Obvious Management Services 3 8.0 0.12 0.09 0.03
19 Hudson Clean Energy Partners 2 145.0 2.21 2.92 -0.71
19 Next World Capital 2 80.6 1.23 0.09 1.14
0.00
50.00
100.00
150.00
200.00
250.00
300.00
350.00
400.00
450.00
350InvestmentPartners
DemeterPartners
GeneralElectric
ChrysalixEnergy
RockPortCapital
Partners
Top 5 VC/PE (Count) Credit by Sector ($m)
Efficiency: Built Environment, Digital EnergyEnergy Storage, Fuel CellsElectrified TransportGeothermal, Marine, Small Hydro, HydrogenBiofuel, Biomass & WasteSolarWind

21
ACQUISITION ADVISERS >> TOP 10 DEALS
RANK TARGET CLOSE SECTOR VALUE ($M) FINANCIAL ADVISERS ($M CREDIT) LEGAL ADVISERS ($M CREDIT)
1 E.ON 25/03/2015 Wind 2,731.0 Macquarie (910.3); JPMorgan Chase (910.3); Evercore Partners
(910.3) Linklaters (2731.0)
2 First Wind Holdings 29/01/2015 Wind 1,898.0
Marathon Capital (949.0); Citigroup (379.6); Lazard (379.6);
Morgan Stanley (379.6); Bank of America (379.6); Goldman
Sachs (949.0); Barclays Bank (379.6)
Cleary Gottlieb Steen & Hamilton (1898.0); Orrick
Herrington & Sutcliffe (949.0); Davis Polk & Wardwell
(949.0)
3 Ormat Industries 15/02/2015 Geothermal 1,641.7 JPMorgan Chase (1641.7) Davis Polk & Wardwell (1641.7)
4 NRG Energy 05/01/2015 Wind 1,226.0 Moelis & Co (1226.0) None Disclosed
5 Senvion 22/01/2015 Wind 1,138.0 Citigroup (1138.0) None Disclosed
6 Finerge-Gestao de Projectos
Energeticos 26/11/2015 Wind 956.2 Grupo Santander (956.2) None Disclosed
7 Crystal Trust 22/05/2015 Biomass & Waste 575.5 Credit Suisse (575.5); DBS Group Holdings (287.8); Morgan
Stanley (287.8) Allen & Gledhill (575.5); WongPartnership (575.5)
8 NextEV 17/09/2015 Electrified
Transport 500.0 None Disclosed None Disclosed
9 REC Solar 31/08/2015 Solar 462.0 Nomura Holdings (462.0); DNB (462.0)
Thommessen Krefting Greve Lund (154.0);
Advokatfirmaet Schjodt (462.0); Shook Lin & Bok
(154.0); Advokatfirmaet Thommessen (154.0)
10 EGPNA Renewable Energy 31/03/2015 Wind 440.00 Goldman Sachs (440.0) Chadbourne & Parke (440.0)

22
M&A AND VC/PE >> FINANCIAL ADVISERS
67%
11%
9%
10%
0%
3%
M&A and VC/PE Financial Adviser Breakdown by Sector RANK
PREVIOUS
QUARTER
RANK
ORGANISATION COUNT CREDIT ($M) TABLE
SHARE (%)
PREVIOUS
QUARTER
SHARE (%)
TABLE SHARE
CHANGE (%)
1 1 JPMorgan Chase 3 2,552.0 14.08 16.45 -2.37
2 3 Goldman Sachs 3 1,521.5 8.40 8.95 -0.55
3 4 Moelis & Co 2 1,226.0 6.77 7.90 -1.13
4 5 Marathon Capital 5 1,029.0 5.68 6.63 -0.95
5 - Grupo Santander 1 956.2 5.28 - 5.28
6 6 Macquarie 1 910.3 5.02 5.87 -0.85
6 6 Evercore Partners 1 910.3 5.02 5.87 -0.85
8 8 Credit Suisse 2 840.5 4.64 5.42 -0.78
9 2 Citigroup 4 833.2 4.60 10.26 -5.66
10 9 Morgan Stanley 3 775.4 4.28 5.00 -0.72
11 10 Nomura Holdings 3 574.5 3.17 3.70 -0.53
12 11 DNB 1 462.0 2.55 2.98 -0.43
13 23 Deutsche Bank 2 453.6 2.50 0.48 2.02
14 12 Bank of America 1 379.6 2.09 2.45 -0.36
14 12 Lazard 1 379.6 2.09 2.45 -0.36
14 12 Barclays Bank 1 379.6 2.09 2.45 -0.36
17 - Arpwood Capital 1 379.3 2.09 - 2.09
18 17 Greentech Capital Advisors 5 291.8 1.61 1.49 0.12
19 15 DBS Group 1 287.8 1.59 1.85 -0.26
20 - ICICI Bank 1 265.0 1.46 - 1.46
0.00
500.00
1,000.00
1,500.00
2,000.00
2,500.00
3,000.00
JPMorganChase
Goldman Sachs Moelis & Co MarathonCapital LLC
GrupoSantander
Top 5 Financial Adviser Credit by Sector ($m)
Digital Energy, Efficiency: Built Environment, Industry, Supply Side
Energy Storage, Fuel Cells
Electrified Transport
Geothermal, Marine, Small Hydro, Hydrogen
Biofuel, Biomass & Waste
Solar
Wind

23
M&A AND VC/PE >> LEGAL ADVISERS
RANK
PREVIOUS
QUARTER
RANK
ORGANISATION COUNT CREDIT ($M) TABLE
SHARE (%)
PREVIOUS
QUARTER
SHARE (%)
TABLE SHARE
CHANGE (%)
1 1 Linklaters 1 2,731.0 16.04 19.50 -3.46
2 2 Davis Polk & Wardwell 2 2,590.7 15.22 18.50 -3.28
3 3 Cleary Gottlieb Steen & Hamilton 1 1,898.0 11.15 13.55 -2.40
4 4 Orrick Herrington & Sutcliffe 1 949.0 5.57 6.78 -1.21
5 18 AZB & Partners 4 872.9 5.13 1.29 3.84
6 5 Wong Partnership 1 575.5 3.38 4.11 -0.73
6 5 Allen & Gledhill 1 575.5 3.38 4.11 -0.73
8 - Weil Gotshal & Manges 1 569.0 3.34 - 3.34
9 7 Advokatfirmaet Schjodt 1 462.0 2.71 3.30 -0.59
10 8 Chadbourne & Parke 1 440.0 2.58 3.14 -0.56
11 10 O'Melveny & Myers 3 315.0 1.85 1.89 -0.04
12 9 DLA Piper 3 285.0 1.67 2.03 -0.36
13 38 Shearman & Sterling 2 274.9 1.61 0.07 1.54
14 - Latham & Watkins 2 274.4 1.61 - 1.61
15 10 Foley & Lardner 1 265.0 1.56 1.89 -0.33
15 - Cyril Amarchand Mangaldas 1 265.0 1.56 - 1.56
17 12 Stikeman Elliott 1 255.3 1.50 1.82 -0.32
18 13 Jingtian & Gongcheng 1 235.5 1.38 1.68 -0.30
19 - White & Case 1 228.0 1.34 - 1.34
20 14 Freshfields Bruckhaus Deringer 2 222.7 1.31 1.59 -0.28
61% 14%
9%
10%
0%
3% 3%
M&A and VC/PE Legal Adviser Breakdown by Sector
0.00
1,000.00
2,000.00
3,000.00
Linklaters Davis Polk &Wardwell
ClearyGottlieb Steen
& Hamilton
OrrickHerrington &
Sutcliffe
AZB &Partners
Top 5 Legal Adviser Credit by Sector ($m)
Digital Energy, Efficiency: Built Environment, Industry, Supply Side
Energy Storage, Fuel Cells
Electrified Transport
Geothermal, Marine, Small Hydro, Hydrogen
Biofuel, Biomass & Waste
Solar
Wind

24
● For data submissions or queries, please contact:
PUBLIC MARKETS PUBLIC MARKETS

25
PUBLIC MARKETS >> TOP 10 DEALS
RANK ORGANISATION CLOSE SECTOR VALUE ($M) LEAD MANAGERS ($M CREDIT) CO-LEAD MANAGERS ($M CREDIT) LEGAL ADVISERS ($M CREDIT)
1 Tesla Motors 14/08/2015 Electrified
Transport 750.0 Goldman Sachs (750.0)
JPMorgan Chase (250.0); Morgan Stanley
(250.0); Deutsche Bank (250.0)
Simpson Thacher & Bartlett (750.0);
Wilson Sonsini Goodrich & Rosati
(750.0)
2 TerraForm Power 18/06/2015 Solar 688.3 Morgan Stanley (688.3)
Citigroup (114.7); Bank of America (114.7);
JPMorgan Chase (114.7); Barclays (114.7);
UBS Group (114.7); Macquarie (114.7)
Latham & Watkins (688.3); Skadden
Arps Slate Meagher & Flom (688.3)
3 TerraForm Global 31/07/2015 Solar 675.0 JPMorgan Chase (675.0)
Citigroup (112.5); Morgan Stanley (112.5);
Bank of America (112.5); Goldman Sachs
(112.5); Barclays (112.5); Deutsche Bank
(112.5)
Latham & Watkins (675.0); Kirkland &
Ellis (675.0)
4 SunEdison 21/08/2015 Solar 650.0 Goldman Sachs (650.0)
JPMorgan Chase (162.5); Bank of America
(162.5); Deutsche Bank (162.5); Macquarie
(162.5)
None Disclosed
5 NRG Yield 23/06/2015 Solar 620.4 Goldman Sachs (620.4)
Citigroup (103.4); Morgan Stanley (103.4);
Bank of America (103.4); JPMorgan Chase
(103.4); Credit Suisse (103.4); RBC Capital (103.4)
Latham & Watkins (620.4); Ballard
Spahr (620.4)
6 Sanan Optoelectronics 14/12/2015 Solar 543.7 Sinolink Securities (543.7) None Disclosed Hubei Zhengxin (543.7)
7 Abengoa Yield 14/05/2015 Solar 536.1 None Disclosed None Disclosed None Disclosed
8 Saeta Yield 16/02/2015 Wind 502.9 None Disclosed
Citigroup (100.6); Banco Santander (100.6);
Societe Generale (100.6); HSBC (100.6);
Bank of America (100.6)
Clifford Chance (502.9); Linklaters
(502.9)
9 SunEdison 27/01/2015 Solar 460.0 None Disclosed Morgan Stanley (115.0); Goldman Sachs (115.0);
Barclays (115.0); Macquarie (115.0)
Latham & Watkins (460.0); Skadden
Arps Slate Meagher & Flom (460.0)
10 SunEdison 20/05/2015 Solar 450.0 None Disclosed
Royal Bank of Canada (40.9); Wells Fargo & Co
(40.9); Citigroup (40.9); KeyCorp (40.9); Morgan
Stanley (40.9); Goldman Sachs (40.9); Barclays
(40.9); Deutsche Bank (40.9); BBVA (40.9); Credit
Suisse (40.9); Macquarie (40.9)
Latham & Watkins (450.0); Skadden
Arps Slate Meagher & Flom (450.0)

26
PUBLIC MARKETS >> LEAD MANAGERS
17%
67%
5%
8%
1% 2%
Public Markets Lead Manager Breakdown by Sector
RANK
PREVIOUS
QUARTER
RANK
ORGANISATION COUNT CREDIT ($M) TABLE
SHARE (%)
PREVIOUS
QUARTER
SHARE (%)
TABLE SHARE
CHANGE (%)
1 1 Goldman Sachs 7 3,272.8 34.77 35.31 -0.54
2 2 Morgan Stanley 3 1,178.6 12.52 14.49 -1.97
3 4 Barclays 4 915.9 9.73 7.10 2.63
4 3 JPMorgan Chase 1 675.0 7.17 8.30 -1.13
5 - Sinolink Securities 1 543.7 5.78 - 5.78
6 5 Bank of Montreal 2 350.0 3.72 4.30 -0.58
7 6 Credit Suisse 2 280.6 2.98 3.45 -0.47
8 7 Deutsche Bank 1 262.0 2.78 3.22 -0.44
9 12 Citigroup 2 234.1 2.49 2.02 0.47
10 9 Wells Fargo & Co 1 217.8 2.31 2.68 -0.37
11 10 Bank of America 2 205.8 2.19 2.53 -0.34
12 11 Canadian Imperial Bank of Commerce 1 180.9 1.92 2.22 -0.30
13 13 HSBC 1 148.2 1.57 1.82 -0.25
14 - China Securities Co 1 124.7 1.32 - 1.32
15 - Joh Berenberg Gossler & Co 1 116.2 1.23 - 1.23
16 15 National Bank of Canada 1 104.5 1.11 1.28 -0.17
17 - Kingston Financial Group 1 74.6 0.79 - 0.79
18 20 Oppenheimer Holdings 3 59.4 0.63 0.63 0.00
19 17 Dr August Oetker 1 56.4 0.60 0.69 -0.09
20 18 Stifel Financial 1 55.2 0.59 0.68 -0.09
0.00
500.00
1,000.00
1,500.00
2,000.00
2,500.00
3,000.00
3,500.00
GoldmanSachs
MorganStanley
Barclays JPMorganChase
SinolinkSecurities
Top 5 Lead Manager Credit by Sector ($m)
Digital Energy, Efficiency: Built Environment, Industry, Supply Side
Energy Storage, Fuel Cells
Electrified Transport
Geothermal, Marine, Small Hydro, Hydrogen
Biofuel, Biomass & Waste
Solar
Wind

27
PUBLIC MARKETS >> CO-LEAD MANAGERS
RANK
PREVIOUS
QUARTER
RANK
ORGANISATION COUNT CREDIT ($M) TABLE
SHARE (%)
PREVIOUS
QUARTER
SHARE (%)
TABLE SHARE
CHANGE (%)
1 1 Bank of America 14 1,166.1 11.06 11.92 -0.86
2 2 Morgan Stanley 13 1,060.4 10.05 10.84 -0.79
3 3 Citigroup 13 1,008.4 9.56 10.31 -0.75
4 4 Deutsche Bank 8 990.1 9.39 8.76 0.63
5 5 JPMorgan Chase 7 821.0 7.79 8.39 -0.60
6 6 Macquarie 10 714.8 6.78 7.31 -0.53
7 7 Goldman Sachs 9 638.7 6.06 6.53 -0.47
8 8 Barclays 9 629.9 5.97 6.44 -0.47
9 9 Royal Bank of Canada 9 591.5 5.61 5.68 -0.07
10 11 Canaccord Genuity Group 5 289.3 2.74 2.35 0.39
11 10 Credit Suisse 5 271.9 2.58 2.78 -0.20
12 14 Leucadia National Corp 4 242.1 2.30 1.87 0.43
13 17 Credit Agricole 2 238.3 2.26 1.07 1.19
14 12 Banco Santander 2 209.9 1.99 2.15 -0.16
14 12 HSBC 2 209.9 1.99 2.15 -0.16
16 15 RBC Capital 2 166.1 1.57 1.70 -0.13
17 - Mizuho Financial 1 133.3 1.26 - 1.26
18 16 UBS Group 1 114.7 1.09 1.17 -0.08
19 21 Stifel Financial 3 113.3 1.07 0.86 0.21
20 18 Societe Generale 1 100.6 0.95 1.03 -0.08
22%
66%
4%
7%
1%
Public Market Co-Lead Manager Breakdown by Sector
0.00
200.00
400.00
600.00
800.00
1,000.00
1,200.00
1,400.00
Bank ofAmerica
MorganStanley
Citigroup Deutsche Bank JPMorganChase
Top 5 Co-Lead Manager Credit by Sector ($m)
Digital Energy, Efficiency: Built Environment, Industry, Supply Side
Energy Storage, Fuel Cells
Electrified Transport
Geothermal, Marine, Small Hydro, Hydrogen
Biofuel, Biomass & Waste
Solar
Wind

28
PUBLIC MARKETS >> LEGAL ADVISERS
RANK
PREVIOUS
QUARTER
RANK
ORGANISATION COUNT CREDIT ($M) TABLE
SHARE (%)
PREVIOUS
QUARTER
SHARE (%)
TABLE SHARE
CHANGE (%)
1 1 Latham & Watkins 11 4,529.2 24.30 25.04 -0.74
2 2 Skadden Arps Slate Meagher & Flom 8 2,756.6 14.79 15.17 -0.38
3 3 Vinson & Elkins 5 1,113.0 5.97 6.31 -0.34
4 4 Davis Polk & Wardwell 5 1,041.6 5.59 5.91 -0.32
5 5 Wilson Sonsini Goodrich & Rosati 2 1,000.6 5.37 5.68 -0.31
6 6 Linklaters 2 830.9 4.46 4.71 -0.25
7 7 Kirkland & Ellis 3 821.0 4.41 4.66 -0.25
8 8 Simpson Thacher & Bartlett 1 750.0 4.02 4.26 -0.24
9 9 Hogan Lovells 5 635.9 3.41 3.61 -0.20
10 10 Ballard Spahr 1 620.4 3.33 3.52 -0.19
11 - Hubei Zhengxin 1 543.7 2.92 - 2.92
12 11 Clifford Chance 1 502.9 2.70 2.85 -0.15
13 12 Baker Botts 2 427.8 2.30 2.43 -0.13
14 16 Norton Rose Fulbright 5 385.0 2.07 1.03 1.04
15 13 Torys 2 238.0 1.28 1.35 -0.07
16 16 Carey Olsen 4 204.1 1.10 1.03 0.07
17 14 Osler Hoskin & Harcourt 1 180.9 0.97 1.03 -0.06
18 18 Blake Cassels & Graydon 1 175.5 0.94 1.00 -0.06
19 19 Andrews Kurth 1 172.5 0.93 0.98 -0.05
20 20 Khaitan & Co 1 167.0 0.90 0.95 -0.05
24%
61%
5%
8%
2%
Public Markets Legal Adviser Breakdown by Sector
0.00
500.00
1,000.00
1,500.00
2,000.00
2,500.00
3,000.00
3,500.00
4,000.00
4,500.00
5,000.00
Latham &Watkins
Skadden ArpsSlate Meagher
& Flom
Vinson &Elkins
Davis Polk &Wardwell LLP
Wilson SonsiniGoodrich &Rosati PC
Top 5 Legal Adviser Credit by Sector ($m)
Digital Energy, Efficiency: Built Environment, Industry, Supply Side
Energy Storage, Fuel Cells
Electrified Transport
Geothermal, Marine, Small Hydro, Hydrogen
Biofuel, Biomass & Waste
Solar
Wind
29
● For data submissions or queries, please contact:
PUBLIC MARKETS WAREHOUSE
FINANCING

30
WAREHOUSE FINANCE >> PROJECT FINANCING FACILITY
Warehouse Facilities gained popularity in 2015 as a
new means of financing the construction and/or
acquisition of clean energy assets. The warehouse
financing vehicle allows similar assets to be
grouped or “warehoused” together while they move
through the construction pipeline. Once completed,
the assets are moved out of the warehouse facility
and dropped down to a yieldco affiliate.
The largest such example (as highlighted in the
table) of 2015 was the $1.5bn SunEdison First
Reserve Private Warehouse Facility. The facility will
be used to finance the build-out of wind and solar
PV generation projects developed by SunEdison,
expected to be dropped down into TerraForm
Power.
The facility consists of a $466m five year term loan,
a $550m four year revolver as well as $500m in
equity commitments.
FACILITY CLOSE VALUE ($M) LEAD ARRANGERS SPONSORS
SunEdison First Reserve
Private Warehouse 06/05/2015 1,516.0
Bank of America (structuring adviser);
Goldman Sachs; Citigroup; Macquarie;
Morgan Stanley; Barclays; General
Electric; Rabobank; OneWest Bank;
Hannon Armstrong Capital; Keybank
National Association; Suntrust Robinson
Humphrey; Deutsche Bank
First Reserve (500.0)
31
GUIDELINES
ACCURACY
Due to the dynamic nature of the BNEF online product, league table rankings may vary between this release and data found on the BNEF website
following the release date. BNEF Clean Energy League Tables represent only transactions that are executed and about which BNEF has been notified.
BNEF does all it can to guarantee the accuracy of deal input data. Organisations are recommended to contact the league table team directly prior to
quarterly publication to ensure that all applicable deals are correctly reflected in the BNEF database.
SUBMISSIONS
Three weeks prior to the quarter/year end, all missing submissions for the quarter/year end must be submitted. Participants should also notify BNEF of
all deals expected to close within the final two weeks of the quarter/year end, and must provide subsequent confirmation of the closing date, prior to the
BNEF League Tables being locked.
Preliminary tables are provided two weeks prior to quarter end for all participants. Any data feedback received following publication of the Q1 to Q4
league tables will be rectified in the following quarter’s publication only.
Any time prior to the final submission deadline, at the participant’s request, a full inventory of only that participant’s submissions can be sent out for
review. Submissions will be accepted if received prior to the final week of the quarter. Any information received after this time may not be included in the
final league table publication but will be updated on the BNEF database.
BNEF reserves the right of final decision concerning league table eligibility and requires adequate documentation for the same. Bloomberg LP and its
suppliers believe the information herein was obtained from reliable sources, but do not guarantee its accuracy. Neither the information nor the opinion
expressed constitutes a solicitation of the purchase or sale of securities or commodities.
ACCURACY CLAIMS & ENQUIRIES
All league table participants have the right to examine the accuracy of league table data as published on the BNEF website. All accuracy claims and
inquiries must be submitted in writing and with adequate explanation and documentation. BNEF will investigate all accuracy claims and inquiries in a
timely manner, but cannot assure completion of its investigation by the respective league table deadlines.

32
This publication is the copyright of Bloomberg New Energy Finance. No portion of this document may be photocopied,
reproduced, scanned into an electronic system or transmitted, forwarded or distributed in any way without prior consent of
Bloomberg New Energy Finance.
The information contained in this publication is derived from carefully selected sources we believe are reasonable. We do
not guarantee its accuracy or completeness and nothing in this document shall be construed to be a representation of such
a guarantee. Any opinions expressed reflect the current judgment of the author of the relevant article or features, and does
not necessarily reflect the opinion of Bloomberg New Energy Finance, Bloomberg Finance L.P., Bloomberg L.P. or any of
their affiliates ("Bloomberg"). The opinions presented are subject to change without notice. Bloomberg accepts no
responsibility for any liability arising from use of this document or its contents. Nothing herein shall constitute or be
construed as an offering of financial instruments, or as investment advice or recommendations by Bloomberg of an
investment strategy or whether or not to "buy," "sell" or "hold" an investment.
COPYRIGHT AND DISCLAIMER
8 April 2015

Subscription-based news, data and analysis to support
your decisions in clean energy, power and water and the
carbon markets
MARKETS Renewable Energy
Energy Smart Technologies
Advanced Transport
Gas
Carbon and RECs
SERVICES Americas Service
Asia Pacific Service
EMEA Service
Applied Research
Events and Workshops
Jonathan Gardiner


