CLEAN ENERGY PROJECT ANALYSIS:RETSCREEN® ENGINEERING & CASES TEXTBOOK
DisclaimerThis publication is distributed for informational purposes only and does not necessarily reflect the views of the Government of Canada nor constitute an endorsement of any commercial product or person. Neither Canada, nor its ministers, officers, employees and agents makeany warranty in respect to this publication nor a s s u m e a n y l i a b i l i t y a r i s i n g o u t o f t h i s publication.
SOLAR AIR HEATING PROJECT ANALYSIS CHAPTERClean Energy Project Analysis: RETScreen® Engineering & Cases is an electronic textbook for professionals and univer-sity students. This chapter covers the analysis of potential solar air heating projects using the RETScreen® International Clean Energy Project Analysis Software, including a technology background and a detailed description of the algorithms found in the RETScreen® Software. A collection of project case studies, with assignments, worked-out solutions and information about how the projects fared in the real world, is available at the RETScreen® International Clean Energy Decision Support Centre Website www.retscreen.net.
1 SOLAR AIR HEATING BACKGROUND1
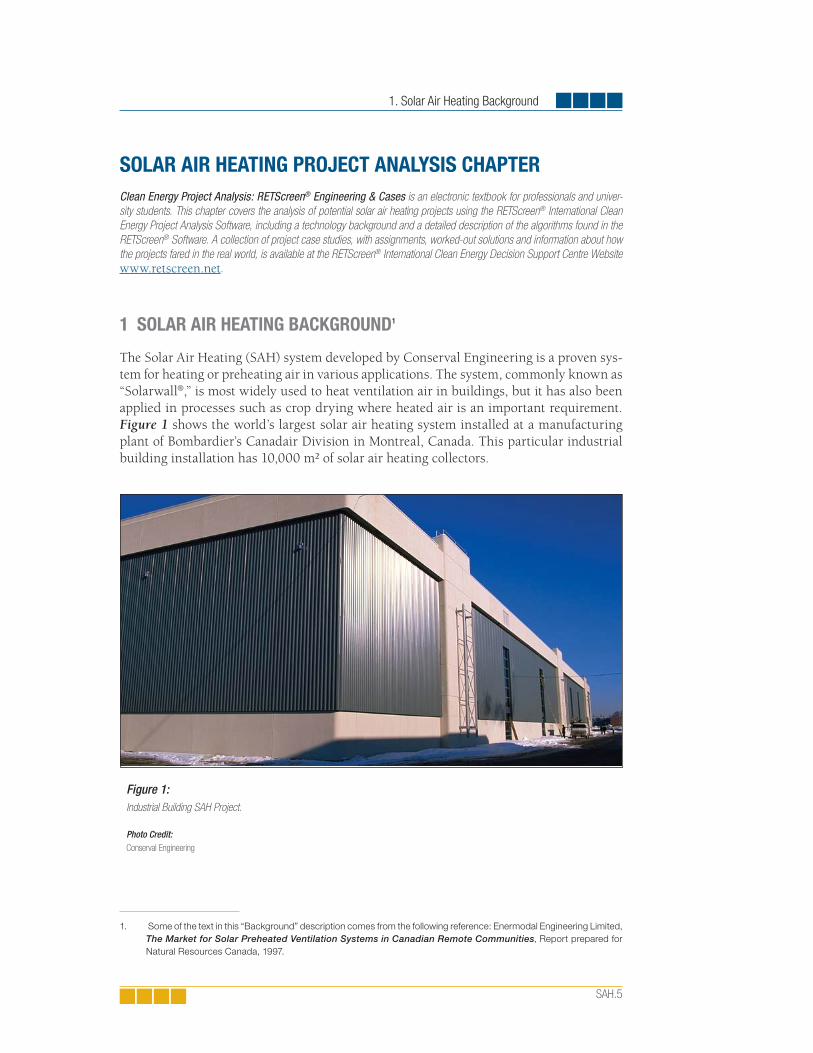
The Solar Air Heating (SAH) system developed by Conserval Engineering is a proven sys-tem for heating or preheating air in various applications. The system, commonly known as “Solarwall®,” is most widely used to heat ventilation air in buildings, but it has also been applied in processes such as crop drying where heated air is an important requirement. Figure 1 shows the world’s largest solar air heating system installed at a manufacturing plant of Bombardier’s Canadair Division in Montreal, Canada. This particular industrial building installation has 10,000 m² of solar air heating collectors.
Figure 1:Industrial Building SAH Project.
Photo Credit: Conserval Engineering
1. Some of the text in this “Background” description comes from the following reference: Enermodal Engineering Limited, The Market for Solar Preheated Ventilation Systems in Canadian Remote Communities, Report prepared for Natural Resources Canada, 1997.
Solar Air Heating Project Analysis Chapter
SAH.6
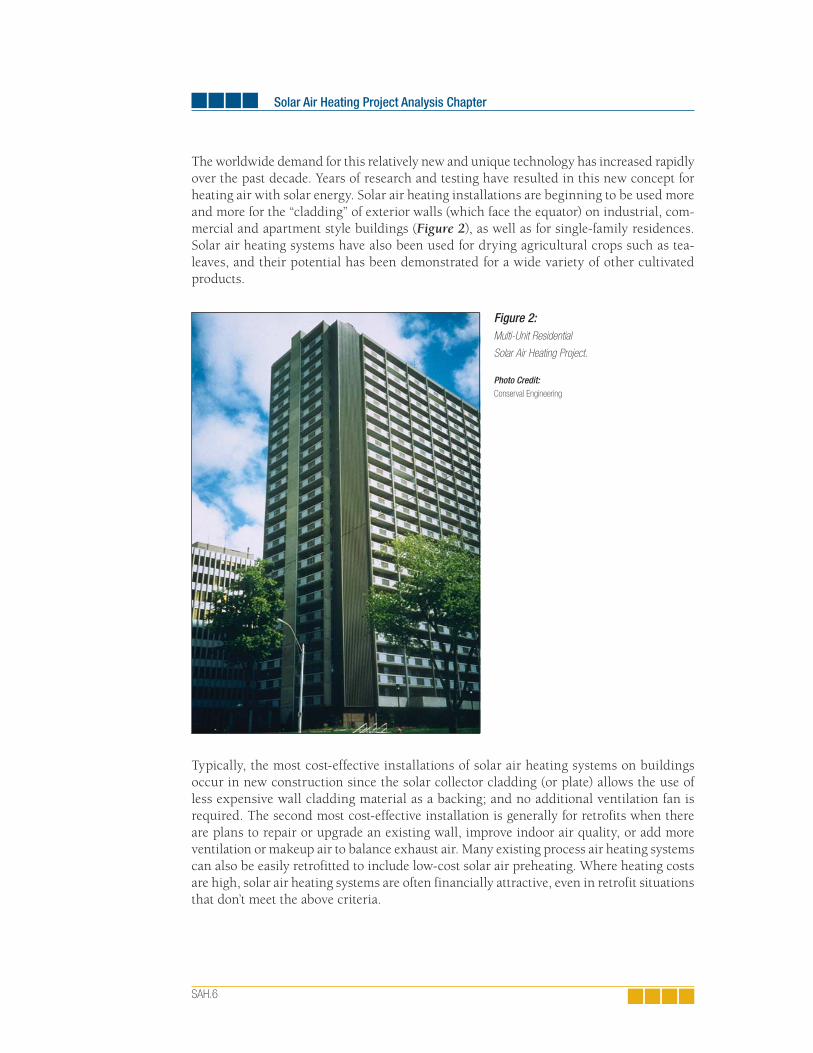
The worldwide demand for this relatively new and unique technology has increased rapidly over the past decade. Years of research and testing have resulted in this new concept for heating air with solar energy. Solar air heating installations are beginning to be used more and more for the “cladding” of exterior walls (which face the equator) on industrial, com-mercial and apartment style buildings (Figure 2), as well as for single-family residences. Solar air heating systems have also been used for drying agricultural crops such as tea-leaves, and their potential has been demonstrated for a wide variety of other cultivated products.
Typically, the most cost-effective installations of solar air heating systems on buildings occur in new construction since the solar collector cladding (or plate) allows the use of less expensive wall cladding material as a backing; and no additional ventilation fan is required. The second most cost-effective installation is generally for retrofits when there are plans to repair or upgrade an existing wall, improve indoor air quality, or add more ventilation or makeup air to balance exhaust air. Many existing process air heating systems can also be easily retrofitted to include low-cost solar air preheating. Where heating costs are high, solar air heating systems are often financially attractive, even in retrofit situations that don’t meet the above criteria.
Figure 2:Multi-Unit Residential
Solar Air Heating Project.
Photo Credit: Conserval Engineering
1. Solar Air Heating Background
SAH.7
1.1 Description of Solar Air Heating Systems
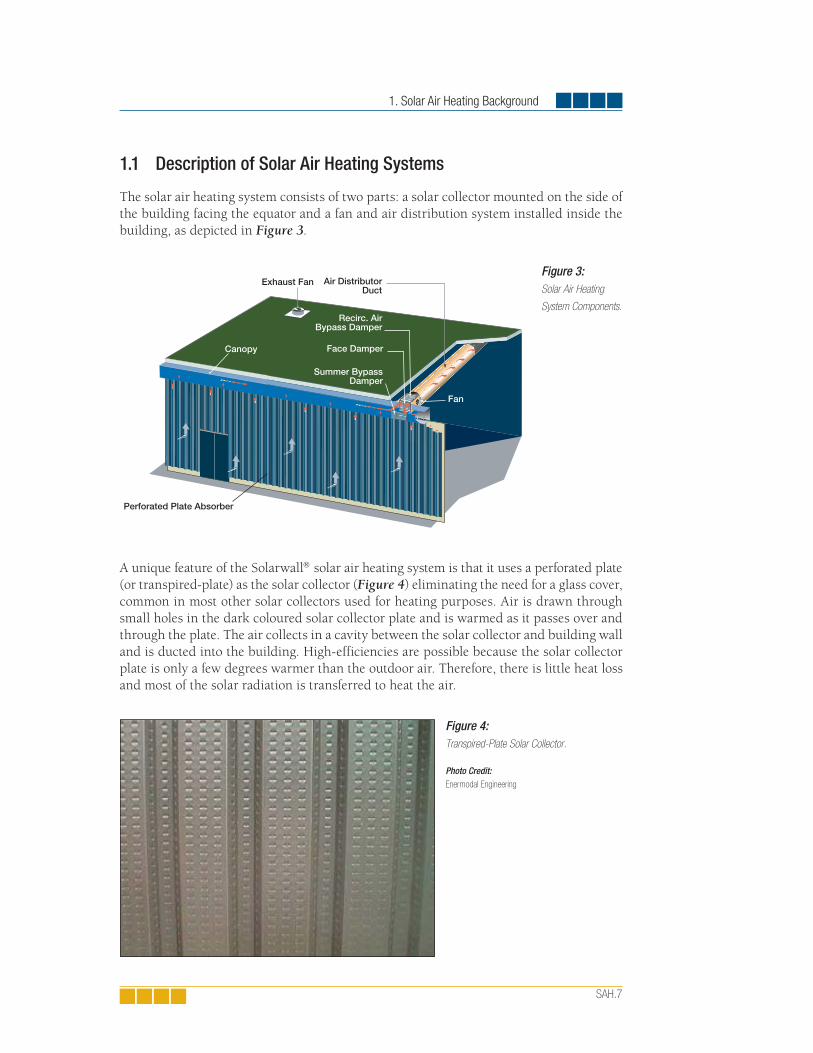
The solar air heating system consists of two parts: a solar collector mounted on the side of the building facing the equator and a fan and air distribution system installed inside the building, as depicted in Figure 3.
A unique feature of the Solarwall solar air heating system is that it uses a perforated plate (or transpired-plate) as the solar collector (Figure 4) eliminating the need for a glass cover, common in most other solar collectors used for heating purposes. Air is drawn through small holes in the dark coloured solar collector plate and is warmed as it passes over and through the plate. The air collects in a cavity between the solar collector and building wall and is ducted into the building. High-efficiencies are possible because the solar collector plate is only a few degrees warmer than the outdoor air. Therefore, there is little heat loss and most of the solar radiation is transferred to heat the air.
Figure 3:Solar Air Heating
System Components.
Figure 4:Transpired-Plate Solar Collector.
Photo Credit: Enermodal Engineering
Solar Air Heating Project Analysis Chapter
SAH.8
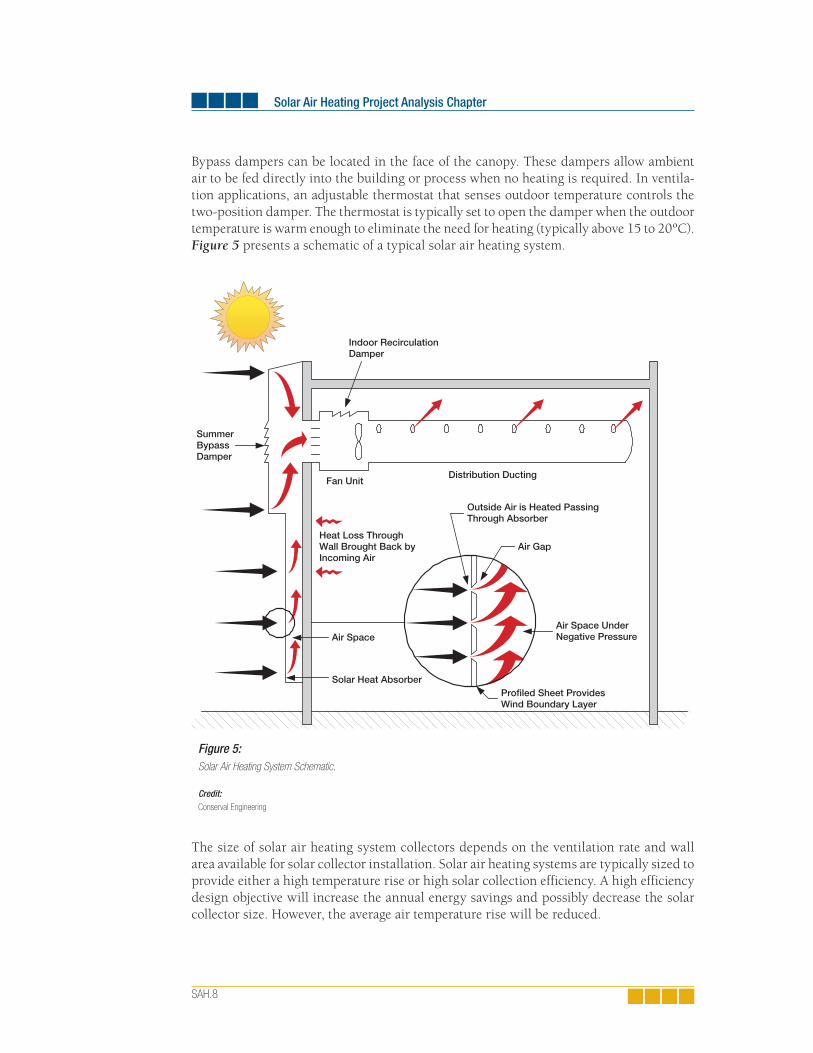
Bypass dampers can be located in the face of the canopy. These dampers allow ambient air to be fed directly into the building or process when no heating is required. In ventila-tion applications, an adjustable thermostat that senses outdoor temperature controls the two-position damper. The thermostat is typically set to open the damper when the outdoor temperature is warm enough to eliminate the need for heating (typically above 15 to 20ºC). Figure 5 presents a schematic of a typical solar air heating system.
The size of solar air heating system collectors depends on the ventilation rate and wall area available for solar collector installation. Solar air heating systems are typically sized to provide either a high temperature rise or high solar collection efficiency. A high efficiency design objective will increase the annual energy savings and possibly decrease the solar collector size. However, the average air temperature rise will be reduced.
Indoor RecirculationDamper
Distribution Ducting
SummerBypassDamper
Heat Loss ThroughWall Brought Back byIncoming Air
Outside Air is Heated PassingThrough Absorber
Air Gap
Air Space UnderNegative Pressure
Profiled Sheet ProvidesWind Boundary Layer
Solar Heat Absorber
Air Space
Fan Unit
Figure 5:Solar Air Heating System Schematic.
Credit: Conserval Engineering
1. Solar Air Heating Background
SAH.9
1.2 Solar Air Heating System Application Markets
Applications for solar air heating systems include both building ventilation air heating and process air heating. Systems used for ventilation heating vary depending on the type of building on which the system will be installed (e.g. industrial, commercial or residential). This applies to new construction and retrofit situations. The method of solar air heat-ing system air delivery depends on the type of building and the existing air distribution system.
1.2.1 Commercial and residential buildings
Most commercial and residential build-ings need ventilation air. Solar ventila-tion air preheating systems preheat this air before bringing it into the building. An air-handling unit pulls ventilation air through the solar collector and delivers it throughout the building with conven-tional ductwork. On cold days, the solar collectors preheat the air and a heater in the air-handling unit provides the neces-sary remaining heat. On cool sunny days, the solar system can likely provide all the necessary air heating. In the summer, a bypass damper is opened, avoiding an unnecessary load on the air-condition-ing system.
An additional advantage of making the solar collector a part of the building façade is that the collector can recapture building wall heat loss. As the heat conducts out the building wall, it reaches the collector air channel. At this point the ventilation air blowing through the channel picks up this heat and blows it back into the building. Typically the ventilation air recaptures half of the wall heat loss.
Most commercial, multi-unit residential and institutional buildings have existing air han-dling systems. In some cases (e.g. apartment buildings, schools), the air handling system is a dedicated ventilation system. In other buildings (e.g. offices), the air handling system provides space heating, cooling and ventilation with ventilation air making up between 10 and 20% of the total airflow. In either case, the solar air heating system is connected to the outdoor air intake and the air is distributed through conventional ductwork. The solar air heating system supplies a constant flow of outdoor air preheating the ventilation air.
RETScreen® InternationalSolar Air Heating Project Model
The RETScreen® International Solar Air Heat-ing Project Model can be used world-wide to easily evaluate the energy production (or savings), life-cycle costs and greenhouse gas emissions reduction for two basic applications: ventilation air heating and process air heat-ing. The model is designed specifically for the analysis of transpired-plate solar collectors. This technology has been successfully applied in a range of applications from small residen-tial to larger commercial/industrial scale ventilation systems, as well in the air-drying processes for various crops.
Solar Air Heating Project Analysis Chapter
SAH.10
1.2.2 Industrial buildings
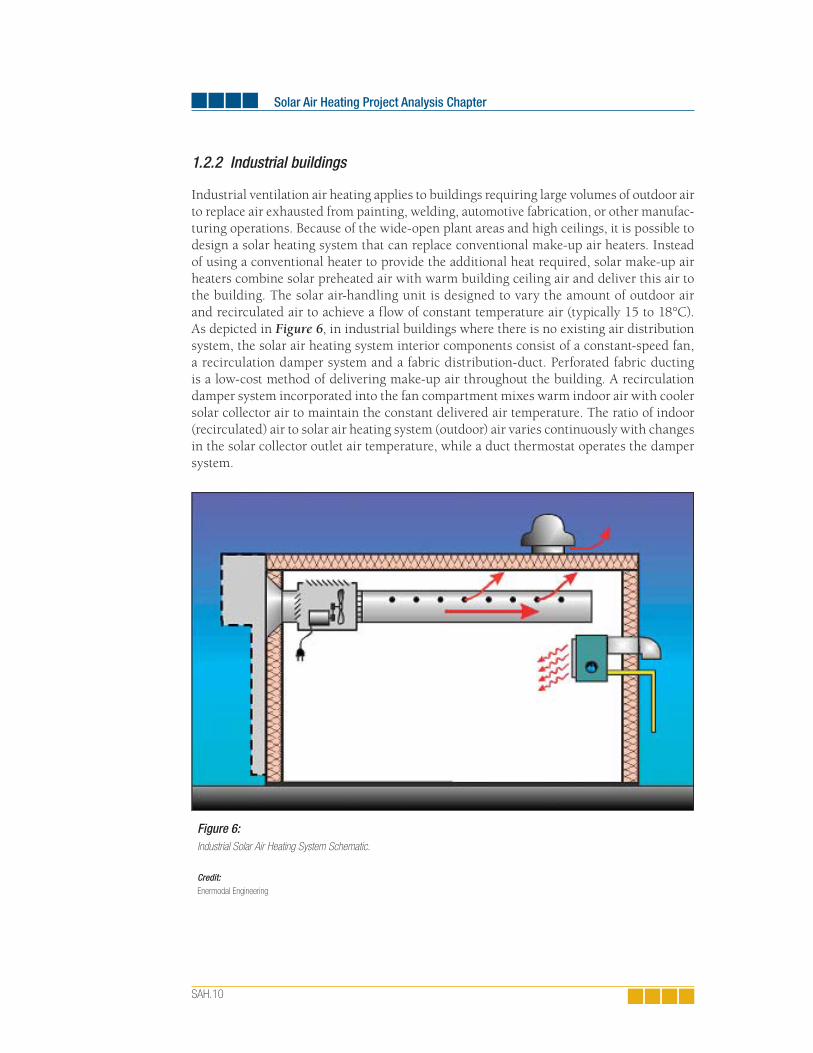
Industrial ventilation air heating applies to buildings requiring large volumes of outdoor air to replace air exhausted from painting, welding, automotive fabrication, or other manufac-turing operations. Because of the wide-open plant areas and high ceilings, it is possible to design a solar heating system that can replace conventional make-up air heaters. Instead of using a conventional heater to provide the additional heat required, solar make-up air heaters combine solar preheated air with warm building ceiling air and deliver this air to the building. The solar air-handling unit is designed to vary the amount of outdoor air and recirculated air to achieve a flow of constant temperature air (typically 15 to 18°C). As depicted in Figure 6, in industrial buildings where there is no existing air distribution system, the solar air heating system interior components consist of a constant-speed fan, a recirculation damper system and a fabric distribution-duct. Perforated fabric ducting is a low-cost method of delivering make-up air throughout the building. A recirculation damper system incorporated into the fan compartment mixes warm indoor air with cooler solar collector air to maintain the constant delivered air temperature. The ratio of indoor (recirculated) air to solar air heating system (outdoor) air varies continuously with changes in the solar collector outlet air temperature, while a duct thermostat operates the damper system.
Figure 6:Industrial Solar Air Heating System Schematic.
Credit: Enermodal Engineering
1. Solar Air Heating Background
SAH.11
The mixture of ventilation air and recirculated air is distributed to the plant through per-forated fabric ducts, which are located at ceiling level. Because the air from the ducting is cooler than air at the ceiling, the ventilation air will cool the ceiling reducing heat loss through the roof at the temperature of exhaust air (for ceiling exhausters) and the air will naturally fall, mixing and destratifying the building air.
Another advantage of the system is that it too can recapture building wall heat loss if the collectors are mounted on the building wall.
1.2.3 Process air
Large quantities of outdoor air are used for process air heating applications. Drying of ag-ricultural products is a good application for solar energy, as the required temperature rise must be kept relatively low to prevent damaging the crops. Those crops that are harvested continuously over the year are well suited because all the available solar radiation can be used. Solar systems can also serve as a preheater to (high temperature) industrial drying systems.
Solar process air heating systems are similar to ventilation air preheating systems. The perforated plate absorber is located in any convenient location that has good exposure to the sun. Sloped roofs as well as walls are suitable mounting structures. A constant flow of air is taken through the collectors and is ducted into the air intake of the process. If necessary, additional heat can be added from auxiliary sources to deliver the desired air temperature and some or all of the process air can bypass the collectors if the air is above the desired temperature.
2. RETScreen Solar Air Heating Project Model
SAH.13
2 RETSCREEN SOLAR AIR HEATING PROJECT MODEL
The RETScreen Solar Air Heating Project Model can be used world-wide to evaluate solar air heating projects, from larger scale industrial building developments to smaller scale residential applications, anywhere in the world. It is also able to model process air heating applications, such as the drying of crops. Solar air heating systems can save conventional energy in three ways, depending upon the application:
Collection of solar energy through active solar air heating for buildings and processes;
Recapture of equator side wall heat loss (heat lost out the original build-ing wall is captured by the ventilation air and recirculated back into the building); and
Destratifi cation of building air in buildings with high ceilings, for example, industrial manufacturing plants or warehouses.
Six worksheets (Energy Model, Solar Resource, Cost Analysis, Greenhouse Gas Emission Reduc-tion Analysis (GHG Analysis), Financial Summary and Sensitivity and Risk Analysis (Sensitivity)) are provided in the Solar Air Heating Project Workbook file.
The Energy Model and Solar Resource worksheets are completed first. The Cost Analysis worksheet should then be completed, followed by the Financial Summary worksheet. The GHG Analysis and Sensitivity worksheets are optional analysis. The GHG Analysis work-sheet is provided to help the user estimate the greenhouse gas (GHG) mitigation potential of the proposed project. The Sensitivity worksheet is provided to help the user estimate the sensitivity of important financial indicators in relation to key technical and financial parameters. In general, the user works from top-down for each of the worksheets. This process can be repeated several times in order to help optimize the design of the solar air heating project from an energy use and cost standpoint.
To help the user characterize a solar air heating system before evaluating its cost and en-ergy performance, some values are suggested for component sizing (e.g. “Suggested solar collector area”). Suggested or estimated values are based on input parameters and can be used as a first step in the analysis and are not necessarily the optimum values.
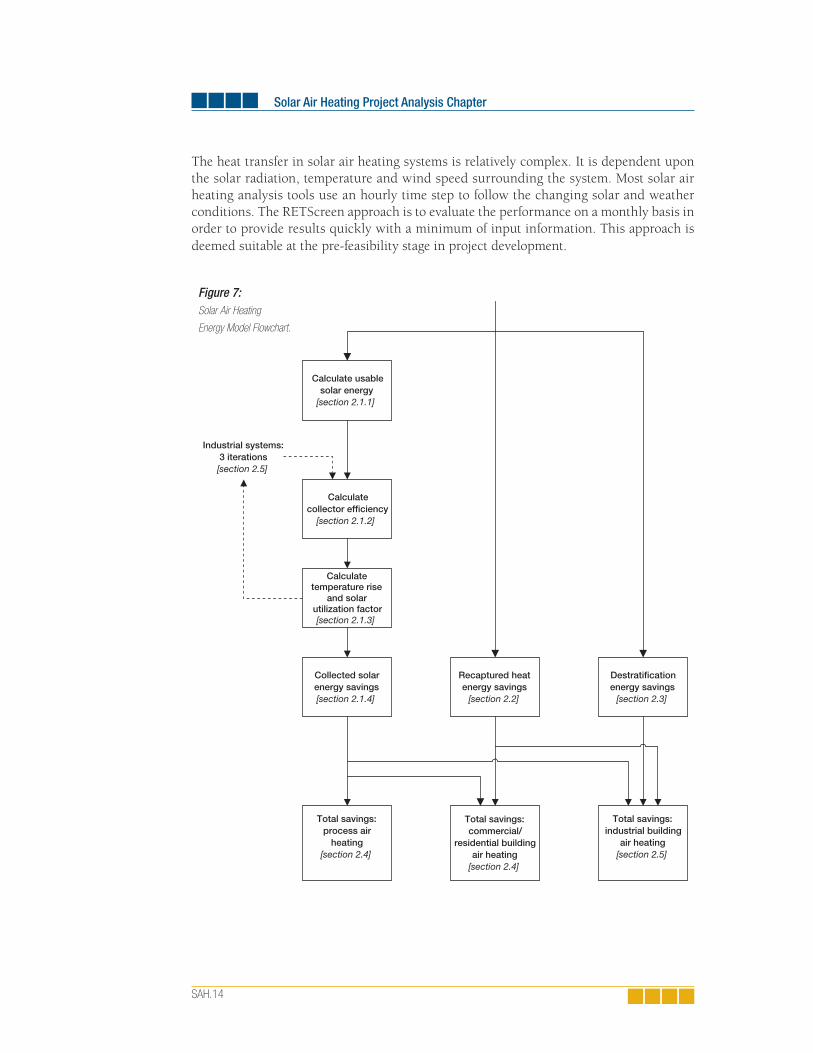
This section describes the various algorithms used to calculate, on a month-by-month basis, the energy savings of solar air heating systems in RETScreen. A flowchart of the al-gorithms is shown in Figure 7. Sections 2.1 to 2.3 present the calculation of the three modes of energy savings: collected solar energy (Section 2.1), building heat recapture (Section 2.2), and destratification (Section 2.3) savings. How these three modes contribute to the overall energy savings is shown in Section 2.4 for heating systems for non-industrial buildings and in Section 2.5 for heating systems for industrial buildings. A validation of the RETScreen Solar Air Heating Project Model is presented in Section 2.6.
Solar Air Heating Project Analysis Chapter
SAH.14
The heat transfer in solar air heating systems is relatively complex. It is dependent upon the solar radiation, temperature and wind speed surrounding the system. Most solar air heating analysis tools use an hourly time step to follow the changing solar and weather conditions. The RETScreen approach is to evaluate the performance on a monthly basis in order to provide results quickly with a minimum of input information. This approach is deemed suitable at the pre-feasibility stage in project development.
Collected solarenergy savings[section 2.1.4]
Recaptured heatenergy savings
[section 2.2]
Destratificationenergy savings
[section 2.3]
Total savings:process air
heating[section 2.4]
Total savings:commercial/
residential buildingair heating
[section 2.4]
Total savings:industrial building
air heating[section 2.5]
Calculate usablesolar energy
[section 2.1.1]
Calculatetemperature rise
and solarutilization factor[section 2.1.3]
Calculatecollector efficiency
[section 2.1.2]
Industrial systems:3 iterations[section 2.5]
Figure 7:Solar Air Heating
Energy Model Flowchart.
2. RETScreen Solar Air Heating Project Model
SAH.15
In RETScreen, process air heating is assumed to benefit only from collected active solar energy savings. It is assumed that the building does not require space heating and any reduction in wall or roof heat loss does not save energy. Furthermore, because the heated air goes straight from the solar collector to the drying ovens, or other process machinery, there is no potential for destratifying the building air.
Commercial/residential buildings benefit from two modes of energy savings: collected active solar energy savings and recaptured heat savings. Industrial buildings, due to the method of air circulation on the building and the height of the ceilings, benefit from all three methods of energy savings.
Because of simplifications introduced, the RETScreen Solar Air Heating Model has a certain number of limitations:
The ventilation model does not incorporate a detailed energy consumption and make-up system analysis for the existing building. This minimised data requirement approach will make it much easier for the user to prepare an analysis, but modelling accuracy will be partially reduced as a result.
The model does not currently include advanced heat recovery technologies currently under development for the solar air heating system. Therefore, the model may understate the potential savings of a combined advanced heat recovery/solar air heating system.
The model is specifi c to the Solarwall® technology developed by Conserval Engineering and does not model other solar air heating systems that may be available on the market.
Finally, the model assumes industrial buildings have a balanced ventilation system for the calculation of destratifi cation savings.
For the majority of applications, these limitations are without consequence.
2.1 Collected Solar Energy Savings
Solar radiation incident upon the tilted collector must be calculated from data input by the user, namely, daily solar radiation on a horizontal surface and operating multiplier. This is detailed in Section 2.1.1. Energy collected by the solar collector is calculated by multiplying incident radiation by the average collector efficiency; calculation of this latter quantity is detailed in Section 2.1.2. However, only part of the energy collected will actually be usable; the concept of solar utilization is covered in Section 2.1.3.
Solar Air Heating Project Analysis Chapter
SAH.16
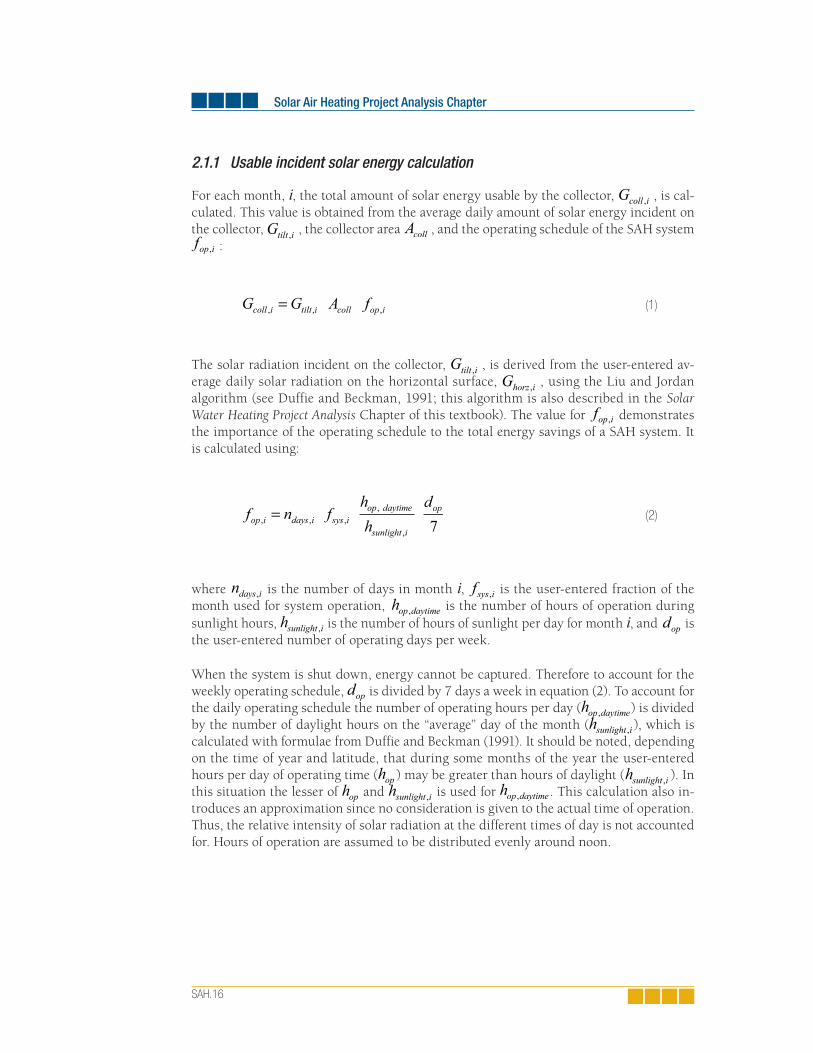
2.1.1 Usable incident solar energy calculation
For each month, i, the total amount of solar energy usable by the collector, Gcoll i, , is cal-
culated. This value is obtained from the average daily amount of solar energy incident on the collector, Gtilt i, , the collector area Acoll , and the operating schedule of the SAH system fop i, :
The solar radiation incident on the collector, Gtilt i, , is derived from the user-entered av-erage daily solar radiation on the horizontal surface, Ghorz i, , using the Liu and Jordan algorithm (see Duffie and Beckman, 1991; this algorithm is also described in the Solar Water Heating Project Analysis Chapter of this textbook). The value for fop i, demonstrates the importance of the operating schedule to the total energy savings of a SAH system. It is calculated using:
where ndays i, is the number of days in month i, fsys i, is the user-entered fraction of the month used for system operation, hop daytime, is the number of hours of operation during sunlight hours, hsunlight i, is the number of hours of sunlight per day for month i, and dop is the user-entered number of operating days per week.
When the system is shut down, energy cannot be captured. Therefore to account for the weekly operating schedule, dop is divided by 7 days a week in equation (2). To account for the daily operating schedule the number of operating hours per day (hop daytime, ) is divided by the number of daylight hours on the “average” day of the month (hsunlight i, ), which is calculated with formulae from Duffie and Beckman (1991). It should be noted, depending on the time of year and latitude, that during some months of the year the user-entered hours per day of operating time (hop ) may be greater than hours of daylight (hsunlight i, ). In this situation the lesser of hop and hsunlight i, is used for hop daytime, . This calculation also in-troduces an approximation since no consideration is given to the actual time of operation. Thus, the relative intensity of solar radiation at the different times of day is not accounted for. Hours of operation are assumed to be distributed evenly around noon.
(1)
(2)
2. RETScreen Solar Air Heating Project Model
SAH.17
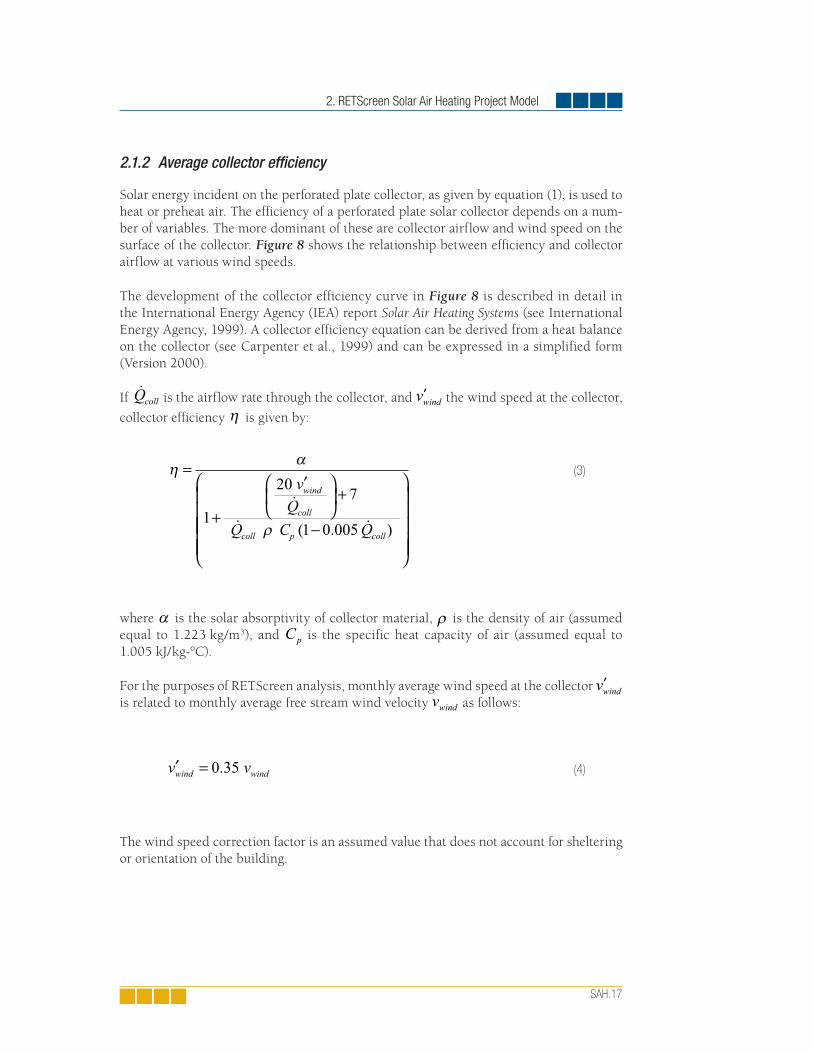
2.1.2 Average collector effi ciency
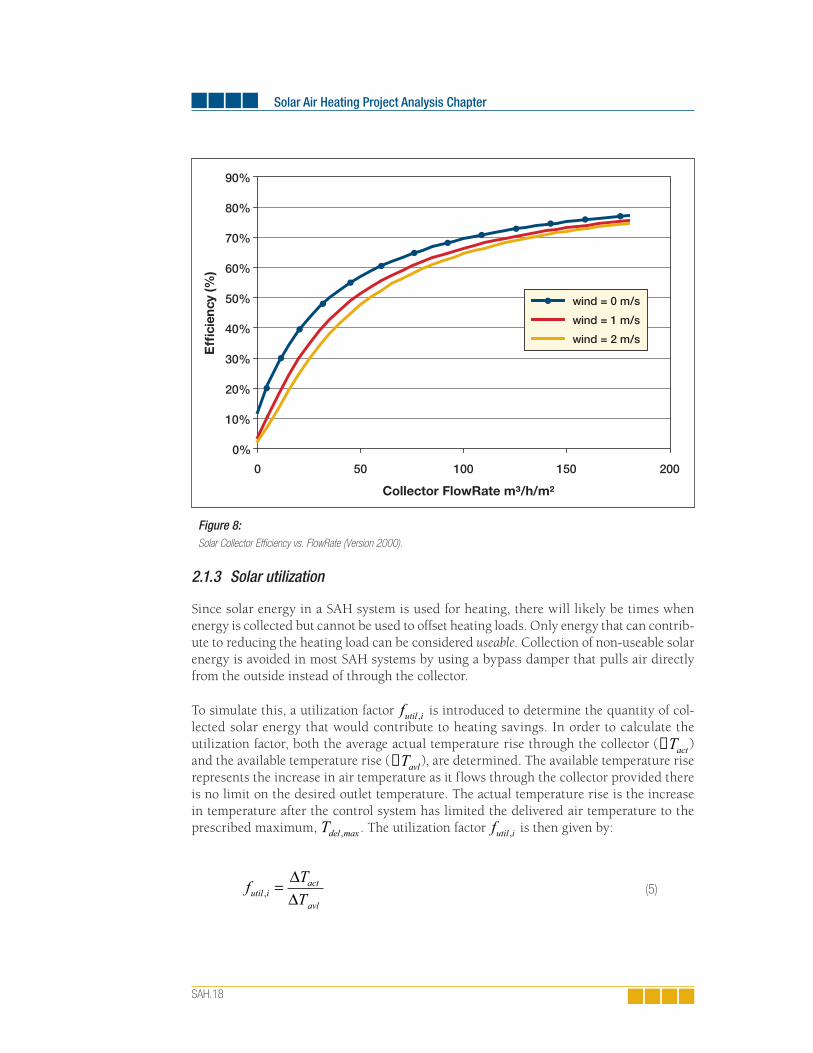
Solar energy incident on the perforated plate collector, as given by equation (1), is used to heat or preheat air. The efficiency of a perforated plate solar collector depends on a num-ber of variables. The more dominant of these are collector airflow and wind speed on the surface of the collector. Figure 8 shows the relationship between efficiency and collector airflow at various wind speeds.
The development of the collector efficiency curve in Figure 8 is described in detail in the International Energy Agency (IEA) report Solar Air Heating Systems (see International Energy Agency, 1999). A collector efficiency equation can be derived from a heat balance on the collector (see Carpenter et al., 1999) and can be expressed in a simplified form (Version 2000).
If Qcoll is the airflow rate through the collector, and ′vwind the wind speed at the collector,
collector efficiency η is given by:
where α is the solar absorptivity of collector material, ρ is the density of air (assumed equal to 1.223 kg/m3), and Cp is the specific heat capacity of air (assumed equal to 1.005 kJ/kg-°C).
For the purposes of RETScreen analysis, monthly average wind speed at the collector ′vwind is related to monthly average free stream wind velocity vwind as follows:
The wind speed correction factor is an assumed value that does not account for sheltering or orientation of the building.
(3)
(4)
Solar Air Heating Project Analysis Chapter
SAH.18
2.1.3 Solar utilization
Since solar energy in a SAH system is used for heating, there will likely be times when energy is collected but cannot be used to offset heating loads. Only energy that can contrib-ute to reducing the heating load can be considered useable. Collection of non-useable solar energy is avoided in most SAH systems by using a bypass damper that pulls air directly from the outside instead of through the collector.
To simulate this, a utilization factor futil i, is introduced to determine the quantity of col-lected solar energy that would contribute to heating savings. In order to calculate the utilization factor, both the average actual temperature rise through the collector (∆Tact ) and the available temperature rise (∆Tavl ), are determined. The available temperature rise represents the increase in air temperature as it flows through the collector provided there is no limit on the desired outlet temperature. The actual temperature rise is the increase in temperature after the control system has limited the delivered air temperature to the prescribed maximum, Tdel max, . The utilization factor futil i, is then given by:
Figure 8: Solar Collector Effi ciency vs. FlowRate (Version 2000).
0%
10%
20%
30%
40%
50%
60%
70%
80%
90%
0 50 100 150 200
Collector FlowRate m³/h/m²
Eff
icie
ncy
(%)
wind = 0 m/s
wind = 1 m/s
wind = 2 m/s
(5)
2. RETScreen Solar Air Heating Project Model
SAH.19
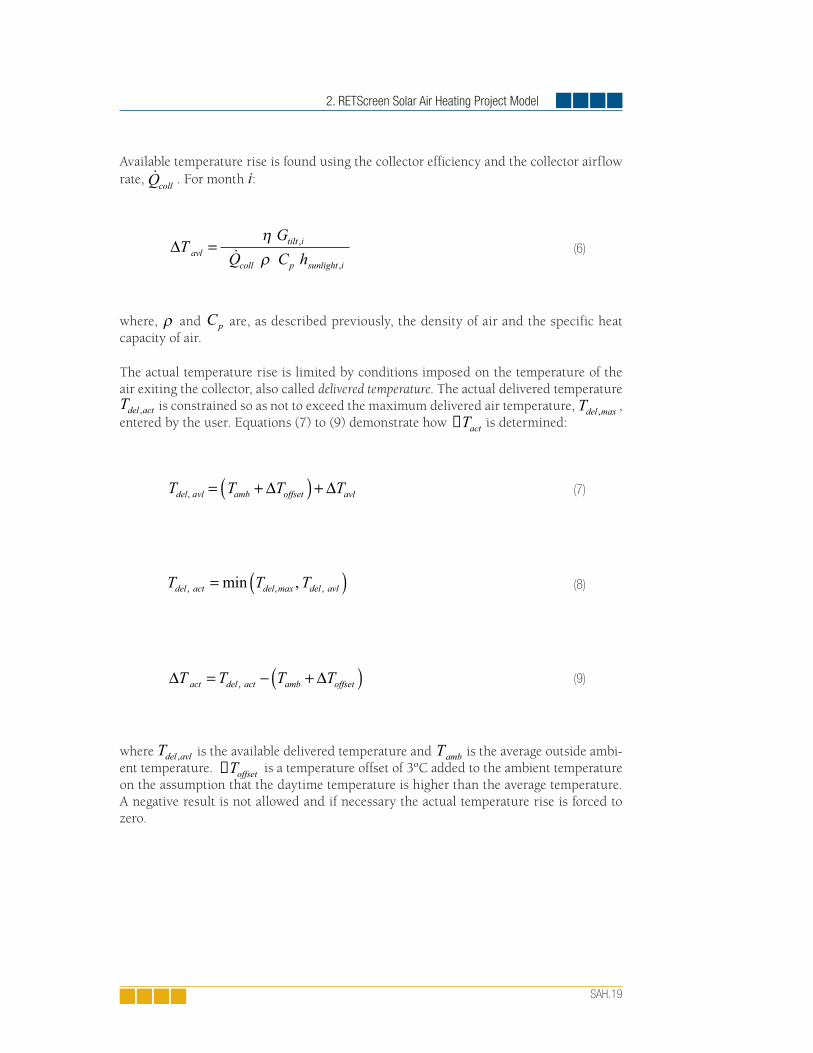
Available temperature rise is found using the collector efficiency and the collector airflow rate, Qcoll . For month i:
where, ρ and Cp are, as described previously, the density of air and the specific heat capacity of air.
The actual temperature rise is limited by conditions imposed on the temperature of the air exiting the collector, also called delivered temperature. The actual delivered temperature Tdel act, is constrained so as not to exceed the maximum delivered air temperature, Tdel max, , entered by the user. Equations (7) to (9) demonstrate how ∆Tact is determined:
where Tdel avl, is the available delivered temperature and Tamb is the average outside ambi-ent temperature. ∆Toffset is a temperature offset of 3ºC added to the ambient temperature on the assumption that the daytime temperature is higher than the average temperature. A negative result is not allowed and if necessary the actual temperature rise is forced to zero.
(6)
(7)
(8)
(9)
Solar Air Heating Project Analysis Chapter
SAH.20
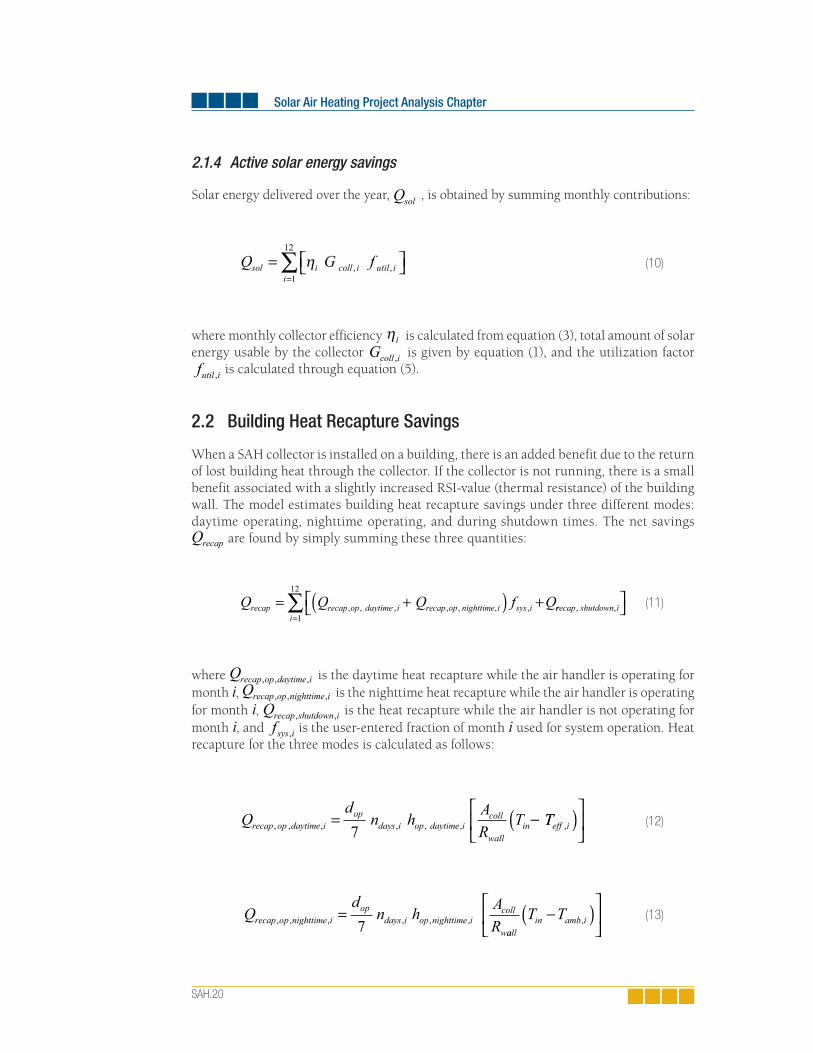
2.1.4 Active solar energy savings
Solar energy delivered over the year, Qsol , is obtained by summing monthly contributions:
where monthly collector efficiency ηi is calculated from equation (3), total amount of solar energy usable by the collector Gcoll i, is given by equation (1), and the utilization factor futil i, is calculated through equation (5).
2.2 Building Heat Recapture Savings
When a SAH collector is installed on a building, there is an added benefit due to the return of lost building heat through the collector. If the collector is not running, there is a small benefit associated with a slightly increased RSI-value (thermal resistance) of the building wall. The model estimates building heat recapture savings under three different modes: daytime operating, nighttime operating, and during shutdown times. The net savings Qrecap are found by simply summing these three quantities:
where Qrecap op daytime i, , , is the daytime heat recapture while the air handler is operating for month i, Qrecap op nighttime i, , , is the nighttime heat recapture while the air handler is operating for month i, Qrecap shutdown i, , is the heat recapture while the air handler is not operating for month i, and
fsys i, is the user-entered fraction of month i used for system operation. Heat recapture for the three modes is calculated as follows:
(10)
(11)
(12)
(13)
2. RETScreen Solar Air Heating Project Model
SAH.21
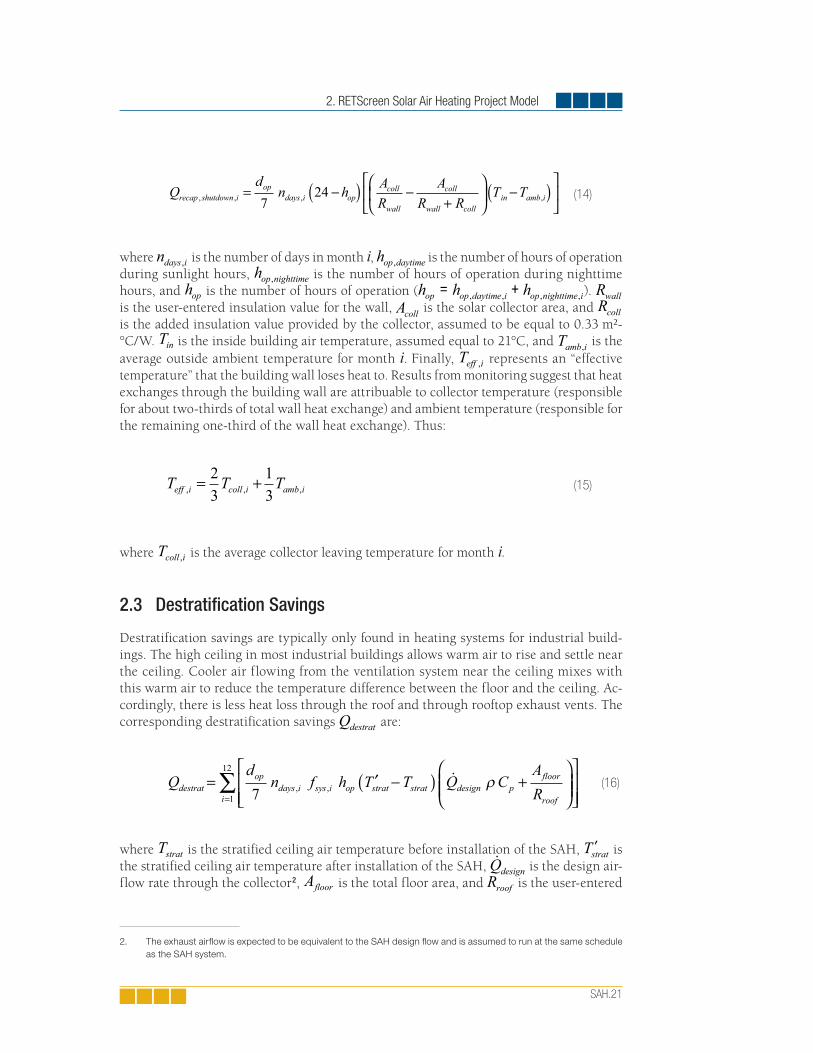
where ndays i, is the number of days in month i, hop daytime, is the number of hours of operation during sunlight hours, hop nighttime, is the number of hours of operation during nighttime hours, and hop is the number of hours of operation (h h hop op daytime i op nighttime i= +, , , , ). Rwall is the user-entered insulation value for the wall, Acoll is the solar collector area, and Rcoll is the added insulation value provided by the collector, assumed to be equal to 0.33 m²-°C/W. Tin is the inside building air temperature, assumed equal to 21°C, and Tamb i, is the average outside ambient temperature for month i. Finally, Teff i, represents an “effective temperature” that the building wall loses heat to. Results from monitoring suggest that heat exchanges through the building wall are attribuable to collector temperature (responsible for about two-thirds of total wall heat exchange) and ambient temperature (responsible for the remaining one-third of the wall heat exchange). Thus:
where Tcoll i, is the average collector leaving temperature for month i.
2.3 Destratifi cation Savings
Destratification savings are typically only found in heating systems for industrial build-ings. The high ceiling in most industrial buildings allows warm air to rise and settle near the ceiling. Cooler air flowing from the ventilation system near the ceiling mixes with this warm air to reduce the temperature difference between the floor and the ceiling. Ac-cordingly, there is less heat loss through the roof and through rooftop exhaust vents. The corresponding destratification savings Qdestrat are:
where Tstrat is the stratified ceiling air temperature before installation of the SAH, ′Tstrat is the stratified ceiling air temperature after installation of the SAH, Qdesign is the design air-flow rate through the collector2, Afloor is the total floor area, and Rroof is the user-entered
(14)
(15)
(16)
2. The exhaust airfl ow is expected to be equivalent to the SAH design fl ow and is assumed to run at the same schedule as the SAH system.
Solar Air Heating Project Analysis Chapter
SAH.22
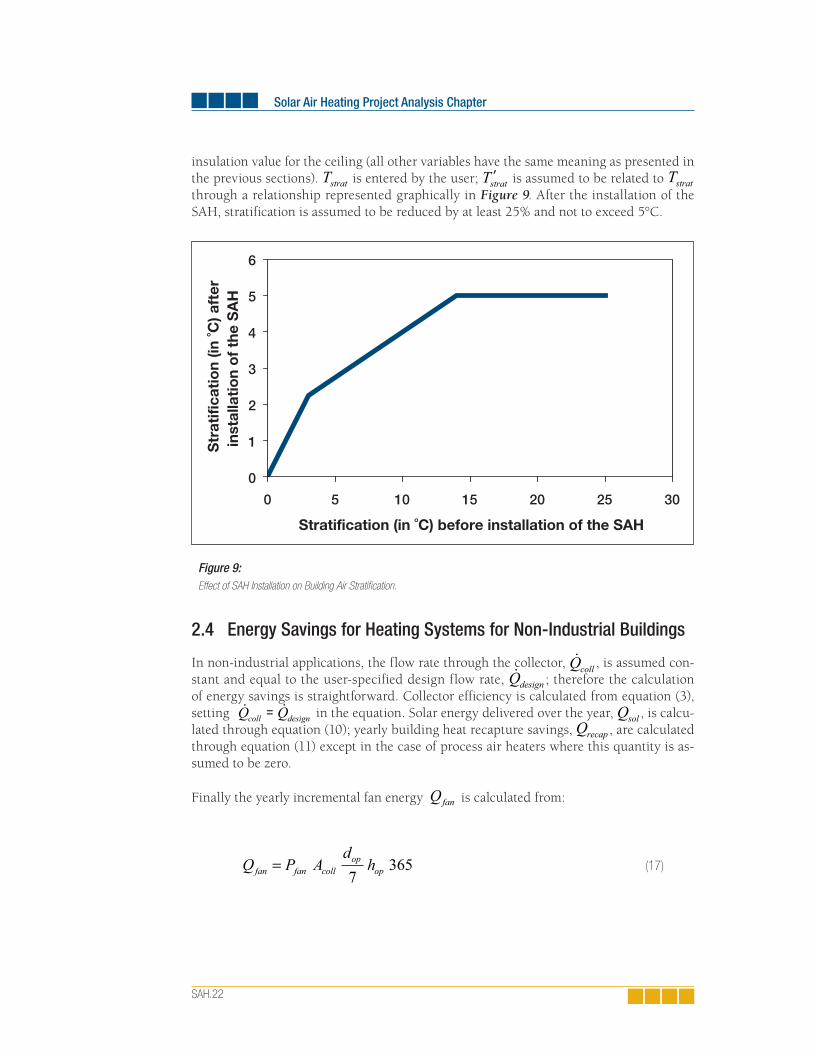
insulation value for the ceiling (all other variables have the same meaning as presented in the previous sections). Tstrat is entered by the user; ′Tstrat is assumed to be related to Tstrat through a relationship represented graphically in Figure 9. After the installation of the SAH, stratification is assumed to be reduced by at least 25% and not to exceed 5°C.
2.4 Energy Savings for Heating Systems for Non-Industrial Buildings
In non-industrial applications, the flow rate through the collector, Qcoll , is assumed con-stant and equal to the user-specified design flow rate, Qdesign ; therefore the calculation of energy savings is straightforward. Collector efficiency is calculated from equation (3), setting Q Qcoll design= in the equation. Solar energy delivered over the year, Qsol , is calcu-lated through equation (10); yearly building heat recapture savings, Qrecap , are calculated through equation (11) except in the case of process air heaters where this quantity is as-sumed to be zero.
Finally the yearly incremental fan energy Qfan is calculated from:
Figure 9: Effect of SAH Installation on Building Air Stratifi cation.
0
1
2
3
4
5
6
0 5 10 15 20 25 30
Stratification (in ˚C) before installation of the SAH
Str
atifi
cati
on
(in ˚C
) aft
er
inst
alla
tio
n o
f th
e S
AH
(17)
2. RETScreen Solar Air Heating Project Model
SAH.23
where Pfan is the incremental fan power per unit collector area. Qfan can be a positive or negative value, and contributes to the savings accordingly. Total amount of renewable energy delivered Qdel is obtained by summing the solar energy collected and the amount of heat recaptured, and subtracting the incremental fan energy:
The specific yield of the solar air heating system, ηsys , is obtained by dividing the amount
of renewable energy delivered by the collector area:
2.5 Energy Savings for Heating Systems for Industrial Buildings
The case of heating systems for industrial buildings is slightly more complicated than that of heating systems for non-industrial buildings. In residential/commercial or process heat applications, the airflow rate through the collector is constant. In heating systems for industrial buildings on the other hand, a recirculation damper system incorporated into the fan compartment mixes warm indoor air with cooler solar collector air to maintain a constant delivered air temperature. The ratio of indoor (recirculated) air to solar air heat-ing system (outdoor) air varies continuously with changes in the solar collector outlet air temperature. As a consequence, the flow rate of air through the collector varies, and so do the collector efficiency (see equation 3) and the temperature rise through the collector (see equation 6). Since it is impossible to calculate one of the quantities without knowing the other, an iterative algorithm becomes necessary to find the operating point on the curve of Figure 8.
For simplicity the RETScreen software program iterates three times. First a suitable esti-mate is made for the starting collector flow rate Qcoll
( )1 . The following equation provides the suitable estimate:
where Qdesign is the design airflow rate through the collector, Tdel is the desired delivered air temperature for the supply air, and Tamb is the outdoor ambient air temperature for
(18)
(19)
(20)
Solar Air Heating Project Analysis Chapter
SAH.24
the given month. An initial efficiency η ( )1 is then determined from equation (3) using
Q Qcoll coll= ( )1 . The first iteration collector temperature rise is then determined using equa-tion (6). The corresponding delivered air temperature is then determined and limited to the specified maximum Tdel max, using equations (7) to (9). Using the new actual temperature rise Tact , a second estimate of collector flow rate is obtained:
where Trecirc is the recirculation temperature, taken as the average of the set point tem-perature and the stratified ceiling air temperature. This process is reiterated until Qcoll
( )3 and η
( )3 are obtained. The efficiency is then used in equation (10) to return the total solar energy collected.
The rest of the calculations are similar to what is done in the non-industrial case (equations 17 to 19), except that the total amount of renewable energy delivered
Qdel also includes destratification savings; therefore (18) is replaced with:
where Qdestrat is the destratification savings calculated by equation (16).
2.6 Validation
Numerous experts have contributed to the development, testing and validation of the RETScreen Solar Air Heating Project Model. They include solar air heating modelling ex-perts, cost engineering experts, greenhouse gas modelling specialists, financial analysis professionals, and ground station and satellite weather database scientists.
This section presents two examples of the validations completed. Predictions of the RETScreen Solar Air Heating Project Model are compared to results from an hourly simu-lation program as well as to data measured at real solar air heating system installations.
The RETScreen Solar Air Heating Project Model uses system design parameters along with monthly weather data to determine annual energy savings. The concept is similar to that used in the SWift™ software program developed by Natural Resource Canada’s CANMET Energy Technology Centre-Ottawa (Carpenter et al., 1999; Enermodal, 1999). The SWift program is a detailed simulation program used to analyse solar air heating systems. SWift calculates system performance on an hourly basis with equations derived from basic
(21)
(22)
2. RETScreen Solar Air Heating Project Model
SAH.25
thermodynamic principles such as Fourier’s Law. The monthly analysis performed in RETScreen is based more on empirical correlation and is therefore a bit more approximate by definition.
SWift is currently one of the most sophisticated modelling tools available for analysis of perforated collector systems and therefore serves as an appropriate benchmark for the RETScreen Solar Air Heating Project Model. Validation of the RETScreen model (Version 2000) was done by comparison to SWift and also to monitored data. Two Canadian cities were chosen for the comparison: Toronto, Ontario, Canada, for its warmer, more southern climate and Winnipeg, Manitoba, Canada for its colder northern climate. Both cities have existing solar air heating installations for which monitored data is available.
For each location, three design configurations were tested and compared on an annual basis to the SWift program. A process airheating configuration was not tested because of the direct similarity to commercial systems. Hourly weather data used by SWift was con-verted to monthly data to be used by RETScreen to avoid any differences in source data. The main parameters of the simulation were:
Building: Floor area = 1,200 m2, walls and ceiling insulation (RSI) = 1.0 m² ºC/W; hours of operation = 7 days/week, 10 hours/day.
Collector: Colour is black; area = 100 m2; airfl ow = 4,000 L/s.
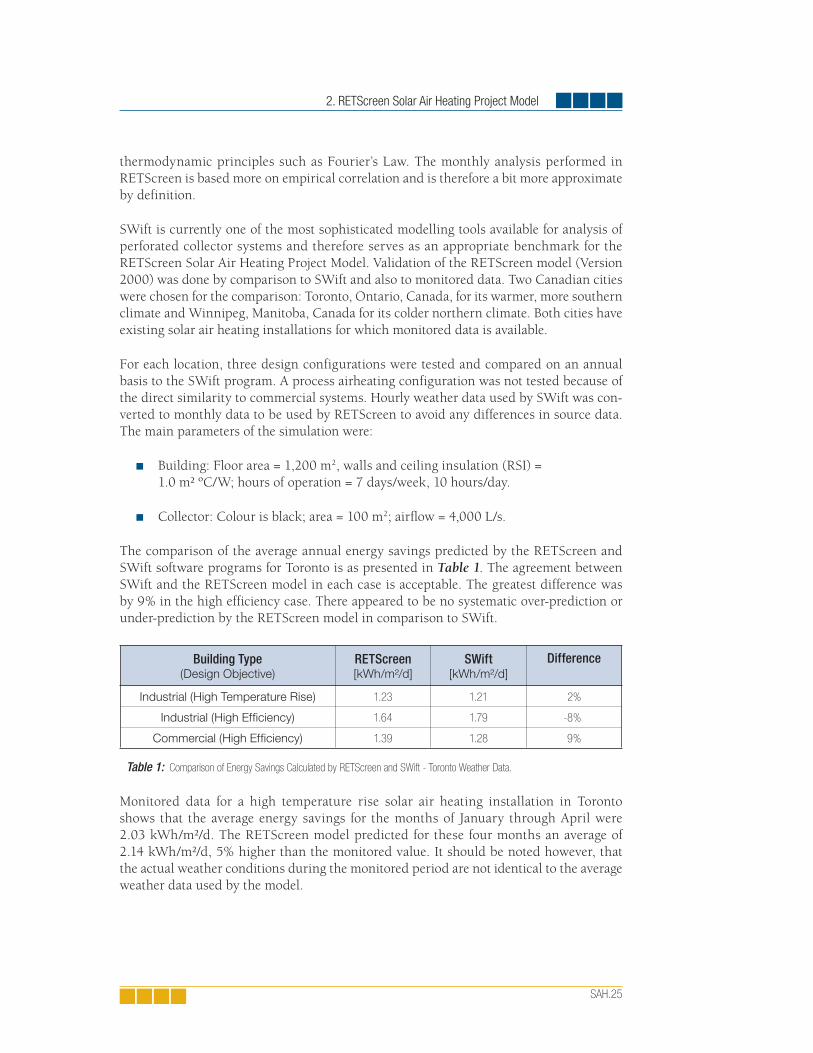
The comparison of the average annual energy savings predicted by the RETScreen and SWift software programs for Toronto is as presented in Table 1. The agreement between SWift and the RETScreen model in each case is acceptable. The greatest difference was by 9% in the high efficiency case. There appeared to be no systematic over-prediction or under-prediction by the RETScreen model in comparison to SWift.
Building Type(Design Objective)
RETScreen[kWh/m²/d]
SWift[kWh/m²/d]
Difference
Industrial (High Temperature Rise) 1.23 1.21 2%
Industrial (High Efficiency) 1.64 1.79 -8%
Commercial (High Efficiency) 1.39 1.28 9%
Table 1: Comparison of Energy Savings Calculated by RETScreen and SWift - Toronto Weather Data.
Monitored data for a high temperature rise solar air heating installation in Toronto shows that the average energy savings for the months of January through April were 2.03 kWh/m²/d. The RETScreen model predicted for these four months an average of 2.14 kWh/m²/d, 5% higher than the monitored value. It should be noted however, that the actual weather conditions during the monitored period are not identical to the average weather data used by the model.
Solar Air Heating Project Analysis Chapter
SAH.26
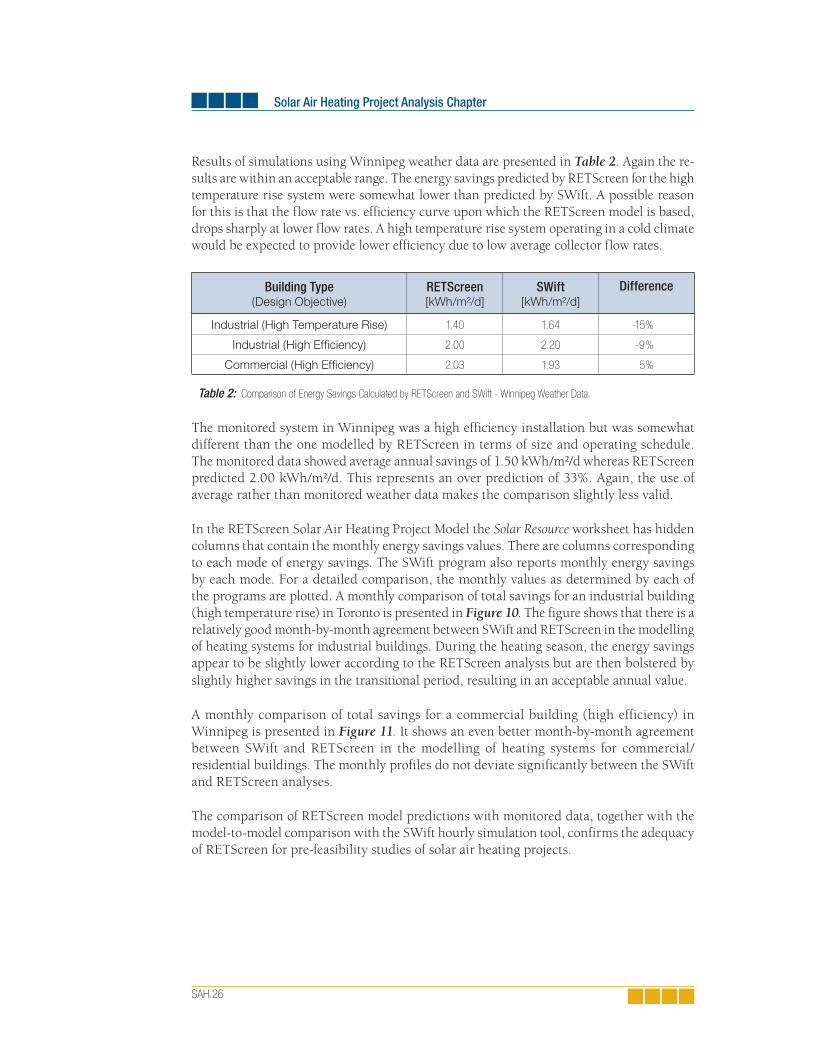
Results of simulations using Winnipeg weather data are presented in Table 2. Again the re-sults are within an acceptable range. The energy savings predicted by RETScreen for the high temperature rise system were somewhat lower than predicted by SWift. A possible reason for this is that the flow rate vs. efficiency curve upon which the RETScreen model is based, drops sharply at lower flow rates. A high temperature rise system operating in a cold climate would be expected to provide lower efficiency due to low average collector flow rates.
Building Type(Design Objective)
RETScreen[kWh/m²/d]
SWift[kWh/m²/d]
Difference
Industrial (High Temperature Rise) 1.40 1.64 -15%
Industrial (High Effi ciency) 2.00 2.20 -9%
Commercial (High Effi ciency) 2.03 1.93 5%
Table 2: Comparison of Energy Savings Calculated by RETScreen and SWift - Winnipeg Weather Data.
The monitored system in Winnipeg was a high efficiency installation but was somewhat different than the one modelled by RETScreen in terms of size and operating schedule. The monitored data showed average annual savings of 1.50 kWh/m²/d whereas RETScreen predicted 2.00 kWh/m²/d. This represents an over prediction of 33%. Again, the use of average rather than monitored weather data makes the comparison slightly less valid.
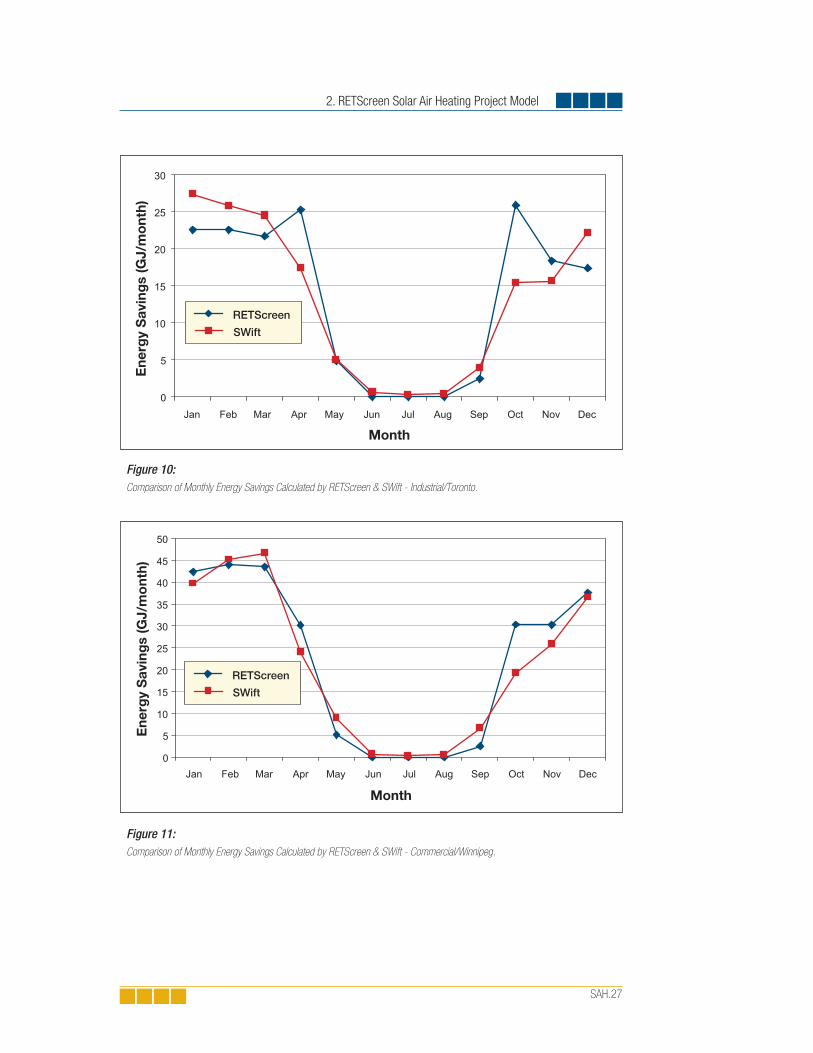
In the RETScreen Solar Air Heating Project Model the Solar Resource worksheet has hidden columns that contain the monthly energy savings values. There are columns corresponding to each mode of energy savings. The SWift program also reports monthly energy savings by each mode. For a detailed comparison, the monthly values as determined by each of the programs are plotted. A monthly comparison of total savings for an industrial building (high temperature rise) in Toronto is presented in Figure 10. The figure shows that there is a relatively good month-by-month agreement between SWift and RETScreen in the modelling of heating systems for industrial buildings. During the heating season, the energy savings appear to be slightly lower according to the RETScreen analysis but are then bolstered by slightly higher savings in the transitional period, resulting in an acceptable annual value.
A monthly comparison of total savings for a commercial building (high efficiency) in Winnipeg is presented in Figure 11. It shows an even better month-by-month agreement between SWift and RETScreen in the modelling of heating systems for commercial/residential buildings. The monthly profiles do not deviate significantly between the SWift and RETScreen analyses.
The comparison of RETScreen model predictions with monitored data, together with the model-to-model comparison with the SWift hourly simulation tool, confirms the adequacy of RETScreen for pre-feasibility studies of solar air heating projects.
2. RETScreen Solar Air Heating Project Model
SAH.27
Figure 10: Comparison of Monthly Energy Savings Calculated by RETScreen & SWift - Industrial/Toronto.
0
5
10
15
20
25
30
Ene
rgy
Sav
ing
s (G
J/m
ont
h)
Month
RETScreen
SWift
Jan Feb Mar Apr May Jun Jul Aug Sep Oct Nov Dec
Figure 11: Comparison of Monthly Energy Savings Calculated by RETScreen & SWift - Commercial/Winnipeg.
0
5
10
15
20
25
30
35
40
45
50
Jan Feb Mar Apr May Jun Jul Aug Sep Oct Nov Dec
Ene
rgy
Sav
ing
s (G
J/m
ont
h)
Month
RETScreen
SWift
Solar Air Heating Project Analysis Chapter
SAH.28
2.7 Summary
In this section the algorithms used by the RETScreen Solar Air Heating Project Model have been shown in detail. The model calculates energy savings resulting from the installation of a perforated plate solar collector. Energy savings are the sum of solar energy actively collected, building heat recapture savings, and destratification savings. Depending on the type of system considered, only some of these savings may apply: process heat systems only benefit from active gains, residential/commercial systems also benefit from building heat recapture and heating systems for industrial buildings benefit from all three modes of savings. Active solar energy gains are calculated with the help of an empirical collec-tor efficiency curve. Other savings are approximated from simple energy balances using monthly average values. The calculation of overall energy savings is straightforward in the case of commercial/residential and process heat systems, where the collector flow rate is set by design; the calculation is more complicated in the case of heating systems for industrial buildings because collector flow rate depends on the mixing ratio with recirculated air, and an iterative procedure has to be used.
Despite the simplifications introduced, comparison of the RETScreen model predictions to results of an hourly simulation program and to monitored data shows that the accuracy of the RETScreen Solar Air Heating Project Model is excellent in regards to the preparation of pre-feasibility studies. This is particularly true given the fact that RETScreen only requires 12 points of weather data versus 8,760 points of data for hourly simulation models.
SAH.29
REFERENCES
Carpenter, S., Daniels, S., Kemp, S., Kokko, J. and Van Decker,, G., New Tools for Assessing the Performance of Solar Ventilation Air Heating Systems, Proc. 8th Biannual Conference on Solar Energy in High Latitudes (North Sun ‘99), Incorporating the 25th Annual Conference of the Solar Energy Society of Canada Inc. (SESCI), Edmonton, AB, Canada, 1999.
Duffi e, J.A. and Beckman, W.A., Solar Engineering of Thermal Processes, 2nd Edition, John Wiley & Sons, 1991.
Energy, Mines and Resources Canada (EMR), Heating and Cooling Equipment (Steam and Water), Energy Management Series 9, 1985.
Enermodal Engineering Limited, The Market for Solar Preheated Ventilation Systems in Canadian Remote Communities, Report prepared for Natural Resources Canada, 1997.
Enermodal, The SWift Computer Program, Available from Enermodal Engineering Limited, 650 Riverbend Drive, Kitchener, ON, Canada, N2K 3S2, 1999.
International Energy Agency, Low Cost, High Performance Solar Air-Heating Systems Using Perforated Absorbers: A Report of Task 14 – Air Systems Working Group, Morse Associates, Inc., Washington, DC, USA, 1999.