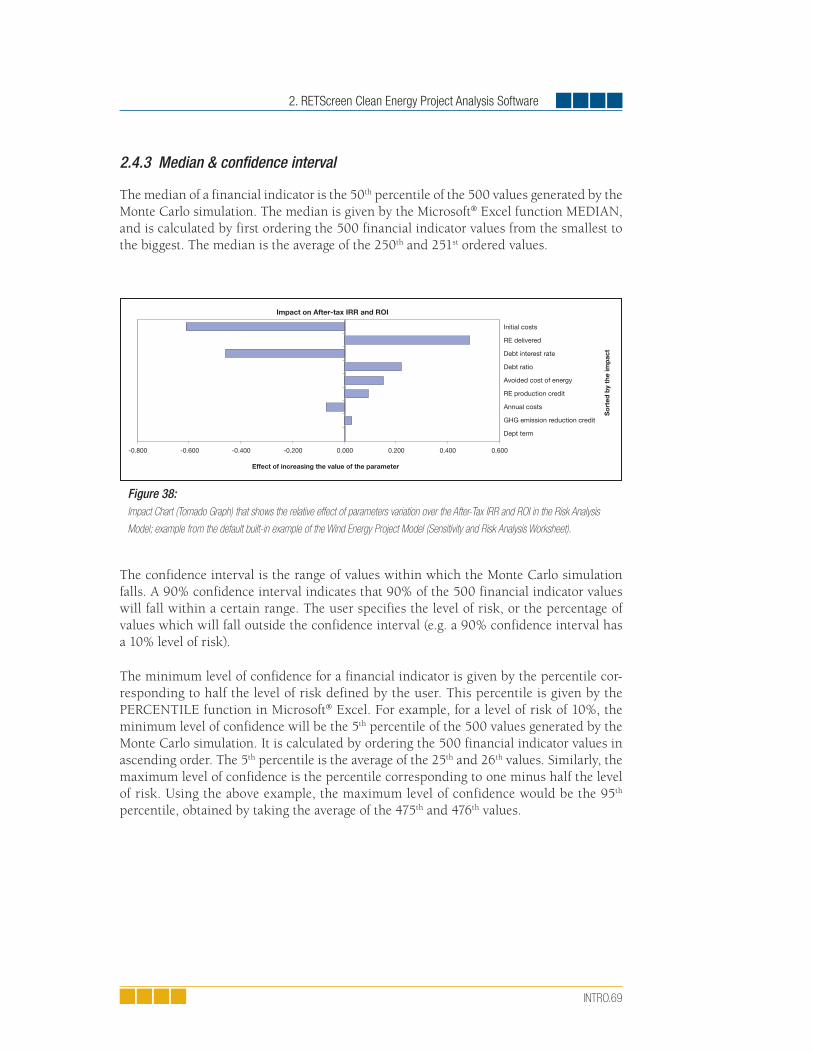
INTRODUCTIONTO CLEAN ENERGY PROJECT ANALYSISCHAPTER
CLEAN ENERGY PROJECT ANALYSIS:RETSCREEN® ENGINEERING & CASES TEXTBOOK
DisclaimerThis publication is distributed for informational purposes only and does not necessarily reflect the v iews of the Government of Canada nor constitute an endorsement of any commercial product or person. Nei ther Canada, nor i ts ministers, officers, employees and agents makeany warranty in respect to this publication nor a s s u m e a n y l i a b i l i t y a r i s i n g o u t o f t h i s publication.
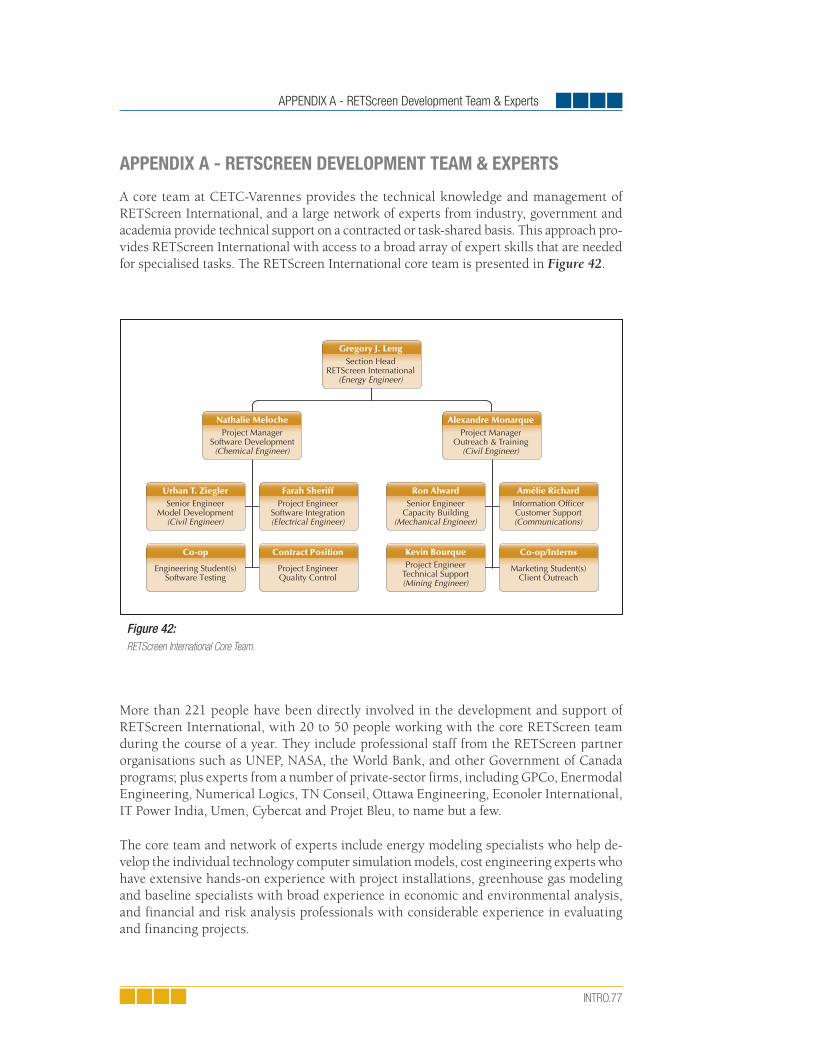
APPENDIX A – RETSCREEN DEVELOPMENT TEAM & EXPERTS . . . . . . . . . . . . . . . 77
INTRO.5
INTRODUCTION TO CLEAN ENERGY PROJECT ANALYSIS CHAPTERClean Energy Project Analysis: RETScreen® Engineering & Cases is an electronic textbook for professionals and uni-versity students. This chapter introduces the analysis of potential clean energy projects, including a status of clean energy technologies, a presentation of project analysis using the RETScreen® International Clean Energy Project Analysis Software, a brief review of the weather and product data available with the RETScreen® Software and a detailed description of the al-gorithms for the greenhouse gas analysis, the fi nancial analysis and the sensitivity and risk analysis found in the RETScreen® Software. A collection of project case studies, with assignments, worked-out solutions and information about how the projects fared in the real world, is available at the RETScreen® International Clean Energy Decision Support Centre Website www.retscreen.net.
1 CLEAN ENERGY PROJECT ANALYSIS BACKGROUND1
The use of clean energy technologies—that is, energy efficient and renewable energy technologies (RETs)—has increased greatly over the past several decades. Technologies once considered quaint or exotic are now commercial realities, providing cost-effective alternatives to conventional, fossil fuel-based systems and their associated problems of greenhouse gas emissions, high operating costs, and local pollution.
In order to benefit from these technologies, potential users, decision and policy makers, planners, project financiers, and equipment vendors must be able to quickly and easily as-sess whether a proposed clean energy technology project makes sense. This analysis allows for the minimum investment of time and effort and reveals whether or not a potential clean energy project is sufficiently promising to merit further investigation.
The RETScreen International Clean Energy Project Analysis Software is the leading tool specifically aimed at facilitating pre-feasibility and feasibility analysis of clean energy tech-nologies. The core of the tool consists of a standardised and integrated project analysis software which can be used worldwide to evaluate the energy production, life-cycle costs and greenhouse gas emission reductions for various types of proposed energy efficient and renewable energy technologies. All clean energy technology models in the RETScreen Software have a common look and follow a standard approach to facilitate decision-mak-ing – with reliable results2. Each model also includes integrated product, cost and weather databases and a detailed online user manual, all of which help to dramatically reduce the time and cost associated with preparing pre-feasibility studies. The RETScreen Software is perhaps the quickest and easiest tool for the estimation of the viability of a potential clean energy project.
1. Some of the text in this chapter comes from the following reference: Leng, G., Monarque, A., Graham, S., Higgins,
S., and Cleghorn, H., RETScreen® International: Results and Impacts 1996-2012, Natural Resources Canada’s
CETC-Varennes, ISBN 0-662-11903-7, Cat. M39-106/2004F-PDF, 44 pp, 2004.
2. All RETScreen models have been validated by third-party experts and the results are published in the RETScreen
Engineering e-Textbook technology chapters.
1. Clean Energy Project Analysis Background
Introduction to Clean Energy Project Analysis Chapter
INTRO.6
Since RETScreen International contains so much information and so many useful features, its utility extends beyond pre-feasibility and feasibility assessment. Someone with no prior knowledge in wind energy, for example, could gain a good understanding of the capa-bilities of the technology by reading through relevant sections of this e-textbook and the RETScreen Software’s built-in “Online Manual.” An engineer needing to know the monthly solar energy falling on a sloped surface at a building site could find this very quickly using the solar resource calculator. An architect investigating energy efficient windows for a new project could use the product database integrated into the RETScreen Passive Solar Heating Project Model to find windows vendors which have certain thermal properties. An investor or banker could use the sensitivity and risk analysis capabilities available in the model to evaluate the risk associated with an investment in the project. The RETScreen Software is very flexible, letting the user focus on those aspects that are of particular interest to him or her.
This e-textbook complements the RETScreen Software, serving the reader in three ways:
It familiarizes the reader with some of the key clean energy technologies covered by RETScreen International;
It introduces the RETScreen Software framework for clean energy project analysis; and
It serves as a reference for the assumptions and methods underlying each RETScreen Clean Energy Technology Model.
The e-textbook progresses from a general overview of clean energy technologies and project analysis to a more detailed examination of each of these technologies and how they are modeled in the RETScreen Software. To this end, the Introduction Chapter first explains the reasons for the mounting interest in clean energy technology and provides a quick synopsis of how these technologies work, as well as their applications and markets. The chapter then proceeds to discuss the importance of pre-feasibility and feasibility analy-sis in the project implementation cycle. Finally, it describes the methods common to all RETScreen Clean Energy Technology Models: the use of climate and renewable energy resource data, the greenhouse gas emission reduction calculation, the financial analysis, and the sensitivity and risk analysis.
Each of the subsequent chapters is dedicated to one of the key clean energy technologies addressed by RETScreen International. Background information on the technology itself expands on the synopsis of the Introduction Chapter; each chapter then continues with a detailed description of the algorithms used in the clean energy model, including assump-tions, equations, and limitations of the approach. The last section of each chapter recounts the various ways that the accuracy of the model has been investigated and validated, nor-mally through third party comparisons with other simulations or measured data.
1. Clean Energy Project Analysis Background
INTRO.7
The combination of the RETScreen Software and its associated tools, which are all avail-able free-of-charge via the RETScreen Website, provide a complete package to guide and inform, distilled from the experience of over 210 experts3 from industry, government and academia, that will be useful to all those interested in the proper technical and financial analysis of potential clean energy projects.
1.1 Clean Energy Technologies
This section introduces clean energy technologies by first comparing renewable energy technologies with energy efficiency measures, then presenting reasons for their growing interest worldwide, and by describing their overall common characteristics. The text then presents an overview of some of the clean energy technologies considered directly by the RETScreen International Clean Energy Project Analysis Software; more in-depth informa-tion is available in the individual chapters dedicated to each technology. Finally, other commercial and emerging clean energy technologies are briefly overviewed.
1.1.1 Energy effi ciency versus renewable energy technologies
Clean energy technologies consist of energy efficient and renewable energy technologies (RETs). Both of these reduce the use of energy from “conventional” sources (e.g. fossil fuels) but they are dissimilar in other respects.
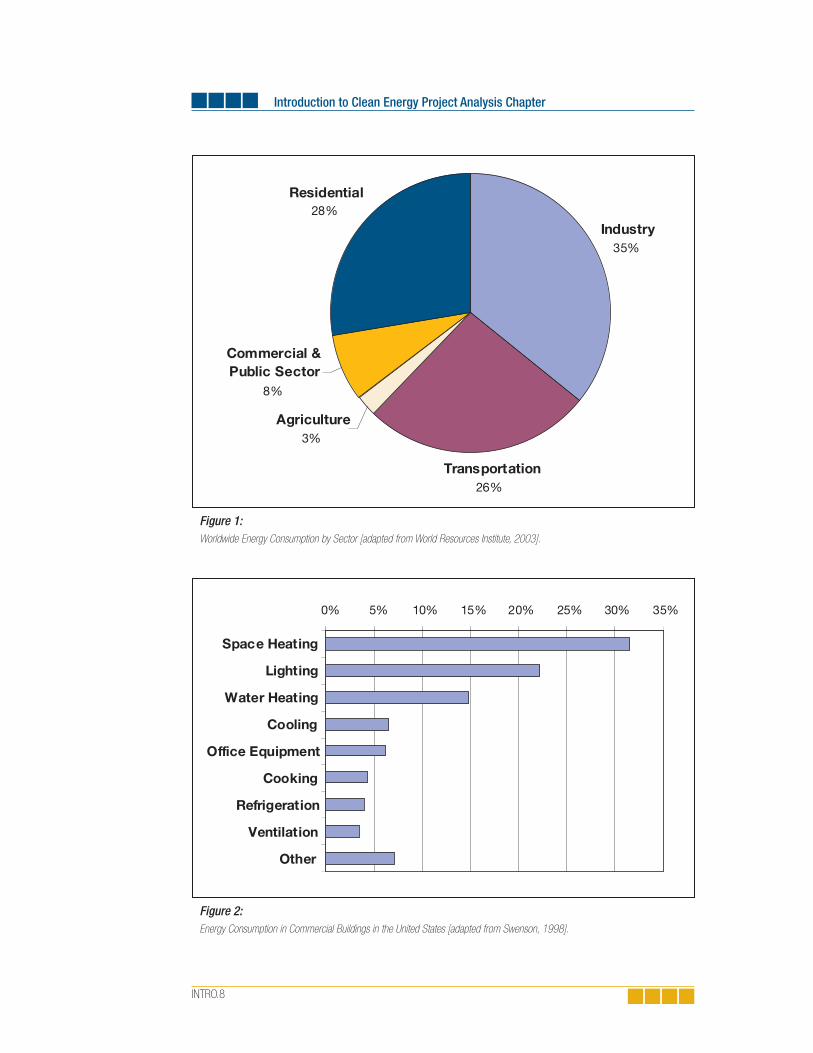
“Energy efficiency measures” refers to methods and means for reducing the energy con-sumed in the provision of a given good or service, especially compared to conventional or standard approaches. Often the service being provided is heating, cooling, or electricity generation. Efficient refrigeration systems with waste heat recovery are an example of such an energy efficient technology: they can provide the same level of cooling as conventional refrigeration technologies, but require significantly less energy. Energy efficiency measures can be applied to various sectors and applications (see Figure 1 and Figure 2).
Clean energy technologies that fall into the energy efficiency category typically include combined heat and power systems, efficient refrigeration technologies, efficient lighting systems, ventilation heat recovery systems, variable speed motors for compressors and ventilation fans, improved insulation, high performance building envelopes and windows, and other existing and emerging technologies.
Renewable energy technologies transform a renewable energy resource into useful heat, cooling, electricity or mechanical energy. A renewable energy resource is one whose use does not affect its future availability. For example, every unit of natural gas burned in order to heat a building results in one less unit of natural gas for future needs. In contrast, using solar energy to heat the building does nothing to reduce the future supply of sunshine. Some renewable energy resources cease to be renewable when they are abused: trees can provide a renewable supply of biomass for combustion, for example, but not if the rate of harvest leads to deforestation.
3. See Appendix A for a detailed list of experts involved in RETScreen International.
Introduction to Clean Energy Project Analysis Chapter
INTRO.8
Industry35%
Transportation26%
Agriculture3%
Commercial & Public Sector
8%
Residential28%
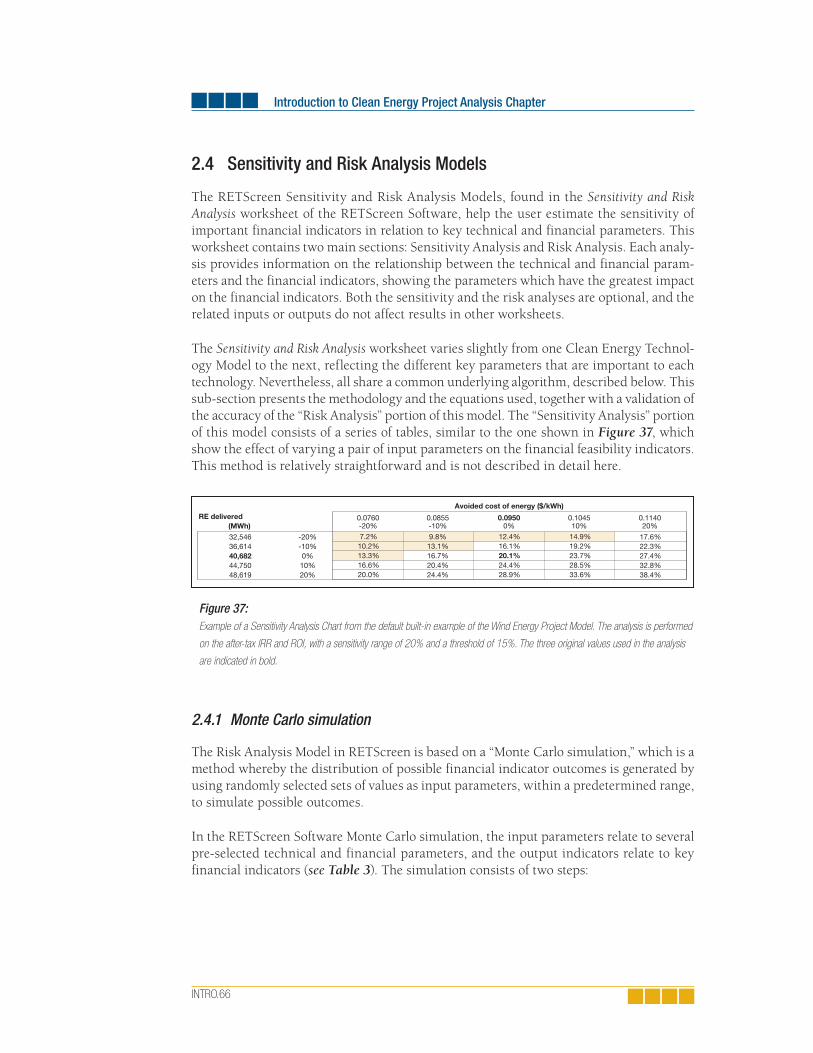
Figure 1:Worldwide Energy Consumption by Sector [adapted from World Resources Institute, 2003].
0% 5% 10% 15% 20% 25% 30% 35%
Space Heating
Lighting
Water Heating
Cooling
Office Equipment
Cooking
Refrigeration
Ventilation
Other
Figure 2:Energy Consumption in Commercial Buildings in the United States [adapted from Swenson, 1998].
1. Clean Energy Project Analysis Background
INTRO.9
RETs include systems that convert sunshine into electricity, heating, and cooling; that generate electricity from the power in wind, falling water (i.e. hydroelectric generation), waves, or tides; and that extract heat from the ground or that provide cooling by rejecting heat to the ground.
Normally, project planners should apply cost-effective energy efficiency measures first, and then consider RETs. Typically there are inefficiencies that can be reduced with fairly minimal investments, yielding significant reductions in energy consumption; achieving the same reductions with RETs is often more costly. Furthermore, by reducing the energy that must be supplied by the RETs, the efficiency measure permits a smaller renewable energy system to be used. Since RETs tend to have high initial costs, the investment in efficiency can make RETs more financially attractive.
As an example, consider a hypothetical house, similar to the one shown in Figure 3, con-nected to the electric grid, in a cold climate. If the objective is to reduce consumption of conventional energy, the first consideration should be the building envelope: high lev-els of insulation, minimal thermal bridging, and airtight construction reduce heat losses throughout the winter. Then, heating and cooling systems should be designed and appli-ances selected so as to minimize energy use. Finally, renewable energy technologies such as solar water heating and photovoltaics (the generation of electricity directly from sunlight) can be considered.
A photovoltaic system installed on the roof of this house would garner more attention from neighbours than improving the building envelope, but would contribute far less to the goal of reducing energy consumption, at a much higher cost.
In many projects, commercially available efficiency measures can halve energy consumption compared to standard practices. Then the use of cost-effective renewable energy technolo-gies can cut, or even eliminate, the remaining conventional energy consumption further.
Figure 3:Effi ciency Measures, Passive Solar
Design and a Solar Water Heating
System Combined in a Residential
Application in Canada.
Photo Credit: Waterloo Green Home
Introduction to Clean Energy Project Analysis Chapter
INTRO.10
Sometimes, the distinction between energy efficient technologies and RETs becomes blurred. In the case of the house just discussed, high performance windows (i.e. permit-ting minimal heat loss) could be considered as part of the envelope and thus an efficiency measure. But if they are oriented towards the equator and properly shaded to avoid summer overheating inside the house, these windows permit sunshine to heat the house only in the winter—making them a RET as well (i.e. passive solar heating). Similarly, a ground-source heat pump, which extracts heat from the ground, is an efficient way to use electricity (which drives the heat pump) to heat the house. But the heat from the ground is ultimately provided by solar energy. Fortunately, the distinction is not that important: the goal, to save money and reduce conventional energy consumption, is the same regardless of the nature of the clean energy technology.
1.1.2 Reasons for the growing interest in clean energy technologies
Clean energy technologies are receiving increasing attention from governments, industry, and consumers. This interest reflects a growing awareness of the environmental, economic, and social benefits that these technologies offer.
Environmental reasons
Environmental concern about global warming and local pollution is the primary impetus for many clean energy technologies in the 21st century. Global warming is the phenomenon of rising average temperatures observed worldwide in recent years. This warming trend is generally attributed to increased emission of certain gases, known as greenhouse gasses, which include carbon dioxide, methane, nitrous oxide, water vapour, ozone, and several classes of halocarbons (compounds containing carbon in combination with fluorine, bromine, and/or chlorine). Greenhouse gasses are so-called because their presence in the atmosphere does not block sunlight from reach-ing the earth’s surface, but does slow the escape of heat from the earth. As a result, heat becomes trapped, as in a greenhouse, and temperatures rise (see Figure 4).
Global warming has the potential to cause massive ecological and human devasta-tion. In the past, drastic, rapid changes in climate have resulted in extinction for large numbers of animal and plant species. Sea levels will rise as ice caps melt, inundating low-lying areas around the world. While average temperatures will rise, extreme weather events, including winter storms and extreme cold, are expected to increase in frequency. Some areas will experience more flooding, while other areas will suffer drought and desertification, straining the remaining agricultural land. Changing climate may permit tropical diseases such as malaria to invade temperate zones, including Europe and North America. Societies whose lifestyle is closely tied to certain ecosystems, such as Aboriginal peoples, are expected to be hit particularly hard by the environmental effects of global warming.
1. Clean Energy Project Analysis Background
INTRO.11
There is a strong consensus among the scientists who study climate that the global warming now observed is caused by human activity, especially the combustion of fossil fuels. When oil, gas, or coal are burned to propel cars, generate electricity or provide heat, the products of the combustion include carbon dioxide, nitrous oxide, and methane. Thus, our conventional energy systems are in large measure responsible for this impending environmental problem (IPCC, 2001). Clean energy technologies address this problem by reducing the amount of fossil fuels combusted. The RETScreen Clean Energy Project Analysis Software allows the user to estimate the reduction in greenhouse gas emissions associated with using a clean energy technology in place of a conventional energy technology.
Global warming is not the only environmental concern driving the growth in clean energy technologies. Conventional energy systems pollute on a local, as well as global, scale. Combustion releases compounds and particulates that exacerbate res-piratory conditions, such as the smog that envelops many cities; sulphur-containing coal causes acid rain when it is burned. Furthermore, local pollution is not limited to combustion emissions: for small systems, noise and visual pollution can be just as significant to people living and working nearby, and fuel spills result in serious damage to the local environment and costly clean-ups. For example, consider a power system for a warden’s residence in a remote park. If a diesel-burning engine were used to drive a generator, the wardens and visitors would hear the drone of the engine (noise pollution) and see the fuel containers (visual pollution), and the system operator would have to be very careful not to contaminate the area with spilled diesel fuel. These concerns could be reduced or eliminated through the use of photovoltaic or wind power, two clean energy technologies.
Figure 4: Absorption of solar energy heats up the earth.
Photo Credit: NASA Goddard Space Flight Center (NASA-GSFC)
Introduction to Clean Energy Project Analysis Chapter
INTRO.12
Economic reasons
Much of the recent growth in clean energy technology sales has been driven by sales to customers for whom environmental concerns are not necessarily the prime motivation for their decision to adopt clean energy technology. Instead, they are basing their decision on the low “life-cycle costs,” or costs over the lifetime of the project, associated with clean energy technologies. As will be discussed in the next section, over the long term, clean energy technologies are often cost-competitive, or even less costly, when compared to conventional energy technologies.
It is not merely the expense of conventional energy that make conventional energy systems unattractive; often the uncertainty associated with this expense is even more troublesome. Conventional energy prices rise and fall according to local, national, continental, and global conditions of supply and demand. Several times over the past decade, unforeseen spikes in the price of conventional energy—elec-tricity, natural gas, and oil—have caused severe financial difficulties for individuals, families, industry, and utilities. This is not just of concern to consumers, but also to the governments which are often held accountable for the state of the economy.
There are good reasons for believing that conventional energy costs will rise in the coming decades. Throughout much of the world, the rate of discovery of new oil reserves is declining, while at the same time, demand is rising. Remaining conven-tional reserves, while vast, are concentrated in a few countries around the world. Large unconventional reserves, such as oil sands, exist in Canada, Venezuela and other regions, but the manufacture of usable fuel (or “synthetic crude”) from these sources is more expensive than conventional methods and emits additional green-house gasses. Rising energy prices and the risk of price shocks makes clean energy technologies more attractive.
Integral to the RETScreen Software are sophisticated but easy-to-use financial anal-ysis and sensitivity & risk analysis worksheets that helps determines the financial viability and risks of a clean energy project. The user can investigate the influence of a number of financial parameters, including the rate at which the price of energy may escalate.
Social reasons
Clean energy technologies are associated with a number of social benefits that are of particular interest to governments. Firstly, clean energy technologies gener-ally require more labour per unit of energy produced than conventional energy technologies, thus creating more jobs. Secondly, conventional energy technologies exploit concentrated energy resources in a capital-intensive manner and require the constant exploration for new sources of energy. In contrast, energy efficiency measures focus on maximizing the use of existing resources and RETs “harvest” more dispersed, dilute energy resources. This generally requires more human inter-vention, either in applying the technology or in manufacturing and servicing the equipment. The additional cost of the labour required by clean energy technologies is offset by the lower cost of energy inputs. For example, in the case of solar and wind energy, the energy input is free.
1. Clean Energy Project Analysis Background
INTRO.13
Fossil fuel imports drain money from the local economy. On the other hand, energy efficiency measures are applied to local systems and RETs make use of local resourc-es. Therefore, transactions tend to be between local organizations. When money stays within the local area, its “multiplier effect” within that area is increased. For example, compare a biomass combustion system making use of waste woodchips to a boiler fired with imported oil. In the latter case, fuel purchases funnel money to oil companies located far from the community; in the former, woodchip collection, quality assurance, storage, and delivery are handled by a local company that will use local labour and that will then spend a portion of its revenues at local stores and service providers and the money will circulate within the community. Globally, this may or may not be advantageous, but it is certainly of interest to local governments, and a driver for their interest in clean energy technologies.
Another social and economic reason for the interest in clean energy technologies is simply the growing demand for energy. The International Energy Agency (IEA) has forecast that, based on historical trends and economic growth, worldwide energy demand will have tripled by 2050 (IEA, 2003). Industries have seen the potential of this expansion, and governments the need for new technologies and fuels to meet this demand. This has stimulated interest in clean energy technologies.
1.1.3 Common characteristics of clean energy technologies
Several characteristics shared by clean energy technologies become apparent when they are compared to conventional energy technologies; these have already been mentioned in passing, but deserve further emphasis.
First, clean energy technologies tend to be environmentally preferable to conventional technologies. This is not to say that they have no environmental impact, nor that they can be used without heed for the environment. All heating systems, power generators, and, by extension, energy consumers, have some environmental impact. While this cannot be eliminated, it must be minimized, and clean energy technologies have been built to address the most pressing environmental problems. When used responsibly and intelligently, they provide energy benefits at an environmental cost far below that of conventional technolo-gies, especially when the conventional technology relies on fossil fuel combustion.
Second, clean energy technologies tend to have higher initial costs (i.e., costs incurred at the outset of the project) than competing conventional technologies. This has led some to conclude that clean energy technologies are too expensive. Unfortunately, this view ignores the very real costs that are incurred during operation and maintenance of any energy sys-tem, whether clean or conventional.
Third, clean energy technologies tend to have lower operating costs than conventional technologies. This makes sense, because efficiency measures reduce the energy require-ment and RETs make use of renewable energy resources often available at little or no marginal cost.
Introduction to Clean Energy Project Analysis Chapter
INTRO.14
So how can the high initial costs and low operating costs of clean energy technologies be compared with the low initial costs and high operating costs of conventional technologies? The key is to consider all costs over the lifetime of the project. These include not just the initial costs (feasibility assessment, engineering, development, equipment purchase, and installation) but also:
Annual costs for fuel and operation and maintenance;
Costs for major overhauls or replacement of equipment;
Costs for decommissioning of the project (which can be very signifi cant for technologies that pollute a site, through fuel spills, for example); and
The costs of fi nancing the project, such as interest charges.
All these costs must then be summed, taking into account the time value of money, to determine the overall “lifecycle cost” of the project.
This leads to the fourth characteristic common to clean energy technologies: despite their higher initial costs, they are often cost-effective compared with conventional technolo-gies on a lifecycle cost basis, especially for certain types of applications. The RETScreen Clean Energy Project Analysis Software has been developed specifically to facilitate the identification and tabulation of all costs and to perform the lifecycle analysis, so that a just comparison can reveal whether clean energy technologies make sense for a given project.
1.1.4 Renewable energy electricity generating technologies
RETScreen International addresses a number of renewable energy electricity generating technologies. The four most widely applied technologies are discribed here. These are wind energy, photovoltaics, small hydro, and biomass combustion power technologies. The first three technologies are briefly introduced in the sections that follow and the fourth technology is introduced later as part of the combined heat and power technology section. More in-depth information is also available in the chapters specifically dedicated to each of these technologies.
Wind energy systems
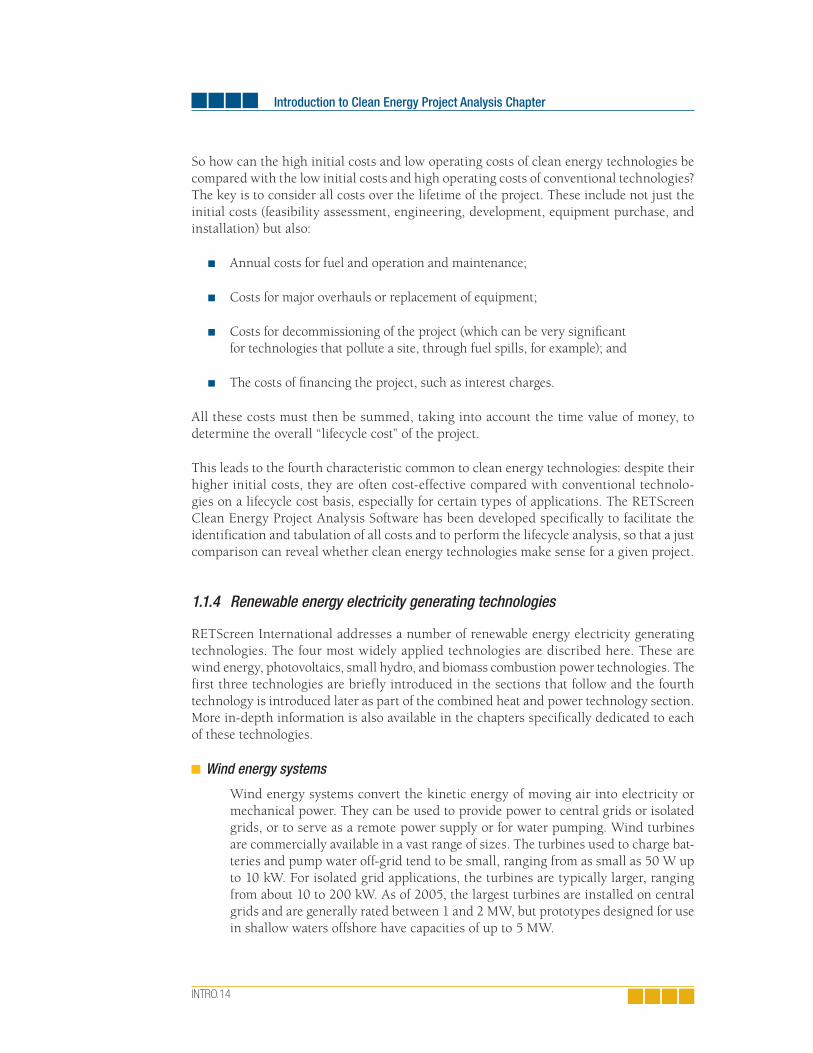
Wind energy systems convert the kinetic energy of moving air into electricity or mechanical power. They can be used to provide power to central grids or isolated grids, or to serve as a remote power supply or for water pumping. Wind turbines are commercially available in a vast range of sizes. The turbines used to charge bat-teries and pump water off-grid tend to be small, ranging from as small as 50 W up to 10 kW. For isolated grid applications, the turbines are typically larger, ranging from about 10 to 200 kW. As of 2005, the largest turbines are installed on central grids and are generally rated between 1 and 2 MW, but prototypes designed for use in shallow waters offshore have capacities of up to 5 MW.
1. Clean Energy Project Analysis Background
INTRO.15
A good wind resource is criti-cal to the success of a commer-cial wind energy project. The energy available from the wind increases in proportion to the cube of the wind speed, which typically increases with height above the ground. At mini-mum, the annual average wind speed for a wind energy project should exceed 4 m/s at a height of 10 m above the ground. Cer-tain topographical features tend to accelerate the wind, and wind turbines are often located along these features. These include the crests of long, gradual slopes (but not cliffs), passes between moun-tains or hills, and valleys that channel winds. In addition, areas that present few obstructions to winds, such as the sea surface adjacent to coastal regions and flat, grassy plains, may have a good wind resource.
Since the early 1990s, wind energy technology has emerged as the fastest growing electricity generation technology in the world. This reflects the steady decline in the cost of wind energy production that has accompanied the maturing of the technol-ogy and industry: where a good wind resource and the central grid intersect, wind energy can be among the lowest cost provider of electricity, similar in cost to natural gas combined-cycle electricity generation.
Small hydro systems
Small hydro systems convert the potential and kinetic energy of moving water into electricity, by using a turbine that drives a generator. As water moves from a higher to lower elevation, such as in rivers and waterfalls, it carries energy with it; this energy can be harnessed by small hydro systems. Used for over one hundred years, small hydro systems are a reliable and well-understood technology that can be used to provide power to a central grid, an isolated grid or an off-grid load, and may be either run-of-river systems or include a water storage reservoir.
Most of the world’s hydroelectricity comes from large hydro projects of up to sev-eral GW that usually involve storage of vast volumes of water behind a dam. Small hydro projects, while benefiting from the knowledge and experience gleaned from the construction of their larger siblings, are much more modest in scale with installed capacities of less than 50 MW. They seldom require the construction of a large dam, except for some isolated locations where the value of the electricity is very high due to few competing power options. Small hydro projects can even be less than 1 kW in capacity for small off-grid applications.
Figure 5:
Wind Energy System.
Photo Credit: NRCan
Introduction to Clean Energy Project Analysis Chapter
INTRO.16
An appreciable, constant flow of water is critical to the success of a commercial small hydro project. The energy available from a hydro turbine is proportional to the quantity of water passing through the turbine per unit of time (i.e. the flow), and the vertical difference between the turbine and the surface of the water at the water inlet (i.e. the head)4. Since the majority of the cost of a small hydro project stems from up front expenses in construction and equipment purchase, a hydro project can generate large quantities of electricity with very low operating costs and modest maintenance expenditures for 50 years or longer.
In many parts of the world, the opportunities for further large hydro developments are dwindling and smaller sites are being examined as alternatives giving significant growth potential for the small hydro market (e.g. China).
Photovoltaic systems
Photovoltaic systems convert energy from the sun directly into electricity. They are composed of photovoltaic cells, usually a thin wafer or strip of semiconductor material, that generates a small current when sunlight strikes them. Multiple cells can be assembled into modules that can be wired in an array of any size. Small photovoltaic arrays are found in wristwatches and calculators; the largest arrays have capacities in excess of 5 MW.
Photovoltaic systems are cost-effective in small off-grid applications, provid-ing power, for example, to rural homes in developing countries, off-grid cottages and motor homes in industrialised countries, and remote telecommunications, monitoring and control systems worldwide. Water pumping is also a notable off-grid application of photovoltaic systems that are used for domestic water supplies, agriculture and, in developing countries, provision of water to villages. These power systems are relatively simple, modular, and highly reliable due to the lack of moving parts. Photovoltaic systems can be combined with fossil fuel-driven generators in
4. In reality, this must be adjusted for various losses.
Figure 6:Small Hydro System.
Photo Credit: SNC-Lavalin.
1. Clean Energy Project Analysis Background
INTRO.17
applications having higher energy demands or in climates characterized by extend-ed periods of little sunshine (e.g. winter at high latitudes) to form hybrid systems.
Photovoltaic systems can also be tied to isolated or central grids via a specially configured inverter. Unfortunately, without subsidies, on-grid (central grid-tied) applications are rarely cost-effective due to the high price of photovoltaic modules, even if it has declined steadily since 1985. Due to the minimal maintenance of pho-tovoltaic systems and the absence of real benefits of economies of scale during con-struction, distributed generation is the path of choice for future cost-effective on-grid applications. In distributed electricity generation, small photovoltaic systems would be widely scattered around the grid, mounted on buildings and other structures and thus not incurring the costs of land rent or purchase. Such applications have been facilitated by the development of technologies and practices for the integration of photovoltaic systems into the building envelope, which offset the cost of conven-tional material and/or labour costs that would have otherwise been spent.
Photovoltaic systems have seen the same explosive growth rates as wind turbines, but starting from a much smaller installed base. For example, the worldwide installed pho-tovoltaic capacity in 2003 was around 3,000 MW, which represents less than one-tenth that of wind, but yet is growing rapidly and is significant to the photovoltaic industry.
1.1.5 Renewable energy heating and cooling technologies
RETScreen International addresses a number of renewable energy heating and cooling technologies that have the potential to significantly reduce the planet’s reliance on con-ventional energy resources. These proven technologies are often cost-effective and have enormous potential for growth. The main ones described here include: biomass heating, solar air heating, solar water heating, passive solar heating, and ground-source heat pump technologies. They are briefly introduced in the sections that follow, with more in-depth information available in the chapters specifically dedicated to each of these technologies.
Figure 7: Photovoltaic System at Oberlin
College’s Adam Joseph Lewis Center
for Environmental studies (USA); the panels
cover 4,682 square feet on the buildings
south-facing curved roof.
Photo Credit:Robb Williamson/NREL Pix.
Introduction to Clean Energy Project Analysis Chapter
INTRO.18
Biomass heating systems
Biomass heating systems burn organic matter—such as wood chips, agricultural residues or even municipal waste—to generate heat for buildings, whole commu-nities, or industrial processes. More sophisticated than conventional woodstoves, they are highly efficient heating systems, achieving near complete combustion of the biomass fuel through control of the fuel and air supply, and often incorporating automatic fuel handling systems.
Biomass heating systems consist of a heating plant, a heat distribution system, and a fuel supply operation. The heating plant typically makes use of multiple heat sources, including a waste heat recovery system, a biomass combustion system, a peak load heating system, and a back-up heating system. The heat distribution system conveys hot water or steam from the heating plant to the loads that may be located within the same building as the heating plant, as in a system for a single institutional or industrial building, or, in the case of a “district heating” system, clusters of buildings located in the vicinity of the heating plant.
Biomass fuels include a wide range of materials (e.g. wood residues, agricultural residues, municipal solid waste, etc.) that vary in their quality and consistency far more than liquid fossil fuels. Because of this, the fuel supply operation for a biomass plant takes on a scale and importance beyond that required for most fossil fuels and it can be considered a “component” of the biomass heating system. Biomass heat-ing systems have higher capital costs than conventional boilers and need diligent operators. Balancing this, they can supply large quantities of heat on demand with very low fuel costs, depending on the provenance of the fuel.
Today, 11% of the world’s Total Primary Energy Supply (TPES)5 comes from biomass combustion, accounting for over 20,000 MW (68,243 million Btu/h) of installed capacity worldwide [Langcake, 2003]. They are a major source of energy, mainly for cooking and heating, in developing countries, representing, for example, 50% of the African continent’s TPES [IEA Statistics, 2003].
5. A measure of the total energy used by humans.
Figure 8: Biomass Heating System
Photo Credit: NRCan
1. Clean Energy Project Analysis Background
INTRO.19
Solar air heating systems
Solar air heating systems use solar energy to heat air for building ventilation or industrial processes such as drying. These systems raise the temperature of the out-side air by around 5 to 15ºC (41 to 59ºF) on average, and typically supply a portion of the required heat, with the remainder being furnished by conventional heaters.
A solar air heating system currently considered by RETScreen consists of a transpired collector, which is a sheet of steel or aluminium perforated with numerous tiny holes, through which outside air is drawn. Mounted on an equator-facing building wall, the transpired collector absorbs incident sunshine and warms the layer of air adjacent to it. A fan draws this sun-warmed air through the perforations, into the air space behind the collector and then into the ducting within the building, which distributes the heated air through the building or the industrial processes. Controls regulate the temperature of the air in the building by adjusting the mix of recirculated and fresh air or by modulating the output of a conventional heater. When heat is not required, as in summertime, a damper bypasses the collector. The system also provides a measure of insulation, recuperates heat lost through the wall it covers and can reduce stratification, the pooling of hot air near the ceiling of voluminous buildings. The result is an inexpensive, robust and simple system with virtually no maintenance requirements and efficiencies as high as 80%.
Solar air heating systems tend to be most cost-effective in new construction, when the net cost of the installation of the transpired collector is offset by the cost of the traditional weather cladding it supplants. Also, new-construction gives the designer more latitude in integrating the collector into the building’s ventilation system and aesthetics. Installation of a transpired collector also makes sense as a replacement for aging or used weather cladding.
Given the vast quantities of energy used to heat ventilation air, the use of perforated collectors for solar air heating has immense potential. In general, the market is strongest where the heating season is long, ventilation requirements are high, and conventional heating fuels are costly. For these reasons, industrial buildings constitute the biggest market, followed by commercial and institutional buildings, multi-unit residential build-ings, and schools. Solar air heating also has huge potential in industrial processes which need large volumes of heated air, such as in the drying of agricultural products.
Figure 9: Solar Air Heating System.
Photo Credit: Conserval Engineering
Introduction to Clean Energy Project Analysis Chapter
INTRO.20
Solar water heating systems
Solar water heating systems use solar energy to heat water. Depending on the type of solar collector used, the weather conditions, and the hot water demand, the temper-ature of the water heated can vary from tepid to nearly boiling. Most solar systems are meant to furnish 20 to 85% of the annual demand for hot water, the remainder being met by conventional heating sources, which either raise the temperature of the water further or provide hot water when the solar water heating system cannot meet demand (e.g. at night).
Solar systems can be used wherever moderately hot water is required. Off-the-shelf packages provide hot water to the bathroom and kitchen of a house; custom systems are designed for bigger loads, such as multi-unit apartments, restaurants, hotels, motels, hospitals, and sports facilities. Solar water heating is also used for industrial and commercial processes, such as car washes and laundries.
Worldwide, there are millions of solar collectors in existence, the largest portion installed in China and Europe. The North American market for solar water heating has traditionally been hampered by low conventional energy costs, but a strong demand for swimming pool heating has led unglazed technology to a dominant sales position on the continent. Solar water heating technology has been embraced by a number of developing countries with both strong solar resources and costly or unreliable conventional energy supplies.
Passive solar heating systems
Passive solar heating is the selective use of solar energy to provide space heating in buildings by using properly oriented, high-performance windows, and selected interior building materials that can store heat from solar gains during the day and release it at night. In so doing, passive solar heating reduces the conventional energy required to heat the building. A building employing passive solar heating maintains a comfortable interior temperature year round and can reduce a building’s space heating requirement by 20 to 50%.
Figure 10: Solar Water Heating System.
Photo Credit: NRCan
1. Clean Energy Project Analysis Background
INTRO.21
Improvements to commercial window technologies have facilitated passive solar heating by reducing the rate of heat escape while still admitting much of the inci-dent solar radiation. Due to their good thermal properties, a high-performance window allows the building designer to make better use of daylight since their size and placement are less restricted than conventional windows. The use of high-per-formance windows is becoming standard practice in the building industry today.
Passive solar heating tends to be very cost effective for new construction since at this stage many good design practices—orientation, shading, and window upgrades—can be implemented at little or no additional cost compared to conventional design. Depending on the level of performance desired, specifying windows that perform better than standard wood frame windows with double-glazing adds 5 to 35% to their cost. Reduced energy expenditures rarely justify the replacement of existing windows that are still in good condition, but a window upgrade (e.g. from single to double-glazing) should be considered whenever windows are replaced.
Passive solar heating is most cost-effective when the building’s heating load is high compared to its cooling load. Both climate and the type of building determine this. Cold and moderately cold climates are most promising for passive solar heating design. Low-rise residential construction is more easily justified than commercial and industrial buildings, where internal heat gains may be very high, decreas-ing the required heating load. On the other hand, such buildings may require perimeter heating even when the building’s net heat load is zero or negative; if high-performance windows obviate the need for this perimeter heating they may be very cost-effective.
Figure 11: Passive Solar Heating System.
Photo Credit: McFadden, Pam DOE/NREL
Introduction to Clean Energy Project Analysis Chapter
INTRO.22
Ground-source heat pumps
Ground-source heat pumps provide low temperature heat by extracting it from the ground or a body of water and provide cooling by reversing this process. Their prin-cipal application is space heating and cooling, though many also supply domestic hot water. They can even be used to maintain the integrity of building foundations in permafrost conditions, by keeping them frozen through the summer.
A ground-source heat pump (GSHP) system has three major components: the earth connection, a heat pump, and the heating or cooling distribution system. The earth connection is where heat transfer occurs. One common type of earth connection comprises tubing buried in horizontal trenches or vertical boreholes, or alternatively, submerged in a lake or pond. An antifreeze mixture, water or another heat-transfer fluid is circulated from the heat pump, through the tubing, and back to the heat pump in a “closed loop.” “Open loop” earth connections draw water from a well or a body of water, transfer heat to or from the water, and then return it to the ground (e.g. a second well) or the body of water.
Since the energy extracted from the ground exceeds the energy used to run the heat pump, GSHP “efficiencies” can exceed 100%, and routinely average 200 to 500% over a season. Due to the stable, moderate temperature of the ground, GSHP systems are more efficient than air-source heat pumps, which exchange heat with the outside air. GSHP systems are also more efficient than conventional heating and air-conditioning technologies, and typically have lower maintenance costs. They require less space, especially when a liquid building loop replaces voluminous air ducts, and, since the tubing is located underground, are not prone to vandalism like conventional rooftop units. Peak electricity consumption during cooling sea-son is lower than with conventional air-conditioning, so utility demand charges may be reduced.
Figure 12: Ground-Source
Heat Pump System.
1. Clean Energy Project Analysis Background
INTRO.23
Heat pumps typically range in cooling capacity from 3.5 to 35 kW (1 to 20 tons of cooling). A single unit in this range is sufficient for a house or small commercial building. Larger commercial and institutional buildings often employ multiple heat pumps (perhaps one for each zone) attached to a single earth connection. This allows for greater occupant control of the conditions in each zone and facilitates the transfer of heat from zones needing cooling to zones needing heating. The heat pump usually generates hot or cold air to be distributed locally by conventional ducts.
Strong markets for GSHP systems exist in many industrialised countries where heating and cooling energy requirements are high. Worldwide, 800,000 units total-ling nearly 10,000 MW of thermal capacity (over 843,000 tons of cooling) have been installed so far with an annual growth rate of 10% [Lund, 2003].
1.1.6 Combined Heat and Power (CHP) technologies
The principle behind combined heat and power (or “cogeneration”) is to recover the waste heat generated by the combustion of a fuel6 in an electricity generation system. This heat is often rejected to the environment, thereby wasting a significant portion of the energy avail-able in the fuel that can otherwise be used for space heating and cooling, water heating, and industrial process heat and cooling loads in the vicinity of the plant. This cogeneration of electricity and heat greatly increases the overall efficiency of the system, anywhere from 25-55% to 60-90%, depending on the equipment used and the application.
6. Such as fossil fuels (e.g. natural gas, diesel, coal, etc.), renewable fuels (wood residue, biogas, agricultural byproducts,
bagasse, landfi ll gas (LFG), etc.), hydrogen, etc.
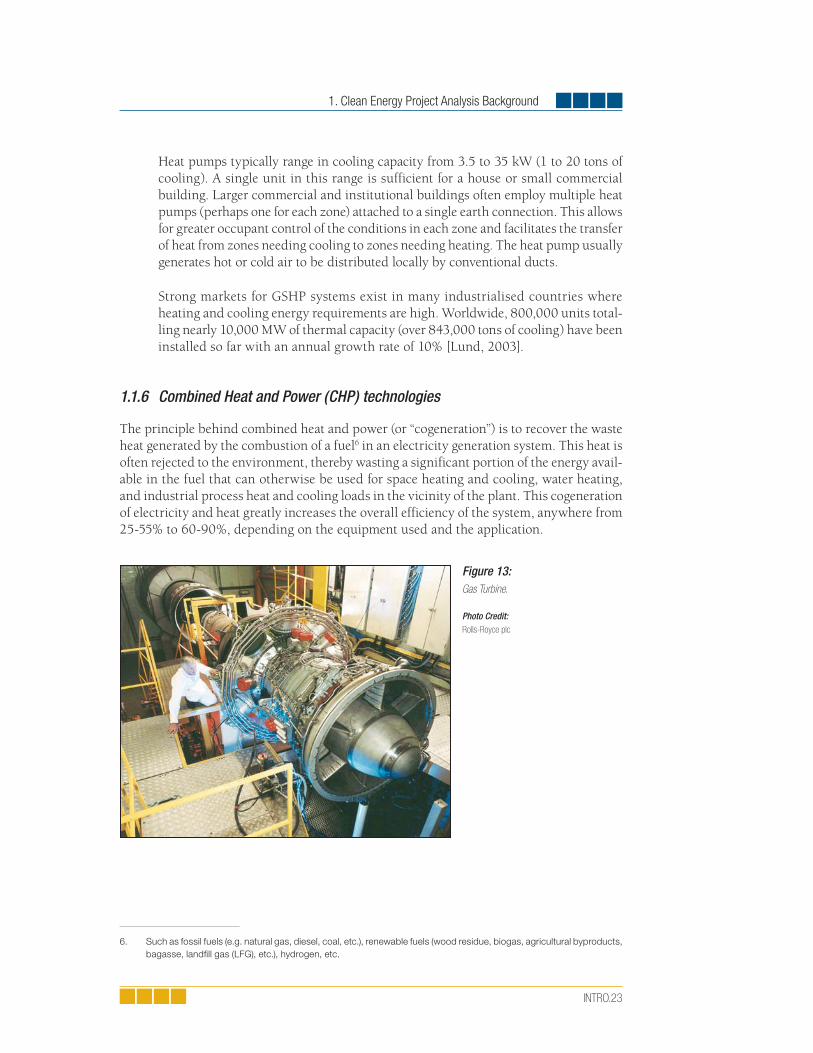
Figure 13: Gas Turbine.
Photo Credit: Rolls-Royce plc
Introduction to Clean Energy Project Analysis Chapter
INTRO.24
Combined heat and power systems can be implemented at nearly any scale, as long as a suitable thermal load is present. For example, large scale CHP for community energy sys-tems and large industrial complexes can use gas turbines (Figure 13), steam turbines, and reciprocating engines with electrical generating capacities of up to 500 MW. Independent energy supplies, such as for hospitals, universities, or small communities, may have capaci-ties in the range of 10 MW. Small-scale CHP systems typically use reciprocating engines to provide heat for single buildings with smaller loads. CHP energy systems with electrical capacities of less than 1 kW are also commercially available for remote off-grid operation, such as on sailboats. When there is a substantial cooling load in the vicinity of the power plant, it can also make sense to integrate a cooling system into the CHP project7. Cooling loads may include industrial process cooling, such as in food processing, or space cooling and dehumidification for buildings.
The electricity generated can be used for loads close to the CHP system, or located else-where by feeding the electric grid. Since heat is not as easily transported as electricity over long distances, the heat generated is normally used for loads within the same building, or located nearby by supplying a local district heating network. This often means that electric-ity is produced closer to the load than centralized power production. This decentralized or “distributed” energy approach allows for the installation of geographically dispersed generating plants, reducing losses in the transmission of electricity, and providing space & process heating and/or cooling for single or multiple buildings (Figure 14).
A CHP installation comprises four subsystems: the power plant, the heat recovery and distribution system, an optional system for satisfying heating8 and/or cooling9 loads and a control system. A wide range of equipment can be used in the power plant, with the sole restriction being that the power equipment10 rejects heat at a temperature high enough
7. In such case, the CHP project becomes a “combined cooling, heating and power project”.
8. Heating equipment such as waste heat recovery, boiler, furnace, heater, heat pump, etc.
9. Cooling equipment such as compressor, absorption chiller, heat pump, etc.
10. Power equipment such as gas turbine, steam turbine, gas turbine-combined cycle, reciprocating engine, fuel cell, etc.
Figure 14: Combined Heat & Power
Kitchener’s City Hall, Ontario, Canada.
Photo Credit: Urban Ziegler, NRCan
1. Clean Energy Project Analysis Background
INTRO.25
to be useful for the thermal loads at hand. In a CHP system, heat may be recovered and distributed as steam (often required in thermal loads that need high temperature heat, such as industrial processes) or as hot water (conveyed from the plant to low temperature thermal loads in pipes for domestic hot water, or for space heating.)
Worldwide, CHP systems with a combined electrical capacity of around 240 GW are presently in operation. This very significant contribution to the world energy supply is even more impressive when one considers that CHP plants generate significantly more heat than power. Considering that most of the world’s electricity is generated by rotating machinery that is driven by the combustion of fuels, CHP systems have enormous poten-tial for growth. This future growth may move away from large industrial systems towards a multitude of small CHP projects, especially if a decentralized energy approach is more widely adopted and the availability of commercial products targeted at this market.
1.1.7 Other commercial and emerging technologies
A number of other clean energy technologies addressed by RETScreen International are also commercially available or in various stages of development. Some of these commercial and emerging technologies are briefly introduced in this section. Further RETScreen de-velopment is also underway or forthcoming for several of these technologies not currently covered by the software.
Commercial technologies
Many other commercial clean energy technologies and fuels are presently available. Some are described here.
Biofuels (ethanol and bio-diesel): Fermentation of certain agricultural products, such as corn and sugar cane, generates ethanol, a type of alcohol. In many regions of the world, and especially in Brazil, ethanol is being used as a transportation fuel that is often blended with conventional gasoline for use in regular car engines. In this way, biomass fuel is substituted for fossil fuels. Researchers are working on pro-ducing ethanol from cellulose, with the goal of converting wood waste into liquid
Figure 15: Biofuel - Agriculture
Waste Fuel Supply.
Photo Credit: David and Associates DOE/NREL
Introduction to Clean Energy Project Analysis Chapter
INTRO.26
fuel. Similarly, plant and animal oils, such as soybean oil and used cooking grease, can be used as fuel in diesel engines. Normally, such biomass oil is mixed with fossil fuels, resulting in less air pollution than stand-ard diesel, although the biomass oils have a tendency to congeal at low temperatures. Often, waste oils are used. When crops are purpose-grown for their oils or alcohols, the agricultural practices must be sustainable in order to be considered as a renewable energy fuel. Regular biofuel supplies (Figure 15) should be secured first and be more widely available before these new biofuel technolo-gies are more widely used11.
Ventilation heat recovery & efficient refrigeration systems: Heating, cooling and ventilation consume vast amounts of energy, but a number of efficiency measures can reduce their consumption. Simultaneous heating and cooling loads are often found within large buildings, in specialized facili-ties such as supermarkets and arenas, and in industrial complexes. For example, efficient refrigeration systems can transfer heat from the areas needing cooling to those needing heating (Figure 16). In absorption cool-ing systems and desiccant dehumidifiers, heat is used to drive the cooling equip-ment. This is a promising application for waste heat. Heat which is normally lost when ventilation air is exhausted from a building can be recuperated and used to preheat the fresh air drawn into the building. Such ventilation heat recovery systems routinely recuperate 50% of the sensible heat; new technologies are improving this and recuperating some latent heat as well, all while maintaining good air quality.
Variable speed motors: Motors consume much of the world’s electricity. For example, energy use in motors represents around 65% of total industrial electric-ity consumption in Europe. The rotational speed of a traditional motor is directly related to the frequency of the electric grid. Variable speed drives result from the combination of traditional motors and power electronics. The power electronics analyze the load and generate a signal to optimize the motor at the speed required by the application. For example, when only a reduced airflow is required, the speed of a ventilation air motor can be reduced, resulting in a more efficient system.
11. ATLAS Website. European Communities.
Figure 16: Secondary loop pumping system for recovery
of heat rejected by the refrigeration systems
in a supermarket.
Photo Credit: NRCan
1. Clean Energy Project Analysis Background
INTRO.27
Daylighting & efficient lighting systems: Lighting is another major consumer of electricity that has been made more efficient by new technologies. High intensity discharge (HID) lamps, fluorescent tubes, and electronic ballasts (for operating HID and fluorescent tubes) have made incremental improvements in the efficiency of light-ing. In commercial buildings, which tend to overheat, more efficient lighting reduces the cooling load, a further energy benefit. Facilitated by improved windows and even transparent insulation, designers are also making better use of daylight to lower artificial lighting energy consumption. This better of use of daylight is especially appropriate for office blocks (Figure 17), where working hours coincide well with day-light availability, but is generally limited to building retrofit and new construction.
Emerging technologies
The worldwide growing concerns about energy security and climate change, and the expected depletion of worldwide fossil fuels (and the associated rise of their selling price) have propelled the research and development of new energy technologies. A number of them are presently in the prototype or pilot stage and may eventually become commercially viable. Some of them are briefly introduced below.
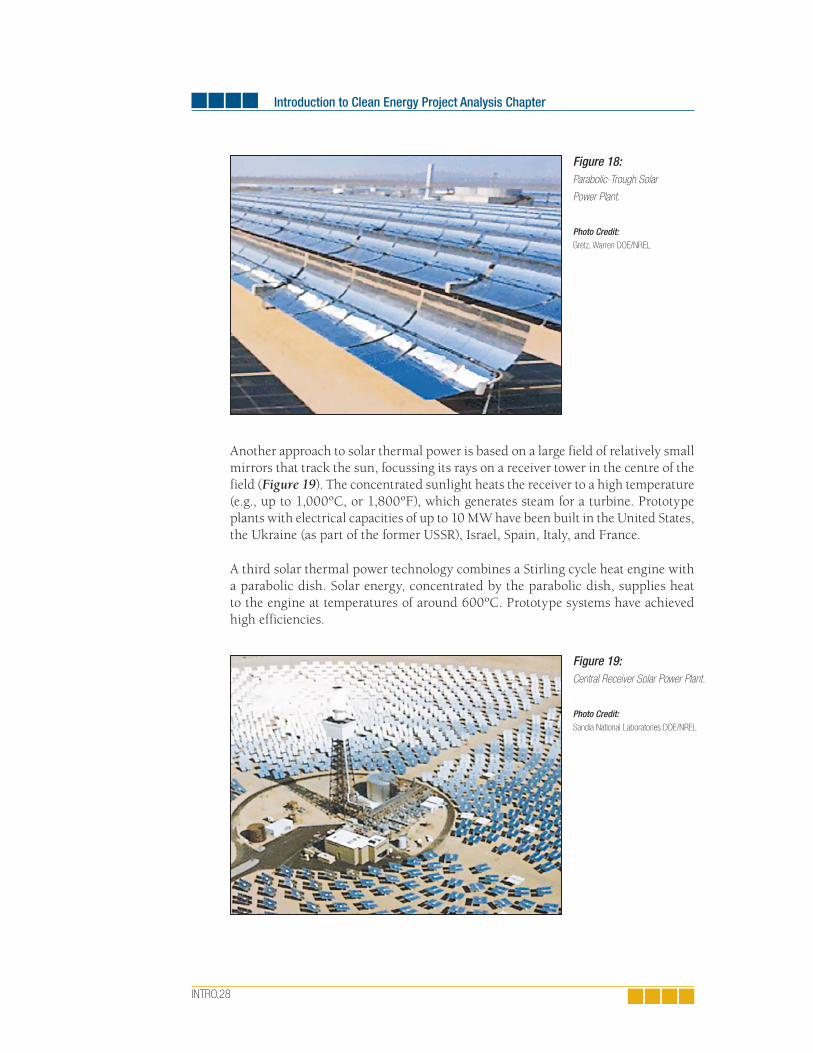
Solar-thermal power: Several large-scale solar thermal power projects, which gen-erate electricity from solar energy via mechanical processes, have been in operation for over two decades. Some of the most successful have been based on arrays of mirrored parabolic troughs (Figure18). Through the 1980’s, nine such commer-cial systems were built in the Mohave Desert of California, in the United States. The parabolic troughs focus sunlight on a collector tube, heating the heat transfer fluid in the collector to 390ºC (734ºF). The heated fluid is used to generate steam that drives a turbine. The combined electric capacity of the nine plants is around 350 MW, and their average output is over 100 MW. The systems have functioned reliably and the most recently constructed plants generate power at a cost of around $0.10/kWh. Several studies have identified possible cost reductions.
Figure 17:Daylighting & Effi cient Lighting.
Photo Credit:Robb Williamson/ NREL Pix
Introduction to Clean Energy Project Analysis Chapter
INTRO.28
Another approach to solar thermal power is based on a large field of relatively small mirrors that track the sun, focussing its rays on a receiver tower in the centre of the field (Figure 19). The concentrated sunlight heats the receiver to a high temperature (e.g., up to 1,000ºC, or 1,800ºF), which generates steam for a turbine. Prototype plants with electrical capacities of up to 10 MW have been built in the United States, the Ukraine (as part of the former USSR), Israel, Spain, Italy, and France.
A third solar thermal power technology combines a Stirling cycle heat engine with a parabolic dish. Solar energy, concentrated by the parabolic dish, supplies heat to the engine at temperatures of around 600ºC. Prototype systems have achieved high efficiencies.
Figure 18:Parabolic-Trough Solar
Power Plant.
Photo Credit: Gretz, Warren DOE/NREL
Figure 19:Central Receiver Solar Power Plant.
Photo Credit:Sandia National Laboratories DOE/NREL
1. Clean Energy Project Analysis Background
INTRO.29
All three of the above technologies can also be co-fired by natural gas or other fossil fuels, which gives them a firm capacity and permits them to be used as peak power providers. This makes them more attractive to utilities, and gives them an advantage over photovoltaics, which cannot necessarily provide power whenever it is required. On the other hand, they utilize only that portion of sunlight that is direct beam and require much dedicated land area. Solar thermal power is still at the development stage: the costs of the technology should be reduced together with the associated risks, and experience under real operating conditions should be a further gain.
Ocean-thermal power: Electricity can be generated from the ocean in several ways, as demonstrated by a number of pilot projects around the world. In ocean thermal electrical conversion (OTEC), a heat engine is driven by the vertical temperature gradient found in the ocean. In tropical oceans, the solar-heated surface water may be over 20ºC warmer than the water found a kilometre or so below the surface. This temperature difference is sufficient to generate low-pressure steam for a turbine. Pilot plants with a net power output of up to 50 kW have been built in Hawaii (USA) and Japan. High production costs, possible negative impacts on near-shore marine ecosystems and a limited number of suitable locations worldwide have so far limited the development of this technology which needs further demonstration before commercial deployment.
Tidal power: Narrow basins experiencing very high tides can be dammed such that water flowing into and out of the basin with the changing tides is forced through a turbine. Such “barrage” developments have been constructed in eastern Cana-da, Russia, and France, where a 240 MW project has been operating since 1966. While technically feasible, the initial costs are high and environmental impacts may include sedimentation of the basin, flooding of the nearby coastline and difficult-to-predict changes in the local ecosystems. Tidal power technology raises many technical questions (e.g. configuration, reliability, safe deployment and recovery, grid connection, operation and maintenance) and market barriers that limit the deployment of this technology.
Wave power: Waves have enormous power, and a range of prototypes harnessing this power have been constructed. These include shore-based and offshore devices, both floating and fixed to land or the ocean floor. Most utilize either turbines, driven with air compressed by the oscillating force of the waves, or the relative motion of linked floats as waves pass under them. Pilot plants with capacities of up to 3 MW have been built; the major barrier to commercialization has been the harsh ocean environment. It is crucial that the current prototypes and demonstration projects are successful to overcome barriers to further deployment.
Ocean current power: Just as wind flows in the atmosphere, so ocean currents exist in the ocean; ocean currents can also be generated by tides. It has been pro-posed that underwater turbines (Figure 20), not unlike wind turbines, could be used to generate electricity in areas experiencing especially strong currents. Some pilot projects investigating the feasibility of this concept have been launched.
Introduction to Clean Energy Project Analysis Chapter
INTRO.30
1.2 Preliminary Feasibility Studies
Energy project proponents, investors, and financers continually grapple with questions like “How accurate are the estimates of costs and energy savings or production and what are the possibilities for cost over-runs and how does the project compare financially with other competitive options?” These are very difficult to answer with any degree of confi-dence, since whoever prepared the estimate would have been faced with two conflicting requirements:
Keep the project development costs low in case funding cannot be secured, or in case the project proves to be uneconomic when compared with other energy options.
Spend additional money and time on engineering to more clearly delineate potential project costs and to more precisely estimate the amount of energy produced or energy saved.
For both conventional and clean energy project implementation, the usual procedure for tackling this dilemma is to advance the project through several steps as shown in Figure 21. At the completion of each step, a “go/no-go” decision is usually made by the project proponent as to whether to proceed to the next step of the development process. High quality, but low-cost, pre-feasibility and feasibility studies are critical to helping the project proponent “screen out” projects that do not make financial sense, as well as to help focus development and engineering efforts prior to construction.
Figure 20:Artist’s impression of MCT pile mounted
twin rotor tidal turbine.
Photo Credit:MCT Ltd. 2003 Director
1. Clean Energy Project Analysis Background
INTRO.31
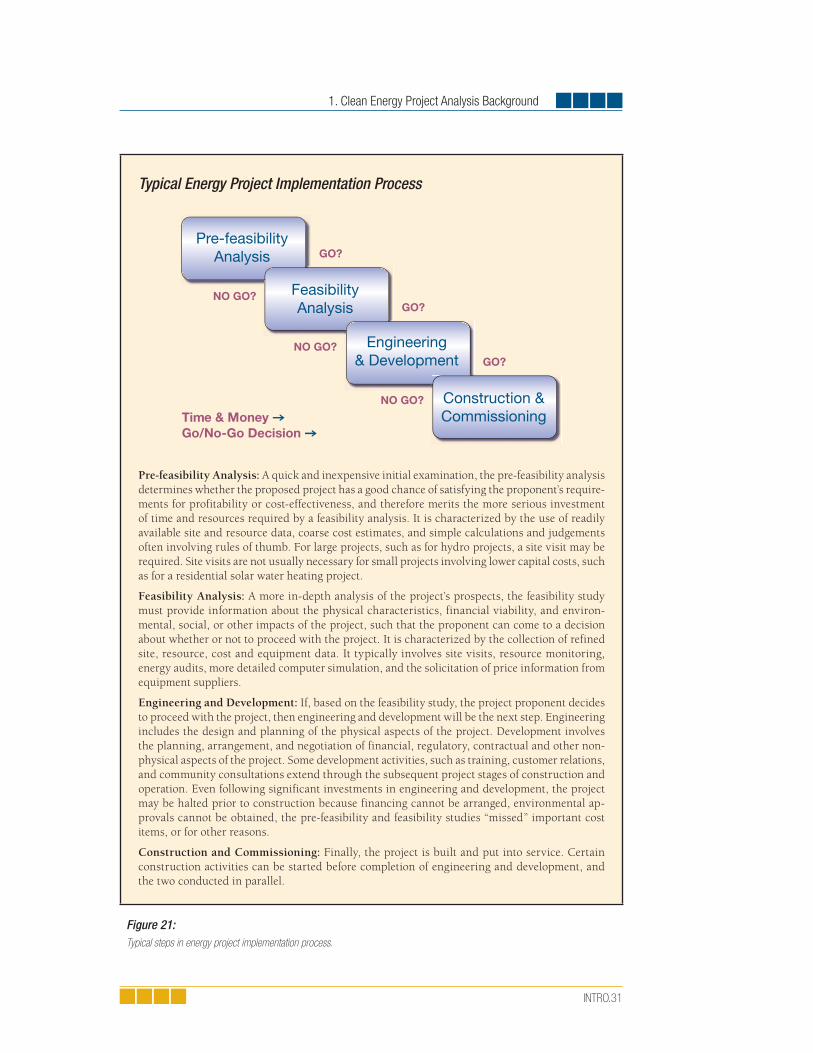
Typical Energy Project Implementation Process
Pre-feasibility Analysis: A quick and inexpensive initial examination, the pre-feasibility analysis determines whether the proposed project has a good chance of satisfying the proponent’s require-ments for profitability or cost-effectiveness, and therefore merits the more serious investment of time and resources required by a feasibility analysis. It is characterized by the use of readily available site and resource data, coarse cost estimates, and simple calculations and judgements often involving rules of thumb. For large projects, such as for hydro projects, a site visit may be required. Site visits are not usually necessary for small projects involving lower capital costs, such as for a residential solar water heating project.
Feasibility Analysis: A more in-depth analysis of the project’s prospects, the feasibility study must provide information about the physical characteristics, financial viability, and environ-mental, social, or other impacts of the project, such that the proponent can come to a decision about whether or not to proceed with the project. It is characterized by the collection of refined site, resource, cost and equipment data. It typically involves site visits, resource monitoring, energy audits, more detailed computer simulation, and the solicitation of price information from equipment suppliers.
Engineering and Development: If, based on the feasibility study, the project proponent decides to proceed with the project, then engineering and development will be the next step. Engineering includes the design and planning of the physical aspects of the project. Development involves the planning, arrangement, and negotiation of financial, regulatory, contractual and other non-physical aspects of the project. Some development activities, such as training, customer relations, and community consultations extend through the subsequent project stages of construction and operation. Even following significant investments in engineering and development, the project may be halted prior to construction because financing cannot be arranged, environmental ap-provals cannot be obtained, the pre-feasibility and feasibility studies “missed” important cost items, or for other reasons.
Construction and Commissioning: Finally, the project is built and put into service. Certain construction activities can be started before completion of engineering and development, and the two conducted in parallel.
Figure 21: Typical steps in energy project implementation process.
GO?
NO GO?
Pre-feasibilityAnalysis
FeasibilityAnalysis
Engineering& Development
Construction &Commissioning
NO GO?
NO GO?
GO?
GO?
Introduction to Clean Energy Project Analysis Chapter
INTRO.32
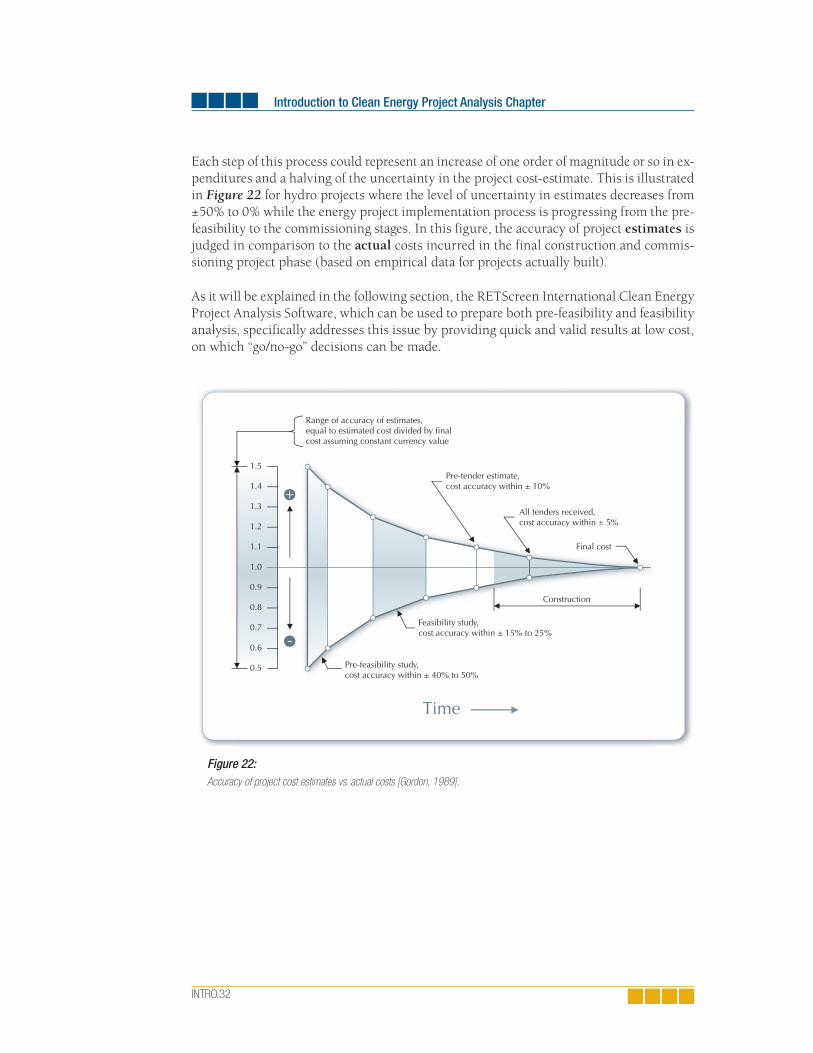
Each step of this process could represent an increase of one order of magnitude or so in ex-penditures and a halving of the uncertainty in the project cost-estimate. This is illustrated in Figure 22 for hydro projects where the level of uncertainty in estimates decreases from ±50% to 0% while the energy project implementation process is progressing from the pre-feasibility to the commissioning stages. In this figure, the accuracy of project estimates is judged in comparison to the actual costs incurred in the final construction and commis-sioning project phase (based on empirical data for projects actually built).
As it will be explained in the following section, the RETScreen International Clean Energy Project Analysis Software, which can be used to prepare both pre-feasibility and feasibility analysis, specifically addresses this issue by providing quick and valid results at low cost, on which “go/no-go” decisions can be made.
Time
1.5
1.4
1.3
1.2
1.1
1.0
0.9
0.8
0.7
0.6
0.5
Range of accuracy of estimates, equal to estimated cost divided by final cost assuming constant currency value
Pre-tender estimate,cost accuracy within ± 10%
All tenders received,cost accuracy within ± 5%
Final cost
Construction
Feasibility study,cost accuracy within ± 15% to 25%
Pre-feasibility study,cost accuracy within ± 40% to 50%
Figure 22: Accuracy of project cost estimates vs. actual costs [Gordon, 1989].
1. Clean Energy Project Analysis Background
INTRO.33
1.2.1 Favourable project conditions
Typically, decision-makers are often not familiar with clean energy technologies. Thus, they have not normally developed an intuition for identifying when clean energy tech-nologies are promising and should be expressly included in a pre-feasibility study. As an initial guide, the conditions indicating good potential for successful clean energy project implementation typically include:
Need for energy system: Proposing an energy system while there is an energy need is a strong favourable prerequisite to any energy project, and especially so for clean energy projects where awareness barriers are often the main stumbling blocks.
New construction or planned renovation: Outfi tting buildings and other facilities with clean energy technologies is often more cost-effective when done as part of an existing construction project. The initial costs of the clean energy technology may be offset by the costs of the equipment or materials it supplants, and early planning can facilitate the integration of the clean energy technology into the rest of the facility.
High conventional energy costs: When the conventional energy options are expensive, the usually higher initial costs of clean energy technologies can be overcome by the lower fuel costs, in comparison with the high conventional energy costs.
Interest by key stakeholders: Seeing a project through to completion can be a protracted, arduous affair involving a number of key stakeholders. If even just one key stakeholder is opposing the project, even the most fi nancially and environmentally attractive projects could be prevented from moving to successful implementation.
Hassle-free approvals process: Development costs are minimised when approvals are possible and easily obtained. Local, regional or national legislation and policy may not be sensitive to the differences between conventional and clean energy technologies, and as such may unfairly disadvantage clean energy technologies.
Easy access to funding and fi nancing: With access to fi nancing, subsidies, and grants, the higher initial costs of clean energy technologies need not present a major hurdle.
Adequate local clean energy resources: A plentiful resource (e.g. wind) will make clean energy technologies much more fi nancially attractive.
Assessing these favourable conditions first could serve as valuable criteria for finding opportunities for clean energy project implementation. As part of an initial filtering or pre-screening process, they could also be used to prioritize clean energy projects, and to select which ones to invest in a pre-feasibility analysis.
Introduction to Clean Energy Project Analysis Chapter
INTRO.34
1.2.2 Project viability factors
Carefully considering the key factors which make a clean energy project financially viable can save a significant amount of time and money for the project’s proponents. Some of the viability factors related to clean energy projects are listed below, with examples for a wind energy project:
Energy resource available at project site (e.g. wind speed)
Equipment performance (e.g. wind turbine power curve)
Decision-maker’s defi nition of cost-effective (e.g. payback period, IRR, NPV, Energy production costs)
The RETScreen Clean Energy Project Analysis Software, as described in the next section, has a number of features to make this focus on key factors relatively straight-forward.
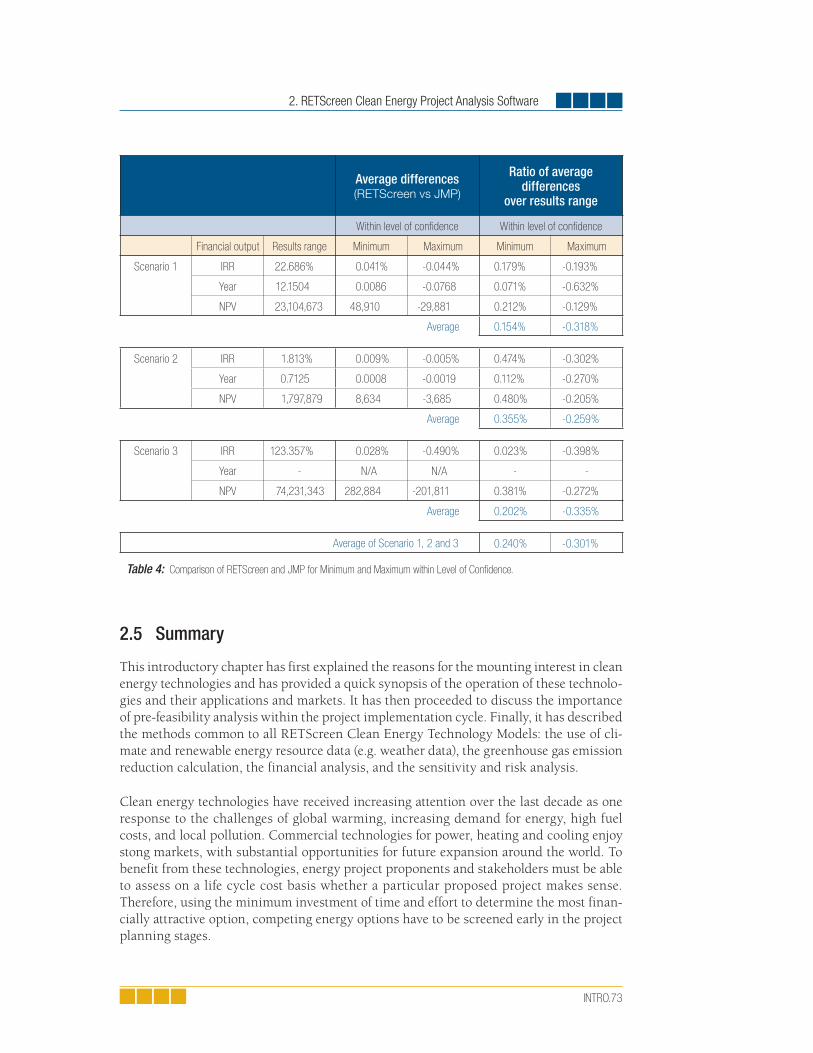
2. RETScreen Clean Energy Project Analysis Software
INTRO.35
2 RETSCREEN CLEAN ENERGY PROJECT ANALYSIS SOFTWARE
The RETScreen International Clean Energy Project Analysis Software can be used worldwide to evaluate the energy production, life-cycle costs and greenhouse gas emission reductions for various types of proposed energy efficient and renewable energy technologies (RETs).
The RETScreen Software has been developed to overcome the barriers to clean energy tech-nology implementation at the preliminary feasibility stage. It provides a proven methodol-ogy for comparing conventional and clean energy technologies. The analyst can therefore focus on the pre-feasibility study, rather than developing the methodology; combined with the tool’s minimal data input requirements and built-in weather and product databases, this results in fast, accurate analyses that cost roughly one-tenth the amount of pre-feasibil-ity studies with custom-developed methodologies. This permits the screening of multiple potential projects, such that the most promising ones can be identified and implemented. It also facilitates the sharing of information by way of a standardised, internationally ac-cepted platform.
All clean energy technology models in the RETScreen Software have a common look and follow a standard approach to facilitate decision-making – with reliable results. Each model also includes integrated product, cost and weather databases and a detailed online user manual, all of which help to dramatically reduce the time and costs associated with pre-paring pre-feasibility studies.
RETScreen has been designed to help not just with the task of carrying out a project analysis, but also to provide useful information about the clean energy technologies, thus building awareness of their capabilities and applications. This should assist the user in developing a good sense for when a given technology should be considered; it also makes RETScreen an excellent resource for teaching and information dissemination.
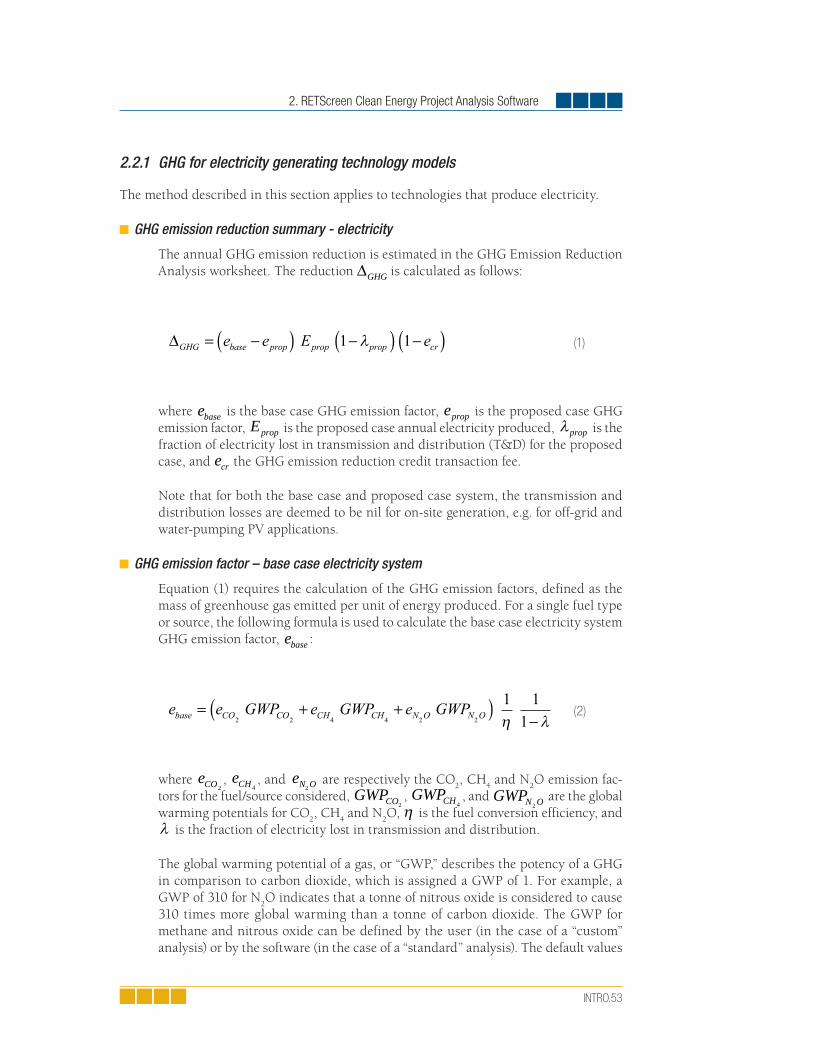
This section presents the RETScreen Software, including the project analysis approach, and some of the clean energy technology models, databases and complementary resources that come with the software. While the methodology and algorithms specific to a RETScreen Clean Energy Technology Model are presented in-depth in their respective chapters, the methodologies and algorithms common to all models are presented in this section. These include the greenhouse gas analysis, the financial analysis and the sensitivity & risk analy-sis methodologies.
2.1 RETScreen Software Overview
Fundamental to the RETScreen Software is a comparison between a “base case”—typically the conventional technology or measure—and a “proposed case”—the clean energy tech-nology. This has very important implications for how the user specifies costs: RETScreen is ultimately not concerned with the absolute costs, but rather the incremental costs—the costs of the proposed case that are in excess of those for the base case. The user can either enter incremental costs directly or enter both the full cost associated with the proposed case and any credits stemming from base case costs made unnecessary by the proposed technology.
Introduction to Clean Energy Project Analysis Chapter
INTRO.36
In the RETScreen Software, the energy benefits are the same for both the base case and the proposed case. If, for example, a proposed on-grid wind farm generates 50,000 MWh per year, then this compared to 50,000 MWh of electricity from conventional sources available through the grid. On the other hand, the costs will not, in general, be the same for the base case and the proposed case: typically, the proposed case will have higher initial costs and lower annual costs (i.e. savings). Thus RETScreen’s analysis task is to determine whether or not the balance of costs and savings over the life of the project make for a financially attractive proposition. This is reflected in the various financial indicators and the cash flows calculated by the RETScreen Software.
RETScreen’s greenhouse gas emission reduction analysis adheres to this same analysis ap-proach: it reports the reduction in GHG emission associated with changing from the base case to the proposed case technology.
2.1.1 Five step standard project analysis
While a different RETScreen Clean Energy Technology Model is used for each of the technologies covered by RETScreen, the same five step standard analysis procedure is common to all of them. As a result, the user who has learned how to use RETScreen with one technology should have no problem using it for another. Since the RETScreen Software is developed in Microsoft® Excel, each of the five steps in the standardised analy-sis procedure is associated with one or more Excel worksheets. Figure 23 presents the RETScreen Software Model Flow Chart’s Five Step Standard Project Analysis, which are further described below:
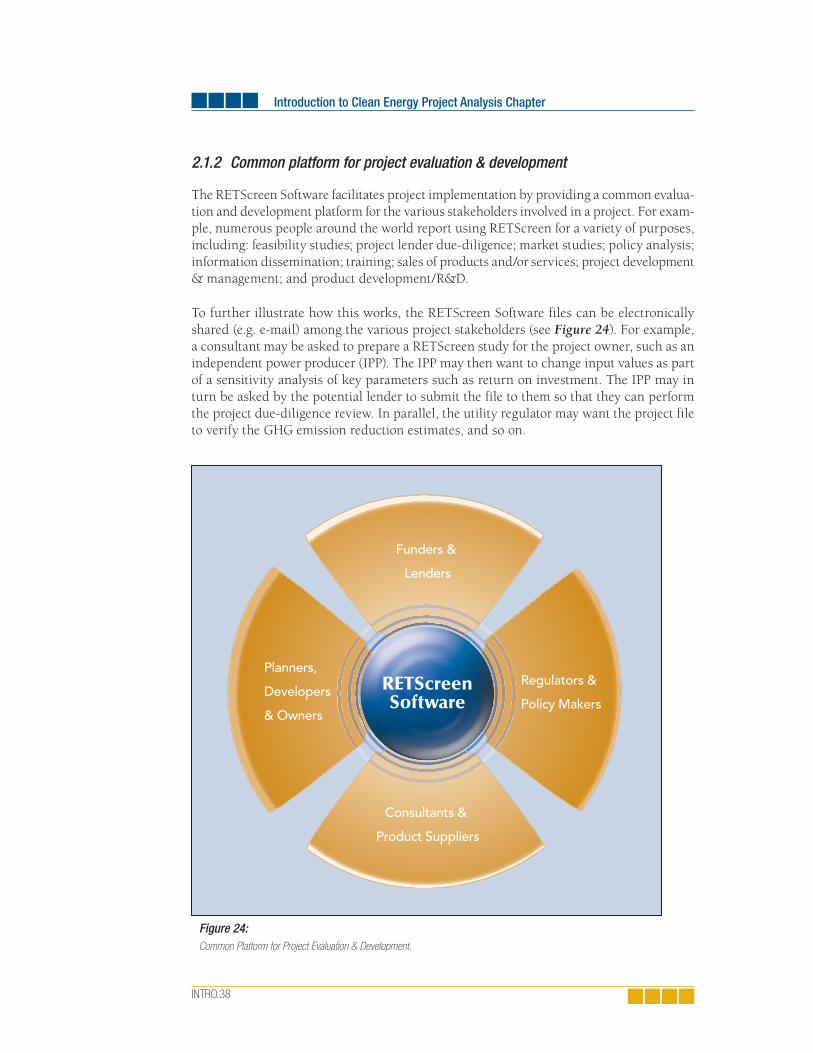
Figure 23:RETScreen Software Model Flow Chart: A Five Step Standard Analysis.
INTRO.37
STEP 1 - Energy Model (and sub-worksheet(s)): In this worksheet, the user specifies pa-rameters describing the location of the energy project, the type of system used in the base case, the technology for the proposed case, the loads (where applicable), and the renewable energy resource (for RETs). In turn, the RETScreen Software calculates the annual energy production or energy savings. Often a resource worksheet (such as the “Solar Resource” or the “Hydrology and Load” worksheet) or an “Equipment Data” worksheet—or both—ac-companies the Energy Model worksheet as sub-worksheet(s). The algorithms used in each technology’s Energy Model worksheet along with their validations can be found in the respective chapters of this textbook.
STEP 2 - Cost Analysis: In this worksheet, the user enters the initial, annual, and periodic costs for the proposed case system as well as credits for any base case costs that are avoided in the proposed case (alternatively, the user can enter the incremental costs directly). The user has the choice between performing a pre-feasibility or a feasibility study. For a “Pre-feasibility analysis,” less detailed and less accurate information is typically required while for a “Feasibility analysis,” more detailed and more accurate information is usually required. Since the calculations performed by the RETScreen Software for this step are straightforward and relatively simple (addition and multiplication), the information found in the online manual for each input and output cell should be sufficient for a complete understanding of this worksheet.
STEP 3– Greenhouse Gas (GHG) Analysis (optional): This optional worksheet helps determine the annual reduction in the emission of greenhouse gases stemming from using the proposed technology in place of the base case technology. The user has the choice between performing a simplified, standard or custom analysis, and can also indicate if the project should be evaluated as a potential Clean Development Mechanism (CDM) project12. RETScreen automatically assesses whether or not the project can be considered as a small-scale CDM project to take advantage of the simplified baseline methods and other rules and procedures for small-scale CDM projects. The methodology and algorithms used in the RETScreen Software for this step are described in detail in Section 2.2.
STEP 4 - Financial Summary: In this worksheet, the user specifies financial parameters related to the avoided cost of energy, production credits, GHG emission reduction credits, incentives, inflation, discount rate, debt, and taxes. From this, RETScreen calculates a vari-ety of financial indicators (e.g. net preset value, etc.) to evaluate the viability of the project. A cumulative cash flow graph is also included in the financial summary worksheet. The methodology and algorithms used in the RETScreen Software for this step are described in detail in Section 2.3.
STEP 5 - Sensitivity & Risk Analysis (optional): This optional worksheet assists the user in determining how uncertainty in the estimates of various key parameters may affect the financial viability of the project. The user can perform either a sensitivity analysis or a risk analysis, or both. The methodology and algorithms used in the RETScreen Software for this step are described in detail in Section 2.4.
12. The Kyoto Protocol has established three mechanisms (the Clean Development Mechanism (CDM), Joint Implementation (JI),
and Emissions Trading) which allow Parties to pursue opportunities to cut emissions, or enhance carbon sinks, abroad.
2. RETScreen Clean Energy Project Analysis Software
Introduction to Clean Energy Project Analysis Chapter
INTRO.38
2.1.2 Common platform for project evaluation & development
The RETScreen Software facilitates project implementation by providing a common evalua-tion and development platform for the various stakeholders involved in a project. For exam-ple, numerous people around the world report using RETScreen for a variety of purposes, including: feasibility studies; project lender due-diligence; market studies; policy analysis; information dissemination; training; sales of products and/or services; project development & management; and product development/R&D.
To further illustrate how this works, the RETScreen Software files can be electronically shared (e.g. e-mail) among the various project stakeholders (see Figure 24). For example, a consultant may be asked to prepare a RETScreen study for the project owner, such as an independent power producer (IPP). The IPP may then want to change input values as part of a sensitivity analysis of key parameters such as return on investment. The IPP may in turn be asked by the potential lender to submit the file to them so that they can perform the project due-diligence review. In parallel, the utility regulator may want the project file to verify the GHG emission reduction estimates, and so on.
Figure 24: Common Platform for Project Evaluation & Development.
2. RETScreen Clean Energy Project Analysis Software
INTRO.39
The reporting capability of the RETScreen Software also facilitates decision-making by allowing one to see all the key information used to prepare a study. This allows for easier project due-diligence and comparison amongst different options or propositions by all the parties involved in an energy project. It particularly helps reduce the costs of studies by decreasing the effort normally dedicated to write the project assessment report. Indeed, the printout of a RETScreen study constitutes, by itself, a report that is often sufficient at the early stage of the project imple-mentation process. The box entitled “Reducing the Cost of Pre-feasibility Studies” shows how this capability has already been instrumental for a project identification initiative.
A language switch allows the analy-sis to be set to one of many languages available in RETScreen13 and facili-tates the communication between stakeholders. It allows partners who speak different languages to easily evaluate a project by removing the need to translate reports and results, thus repeating the analysis in each language; the language switch auto-matically translates the entire analy-sis. For example, a project proponent from France might want to prepare a RETScreen analysis in French for a potential clean energy project in China, which might result in GHG production credits as a clean devel-opment mechanism (CDM) project as defined in the Kyoto Protocol. By using the RETScreen language switch, the analysis initially pre-pared in French can automatically be translated into Simplified Chinese for potential Chinese partners, and also into English for the required CDM related project analysis.
The overall time and cost savings attributable to RETScreen are very important in terms of accelerating clean energy project implementation and market expansion. According to an independent impact assessment of RETScreen International14, the user savings attrib-uted to the RETScreen Software between 1998 and 2004 are estimated to be $600 million worldwide, and are expected to grow exponentially to reach $7.9 billion by 2012.
13. As of September, 1st 2005, the languages available include: Arabic, Bengali, Chinese, Danish, Dutch, English, Finnish,
and Telugu. Additional product translations for these languages and additional translations in other languages are
expected to be available in RETScreen.
14. Graham, Stephen and Steve Higgins, SGA Energy Ltd., An Impact Assessment of RETScreen® International 1998-2012, Final Report to NRCan’s CETC-Varennes, April 2004.
REDUCING THE COST OF PRE-FEASIBILITY STUDIES
RETScreen was instrumental in helping Natural Resources Canada’s (NRCan) CETC-Varennes and a team of eleven consulting firms prepare studies for 56 potential RET projects in Canada’s 300 remote communities at a cost of less than $2,000 each. Of these, 27 projects offered commercial potential with-out government incentives. Similar studies would otherwise have cost in the order of 5 to 10 times this amount! As a result, money saved is now being used to develop a number of these projects, with several projects already built, such as the 35 m2 solar air heating collector shown here [Alward, 1999].
Solar Air Heating Technology, Yellowknife, NWT, Canada.
Introduction to Clean Energy Project Analysis Chapter
INTRO.40
2.1.3 Clean energy technology models
The RETScreen Software can be used to evaluate industrial, commercial, institutional, community, residential and utility applications. Some of the RETScreen clean energy tech-nology models are as follows15:
Wind Energy Project Model for central-grid and isolated-grid con-nected projects, ranging in size from large-scale multi-turbine wind farms to small-scale single-turbine wind-diesel hybrid systems.
Small Hydro Project Model for central-grid and isolated-grid con-nected projects, ranging in size from multi-turbine small and mini hydro installations to single-turbine micro hydro systems.
Photovoltaic Project Model for on-grid (central-grid and isolated-grid PV systems); off-grid (stand-alone (PV-battery) and hybrid (PV-battery-genset) systems; and water pumping applications (PV-pump systems).
Biomass Heating Project Model for biomass and/or waste heat recov-ery (WHR) heating projects, from large-scale developments for clusters of buildings to individual building applications. The model can be used to evaluate three basic heating systems using: waste heat recovery; bio-mass; and biomass and waste heat recovery combined.
Solar Air Heating Project Model for ventilation air heating and process air heating applications of transpired-plate solar collectors, from small residential to larger commercial/industrial-scale ventilation systems, as well in the air-drying processes for various crops.
Solar Water Heating Project Model for domestic hot water, industrial process heat and swimming pools (indoor and outdoor), ranging in size from small residential systems to large scale commercial, institutional and industrial systems.
15. NRCan continues to develop the RETScreen Software, including new energy effi ciency models. See the RETScreen
Website (www.retscreen.net) for the latest developments.
2. RETScreen Clean Energy Project Analysis Software
INTRO.41
Passive Solar Heating Project Model for passive solar designs and/or energy efficient window use in low-rise residential and small commercial building applications, for either retrofit or new construc-tion projects.
Ground-Source Heat Pump Project Model for heating and/or cooling of residential, commercial, institutional and industrial buildings, for both retrofit and new construction projects using either ground-coupled (horizontal and vertical closed loop) or groundwater heat pumps.
Combined Heat & Power (CHP) Project Model for any one or combina-tion of the following applications: power; heating; cooling; single buildings or multiple buildings; industrial processes; communities; district heating and district cooling; with a wide range of renewable and non-renewable fuels (which can be used in parallel), including landfill gas; biomass; ba-gasse; biodiesel; hydrogen; natural gas; oil/diesel; coal; municipal waste, etc.; and using multiple types of power, heating and/or cooling equipment, including reciprocating engines; gas turbines; gas turbine - combined cycle; steam turbines; geothermal systems; fuel cells; wind turbines; hydro tur-bines; photovoltaic modules; boilers; heat pumps; biomass systems; heaters; furnaces; compressors; absorption chillers, etc., all working under various operating conditions (base load, intermediate load and/or peak load).
For the above clean energy technologies, a detailed description of the algorithms found in the RETScreen Software is available in the respective chapters of this textbook covering each of these technologies.
2.1.4 Clean energy related international databases
The RETScreen Software uses both meteorological and product performance data as input to the various technology models to help determine the amount of energy that can be delivered (or saved) by a project, or to help calculate other important parameters, such as heating loads. Additional data regarding costs and other financial parameters is necessary to determine various financial aspects of the project. Gathering this sort of data for an individual project can be very time consuming and expensive. The RETScreen Software integrates a series of databases to help overcome this deployment barrier and to facilitate the implementation of clean energy projects around the world. However, the user can, at any time, enter data from other sources where needed.
This section introduces the origin of the meteorological data used in RETScreen, both for the ground-based meteorological data and NASA’s satellite-derived meteorological data sets, both of which provide weather (climate) data for the entire surface of the planet. An overview of the hydrology, product and cost data that are also included with the RETScreen Software is also provided below.
Introduction to Clean Energy Project Analysis Chapter
INTRO.42
Worldwide ground-based meteorological data
Worldwide Ground-based Meteorological Data has been incorporated directly into the RETScreen Software. This integrated RETScreen International Online Weather Database includes ground-based observation averages for over 4,700 sites16 around the world, compiled from over 20 different sources for the 1961-1990 period. A map displaying all ground-based weather stations used in RETScreen is shown in Figure 25, and an example of the integrated weather database in the Solar Water Heating Project Model is presented in Figure 26.
16. The RETScreen Combined Heat & Power Model Version 3.2 and subsequent versions of the RETScreen Software
integrate data for over 4,720 ground-monitoring stations. Earlier version have 1,000 weather stations.
Figure 25: Worldwide location of ground-based weather stations in RETScreen.
Figure 26: Example of the Integrated Weather Database to the RETScreen Solar Water Heating Project Model.
2. RETScreen Clean Energy Project Analysis Software
INTRO.43
These data are compiled from a number of different sources. As a consequence, the original data is not presented, but rather data from the various sources are gathered into a single, coherent repository. For example, the data is homogenised so that SI units are used for all locations, regardless of the original units. Also, depending on the station, some variables are calculated from other quantities; for example, the rela-tive humidity may be calculated from the minimum and maximum humidity levels.
Over 20 different sources were used to compile the database. However, not all sources contributed equally. For example, some sources had limited spatial cover-age (i.e. covered only one country), or proved less reliable than other sources for the same location and were thus used only as a last resort in the absence of other, more reliable data. The most significant sources were:
1. Environment Canada (1993). Canadian Climate Normals, 1961-1990. Ottawa: Minister of Supply and Services Canada. This six-volume book includes a wealth of meteorological information for Canada and was used for most Canadian stations (except for solar radiation and wind data, see below).
2. Environment Canada (1998). The Canadian renewable energy wind and solar resource (CERES). Ottawa: Minister of Supply and Services Canada. This CD-ROM contains wind and solar radiation information for all available Canadian sites.
3. Numerical Logics Inc. (1998). Monthly averages of solar radiation and sunshine derived from data from the World Radiation Data Centre (WRDC) Online Archive (1964-1993). Averages for solar radiation were calculated from data stored at the WRDC; only stations having more than fi ve years of data were included in the RETScreen database.
4. National Climatic Data Center and National Renewable Energy Laboratory (1993). Solar And Meteorological Surface Observation Network (SAMSON) 1961-1990. Version 1.0. These 3 CD-ROMs were the primary source for climate data, including solar radiation, for sites in the United States. Monthly averages were calculated from hourly values contained in the CD-ROM.
5. World Meteorological Organization (1996). Climatological Normals (CLINO) for the period 1961-1990. WMO/OMM-No.847. Geneva: Secretariat of the World Meteorological Organization. This very large document contains information that was supplied by member countries on various climatological parameters. The number of parameters included depends on the reporting country. Some less developed countries may contain only one parameter, whereas more developed countries tend to report values for all parameters required for the RETScreen database.
A detailed description of the meteorological variables used in the RETScreen Soft-ware is found in the Online Manual.
Introduction to Clean Energy Project Analysis Chapter
INTRO.44
NASA’s satellite-derived meteorological data set
NASA’s Satellite-derived Meteorological Data for any location on earth is pro-vided for use with the RETScreen Software via the NASA Surface Meteorology and Solar Energy (SSE) Data Set. This data set, developed by NASA in collaboration with RETScreen International, is a useful alternative when ground-based data or detailed resource maps are not available for the project location. A direct link to the NASA Website is provided from within the RETScreen Software; the user may simply copy the relevant data from the Website and paste it into the relevant worksheets of the RETScreen Software.
The SSE data set is derived mainly from several other data sets developed by NASA, including the Goddard Earth Observing Systems Version 1 (GEOS-1) and, for solar radiation data, the International Satellite Cloud Climatology Project Version D (ISCCP D-1), using an atmospheric model constrained to satellite and sounding observations. These data sets, in turn, were derived from the analysis of observa-tions made by earth-orbiting satellites: the Geostationary Operational Environmen-tal Satellites (GOES) and Polar-Orbiting Environmental Satellites (POES) from the US National Oceanic & Atmospheric Administration (NOAA), the Meteorological Satellites (Meteosat) operated by the European Space Agency, and the Geostationary Meteorological Satellites (GMS) operated by the Japan Meteorological Agency.
Satellite-derived data provide a much greater coverage than ground-based data. Unlike the RETScreen ground-based meteorological database, the SSE is not limited to any particular station and is able to provide climatic variables for any location on earth. This is important since many ground measurement stations are located near populated areas; the SSE may therefore be a valuable resource – and sometimes the only resource – for isolated and remote locations. On the other hand, the resolution of the grid used by the SSE may be insufficient to catch local peculiarities of the climate; natural or human (urban effect) microclimates are not taken into account, and the SSE data alone is not appropriate where there are large topographic features within a cell of the grid. Certain climate parameters may be sensitive to variations within the cell boundaries (i.e. wind speed) whereas others are ideally suited to this resolution (i.e. insolation); higher resolution data for these parameters will have a negligible or no effect on the final energy analysis. Examples of maps generated from average (1983-1992) SSE data for the month of July are shown in Figure 27 for insolation (solar radiation), 50 m wind speed, and earth skin temperature.
The NASA SSE data set is formulated from data gathered for the 10-year period from July 1983 to June 1993. The original satellite and GEOS-1 data are calculated using a 1-degree grid size which covers the entire globe (64,800 regions). At mid-latitudes (45°), the cell size is therefore approximately 80×110 km. Figure 28 shows a detailed sample of the grid covering the United Kingdom and Ireland. The 1-degree data is generated using the NASA Goddard Earth Observing System - Version 1 (GEOS-1) Multiyear Assimilation Timeseries Data.
2. RETScreen Clean Energy Project Analysis Software
INTRO.45
A description of the algorithms used to derive the SSE is beyond the scope of this textbook. A fairly complete description of the Staylor algorithm used to calculate solar insolation is found in the Surface Radiation Budget (SRB) Langley DAAC Data Set Document, available on-line17. NASA’s methodology and other relevant additional information can also be found on the NASA’s Surface meteorology and Solar Energy Website.
Figure 28: Example of the grid covering the United Kingdom
and Ireland, used by NASA.
Source: NASA’s Surface Meteorology
and Solar Energy (release 5.1) Website.
Introduction to Clean Energy Project Analysis Chapter
INTRO.46
Hydrology data
In the RETScreen Small Hydro Project Model, hydrological data are specified by a flow-duration curve, which is assumed to represent the flow conditions in the river being studied over the course of an average year. For reservoir storage projects, data must be manually entered by the user and should represent the regulated flow that results from operating a reservoir. For run-of-river projects, the required flow-duration curve data can be entered either manually or by using the specific run-off method and data contained in the RETScreen Online Weather Database.
Hydrology Data from Environment Canada for more than 500 Canadian river gauges are available in the Weather Database included in the RETScreen Small Hydro Project Model (see Figure 29), including regional flow-duration curves and specific run-off maps prepared using Water Survey of Canada data (see Figure 30).
Flow-duration curve data, required to run the model, are available for a large num-ber of stream flow gauging stations. For example, stream flow data for the United Kingdom and Spain are available from the Centre for Hydrology and Ecology via a database called HYDATA. The actual weather database integrated in the RETScreen Small Hydro Project Model currently includes a flow-duration curve dataset that has been calculated from the HYDAT hydrological database, available from Environ-ment Canada18. For project locations outside of Canada, hydrology data from other sources can be entered manually.
18. http://www.wsc.ec.gc.ca
Figure 29: Example of the integrated Weather (Hydrology) Database to the RETScreen Small Hydro Project Model,
which includes 500 Canadian river gauges (from Environment Canada).
2. RETScreen Clean Energy Project Analysis Software
INTRO.47
Product data
The product data incorporated directly into the RETScreen Software provides access to over 6,000 pertinent product performance and specification data needed to describe the performance of the proposed clean energy system in the first step of the RETScreen analysis (i.e. in the Energy Model and accompanying worksheets).
The data for these products can be pasted into the relevant cells direct-ly in the clean energy technology model as shown in Figure 31. This figure shows an example of the integrated product database includ-ed in the RETScreen Photovoltaic Project Model. The RETScreen Product Database provides data for the power, heating and cooling sys-tems listed in Table 1 and more.
In addition, the product database provides access, via website links within the software, to contact information for clean energy tech-nology manufacturers around the globe so that the user interested in getting more information (e.g. a quotation) can contact the prod-uct supplier directly.
Figure 31: Example of the Integrated Product Database
in the RETScreen Software.
Introduction to Clean Energy Project Analysis Chapter
INTRO.48
Complementary to the product database integrated into the RETScreen Software, a companion Internet-based e-Marketplace provides contact information for clean energy related equipment suppliers, service providers and other sources of informa-tion located around the globe. The RETScreen Marketplace found on the RETScreen Website, facilitates the sharing of information among product and service suppliers, consumers, and users of RETScreen. This consists of a searchable database of sup-pliers and on-line forums where users can post questions and comments.
Power Systems
Wind turbines Gas turbines
Hydro turbines Gas turbines – combined cycle
Photovoltaic modules Reciprocating engines
Geothermal systems Steam turbines
Fuel cells Other
Heating Systems
Biomass heating systems Boilers
Solar air heating systems (e.g. Solarwall®) Furnaces
Solar water heaters (including pool heaters) Heaters
Windows for passive solar heating Heat pumps (air and ground-source)
Cooling Systems
Heat pumps (air and ground-source) Desiccant wheels
Absorption chillers Free cooling
Compressors Other
Table 1: Power, heating and cooling systems for which data are provided in the RETScreen Product Database.
Cost data
Each RETScreen Clean Energy Technology Model contains data on typical quanti-ties and costs for many of the items listed in the Cost Analysis Worksheet (Step 2) for the standard project analysis procedure. The built-in cost data is displayed in the rightmost column “Unit Cost Range,” as shown in Figure 32. The user can also enter custom columns of cost and quantity data by selecting the various options under the cell “Cost reference.” This option serves to update the original data, or to add custom data (e.g. for regional considerations). Complementary cost information is also available in the built-in Online Manual.
2. RETScreen Clean Energy Project Analysis Software
INTRO.49
2.1.5 Online manual and training material
A number of additional resources have been developed to help users learn how to use the RETScreen Software quickly, effectively, and accurately. These resources are:
Online manual: Within the RETScreen Software is an extensive Online User Manual (see Figure 33). For every cell displaying an output or requiring user input, there is an associated page in the online manual that explains what the cell means. This is helpful for new users and experts alike. New users can step through the spreadsheet, seeking guidance from the online manual for every input cell they encounter. Expert users can rely on the manual for clarifi cation of conventions and to help them remember pricing, sizing, and other details. The manual also provides background on both the clean energy technologies and the RETScreen methodology. This further enhances RETScreen’s utility in education and information dissemination. The manual is also available from the RETScreen Website for download as an Adobe Acrobat (pdf) format fi le, for those users who wish to print the entire manual.
Figure 32: Example of the Integrated Cost Data in the RETScreen Software.
Figure 33: Example of the integrated online manual in the RETScreen
Photovoltaic Project Model.
Introduction to Clean Energy Project Analysis Chapter
INTRO.50
Training material: Training material for a modular case study-based Clean Energy Project Analysis Course has been created for use by recognised educational centres and training organisations around the globe, as well as for use by professionals and college/university students in “self-study” distance learning format. Each module can be presented as a separate seminar or workshop for professionals, or as a section of a college/university course. All the modules combined can be presented either as a one to two week long intensive course for professionals or as a one to two semester long course for college/university students. The course material, including slide presentations (see Figure 34) and an instructor’s voice-over, has also been made available on the RETScreen Website for download, free-of-charge.
Engineering textbook: the electronic textbook Clean Energy Project Analysis: RETScreen Engineering & Cases (which you are currently reading) is written for professionals and university students who are interested in learning how to better analyse the technical and fi nancial viability of possible clean energy projects. It covers each of the technologies in the RETScreen Software, including a background of these technologies and a detailed description of the algorithms found in some of the RETScreen software clean energy technology models (see Figure 35). This textbook has also been made available on the RETScreen Website for download, free-of-charge.
Case studies: a collection of clean energy project case studies is also provided to complement the training material and to facilitate the use of the RETScreen Software. Available free-of-charge on the RETScreen website, these case studies typically include assignments, worked-out solutions (e.g. RETScreen Studies) and information about how the projects fared in the real world (see Figure 36).
Figure 34: Example of the complementary training course material (Slides) available with the RETScreen Software.
2. RETScreen Clean Energy Project Analysis Software
INTRO.51
The methodologies and algorithms common to all models are presented in detail in the following section. These include the greenhouse gas analysis, the financial analysis and the sensitivity & risk analysis methodologies.
2.2 Greenhouse Gas (GHG) Emission Reduction Analysis Model
The RETScreen Greenhouse Gas (GHG) Emission Reduction Analysis Model found in the GHG Analysis worksheet of the RETScreen Software, helps the user estimate the green-house gas emission reduction (mitigation) potential of a proposed clean energy project. The GHG analysis model is common to all RETScreen Clean Energy Technology Models. It calculates the GHG emission profile for a Base Case System (Baseline), and for the Proposed Case System (clean energy project). The GHG emission reduction potential is obtained by combining the difference of the GHG emission factors with other information calculated by RETScreen, such as the annual energy delivered.
Figure 35: Example of the complementary Engineering
Textbook “Clean Energy Project Analysis:
RETScreen Engineering & Cases” available
with the RETScreen Software.
Figure 36: Example of the complementary Case Studies
available with the RETScreen Software.
Introduction to Clean Energy Project Analysis Chapter
INTRO.52
The methodology implemented in the RETScreen Software to calculate the GHG emis-sion reductions associated with a clean energy project, has been developed by Natural Resources Canada in collaboration with the United Nations Environment Programme (UNEP), the UNEP Collaborating Centre on Energy and Environment at the RISØ National Laboratory, and the World Bank’s Prototype Carbon Fund (PCF). It has been validated by a team of experts from government and industry (see Appendix A).
There are some challenges that may arise in the basic calculations associated with a GHG analysis. The following items are taken into consideration by the RETScreen Software in addition to the Base Case/Proposed Case comparison:
Combustion produces not just carbon dioxide, but also methane and nitrous oxide. The RETScreen Software uses carbon dioxide, the most common GHG, as a common currency: methane and nitrous oxide emissions are converted into their equivalent carbon dioxide emission according to their “global warming potential” (GWP). International scientifi c committees such as the International Panel on Climate Change [IPCC, 1996] have proposed GWP factors for these gasses. These factors are built into the RETScreen Software as default conversion values used in the standard GHG analysis type.
The transmission and distribution (T & D) losses in electrical systems that feed into a grid must be considered. When electricity is generated in one place but consumed in another, a certain fraction of the electricity is lost as heat from the transmission and distribution lines connecting the two. Modern, industrialized grids tend to have losses of around 8 to 10 %. Thus, electricity destined for a grid (i.e. not consumed directly on-site) produced by either the base case system or the proposed case system must include these losses when calculating the energy delivered to the end user. The RETScreen Software permits the user to specify the expected “T & D losses”.
The number of credits that accrue to the project may be reduced if a percentage has to be paid annually as a transaction fee to a crediting agency (e.g. the United Nations Framework Convention on Climate Change - UNFCCC) or the country hosting the project, or both. The RETScreen Software includes an input cell entitled “GHG credits transaction fee” where the user can specify this percentage.
The RETScreen Software takes into account the emerging rules from the Kyoto Protocol that are associated with three specific flexibility mechanisms: the Clean Development Mecha-nism (CDM), Joint Implementation (JI), and Emissions Trading. These allow Parties to the Kyoto Protocol to pursue opportunities to cut emissions, or enhance carbon sinks, abroad.
This section presents the equations used in the RETScreen GHG Emission Reduction Analysis Model. The model works slightly differently depending on whether the clean energy system under consideration generates electricity or provides heating or cooling; the main difference lies in transmission and distribution losses, which are incurred only by electricity generating systems.
2. RETScreen Clean Energy Project Analysis Software
INTRO.53
2.2.1 GHG for electricity generating technology models
The method described in this section applies to technologies that produce electricity.
GHG emission reduction summary - electricity
The annual GHG emission reduction is estimated in the GHG Emission Reduction Analysis worksheet. The reduction ΔGHG is calculated as follows:
where ebase is the base case GHG emission factor, eprop is the proposed case GHG emission factor, Eprop is the proposed case annual electricity produced, λprop
is the fraction of electricity lost in transmission and distribution (T&D) for the proposed case, and ecr the GHG emission reduction credit transaction fee.
Note that for both the base case and proposed case system, the transmission and distribution losses are deemed to be nil for on-site generation, e.g. for off-grid and water-pumping PV applications.
GHG emission factor – base case electricity system
Equation (1) requires the calculation of the GHG emission factors, defined as the mass of greenhouse gas emitted per unit of energy produced. For a single fuel type or source, the following formula is used to calculate the base case electricity system GHG emission factor, ebase :
where eCO 2, eCH 4
, and eN O2 are respectively the CO
2, CH
4 and N
2O emission fac-
tors for the fuel/source considered, GWPCO2, GWPCH 4
, and GWPN O2 are the global
warming potentials for CO2, CH
4 and N
2O, η is the fuel conversion efficiency, and
λ is the fraction of electricity lost in transmission and distribution.
The global warming potential of a gas, or “GWP,” describes the potency of a GHG in comparison to carbon dioxide, which is assigned a GWP of 1. For example, a GWP of 310 for N
2O indicates that a tonne of nitrous oxide is considered to cause
310 times more global warming than a tonne of carbon dioxide. The GWP for methane and nitrous oxide can be defined by the user (in the case of a “custom” analysis) or by the software (in the case of a “standard” analysis). The default values
(1)
(2)
Introduction to Clean Energy Project Analysis Chapter
INTRO.54
used by RETScreen are shown in Table 2; these values can be found in the Revised Intergovernmental Panel on Climate Change (IPCC) Guidelines for Greenhouse Gas Inventories, 1996.
The GHG emission factor will vary according to the type and quality of the fuel, and the type and size of the power plant. Emission factors are defined by the user (in the case of a “custom” analysis) or by the software (in the case of a “standard” analysis).
Greenhouse gas GWPCO2
1
CH 21
N2O 310
Table 2: Global warming potentials of greenhouse gases.
In cases for which there are a number of fuel types or sources, the GHG emission factor ebase for the electricity mix is calculated as the weighted sum of emission factors calculated for each individual fuel source:
where n is the number of fuels/sources in the mix, fi is the fraction of end-use electricity coming from fuel/source i, and ebase i, is the emission factor for fuel i, calculated through a formula similar to equation (2):
where
,
, and are respectively the CO2, CH
4 and N
2O emission
factors for fuel/source i, ηi is the fuel conversion efficiency for fuel i, and λi is fraction of electricity lost in transmission and distribution for fuel i.
Alternatively, the GHG emission factor for the electricity mix, before transmission and distribution losses are applied, can be entered directly by the user, in case of a “user-defined” analysis.
(3)
(4)
2. RETScreen Clean Energy Project Analysis Software
INTRO.55
Note that the GHG emission factor for the electricity mix will apply from year 1 up to the year of change in baseline, as specified by the user, unless no changes are specified; in this case, the emission factor will apply throughout the life of the project. When a change in the baseline emission factor is specified, the new factor for the year that the change in baseline takes place, and the years that follow will be determined by (e*):
where rchange is the percentage change in the base case (baseline) GHG emission factor for the year that the change in baseline takes place, and the years that follow.
GHG emission factor – proposed case electricity system
The calculation of the proposed case electricity system GHG emission factor, eprop ,
is similar to that of the base case GHG emission factor, with the exception that for off-grid systems the fraction of electricity lost in transmission and distribution is set to zero.
eprop is therefore calculated through equation (2) with λ = 0 , in the
case of a single fuel/source, or through equations (3) and (4) with all λi = 0 , in the case of a mix of fuel/sources.
Alternatively, the proposed case GHG emission factor, before transmission and dis-tribution losses are applied, can be entered directly by the user, in case of a “user-defined” analysis.
2.2.2 GHG for heating and cooling technology models
The method described in this section applies to heating and cooling technologies.
GHG emission reduction summary – heating and cooling
The annual GHG emission reduction is estimated in the GHG Emission Reduction Analysis Worksheet. The reduction ΔGHG hc, is calculated as follows:
where ΔGHG heat, and
ΔGHG cool, are the annual GHG emission reductions from heat-ing and cooling. These are calculated as:
(5)
(6)
Introduction to Clean Energy Project Analysis Chapter
INTRO.56
where ebase heat, and ebase cool, are the base case GHG emission factors for heating and for cooling, and eprop heat, and
eprop cool, are the proposed case GHG emission
factors for heating and for cooling. Eprop heat, is the proposed case end-use annual
heating energy delivered and Eprop cool, is the proposed case end-use annual cool-
ing energy delivered.
GHG emission factor – base case electricity system
Some applications require the definition of a base case electricity system to account for the GHG emissions from electricity that can be emitted for heating, for air con-ditioning or to drive auxiliary equipment such as fans and pumps (for example, a solar water heating system may require an electric pump to circulate water through the collectors). The corresponding GHG emission factor is calculated through equa-tion (2) in the case of a single fuel/source, or through equations (3) and (4) in the case of a mix of fuel/sources.
GHG emission factor – base case and proposed case heating and cooling systems
For a single fuel type or source, the GHG emission factor e (for example ebase cool, , ebase heat, , etc.) is calculated through an equation very similar to equation (2), except that there are no transmission and distribution losses (since heating or air-condi-tioning systems are considered to be at the site of use):
where η is the fuel conversion efficiency and all other variables have the same mean-ing as in equation (2). If there are a number of fuel types or sources, the GHG emis-sion factor is calculated as the weighted sum of emission factors calculated for each individual fuel source:
(8)
(9)
(10)
(7)
2. RETScreen Clean Energy Project Analysis Software
INTRO.57
where n is the number of fuels/sources in the mix,
fi is the fraction of end-use energy coming from fuel/source i, and ei is the emission factor for fuel i, calculated through a formula similar to equation (9):
where ηi is the fuel conversion efficiency for fuel i.
For heating systems, the calculation of the emission factor for the proposed case requires special attention because of the presence of parasitic electric energy. For example the electricity required to run the pump of a solar collector does not con-tribute to the clean energy delivered by the system, but it does contribute to its GHG emissions. To take this into account, the following quantity, epara , is added to the GHG emission factor calculated through equations (9) and (10):
where eelec is the emission factor for the base case electricity system, Eprop para, is the parasitic electrical energy used in the proposed case, and Eprop heat, is, as before, the proposed case end-use annual heating energy delivered.
2.3 Financial Analysis Model
The RETScreen Financial Analysis Model, found in the Financial Summary worksheet of the RETScreen Software, allows the user to input various financial parameters, such as discount rates, etc., and to automatically calculate key financial feasibility indicators, such as internal rate of return, simple payback, net present value, etc.
This section presents the equations used in the RETScreen Financial Analysis Model. The formulae used are based on standard financial terminology that can be found in most fi-nancial textbooks, such as Brealey and Myers (1991) or Garrison et al. (1990). The model makes the following assumptions:
The initial investment year is year 0;
The costs and credits are given in year 0 terms, thus the infl ation rate (or the escalation rate) is applied from year 1 onwards; and
The timing of cash fl ows occurs at the end of the year.
(11)
e eEEpara elec
prop para
prop heat
= ,
,
(12)
Introduction to Clean Energy Project Analysis Chapter
INTRO.58
2.3.1 Debt payments
Debt payments are a constant stream of regular payments that last for a fixed number of years (known as the debt term). The yearly debt payment D is calculated using the fol-lowing formula:
(13)
where C is the total initial cost of the project, fd is the debt ratio, id is the effective annual debt interest rate, and N ′ is the debt term in years. The yearly debt payment, as given by equation (13), can be broken down into payment towards the principal Dp n,
and payment of interest Di n, :
(14)
Both Dp n, and Di n, vary from year to year; they are calculated by standard functions built
into Microsoft® Excel.
2.3.2 Pre-tax cash fl ows
The calculation of cash flows keeps track, on a yearly basis, of all expenses (outflows) and in-comes (inflows) generated by the clean energy project. This sub-section presents the formu-lae used in RETScreen to determine the cash flows of a project, before considering taxes.
Cash outfl ows
For year zero, the pre-tax cash outflow Cout ,0 is equal to the project equity, that is, the portion of the total investment required to finance the project that is funded directly and therefore not incorporated in the financial leverage (e.g. not included in the debt):
(15)
For subsequent years, the pre-tax cash outflow Cout n, is calculated as:
(16)
2. RETScreen Clean Energy Project Analysis Software
INTRO.59
where n is the year, CO M& is the yearly operation and maintenance costs incurred by the clean energy project, ri is the inflation rate, C fuel is the annual cost of fuel or electricity, re is the energy cost escalation rate, D is the annual debt payment (equation 13), and Cper is the periodic costs or credits incurred by the system.
Cash infl ows
For year zero, the pre-tax cash inflow Cin,0 is simply equal to the incentives and grants IG :
(17)
For subsequent years, the pre-tax cash inflow Cin n, is calculated as:
(18)
where n is the year, Cener is the annual energy savings or income, Ccapa is the annual capacity savings or income, CRE is the annual renewable energy (RE) production credit income, rRE the RE credit escalation rate, CGHG is the GHG reduction income, rGHG is the GHG credit escalation rate. For the last year, the end-of-project life credit, incremented by inflation, is added to the right-hand side of equation (18).
Pre-tax cash fl ows
The pre-tax cash flow Cn for year n is simply the difference between the pre-tax cash inflow and the pre-tax cash outflow:
(19)
2.3.3 Asset depreciation
The calculation of asset depreciation (or capital cost allowance) depends on the deprecia-tion method chosen by the user in the Financial Summary Worksheet: choices are “None,” “Declining balance,” or “Straight-line.” The yearly depreciation of assets is used in the model in the calculation of income taxes and after-tax financial indicators. The user should select the method which most closely resembles the methods used by the tax departments in the jurisdiction of the project. At the end of the project life, the difference between the “End of project life” value and its undepreciated capital costs is treated as income if posi-tive and as a loss if negative.
Introduction to Clean Energy Project Analysis Chapter
INTRO.60
When there is no depreciation, the model assumes that the project is fully capitalised at inception, is not depreciated through the years and therefore maintains its undepreciated value throughout its life. At the end of the project’s life, the depreciation is equal to the undepreciated, or full value of the assets. For both declining balance and straight-line de-preciation, the model assumes that the full depreciation allowed for a given year is always taken.
Declining balance depreciation
The declining balance depreciation method depreciates the asset more quickly in the early years of the project, leading to more depreciation earlier rather than in the later years of the asset’s useful life. For the first year (year zero), the capital cost allowance CCA0 is calculated using the portion of the initial costs that are fully expensed during the year of construction:
(20)
where δ is the depreciation tax basis used to specify which portion of the initial costs are capitalised and can be depreciated for tax purposes. The portion which is not depreciated is deemed to be fully expensed during the year of construction (year 0). The undepreciated capital cost at the end of year zero, UCC0 is calculated through:
(21)
For subsequent years, the capital cost allowance is given by:
(22)
where d is the depreciation rate, and UCCn 1 is the undepreciated capital cost at the end of the n( )1 -th period, given as:
(23)
Finally at the end of the project life (year N), the remaining portion of the undepre-ciated capital cost is deemed to be fully expensed and the capital cost allowance for the last year is thus set to be equal to the undepreciated cost of capital:
(24)
2. RETScreen Clean Energy Project Analysis Software
INTRO.61
so that the undepreciated capital cost at the end of that year becomes zero:
(25)
Straight-line depreciation
With the straight-line depreciation method, the financial analysis model assumes that the capitalised costs of the project, as specified by the depreciation tax basis, are depreciated with a constant rate over the depreciation period. The portion of initial costs not capitalised is deemed to be expensed during the year of construction, i.e. year 0. In this method, the following formulae are used:
(26)
for year zero, and for subsequent years within the depreciation period:
(27)
where Nd is the user-defined depreciation period in years.
2.3.4 Income tax
The income tax analysis allows the financial analysis model to calculate after-tax cash flows and after-tax financial indicators. The tax rate used in the RETScreen Financial Summary worksheet is the effective equivalent rate, and is specified by the user. It is the rate at which the net income from the project is taxed. In all cases, the financial analysis model assumes a single income tax rate valid and constant throughout the project life and applied to net income.
Net taxable income is derived from the project cash inflows and outflows assuming that all revenues and expenses are paid at the end of the year in which they are earned or incurred. The amount of tax Tn for year n is equal to the effective income tax rate t , specified by the user, multiplied by the net income for that year, In :
(28)
Introduction to Clean Energy Project Analysis Chapter
INTRO.62
The net income for years one and beyond is calculated as:
(29)
where Cn is the pre-tax annual cash flow (equation 19), Dp n, is the payment on the prin-cipal (equation 14), and CCAn is the capital cost allowance (equations 20 or 25 depending on the asset depreciation method selected). For year 0, the net income is simply:
(30)
where IG is the value of incentives and grants.
2.3.5 Loss carry forward
A loss (e.g. a negative net income) in a given year can sometimes be used, according to some taxation rules, to lower taxes owed in that same year. According to other taxation rules, it can be deferred to offset profits from future years. A third alternative is that the loss cannot be used in the same year nor in the future, and is thus lost from a tax perspective. The Loss Carry Forward option in the Financial Summary worksheet allows the user to select which of the three rules apply to the project being analysed. If the Loss Carry Forward option is selected, losses are carried forward and applied against net income in the following years, thereby reducing taxes in the following year(s). If the option is not selected, losses are not carried forward nor applied against other income, but are effectively lost as a tax offset. If the Flow-through option is selected, losses are not carried forward but used to generate a refundable tax credit in the year in which the loss occurs.
2.3.6 After-tax cash fl ow
Considering the pre-tax cash flows, the asset depreciation, the income tax, and the loss carry forward discussed in the previous sections, the after-tax cash flow nC~ is calculated as follows:
(31)
where Cn is net cash flow (equation 19) and Tn the yearly taxes (equation 28).
2. RETScreen Clean Energy Project Analysis Software
INTRO.63
2.3.7 Financial feasibility indicators
This sub-section presents several financial feasibility indicators calculated automatically by the RETScreen Software in the Financial Summary worksheet. Based on the data entered by the user, they provide financial indicators for the project being analysed, facilitating the project evaluation process for planners and decision-makers.
Internal rate of return (IRR) and return on investment (ROI)
The internal rate of return IRR is the discount rate that causes the Net Present Value (NPV) of the project to be zero. It is calculated by solving the following for-mula for IRR:
(32)
where N is the project life in years, and Cn is the cash flow for year n (note that C0 is the equity of the project minus incentives and grants; this is the cash flow for year zero). The pre-tax IRR is calculated using pre-tax cash flows, while the after-tax IRR is calculated using the after tax cash flows. Note that the IRR is undefined in certain cases, notably if the project yields immediate positive cashflow in year zero.
Simple payback
The simple payback SP is the number of years it takes for the cash flow (excluding debt payments) to equal the total investment (which is equal to the sum of the debt and equity):
(33)
where all variables were previously defined.
Year-to-positive cash fl ow (also Equity payback)
The year-to-positive cash flow NPCF is the first year that the cumulative cash flows for the project are positive. It is calculated by solving the following equation for NPCF :
(34)
where nC~ is the after-tax cash flow in year n.
Introduction to Clean Energy Project Analysis Chapter
INTRO.64
Net present value (NPV)
The net present value NPV of a project is the value of all future cash flows, dis-counted at the discount rate, in today’s currency. It is calculated by discounting all cash flows as given in the following formula:
(35)
where r is the discount rate.
Annual life cycle savings
The annual life cycle savings ALCS is the levelised nominal yearly savings having exactly the same life and net present value as the project. It is calculated using the following formula:
(36)
Benefi t-Cost (B-C) ratio
The benefit-cost ratio, B C , is an expression of the relative profitability of the project. It is calculated as a ratio of the present value of annual revenues (income and/or savings) less annual costs to the project equity:
(37)
Debt service coverage
The debt service coverage DSC is the ratio of the operating benefits of the project over the debt payments. This value reflects the capacity of the project to generate the cash liquidity required to meet the debt payments. The debt service coverage DSCn for year n is calculated by dividing net operation income (net cash flows before depreciation, debt payments and income taxes) by debt payments (principal and interest):
(38)
2. RETScreen Clean Energy Project Analysis Software
INTRO.65
where COIn is the cumulative operating income for year n, defined as:
(39)
The Financial Analysis model calculates the debt service coverage for each year of the project and reports the lowest ratio encountered throughout the term of debt.
Energy production cost
The energy production cost is the avoided cost of energy that brings the net present value to zero. This parameter is not included in the Combined Heat & Power Model, since there are potentially many types of energy produced, each potentially having a distinct production cost . The energy production cost, Cprod , is thus obtained by solving for:
(40)
where
(41)
(42)
(43)
GHG emission reduction cost
The GHG Emission reduction cost GRC represents the levelised nominal cost to be incurred for each tonne of GHG avoided. It is calculated by:
(44)
where ALCS is the annual life cycle savings calculated in equation 36, and GHG is the annual GHG emission reduction, calculated in the GHG Analysis worksheet (equation 1).
Introduction to Clean Energy Project Analysis Chapter
INTRO.66
2.4 Sensitivity and Risk Analysis Models
The RETScreen Sensitivity and Risk Analysis Models, found in the Sensitivity and Risk Analysis worksheet of the RETScreen Software, help the user estimate the sensitivity of important financial indicators in relation to key technical and financial parameters. This worksheet contains two main sections: Sensitivity Analysis and Risk Analysis. Each analy-sis provides information on the relationship between the technical and financial param-eters and the financial indicators, showing the parameters which have the greatest impact on the financial indicators. Both the sensitivity and the risk analyses are optional, and the related inputs or outputs do not affect results in other worksheets.
The Sensitivity and Risk Analysis worksheet varies slightly from one Clean Energy Technol-ogy Model to the next, reflecting the different key parameters that are important to each technology. Nevertheless, all share a common underlying algorithm, described below. This sub-section presents the methodology and the equations used, together with a validation of the accuracy of the “Risk Analysis” portion of this model. The “Sensitivity Analysis” portion of this model consists of a series of tables, similar to the one shown in Figure 37, which show the effect of varying a pair of input parameters on the financial feasibility indicators. This method is relatively straightforward and is not described in detail here.
2.4.1 Monte Carlo simulation
The Risk Analysis Model in RETScreen is based on a “Monte Carlo simulation,” which is a method whereby the distribution of possible financial indicator outcomes is generated by using randomly selected sets of values as input parameters, within a predetermined range, to simulate possible outcomes.
In the RETScreen Software Monte Carlo simulation, the input parameters relate to several pre-selected technical and financial parameters, and the output indicators relate to key financial indicators (see Table 3). The simulation consists of two steps:
32,54636,61440,68244,75048,619
Avoided cost of energy ($/kWh)RE delivered
(MWh)
-20%-10%0%
10%20%
7.2%10.2%13.3%16.6%20.0%
9.8%13.1%16.7%20.4%24.4%
12.4%16.1%20.1%24.4%28.9%
14.9%19.2%23.7%28.5%33.6%
17.6%22.3%27.4%32.8%38.4%
0.0760-20%
0.0855-10%
0.09500%
0.104510%
0.114020%
Figure 37: Example of a Sensitivity Analysis Chart from the default built-in example of the Wind Energy Project Model. The analysis is performed
on the after-tax IRR and ROI, with a sensitivity range of 20% and a threshold of 15%. The three original values used in the analysis
are indicated in bold.
2. RETScreen Clean Energy Project Analysis Software
INTRO.67
1. For each input parameter, 500 random values are generated using a normal (Guassian) distribution with a mean of 0 and a standard deviation of 0.33 using the Random Number Generation function in Microsoft® Excel’s Data Analysis ToolPack. Once generated, these random numbers are fi xed.
2. Each random value is then multiplied by the related percentage of variability (range) specifi ed by the user in the Sensitivity and Risk Analysis worksheet. The result is a 500 x 9 matrix containing percentages of variation that will be applied to input parameters’ initial value in order to obtain 500 results for the output fi nancial indicators.
Since the set of random numbers is fixed, whenever the same input parameters are speci-fied in the RETScreen Clean Energy Project Model and the same ranges of variability are used, the user will obtain exactly the same results from the Risk Analysis Model.
Technical and Financial Parameters(Input parameters)
Financial Indicators(Output indicators)
Avoided cost of energy
Fuel cost – proposed case
Fuel cost – base case
Renewable energy (RE) delivered
Initial costs
Annual costs (O&M)
Debt ratio
Debt interest rate
Debt term
GHG emission reduction credit
Net GHG reduction – credit duration
RE production credit (CE production credit)
Customer premium income – rebate
Electricity export rate
After-tax internal rate of return (IRR)and return on investment (ROI)
After-tax IRR – equity
After-tax IRR – assets
Year-to-positive cash fl ow (equity payback)
Net present values (NPV)
Table 3: Input Parameters and Output Indicators associated with the Monte Carlo simulation performed
in the RETScreen Risk Analysis Model.
Introduction to Clean Energy Project Analysis Chapter
INTRO.68
2.4.2 Impact graph
The impact of each input parameter on a financial indicator is obtained by applying a standardised multiple linear regression19 on the financial indicator. The input parameters’ coefficients, calculated using the method of least squares, are the values plotted on the impact graph (see Figure 38). The multiple linear regression is developed as follows, using the Wind Energy Project Model as an example.
Let Y , the dependent variable, be a financial indicator, and the independent variables X be the input parameters as follows:
X1 be the avoided cost of energy;
X 2 be the RE delivered;
X 3 be the initial costs;
X 4 be the annual costs;
X 5 be the debt ratio;
X 6 be the debt interest rate;
X 7 be the debt term;
X8 be the GHG emission reduction credit; and
X 9 be the RE production credit.
Then the multiple linear regression model is:
(45)
where βk are the coefficients for each parameter k and ε is the model error. To build the model, the data generated from the Monte Carlo simulation are used. There are 500 values of Y associated to 500 values for each X . The Microsoft® Excel function LINEREG, applied to the Y vector and the X matrix, calculates the coefficients using the method of least squares.
These coefficients are then standardised by applying the following formula:
(46)
where sk is the standard deviation of the 500 X k values and sY is the standard deviation of the 500 Y values. The bk values are then plotted on the impact graph.
19. See Neter, Wasserman, Kutner. Applied Linear Statistical Models. 3rd edition. Homewood, IL: Irwin, 1990.
2. RETScreen Clean Energy Project Analysis Software
INTRO.69
2.4.3 Median & confi dence interval
The median of a financial indicator is the 50th percentile of the 500 values generated by the Monte Carlo simulation. The median is given by the Microsoft® Excel function MEDIAN, and is calculated by first ordering the 500 financial indicator values from the smallest to the biggest. The median is the average of the 250th and 251st ordered values.
The confidence interval is the range of values within which the Monte Carlo simulation falls. A 90% confidence interval indicates that 90% of the 500 financial indicator values will fall within a certain range. The user specifies the level of risk, or the percentage of values which will fall outside the confidence interval (e.g. a 90% confidence interval has a 10% level of risk).
The minimum level of confidence for a financial indicator is given by the percentile cor-responding to half the level of risk defined by the user. This percentile is given by the PERCENTILE function in Microsoft® Excel. For example, for a level of risk of 10%, the minimum level of confidence will be the 5th percentile of the 500 values generated by the Monte Carlo simulation. It is calculated by ordering the 500 financial indicator values in ascending order. The 5th percentile is the average of the 25th and 26th values. Similarly, the maximum level of confidence is the percentile corresponding to one minus half the level of risk. Using the above example, the maximum level of confidence would be the 95th percentile, obtained by taking the average of the 475th and 476th values.
Figure 38: Impact Chart (Tornado Graph) that shows the relative effect of parameters variation over the After-Tax IRR and ROI in the Risk Analysis
Model; example from the default built-in example of the Wind Energy Project Model (Sensitivity and Risk Analysis Worksheet).
Introduction to Clean Energy Project Analysis Chapter
INTRO.70
2.4.4 Risk analysis model validation
A validation of the Risk Analysis Model was performed to assess the accuracy of the impact statistics, the median, and the maximum and minimum level of confidence. The validation also investigated the effect of the number of observations used in the Monte Carlo simu-lation on the precision of the impact results. The validation was done by comparing the statistical results obtained from RETScreen to JMP, a statistical software from the company SAS. The default example of the RETScreen Wind Energy Project Model was used as the test case.
Number of observations effect
All the results presented in the Risk analysis section are obtained from a Monte Carlo simulation using 500 randomly generated observations. It is well known that the larger the number of observations generated, the more precise the estimates obtained from the simulation will be. The drawback is an increase in the time it takes to perform the calculations. To assess the effect the number of observations used in the Monte Carlo simulation has on the precision of the impact results, the following calculations were performed.
For each financial indicator output, a multiple linear regression analysis was per-formed using subsets of the 500 values generated from the Monte Carlo simulation. The subsets were obtained using the last 50 observations, last 100 observations, and so on, up to the last 450 observations and the full set of 500 observations. For each of these subsets, multiple linear regression coefficients and their estimation error were used as the input parameters for the JMP statistical software. The estimation errors were then standardised according to their standard deviation:
(47)
where Z p i, is the standardised error for the input parameter p and subset i (e.g. the subset of the last 50 observations, last 100 observations, etc.), Qp i, is the error in the estimate of parameter p when using subset i, Qp is the average for all values of i of the error Qp i, , and σ p is the standard deviation of the set of Qp i, for the parameter p over all values of i (i.e., 50 observations, 100 observations, etc.).
The values of Z p i, are plotted in Figures 39, 40, and 41. Note that with standardised errors, a negative value does not mean underestimation; rather, it means that the error is lower than average. As the number of observations in the Monte Carlo simu-lation increases, the standardised error of the regression coefficients decreases. The slope of the standardised error usually flattens as the number of observations gets closer to 500. This pattern is more obvious for NPV and after-tax IRR and ROI than for the year-to-positive cash flow.
2. RETScreen Clean Energy Project Analysis Software
INTRO.71
NPV - Variability of input parameters’ regression coefficient estimates
-1.5
-1.0
-0.5
0.0
0.5
1.0
1.5
2.0
2.5
3.0
100 200 300 400 500
Number of observations
Sta
ndar
dis
ed e
rro
r
avoided cost RE delivered Initial costs
Annual costs Debt ratio Interest rate
Debt term GHG credit RE production credit
Figure 39:Standardised Error for Net Present Value as a Function of the Number of Observations.
IRR - Variability of input parameters’ regression coefficient estimates
-1.5
-1.0
-0.5
0.0
0.5
1.0
1.5
2.0
2.5
100 200 300 400 500
Number of observations
Sta
ndar
dis
ed e
rro
r
avoided cost RE delivered Initial costs
Annual costs Debt ratio Interest rate
Debt term GHG credit RE production credit
Figure 40: Standardised Error for the Internal Rate of Return as a Function of the Number of Observations.
Introduction to Clean Energy Project Analysis Chapter
INTRO.72
Statistical results accuracy
Using the test case (the default values in the Wind Energy Project Model), three different risk analysis scenarios were generated. The accuracy of impact, median, maximum and minimum level of confidence was checked against the JMP statistical software. For after-tax IRR and ROI, and year-to-positive cash flow, three decimals of precision were used; for the NPV, results were expressed to the nearest integer.
For all three scenarios, RETScreen’s values for the impacts and the medians were identi-cal to those of the JMP software. The RETScreen Risk Analysis Model’s maximum and minimum within level of confidence values never differed more than 0.7% from those of JMP, as summarized in Table 4. The average ratio of the difference between RETScreen and JMP over the financial output indicators range for all three scenarios is 0.24% for the minimum level of confidence and -0.30% for the maximum level of confidence.
On average, the RETScreen Risk Analysis Model gives a higher minimum within level of confidence and a lower maximum within level of confidence resulting in a confidence interval that is narrower than the JMP software. The average differ-ence between RETScreen and JMP increases with increasing range of the financial indicator (e.g. the difference between the maximum and minimum values from the 500 calculations in the Monte Carlo simulation). Overall, the differences are insig-nificant and illustrate the adequacy of the RETScreen Sensitivity and Risk Analysis Model for pre-feasibility studies.
Year - Variability of input parameters’ regression coefficient estimates
100 200 300 400 500
Number of observations
Sta
ndar
dis
ed e
rro
r
-2.0-1.5
-1.0-0.5
0.00.5
1.01.52.0
2.53.0
avoided cost RE delivered Initial costs
Annual costs Debt ratio Interest rate
Debt term GHG credit RE production credit
Figure 41: Standardised Error for Year-to-Positive Cash Flow as a Function of the Number of Observations.
2. RETScreen Clean Energy Project Analysis Software
INTRO.73
Average differences(RETScreen vs JMP)
Ratio of average differences
over results range
Within level of confi dence Within level of confi dence
Financial output Results range Minimum Maximum Minimum Maximum
Table 4: Comparison of RETScreen and JMP for Minimum and Maximum within Level of Confi dence.
2.5 Summary
This introductory chapter has first explained the reasons for the mounting interest in clean energy technologies and has provided a quick synopsis of the operation of these technolo-gies and their applications and markets. It has then proceeded to discuss the importance of pre-feasibility analysis within the project implementation cycle. Finally, it has described the methods common to all RETScreen Clean Energy Technology Models: the use of cli-mate and renewable energy resource data (e.g. weather data), the greenhouse gas emission reduction calculation, the financial analysis, and the sensitivity and risk analysis.
Clean energy technologies have received increasing attention over the last decade as one response to the challenges of global warming, increasing demand for energy, high fuel costs, and local pollution. Commercial technologies for power, heating and cooling enjoy stong markets, with substantial opportunities for future expansion around the world. To benefit from these technologies, energy project proponents and stakeholders must be able to assess on a life cycle cost basis whether a particular proposed project makes sense. Therefore, using the minimum investment of time and effort to determine the most finan-cially attractive option, competing energy options have to be screened early in the project planning stages.
Introduction to Clean Energy Project Analysis Chapter
INTRO.74
The RETScreen International Clean Energy Project Analysis Software facilitates this deci-sion process, and can be used worldwide to evaluate the energy production, life-cycle costs and greenhouse gas emission reductions for various types of proposed energy efficient and renewable energy technologies (RETs). Its use significantly reduces the cost and increases the precision of pre-feasibility studies and contributes to the formulation of more fully informed decisions prior to project implementation. The RETScreen Software is increasing and improving access to clean energy technologies, building awareness & capacity, and helping to identify opportunities that facilitate the implementation of energy projects that save money, while reducing greenhouse gas emissions.
INTRO.75
REFERENCES
Al Homoud, M.S., Variable-Base Heating and Cooling Degree-Day Data for 24 Saudi Arabian Cities, ASHRAE Transactions, 104-2, 1998.
Alward, R., Remote Community Renewable Energy Technology Project Identifi cation Initiative (RETPII), Natural Resources Canada’s CANMET Energy Diversifi cation Research Laboratory (CEDRL), Varennes, QC, Canada, Initiative Summary (Abstract), 6 pp, 1999.
American Wind Energy Association (AWEA), Global Wind Power Growth Continues to Strengthen, 2005.
ASHRAE, Commercial/Institutional Ground-Source Heat Pump Engineering Manual, American Society of Heating, Refrigerating and Air-Conditioning Engineers, Inc., 1791 Tullie Circle, N.E., Atlanta, GA 30329, USA, 1995.
ASHRAE, Handbook of Fundamentals, SI Edition, American Society of Heating, Refrigerating and Air-Conditioning Engineers, Inc., 1791 Tullie Circle, N.E., Atlanta, GA 30329, USA, 1997.
Beaumert, K. and Selman, M., Data Note: Heating and Cooling Degree Days, World Resources Institute, 2003.
Chandler, W.S., Brown, D.E., Whitlock, C.H., and Stackhouse, P.W., NASA Climatological Data for Renewable Energy Assessment, Submitted to ISEC 2003 International Solar Energy Conference, 16-18 March 2003, Mauna Kea Resort, HI, USA, 2003.
Danish Wind Industry Association, 2004.
Eliasson, B., Renewable Energy: Status and Prospects 1998, Baden-Dättwil, Switzerland: ABB Corporate Research, Ltd., 1998.
Environment Canada, Canadian Weather Energy and Engineering Data Sets (CWEEDS), 1993.
European Commission, European Network of Energy Agencies ATLAS, 2005.
European Wind Energy Association (EWEA), Wind Power Installed In Europe by end of 2003, 2005.
ESTIF, A Solar Thermal Strategy: Sun in Action II, Renewable Energy World, pp. 200-209, July-August 2003.
Gipe, P., The BTM Wind Report: World Market Update, Renewable Energy World, pp. 66-83, July-August 2003.
IEA, Energy to 2050—Scenarios for a Sustainable Future, International Energy Agency (IEA), Paris, France, 2003.
IEA Statistics, Renewables Information, IEA, Paris, France, 2003.
International Small Hydro Atlas, Small-Scale Hydro Annex of the International Energy Agency (IEA)’s Implementing Agreement for Hydropower Technologies & Programmes, 2004.
Introduction to Clean Energy Project Analysis Chapter
INTRO.76
IPCC, IPCC Third Assessment Report—Climate Change 2001: Summary for Policy Makers, Intergovernmental Panel on Climate Change (IPCC), Geneva, Switzerland, 2001.
Langcake, P., Getting a Clear View: Strategic Perspectives for Renewable Energy Companies, Renewable Energy World, pp. 29-37, March-April 2003.
Leng, G., Monarque, A., Graham, S., Higgins, S., and Cleghorn, H., RETScreen® International: Results and Impacts 1996-2012, Natural Resources Canada’s CETC-Varennes, ISBN 0-662-11903-7, Cat. M39-106/2004F-PDF, 44 pp, 2004.
Lund, J., Ground-source Heat Pumps: A World Overview, Renewable Energy World, pp. 218-227, July-August 2003.
Marine Current Turbines, Bristol, UK, 2005.
Maycock, P., Boomer, PVNews, May 2004.
Maycock, P., PV Market Update, Renewable Energy World, pp. 84-101, July-August 2003.
Microsoft Online Help and Support, Microsoft, 2005.
National Aeronautics and Space Administration (NASA), USA, 2005.
National Renewable Energy Laboratory (NREL), Golden, CO, USA, 2005.
NCDC, International Surface Weather Observations (ISWO), Available from the National Climatic Data Centre, 151 Patton Ave., Asheville, NC, 28801-5001, USA, 1997.
Strahler, A.H. and Strahler, A.N., Modern physical geography, New York: John Wiley and Sons, 1992.
Swenson, A., Energy Consumption by End Use, Energy Information Administration, U.S. Department of Energy, USA, 1998.
Thevenard, D.J. and Brunger, A.P., The Development of Typical Weather Years for International Locations: Part I, Algorithms, and Part II: Production, ASHRAE Transactions, 108, 2, 376-383 and 480-486, 2002.
Whitlock, C., Brown, D., Chandler, W., DiPasquale, R., Meloche, N., Leng, G.J., Gupta, S., Wilber, A., Ritchey, N., Carlson, A., Kratz, D., Stackhouse, P., Release 3 NASA Surface Meteorology and Solar Energy Data Set for Renewable Energy Industry Use, Rise & Shine 2000 – The 26th Annual Conference of the Solar Energy Society of Canada Inc. (SESCI), Halifax, NS, Canada, October 21st to 24th, 2000.
Windpower Monthly News Magazine, The Windicator, Windpower Monthly, January 2004.
World Resources Institute, Earth Trends: Energy Consumption by Economic Sector, 2003.
APPENDIX A - RETScreen Development Team & Experts
INTRO.77
APPENDIX A - RETSCREEN DEVELOPMENT TEAM & EXPERTS
A core team at CETC-Varennes provides the technical knowledge and management of RETScreen International, and a large network of experts from industry, government and academia provide technical support on a contracted or task-shared basis. This approach pro-vides RETScreen International with access to a broad array of expert skills that are needed for specialised tasks. The RETScreen International core team is presented in Figure 42.
More than 221 people have been directly involved in the development and support of RETScreen International, with 20 to 50 people working with the core RETScreen team during the course of a year. They include professional staff from the RETScreen partner organisations such as UNEP, NASA, the World Bank, and other Government of Canada programs; plus experts from a number of private-sector firms, including GPCo, Enermodal Engineering, Numerical Logics, TN Conseil, Ottawa Engineering, Econoler International, IT Power India, Umen, Cybercat and Projet Bleu, to name but a few.
The core team and network of experts include energy modeling specialists who help de-velop the individual technology computer simulation models, cost engineering experts who have extensive hands-on experience with project installations, greenhouse gas modeling and baseline specialists with broad experience in economic and environmental analysis, and financial and risk analysis professionals with considerable experience in evaluating and financing projects.
Introduction to Clean Energy Project Analysis Chapter
INTRO.78
Other experts include the team developing the ground station and satellite weather data-bases, as well as the product databases. Additional experts validate the work done by the core development team of experts and others provide testing and debugging of the final products, as well as preparing case studies, e-Textbook chapters and training material for the course.
The team also includes numerous people involved in the overall software completion and website development and a dedicated group involved in customer support and outreach.
Finally, hundreds of other people provide comments and suggestions for improvements to the RETScreen software on an on-going basis, and a growing international network of RET-Screen trainers provide local training and technical support to users around the globe.
The following is an alphabetical listing of the people who have been directly involved in the development and support of RETScreen International to-date:
Richard AdamsonSouthern Research Institute
Kim Ah-YouNRCan/CETC-Varennes
Gerard AllengUniversity of Delaware
Ron AlwardNRCan/CETC-Varennes
Tommy AndersonNRCan/CETC-Varennes
Louis AugerGPCo
Josef AyoubNRCan/CETC-Varennes
Pierre-Luc BeaupréProjet Bleu
Vadim BelotserkovskyGPCo
Kearon J. BennettOttawa Engineering
Jocelyn BenoitNRCan/CETC-Varennes
Jocelyn BérubéGraphiscan
S. C. BhattacharyaAsian Institute of Technology (AIT)
Mariusz BogackiPolish Foundation for Energy Effi ciency (FEWE)
Daniel BolinuNRCan/CETC-Ottawa
Julie BosséNRCan/CETC-Varennes
Isabelle BouchardNRCan/CETC-Varennes
Lucie BourgoinNRCan/CETC-Varennes
Kevin BourqueNRCan/CETC-Varennes
Ron BraatenNRCan/CETC-Ottawa
Rob BrandonNRCan/CETC-Ottawa
Abeeku Brew-HammondGlobal Village Energy Partnership (GVEP)
Pascale BrièreAcres International
Carl BrothersAtlantic Wind Test Site
Ève-Line BrouillardGPCo
Alexander BrownNRCan/CETC-Varennes
Donald E. Brown, IIScience Applications International Corporation (SAIC)
Douglas CaneCaneta Research
Martin CarignanBezeau Carignan
Stephen CarpenterEnermodal Engineering
André ChalifourNRCan/CETC-Varennes
Jasmin ChampagneNRCan/CETC-Varennes
INTRO.79
APPENDIX A - RETScreen Development Team & Experts
Bill ChandlerScience Applications International Corporation (SAIC)
Dominique ChartierUmen Innovation
Simon ChartrandNRCan/CETC-Varennes
Salim ChemanedjiGPCo
William ChenCanadian Solar Inc. (CSI)
Koshy Cherail Consultant
John ChinFVB Energy
Mo ChungYeungnam University
Lyn CiavagliaNRCan/CETC-Ottawa
Roland ClarkeCaribbean Renewable Energy Development Programme (CREDP)
Harry CleghornCleghorn & Associates
Jean-Philippe CossetteNRCan/CETC-Varennes
Rada CraciunAzitrad RSL
Stephen DanielsEnermodal Engineering
Barbara DederkoConsultant
Bengt DegermanÖsterlens Kraft AB
Jaime Agredano DiazInstituto de Investigaciones Electricas (IIE)
Lisa Dignard-BaileyNRCan/CETC-Varennes
Roberta C. DiPasqualeScience Applications International Corporation (SAIC)
Stephen DixonTdS Dixon
Anton DriesseQueen’s University
Éric DubucNRCan/CETC-Varennes
Christian DugasProjet Bleu
Richard EckmanNASA Langley Research Center
Jason EdworthyVision Quest Windelectric
Joergen FenhannUNEP-Risoe
André FilionNRCan/CETC-Varennes
Guido FlorIntermic
Kirsi-Maaria ForssellMotiva
Lionel FretzEcoSecurities
Ryoko FukuharaUNEP-GEF Networks
Benjamin GarantCyberCat
Shirish GarudThe Energy and Resources Institute (TERI)
Olivier GaumondUmen Innovation
Renka GesingCleghorn & Associates
Neila GhribiNRCan/CETC-Varennes
Dionysios GiannakopoulosNational Technical University of Athens
Helene GichenjeNRCan/CETC-Varennes
Daniel GiguèreNRCan/CETC-Varennes
James GordonConsultant
Anil GoyalIndia Desein Private Limited
Stephen GrahamSGA Energy
Vasile GrasinSC ECO-ERG Technologie Service S.R.L
Sandra GreinerWorld Bank Prototype Carbon Fund (PCF)
François GrenierÉdumicro
Vanessa GrimmWuppertal Institute
Martin HamelGPCo
Tom HamlinUNEP/SWERA
Introduction to Clean Energy Project Analysis Chapter
INTRO.80
Abdelaziz HammacheNRCan/CETC-Varennes
Skip HaydenNRCan/CETC-Ottawa
Gajanana HegdeIT Power India
Johannes HeisterWorld Bank Prototype Carbon Fund (PCF)
Gabriel HernandezOrganización Latinoamericana de Energía (OLADE)
Steve HigginsSGA Energy
William HindsBarbados Ministry of Energy and Public Utilities (MEPU)
Hans HofEurope’s Energy Point
John HollickConserval Engineering
Pierre HosatteTN Conseil
Sophie HosatteNRCan/CETC-Varennes
Robin HuguesTREC North
Seppo Kalevi HulkkonenMotiva
Fenny HumNRCan/CETC-Varennes
Frederick IsaacEnergy & Advanced Control Technologies
Gilles JeanNRCan/CETC-Varennes
Annie JenkinsNRCan/CETC-Varennes
Emmanuelli KakarasNational Technical University of Athens
Tara Chandra KandpalIndian Institute of Technology (IIT-Delhi)
Socrates N. KaplanisTechnological Educational Institute of Patras
Celia KirlewNRCan/REED
Harley E. KelseyConsultant
Steve KempEnermodal Engineering
Björn KjellströmLuleå University of Technical
John KokkoEnermodal Engineering
Kerstin Kramer Premier Focus Inc.
Amit KumarThe Energy and Resources Institute (TERI)
Hertsel LabibNRCan/AMD
Maxime LagacéNRCan/CETC-Varennes
Nathalie LagdenProjet Bleu
Pierre LangloisEconoler International
Steve LappSGA Energy
Ingvar LarssonFVB AB
Catherine LavigneUmen Innovation
Marius LavoieNRCan/CETC-Varennes
Franck LecocqWorld Bank Prototype Carbon Fund (PCF)
E. J. LeeKorea Institute of Energy Research (KIER)
Norbert LegrosÉdumicro
Gregory J. LengNRCan/CETC-Varennes
Nadya LevtchenkoConsultant
Vladimir LikhachevRussian Academy of Sciences
Szymon LiszkaPolish Foundation for Energy Effi ciency (FEWE)
Baiqi LiuGroupe Sinordev International
Malcolm LodgeAtlantic Orient Corporation (AOC)
Carolyn LuceSolea
Benedict T. LumbyIT Power India
Per Lundsager UNEP-Risoe
Bouabdellah MahmoudNRCan/CETC-Varennes
APPENDIX A - RETScreen Development Team & Experts
INTRO.81
Jacques MailhotSNC-Lavalin
Nana-Osei MainooKumasi Institute of Technology and Environment (KITE)
Robin MajumdarNRCan/CETC-Varennes
Vladimir MalafeevRussian Academy of Sciences
Loreti MarcoConsultant
Robert M. MarshallArctic Energy Alliance
Sylvain MartelNRCan/CETC-Varennes
Eduardo Antunez de Mayolo RamisConsultant
Bruce McCallumEnsight Consulting
Bernard McNelisIT Power
Nathalie MelocheNRCan/CETC-Varennes
Svend Erik Mikkelsen COWI A/S
Swapan Das Modak Consultant
Alexandre MonarqueNRCan/CETC-Varennes
Rick MosherConestoga Rovers Associates
Paritosh NandiJadavpur University
Joop NeindersIngenieursbureau ter Horst
Vladimir NikiforovConserval Engineering
Lucie NolinNRCan/CETC-Varennes
Stéphanie NourEconoler International
Matti NuutilaFinnish District Heating Association (FDHA)
Peter OstrowskiUniversity of Northern British Columbia (UNBC)
Guy PainchaudGPCo
Michel ParentTechnosim Consulting Group
S.H. ParkKorea Institute of Energy Research (KIER)
Jean-Michel ParouffeGPCo
Slawomir PasierbKogen Polska Polski Klub Kogeneracji
Binu ParthanRenewable Energy and Energy Effi ciency Partnership (REEEP)
Marcelle PayeurNRCan/CETC-Varennes
Lotte Lykke PedersenCOWI A/S
Paulo da Silva Filho PedroConsultant
Francis PelletierGPCo
Samuel PelletierCyberCat
Michael PeltonEnermodal Engineering
Geneviève PerronUmen Innovation
Julien PoirierNRCan/CETC-Varennes
Florin PopEnergoBit
Stephen PopeNRCan/CETC-Ottawa
Alexander PotterConsultant
Frédéric PouyotGPEKS Constructions
Chuck PriceDirk and Price Engineering
Mark RadkaUNEP/DTIE
Dineka RayasamNRCan/CETC-Varennes
Beeram Rami ReddiConsultant
Amélie RichardNRCan/CETC-Varennes
Sonia RinguetteNRCan/CETC-Varennes
Frank RittnerUNEP-GEF Networks
Michael RossGPCo
Introduction to Clean Energy Project Analysis Chapter
INTRO.82
Nicolas RossCyberCat
Jimmy RoyerNRCan/REED
Matthew SalkedTaylor Munro Energy Systems
Mario SamsonNRCan/CETC-Varennes
Stéphanie SanchezNRCan/CETC-Varennes
Dominique SanschagrinUmen Innovation
Massimiliano Santini Baxterenergy Engineering
Flavio SantosTurbec
John P. ScottNRCan/CETC-Varennes
Pippa SellersSGA Energy
Mabrouk SghaierSociété Tunisienne de Gérance de L’Énergie (STGE)
Farah SheriffNRCan/CETC-Varennes
Reynaldo Sigiliao da CostaConsultant
Philippe SimardNRCan/CETC-Varennes
Ioana SiposEnergobit
Bard SkagestadFVB Energy
Doug SmithEntropic Energy
Paul StackhouseNASA Langley Research Center
John StephensonFVB Energy
Benoît St-GermainNRCan/CETC-Varennes
Ian B. StoreyI.B. Storey Professional Energy Solutions
Roberto SunyeNRCan/CETC-Varennes
Jean-Michel SurprenantNRCan/CETC-Varennes
Gunnar SvahnTac Strategy
Brian SykesEnvironment Canada
Jessica TanNRCan/CETC-Varennes
Didier ThevenardLevelton Consultants
Joe ThwaitesTaylor Munro Energy Systems
Natalia TischenkoConsultant
Fukuda ToruResearch Institute for Systems Technology
Michel TremblaySNC-Lavalin
William TrowerConsultant
Sébastien TrudelGPCo
Haruki TsuchiyaResearch Institute for Systems Technology
Dave TurcotteNRCan/CETC-Varennes
Eric UsherUNEP/DTIE
Normand VallièresTN Conseil
Marine Van HoofConsultant
Jari VayrynenWorld Bank Prototype Carbon Fund (PCF)
Martin VézinaProjet Bleu
Chris WeyellSigma Engineering
Charles H. WhitlockScience Applications International Corporation (SAIC)
Eric M. WilsonConsultant
Matthias WissnerWuppertal Institute
Ronald G. WroblewskiProductive Energy Solutions
Hakim ZaharEconoler International
Khaled ZaharConsultant
Urban ZieglerNRCan/CETC-Varennes
APPENDIX A - RETScreen Development Team & Experts
INTRO.83
ACKNOWLEDGEMENTS
A great number of other people have provided information and/or guidance during the development of RETScreen International. We apologise in advance to anyone who may have helped with the development with this tool, but is inadvertently not acknowledged here. The authors would also like to thank the numerous individuals from government, industry, academia and non-government organisations (NGOs) for their assistance.
As part of the various alpha and beta tests conducted since 1997, numerous other organisations provided comments and suggestions for improvements to the RETScreen International. Their efforts are gratefully acknowledged.