Page 1
EN EN
EUROPEAN COMMISSION
Brussels, XXX
[…](2013) XXX draft
COMMISSION STAFF WORKING DOCUMENT
IMPACT ASSESSMENT
Accompanying the documents
Commission Regulation implementing Directive 2009/125/EC of the European
Parliament and of the Council with regard to ecodesign requirements for vacuum
cleaners
Commission Delegated Regulation supplementing Directive 2010/30/EU of the European
Parliament and of the Council with regard to energy labelling of vacuum cleaners
Page 2
EN 2 EN
TABLE OF CONTENTS
1. Procedural issues and consultation ............................................................................... 4
1.1 Organisation and Timing .............................................................................................. 4
1.2 Impact Assessment Board ............................................................................................ 5
1.3 Transparency of the consultation process .................................................................... 5
1.4 Preliminary results of stakeholder consultation ........................................................... 6
2. Policy context, problem definition, and subsidiarity ................................................... 7
2.1 Policy context ............................................................................................................... 7
2.1.1 Sales volume and market structure .............................................................................. 7
2.1.2 Environmental impact .................................................................................................. 9
2.1.3 Saving potential .......................................................................................................... 11
2.2 Problem definition ...................................................................................................... 12
2.3 Baseline scenario for the electricity consumption ..................................................... 16
3. Objectives ................................................................................................................... 22
4. Policy Options ............................................................................................................ 23
4.1 Option 1: No EU action .............................................................................................. 23
4.2 Option 2: Self-regulation ............................................................................................ 23
4.3 Option 3: Energy labelling targeting vacuum cleaners .............................................. 24
4.4 Option 4: Ecodesign implementing regulation on vacuum cleaners (MEPS) ............ 24
4.5 Option 5: Labelling and Ecodesign MEPS combined ................................................ 24
4.5.1 Definition of the types of energy-using products covered ......................................... 25
4.5.2 Implementation of ecodesign requirements ............................................................... 25
4.5.3 Implementation of energy labelling ........................................................................... 29
4.5.4 Date for evaluation and possible revision .................................................................. 29
4.5.5 Interrelation with other ecodesign implementing measures — implications on scope
.................................................................................................................................... 29
4.5.6 Options related to production phase ........................................................................... 29
5. Impact Analysis .......................................................................................................... 30
5.1 Introduction ................................................................................................................ 30
5.2 Impacts ....................................................................................................................... 30
5.2.1 Electricity ................................................................................................................... 30
5.2.2. Emissions: Carbon ..................................................................................................... 31
5.2.3 Consumer impact ....................................................................................................... 31
5.2.4 Business economics ................................................................................................... 32
5.2.5 Competitiveness proofing (CP) .................................................................................. 33
Page 3
EN 3 EN
5.2.6 Effect on SME (manufacturing) ................................................................................. 34
5.2.7 Effect on distribution channels ................................................................................... 34
5.2.8 Effects in third countries ............................................................................................ 34
5.2.9 Social impacts: Employment ...................................................................................... 35
5.2.10 Territorial impact ........................................................................................................... 35
5.2.11 Administrative costs for Member States .................................................................... 35
5.2.12 Specific impact of production phase: durability requirements .................................. 36
5.3 Summary economic, social and environmental impacts ............................................ 36
5.4 Sensitivity analysis sub-option scenarios ................................................................... 37
6. Conclusions ................................................................................................................ 38
7. Monitoring and Evaluation ........................................................................................ 40
ANNEX A ................................................................................................................................ 41
Minutes of Consultation Forum meeting 2010 ........................................................................ 41
ANNEX B ................................................................................................................................ 45
Minutes of Consultation Forum meeting 2011 ........................................................................ 45
ANNEX C ................................................................................................................................ 49
Final stakeholder meeting preparatory study, Jan. 2009 .......................................................... 49
ANNEX D ................................................................................................................................ 52
Stock model methodology & detailed results .......................................................................... 52
Page 4
EN 4 EN
1. PROCEDURAL ISSUES AND CONSULTATION
1.1 Organisation and Timing
The products discussed in the underlying impact assessment (IA) report are electric dry
vacuum cleaners (VCs) in the domestic and commercial sector. Wet, wet & dry, industrial,
central, robot, wet filter and large battery vacuum cleaners are not included (see also par.
4.5.1). Within the measures it is not proposed to differentiate between different types of
vacuum cleaner which perform the same function. The measure will thus cover cylinder,
upright and stick appliances as well as those with or without bags.
Implementing measures on ecodesign of vacuum cleaners (VCs) is one of the priorities of the
Action Plan on Energy Efficiency1, and is part of the 2008 Catalogue of actions adopted by
the Commission (EC) for the year 2008.2 Legal basis of the Ecodesign Directive is Art. 114
TFEU (internal market)3 and the Energy Labelling Directive is based on Art. 194 TFEU on
energy policy, aiming amongst others at ensuring security of energy supply in the Union and
promoting energy efficiency and energy saving.
Ecodesign and energy labelling requirements for products constitute an important instrument
for meeting the policy objectives under the ‘Resource-efficient Europe - Flagship Initiative’4,
the ‘Energy 2020’5 strategy paper and the Commission’s ‘Energy Efficiency Plan 2011’
6. The
Ecodesign directive references the objectives of the EAP67 and ECCP
8.
At an operational level the ’20-20-20’ target is relevant, which aims amongst others at a 20%
reduction of energy consumption and carbon emissions in 2020 with respect of the reference
year 1990.9
In contrast to many other domestic appliances, vacuum cleaners have not been subject to
mandatory energy labelling or other mandatory measures in the EU addressing their
environmental impact before.
The proposed implementing measure is based on the Directive 2009/125/EC of the European
Parliament and of the Council establishing a framework for the Commission, assisted by a
regulatory committee to set ecodesign requirements for energy-related products10
in
combination with energy labelling under Directive 2010/30/EU. An energy-related product, or
a group of energy-related products, shall be covered by ecodesign implementing measures, or
by self-regulation (cf. criteria in Article 17), if the products represent significant sales
volumes, while having a significant environmental impact and significant improvement
1 COM(2006)545 final.
2 COM(2008)11 final.
3 Treaty on the European Communities (TEC) was replaced by the Treaty on the functioning of the
European Union (TFEU) which entered into force on 1st of December 2009, following the Treaty of
Lisbon 13 Dec. 2007. The content of article 95 TEC was moved to article 114 TFEU. 4 A resource-efficient Europe – Flagship initiative under the Europe 2020 strategy, EC, 26.1.2011, COM
(2011)21. 5 Energy 2020, A strategy for competitive, sustainable and secure energy, EC, 10.11.2010, COM(2010)
639 final 6 Energy Efficiency Plan 2011, EC, 8.3.2011, COM (2011) 109 final.
7 Decision No 1600/2002/EC of the European Parliament and of the Council of 22 July laying down the
Sixth Community Environment Action Programme OJ L242/1 10.9.2002. 8 European Climate Change Programme. http://ec.europa.eu/clima/policies/eccp/index_en.htm
9 Formulated in ‘Energy Policy for Europe’, Presidency conclusions, European Council, March 2007
10 Directive 2009/125/EC of the European Parliament and of the Council of 6 July 2005 establishing a
framework for the setting of ecodesign requirements for energy-related products (recast) , OJ L 285,
31.10.2009
Page 5
EN 5 EN
potential (Article 15). The structure and content of an ecodesign implementing measure shall
follow the provisions of the Ecodesign Directive (Annex VII).
Article 16 provides the legal basis for the Commission to adopt implementing measures on
this product category.
Consultation of stakeholders is based on the Ecodesign Consultation Forum as foreseen in
Article 18 of the Directive (see next section for details), including the consultation of
stakeholders during a preparatory technical study from 2006 until February 2009 in order to
assist the Commission in analysing the likely impacts of the planned measures.
Article 19 of the Directive 2009/125/EC foresees a regulatory procedure with scrutiny for the
adoption of implementing measures. Subject to qualified majority support in the regulatory
committee and after scrutiny of the European Parliament, the adoption of the measures by the
Commission is planned by mid- 2013.
1.2 Impact Assessment Board
The Commission’s Impact Assessment Board (IAB) gave its favourable opinion in the
meeting of March 2012 under the condition that the report should be improved in a number of
respects. In response, the underlying report has revisited the following aspects:
Subsection 2.1 of the IA report (heading to 'sales volume and market structure') now includes
a fuller description of the market structure and a clear indication of the categories in scope
was added in chapter 1 of the IA report and in the summary.
A table with key figures was added to the main text of the IA report in Chapter 2. The
methodology, inputs and assumptions for the projections were better explained in the main
body text and in the Annex. A fuller description in chapter 2 was included, explaining how
the market structure discussed in 1 above has led to distortions.
In chapter 4 on policy options an explanation was included of the absence of international
comparisons, and in sections 4.2 and 4.3 a fuller explanation as to why options 2 and 3 have
been discarded.
In chapter 5, include a fuller explanation was added as to why the measures are on balance
likely to a) increase market competitiveness, even though they will lead to the elimination of a
high proportion of existing models from the market, b) benefits SMEs, distribution channels
and consumers and c) lead to better more efficient vacuum cleaners worldwide.
The text was improved to better take account (updated) IA guidelines, and to improve
readability for the lay reader. Tables and graphs were moved from the Annex D to the main
body text to improve understanding.
1.3 Transparency of the consultation process
Starting in 2007, the EC commissioned a study of vacuum cleaners, called ‘Lot 17, Vacuum
Cleaners, Preparatory Studies for Eco-design Requirements of EuP.’ (in the following called
‘preparatory study’), carried out by external consultants11
on behalf of the Commission’s
Directorate General for Energy and Transport (DG TREN, now DG ENER). The purpose of
the Lot 17 study was to perform a technical, environmental and economic analysis for vacuum
cleaners in order to improve their environmental performance, within the framework of
Directive 2005/32/EC.
11
The work was carried out by AEA Energy & Environment, Intertek, and Consumer Research
Associates between November 2007 and January 2009.The study has followed the European
Commission’s MEEuP methodology . The study website is off-line, but the study is available on Circa
Page 6
EN 6 EN
The preparatory study was developed in an open process, taking into account input from
relevant stakeholders including manufacturers and their associations, environmental NGOs,
consumer organisations, and EU Member State experts. The preparatory studies provided a
dedicated website12
where interim results and further relevant materials were published
regularly for timely stakeholder consultation and input. The study website was promoted on
the ecodesign-specific websites of DG ENER and DG ENTR. Open consultation meetings for
directly affected stakeholders were organised at the Commission’s premises in Brussels. The
final stakeholder meeting took place 19 January 2009 in Brussels to discuss and validate the
preliminary results of the studies. Minutes of the final stakeholder meeting are attached in
Annex C.
Further to Article 18 of the 2009/125/EC Directive, formal consultation of stakeholders was
carried out through the Ecodesign Consultation Forum consisting of a ‘balanced participation
of Member States’ representatives and all interested parties concerned with the product group
in question’.
The meetings of the Ecodesign Consultation Forum took place on 25th of June 2010 and 8th
September 2011. Building on the results of the study, the Commission services presented a
Working Document suggesting ecodesign requirements based on scenario developed under
the preparatory study.13
The working documents were sent out three weeks before the meeting
to the members of the Consultation Forum, and to the secretariats of the ENVI (Environment,
Public Health and Food Safety) and ITRE (Industry, Research and Energy) Committees of the
European Parliament for information. The working documents were published on DG
ENER’s ecodesign website, and they were included in the Commission’s CIRCA system
alongside the stakeholder comments received in writing before and after the Consultation
Forum meeting. Minutes of the Consultation Forum meetings can be found in Annexes A and
B.
1.4 Preliminary results of stakeholder consultation
The general approach to set mandatory minimum requirements in the framework of ecodesign
was largely supported by Industry14
associations. However, the main discussion was on the
definition of the scope and on the rating methodology. As regards the scope, the industry was
in favour of tackling only dry vacuum cleaning systems and predominantly domestic systems
and commercial products of that typology. For wet systems, robot vacuum cleaners, industrial
products, central vacuum cleaner systems, etc. there are no suitable measurement methods.
Most manufacturers initially also appeared to be sceptic towards the suggestion of the
preparatory study to use the Ecodesign Directive to set an absolute power cap and were in
favour of limits based on an 'efficiency rating', i.e. power consumption required to reach a
specific cleaning performance. After a number of bilateral meetings, however, they proposed
the addition of caps on absolute power consumption in combination with a minimum cleaning
performance. After the second consultation forum, they proposed a compromise 'metric' for
estimating energy consumption, that is influenced by cleaning performance but far less than
their previous formula. For energy labelling, there was agreement on a labelling scheme that
is coherent with that of washing machines and dishwashers, i.e. separate labelling schemes for
specific energy and cleaning performance.
12
now off line 13
Available on DG ENER’s ecodesign website:
http://ec.europa.eu/energy/efficiency/ecodesign/eco_design_en.htm 14
See e.g. position papers of CECED, available on their respective websites.
Page 7
EN 7 EN
Environmental NGOs and consumer’s associations were also in support of the proposed
measure, not just for energy but also for noise, filtration performance and possibly also on
other environmental aspects such as banning brominated and chlorinated flame retardants.
Regarding energy, the ECOS position papers of 22 June 2010 and 5th
September 2011
supported a power cap of 1000 W by 2013 (then 750 W by 2015) in combination with a
minimum cleaning performance and an energy label that would mainly be based on power
consumption, but possibly with some small influence from cleaning performance. ECOS
supports not mentioning the power on the label. As regards the scope, ECOS would like to
incorporate small hand-helds (because of standby power), robot cleaners and an energy label
that should also apply to commercial vacuum cleaners.
Member State representatives at both Consultation Forums the necessity of both measures,
ecodesign minimum requirements and labelling, was not under discussion. Instead they
discussed the various aspects of implementation. On the subject of noise, most countries were
in favour a lenient noise limit of variously (80, 77 or 76 dBA), while the label should mention
a dBA figure rather than include an A-G scale) . Austria was in favour of strict noise limits.
Denmark was concerned over the correlation between noise and energy. Very strict
requirements on filtration efficiency would mean it was redundant to give this information on
the label. Cleaning performance was seen as necessary item for the label, but the discussion
focussed on having 2 scales –hard floor and carpet cleaning—or 1 combined/weighted
performance scale. The initial discussions on regulating/labelling the energy consumption was
inconclusive, with some Member States in favour of power caps and others in favour of
efficiency caps. However, it was agreed that a compromise method of estimating energy
consumption, with some influence of cleaning performance on cleaning time (and so energy
consumption) but less than had been suggested by the industry would be closer to reflecting
reality.
2. POLICY CONTEXT, PROBLEM DEFINITION, AND SUBSIDIARITY
2.1 Policy context
Article 15(2) of the Ecodesign Directive formulates the main criteria that make a product
group eligible for Ecodesign measures, i.e. significant sales volume, a significant
environmental impact and a significant improvement potential without excessive costs. The
latter is to take into account the absence of other relevant Community legislation or failure of
market forces to address the issue properly and a wide disparity of environmental
performance for functionally comparable products.
The following sections will subsequently address the three main eligibility criteria. Note that,
as vacuum cleaners have not been subject to mandatory EU energy labelling in the past, data
availability is poor. Also, vacuum cleaners have not yet been studies or regulated in third
countries, apart from South-Korea from which no further data is available.
2.1.1 Sales volume and market structure
Sales domestic VCs
The preparatory study reports sales of around 45 million domestic vacuum cleaners per year
in 200615
. Thus domestic vacuum cleaners most certainly meet the minimum sales criterion of
Article 15.16
The preparatory study states that less than one-third, around 14 million units,
15
Source: AEA, Preparatory study vacuum cleaners, 2009. Relating to sales of vacuum cleaner types in the scope of the study
16 Art. 15 Ecodesign directive: minimum sales of over 200.000 pieces/a.
Page 8
EN 8 EN
were produced in the EU-27 in 2006. Approximately 31 million units were imported from
mainly China (30 million).
The Eurostat (ProdCom) data suggest that the EU production represents a turnover in
manufacturer selling prices (msp) of around € 1,25 billion, i.e. a unit msp of € 90,-. At the
usual retail margin and VAT (msp x 2,5) this results in an average consumer price of around €
225,-/unit and a total consumer investment of over € 3 billion per year.
Production and trade of domestic VCs
The preparatory study reports that major EU producers are Germany (5,3 million unit sales in
2006), Italy (2,5 million) and the UK (1,8 million). Over the period 2000-2005 the EU27-
imports of domestic vacuum cleaners have almost doubled to approximately 54,5 million
units, whereas exports have remained stable at around 18-20 million units. Over the same
period, EU-27 production has almost halved and the declining trend is expected to continue
with manufacturers moving their production to Asia.
Market trends domestic VCs
Sales of domestic vacuum cleaners are increasing due to a combination of declining product
life and increasing market penetration with more and more households owning 2 or more
units. Over the period 2000-2005 the average annual units sales growth rate has been around
9%.17
Around 40 million out of 45 million unit sales are replacements. At an average product
life of 8 years this means a stock of over 320 million units.18
For 2010, at 200 million EU27-
households, this results in 1,6 vacuum cleaner per household.
As with most domestic appliances, vacuum cleaners continued this trend up to and including
2007, followed by a few years of heavy decline in sales, making the expected turnover for
2010 roughly the same as for 2005, i.e. 45 million annual unit sales. From then on, based on
the ECFIN rebounce scenarios, the sales growth may pick up its old pace of ca. 9% per year
to arrive at a total market of 100 million units in 2020.
Growth in the number of EU27-households over the 2010-2020 period is projected to be 1%
per year, so 8% out of the 9% sales growth is due to either a shorter product life or an
increased market penetration; the preparatory study does not have any specific indication.
Assuming that two thirds (5%) is due to a shorter product service life and the product life of
the stock in 2010 is still 8 years, the life expectancy of the average vacuum cleaner in a
household will drop to 5 years in 2020. If the other 3% growth is caused by an increased
market penetration then this would rise from 1,6 in 2010 to approximately 2 vacuum cleaners
per household in 2020.19
Note that this is a technically plausible assumption for the benefit of
making scenario calculations; no statistical time series on VC product service life nor
projections of VC market penetration are available.
Correlation between sales and energy impact
More sales and higher market penetration does not mean in itself that there is a higher
electricity consumption during use. The total number of operating hours per household of
vacuum cleaners is the relevant parameter. Having a vacuum cleaner on every floor of the
17
Apparent consumption derived from Eurostat Prodcom and trade data, as published in the preparatory
study. 18
The preparatory study stock model mentions a stock, excluding handheld battery units, of 332 million
units but tends to overestimate the stock of commercial vacuum cleaners. 19
Given that 44% of households live in apartments, i.e. where usually 1 vacuum cleaner will be enough,
this implies that the other households that live in individual houses would own and use around 3
vacuum cleaners (e.g. 1 for each floor, plus 1 in the garage). This is already at the limits of probability,
but still perceivable.
Page 9
EN 9 EN
house may be a sign of increased wealth, but the preparatory study found no indication that
cleaning the house is becoming a more desirable activity. Therefore, in the energy scenario’s
the increased market penetration will play only a limited role, i.e. as the ownership goes up,
the average operating hours per unit will go down (at least) at the same rate. In policy
scenarios the shorter product life plays an ambiguous role: on the one hand it will promote the
stock replacement of old inefficient vacuum cleaners by new, regulated types. On the other
hand, the energy and environmental impact of production, distribution and end-of-life vacuum
cleaners will become relatively more significant as compared to the use phase.
Market for non-domestic VCs
For non-domestic vacuum cleaners, there is even less hard data available than on domestic
products. Non-domestic vacuum cleaners are estimated by the preparatory study to account
for around 1,3 million unit sales, with the ‘tub’ type being the most popular (75% share).
Statistical price information is not available, but at prices that are easily 3-4 times higher than
those for domestic vacuum cleaners, the industry turnover may well be over € 0,4 billion in
2010. Furthermore, also as regards energy impact non-domestic vacuum cleaners may well be
significant as they have much more operating hours in their useful product-life. For instance,
at 3 hours per day over a useful life of 4 years, every unit will have 10 times more operating
hours over its product life and around 15 times more operating hours per year.20
Assuming
that these 1,3 million sales are used to keep ‘alive’ a stock of around 5 million non-domestic
vacuum cleaners then –at the same power consumption—these 5 million will count as much
as 75 domestic vacuum cleaners in terms of energy impact. This is around 25% of the
domestic energy impact.
2.1.2 Environmental impact
Electricity in the use phase
The preparatory study predicts an average rated power consumption of 1500 W per domestic
vacuum cleaner owned and a time expenditure of 1 hour per week (say 50h per year) for
vacuuming per household. At 200 million EU27-households in 2010, this means an average
electricity consumption during use phase of 75 kWh/hh/a (divided over 1,6 vacuum cleaners
per household) and a total EU27-consumption of 15 000 million kWh (15 TWh) per year. To
this, around 25% for non-domestic vacuum cleaners have to be added, which brings the total
to 19 TWh. At 0,43 Mt CO2 equivalent per TWh electricity this equals approx. 8 Mt CO2
equivalent in 2010. In primary energy 19 TWh electricity, at a primary energy power
conversion factor of 2,5, is equivalent to 170 PJ (peta Joules) of fossil fuel enthalpy (Hs,
Gross Calorific Value).21
As mentioned, for the trend in electricity consumption during the use phase of the product, the
number of vacuum cleaners per household is not relevant. What is relevant is the increase in
number of households (around 1-1,5%/a), the increase in average dwelling size (also around
1-2%/a) and the power consumption of the vacuum cleaner (approx. 2,5%/a). Trends in
flooring, e.g. more or less labour-intensive carpets, may play a role, but the preparatory study
givens no indications in this respect. Also changes in habits and hygienic standards have an
influence, but again there are no indications of particular changes in this respect. Taking into
account only household numbers, dwelling sizes and specific vacuum cleaner power
consumption, the electricity consumption of vacuum cleaners –without measures-- should be
20
This assumes around 4000 hrs life, brushless motor or possibly 2 carbon brush exchanges for motors
with carbon brushes (change after a brush life of around 1500 h). 21
1 TWh= 2,5 (primary energy) x 3,6 (conversion TWh to PJ) PJ
Page 10
EN 10 EN
just over 70% higher in 2020 with respect of 2010. For a ‘BAU’ scenario this means an EU-
27 electricity consumption of around 32 TWh in 2020 (ca. 12,8 Mt CO2 eq.).
For comparison: 32 TWh/year is close to the current electricity consumption of
Denmark. The greenhouse gas emissions of 12,8 Mt CO2 eq. are more than the
current greenhouse gas of e.g. washing machines and dishwashers put together.
Based on this environmental aspect alone, the environmental impact is significant
enough to be elected for policy measures.
Production energy
At an average product weight of 7,2 kg and 40 million unit sales to keep the stock level, there
is a net materials consumption of 288 000 tonnes per year. Given the overall Gross Energy
Requirement of 130 MJ/kg22
, the total energy required in the EU-27 for production,
distribution and end-of-life of vacuum cleaners amounts to around 37 PJ per year. It is still
only 22% of the total energy impact but it is –as one of the few products that have been
studied in the context of Ecodesign thus far—not insignificant, especially if the sales growth
continues up to 100 million units per year.
Waste
The waste output from discarded vacuum cleaners lags some 10 years (product life+ time ‘on
stock’ in the house) behind the developments in sales and relates to a smaller stock. The
preparatory study estimates that 100 000 tonnes of discarded vacuum cleaners are collected
through the official channels. An estimate of the amount discarded ‘illegally’, through the
normal garbage or dumped, was not given.
Other waste includes disposable bags and filters, on average 5 bags and one filter per
domestic vacuum cleaner per year23
, resulting in approximately 75 000 tonnes of waste.
Waste from repairs (20% of products being repaired in the first 6 years of life) may include
new hoses, carbon brushes, fans, etc., but the amount of waste from repairs is generally
negligible.24
Noise
Noise is another environmental impact, but there is definitely a negative relationship with
energy efficiency and most stakeholders are reluctant to set stringent limits for an appliance
that will be used only indoors and at one hour a week.
Dust re-emission
Re-emission of small particulate dust (0.3-10 µ) from the vacuum cleaner is an important
health factor for an increasing part of the population suffering from respiratory disease and
allergies. It is also clear that reducing the level of small particulates in indoor air will provide
a substantial benefit to the general population. The exact relationship between its effective
removal from the floor and other surfaces, and their subsequent level in indoor air is not clear.
On the other hand there is general consensus from stakeholders (in particular manufacturers)
22
The preparatory study finds GER-figures between 128 and 140 MJ/kg for the 4 different types. 23
Preparatory study mentions an annual cost of 12 Euro per average vacuum cleaner, based on 5 bags and
one filter. This equals, including packaging a consumption of 5 x 50 g= 250 g paper/cardboard per year
plus a negligible part for a filter. At a stock of 320 million units this results in waste of 75 million kg.
The market share of ‘bagged’ vacuum cleaners (vs. ‘bagless’) is estimated at 85%. 24
The preparatory study mentions a cost of 50 Euro per repair, which comes down to 10 Euro per average
vacuum cleaner
Page 11
EN 11 EN
that a maximum level of 1% re-emission is possible without significant increases in product
prices or energy consumption. There is also a case for declaring the level of dust re-emission,
to enable those with relevant health concerns to pick vacuum cleaners that will meet their
needs.
2.1.3 Saving potential
There is a wide disparity in vacuum cleaners as regards electricity use and there is no specific
EU legislation tackling their energy and environmental impact.
As mentioned, the preparatory study identified an annual increase in power consumption of
2,5% per year. While the overall average may be 1500 W, the German national average is as
high as 2300-2400 W. Also in other countries like the Netherlands the share of machines
above 1800 W has grown to well over 40% and the baseline projection is that the average
vacuum cleaner in the EU-27 will be substantially more than 2000 W in 2020.
At the same time, and at (at least) a comparable cleaning performance, there are several
machines in the range of 650 to 900 W25
that prove that a power cap of 1000 W or – in a few
years – 750 W as proposed by the preparatory study seems feasible at first glance.
Nevertheless, these are all upright (‘vertical’) vacuum cleaners, which are particularly popular
in the UK. When looking at normal canister types – the ones with a hose – the lowest rated
power consumption on the market is 1100-1200 W. Thus a 1000 W cap would eliminate all
current models. For these types a higher initial power cap (1500-1600 W) would seem more
appropriate and would still eliminate the ‘worst’ 40-50% of today’s models. In a second stage,
more ambitious targets could be set (e.g. 1100 W, see scenario’s) and/or targets could be
achieved through mandatory energy labelling. Note that the power values mentioned relate to
an average nozzle width (25-30 cm); for a fair comparison ‘power caps’ should be capacity-
specific, e.g. in W per cm nozzle width or – the same thing but more transparent to the
consumer – Wh per m² floor area at a fixed number of double-strokes.
Energy savings of at least 30% (with respect of 2010) or 50% (with respect of
baseline 2020) seem realistic. The latter translates into a saving of 16 TWh electricity
and 6,4 Mt CO2 equivalent. Compared to savings for other domestic appliances
subject to eco-design measures this is more than significant and confirms eligibility
for measures.
The technical design options that would bring about these saving were identified in the
preparatory study as follows:
(1) Maximising fan efficiency: reduce energy losses in fan/motor/drive from current 60-
70% to 45% through improved fan case and impeller design;
(2) Improved efficiency airways: reduce energy loss of current 5-10% to the BAT level
of 5%;
(3) Reduced filtration energy losses: increasing the filtration area surface;
(4) Reduced leakage losses: by using better seals reduce the current 10-20% loss to 5%;
(5) Nozzle improvements: reduce current loss at the nozzle from current 15-25% to
10%;
25
Like the Vorwerk Kobold (900 W), Electrolux Envirovac (800 W), Dyson DC24 (650 W).
Page 12
EN 12 EN
(6) Combinations of options 1 to 5 above: taking into account all of the above in a well-
balanced design current overall vacuum cleaner energy efficiency can be improved
from the current 11-25% to as high as 40%.
(7) Reduced materials/ light-weighting: Reduce product weight by up to 50%, using best
materials options (e.g. foamed plastics)
(8) Increase product lifetime: Increase the product lifetime from 8 to 12 years by using
better and – probably – more materials. This option is counteracting the effects of
option 7.
In terms of product weight, there are vacuum cleaners that weigh 3,3 kg and those that will go
up to 15 kg, suggesting that at least a 20-30% weight (and production energy) saving is
possible.
When looking at the significant waste from bags and filters the obvious and hardly
spectacular answer would be an even greater move towards ‘bagless’ vacuum cleaners, of
which there are already many on the market with an increasing market share. But there is a
practical limit as allergy sufferers would not willingly buy ‘bagless’ types due to the ‘messy’
emptying procedure, which may lead to much of the small particulate dust captured by the
vacuum cleaner being re-emitted.. In other words, there is a likely negative health impact in
making ‘bagless’ vacuum cleaners mandatory overall.
Noise is still problematic. Certainly there are silent vacuum cleaners at reportedly 66 dBA
instead of the louder 80 dBA that one might expect from the average vacuum cleaner. But
still, the power consumption is around 2200 W. Combinations of noise at those levels and a
low power consumption can currently not be found. Note that, because of this negative
correlation between noise and energy, stakeholders are not in favour of overly stringent noise
requirements (see Annexes A to C).
Dust re-emission is another area where it is difficult to look at the possible improvement in
isolation. For sure, better filters (HEPA, etc.) will help tremendously for those suffering from
respiratory diseases, but for the average consumer it is questionable if a top filter performance
is really needed, whereas certainly it will increase the aerodynamic resistance and thus power
consumption. However, a maximum level of 1% re-emission, equivalent to a ‘filter
efficiency’ of 99%, appears unlikely to significantly increase power consumption.
2.1.4 Legal basis
The Ecodesign Directive and, more specifically, its Article 16 provides the legal basis for the
Commission to adopt an implementing measure that would tackle this problem. Note that the
Ecodesign Directive relates to Article 114 of the Treaty of the Functioning of the European
Union (‘single market’) and uses ‘CE marking’ of products brought on the market by
manufacturers as the legal tool. Subsidiarity in this context is not applicable, because the
problem is trans-national and actions by Member States alone would restrict free circulation
of goods. Furthermore at the scale of EU level any action would be far more effective than at
Member State level.
2.2 Problem definition
The main market and regulatory barriers hampering a larger market penetration of energy
efficient vacuum cleaners were identified in the preparatory study and are as follows:
1. Lack of consumer information
The ecodesign preparatory study made clear that there has been very little policy action either
in the EU or in third countries to reduce the energy consumption of vacuum cleaners. The
Page 13
EN 13 EN
ecodesign and IA studies both found that the only information normally provided for vacuum
cleaners was their power input. This has been marketed as a proxy for their performance.26
As
has been acknowledged by stakeholders for example in the Consultation Forum and in view
of the market structure described in section 2.1.1, this has led to high power input and low
efficiency. Some consumers use performance information from consumer organisations but
this does not place much emphasis on energy consumption and has not halted the trend in
increasing input power.
2. Externalities
As with other consumer goods, it is clear that even with good information available, many
customers will either not understand implications, or will not care. Some of the impact will be
on the users (energy cost, noise, dust re-emission in their own home, etc.), other impacts will
be externalities (impact of energy production, noise to neighbours etc.). One justification of
ecodesign requirements is to reduce the environmental impact of the vacuum cleaners people
buy both for themselves, and for others.
3. Lack of specific policy measures
Specific measures
Apart from a voluntary EU Ecolabel program for vacuum cleaners in the period 2003-
200827
and some similar national initiatives of a voluntary nature (France, Sweden28
) the
vacuum cleaner has so far escaped the attention of policy makers. Mandatory measures and
financial incentives have also never been introduced, neither inside nor outside the EU.
At a component level, imminent Ecodesign regulations on fans and motors will have no effect
on vacuum cleaners:
The Ecodesign Commission Regulation 327/2011 on Fans >125 W will have no impact on
vacuum cleaner energy efficiency, because fans that operate at a speed above 8 000 rpm are
exempt from the energy efficiency requirements (though not from information requirements).
Vacuum cleaner fans operate at 30 000 rpm or – with brushless motors – up to 100 000 rpm.
The Ecodesign Commission Regulation No. 640/2009 on Motors >750 W, published d.d.
23.7.2009, will have – at least on the short run – no positive impact on vacuum cleaner energy
efficiency, because it applies only to (brushless) squirrel cage motors. Motors with carbon
brushes are, according to the preparatory study, still by far the most common type of vacuum
cleaner motors and thus out of scope of the measure. Only the latest generation (more
efficient) brushless vacuum cleaner motors, i.e. permanent magnet motors with variable speed
drive, will be subject to Regulation No. 640/2009 and have to reach IE2 level on the 16tht of
July 2011 and (for motors <7,5 kW) meet either the IE3 level or be equipped with a variable
speed drive by 1 January 2017.
So far there has been no significant action by Member States to distort the internal market, but
in the absence of EU action, the problems described may lead Member States to act on their
own (as already has happened in the case of other products, such as circulators).
General legislation applicable to (certain types of) vacuum cleaners
26
Ecodesign preparatory study, section 2.3.8, table 8 27
Commission Decision 2003/121/EC of 11 February 2003 establishing the ecological criteria for the
award of the Community eco-label to vacuum cleaners, OJ L 047 , 21.02.2003 P. 0056 - 0060. Article
4: 'This Decision shall apply from 1 April 2003 until 31 March 2007. If on 31 March 2007 revised
criteria have not been adopted, this Decision shall apply until 31 March 2008.' The criteria were not
revised and hence the Eco-label for VCs no longer exists, presumably because of lack of sufficient
participants. 28
www.environdec.com
Page 14
EN 14 EN
At a more general level, the possible use of brominated or chlorinated flame-retardants is
tackled in the RoHS Directive (2002/95/EC), but from literature it is clear that these are not a
‘hot’ environmental issue.
The WEEE Directive (2002/96/EC) was set up to handle recovery/recycling of electronic and
electrical waste, amongst which vacuum cleaners. Given the recovery of some 100 000 tonnes
through the official channels, this seems fairly successful. But no particular design measures
were found – apart from the usual29
– that would be particularly helpful in recovering and
recycling of vacuum cleaners.
The packaging of vacuum cleaners has long been regulated through the Packaging directive
(92/62/EC) and after the switch to simple mono-material solutions (cardboard/paper inside
and outside) it can actually no longer be considered a priority environmental issue.
The Low Voltage Directive LVD (2006/95/EC) regulates electrical safety of domestic
vacuum cleaners, but in terms of environmentally related issues the most relevant are
references to harmonised standards on emissions of toxic materials under fault (on fire)
conditions. For non-domestic vacuum cleaners the safety is regulated under the Machinery
Directive (2006/42/EC) which came into force on 29 December 2009.
Other applicable legislation, all with very little bearing on the environmental impact, include
the directive on Electromagnetic Compatibility EMC (2004/108/EC), the Batteries Directive
(2006/66/EC) for vacuum cleaners with battery powered heads, the REACH Directive
(2004/121/EC) for vacuum cleaners using chemicals in wet (filter) systems, the ATEX
directive (94/9/EC) for non-domestic vacuum cleaners operating in potentially explosive
atmosphere, possibly the Construction Products Directive (89/106/EC) for central vacuum
systems and possibly specific directives on noise of appliances.30
4. Lack of appropriate measurement standards
Although consumer associations have been rating the cleaning performance of vacuum
cleaners in all sorts of possible ways over the past decades, a harmonised test standard for
domestic vacuum cleaners that would give consumers clear and unbiased quantitative
performance rating is still lacking.
The most relevant for this purpose is the IEC 60312-1 (Vacuum cleaners for household use–
dry vacuum cleaners – methods for measuring performance), which appears to be frequently
under revision. It describes tests for dust removal from hard floors (with or without crevices),
carpets, dust (re) emission, durability tests, maximum volume of dirt receptacle and – in the
4th
version currently underway – energy consumption measurement. For the noise tests, where
Sound Power (LwA) is measured expressed in decibels (dBA), of vacuum cleaners IEC 60704
applies. The EN 60335 (parts 1 and 2.2) is mainly a safety standard, but for the scope
definition it may be useful to know that this standard defines ‘nominal input power’: the
arithmetic average of maximum electric input power in W (at highest airflow) and the
minimum input power in W (at zero airflow). The standard allows a 10% tolerance in the
nameplate-declaration of both the ‘nominal’ and a ‘maximum’ value in Watts.
In Mandate 353, the Commission asked the European Committee for Electrotechnical
Standardization (CENELEC) to prepare methods to measure the energy consumption,
cleaning performance and dust re-emission of vacuum cleaners. A working group of their
relevant technical committee (TC 59X WG 6) is preparing the necessary amendment of IEC
29
E.g. design for disassembly, easy recovery of metals parts, avoid to use a mix of plastics that would
make the product more difficult to handle in shredder-based recycling, etc. . 30
The preparatory study mentions for outdoor leaf suction machines the Noise Emissions for Outdoor
Equipment Directive (2000/14/EC).
Page 15
EN 15 EN
60312. For the cleaning performance, the latest publication describes the measurement of the
dust removal in % after 5 double strokes on hard floors with crevices or carpets.
For carpets the double strokes are performed on a test area of 700±5 mm long and as wide as
the width of the cleaning head. Stroke speed is 0,5 ± 0,02 m/s and stroke length is (at least)
1200 mm with the cleaning head staring 200 mm before the test area and ending at least 300
mm past the test area. The amount of test dust is uniformly distributed at an amount of
125g/m² test area. Dust removal ability for carpets is calculated as the ratio between the dust
captured in the dust receptacle and the dust originally applied to the test area.
For hard floors the double strokes are performed on a hard floor test area with a diagonally
placed insert (‘the crevice’, e.g. a U-profile), positioned at an angle of 45° with respect of the
direction of the stroke. The insert is filled with mineral dust, weighted to determine the
amount of dust and then inserted in the hard floor test area. The dust removal ability for hard
floors is ratio between the amount of dust removed from the crevice and the amount of dust
that was originally in the insert at the width of the cleaning head, accounting for the oblique
45° angle.
The dust removal test result in %, both for hard floor and carpet testing, is the average result
of a number of cleaning cycles.
Ring-tests were done and the test method proved to be accurate and repeatable. The question
(and discussion, see chapter 1) is whether it is realistic to test dust removal by going over the
same piece of floor 10 times or rather whether it is acceptable to perform unrealistic tests as
long as the relative ranking does not change. A second problem, probably solvable by
introducing it as a transitional method, is the fact that the protocol is at the very beginning of
its approval procedure within CENELEC and has currently not even the status of prEN
standard.
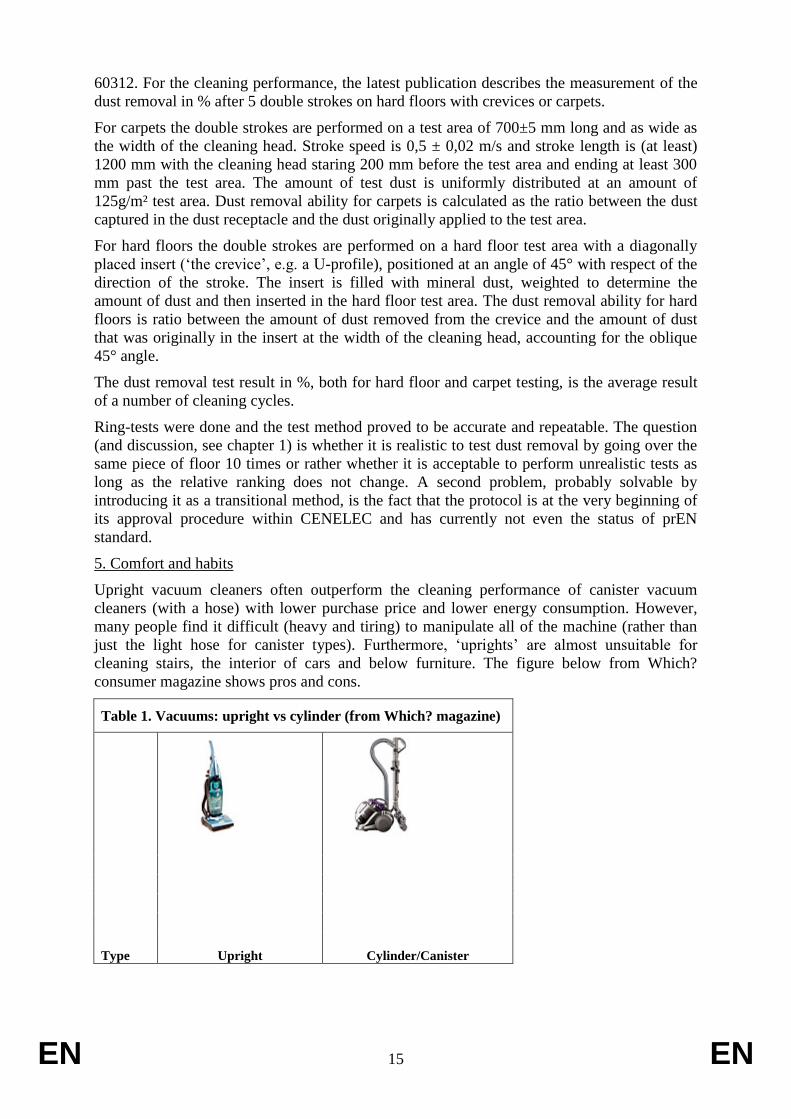
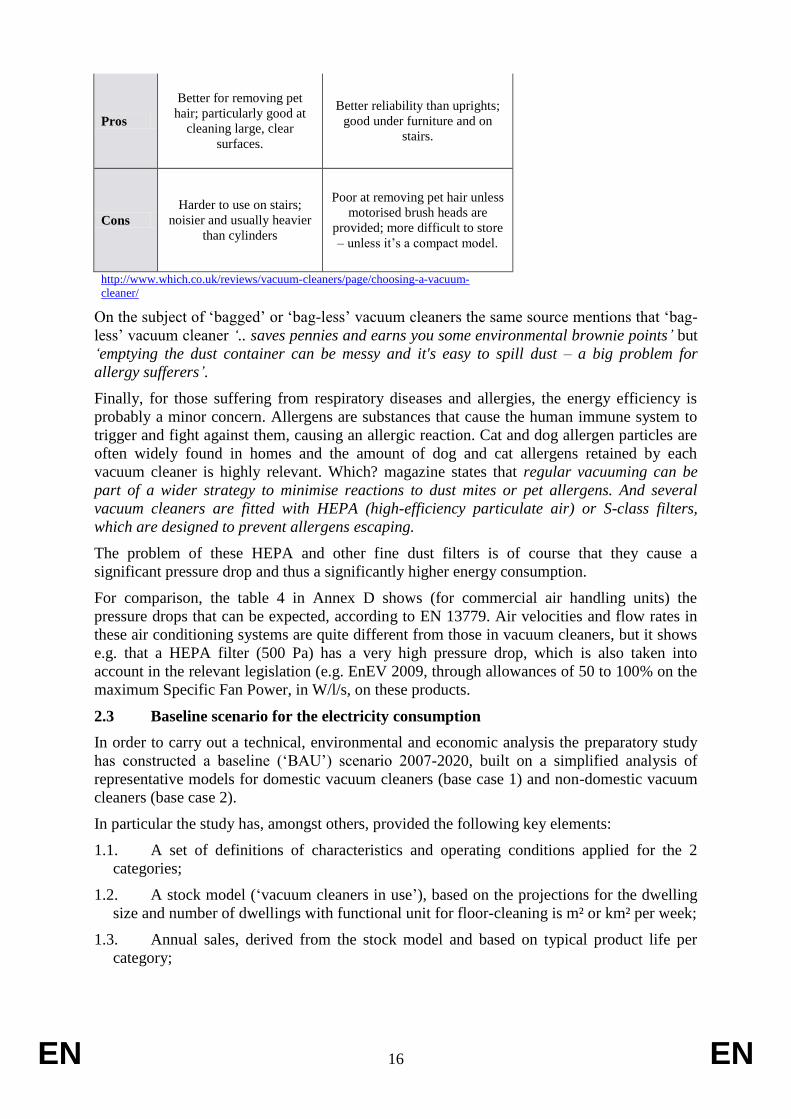
5. Comfort and habits
Upright vacuum cleaners often outperform the cleaning performance of canister vacuum
cleaners (with a hose) with lower purchase price and lower energy consumption. However,
many people find it difficult (heavy and tiring) to manipulate all of the machine (rather than
just the light hose for canister types). Furthermore, ‘uprights’ are almost unsuitable for
cleaning stairs, the interior of cars and below furniture. The figure below from Which?
consumer magazine shows pros and cons.
Table 1. Vacuums: upright vs cylinder (from Which? magazine)
Type Upright Cylinder/Canister
Page 16
EN 16 EN
Pros
Better for removing pet
hair; particularly good at
cleaning large, clear
surfaces.
Better reliability than uprights;
good under furniture and on
stairs.
Cons
Harder to use on stairs;
noisier and usually heavier
than cylinders
Poor at removing pet hair unless
motorised brush heads are
provided; more difficult to store
– unless it’s a compact model.
http://www.which.co.uk/reviews/vacuum-cleaners/page/choosing-a-vacuum-
cleaner/
On the subject of ‘bagged’ or ‘bag-less’ vacuum cleaners the same source mentions that ‘bag-
less’ vacuum cleaner ‘.. saves pennies and earns you some environmental brownie points’ but
‘emptying the dust container can be messy and it's easy to spill dust – a big problem for
allergy sufferers’.
Finally, for those suffering from respiratory diseases and allergies, the energy efficiency is
probably a minor concern. Allergens are substances that cause the human immune system to
trigger and fight against them, causing an allergic reaction. Cat and dog allergen particles are
often widely found in homes and the amount of dog and cat allergens retained by each
vacuum cleaner is highly relevant. Which? magazine states that regular vacuuming can be
part of a wider strategy to minimise reactions to dust mites or pet allergens. And several
vacuum cleaners are fitted with HEPA (high-efficiency particulate air) or S-class filters,
which are designed to prevent allergens escaping.
The problem of these HEPA and other fine dust filters is of course that they cause a
significant pressure drop and thus a significantly higher energy consumption.
For comparison, the table 4 in Annex D shows (for commercial air handling units) the
pressure drops that can be expected, according to EN 13779. Air velocities and flow rates in
these air conditioning systems are quite different from those in vacuum cleaners, but it shows
e.g. that a HEPA filter (500 Pa) has a very high pressure drop, which is also taken into
account in the relevant legislation (e.g. EnEV 2009, through allowances of 50 to 100% on the
maximum Specific Fan Power, in W/l/s, on these products.
2.3 Baseline scenario for the electricity consumption
In order to carry out a technical, environmental and economic analysis the preparatory study
has constructed a baseline (‘BAU’) scenario 2007-2020, built on a simplified analysis of
representative models for domestic vacuum cleaners (base case 1) and non-domestic vacuum
cleaners (base case 2).
In particular the study has, amongst others, provided the following key elements:
1.1. A set of definitions of characteristics and operating conditions applied for the 2
categories;
1.2. A stock model (‘vacuum cleaners in use’), based on the projections for the dwelling
size and number of dwellings with functional unit for floor-cleaning is m² or km² per week;
1.3. Annual sales, derived from the stock model and based on typical product life per
category;
Page 17
EN 17 EN
The floor-cleaning performance is derived from DG ENER Lot 1 data on building volume
(see fig. 1), whereby for residential dwellings a floor height of 2,85 m was assumed and for
commercial/public sector a floor height of 3,6 m was employed.
According to this study, the total heated building volume 2005 was around 110 billion m³, of
which houses account for 29,3% (32,2 billion m³, 11,3 billion m²), apartments for 14,5 % (16
bln m³, 5,6 billion m²). Together they account for around 17 billion m², or 17 000 km², of
floor area to be cleaned. Note that only households, i.e. ‘primary dwellings’ actually in use,
are counted. The growth of EU-27 households between 1990 and 2000 amounted to 10,1%
(1% annually) and from 2000 onwards amounted to 7,6% (0,75% annually). The average
dwelling size, with 87 m² in anchor year 2005 is estimated at 1% annually.
The commercial sector accounted for 14,5 % (16 billion m³, 4,4 billion m²), the public sector
for 19,4% (21,3 billion m³, 5,9 billion m²). Together these tertiary sector buildings account for
around 10,3 billion m², or 10 300 km², of floor area to be cleaned.
Naturally, especially in the public and retail sector with sturdy hard floor surfaces, very often
dry vacuum cleaners will not be used, so –for lack of better data—the projections for the
tertiary sector will assume the use of dry vacuum cleaners only in 50% of the tertiary sector
floor area (offices, hotels), which means around 5,1 billion m², or 5 100 km² of floor area will
actually be cleaned with dry vacuum cleaners and this size is kept constant over the projection
period.
Fig. 1. Split-up of 110 billion m³ heated volume equivalent at 18°C indoor temperature in the
EU. (source: VHK, Ecodesign Boilers, Lot 1, preparatory study)
The technical consultant for the underlying impact analysis has extended the model
backwards to the reference year 1990 (reference for Kyoto Treaty and ‘20-20 in 2020’ target)
and forward to the year 2025.
Page 18
EN 18 EN
The structure of the methodology of the technical, environmental and economic analysis is
contained in Annex D.
The graph below shows the total weekly floor-cleaning demand, expressed in the functional
unit of km² (=million m²) per week.
0
5.000
10.000
15.000
20.000
25.000
30.000
1990 2000 2005 2010 2015 2020
km²/
we
ek
EU-27: dry vacuum floor-care demand 1990-2020(in km²/week)
floor area tertiary (dry vac), km2
floor area residential, in km2
Fig. 2. Vacuum cleaners: Baseline floor-cleaning demand in km² floor-care/week .
The main outcomes of the baseline (‘BAU’, Business-as-Usual) scenario are summarized in
Table 2 below.
This BAU scenario shows a rapidly growing energy demand rising from 18 TWh in 2005 to
43 TWh in 2025 (domestic and commercial). This is driven by increasing floor area, coupled
with increases in average power input.
Table 2: Vacuum cleaners: EU-27 Key figures ‘Baseline’
1990 2000 2005 2010 2015 2020 2025
DEMAND (floor area to clean)
primary dwellings EU-27, million 172 186 194 202 210 218 227
dwelling size, m²/dwelling 76 84 88 93 97 102 108
floor area residential, in km² 13072 15637 17103 18706 20459 22377 24474
floor area tertiary (dry vac), km² 4333 4840 5100 5360 5634 5921 6218
total floor area, km² 17405 20477 22203 24066 26093 28298 30692
ENERGY-RELATED PARAMETERS
operating hours/km² dom.*, h/clean 11364 11364 11364 11364 11364 11364 11364
op. hours/km² non-dom.**, h/clean 10196 10196 10196 10196 10196 10196 10196
rated domestic VC power, W 1275 1423 1500 1739 2016 2337 2711
rated non-domestic VC power, W 929 1107 1200 1293 1393 1500 1500
electricity domestic, in TWh 9,5 12,6 14,6 18,5 23,4 29,7 37,7
electricity non-domestic, in TWh 2,1 2,7 3,1 3,5 4,0 4,5 4,8
energy total, in TWh 11,5 15,4 17,7 22,0 27,4 34,2 42,5
MJ/kWh 11,0 10,9 10,9 10,8 10,6 10,5 10,4
primary energy electricity, in PJ 104 138 159 199 249 311 392
primary energy disposables use, in PJ 2,2 2,3 2,4 2,5 2,6 2,7 2,8
Page 19
EN 19 EN
prim. energy production & eol, in PJ 15 31 46 46 64 77 85
total primary energy PJ 121 165 200 234 295 371 371
GHG EMISSIONS
Mt CO2/TWh 0,50 0,46 0,45 0,43 0,41 0,38 0,36
Mt CO2 electricity 4,7 5,8 6,6 7,9 9,6 11,3 13,6
Mt CO2 other 1,0 1,3 2,1 2,0 2,7 3,5 3,5
Mt CO2 total 6,7 8,4 10,0 11,2 13,5 15,7 15,7
ECONOMICS****
€ billion electricity 1,9 2,6 3,0 3,7 4,6 5,8 7,1
€ billion disposables 2,1 2,3 2,4 2,5 2,6 2,7 2,8
€ billion purchase 4,0 8,4 12,2 12,2 17,0 20,6 22,7
€ billion total consumer expenditure 8,1 13,2 17,5 18,3 24,2 29,0 32,6
PRODUCT SERVICE LIFE VC
product life sales domestic VC 9 8 7 6 5 4 4
product life stock domestic VC 9,0 8,6 7,6 7,3 6,2 5 5
SALES & STOCK
sales growth domestic VC.*** 8,0% 8,0% 0,0% 7,0% 4,0% 2,0% 2,0%
sales domestic VC, million units 16,66 35,97 52,86 52,86 74,13 90,19 99,58
sales non-domestic VC (1%/a growth) 1,1 1,2 1,2 1,3 1,3 1,4 1,5
total sales VC 17,8 37,1 54,1 54,1 75,5 91,6 101,1
in stock, domestic VC 150 194 288 355 387 411 474
in stock, non-domestic VC 5,5 6,2 6,5 6,8 7,2 7,5 7,8
market penetration, domestic (VC/hh)* 0,87 1,04 1,49 1,76 1,84 1,88 2,09
*=based on 87 m² per dwelling and ca. 1 h per week in 2005; 50 h/dwelling per year
**=based on 500h/a * 5,2 million units in stock = 2600 million h per 5100 km² x 50 weeks/a
***= in the year 2005 0% growth means that in the period 2005-2007 sale continue to grow at a rate of 8-9% per
year, but during the crisis 2008-2009-2010 they drop again to a level of around 2005
****=based on product price constant in 2005 Euro
Comparing impacts to policy goals and other yardsticks: At 18 TWh/a in 2010 the VC
represented around 0,7% of EU-27 electricity consumption.1 The carbon emissions of
8,5 Mt/a represent 0,2 % of EU-27 total.1 For 2020, taking the 2010 electricity use and
carbon emissions as a reference, the share of VCs would be 1,1% and carbon emissions
around 0,35% of the EU-27 total in the baseline scenario.
The baseline projection builds on the existing trend with a growth rate of 9% annually.
Environmental impacts
Page 20
EN 20 EN
The environmental impact especially shows that for non-domestic vacuum cleaners the use
phase is much more important than for domestic vacuum-cleaners. For domestic VCs it is
remarkable that at least the production phase is not insignificant.
Fig. 3. Resources Usage (example from preparatory study)
As regards the monetary situation, the table 1 gives an overview of the direct and indirect
consumer expenditure due to domestic vacuum cleaners today.
Actors and market structure
Currently the European domestic vacuum cleaner market is dominated by manufacturers such
as BSHG (DE), Vorwerk (DE), Miele (DE), Rowenta (FR, SEB group), Philips (NL, EU site
in PL), Electrolux (SE, EU sites in HU), Indesit (IT, Merloni group), Hoover Candy Group
(IT, site in CZ), Dyson (UK, site in Malaysia), Numatic (UK), etc.. In non-domestic dry
vacuum cleaners Nilfisk Advance (DK, also EU sites in IT, HU) is a leading manufacturer.
EU dry vacuum cleaner related industrial employment, for production, R&D, distribution
centres and head offices is estimated at around 7000 - 10 000 employees, of which roughly
half in production. OEM employment will not exceed around 3000 people. Most EU
manufacturers also have manufacturing sites in especially Asia (China, Malaysia).
Domestic vacuum cleaner manufacturers are represented at an EU-scale by the manufacturer’s
association CECED. Non-domestic vacuum cleaner manufacturers are represented by
ICMMA, the Industrial Cleaning Machine Manufacturer’s Association, and EUnited
Cleaning, the European association of commercial cleaning machine manufacturers.
The retail and wholesale sector for vacuum cleaners in the EU-27 is estimated at around 300-
350.000 companies. This estimate by the technical consultant VHK is based on a proprietary
analysis of national and EU NACE statistics (see Table 4). The most important outlets are
Page 21
EN 21 EN
stores for household appliances, DIY-stores, and the non-food section of larger supermarkets
(>100 m²). Table 3 gives an overview of the number of companies.31
The added value of vacuum cleaners for the trade sector is assumed at 40% of sales in
consumer prices, resulting in around € 1,3 billion for 2010. The total added value of the trade
sector in the EU-27 is 11% of GDP, i.e. around € 1.300 billion32
. So vacuum cleaners
represent 0,1 % of the trade total.
Employment in the trade sector is 31 million jobs. Partitioning on the basis of revenue, this
means that around 75.000 retail/trade jobs depend on vacuum cleaners.33
These figures imply
€ 41.000 added value and € 96.000 turnover per employee in the trade sector. In addition to
the 75000 jobs mentioned, independent door-to-door salespeople still represent a significant
part of the market. For instance, the direct-selling German manufacturer Vorwerk sells its
vacuum cleaners (brand ‘Kobold’) and kitchen mixers through 35.000 independent door-to-
door ‘advisers’, of which a substantial part in the EU.
The trade sector is represented at EU level by Eurocommerce.
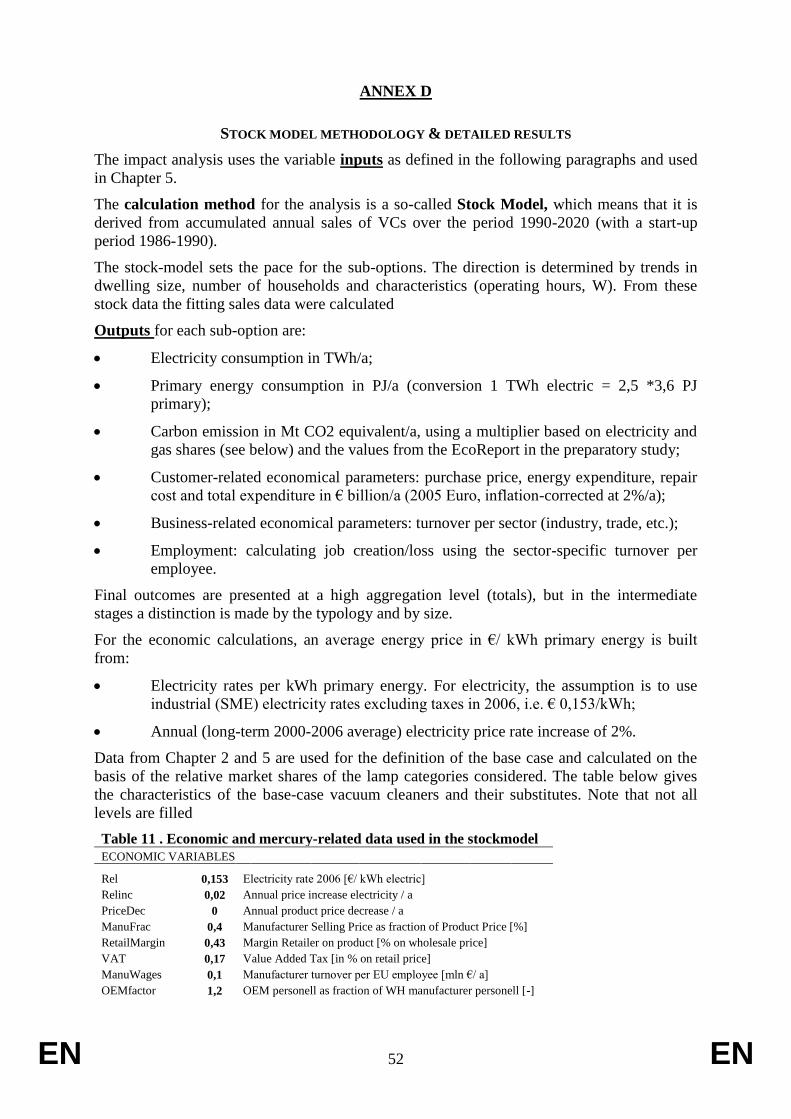
Table 3. Retail outlets EU, ca. 2005 (source VHK analysis of Member State and
Eurostat NACE statistics)
NACE number & Descriptions
No. of
companies
52.113 Superettes (100 m² - 400 m²) 50192
52.114 Supermarkets (400 m² - 2500 m²) 124985
52.115 Hypermarkets (>2500m²) 15213
52.121 Other department stores, non-food (>2500m²) 1772
52.122-129 Retail sale in non-specialized stores n.e.c. 18703
52.445 Stores for household appliances n.e.c. 17408
52.461 Stores for hardware, plumbing and building materials 94522
52.462 Do-it-yourself / paint stores 37982
Total 360776
The national government tax offices collect the taxes and levies. In the scenario calculations
some 19% VAT and taxes were assumed on top of the consumer price without taxes. This
translates into around 17% of sales, i.e. around € 510 million in 2010.
The electricity costs of vacuum cleaners in the EU are around € 3 billion in 2010. The
electricity companies, represented at EU level by Eurelectric.
As mentioned in Table 1, the total consumer expenditure in 2010 at a total of almost € 15
billion in 201034
. Per capita this comes close to ca. € 30 and per household close to € 75,-.
Consumer associations are represented at EU level by ANEC/ BEUC.
Other relevant stakeholders are the green NGOs (e.g. ECOS) and the Member States.
2.4 Sensitivity analysis of baseline
31
Note that one company may own several outlets. On the other hand, a part of the population may
choose not to have reflector lamps on stock, which together makes for the estimate of 250-300.000
outlets. 32
Source www.eurocommerce.be 33
Total employment data are based on Eurocommerce data. Note that the figure of € 41.000 added value
per employee is used in the analysis of suboptions. 34
At € 0,16/kWh this is € 2,4 billion in electricity + at € 12,-/a for bags gives € 2,4 billion + at € 225/unit
and 45 million unit sales resulting in € 10,1 billion
Page 22
EN 22 EN
How robust are the projections in the baseline scenario? First of all, it must be mentioned that
the data availability for this sector is very poor. This is not only due to the ‘usual’
confidentiality issues, but also because the VCs have largely been ignored from an energy
perspective by most stakeholders. As a result, not only market data but also technical data
regarding efficiency are difficult to find and a large part of the underlying analysis had to be
based on anecdotal rather than systematic information. An extra difficulty is introduced by the
fact that VC projections relate to both the domestic and the tertiary sector.
Economic Crisis
In several consumer product sectors the 2008-2009 crisis has led to drops in sales up to 20 or
25% (air-conditioners, boilers, etc.), after a considerable growth in the 2006-2007 period. The
overall effect that is assumed, in line with scenarios given by EC DG ECFIN, is that the 2010
sales equal those of 2005. This scenario has been compared with other standard crisis
scenarios proposed by the Commission and appears fairly robust (deviations <10%).
As regards the influence of the electricity rates the scenarios have been adapted to the latest
findings in the MEErP study35
, which signals that the electricity rates – which were previously
in line with inflation – were subject to an escalation rate (real growth, i.e. above inflation) of
3-4%.
Functionality
The development of vacuum cleaners has been evolutionary rather than revolutionary. Hence
no drastic changes are expected for the future.
Rebound effect
The ‘rebound effect’ is a phenomenon whereby the increased popularity of an energy-saving
technology has not only triggered replacement of inefficient products, but – presumably
because consumers no longer felt ‘guilty’ – also created completely new applications in places
where no energy was consumed before.
With vacuum cleaners the chances of these rebound effects are very slim, because no matter
how wonderful the new vacuum cleaner the activity of floor-cleaning is very unlikely to
become more popular for that reason.
Conclusion
Based on the above, the accuracy of the baseline scenario in predicting the electricity
consumption of vacuum cleaners in 2020 is estimated not be higher than ± 20%.
2.5 Risk Management
For a sector like vacuum cleaners there are no issues that meet the conditions for a risk
assessment as a part of the impact analysis as addressed in the EU IA Guidelines.36
3. OBJECTIVES
As laid out in Section 2, the preparatory study has confirmed that a large cost-effective
potential for reducing electricity consumption of vacuum cleaners exists. This potential is not
captured, as outlined above. The general objective is to develop a policy which corrects the
market failures, and which:
35
Kemna, R. , Methodology for the Ecodesign of Energy-related Products (MEErP), VHK for European
Commission, Nov. 2011.(see www.meerp.eu) 36
European Commission, Impact Assessment Guidelines, SEC(2009)92, 15 Jan. 2009.
Page 23
EN 23 EN
1.4. I) Reduce energy consumption and related CO2 and pollutant emissions due to
vacuum cleaners following Community environmental priorities, such as those set out in
Decision 1600/2002/EC or in the Commissions European Climate Change Programme
(ECCP);
1.5. II) Promote energy efficiency hence contribute to security of supply in the
framework of the Community objective of saving 20% of the EU’s energy consumption by
2020.
The Ecodesign Directive, Article 15, requires that ecodesign implementing measures meet all
the following criteria:
1.6. a) there shall be no significant negative impacts on the functionality of the product,
from the perspective of the user;
1.7. b) health, safety and the environment shall not be adversely affected;
1.8. c) there shall be no significant negative impact on consumers in particular as regards
affordability and life cycle cost of the product;
1.9. d) there shall be no significant negative impacts on industry’s competitiveness;
1.10. e) in principle, the setting of an ecodesign requirement shall not have the
consequence of imposing proprietary technology on manufacturers;
1.11. f) no excessive administrative burden shall be imposed on manufacturers.
1.12. As regards the operational objectives it is clear that the 2020 time horizon, used in
several overarching policy objectives for energy security of supply and environment, is
very important. Savings in 2020, with respect to the reference year 1990, will indicate the
relative contribution of measures.
4. POLICY OPTIONS
4.1 Option 1: No EU action
This option would have the following implications:
1.13. The market failures would persist, and only very slowly the consumers would
become aware of the advantages and disadvantages of the different types. The impact of
this option is described in more detail in Section 2.
1.14. It is to be expected that Member States may want to take individual non-harmonised
action on vacuum cleaner efficiency. This would hamper the functioning of the internal
market and lead to high administrative burdens and costs for manufacturers, in
contradiction to the goals of the Ecodesign Directive.
1.15. The specific mandate of the Legislator would not be respected.
Therefore this option is discarded from further analysis.
4.2 Option 2: Self-regulation
This option would have the following implications:
1.16. No initiative for self-regulation on vacuum cleaners has been brought forward by any
industrial sector.
1.17. Industry has called for a clear legal framework (‘level playing field’) ensuring fair
competition, while voluntary agreements could lead to competitive advantages for free-
riders and/or non-participants to the ‘self-commitment’.
Page 24
EN 24 EN
1.18. The specific mandate of the Legislator would not be respected.
The relevant industry association (CECED37
) made a number of 'voluntary agreements' in the
1990s in respect of some white goods(washing machines, dishwashers and refrigerators and
freezers) However in the mid-2000s they decided they would prefer statutory limits as this
gave a level playing field, and so ruled out agreeing to self-regulation. This remains their
position. Moreover, as explained in par. 2.1.1, the market structure (low concentration and
low market power) would probably rule out an effective self-regulation.
Therefore this option is discarded from further analysis.
4.3 Option 3: Energy labelling targeting vacuum cleaners
This option would include the labelling of vacuum cleaner efficiency in seven efficiency
classes as under the Energy Labelling Directive
This option would imply the following:
1.19. In general, two main objectives of labelling schemes are to increase the market
penetration of, in this case, energy efficient products by providing incentives for
innovation and technology development, and to help consumers to make cost effective
purchasing decision by addressing running costs.
1.20. Furthermore, the energy label would be an ideal vehicle to inform the consumers on
the performance characteristics of the new(er) technologies.
Option 3 would result in savings. However, it would miss out on the substantial initial
reduction in energy consumption from minimum requirements which will eliminate a high
proportion of current models from the market (though design changes will be relatively
small). Based on the experience from white goods energy labelling, it seems likely that a
labelling only policy would allow substantial continuing sales of existing high input power
(low efficiency models). This might be particularly marked for the low price models.
Especially with vacuum cleaners having been turned into a relatively cheap commodity
product, a large part of the possible buyers are relatively insensitive to ‘rational’ economic
and environmental arguments. These buyers would not be reached by labelling alone and for
this reason ‘labelling only’ is discarded as an option.
4.4 Option 4: Ecodesign implementing regulation on vacuum cleaners (MEPS)
This option aims at improving the environmental impact of vacuum cleaners, i.e., setting
minimum efficacy levels for their power consumption. Details of the rationale for the
elements of the corresponding regulation, as listed in Annex VII of the ecodesign framework
directive, would apply.
In itself this is an effective measure, because it is largely independent on consumer and
market behaviour and would take the worst performing products from the market.
On the other hand, it would not address the considerable saving potential from new
technologies as it would not provide the necessary guidance and ‘market pull’ towards these
new technologies. For that reason the options of ‘MEPS only’ is discarded.
4.5 Option 5: Labelling and Ecodesign MEPS combined
The most adequate solution is a combination of options 3 and 4, i.e. labelling and MEPS. It
combines the advantages of the two options discussed earlier and it avoids the pitfalls.
37
Page 25
EN 25 EN
But within that option there are still several sub-options related to timing and target levels,
elaborated in Chapter 5.
4.5.1 Definition of the types of energy-using products covered
The scope of the product categories addressed by an ecodesign measure is in line with the
scope of the preparatory study and stakeholder consultations. This means that in principle
domestic and non-domestic dry vacuum cleaners are addressed. The following table gives an
overview of the scope:
Table 4 . Products in scope
Products within scope
Proposed definition
Domestic VCs
A vacuum cleaner (including hybrid products that can be both mains and
battery powered) used primarily in household or domestic situations; the
manufacturer declares the product's compliance with the Low Voltage
Directive (LVD) in the Declaration of Conformity (DoC).
Commercial VCs
A vacuum cleaner for professional housekeeping purposes and intended to be
used by laymen, cleaning staff or contracting cleaners in office, shop, hospital
and hotel environments; the manufacturer declares the product's compliance
with the Machinery Directive (MD) in the Declaration of Conformity (DoC).
Products excluded from
scope or to be included with
delay
Proposed definition
Industrial VCs designed to be part of a production process, including vacuum cleaners
designed for cleaning hazardous material, or as part of an industrial machine or
tool and/or with a head width exceeding 50 cm
Wet VCs A vacuum cleaner that can store dirty water or water-based cleaning solution,
previously placed on the surface to be cleaned or dried by the same appliance
or separately by the end-user.
Wet and dry VCs A vacuum cleaner designed to remove a significant volume (more than 2.5
litres) of liquid.
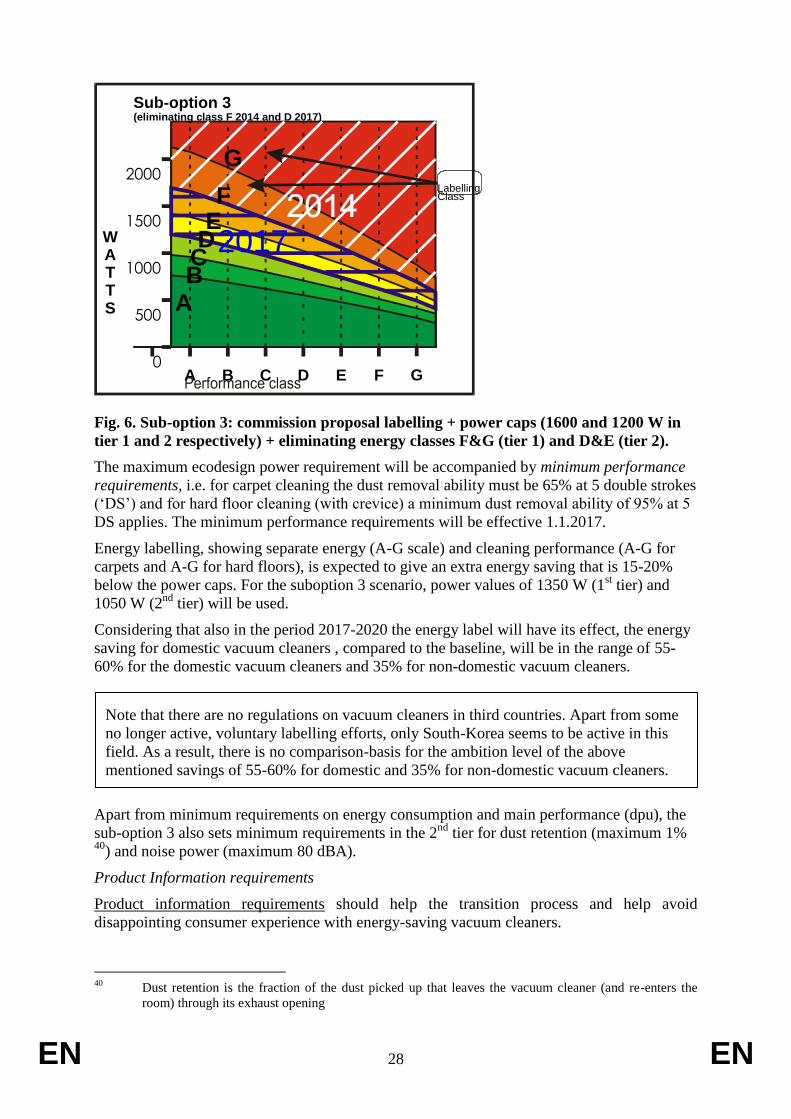
Robot VCs An appliance equipped with built-in energy source that recognize environment
autonomously navigated and performs autonomous and/or semi-autonomous
cleaning function.
Central VCs With a fixed (not movable) underpressure source location and the hose
connections located at fixed positions in the building
Battery VCs Battery powered domestic or commercial VC
Water filter VCs An appliance that uses water as filter medium; the suction air is forced through
the water entrapping the removed dry material as it passes through.(Label and
ecodesign when measurement method.)
Measurement standards
The applicable standard will be EN 60312, including the latest amendments. If the standard is
not approved by the standardisation bodies in time, relevant parts will be published as a
‘transitional method’ in the Official Journal.
4.5.2 Implementation of ecodesign requirements
According to the 2009/125/EC the target levels for measures should be set at least life cycle
cost (LLCC), which presumes that at some point the price of the product increases so much
with extra design options to save energy that the life cycle costs (purchase price plus running
costs) will start to rise again.
However, as has been argued in the preparatory study, most design options can be realised at
low costs and negligible effect on Life Cycle Costs (e.g. +€ 10/unit). Exceptions may occur
for increased product life (consumer price +€ 50/unit) or when the MEPS would impose the
Page 26
EN 26 EN
use of VSD permanent magnet motors. The latter may typically occur at second stage MEPS
and would drive the average price to around € 275-€ 285 from the current (in constant €,
2005) from the current € 225/unit.
Generally speaking, the LLCC point typically coincides with the BAT (Best Available
Technology) point and it will be mostly the maturity of the latest technologies and the
affordability to restrict target levels.
Efficiency requirements vacuum cleaners
The preparatory study proposes to introduce a power cap of 1000 W (first tier, 2014) and later
750 W (second tier, 2017). Given the stringent limits, energy labelling in whatever form is not
expected to play a role until after 2020. This is known as ‘sub-option 1’ in the scenario
calculations.
Compared to the baseline domestic vacuum cleaners in 2020 (2337 W, see Table 3) stage 2
requirements imply a 67% saving. Compared to the baseline non-domestic dry vacuum
cleaners (1500 W, see Table 3) stage 2 requirements give a 50% saving.
Stage 1 is foreseen 2 years after entry into force of the regulation and stage 2 is foreseen 4
years after entry into force of the regulation.
This proposal heavily relies on the fact that industry will be able to develop effective and
efficient products in the future, as it bans all currently available canister type vacuum cleaners
on the market today.
Sub-option 2 is the industry counterproposal presented in May 2010 regarding energy
labelling. Energy consumption is estimated on the assumption that the consumer will continue
to operate the vacuum cleaner until a minimum cleaning performance is reached (e.g. 65% for
carpets, 90% for hard floor used in a combined index). Hence a vacuum cleaner with low
cleaning performance will have far higher annual energy consumption than one with good
cleaning performance.
In 2010, the industry did not propose to use limits of any type, but for the sake of the analysis
it is assumed that eventually an elimination of class F (in stage 1) and D (in stage 2) would be
plausible. Figure 5 below illustrates the energy labelling classes (in kWh/yr38
), the cleaning
classes in '% dust pick up' (dpu) and the allowed power consumption (wattage, in W) for
carpets. Note that in this Sub-option 2 the cleaning performance plays a large role. Even after
stage 2 (elimination of D class) it is possible to produce vacuum cleaners with almost 3000 W
power consumption (out of reach of the diagram), as long as the cleaning performance is good
enough (e.g. cleaning class better than D). There is little evidence as to how users behave in
reality, but two small studies undertaken by manufacturers indicate a limited influence of
cleaning performance on cleaning time (and so energy consumption). 39
38
The original proposal was in Wh/10m² . But for the annual energy consumption the industry proposal
entailed that this figure would be multiplied by 50 times a year (once a week) and by 10 x 10 m² (home
with 100 m² surface). 39
As mentioned the industry proposal entailed a combined cleaning index, composed of a normalized
carpet cleaning index (normalized to 65% dpu) and a normalized hard floor crevice cleaning index
(normalized to 90% dpu). For the sake of simplicity the diagram only shows the results for carpet only
vacuum cleaners.
Page 27
EN 27 EN
0
500
1000
1500
2000
WATTS
BA C D E F
Sub-option 2 (industry proposal eliminating class F 2014 and D 2017)
2017 LabellingClass
A
BC
DE
F
G
Fig. 5. Sub-option 2: industry label proposal + eliminating class F (stage 1) and D (stage
2)
This makes it very hard to predict a saving potential, because there is only anecdotal
information on the cleaning performance (i.e. from consumer association tests) based on the
new EN 60321 standard still under development. Based on this scarce information and an
assumption that the market will not accept a cleaning performance below ‘C’ (in combination
with a minimum ‘C’ energy class due to the regulation) the average power consumption will
not reach the level of 2337 W projected for 2020, but will stay at a level of around 1800-2000
W for domestic vacuum cleaners (20% saving versus baseline). For non-domestic vacuum
cleaners the level may be at 1200 W (also 20% saving versus baseline).
Sub-option 3, i.e. the 2011 Working Document, is a compromise that takes largely into
account the stakeholder comments and that does not run the risk of eliminating canister types
of the market. It proposes a 1st tier power cap of 1600 W plus the elimination of energy
classes F and G and a 2nd
tier maximum power of 1200 W plus elimination of energy classes
D and E. At the first tier classes ‘A+’ and ‘A++’ will be introduced and at the 2nd
tier energy
class ‘A+++’ will be added. As with sub-option 2, for sub-option 3 stage 1 is foreseen 2 years
after entry into force of the regulation and stage 2 is foreseen 4 years after entry into force of
the regulation.
The metric for the energy labelling includes an effect to the cleaning time dependent on the
cleaning performance, but considerably smaller than that of the 2010 industry proposal. It also
has a smaller bandwidth for the energy classes. For instance, where sub option 2 proposes an
F class lower limit at ca. 250-270 kWh/yr (at 100 m² surface) for carpet vacuum cleaners, the
sub-option 3 proposes an F class lower limit at ca. 78 kWh/yr.
Page 28
EN 28 EN
0
500
1000
1500
2000
W A T T S
B A C D E F
Sub-option 3 (eliminating class F 2014 and D 2017)
2017
Labelling Class
A
B C D
E
F
G
G
Fig. 6. Sub-option 3: commission proposal labelling + power caps (1600 and 1200 W in
tier 1 and 2 respectively) + eliminating energy classes F&G (tier 1) and D&E (tier 2).
The maximum ecodesign power requirement will be accompanied by minimum performance
requirements, i.e. for carpet cleaning the dust removal ability must be 65% at 5 double strokes
(‘DS’) and for hard floor cleaning (with crevice) a minimum dust removal ability of 95% at 5
DS applies. The minimum performance requirements will be effective 1.1.2017.
Energy labelling, showing separate energy (A-G scale) and cleaning performance (A-G for
carpets and A-G for hard floors), is expected to give an extra energy saving that is 15-20%
below the power caps. For the suboption 3 scenario, power values of 1350 W (1st tier) and
1050 W (2nd
tier) will be used.
Considering that also in the period 2017-2020 the energy label will have its effect, the energy
saving for domestic vacuum cleaners , compared to the baseline, will be in the range of 55-
60% for the domestic vacuum cleaners and 35% for non-domestic vacuum cleaners.
Note that there are no regulations on vacuum cleaners in third countries. Apart from some
no longer active, voluntary labelling efforts, only South-Korea seems to be active in this
field. As a result, there is no comparison-basis for the ambition level of the above
mentioned savings of 55-60% for domestic and 35% for non-domestic vacuum cleaners.
Apart from minimum requirements on energy consumption and main performance (dpu), the
sub-option 3 also sets minimum requirements in the 2nd
tier for dust retention (maximum 1% 40
) and noise power (maximum 80 dBA).
Product Information requirements
Product information requirements should help the transition process and help avoid
disappointing consumer experience with energy-saving vacuum cleaners.
40
Dust retention is the fraction of the dust picked up that leaves the vacuum cleaner (and re-enters the
room) through its exhaust opening
Page 29
EN 29 EN
All information should be available on free-access websites, the URL of which should be in
the packaging of the product (6 pt font)
4.5.3 Implementation of energy labelling
The energy label identifies manufacturer and model name and it contains information on
annual electricity consumption (in kWh/yr, calculated from annual surface area to
clean as well as power consumption and cleaning performance of the model),
energy efficiency class (class A-G, based on annual electricity consumption),
carpet cleaning performance (class A-G),
hard floor cleaning performance (class A-G),
dust re-emission (class A-G) and
noise power (in decibel).
Implementation of the label is mandatory 1 year after entry into force of the delegated
regulation. Extra labelling classes are to be introduced (and lowest labelling classes
eliminated) 2 years (add ‘A+’ and ‘A++’) and 4 years (‘A+++’) after entry into force of the
delegated regulation.
4.5.4 Date for evaluation and possible revision
The main issues for a possible revision of the Regulation are
1.21. appropriateness of the product scope;
1.22. appropriateness of the levels for the ecodesign requirements
The second stage of the ecodesign requirements becomes effective 4 years after entry into
force of the Regulation. With a view to the level of requirements proposed and the still
immature market for new technologies, a review can be presented to the Consultation Forum
5 years after entry into force of the regulation. For this revision, it is important that the
necessary measurement standard is fully developed and tested
4.5.5 Interrelation with other ecodesign implementing measures — implications on scope
As mentioned in Chapter 2, there is hardly any overlap at the present time with other
Ecodesign regulations such as e.g. the Motor or Fan Regulation.
4.5.6 Options related to production phase
As was noted in section 2.3 (environmental impacts) the energy embedded in domestic
vacuum cleaners was perhaps 10-15% of total energy, and so not insignificant. The
preparatory study identified different options such as light weighting and increased durability
for reducing the overall material content of performing the vacuum cleaning functions, thus
addressing this significant impact. The option that appears most beneficial at this stage is
increasing the durability of vacuum cleaners along with information requirements on
disassembly for repair/maintenance and recycling/recovery/disposal.
The preparatory study suggested that:
the number of vacuum cleaners bought annually is increasing due to a combination
of declining product lifetime and the increasing trend towards multiple ownership;
the top reasons for breakdowns were "split or broken hoses" (first cause) and
"motors" (second/third highest cause depending on the type of vacuum cleaner);
Page 30
EN 30 EN
vacuum cleaners dominate the "small mixed WEEE" (category 2) waste stream in
terms of waste generated (and collected);
Durability requirements addressing the hose and the motor can be introduced, because
applicable test methods are included in the IEC 60312 standard. Information requirements on
disassembly for repair/maintenance and recycling/recovery/disposal are also feasible.
5. IMPACT ANALYSIS
5.1 Introduction
Given that options 1 to 4 have been discarded in Section 4, this Section looks into the impacts
of option 5. To this end an assessment of possible sub-options as regards the ‘intensity’ of the
measure - the combination of the levels of requirements for the levels pursuant to Article
15(4f) of the Ecodesign Directive - is carried out, in terms of economic, environmental and
social impacts. The savings calculated in this chapter relate to measures for vacuum cleaners.
The assessment is done with a view to the criteria set out in Article 15(5) of the Ecodesign
Directive, and the impacts on manufacturers including SMEs. The aim is to find a balance
between quick realisation for achieving the appropriate level of ambition and the associated
benefits for the environment and the user (due to reduction of life-cycle costs) on the one
hand, and potential burdens related e.g. to un-planned re-design of equipment for achieving
compliance with ecodesign requirements on the other hand, while avoiding negative impacts
for the user, in particular as related to affordability and functionality. The methodology of the
analysis is explained in Annex D.
The sub-options 1, 2 and 3 are explained in par. 4.5.3.
5.2 Impacts
5.2.1 Electricity
The graph below gives the results for the baseline and 3 sub-option scenarios.
27,4
34,2
42,5
14,511,8 12,811,5
15,4
17,722,0 25,5
29,1 31,6
18,815,4 15,0
0,0
5,0
10,0
15,0
20,0
25,0
30,0
35,0
40,0
45,0
1985 1990 1995 2000 2005 2010 2015 2020 2025 2030
VC: EU-27 Electricity consumption in TWh/yr
BAU
suboption 1
suboption 2
suboption 3
Figure 7
The graph shows that in 2020 the BAU scenario amounts to around 34 TWh/yr, whereas sub-
option 1 promises a saving of 22,4 TWh/yr. Sub-option 3 saves around 3,6 TWh/yr less, but
still 18,8 TWh/yr (55%). Sub-option 2 saves considerably less, i.e. only 15% in 2020. In 2025
the savings further increase.
Page 31
EN 31 EN
5.2.2. Emissions: Carbon
8,4
10,011,2
13,5
15,715,7
8,7
7,98,1
6,7
13,214,5
14,8
10,4 9,38,9
0,0
2,0
4,0
6,0
8,0
10,0
12,0
14,0
16,0
18,0
1980 1990 2000 2010 2020 2030
VC: EU-27 carbon emissions in Mt CO2 eq./yr
BAU
suboption 1
suboption 2
suboption 3
Figure 8
The picture for greenhouse gas emissions is similar to that of the
electricity consumption, which is the main contributor to the carbon
emissions with vacuum cleaners. In 2020 sub-option 3 saves 6,4 Mt CO2
equivalent and sub-option 1 around 7,8 Mt CO2 equivalent, which are
both substantial savings versus the baseline. The CO2-saving of sub-
option 2 is relatively small, i.e. 1,2 Mt CO2.
5.2.3 Consumer impact
The graph below gives the total annual consumer expenditure on dry vacuum cleaners
(purchase and running costs).
8,1
13,2
17,5
18,3
24,2
29,0
32,629,4
32,1
29,6
32,8
30,0
32,5
0,0
5,0
10,0
15,0
20,0
25,0
30,0
35,0
1980 1990 2000 2010 2020 2030
VC: EU-27 consumer expenditure in bln. Euro/yr
BAU
suboption 1
suboption 2
sub-option 3
Figure 9
The graph shows that, despite the considerable differences in electricity
consumption, the 4 scenarios are very close together. The reason is that
for this product the purchase price and - to a lesser degree - the
Page 32
EN 32 EN
disposables play a more important role in the expenditure than the
electricity consumption.
Overall the effect on consumers should be beneficial as the reduction in their energy costs
should offset a modest increase in purchase price. It will also guarantee a reasonable level of
performance and give health benefits from the limit on dust re-emissions. At the cheapest end
of the market, it is possible that the price increases will be more significant, but even here it
should be easily offset by lower energy costs.
5.2.4 Business economics
The graph below gives the projected sales value in billion EUR per year of the baseline and 3
sub-options. It is estimated that sub-options 1 and 3 cause the highest production costs and
thus the highest sales value at equal unit sales. At ultimately a price level of around € 270 per
VC the sales value is around 20% higher than at the baseline (€ 225 per baseline unit). Sub-
option 2 requires considerable less investment in new components and the sales value is
estimated to be relatively lower than sub-options 1 and 3.
17,0
20,6
22,718,5
24,7 27,3
4,0
8,4
12,2 12,2
22,0
24,8
27,3
0,0
5,0
10,0
15,0
20,0
25,0
30,0
1980 1990 2000 2010 2020 2030
VC: EU-27 sales in bln. Euro/yr
BAU
suboption 1
suboption 2
suboption 3
Figure 10
The graph and table below give an estimate on how the revenues from the sales are divided
over EU-trade and industry.
Page 33
EN 33 EN
8,2 9,9 8,8 9,9
8,910,6
9,510,6
3,5
4,23,7
4,2
0,0
5,0
10,0
15,0
20,0
25,0
30,0
BAU sub-opt 1 sub-opt 2 sub-opt 3
bln
. Eu
ro
2005
.
sub-options
VC: EU27 Turnover Industry & Trade 2020, in bln. €
VAT prod
Retail
Industry
Figure 11
Table 6.
TURNOVER 2020 (million€*/a)
BAU sub-opt 1 sub-opt 2 sub-opt 3
Industry 8,2 9,9 8,8 9,9
Retail 8,9 10,6 9,5 10,6
VAT prod 3,5 4,2 3,7 4,2
subtotal purchase costs 20,6 24,7 22,0 24,7
Electricity costs 5,8 2,0 4,9 2,6
Disposables (bags) 2,7 2,7 2,7 2,7
Total costs consumers 29,0 29,4 29,6 30,0
5.2.5 Competitiveness proofing (CP)
Competitiveness Proofing is described in Commission Staff Working document SEC (2012)
009141
as a complementary instrument to reinforce the overall assessment of economic
impacts of a new proposal with a better account of impacts on enterprise competitiveness at
sector and aggregate level by identifying, and – where proportionate – by quantifying the
likely impacts of the new proposal in three dimensions of enterprise competitiveness, i.e.
costs, capacity to innovate and international competitiveness [of the European industries].
Unfortunately for the VC sector not enough data are available for quantification and thus the
following describes the three dimensions only qualitatively:
While the proposed measures will remove a high percentage of models from the market, the
effect of this will be limited as the technical analysis in the Ecodesign study suggests that the
costs of redesign to meet proposed requirements is not particularly great. In fact one recent
test suggested (albeit on a small sample) that most current models could meet the
requirements simply by reducing the power of the motor (5 out of 6 models would conform to
the requirements with a motor of 500W).
41
http://ec.europa.eu/governance/impact/key_docs/docs/sec_2012_0091_en.pdf
Page 34
EN 34 EN
EU-industry is firmly convinced that strong measures both on the energy and the performance
side will have a positive impact on their competitiveness and their innovation capacity. It
will ban inefficient the low-cost imports which have had a highly negative impact on
profitability and has forced manufacturers (in order to survive) to choose OEM suppliers from
Asia to do most of the manufacturing. The EU-industry focus is now on distribution and sales,
R&D, marketing and management. Manufacturers have indicated that they will gladly carry
the (modest) costs of printing costs and handling, because in fact the label and the proposed
minimum requirements are seen as having a positive impact on competitiveness. The price of
labelling, at costs of less than € 0.10 per label and thus less than € 4.5 million for the sector, is
a price the industry is happy to pay.
On the international market EU direct exports are modest (less than 4 million units) when
compared to Chinese sales into the EU (perhaps 30 million units). It is not clear that the
measures will have any significant effect on these numbers. Indirectly if third countries follow
the EU lead, this would probably help EU producers’ competitiveness.
5.2.6 Effect on SME (manufacturing)
The move to low-labour cost countries has had a negative impact not only on employment of
manufacturers, for which only anecdotal data are available, but most certainly also on the
European SMEs that previously supplied the product-parts to the vacuum cleaner
manufacturers. If the measures reverse the decline in EU manufacturing of vacuum cleaners,
this will no doubt also help (SME) producers of components.
5.2.7 Effect on distribution channels
Between 1990 and 2010 the total consumer expenditure for vacuum cleaners, both acquisition
and running costs, has more than doubled from € 8 to 18 billion. Up to 2025 it is not expected
that this trend will cease (with or without measures). The figure shows total consumer
expenditure to be more or less equal for the baseline and all policy scenarios.
The measures should ensure that the consumers will spend less money on energy, but instead
use some of the savings on buying long-lasting high quality machines. It is possible that the
higher acquisition costs will also halt the growth of the penetration rate but because this is by
no means proven, a continuation of the trend is projected to continue. Taken together, these
factors will probably mean that the measures will increase the value of sales, so benefiting
distribution channels. As there is a relatively large proportion of SMEs in these channels it
should also benefit them.
5.2.8 Effects in third countries
The process for establishing ecodesign requirements has been fully transparent, and after
endorsement of the regulation by the Regulatory Committee a notification under WTO-TBT
will be issued.
As mentioned, the market is dominated by a handful of players. For that, it is relevant that the
requirements in the EU do not dramatically differ from the rest of the world. This has been
investigated and it is found that the proposed level is ambitious but realistic. No competitive
disadvantages for EU manufacturers exporting affected products to third countries are
expected.
There are very few regulations on vacuum cleaners in third countries. Apart from some
legacy, i.e. no longer active, voluntary label efforts, only South-Korea seems to be active in
this field. The way how EU-measures in the field would affect third countries is difficult to
predict. The EU has often been leading in standardisation and energy labelling and it is thus
likely that many countries like China would follow the EU example. This will strengthen the
Page 35
EN 35 EN
global effort of fighting low-efficiency appliances. In the short term this will constitute a
negative impact for manufacturers of these low-efficiency appliances around the globe. On
the long run, the production of high-quality appliances, once they have made the transition,
will also allow them to be more profitable.
5.2.9 Social impacts: Employment
The analysis shows positive employment impacts for the considered sub-options (see graph)
16 20 18 207 9 8 9
127
152135
152
0
20
40
60
80
100
120
140
160
180
200
BAU sub-opt 1 sub-opt 2 sub-opt 3
job
s x1
000
sub-options
VC: est. EU27 Employment 2020, in 1000 jobs
Retailers
OEM
Manufacturers
Figure 12
Table 7.
EU-27 EMPLOYMENT 2020 (jobs x 1000)
BAU sub-opt 1 sub-opt 2 sub-opt 3
Manufacturers 16 20 18 20
OEM 7 9 8 9
Retailers 127 152 135 152
Total jobs 150 180 160 180
5.2.10 Territorial impact
Territorial impact assessment (TIA) is one of the possible elements of the impact assessments.
As stated in a recent presentation of the Commission services42
, TIA is only required when
the policy explicitly targets a (type) of a region and/or the policy targets some regions or areas
more than others. In the case of the ecodesign policy for vacuum cleaners, these conditions do
not apply and thus the TIA is not appropriate.
5.2.11 Administrative costs for Member States
The form of the legislation is a regulation which is directly applicable in all Member States.
This ensures no costs for national administrations for transposition of the implementing
legislation into national legislation.
42
Dijkstra, Lewis (European Commission, DG Regio), “Assessing territorial impacts as part of the
general impact assessment guidelines, presentation ESPON Workshop, 6 June 2012.
Page 36
EN 36 EN
The Impact Assessment on the recast of the Energy Labelling Directive SEC(2008) 2862
calculates the administrative burden of introducing a new implementing Directive, similar to
the proposed to the ecodesign implementing measure, in accordance with the EU Standard
Cost Model.
It estimates the administrative cost of implementing measures in the form of a Directive at €
4,7 million of which € 720.000 for administrative work on the amendment/development of the
new Directive and €4 million for transposition by Member States. It follows that the
administrative cost of an implementing Regulation - as is currently proposed - would save € 4
million in avoiding the transposition cost.
Administrative costs of enforcing the Regulation are difficult to estimate. Enforcement could
involve random spot-checks by the authorities, but from experience with other regulations of
this type most spot-checks are not random but follow indications of competitors or third
parties (e.g. industry or consumer associations). In those cases, the probability of not only
recuperating testing costs and legal costs, but also of collecting fines is high. Therefore, no
extra enforcement costs for Member States are anticipated from the measure.
Also for business, extra administrative costs, if any, will be modest. In current practice, VCs
are subject to efficacy and performance tests for a number of reasons (CE-marking, client
specification, etc.). The proposed Regulation will not change this situation. There is no
difference in this respect between various sub-options.
5.2.12 Specific impact of production phase: durability requirements
The preparatory study calculated that if durability of all vacuum cleaners is increased by 50%
(for 8 years to 12 years) annual reduction of the following environmental impacts over the life
cycle of VC (in stock across all EU, 2005 data, compared to BAU scenario) would occur:
non-hazardous waste generation: reduction by around 18% (or 170,000 tonnes)
hazardous waste generation: reduction by around 27% (or 22,000 tonnes)
emission of particular matters: reduction by around 30% (or 11,000 tonnes)
some smaller reduction in other impacts, such as emission of heavy metals and PAHs
While upfront cost to consumer would increase, annual Life Cycle Cost (including upfront,
running and any repair costs) for consumers will be reduced compared to the BAU scenario.
There are no excessive costs for industry, because a large part of the vacuum cleaners
currently produced does not show pre-mature failure on hose and/or motor and such
appliances are affordable.
There could be a trade-off between durability and energy savings in the use phase as more
durable products may delay sales of newer, more efficient products. Such trade-off can be
avoided by introducing durability requirements only at a later stage once also stringent energy
efficiency requirements apply. This would also give time to the industry for any re-design of
their products for these requirements.
5.3 Summary economic, social and environmental impacts
The table below gives an overview of the most important savings for the 3 sub-options versus
the baseline.
Table 8a. Savings 2020
Sub-
option 1
Sub-
option 2
Sub-
option 3
Versus Baseline
Page 37
EN 37 EN
TWh saving in 2020 22,4 5,2 18,8
Accumulative TWh saving 2011-2020 134,6 31,1 112,9
Mt CO2 saving in 2020* 7,7 1,2 6,4
Accum. Mt CO2 saving 2011-2020 46,4 7,1 38,2
El. costs saving in 2020 (in billion Euro) 3,8 0,9 3,2
Accum. el.costs saving 2011-2020 (billion
Euro) 22,6 5,2 19,0
Extra purchase cost in 2020 (in billion Euro) 4,1 1,4 4,1
Accum.extra purchase cost 2011-2020 (billion
Euro) 24,7 8,2 24,7
Total extra cost in 2020 (in billion Euro) 0,4 0,5 1,0
Accum. extra costs 2011-2020 (billion Euro) 2,1 3,0 5,8
Table 8b. Savings 2025
Sub-
option 1
Sub-
option 2
Sub-
option 3
Versus Baseline
TWh saving in 2025 29,6 10,8 27,4
Accumulative TWh saving 2011-2025 273,9 100,1 253,4
Mt CO2 saving in 2025* 7,6 0,8 6,8
Accum. Mt CO2 saving 2011-2025 70,3 7,7 62,9
El. costs saving in 2025 (in billion Euro) 5,0 1,8 4,6
Accum. el.costs saving 2011-2025 (billion
Euro) 46,0 16,8 42,6
Extra purchase cost in 2025 (in billion Euro) 4,5 2,0 4,5
Accum.extra purchase cost 2011-2025 (billion
Euro) 42,0 18,7 42,0
Total extra cost in 2025 (in billion Euro) -0,4 0,2 -0,1
Accum. extra costs 2011-2025 (billion Euro) -4,0 1,9 -0,5
5.4 Sensitivity analysis sub-option scenarios
At the electricity prices used in the scenarios the extra total expenditure of measures results in
extra costs of 0,4 (sub-option 1), 0,5 (sub-option 2) and 1,0 billion Euro (sub-option 3) in
2020.
Doubling the electricity price these extra costs become savings of € 4 (sub-option), 0,4 (sub-
option 2) and 2,2 billion (sub-option 3). This means that consumers could be making a small
profit of 1,3, 7,3 or 13% but it would not change the priorities or target values.
Doubling the estimated price increase of the product due to measures would lead to an extra €
4,1 (13%) extra costs for the consumer in the case of sub-options 1 and 3 (see Table 8a). For
Page 38
EN 38 EN
sub-option 2 the price increase is 1,4 billion (almost 5%). This may seem significant, but
when taking into account that there is an autonomous production rationalisation driving prices
down - which was not considered in the scenarios - the likelihood of such a steep price
increase is very small.
The introduction of EU energy labelling is supported by all EU stakeholders: industry,
consumer associations and Member States. Prescriptions for internet publication are not new
but merely a requirement in line with what is customary in mandatory energy labelling.
Member States have not indicated their desire to introduce their own stringent requirements
for vacuum cleaners.
As regards the external societal costs, they are mostly linked to electricity consumption. They
would add in the order of magnitude of 10% of electricity costs, but would hardly
differentiate between the scenarios.
All in all, it is considered that the scenarios are robust.
6. CONCLUSIONS
Following the principle of proportionality in the analysis, policy options 1 to 4 were discarded
at an earlier phase of the analysis.
The analysis shows that the combined MEPS/Label sub-options offer the best energy savings
and strongest reduction in CO2. Sub option 2 provides substantially smaller savings than the
other 2 options. The differences between the other MEPS/Label sub-options are smaller.
While sub-option 1 provides highest savings by 2020, its introduction may cause difficulty for
manufacturers as the 750W 'power cap' may represent the limit of what can be achieved for
the normal canister model. Manufacturers and so consumers may be pushed towards 'upright'
or 'stick' models that are less easy to manipulate, and make it difficult to vacuum under
furniture, or on vertical or other surfaces. However, manufacturers have participated in the
development of the new efficiency measurement method and have been aware of the possible
forthcoming requirements since the start-up of the preparatory study in 2006. Consequently,
the MEPS/Label sub-option 3 is considered to offer the optimal solution between fast savings
and minimum strain for the industry.
The additional option on increasing the durability of vacuum cleaners is also considered
desirable in terms of reduction of environmental impact and reducing annual life cycle costs
to users/consumers while they do not seem to entail excessive upfront costs for consumers nor
industry. In order to eliminate or minimise any small negative impacts on energy during the in
use phase, it is recommended that durability requirements are introduced at the second tier of
requirements only.
Finally, most vacuum cleaner manufacturers are global companies. SMEs are considered to be
only significantly present in the wholesale and especially retail sector. The analysis shows
that the policy options will have no negative impact on them. On the contrary, they would
benefit from a stronger demand for new technologies and a higher turnover.
The comparison of options and sub-options shows that the appropriate policy option for
realizing the improvement potential of vacuum cleaners is a Commission Regulation setting
ecodesign requirements combined with an Energy Labelling delegated Regulation to guide
customers towards the most efficient appliances. The ecodesign requirements would be set in
two tiers with entry into force two and four years after publication of the measures
respectively, and the labelling requirements one year after the proposed regulation has entered
into force. Within this option, the scenario analysis shows that the saving for sub-option 3 is
16% less than for sub-option 1 but is still very substantial. At the same time sub-option 3
Page 39
EN 39 EN
avoids the negative impact on functionality, affordability and competitiveness of sub-option 1,
i.e. cutting out all current domestic canister models. Compared to sub-option 2, sub-option 3
yields substantially higher savings and is thus preferred.
This approach ensures that:
– the least energy efficient vacuum cleaners will be removed from the market,
increasing competition on energy efficiency instead of price and additional features;
– on-going energy improvements are fostered by setting a transparent legislative
framework that will provide the industry with the long-term security needed to invest
in innovative technology;
– information on product differentiation provides consumers with an effective and
reliable tool to compare energy consumption of products in an economic setting
where there is demand for energy efficient appliances;
– cost-effective potentials to reduce the electricity consumption of vacuum cleaners are
quickly realized leading to at least 60%43
increase in average efficiency;
– by 2020, the annual electricity consumption and CO2 emissions of vacuum cleaners
will be reduced by 19 TWh and almost 6 Mtons of CO2 compared to a business as
usual scenario (2025 27 TWh and 10 Mtons CO2);
– significant material savings and reductions in life cycle costs for consumers are
achieved;
– a clear legal framework for product design leaves flexibility for manufacturers to
achieve the efficiency levels; and gives them a level playing field, ensuring fair
competition and free circulation of products.
– requirements for vacuum cleaners are harmonized in the Community, leading to a
minimization of administrative burdens and costs for the economic operators;
– market failures are corrected and the internal market functions properly;
– that the specific mandate of the Legislator is respected;
– a reduction in accumulated electricity consumption by 2020 amounts to 113 TWh, 38
Mt of CO2 at a reduction in electricity costs of € 3,2 billion/yr in 2020 versus the
baseline. For 2025, at complete stock change after stage 2 of the measures, the
accumulated savings are more than twice as high. The saving on electricity costs, at a
higher rate than in the period before 2020, is also more than twice as high.44
– costs for re-design and re-assessment upon introduction of the regulation, which are
limited in absolute terms, and not significant in relative terms (per product);
disproportionate burdens for manufacturers are avoided due to transitional periods
which duly take into account redesign cycles;
– the measures have no significant impacts on the competitiveness of industry, and in
particular SMEs.
– the measures have positive impact on employment, in particular for SMEs.
43
The average power input of domestic vacuum cleaners was about 1700W in 2010. Introduction of
measures will boost reduce this to around 1050 W without affecting performance in the medium term (a
60% increase in efficiency)and higher savings on the long term. 44
After 2010 an escalation rate of 4% is applied for electricity prices (see also www.meerp.eu)
Page 40
EN 40 EN
As laid out in Section 7 of the impact assessment, monitoring of the impacts will mainly be
done by market surveillance carried out by Member State authorities ensuring that the
requirements are met, whereas the appropriateness of scope, definitions and concepts will be
monitored by the on-going dialogue with stakeholders and Member States.
7. MONITORING AND EVALUATION
The appropriateness of scope, definitions and limits will be reviewed after maximum 5 years
from the adoption of the measure (as required by Annex VII.9 of the Ecodesign Directive and
laid down in the implementing measure). Account will be taken also of speed of technological
development and input from stakeholders and Member States. Compliance with the legal
provisions will follow the usual process of ‘New Approach’ regulations as expressed by the
CE marking.
Compliance checks are mainly done by market surveillance carried out by Member State
authorities ensuring that the requirements are met. Further information from the field as e.g.
complaints by consumer organisation or competitors could alert on possible deviations from
the provisions and/or of the need to take action.
Input is also expected from work carried out in the context of upcoming ecodesign activities
on further product categories and related activities.
Page 41
EN 41 EN
ANNEX A
MINUTES OF CONSULTATION FORUM MEETING 2010
CONSULTATION FORUM ON VACUUM CLEANERS – JUNE 25, 2010
DRAFT MINUTES
The Chairman informed that a working document had been circulated prior to the meeting.
This session would focus at the most fundamental questions relating to the ecodesign and
energy labelling of vacuum cleaners (VCs). There will later be a 2nd
consultation forum based
on a more concrete text on VCs.
SCOPE
On the scope, the Commission staff informed that the intention was to cover both domestic
and commercial VCs. A distinction between the two could be made by applying the low
voltage directive (household) and the machinery directive (commercial). Industrial VCs, wet
and dry VCs, carpet cleaners, robot VCs and central VCs should all be excluded. Large
battery VCs and wet filter VCs could be included when measurement methods allows it.
Battery driven VCs
ECOS asked whether battery handhold models are covered by standby or battery charges
regulations.
DE agreed that there is a problem of measurement methods. These should be developed
before the product is included.
CECED informed that if the appliance has a plug in, there is a limit on the standby
consumption. When the battery is used, it will not be under the definition for standby
Robot and central VCs
ECOS suggested to include robot VCs in the revision of the legislation.
NL pointed out that robot and central VCs should be included if the scope is defined from
functionality. Robot and central VCs would compete with normal VCs and may in that respect
need a labelling.
CECED wanted robot and central VCs to be included in a later stage as the current
measurement methods do not allow the comparison of models.
The Commission staff informed that robot VCs have not been looked at by study and could
not yet be covered in terms of current measurement standards. They may however be included
in the revised legislation. The central VCs have the same function as a normal VC but its
energy consumption would depend considerably on the particular installation and is hence
more difficult to measure.
Commercial and domestic VCs
NL and DE suggested all VCs in the scope to have a label as it might be difficult to
distinguish between domestic and commercial VCs.
DE added that the labelling of commercial products is a horizontal question and should be
discussed on a horizontal level.
ICMMA (The Industrial Cleaning Machine Manufacturer's Association) supported having
the same requirements for domestic and commercial VCs
NOISE
Page 42
EN 42 EN
The Commission staff presented different policy options with regard to the labelling and
ecodesign requirements on noise. On the energy label, a dBA-figure or an A-G scale could be
given. An alternative could also be to set an ecodesign limit on noise as the impact is quite
significant.
Ecodesign
UK did not see noise as particularly relevant for the product and suggested setting an
ecodesign limit using a dBA limit, if to set a limit at all.
DE gave its support and suggested a limit of 80 dBA.
IT and CECED said that a limit on noise should not be too strict.
AU welcomed having an ambitious ecodesign limit for noise.
DK wanted the correlation between noise and energy consumption to be further studied.
Energy consumption should be considered more important of the two.
CECED could confirm there is a link between the two.
Energy label
F, BE, I, ENV NGOs and CECED asked for the level in dBA on the label.
ENV NGOs, CECED and BE, F added that an A-G scale could be confusing for the
consumer as there would be a risk of having too many scales.
AU said one should be careful not having too many scales on the label, but a noise scale could
be helpful.
I commented that as it will now be mandatory on the label to show the numbers, Member
States and others should start measures to explain what the figures mean.
DE emphasized that all products to be treated in the same way with regard to the labelling of
noise.
Filtration efficiency
The Commission staff informed about the negatively health impact by small particulates of
dust. A question raised was whether a very good filtration of a VC would make a significant
improvement on the dust level or whether the most important would be to vacuum more
regularly. It was asked whether filtration should be presented as a figure for re-emission or
filtration, in percentage or as an A-G scale and whether there should be an ecodesign limit.
Ecodesign
CECED and the ENV NGOs stated that an increased retention level would also increase the
energy consumption.
ENV NGOs added that the fiche needs to inform about the size and kind of particles.
BE suggested to have a reasonable, but not too strict limit in order to guarantee a high level of
filtration efficiency.
Energy labelling
CECED meant that a classing system for filtration efficiency would trigger increased energy
consumption as consumers without a specific need would opt for class A.
DE and BE said that a labelling of filtration efficiency could run the risk of not being
understood by the consumer.
Page 43
EN 43 EN
BE added that giving an absolute value of mg/M³ could be more understandable for the
people affected.
Cleaning performance
The Commission staff informed about different ways of measuring cleaning performance. In
the current standard, 5 double strokes are used to see how much dirt is removed from a
standard hard floor or carpet. Fewer double strokes (2 or 3) might be closer to reality.
Alternatively one can measure how many double strokes are required to reach a certain level
of cleanliness (65 % for carpets and 95 % for hard floors). The label could give an A-G scale
or a percentage figure separately or combined for hard floors and carpets. More information
can alternatively be given in the fiche. The question was raised whether one should set limits
on cleaning performance.
Measurement method
NL asked for a measurement method that is reliable and repeatable. This is more important
than having a realistic measurement method as long as the ranking stays the same.
F meant it did not matter much whether one used 2 or 5 for the measuring as one will
compare the different products with each other.
DK stated that the measurements should be as realistic as possible, hence supported 1-2
double strokes.
CECED and ICMMA agreed that 2 double strokes would be more realistic, but informed that
a measurement would be more accurate with 5 double strokes as the standard deviation is
lower. The hierarchy of the performance would however be the same.
The Commission staff agreed that the data from the recent round robin test would give a
clear indication of the relative reproducibility and repeatability of different measurements
using numbers of strokes .
Ecodesign
F stated that limits might not be too useful.
DE and DYSON supported ecodesign requirements for cleaning performance.
Energy labelling
AU, BE, DK, DE, F, CECED asked for one scale for cleaning performance hard floors and
one scale for cleaning performance on carpets.
NL supported having an A-G scale, but a differentiation between hard floor and carpet could
be made in the fiche.
ECOS was concerned that consumers would look firstly at cleaning performance and then at
the other parameters on the label. Consumers should be educated so as to use a more efficient
VC less. This could be done by showing the number of double strokes to reach a reference
level of cleanliness or by indicating the time needed to clean a certain surface.
CECED replied that informing about a VC's cleaning performance would allow consumer's to
change behaviour.
Energy consumption
The Commission staff informed that there is close link between the discussion on cleaning
performance and the one on energy consumption. There is however no good knowledge on
how performance of VCs affect their use. Energy consumption can be measured by
vacuuming a certain area with a given number of double strokes or as in the current standard
Page 44
EN 44 EN
by reaching a reference level of cleanliness for hard floors and carpets. Energy consumption is
then calculated by the fractional number of double strokes needed to reach the given level.
Measuring energy consumption in a certain area and with a certain number of double strokes
is simpler in terms of reproducibility and repeatability. By incorporating the performance, the
reproducibility and repeatability would go down.
Measurement methods
ECOS asked for clarification on what programs and levels are used for the assessment of
energy consumption. The measurements should be done as close as possible to reality.
NL said that the most important would be to have reliable and reproducible measurement
methods.
CECED explained that measurements in the current standard are done at the maximum power
for the appliance and with the nozzle recommended by the manufacturer for hard floors and
carpets.
Energy labelling and ecodesign
DE, CECED and ICMMA supported having a combination of performance and energy
consumption. Such a method would secure that high input power appliances would not be
allowed to reach the higher classes.
NL, ECOS and DYSON preferred to set caps on the electric power.
ECOS added this would be easier to measure than a mixed measure of energy consumption
and cleaning performance.
CECED replied that such a measure would leave little flexibility to manufacturers.
NL asked for more information on the different proposals for the measurement of energy
consumption and how to derive a scale.
CECED invited all stakeholders who are interested to have bilateral discussions with them for
clarification.
Page 45
EN 45 EN
ANNEX B
MINUTES OF CONSULTATION FORUM MEETING 2011
CONSULTATION FORUM ON VACUUM CLEANERS – September 8, 2011
DRAFT MINUTES
The Chairman informed that a working document had been circulated prior to the meeting.
This gave detailed proposals for both Ecodesign and Energy Labelling measures. It was
agreed that the meeting would deal with the Ecodesign and Energy Labelling jointly as in
most cases the technical issues would be similar. The Commission gave a presentation which
was the basis on which these discussions would be organized.
SCOPE
On the scope, the Commission staff informed that the intention was to cover both domestic
and commercial VCs. A distinction between the two could be made by applying the low
voltage directive (household) and the machinery directive (commercial). Industrial VCs, Wet
VCs (which spray liquid)
ANEC felt that there should battery vacuum cleaners should be dealt with at some stage.
DE mentioned that measurement methods for battery operated appliances were missing.
ECOS felt the revision clause should deal with the excluded categories.
EU Cleaning suggested that commercial appliances with large heads (more than 50cm)
should be excluded. There should be a definition of 'large battery operated models', which
should be dealt with in a second stage.
The European Power Tool Association explained that 'industrial' vacuum cleaners included
products supplied with power tools to remove the dust produced by cutting grinding etc. and
could not be directly compared with general purpose machines. Many of them also had to deal
with hazardous dust.
CATEGORIES
The Commission staff explained that it was not proposed to distinguish between any
'technical' categories (such as canister v. upright; motorized brushes; bags v. bagless (cyclone
etc) as all the products were performing the same function. There was a need to allow for VCs
designed for general use with those either for hard floor only, or for carpets only (used by
customers whose floors were either all carpeted, or 'hard'), As there were a number of such
products, and it would not be reasonable to set requirements for example related to a hard
floor vacuum cleaner performed on carpet (or vice versa).
EU cleaning agreed that the measures would need to be adapted to allow for such machines.
Impacts
The Commission staff explained that the main environmental impacts of vacuum cleaners
were energy use, noise, increased hygiene (from cleaning their primary function) and small
particulate dust (where they removed such dust and so lowered levels in the internal
environment).
Noise
The Commission staff explained that it was not proposed to have an Ecodesign limit for
noise, but the dBa figure would be included on the label.
Page 46
EN 46 EN
DE suggested there should be a noise limit, and suggested a figure of 77dBa. Austria agreed.
Belgium suggested a figure of 76 dBa. Cenelec noted that the test standard would be available
soon. Dyson suggested that it was not only the sound power level, but also its quality that was
important. CECED had sympathy with the idea of a noise limit, and noted that that for
commercial vacuum cleaners the Machinery Directive defined limits, which should be
followed. They also noted that it was perhaps the vibration transmitted to the floor that was
most important, rather than the sound power emitted to the air.
Dust re-emission
The Commission staff explained that this was important in reducing the level of small
particulate dust in the indoor environment so reducing the health damage they cause. The
working document included a limit of 3% for the particle size range of 0.4 – 4 microns. The
Energy Label would include a dust re-emission figure.
DE suggested a tougher limit of 2% would be preferable. Austria and Sweden agreed. The UK
suggested a tough limit perhaps as low as 1%.
ANEC/BEUC suggested 0.3µ would be possible, or even 0, 2µ (though with less accuracy).
The level of the smallest particles was important, as these had the most health impact. The
limit should be strict for example 1% in phase 1 and 0,4% in phase 2.
CECED (BSH) suggested an upper limit on particle size of 20µ would be possible but testing
for particles smaller than 0.3-0.4µ would be difficult.
Cleaning Performance
The working documents proposed that cleaning performance should be measured after 2
double strokes. This was less repeatable and reproducible than measurements after 5 double
strokes, but the proportionate difference would probably diminish as more experience was
gained, and the accuracy was probably sufficient for a performance declaration.
DK mentioned that 2 double strokes was quite close to real life vacuum cleaner use. The test
accuracy would be acceptable, particularly if repeated. There should also be an Ecodesign
limit on cleaning performance.
DE would like to use 5 double strokes for testing cleaning performance, and there should be
an Ecodesign limit. Measures based on 5 double strokes would be enforceable; any on 2
double strokes would not.
ECOS wanted a performance limit on cleaning performance. They felt that test using 2
double strokes were closer to real use, and could provide reasonably accurate results.
Cenelec suggested that the ring test implied that it was not realistic to use 2 double strokes,
and that performance tests at 5 double strokes would give more repeatable and reproducible
results.
CECED, NL, ECMA agreed with Cenelec
Dyson agreed that 5 double strokes gave more reliable results. However, tests should also be
done with (half) full dust receptacles. The performance of vacuum cleaners decreased as they
filled up with dirt. This reduction varied considerable between machines (with in general a
greater reduction in machines with dust bags as opposed to 'bagless' cyclone machines).
ANEC supported this point.
The Commission staff concluded that the majority of the consultation forum favoured the
use of 5 double strokes for performance testing as it was more reliable albeit further from real
life use.
Page 47
EN 47 EN
Minimum Performance Requirement
The UK had doubts whether this should be included in the Ecodesign measure, indication on
the label was sufficient.
The NL considered it should be there but not at too high a level. DE agreed.
EUcleaning felt labelling information only would be sufficient.-
Push Force
The Commission staff explained that the working documents included a factor which
increased the 'cleaning time' and so the annual energy consumption of those machines which
require a high push force (of over 25 Newtons). This could be interpreted as saying that if the
machine were too hard to push, users would move the machine more slowly, and so energy
consumption would increase.
DE was not convinced that push force was a relevant factor. BE agreed.
FR suggested as it should not be included as this would be too complex.
ECOS suggested that the reasoning was somewhat speculative, and suggested it should be
considered in any revision.
Cenelec mentioned that the current measurement method does not deal with push force.
NL felt that push force should be included. In practice measurement should not present a
problem. It might be better to set an upper limit. A level of 30 Newtons would be more
appropriate.
Austria suggested it could be included on the label.
The UK suggested it should not be included in the Ecodesign measure.
Page 48
EN 48 EN
Energy Consumption
The Commission staff explained the formula for estimating annual energy consumption used
in the working document, and compared it with the formula suggested by CECED. The main
difference related to how users reacted to difference in cleaning performance in different
vacuum cleaners. The working document was based on the premise that at least for machines
with average or better cleaning performance, they still vacuumed for an average equivalent to
2 double strokes, though it was plausible that with very low performance machines they
would clean for longer. A small test by Dyson backed this up. The formula suggested by
CECED implied that with high performance machines users would only vacuum for as little
as 1 double stroke. It also involved the extrapolation of the performance of vacuum cleaners
after as few as 1 or 2 double strokes, information which many stakeholders considered
unreliable (see cleaning performance above).
CECED explained their suggestion, but agreed that it might be possible to come to a solution
that took account of possible changes in user behaviour depending on cleaning performance,
but using cleaning performance measured at 5 double strokes, and with less variation in
cleaning time than was suggested by their formula.
They also expressed concern that the Commission formula would allow very low performance
vacuum cleaners with very low input power to gain an A label for Energy consumption, albeit
with a G for cleaning performance. This could confuse consumers, as in practice such
machines would not clean.
There was a general discussion on the respective formulae, and it was agreed that further
discussions were needed to see if a better formulation could be arrived at.
Page 49
EN 49 EN
ANNEX C
FINAL STAKEHOLDER MEETING PREPARATORY STUDY, JAN. 2009
Summary of Final Stakeholder Meeting, EuP Vacuum Cleaners
Brussels, 19 January 2009
Present:
Mathew Kestner, European Commission (Chair)
Martin Buchele, European Commission
Laurent Caro, Groupe SEB
Maya de Groot, Federale Overheidsdient Volksgezondheid
Harry Langdon, Numatic
Hakan Messler, Electrolux
Sandra Mueller, BSH
Peter Mueller-Baum, United Cleaning
Dietlinde Quack, Oeko Institute
Matteo Rambaldi, CECED
Morris Rollo, Hoover
Harald Schellenberg, BSH
Wolfgang Siefert, Miele
Paul van Wolfren, Philips
Steffen Reiser, Kaercher
Steve Ogilvie, AEA (Project manager)
Grahame Capron-Tee, Intertek
Chris Evans, Consumer Research Associates
Phil Dolley, AEA
Purpose of the Meeting:
To review the consultant’s findings and the technical assessment contained in Task 7. If time
allowed, Task 8 to be discussed.
Discussion
a) Tasks 1 to 6 – further comments were requested, none were raised. The presumption was
that stakeholders are content with the findings of Tasks 1 to 6.
b) Task 7 – SO gave a brief presentation of the key findings and results. Several questions
were raised:
Is it possible to go beyond 40% efficiency?
Key limitation is fan design and its influence on fan efficiency. If more attention was paid to
developing more refined fan blades then efficiency gains could be realised. Stakeholders
queried the assumed cost increment for such design saying there would be significant tooling
costs and some material costs per fan.
Other design types are possible such as coaxial fans and displacement technology. Both
would result in physically larger vacuum cleaners though. Neither is being considered for
production.
Robot designs are expected to increase market share in coming years. They may evolve to be
able to sense the amount of dirt present and alter their energy consumption accordingly.
There may be some efficiency to be gained in motor design (e.g. switched reluctance motors
with electronic control) but the consultant’s work has assumed that current technology
remains dominant for some years to come, only such switched reluctance motor powered
vacuum cleaner design exists for sale on the Japanese market but is very much a premium
price product. For reasons of cost, stakeholders agreed. Lower speed, higher torque motors,
whilst an option, would require up to an additional 40% by weight of materials and cost
perhaps up to an extra five euros . .
Page 50
EN 50 EN
How was BNAT chosen?
Difficult area to discuss as producers are unwilling, for obvious reasons, to discuss their R&D
work. The identified BNAT solutions are those that the study team’s experience of VC
development has allowed them to identify.
How did the consultants identify consumer behaviour parameters (hours spent cleaning etc)?
From the limited information available and in discussion with stakeholders at earlier
meetings. Experience from surveys in the USA also suggests that consumers typically spend
around an hour a week cleaning. Whilst all parties accept the same for Europe the ideal would
be for a European survey to be conducted. This would have additional benefits – for example,
it would help correlate test method protocols with actual cleaning behaviour - a subject
presently not well understood.
The above discussion was completed with plenty of time remaining. MK remarked that he
was pleased with the Task 1 to 7 work and the input stakeholders have made facilitating such
an efficient discussion today. MK progressed the meeting to discuss Task 8.
c) Task 8 – SO gave a brief presentation of the key findings and results. There are a number
of key issues for EuP implementing to take into consideration:
that VC ownership is increasing,
that input power ratings have increased markedly since the 1970s,
energy efficiency has decreased over this period,
CECED has developed proposals for an Energy Label,
Current EN test standards are flawed,
There is good technical potential for achieving energy savings,
These savings can be won at little cost to producers and significant savings to
consumers,
Technology developments can be accommodated within existing design cycles.
Broadly the discussion centred on:
Limiting rated input power (caps). Some stakeholders oppose caps arguing that high
power allows consumers to clean to a certain level more quickly.
Others are supportive if the time frame for implementation was adjusted to a later
date. MK remarked that additional market data would be helpful to inform the
Commission what the outcome of a cap might be.
Active brush head. Canister VCs can achieve better cleaning performance with a
motorised head. MK asked the consultants to include active brush heads in the
scenario work – what are the benefits and costs?
A proposal for an Energy Label. Both the consultants and CECED have identified
that an Energy Label would drive product improvement. However, the two
approaches differ in one key regard; that CECED’s proposal combines energy
consumption and cleaning performance into a single parameter. The consultants
argue that the assumption that consumers will change their behaviour and use high
powered VCs for less time is questionable. It is more likely that consumers will
continue to use their VC for the same length of time.
DQ advised that consumers would want energy and cleaning performance kept
separate. CE remarked that there is a precedent for this in the Energy Label for
Page 51
EN 51 EN
washing machines where energy, cleaning and drying performance are all separate
items leading to very good designs being ‘triple A rated’. DQ added that consumers
would also want additional information e.g. regarding noise and dust emissions
included in the Energy Label.
Test methods. The proposed CENELEC Working Group method produces an
average result of the testing on a carpet and a hard floor. Results are skewed by the
hard floor test where it is not uncommon for VCs to achieve 105% or higher. The
issue is recognised and accepted by some stakeholders. It was noted that the ASTM
method uses four different carpet types so producers cannot ‘tune’ their VC to a
single type to achieve good performance. MK remarked the Commission will
consider the case for a new test method. GCT added that the correlation between EN
test methods and actual home cleaning is not known.
Carpet cleaning. GCT noted that some carpets are easier to clean than others. MK
remarked that this is part of the ‘system’ – perhaps carpets should be labelled. He
asked the consultants to note the point in their report.
Actions
Task 7 to include a scenario for active brush heads
The effect of an Energy Label to be factored into the scenarios. What might it
achieve if the worst performing products are phased out?
Are there any differences in the way VCs are used in different member states that
need to be considered? The consultants will comment in their report.
The consultants will provide further commentary regarding the perceived need for
updating test methods.
Reported results to make clear whether data and figures refer to rated power or max
input power.
Need to review the proposed definition of commercial vacuum cleaners
MK requested the meeting not to provide feedback on the Task 8 discussion. He said that the
development of policy options was the responsibility of the Commission
Page 52
EN 52 EN
ANNEX D
STOCK MODEL METHODOLOGY & DETAILED RESULTS
The impact analysis uses the variable inputs as defined in the following paragraphs and used
in Chapter 5.
The calculation method for the analysis is a so-called Stock Model, which means that it is
derived from accumulated annual sales of VCs over the period 1990-2020 (with a start-up
period 1986-1990).
The stock-model sets the pace for the sub-options. The direction is determined by trends in
dwelling size, number of households and characteristics (operating hours, W). From these
stock data the fitting sales data were calculated
Outputs for each sub-option are:
Electricity consumption in TWh/a;
Primary energy consumption in PJ/a (conversion 1 TWh electric = 2,5 *3,6 PJ
primary);
Carbon emission in Mt CO2 equivalent/a, using a multiplier based on electricity and
gas shares (see below) and the values from the EcoReport in the preparatory study;
Customer-related economical parameters: purchase price, energy expenditure, repair
cost and total expenditure in € billion/a (2005 Euro, inflation-corrected at 2%/a);
Business-related economical parameters: turnover per sector (industry, trade, etc.);
Employment: calculating job creation/loss using the sector-specific turnover per
employee.
Final outcomes are presented at a high aggregation level (totals), but in the intermediate
stages a distinction is made by the typology and by size.
For the economic calculations, an average energy price in €/ kWh primary energy is built
from:
Electricity rates per kWh primary energy. For electricity, the assumption is to use
industrial (SME) electricity rates excluding taxes in 2006, i.e. € 0,153/kWh;
Annual (long-term 2000-2006 average) electricity price rate increase of 2%.
Data from Chapter 2 and 5 are used for the definition of the base case and calculated on the
basis of the relative market shares of the lamp categories considered. The table below gives
the characteristics of the base-case vacuum cleaners and their substitutes. Note that not all
levels are filled
Table 11 . Economic and mercury-related data used in the stockmodel
ECONOMIC VARIABLES
Rel 0,153 Electricity rate 2006 [€/ kWh electric]
Relinc 0,02 Annual price increase electricity / a
PriceDec 0 Annual product price decrease / a
ManuFrac 0,4 Manufacturer Selling Price as fraction of Product Price [%]
RetailMargin 0,43 Margin Retailer on product [% on wholesale price]
VAT 0,17 Value Added Tax [in % on retail price]
ManuWages 0,1 Manufacturer turnover per EU employee [mln €/ a]
OEMfactor 1,2 OEM personell as fraction of WH manufacturer personell [-]
Page 53
EN 53 EN
RetailWages 0,041 Retail turnover per employee [mln €/ a]
ExtraEUfrac 0,8 Fraction of OEM personell outside EU [% of OEM jobs]
Inflation 0,02 Inflation rate/a
Discount 0,04 Discount rate/a
Page 54
EN 54 EN
The Figure below shows EU27 Electricity rates 2007.
Figure 11.
Page 55
EN 55 EN
The following tables are in addition to the baseline data from Table 3 and give the detailed
results from section 5 for the sub-options in tabular format:
Baseline 1990 2000 2005 2010 2015 2020 2025
€ bln.turnover industry 1,6 3,3 4,9 4,9 6,8 8,2 9,1
€ bln.turnover trade 1,7 3,6 5,2 5,2 7,3 8,9 9,8
€ bln.VAT 0,7 1,4 2,1 2,1 2,9 3,5 3,9
TOTAL
jobs industry 16 33 49 49 68 82 91
jobs OEM 7 14 21 21 29 35 39
jobs retail 25 51 75 75 104 127 140
jobs total 47 99 144 145 201 245 270
jobs EU industry 12 10 10 10 14 16 18
jobs EU OEM 5 4 4 4 6 7 8
jobs EU retail 25 51 75 75 104 127 140
EU jobs total 42 66 89 89 124 150 166
Suboption 1 1990 2000 2005 2010 2015 2020 2025
rated dom. VC power, W 1275 1423 1500 1739 1000 750 750
rated non-dom. VC power, W 929 1107 1200 1293 1000 750 750
electricity domestic, in TWh 9,5 12,6 14,6 18,5 11,6 9,5 10,4
electricity non-domestic, in TWh 2,1 2,7 3,1 3,5 2,9 2,3 2,4
energy total, in TWh 11,5 15,4 17,7 22,0 14,5 11,8 12,8
Mt CO2 electricity 5,8 7,1 8,0 9,5 5,9 4,5 4,6
Mt CO2 other 1,0 1,3 2,1 2,0 2,7 3,5 3,5
Mt CO2 total 6,7 8,3 10,0 11,4 8,7 7,9 8,1
Price 225 225 225 225 245 270 270
€ bln. electricity 1,9 2,6 3,0 3,7 2,4 2,0 2,2
€ bln. disposables 1,7 2,1 2,3 2,6 2,6 2,7 2,7
€ bln. purchase 4,0 8,4 12,2 12,2 18,5 24,7 27,3
€ bln. total consumer expenditure 7,6 13,0 17,5 18,5 23,6 29,4 32,1
€ bln.turnover industry 1,6 3,3 4,9 4,9 7,4 9,9 10,9
€ bln.turnover trade 1,7 3,6 5,2 5,2 8,0 10,6 11,7
€ bln.VAT 0,7 1,4 2,1 2,1 3,1 4,2 4,6
jobs industry 16 33 49 49 74 99 109
jobs OEM 7 14 21 21 32 43 47
jobs retail 25 51 75 75 114 152 168
jobs total 47 99 144 145 219 293 324
of which
Page 56
EN 56 EN
jobs EU industry 12 10 10 10 15 20 22
jobs EU OEM 5 4 4 4 6 9 9
jobs EU retail 25 51 75 75 114 152 168
EU jobs total 42 66 89 89 135 180 199
Suboption 2 1990 2000 2005 2010 2015 2020 2025
rated dom. VC power, W 1275 1423 1500 1739 1900 2000 2000
rated non-dom. VC power, W 929 1107 1200 1293 1200 1200 1200
electricity domestic, in TWh 9,5 12,6 14,6 18,5 22,1 25,4 27,8
electricity non-domestic, in TWh 2,1 2,7 3,1 3,5 3,4 3,6 3,8
energy total, in TWh 11,5 15,4 17,7 22,0 25,5 29,1 31,6
Mt CO2 electricity 5,8 7,1 8,0 9,5 10,5 11,0 11,4
Mt CO2 other 1,0 1,3 2,1 2,0 2,7 3,5 3,5
Mt CO2 total 6,7 8,3 10,0 11,4 13,2 14,5 14,8
Price 225 225 225 225 235 240 245
€ bln. electricity 1,9 2,6 3,0 3,7 4,3 4,9 5,3
€ bln. disposables 1,7 2,1 2,3 2,6 2,6 2,7 2,7
€ bln. purchase 4,0 8,4 12,2 12,2 17,7 22,0 24,8
€ bln. total consumer expenditure 7,6 13,0 17,5 18,5 24,7 29,6 32,8
€ bln.turnover industry 1,6 3,3 4,9 4,9 7,1 8,8 9,9
€ bln.turnover trade 1,7 3,6 5,2 5,2 7,6 9,5 10,6
€ bln.VAT 0,7 1,4 2,1 2,1 3,0 3,7 4,2
jobs industry 16 33 49 49 71 88 99
jobs OEM 7 14 21 21 31 38 43
jobs retail 25 51 75 75 109 135 152
jobs total 47 99 144 145 210 261 294
of which
jobs EU industry 12 10 10 10 14 18 20
jobs EU OEM 5 4 4 4 6 8 9
jobs EU retail 25 51 75 75 109 135 152
EU jobs total 42 66 89 89 129 160 180
Page 57
EN 57 EN
Suboption 3 1990 2000 2005 2010 2015 2020 2025
rated dom. VC power, W 1275 1423 1500 1739 1300 980 880
rated non-dom. VC power, W 929 1107 1200 1293 1300 980 880
electricity domestic, in TWh 9,5 12,6 14,6 18,5 15,1 12,5 12,2
electricity non-domestic, in TWh 2,1 2,7 3,1 3,5 3,7 3,0 2,8
energy total, in TWh 11,5 15,4 17,7 22,0 18,8 15,4 15,0
Mt CO2 electricity 5,8 7,1 8,0 9,5 7,7 5,9 5,4
Mt CO2 other 1,0 1,3 2,1 2,0 2,7 3,5 3,5
Mt CO2 total 6,7 8,3 10,0 11,4 10,4 9,3 8,9
Price 225 225 225 225 235 270 270
€ billion electricity 1,9 2,6 3,0 3,7 3,2 2,6 2,5
€ billion disposables 1,7 2,1 2,3 2,6 2,6 2,7 2,7
€ billion purchase 4,0 8,4 12,2 12,2 17,7 24,7 27,3
€ billion total consumer expenditure 7,6 13,0 17,5 18,5 23,5 30,0 32,5
€ billionturnover industry 1,6 3,3 4,9 4,9 7,1 9,9 10,9
€ billionturnover trade 1,7 3,6 5,2 5,2 7,6 10,6 11,7
€ billionVAT 0,7 1,4 2,1 2,1 3,0 4,2 4,6
jobs industry 16 33 49 49 71 99 109
jobs OEM 7 14 21 21 31 43 47
jobs retail 25 51 75 75 109 152 168
jobs total 47 99 144 145 210 293 324
of which
jobs EU industry 12 10 10 10 14 20 22
jobs EU OEM 5 4 4 4 6 9 9
jobs EU retail 25 51 75 75 109 152 168
EU jobs total 42 66 89 89 129 180 199