Page 1
1Keith Midson Clear Zone Effectiv eness and Crash Risk
Clear Zone Effectiveness and Crash Risk
AuthorKeith Midson BE MTraffic MTransport MITE MIEAust C PEng
Manager Transportation, Tasmania
GHD Pty Ltd
2 Salamanca Square
Hobart TAS 7000
e: [email protected] p: +61 3 6210 0649
Page 2
2Keith Midson Clear Zone Effectiv eness and Crash Risk
Abstract
The provision of an adequate clear zone width is an integral consideration of any road design. There are
a number of references that are used to determine the appropriate clear zone width for a given set of
circumstances in both Australia and overseas. This paper provides an overview and comparison
between various key references on clear zones, as well as providing a background on some of the
fundamental principles and theories behind clear zone provision.
GHD undertook a study for VicRoads that reviewed over 30 road links acro ss metropolitan Melbourne
with varying functional classifications, speed limits and clear zone widths. The run-off-road crash rates
were asse ssed for each road link and the results compared across several road categories. The
variance from the VicRoads clear zone guidelines was compared to the actual clear zone provision and
the road safety performance was critically asse ssed. This paper presents the key findings from this
study.
About the Authors
Keith Midson
Keith is a traffic engineer and transport planner with thirteen years experience in local government and
consulting. He is currently Manager Transportation with GHD in the Tasmanian Operating Centre. Keith
is also an Honorary Associate with the University of Tasmania and lectures Transportation Engineering
on a part-time basis. He has a Master of Traffic and Master of Transport with Monash University and has
worked on large and small scale projects throughout Australia and the Middle East. He is currently the
Secretary on the Executive Board of the Institute of Transportation Engineers, Australia/ New Zealand.
Keith has a strong background in road safety, and has been involved in numerous projects including road
safety strategies, road safety audits, counter-measure design, road safety investigations, road safety
research, crash analysis, crash investigation expert witness and transport studies involving a high degree
of road safety investigations.
Daniel Gregor
Daniel is an experienced Traffic Engineer and Transport Planner who has worked in consulting, local
government and secondments at public transport operators and government land developers, where he
gained practical and technical expertise in this field. Daniel’s key areas of interest include road safety,
su stainable mobility planning and general traffic engineering.
Daniel has a strong road safety background, with qualifications in road safety auditing and involvement in
schemes such as traffic management for large infrastructure projects; implementation of reduced urban
speed limits; pedestrianisation within activity centres, and a variety of road safety audits.
Nicole Guy
Nicole recently started with GHD as a graduate, where she has worked on a variety of transport planning
and road safety projects. On this project, Nicole assisted with much of the data collection, analysis and
reporting.
Page 3
3Keith Midson Clear Zone Effectiv eness and Crash Risk
1. Introduction
GHD were engaged by VicRoads to investigate an outcome-based approach to determining appropriate
clear zones on a case-by-case basis, for use in Victoria. This study was commissioned in conjunction
with three similar studies undertaken by Hyder, Monash University Accident Research Centre (MUARC)
and ARRB Group, although it is noted that vastly alternative approaches were adopted by each
consulting firm. The various studies were to investigate an approach to determining “Outcome Based
Clear Zone Requirements”, with a view to further develop a preferred approach.
The project originated following recommendations to investigate the traditional approach of the
application of clear zones following a Coronial Inquest. It is understood that the Parliamentary Road
Safety Committee (PRSC) supports a more conservative safety approach than that accepted for many
years through the application of the various standards.
Through this project, GHD have defined “Outcome-based Clear Zone Guidelines” as defining a
potential crash risk for a provided clear zone on a given road classification and speed limit. This
varies from the traditional ‘chart based’ approach where a ‘recommended’ clear zone is defined by
relevant guidelines that are not always achievable for various reasons. In this way, a more educated
understanding of the type of clear zone that should be provided for a given set of parameters such as
road classification, speed limit and terrain can be obtained that provides a defined crash risk rating.
GHD tested a general approach to investigating the application of clear zones, but it must be
emphasised that the findings of this study were not conclusive, but suggested that an alternative
approach may be feasible.
GHD’s approach to the study involved the application of an evidence based approach to investigating the
effect of clear zone widths on run-off-the-road single vehicle crash rates, along with a comprehensive
review of current clear zone guidelines currently in practice in Australia and overseas.
The key findings of this report were as follows:
Overview of clear zone guidelines literature review;
Run-off-the-road crash risk increases with increasing traffic volume (exposure measure);
Run-off-the-road crash risk increases with decreasing clear zone width (except for Activity Centres);
and
An outcome-based clear zone approach is possible, by categorising risk profiles for road types and
speed limits. It is possible to obtain an understanding of run-off-the-road crash risk by defining
clear zone width. Then an assessment of the road design (or existing road profile) will determine
the likelihood of a crash.
This report recommends that further investigation be undertaken, including to determine the crash risk for
higher speed roads (100km/h and 110km/h) with a higher sample rate of Victorian roads.
Overall, the approach adopted as part of this investigation has the potential to be very insightful, however
it is recognised that a much larger sample of road lengths is required to produce findings of any
significance.
Page 4
4Keith Midson Clear Zone Effectiv eness and Crash Risk
2. Adopted Approach
In order to have an evidence based approach to the application of clear zone widths for a range of road
types, the crash history for a selection of roads with varying clear zone widths, road classification, speed
zones and other factors have been investigated to determine their significance in single vehicle run-off-
the-road crash rates.
Specifically, the approach that has been adopted by GHD includes the following key steps:
Review of existing available literature and research;
Based on the review of available literature and research, establish suitable objectives for the
development of Outcome-based Clear Zone Guidelines;
Based on the project team’s experience, identify features that are key factors in run-off-the-road
type crashes;
Select a small sample of road lengths in metropolitan Melbourne to test for key factors in run-off-
the-road crashes and to verify an evidence based approach to identifying outcome-based clear
zone guidelines;
Visit each selected road length to establish existing conditions;
Undertake crash analysis for each road length (using CrashStats) to identify crash trends for all
crash types and specifically run-off-the-road crashes;
Report on the findings of the approach adopted and its suitability to identify Outcome-based Clear
Zone Guidelines.
In total, 25 road lengths from across Melbourne with varying features were selected, with at least four
road lengths in each category. Each site selected was visited to record the typical and minimum offset
(in metres) to any existing roadside hazards along the length as well as other information such as speed
zone, kerb type, adjoining land use, road surface, horizontal geometry, etc. Two-way traffic volume data
for each road length was estimated from the strategic Melbourne Integrates Transport Model (MITM),
and accordingly, the traffic volume data is a broad estimate only. Table 3 lists road sections and their
associated classification.
The road lengths selected in this study are not considered to be fully representative of all Victorian
Roads. Given the preliminary nature of this investigation project and the limited resources available to
undertake site inspections, only sites within Melbourne have been selected for analysis. Accordingly,
‘Rural Highways’ or ‘Rural Roads’ have not been asse ssed as part of this investigation. It is
recommended that this form part of a future piece of work, however it is acknowledged that the existing
clear zone guidelines are more likely to be applicable in ‘rural highway’ settings.
Page 5
5Keith Midson Clear Zone Effectiv eness and Crash Risk
3. Literature Review
To enable a greater understanding of clear-zones and the application of clear zone widths for various
functional road designs used within other states of Australia and other countries around the world a
literature review was undertaken.
The Literature review included the following documents:
VicRoads Guidelines – Road Design Guidelines;
Austroads Guidelines;
– Austroads Rural Road Design Guide;
– Austroads Urban Road Design Guide;
Note The Austroads Guide to Road Design Part 6 is currently in preparation, this guide is believed
to cover Road Safety and contain a section on clear zones, this may update the clear zone
guidelines within both the Urban and Rural Road Design Guides
Interstate Practice;
– Road Design Guidelines, Section 3: Road Cross Section (NSW);
– Main Roads Western Australia: Asse ssment of Roadside Hazards (WA);
– Chapter 8 Safety Barriers and Roadside Furniture (Department of Main Roads Road Planning and
Design Manual, QLD);
– Road Hazard Management Guide (Department of Infrastructure, Energy and Resources, TAS);
Overseas Practice/Research;
– United States – AASHTO;
– British Columbia – Ministry of Transportation and Highways Technical Bulletin: Clear Zone
Standards;
– New Zealand – Transit New Zealand: State Highway Geometric Design Manual, Section 6: Cross
Section;
– Europe – European Best Practice for Roadside Design: Guidelines for Roadside Infrastructure on
New and Existing Roads (RISER);
The regions (Australian states and other countries) incorporated within the literature review revealed that
the clear zone guidelines for the regions were based upon either the Austroads Urban and Rural Design
Guidelines or AASHTO, or RTA NSW Road Design Guidelines. Table 1 summarises the guidelines that
each region bases the clear zone widths upon and the document that this is outlined for each state this
in.
Page 6
6Keith Midson Clear Zone Effectiv eness and Crash Risk
Table 1 Summary of Guidelines Used and Document Name
State/Country Guidelines Usedfor clear zones
GuidelinesUsed forSafetyBarriers
Document Name Document Date
Victoria AustRoads AustRoads VicRoads RoadDesignGuidelines CrossSection; 3.9Clear Zones &3.10 SafetyBarriers
2002
New South Wales NSW RTA RTA NSW RoadDesignGuidelines,Section 3 RoadCross Section;3.7 Clear Zones
1999
South Australia Austroads Ruraland Urban DesignGuides
AustroadsRural andUrban DesignGuides andGovernment ofSouthAustralia-Department ofTransport,Energy andInfrastructureGuide toselection ofsafety barriers.
- -
Western Australia AustRoads AustRoads Main RoadsWesternAustralia:Assessment ofRoadsideHazards
2007
Queensland AASHTO AS/NZS3845:1999Road SafetyBarrierSystems andthe NationalCooperativeHighwayResearchProgram
Department ofMain RoadsRoad Planningand DesignManual: Chapter8 Safety barriersand roadsidefurniture
2005
Page 7
7Keith Midson Clear Zone Effectiv eness and Crash Risk
State/Country Guidelines Usedfor clear zones
GuidelinesUsed forSafetyBarriers
Document Name Document Date
Tasmania AustRoads AS/NZS3845:1999Road SafetyBarrierSystems
Road HazardManagementGuide
unknown
Northern Territory AustRoads - No responsereceived
-
United States AASHTO - - -
British Columbia Based uponAASHTO but theactual clear zonewidths are slightlydifferent
- Ministry ofTransportationand HighwaysTechnicalBulletin: ClearZone Standards
1996
New Zealand AASHTO - Transit NewZealand: StateHighwaygeometric designmanual, section6-Cross section
2002
Europe - - European BestPractice forRoadside Design:Guidelines forRoadsideInfrastructure onNew and ExistingRoads
2005
Page 8
8Keith Midson Clear Zone Effectiv eness and Crash Risk
The main objectives that have been identified within a number of the guidelines reviewed are presented
in Table 2.
Table 2 Key Objectives
Name ofDocument
Date Organisation Objectives
Urban / RuralRoad DesignGuide
2003 AustRoads The clear zone is a compromise between the recoveryarea for every errant vehicle, the cost of providing thatarea and the probability of an errant vehicleencountering a hazard. Ideally the clear zone should bekept free from non-frangible hazards where economicallypossible; alternatively, vehicles should be protected fromhazards within the clear zone.
RoadsideInfrastructure forSafer EuropeanRoads (RISER)Dupre G &Bisson D
2003 RISER If the goal of the safety zone is to eliminate impacts withobjects for impact speeds above 40 km/h, then thelateral distance of the safety zone must accommodatethe motions of the vehicles until this speed is reached.
State HighwayGeometricDesign Manual,Section 6
Transit NewZealand
About 80 percent of vehicles that run-off-the-road toregain control with minimum da mage to both vehiclesand occupants
Shoulder, verge and batter design must ensure a clearzone, which will allow an errant vehicle to traverse thisarea with minimum damage to itself and occupants.
AASHTORoadsideDesign Guide3rd ed.
2002 AASHTORoadside designGuide: AconciseOverview(Power Point)
2002 AmericanAssociation ofState andHighwayTransportationOfficials
To the extent practical, all roadsides should betraversable and contain no objects likely to cause severeinjuries when struck by a motorist. This concept is thecornerstone of the ‘forgiving roadside’ philosophy.
Roadside hardware that cannot be removed or locatedfarther from the roadway should be designed to yieldwhen struck, decreasing the likelihood of serious injury.
Whenever a hazardous terrain feature or fixed objectcannot be eliminated through redesign or made to yieldon impact, shielding with an appropriate traffic barriershould be considered.
Page 9
9Keith Midson Clear Zone Effectiv eness and Crash Risk
3.1 Clear Zone Guidelines
The following sections outline the basic methodology on how a clear zone is determined for a given road
type and speed zone for the most commonly used Guides in Australia.
3.1.1 Austroads Urban and Rural Road Design Guide
The Austroads Urban and Rural Road Design Guidelines both outline identical methodologies to
determine the clear zone width for a road and are therefore discussed as the one document in the
following section.
The Austroads Road Design Guide provides an indication of appropriate clear zone widths for a straight
section of road. Within the guidelines it states, “The clear zone is a compromise between the recovery
area for every errant vehicle, the cost of providing that area and the probability of an errant vehicle
encountering a hazard. Ideally the clear zone should be kept free from non-frangible hazards where
economically possible; alternatively, vehicles should be protected from hazards within the clear zone”.
The calculation of the clear zone width is completed with the aid of the graph shown in Figure 1. The
clear zone width is dependent on the 85-percentile speed, one-way AADT traffic volumes and the batter
slopes. For roads that have a horizontal curve an adjustment factor, Fc, is used to increase the clear
zone width. This factor is dependant upon the operating speed of the road and radius of the curve. The
curve adjustment factor, Fc, ranges between 1.0 – 1.9 and is shown in Figure 2.
Page 10
10Keith Midson Clear Zone Effectiv eness and Crash Risk
Figure 1: Austroads Urban Road Design Guide, Clear Zone Width
Page 11
11Keith Midson Clear Zone Effectiv eness and Crash Risk
Figure 2: Austroads Urban Road Design Guide, Horizontal Curv e Factor
3.1.2 NSW RTA – Road Design Guide, Section 3: Cross Section
Section 3.7 of the NSW RTA Road Design Guide, stipulates the clear zone widths to be applied for NSW
roads. These guidelines follow a similar approach to that used within the Austroads guidelines; Figure 3
shows the diagram that is used to determine the clear zone widths.
The factors the clear zone width is dependent upon are the 85th-percentile speed, one-way AADT traffic
volumes and the batter slopes, the same factors used within the Austroads guidelines. However the
weighting each factor is given, to effect the clear zone width is different to the weighting of given to the
factors within the Austroads guidelines. The clear zone widths calculated from the NSW RTA guidelines
are generally smaller than the widths calculated from the Austroads guidelines for lower speed roads,
Page 12
12Keith Midson Clear Zone Effectiv eness and Crash Risk
Figure 3: NSW RTA, Clear Zone Nomograph
Page 13
13Keith Midson Clear Zone Effectiv eness and Crash Risk
3.1.3 AASHTO Roadside Design Guide
The AASHTO Roadside Design Guide is similar to both the Austroads and NSW RTA guidelines as it
also provides an indication of appropriate clear zone widths for a straight section of road. The clear zone
width is dependent on the 85th-percentile speed, the one-way AADT approach volume and the slope of
the cut or fi ll . The graph used is shown in Figure 4. The clear zone width is adjusted for roads that:
Have a horizontal curvature;
Are two-land two-way road; and
Are dual carriageways.
Figure 5 displays the adjustment factors that must be applied if any or all of the features are present
along the road section. The largest of the factors is used to determine the adjusted clear zone distance.
When compared to the Austroads guidelines, the AASHTO clear zones are relatively simiar for vehicles
travelling at high speeds, however where the design speed is lower than 80km/hr the clear zone width
are generally smaller when using the AASHTO guidelines.
Page 14
14Keith Midson Clear Zone Effectiv eness and Crash Risk
Figure 4: AASHTO Roadside Guidelines, Clear Zone Width
Page 15
15Keith Midson Clear Zone Effectiv eness and Crash Risk
Figure 5: AASHTO Roadside Guidelines, Adjustment Factors
Page 16
16Keith Midson Clear Zone Effectiv eness and Crash Risk
4. Development of Outcome-Based Clear ZoneGuidelines
4.1 Summary of Adopted Approach
In order to have an evidence based approach to the application of clear zone widths for a range of road
types, the crash history for a selection of roads with varying clear zone widths, road classification, speed
zones and other factors have been investigated to determine their significance in single vehicle run-off-
the-road crash rates.
In total, 25 road lengths from across Melbourne with varying features were selected, with at least four
road lengths in each category. Each site selected was visited to record the typical and minimum offset
(in metres) to any existing roadside hazards along the length as well as other information such as speed
zone, kerb type, adjoining land use, road surface, horizontal geometry, etc. Two-way traffic volume data
for each road length was estimated from the strategic MITM, and accordingly, the traffic volume data is
an estimate only.
The road lengths selected in this study are not considered to be fully representative of all Victorian
Roads. Given the preliminary nature of this investigation project and the limited resources available to
undertake site inspections, only sites within Melbourne have been selected for analysis. Accordingly,
‘Rural Highways’ or ‘Rural Roads’ have not been asse ssed as part of this investigation. It is
recommended that this form part of a future piece of work, however it is acknowledged that the existing
clear zone guidelines are more likely to be applicable in ‘rural highway’ settings.
4.1.1 Recognised Limitations of This Investigation
It is acknowledged that the evidence-based approach to identifying Outcome-based Clear Zone
Guidelines adopted in this asse ssment has some limitations. These are as follows:
Small Sample Size: A small sample of road lengths analysed. It is acknowledged that the size of
the sample selected for this investigation is too small to draw any statistically significant
conclusions, however the purpose of the sample and investigation is to identify whether crash
history trends for a variety of factors can be used to determine Outcome-based Clear Zone
Guidelines for a variety of factors and road types. It is recommended that any future analysis
include a much larger sample size to provide more statistically reliable results;
Metropolitan Roads only: Given the preliminary nature of this investigation project, the limited
resources and time constraints to undertake site inspections, only sites within Melbourne have been
selected for analysis. The sample of road lengths has included roads from a variety of different
environments, but only within a metropolitan Melbourne context. This means that the size of sub-
categories within the small sample of road lengths are maximised. It is recommended that any
future analysis include roads from a broad range of areas, locations and environments;
Limited Number of Factors Assessed: The analysis has focused on a number of different factors
that may be related to run off road crashes. This has included the adjoining road environment, the
terrain and speed zone. It is acknowledged that these are no the only factors that contribute to run
off the road crashes and it is recommended that future analysis include other factors (e.g.
delineation, street lighting, pedestrian volumes, etc.);
Page 17
17Keith Midson Clear Zone Effectiv eness and Crash Risk
Limited Site Data: Given the limited time available to undertake this investigation, only very basic
information was collected at each site (i.e. speed zone, typical offset to existing roadside hazards,
etc.). There may be benefit in any future analysis incorporating more detailed and accurate site
information (e.g. measure roadside hazards with GPS, measure lane widths, etc.); and
Estimated Traffic Volume: The two-way traffic volume estimated for each site has been estimated
based on the MITM model and accordingly, the volumes are estimates only.
4.2 Site Selection
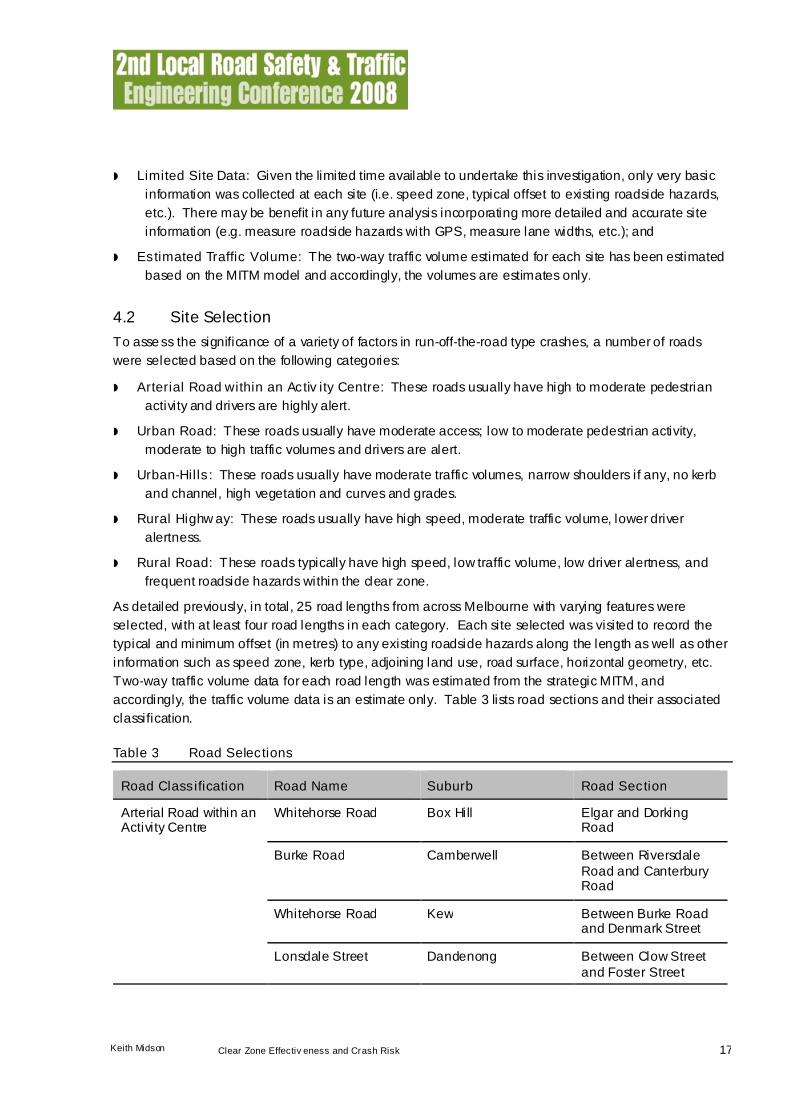
To asse ss the significance of a variety of factors in run-off-the-road type crashes, a number of roads
were selected based on the following categories:
Arterial Road within an Activ ity Centre: These roads usually have high to moderate pedestrian
activity and drivers are highly alert.
Urban Road: These roads usually have moderate access; low to moderate pedestrian activity,
moderate to high traffic volumes and drivers are alert.
Urban-Hills: These roads usually have moderate traffic volumes, narrow shoulders if any, no kerb
and channel, high vegetation and curves and grades.
Rural Highway: These roads usually have high speed, moderate traffic volume, lower driver
alertness.
Rural Road: These roads typically have high speed, low traffic volume, low driver alertness, and
frequent roadside hazards within the clear zone.
As detailed previously, in total, 25 road lengths from across Melbourne with varying features were
selected, with at least four road lengths in each category. Each site selected was visited to record the
typical and minimum offset (in metres) to any existing roadside hazards along the length as well as other
information such as speed zone, kerb type, adjoining land use, road surface, horizontal geometry, etc.
Two-way traffic volume data for each road length was estimated from the strategic MITM, and
accordingly, the traffic volume data is an estimate only. Table 3 lists road sections and their associated
classification.
Table 3 Road Selections
Road Classification Road Name Suburb Road Section
Arterial Road within anActivity Centre
Whitehorse Road Box Hill Elgar and DorkingRoad
Burke Road Camberwell Between RiversdaleRoad and CanterburyRoad
Whitehorse Road Kew Between Burke Roadand Denmark Street
Lonsdale Street Dandenong Between Clow Streetand Foster Street
Page 18
18Keith Midson Clear Zone Effectiv eness and Crash Risk
Road Classification Road Name Suburb Road Section
Ascot Vale Road Ascot Vale Between RacecourseRoad and MaribyrnongRoad
High Street Preston Between Bell Streetand Dundas Street
Mount Alexander Road Travancore Between City Link andMaribyrnong Road
Urban Roads Buckley Street Essendon Between Railway Lineand Waverley Street
Andersons Creek Road East Doncaster Between BlackburnRoad and Heidelberg-Warrandyte Road
Blackburn Road East Doncaster Between King Streetand Reynolds Road
King Street East Doncaster Between Victoria Streetand Blackburn Road
George Street East Doncaster Between Victoria Streetand Blackburn Road
Plymouth Road Corydon Hills Between Kalinda Roadand Yarra Road
Barkers Road Kew Between Burke Roadand Denmark Street
Canterbury Road Surrey Hills Between Union Roadand Balwyn Road
Burke Road Camberwell Between Toorak Roadand Riversdale Road
Balwyn Road Balwyn Between DoncasterRoad and WhitehorseRoad
Springvale Road Forest Hill Between CanterburyRoad and BurwoodHighway)
Burwood Highway Burwood East Between BlackburnRoad and MorackRoad
Hoddle Street Richmond Between WellingtonParade and JohnstonStreet
Page 19
19Keith Midson Clear Zone Effectiv eness and Crash Risk
Road Classification Road Name Suburb Road Section
Buckley Street Aberfeldie Between WaverleyStreet and HoffmansRoad
Urban-Hills Jumping Creek Road Warrandyte Between WarrandyteRoad and HooperRoad
Park Road Park Orchards Between GrenardAvenue and BeringaRoad
Warrandyte Road Warrandyte South Between Milne Roadand Croydon Road
Croydon Road Warrandyte South Between WarrandyteRoad and Wonga Road
4.3 Crash Analysis Overview
4.3.1 Crash History Assessment
An assessment of the casualty crash history, sourced from VicRoads’ publicly available database
CrashStats, was completed for all the sections of roads listed in Table 3, including any intersections
within the subject road length, for the five year period 2001-2005.
A focus on single vehicle run-off-the-road crashes was adopted for this assessment. The following data
was extracted for each road length and each crash site from the CrashStats output:
Total number of crashes along the subject road length;
Number of run-off-the-road crashes along the subject road length;
Direction of errant vehicle from the carriageway (e.g. left or right);
Alignment of road (curve or straight);
Type of object struck (e.g. pole, tree, etc.); and
Whether the kerb was mounted.
In addition, the following features have also been attributed to each specific site:
Adjoining environment (e.g. Activity Centre);
Road type (e.g. Arterial);
Length of the road assessed;
Traffic volume;
Speed zone;
Terrain; and
Street lighting.
Page 20
20Keith Midson Clear Zone Effectiv eness and Crash Risk
As each road section that has been asse ssed were of different lengths, it would be inappropriate to
compare the total number of crashes per road directly. Accordingly, the number of run-off the road
crashes has been compared based on the number of crashes per kilometre of road length. Some
assessment was also undertaken on the crash exposure rates by investigating the Two-Way Average
Daily Traffic Volume on each of the selected road links.
It is noted that the analysis only focused on those casualty crash details that relate to the road design
element. On this basis, factors such as time of day, seasonal and weather factors have not been
included in the analysis.
4.3.2 Crash History Assessment – Overv iew and Comparison
Of all the road lengths asse ssed, the roadside hazards were on average offset from the edge of the
nearest traffic lane a distance of 2.46m. For each of the different categories the average offset was:
1.2m for ‘Activity Centres’;
2.7m for ‘Urban’; and
3.0m for ‘Urban-Hills’.
For the road lengths investigated, a total of 1,311 casualty crashes were recorded for the 5-year period
between 2001-2005, of which 114 (8.7%) were run-off-the-road type crashes. On average, there were
approximately 32.6 casualty crashes per km, and approximately 2.4 run-off-the-road type crashes per
km.
The analysis indicates that roads within an ‘Activity Centre’ had the largest number of total casualty
crashes per kilometre, with on average approximately 66.1 casualty crashes per kilometre and 2.2 run-
off-the-road crashes per km.
Roads classified as ‘Urban’ had on average 28.5 crashes per km and 2.3 run-off-the-road crashes per
km. ‘Urban-Hills’ roads had on average 7.5 casualty crashes per km and 3.2 run-off-the-road type
crashes (the highest per km of all road categories). This information is presented in Figure 6.
It is noted that, ‘Urban Hills’ roads have the highest proportion of run-off-the-road crashes with 43% of its
total crashes being run-off-the-road crashes, while ‘Activity Centre’ roads, and ‘Urban roads both have
below 10% of total casualty crashes being classified as run-off-the-road crashes
As depicted in Figure 7, based on the road lengths assessed, the severity of run-off road type crashes
are typically higher for the ‘Activity Centre’ and ‘Urban’ type roads compared to the ‘Urban-Hills’.
Page 21
21Keith Midson Clear Zone Effectiv eness and Crash Risk
Average Number of Casualty and Run-Off-Road Crashes (per
km) For Each Road Classification
0.0
10.0
20.0
30.0
40.0
50.0
60.0
70.0
Activity Centre Urban Urban Hills
Nu
mb
er
of
Cas
ua
lty
Cra
sh
es
(pe
rk
m)
ROR Crashes All other crashes (excluding ROR)
Figure 6: Average Number of Casualty Crashes per km
Comparision Of The Total Number of Crashes, per Km,
Classified Fatal Or Serious and Other For Each Road Type
0.00
0.50
1.00
1.50
2.00
2.50
3.00
3.50
4.00
Activity Centre Urban Urban Hills
Pro
po
rtio
no
fc
ras
he
s
Number of crashes classified fatal or serious per Km Number of crashes classified other per Km
Figure 7: Crash Severity for Run-Off Road Crashes
Page 22
22Keith Midson Clear Zone Effectiv eness and Crash Risk
For ’Activity Centre’ and ‘Urban’ road classifications, the majority of run-off-the-road crashes occur on
straights, while for ’Urban-Hills’ roads the most common type of run-off-the-road crash is to the left of the
carriageway and on a curve. This is presented in Figure 8. Although this is a function of the actual road
lengths selected, as expected it appears that there is a high correlation between the presence of bends
and the run-off-the-road crash risk per km.
Comparision of Each Run-Off-Road Type Crashes For Each Road
Classification
0%
10%
20%
30%
40%
50%
60%
70%
80%
90%
100%
Activity Centre Urban Urban Hills
Pro
po
rtio
no
fC
ras
hes
Left-Straight Left-Curve Right-Straight Right-Curve
Figure 8: Comparison of Each Run-off-the-road Type Crashes for Each Road Classification Crash
History Assessment – Overview and Comparison
When an errant vehicle leaves the carriageway, there are a variety of objects that the vehicle may collide
with; the objects that are present usually depend on the topography of the land, facilities that are required
within the area (electricity poles, bus stops), surrounding land uses and the type of road.
The roadside hazards that are typical along many roads (and is recorded by CrashStats) include:
Pole (utili ty or lighting);
Tree;
Traffic Signal;
Traffic Sign;
Traffic Island;
Fences;
Buildings;
Guard Rail;
Guide Post;
Page 23
23Keith Midson Clear Zone Effectiv eness and Crash Risk
Fire Hydrant;
Open drains;
Roadside furniture; and
Embankment.
The above list of hazards was used within the crash asse ssment to determine if there is one particular
roadside hazard that has a greater occurrence of being struck.
Figure 9 shows the roadside hazards that have been stuck by vehicles that have left the carriageway for
all of the asse ssed road lengths investigated in this study.
‘Poles’ had the highest percentage of being hit of all the objects at 39%; ‘Tree’ has the second highest
percentage with 18% of all reported crashes. It demonstrates that poles and trees are the most struck
roadside hazards. This is largely because they are the predominant roadside object and are often
located within the clear zone and can be difficult and expensive to remove, relocate or shield.
Traffic islands, fire hydrants, guideposts and guardrails all were only struck 1% or 2% of the collisions
within the assessed road lengths.
Page 24
24Keith Midson Clear Zone Effectiv eness and Crash Risk
Roadside Hazards Struck
Pole
39%
Tree
18%
Traff ic Signal
10%
Traff ic Sign
4%
Traf fic Island
(including tram
Safety Zones)
2%
Fences
10%
Buildings
4%
Guard Rail
2%
Guide Post
1%
Fire Hydrant
2%
Embankment
4%
Other
4%
Figure 9: Frequency of Roadside Hazards Being Struck From All Run-off-the-road Crashes
Figure 10 is a scatter plot that presents the relationship between the number of run-off-the-road type
crashes per km (for all road lengths investigated) against the VicRoads clear zone requirement for each
subject road length. It is noted that the clear zone requirements have been calculated based on the
estimated one-way traffic volume for each road and the posted speed zone.
Of the 25 road lengths investigated, only 5 typically met or exceeded the VicRoads Clear Zone
requirements. For these roads, the number of crashes per kilometre was generally below 1.5 run-off-the-
road crashes per kilometre.
By comparison, 20 of the 25 road lengths did not meet the VicRoads clear zone requirements. The
range was a shortfall of between 0.3m up to 4.0m. For these sites, the run-off-the-road crash rate was
between 1.2 and 6.2 run-off-the-road crashes per km.
A linear regression line has been applied to the data, which shows that there is generally a generally
negative linear relationship between the actual/required clear zone and the run-off-the-road crash rate.
The coefficient of determination (R2) is a statical measure to determine how well the regression line
approximates the data. For the linear regression line shown in Figure 10 it has an R2 value of 0.1558,
this would indicate that the regression line doesn’t approximate the data set very well. However, what
the line does indicate is that where the roadside hazards along a road length meet the VicRoads clear
Page 25
25Keith Midson Clear Zone Effectiv eness and Crash Risk
zone requirements that the run-off-the-road crash rate is approximately 1.7 crashes per km (i.e. the Y
intercept).
It is acknowledged that the data and crash analysis is based on a very small sample of sites. It is
recommended that this approach be adopted for a much larger sample of sites across a variety of road
types, with varying adjoining environment factors, varying terrain, varying speed zones and other factors.
This will enable the development of a statistically reliable equation for the relationship of crash rate risk to
specific road environment factors.
ROR Crashes vs Whether Meets VicRoads Clear Zone Requirements
y = -0.393x + 1.6716
R2
= 0.1558
0.0
1.0
2.0
3.0
4.0
5.0
6.0
7.0
-5 -4 -3 -2 -1 0 1 2 3 4
Difference Between Required Clear Zone and Actual Offset
No
.R
OR
Cra
sh
es
per
km
Figure 10: Run-off-the-road Crash Rate by the Difference Between the Vicroads Clear Zone
Requirements and the Actual Offset to Roadside Hazards.
4.4 Run-off-the-road Crash Comparisons Based on Different Factors
For the purpose of this asse ssment, a number of different factors have been selected for analysis to
determine whether this approach to identifying outcome-based clear zone guidelines is appropriate. It is
acknowledged that the factors chosen do not represent all the factors that may be involved in run-off-the-
road type crashes, however it is recommended that future work consider other factors.
The factors investigated include the impact of:
The adjoining roadside environment (i.e. activity centre, urban, urban-hills),
The road terrain (i.e. level, undulating/rolling), and
Speed zone.
Page 26
26Keith Midson Clear Zone Effectiv eness and Crash Risk
4.4.1 Adjoining Road Env ironment
The roads selected for assessment have been categorised into three distinct groups based on the
adjoining road environment. The three categories are:
Activity Centre roads
Urban roads
Urban-Hills roads
These categories were selected to see if the environment within which a road is situated is a factor in
run-off the road type crashes.
Activ ity Centre
Arterial roads within Activity Centres generally have a moderate to high degree of activity associated with
them in the form of pedestrian movements, parking and access manoeuvres and lower speed limits.
The dominant run-off-the-road crash type for the Activity Centres studied was left-carriageway-straight,
with 55% of all crashes falling in this category. The remaining crashes were right-carriageway, with 45%.
The typical roadside hazards struck in the Activity Centres studied are presented in Figure 11. Traffic
signals were the most common hazard struck, with 23%, followed by pole with 17% and tree, fence, fire
hydrant and traffic islands each with 12%.
Roadside Hazards Struck -Activity Centre
Pole
17%
Tree
12%
Traffic
Signal
23%
Other6%
Fences
12%
Traffic
Island
(IncludingTram
Safety
Zones)
12%Traff ic
Sign
6%
Fire
Hydrant
12%
Figure 11: Activ ity Centre Roadside Hazards
Figure 12 shows the run-off-the-road crash rate per kilometre versus the two-way traffic volume for the
five Activity Centre roads studied. The scattering of crash rates does not tend to suggest any particular
Page 27
27Keith Midson Clear Zone Effectiv eness and Crash Risk
trend. The scattering of crash rates does not tend to suggest any particular trend, This is unless
Lonsdale Street is regarded as an outlier and then the trend would appear upward indicating that, as
traffic volume increases, so does the number of crashes per km of road length.
Traffic Volume and Run-Off-Road Crashes - Activity Centre
0.0
0.5
1.0
1.5
2.0
2.5
3.0
3.5
4.0
0 5,000 10,000 15,000 20,000 25,000 30,000
Daily Traffic Volume (vpd)
No.
of
R.O
.R.
Cra
sh
es
per
km
Whitehors e Road, Box Hill
Burke Road, Camberwell
Whitehors e Road, Balwyn
Lonsdale Street , Dandenong
High Street, Preston
Figure 12: Activ ity Centre Traffic Volume and Run-off-the-road Crashes
It is likely that other factors have a more significant impact on run-off-the-road crashes in Activity Centres
given the complexity of movements occurring within these roads, and therefore finding a reasonable
relationship for the clear zone width along may prove to be difficult.
The distribution of run-off-the-road crashes per kilometre versus the typical hazard offset at each site
(effectively the clear zone provided on-site) for the five selected road lengths studied did not tend to
indicate any specific trends given the small sample size and other factors.
Overall, for the ‘Activity Centre’ classification, it is recommended that a larger sample of roads be
assessed to more accurately identify whether there are any trends associated with crash rate and traffic
volume and hazard offset in activity centres.
Urban
Roads classified as ‘Urban Roads’ are generally Primary Arterial and Secondary Arterial roads.
Therefore the characteristics vary slightly within this category, however urban roads generally have
moderate property access; low pedestrian activity, moderate to high volumes, moderate traffic speeds
and drivers are generally alert.
The dominant run-off-the-road crash type for the ‘Urban’ roads studied was left-carriageway-straight, with
62% of all crashes falling in this category. The remaining crashes split amongst the right-carriageway-
straight and left-carriageway-curve, with 37% and 1% respectively.
All 16 of the roads classified as an ‘Urban Road’ have 10% or less of the total crashes being run-off the
road crashes, with George Street having no recorded run-off-the-road collisions.
Page 28
28Keith Midson Clear Zone Effectiv eness and Crash Risk
The typical roadside hazards struck in the ‘Urban’ roads studied are shown in Figure 13. Poles were the
most common hazard struck, with 48%, followed by trees and fences with 12% and traffic signals with
10%.
Roadside Hazards Struck - Urban
Pole
48%
Tree
12%
Traff ic Signal
10%
Traff ic Sign5%
Fences
12%
Buildings
6%
Guard Rail
1%
Guide Post
1%
Fire Hydrant
1%
Other
4%
Figure 13: Urban Roads Roadside Hazards
Figure 14 displays the run-off-the-road crash rate per kilometre versus the two-way traffic volume for
each road studied in the ‘Urban’ road category. Figure 15 takes the data from Figure 14 and shows that
there is a generally positive linear relationship between the two-way traffic volume and the number of
run-off-the-road crashes. For the linear regression line shown in Figure 15 it has an R2 value of 0.3762,
this would indicate that the regression line doesn’t approximate the entire data set very well. There does
appear to be a stronger linear relationship between the two-way traffic volume and number of run-off-the-
road crashes for roads with lower traffic volumes.
Figure 16 shows the distribution of run-off-the-road crashes per kilometre versus the hazard offset
(effectively the clear zone) for the road lengths studied. Figure 17 uses this data to demonstrate that
there doesn’t appear to be any strong relationship between the hazard offset and the number of run-off-
the-road crashes. A linear regression line and a logarithmic regression line have both been fitted to the
data. For the linear regression line shown in Figure 17 it has an R2 value of 0.132, the logarithmic
regression line is also shown in Figure 17 and has an R2 value of 0.0524. This indicates that data does
not have a strong linear or logarithmic relationship.
Page 29
29Keith Midson Clear Zone Effectiv eness and Crash Risk
Traffic Volume and Run-Off-Road Crashes
- Urban
0.0
1.0
2.0
3.0
4.0
5.0
6.0
7.0
0 20,000 40,000 60,000 80,000
Daily Traffic Volume (vpd)
Nu
mb
er
ofR
OR
Cra
sh
es
per
km
Anderson s Creek Road, East
Doncaste rBlackburn Road, East Doncaster
King Street, East Doncaste r
George Street, East Doncaster
Plymou th Ro ad, Croydon Hills
Buckley Street, Essendon
Barkers Road, Kew
CanterburyRod, Surrey Hills
Burke Roa d, Cam berwell
Balwyn Ro ad, Balwyn
Sprin gvale Road, Forest Hill
Burwood Highwa y, Burwoo d East
Hoddle Street, Rich mond
Mount Ale xander Road , Tra va ncor
Buckley Street, Aberfe ldie
Ascot Vale Road, Asco t Vale
Figure 14: Urban Roads Traffic Volume and Run-off-the-road Crashes
Traffic Volume (vpd) vs Run-off Road Crashes per km - Urban
y= 7E-05x+ 0.6409
R2
= 0.3762
0.0
1.0
2.0
3.0
4.0
5.0
6.0
7.0
0 20,000 40,000 60,000 80,000
Traffic Volume (vpd)
No
.R
.O.R
.C
ras
he
sp
er
km
Hazard Offset vs Run-off roadcrashes per km
Linear (Hazard Offset vs Run-
off road crashes per km)
Figure 15: Urban Road Traffic Volume and Run-off-the-road Crashes
Page 30
30Keith Midson Clear Zone Effectiv eness and Crash Risk
Haz ard Offset and Run-Off-Road Crashes
- Urban
0.0
1.0
2.0
3.0
4.0
5.0
6.0
7.0
0 2 4 6 8
Offset To Roadside Hazard (m)
No
.R
.O.R
.Cra
sh
esp
er
km
Andersons Creek Road, EastDoncasterBlackburn Road, East Doncaster
King Street, East D oncaster
George Street, East D oncaster
Plym outh Road, Croydon Hills
Buckley Street, Croydon Hills
Barkers Road, Kew
Canterbury Rod, Surrey Hills
Burke Road, C am berwell
Balw yn Road, Balwyn
Springvale Road, Forest Hill
Burwood Highway, Burw ood East
Hoddle Street, Richmond
Mount Alexander Road, Travancor
Buckley Street, Aberfeldie
Ascot Vale Road, Essendon
Figure 16: Urban Run-off-the-road Crash Rate and Hazard Offset Distance
Offset to Roadside Hazard vs Run-off Road Crashes per km - Urban
y = -0.7148Ln(x) + 2.9145
R2
= 0.0524y = -0.3528x + 3.2874
R2 = 0.1032
0.0
1.0
2.0
3.0
4.0
5.0
6.0
7.0
0 2 4 6 8
Offset to Roadside Hazard (m)
No
.R
.O.R
.C
rash
es
pe
rk
m
Hazard Offset vs Run-offroad crashes per km
Log. (Hazard Offset vs Run-off road crashes per km)
Linear (Hazard Offset vsRun-off road crashes per km)
Figure 17: Urban Run-off-the-road Crash Rate and Hazard Offset Distance – Regression.
Page 31
31Keith Midson Clear Zone Effectiv eness and Crash Risk
Urban Hills
‘Urban Hill ’ roads are those roads that are within Metropolitan Melbourne but are typically windy and
have some rural characteristics. These roads usually have moderate volumes, narrow shoulders if any,
no kerb and channel, may have high vegetation and have low to moderate accesses.
The dominant run-off-the-road crash type for the ‘Urban Hills’ studied was left-carriageway-curve, with
49% of all crashes falling in this category. The remaining crashes are split amongst the left-carriageway-
straight, right-carriageway-straight, right-carriageway-curve, with 17%, 10% and 24% respectively.
The four roads classified as ‘Urban Hills’ roads incorporated within this study all between 40% and 50%
of the total crashes being run-off-the-road crashes.
The typical roadside hazards struck in the ‘Urban Hills’ roads studied are shown in Figure 18. Trees
were the most common hazard struck, with 44%, followed by poles and embankments each with 22%.
The remaining objects that were struck were guardrails, fences and other objects; these roadside
features were all struck 4% of the time.
Roadside Hazards Struck - Urban-Hills
Po le
22%
Tree
44%
Fences
4%
Oth er
4%
Gu ard Rail
4 %
Emban km ent
22%
Figure 18: Urban Hills Roadside Hazards
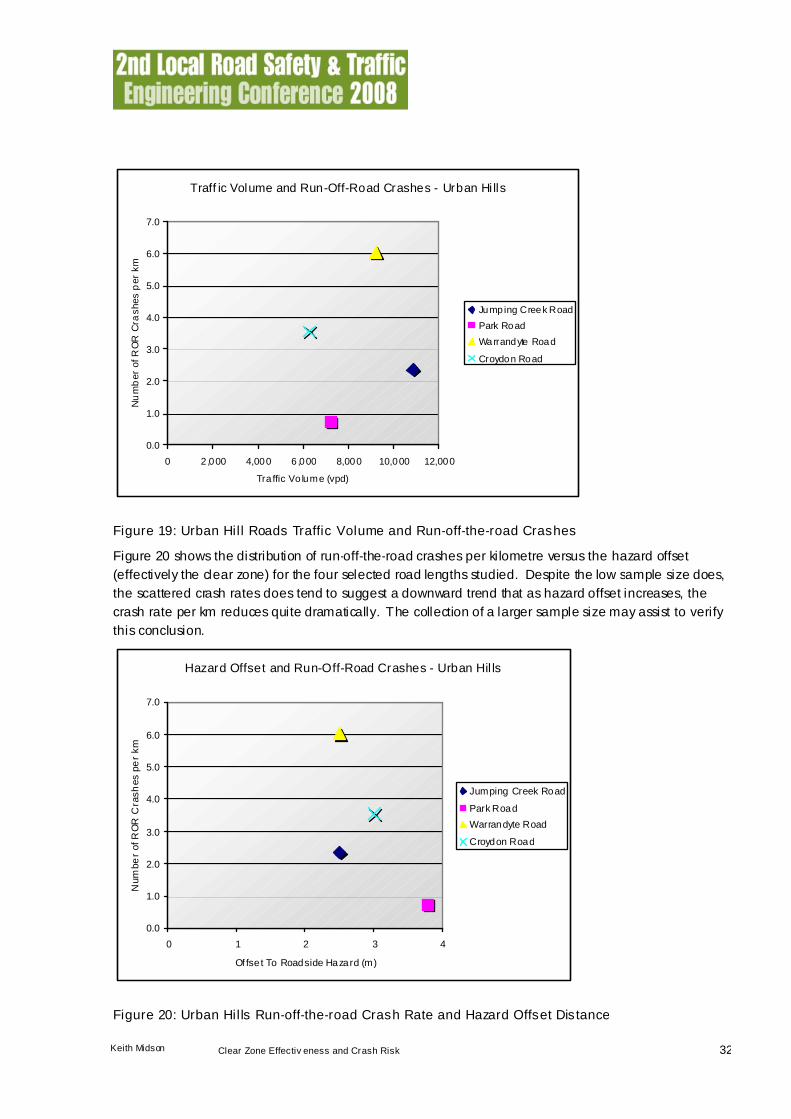
Figure 19 depicts the run-off-the-roads crash rate per kilometre versus the two-way traffic volumes of the
four roads classified as ‘Urban Hills’ roads included within the study. The scattering of the crash rates
doesn’t tend to suggest any particular trends.
Page 32
32Keith Midson Clear Zone Effectiv eness and Crash Risk
Traff ic Volume and Run-Off-Road Crashes - Urban Hills
0.0
1.0
2.0
3.0
4.0
5.0
6.0
7.0
0 2 ,000 4,000 6 ,000 8,000 10,000 12,000
Traffic Volume (vpd)
Nu
mb
er
ofR
OR
Cra
shes
per
km
Jumping Creek Road
Park Road
Warrandyte Road
Croydon Road
Figure 19: Urban Hill Roads Traffic Volume and Run-off-the-road Crashes
Figure 20 shows the distribution of run-off-the-road crashes per kilometre versus the hazard offset
(effectively the clear zone) for the four selected road lengths studied. Despite the low sample size does,
the scattered crash rates does tend to suggest a downward trend that as hazard offset increases, the
crash rate per km reduces quite dramatically. The collection of a larger sample size may assist to verify
this conclusion.
Hazard Offset and Run-Off-Road Crashes - Urban Hills
0.0
1.0
2.0
3.0
4.0
5.0
6.0
7.0
0 1 2 3 4
Offset To Roadside Hazard (m)
Num
be
rofR
OR
Cra
sh
es
pe
rkm
Jumping Creek Road
Park Road
Warrandyte Road
Croydon Road
Figure 20: Urban Hills Run-off-the-road Crash Rate and Hazard Offset Distance
Page 33
33Keith Midson Clear Zone Effectiv eness and Crash Risk
Comparison of Run-off-the-road Crashes at All Sites
Figure 21 shows the crash rates of all sites against the two-way traffic volume. It can be seen that there
is a general trend of increasing crash rates for increasing traffic volume, as the exposure increases. As
mentioned in Section 4.4.1, the Activity Centres did not appear to follow this trend, although a general
lack of data may be a causing factor.
No. R.O.R. Crashes per km and Traffic Volume
y = 5E-05x + 1.4319 y = -2E-05x + 2.628
y = 7E-05x + 0.6409 y = 0.0002x + 1.633
0.0
1.0
2.0
3.0
4.0
5.0
6.0
7.0
0 10,000 20,000 30,000 40,000 50,000 60,000 70,000
Traffic Volume (vpd)
No.
RO
RC
rash
es
per
km All sites
Activity Cent re
Urban
Urban-Hills
Linear (All sites)
Linear (Activity Cent re)
Linear (Urban)
Linear (Urban-Hills)
Figure 21: Number of Run-off-the-road Crashes and Traffic Volumes
It can be seen from Figure 22 that the crash rate per kilometre generally reduces as the distance to the
offset hazard increases. This demonstrates that as the clear zone increases, the likelihood of run-off-
the-road crashes decreases.
This trend was not as evident for Activity Centre sites, where a slightly increasing trend was observed.
Given the limited range of clear zone distances present at these site (maximum recorded being only 2
metres), it may simply indicate that there is insufficient data to draw significant conclusions from. The
increasing trend may also be due to factors such as possible increasing speed with increased clear zone
at these sites.
Figure 22 tends to indicate that crash risk for run-off-the-road crashes per kilometre reduces as the clear
zone increases. Whilst time constraints prevented higher speed limited roads (100km/h and 110km/h)
from being investigated, it is most likely that this trend would also be observed.
Page 34
34Keith Midson Clear Zone Effectiv eness and Crash Risk
No. R.O.R. Crashes per km and Offset to Roadside Hazard
y = -0.278x + 3.121
y = 0.503x + 1.6101
y = -0.3528x + 3.2874
y = -2.6457x + 10.975
0.0
1.0
2.0
3.0
4.0
5.0
6.0
7.0
0 1 2 3 4 5 6 7 8
Offset to Hazard (m)
No
.R
OR
Cra
sh
es
per
km All sites
Act ivity Centre
Urban
Urban-Hills
Linear (All sites)
Linear (Activity Cent re)
Linear (Urban)
Linear (Urban-Hills)
Figure 22: Run-off-the-road Crashes per km and Offset to Hazard
4.4.2 Road Terrain
Within the analysis the 25 selected roads were classified by road terrain, as this study has been focused
on the urban environment all the roads were classified either level, undulating or rolling. According to the
Austroads Rural Design Guide the definitions of the road terrain classifications are as follows.
Lev el Terrain: Is that condition where road sight distance, as governed by both horizontal and
vertical restrictions, are generally long or could be made to be so without construction difficulty or
major expense.
Undulating Terrain: Is that condition where road sight distance is occasionally governed by both
horizontal and vertical restrictions with some construction difficulty and major expense but with
only minor speed reduction.
Rolling Terrain: Is that condition where the natural slopes consistently rise above and fall below
the road grade and where occasional steep slopes offer some restriction to normal horizontal and
vertical roadway alignment. The steeper grades cause trucks to reduce speed below those of
passenger cars.
Due to the small sample size the roads, which were classified as having either undulating or rolling
terrain, were grouped together.
Page 35
35Keith Midson Clear Zone Effectiv eness and Crash Risk
Undulating and Rolling Terrain
The following roads were classified as having either an undulating or rolling terrain:
Plymouth Road;
Blackburn Road;
King Street;
Andersons Creek Road;
Burke Road (between Riverdale Rd and Toorak Rd);
George Street;
Park Road;
Croydon Road;
Jumping Creek Road; and
Warrandyte Road
The proportion of run-off-the-road crashes within this category varies between 0% (along George Street)
and approximately 50% (along Park Road).
The dominant run-off-the-road crash type for the undulating and rolling terrain roads, included within the
study was left-carriageway-curve, with 38% of all crashes falling in this category. 32% of the run-off-the-
road crashes classified left-carriageway-straight, while the remaining 31% were crashes to the right of
the carriageway.
Poles were the most common hazard struck, with 36%, followed by trees and embankments with 23%
and 16% respectively.
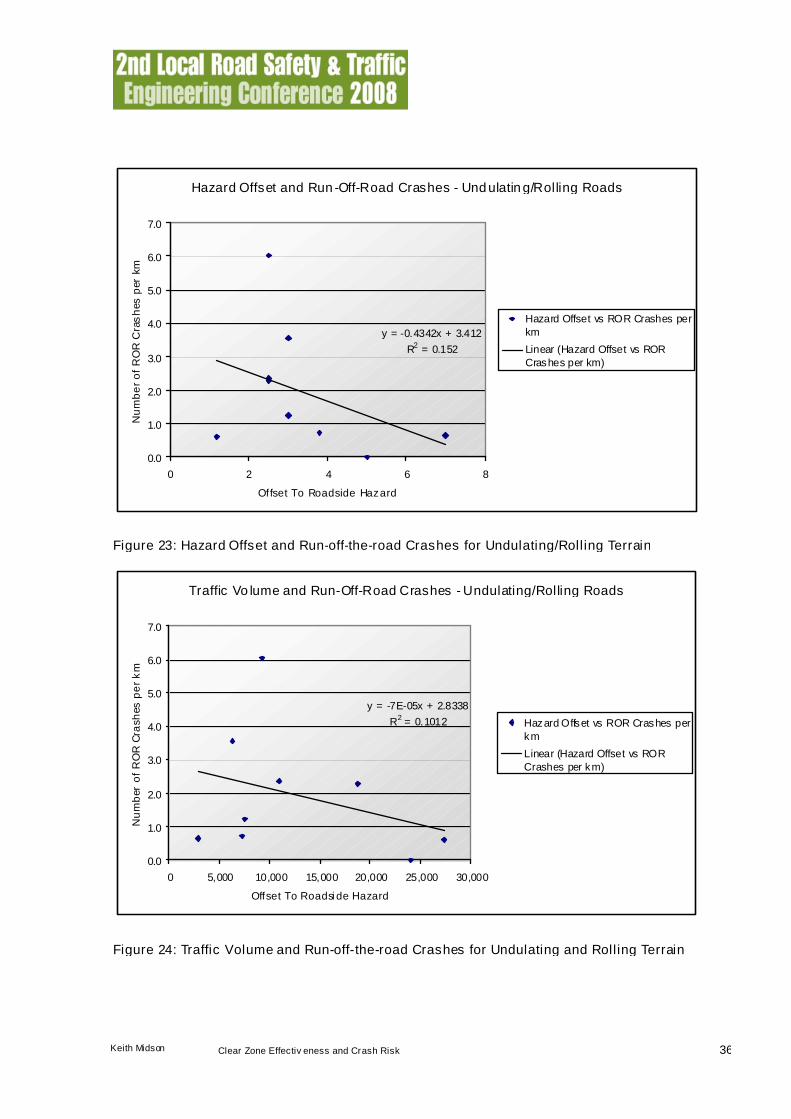
Figure 23 displays the offset to a roadside hazard and the number of run-off-the-road crashes per
kilometre for undulating and rolling roads. A linear regression has been fitted to the data points; from this
it would indicate that there is a negative linear relationship between the offset to roadside hazards and
the number of the run-off-the-road crashes per kilometre. The regression model has an R2 value of
0.152 indicating that there is a weak negative linear relationship.
The two-way traffic volume and the number of run-off-the-road crashes per kilometre for undulating and
roll ing terrain roads are shown in Figure 24. A negative linear regression line has been fitted to the data
set; an R2 value of 0.1012 was obtained from the regression model.
Page 36
36Keith Midson Clear Zone Effectiv eness and Crash Risk
Hazard Offset and Run-Off-Road Crashes - Undulating/Rolling Roads
y = -0.4342x + 3.412
R2 = 0.152
0.0
1.0
2.0
3.0
4.0
5.0
6.0
7.0
0 2 4 6 8
Offset To Roadside Hazard
Nu
mb
er
of
RO
RC
ras
hes
per
km
Hazard Offset vs ROR Crashes perkm
Linear (Hazard Offset vs RORCrashes per km)
Figure 23: Hazard Offset and Run-off-the-road Crashes for Undulating/Rolling Terrain
Traffic Volume and Run-Off-Road Crashes - Undulating/Rolling Roads
y = -7E-05x + 2.8338
R2 = 0.1012
0.0
1.0
2.0
3.0
4.0
5.0
6.0
7.0
0 5,000 10,000 15,000 20,000 25,000 30,000
Offset To Roadside Hazard
Nu
mb
er
of
RO
RC
rash
es
pe
rk
m
Hazard Offset vs ROR Crashes perkm
Linear (Hazard Offset vs RORCrashes per km)
Figure 24: Traffic Volume and Run-off-the-road Crashes for Undulating and Rolling Terrain
Page 37
37Keith Midson Clear Zone Effectiv eness and Crash Risk
Lev el Terrain
The following roads have been classified as having a level terrain:
Whitehorse Road (Elgar Rd and Dorkign Rd);
Burke Road (between Riverdale Rd and Canterbury Rd);
Lonsdale Street;
High Street;
Barkers Road;
Buckley Street (between Waverley Street and Hoffmans Road);
Whitehorse Road (between Union Road and Balwyn Road);
Balwyn Road;
Canterbury Road;
Ascot Vale Road;
Hoddle Street;
Mount Alexander Road;
Burwood Highway;
Buckley Street (between the railway line and Waverley Street);
Springvale Road; and
The proportion of run-off-the-road crashes within this category is below 20% for all of the asse ssed
roads.
Poles were the most common hazard struck, with 44%, followed by trees and traffic signals with 13% and
11% respectively, while no embankments were hit.
The dominant run-off-the-road crash type for level terrain roads, included within the study, was left-
carriageway-straight, with 60% of all crashes fall ing in this category. There were 39% of the run-off-the-
road crashes classified right-carriageway-straight, and 1% of the crashes were classified as left-
carriageway-curve.
Figure 25 displays the offset to a roadside hazard and the number of run-off-the-road crashes per
kilometre for roads with level terrain. A linear regression has been fitted to the data points; however it
would indicate that there is no particular trend for this data as the R2 value given from the regression is
0.0088.
The two-way traffic volume and the number of run-off-the-road crashes per kilometre for level terrain
roads are shown in Figure 26, the data points would indicate that there is a positive relationship between
these two factors. A linear regression line has been fitted to the data; this regression provided an R2
value of 0.3803, indicating that the fitted regression line slightly approximates the data.
Page 38
38Keith Midson Clear Zone Effectiv eness and Crash Risk
Hazard Offset and Run-Off-Road Crashes - Level Roads
y = 0.1295x + 2.4656
R2
= 0.0088
0.0
1.0
2.0
3.0
4.0
5.0
6.0
7.0
0 1 2 3 4 5
Offset To Roadside Crashes(m)
Nu
mb
ero
fR
OR
Cra
she
sp
er
km
Hazard Of fset v s RORCrashes per km
Linear (Hazard Of fset
vs ROR Crashes perkm)
Figure 25: Hazard Offset and Run-off-the-road Crashes for Level Terrain
Traffic Volume and Run-Off-Road Crashes - Level Roads
y = 5E-05x + 1.328
R2
= 0.3803
0.0
1.0
2.0
3.0
4.0
5.0
6.0
7.0
0 20,000 40,000 60,000 80,000 100,000
Traffic Volume (vpd)
Nu
mb
er
of
RO
RC
ras
hes
pe
rk
m
Traf fic Volume vs RORCrashes per km
Linear (Traf fic Volumevs ROR Crashes per
km)
Figure 26: Traffic Volume and Run-off-the-road Crashes for Level Terrain
Page 39
39Keith Midson Clear Zone Effectiv eness and Crash Risk
4.4.3 Speed Zone
Within the analysis the 25 selected roads were classified by the designated speed zone for the section of
road included within the study. The road lengths asse ssed were found to be within either a 60km/hr,
70km/hr or 80km/hr speed zone (excluding any school zone sections).
Due to the small sample size the roads, which were classified as having either a 70km/hr or an 80km/hr
speed zone, were grouped together. It is further noted that 85th-percentile speeds were not recorded for
the sites selected in this study. It is possible that the 85th-percentile speeds may not be representative of
the speed limits in some locations.
60km/hr Speed Zone
There were 20 of the 25 roads being classified as having a 60km/hr speed zone. The proportion of run-
off-the-road crashes varies between 0% (along George Street) and 70% along (Warrandyte Road),
however majority of the assessed roads are below 30%.
The dominant run-off-the-road crash type for 60km/hr roads, included within the study, was left-
carriageway-straight, with 46% of all crashes fall ing in this category. 26% of vehicles that left the
carriageway left to the right on a straight section of road while 19% were to the left of the carriageway
and on a curve and the remaining 9% were to the right of the carriageway on a curve.
Poles were the most common hazard struck, with 38%, followed by trees with 19% and fences with 13%.
The offset to a roadside hazard and the number of run-off-the-road crashes per kilometre for roads with a
60km/hr speed limit are shown in Figure 27. A linear regression has been fitted to the data points;
however it would indicate that there is no particular trend for this data as the R2 value given from the
regression is 0.0649.
Figure 28 displays the two-way traffic volume and the number of run-off-the-road crashes per kilometre
for roads with a 60km/hr speed limit. A linear regression has been fitted to the data points; however it
would indicate that there is no particular trend for this data as the R2 value given from the regression is
0.002.
In a 60km/hr speed zone, when a vehicle leaves the carriageway it has a greater opportunity to reduce
its speed to 40km/hr or below before it coll ides with a roadside hazard. Accordingly, there is a higher
likelihood that run-off-the-road crashes in a 60km/hr speed zone will result in property damage crashes
only and will not appear in CrashStats. Therefore the proportion of run-off-the-road type crashes in a
60km/hr speed zone may be under represented.
Page 40
40Keith Midson Clear Zone Effectiv eness and Crash Risk
Hazard Offset and Run-Off-Road Crashes - 60km/hr Roads
y = -0.3155x + 2.8596
R2
= 0.0649
0.0
1.0
2.0
3.0
4.0
5.0
6.0
7.0
0 1 2 3 4 5 6
Offset To Roadside Hazards (m)
Nu
mb
er
of
Cra
shes
per
km Hazard Of fset vs No. ROR
crashes per km
Linear (Hazard Off set vs No. ROR
crashes per km)
Figure 27: Hazard Offset and Run-off-the-road Crashes for Roads with a 60km/hr Speed Zone
Traffic Volume and Run-Off-Road Crashes - 60km/hr Roads
y = -9E-06x + 2.3347
R2
= 0.002
0.0
1.0
2.0
3.0
4.0
5.0
6.0
7.0
0 5,000 10,000 15,000 20,000 25,000 30,000 35,000
Traffic Volume (vpd)
Nu
mbe
rof
Cra
shes
per
km Hazard Off set vs No. ROR
crashes per km
Linear (Hazard Offset vs No. RORcrashes per km)
Figure 28: Traffic Volume and Run-off-the-road Crashes for Roads with a 60km/hr Speed Zone
Page 41
41Keith Midson Clear Zone Effectiv eness and Crash Risk
70km/hr and 80km/hr Speed Zone
Of the selected road lengths, only 5 road sections had speed limits of 70km/hr or 80km/hr. These roads
are as follows:
Andersons Creek Road (70km/hr);
Blackburn Road (70km/hr);
Hoddle Street (70km/hr);
Springvale Road (80km/hr); and
Burwood Highway (80km/hr)
Along these five roads, between January 2001 and December 2005, there were a total of 489 crashes
and 40 of these were run-off the road crashes; this resulted in all rods having less than 15% of the
crashes being classified as run-off-the-road crashes. Within the 40 run-off-the-road crashes 60% were
classified as being left-carriageway-straight while the other 40% were classified as being right-
carriageway-straight.
Poles were the most common hazard struck, with 47%, followed by trees and traffic signals both with
17%.
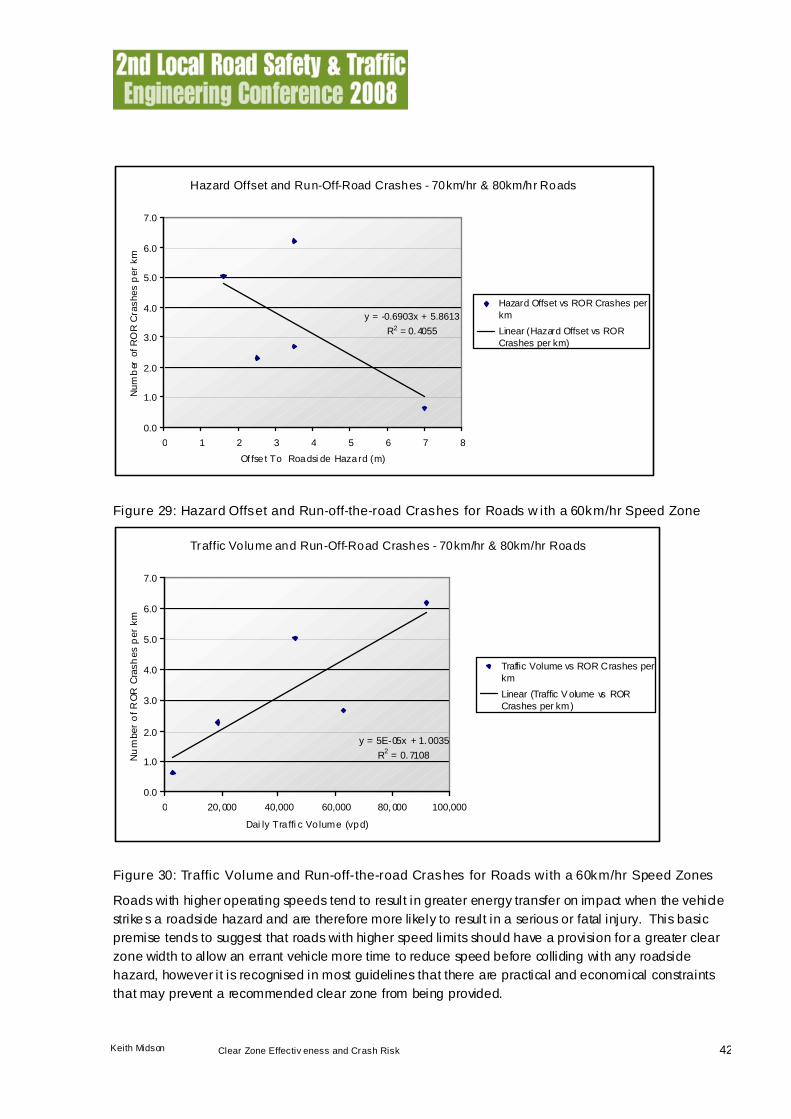
The offset to a roadside hazard and the number of run-off-the-road crashes per kilometre for roads with a
60km/hr speed limit are shown in Figure 29. A linear regression has been fitted to the data points; where
the R2 value from this regression is 0.4055. There is a negative line relationship, which indicates that as
the offset to the roadside hazard increases the number of crashes decreases
Figure 30 displays the two-way traffic volume and the number of run-off-the-road crashes per kilometre
for roads with a 60km/hr speed limit. A linear regression has been fitted to the data points; an R2 value
of 0.7108 is given for this regression. This would suggest that the linear regression is a relatively good fit
for the data and that there is a strong positive relationship between the two variables. Thus as the
volume increases along a section of road, the number of crashes increases.
Page 42
42Keith Midson Clear Zone Effectiv eness and Crash Risk
Hazard Offset and Run-Off-Road Crashes - 70km/hr & 80km/hr Roads
y = -0.6903x + 5.8613
R2 = 0.4055
0.0
1.0
2.0
3.0
4.0
5.0
6.0
7.0
0 1 2 3 4 5 6 7 8
Offset To Roadside Hazard (m)
Num
ber
ofR
OR
Cra
shes
per
km
Hazard Offset vs ROR Crashes perkm
Linear (Hazard Offset vs RORCrashes per km)
Figure 29: Hazard Offset and Run-off-the-road Crashes for Roads with a 60km/hr Speed Zone
Traffic Volume and Run-Off-Road Crashes - 70km/hr & 80km/hr Roads
y = 5E-05x + 1.0035
R2
= 0.7108
0.0
1.0
2.0
3.0
4.0
5.0
6.0
7.0
0 20,000 40,000 60,000 80,000 100,000
Dai ly Traffic Volume (vpd)
Nu
mber
ofR
OR
Cra
sh
es
per
km
Traffic Volume vs ROR Crashes perkm
Linear (Traffic V olume vs RORCrashes per km)
Figure 30: Traffic Volume and Run-off-the-road Crashes for Roads with a 60km/hr Speed Zones
Roads with higher operating speeds tend to result in greater energy transfer on impact when the vehicle
strike s a roadside hazard and are therefore more likely to result in a serious or fatal injury. This basic
premise tends to suggest that roads with higher speed limits should have a provision for a greater clear
zone width to allow an errant vehicle more time to reduce speed before colliding with any roadside
hazard, however it is recognised in most guidelines that there are practical and economical constraints
that may prevent a recommended clear zone from being provided.
Page 43
43Keith Midson Clear Zone Effectiv eness and Crash Risk
5. Outcome-based Clear Zone Options
5.1 Clear Zone Widths and Run Off Road Crash Rate
From the limited research undertaken in this study, it appears that there is some relationship between
clear zone width and risk of run-off-the-road collision for a given functional road classification.
In order to determine an Outcome Based Clear Zone, a set of charts, tables and equations can be
produced that define the risk of run-off-the-road collision for a given functional road classification (with
variables of road type, speed limit or design speed, terrain etc).
Either the clear zone can be selected to obtain an understanding of the likely risk of run-off-the-road
collision, or the desired risk of run-off-the-road collision can be selected to determine the corresponding
clear zone. This approach provides a good appreciation of the crash risk corre sponding to clear zone
decisions.
It should be noted that substantial further analysis of crash data should be undertaken before preparing
such diagrams. It is further noted that any such diagrams should be reviewed as road and vehicle
design practices improve over time.
Further, as demonstrated by the analysis in Section 4.3.2, an equation of the relationship between the
run-off-the-road crash risk and different road types and crash factors can be determined provided that a
statistically reliable sample size is adopted.
5.2 Further Research
Overall, the approach adopted as part of this investigation has the potential to be very insightful and can
be used to develop Outcome-based Clear Zone Guidelines. However, as discussed in Section 4.1.1,
there have been a number of limitations in the adopted approach for this investigation, particularly given
the time, resources and scope constraints.
It is recommended that future analysis into the development of Outcome-based Clear Zone Guidelines
include the approach adopted as part of this assessment, with consideration to addressing the limitations
identified in Section 4.1.1. Specifically:
Collect crash history and site data from a statistically reliable sample size, including for each sub-
category.
Collect crash history and site data for a broad range of road types, areas, locations and
environments. The required clear zone and crash risk for these categories can be graphically
presented and an equation for the relationship identified.
Include in the analysis consideration of a broader range of factors that may contribute to run-off-the-
road type crashes (e.g. delineation, street lighting, pedestrian volumes, etc.). The required clear
zone and crash risk for these factors can be graphically presented and an equation for the
relationship identified.
There may be benefit in any future analysis incorporating more detailed and accurate site
information (e.g. measure roadside hazards with GPS, measure lane widths, etc.)
In summary, any future assessment will be required to be considerably larger; it should follow a similar
approach, as the preliminary assessment that GHD has completed however should be completed in
Page 44
44Keith Midson Clear Zone Effectiv eness and Crash Risk
greater detail and with a larger selection of roads and road lengths for greater statistical conclusions to
be drawn.
For a subsequent asse ssment to gain a greater understanding of aspects that affect the frequency and
severity of single vehicular run-off-the-road crashes the following issues are recommended to
investigated and included:
Rural roads, particularly rural highways, should be included within any further investigation.
Possible roads that could be included within this investigation include: Melba Highway; Maroondah
Highway; South Gippsland Highway; Bass Highway; Princes Highway; Midland Highway; Hume
Highway, etc.
Further investigation of run-off-the-road crashes that occur on horizontal curves.
– Determine if the type of curve (left curve as compared to right curve) has any effects the crashes
that occur on curves;
– Determine what affect the size and frequency of curves on a section of road has on the run-off-the-
road crashes;
Use GPS to map a small selection of roads with respect to clear zone distances;
Map all run-off-the-road crashes for the roads included within the assessment, to determine if there
are any trends for run-off-the-road crashes in particular regions of Victoria;
Further statistical analysis of the crash data; and
Weighting of the factors listed in Table 3 could also be completed. This would enable the factors
that have been found to have a greater effect on the frequency and severity of run-off-the-road
crashes to have a large effect on the clear zone width.
Page 45
45Keith Midson Clear Zone Effectiv eness and Crash Risk
6. Key Findings and Conclusions
GHD defined “Outcome-based Clear Zone Guidelines” as defining a potential crash risk for a provided
clear zone on a given road classification and speed limit. This varies from the traditional ‘chart based’
approach where a ‘recommended’ clear zone is defined by relevant guidelines that are not always
achievable for various reasons. In this way, a more educated understanding of the type of clear zone
that should be provided for a given set of parameters such as road classification, speed limit and terrain
could be obtained that provides a defined crash risk rating.
GHD’s approach to the study involved the application of an evidence based approach to investigating the
effect of clear zone widths on run off the road single vehicle crash rates, along with a review of current
clear zone guidelines currently in practice in Australia and overseas.
Based on our review of the available literature, research and existing clear zone guidelines it would
appear that the Austroads clear zone guidelines, which are adopted in Victoria, is the most conservative
approach (i.e. produces the highest clear zone requirement).
Also based on our review of the available literature, the following objectives were identified as
appropriate for Outcome-based Clear Zone Guidelines:
1. That the guidelines are easy to understand and apply;
2. That they eliminate or reduce impacts with objects for impact speeds above 40 km/h, and
accordingly the lateral distance of the safety zone must accommodate the motions of the
vehicles until this speed is reached;
3. The clear zone provided will determine a level of run-off-road risk a ssociated with a road for a
given set of parameters such as design speed, terrain and functional road classification.
4. The clear zone is to be kept free from all non-frangible hazards, where it is economically viable;
and
5. Whenever a hazardous terrain feature or fixed object cannot be eliminated through redesign or
made to yield on impact, shielding with an appropriate traffic barrier should be considered.
In order to have an evidence based approach to the application of clear zone widths for a range of road
types, GHD investigated a number of road lengths with varying clear zone widths, road classifications,
speed limits and other various factors to determine how these may relate to single vehicle run off the
road crash rates.
The key findings of this report were as follows:
Overview of clear zone guidelines literature review;
Run-off-road crash risk increases with increasing traffic volume (exposure measure);
Run-off-road crash risk increases with decreasing clear zone width (except for Activity Centres);
and
An outcome-based clear zone approach is possible, by categorising risk profiles for road
types and speed limits. It may be possible to obtain an understanding of run-off-the-road
crash risk by defining clear zone width. Then an asse ssment of the road design (or existing
road profile) will determine the likelihood of a crash.
Page 46
46Keith Midson Clear Zone Effectiv eness and Crash Risk
The investigation has indicated that there appears to be some relationship between clear zone width and
risk of run-off-road collision for different factors such as the adjoining road environment, terrain and
speed zone. These relationships can be plotted to determine their impact on run off the road crash rates
and clear zones. In addition, equations of the relationships can be determined, provided that sufficient
sample sizes are adopted.
Any future assessment will be required to be considerably larger; it should follow a similar approach, as
the preliminary assessment that GHD has completed, however should be completed in greater detail and
with a larger selection of roads and road lengths for greater statistical conclusions to be drawn.
Page 47
47Keith Midson Clear Zone Effectiv eness and Crash Risk
7. Acknowledgements
The author would like to thank the following key people who were instrumental in the development of this
study:
Daniel Gregor, Nicole Guy, and Shaun Smedley from GHD. All were instrumental in the
development of the report as part of the study team.
Bruce Thompson, Ken Hall and Nick Szwed from VicRoads.