CLEARING FOR RESULTS PHASE II Project ID: 00076990 Project Duration: 01 st January 2011 - 29 th February 2016 Current Project Budget: US$ 27,595,667.22 Implementing Partner: Cambodian Mine Action and Victim Assistance Authority Country Programme Outcome: National and sub-national capacities strengthened to develop more diversified, sustainable and equitable economy IMPACT ASSESSMENT SURVEY REPORT CLEARING FOR RESULTS II PROJECT 2011-2015 CAMBODIA 2015 Prepared by Rukhshona Rajabova Monitoring and Evaluation Officer CFR II project
Transcript
CLEARING FOR RESULTS PHASE II
Project ID: 00076990 Project Duration: 01st January 2011 - 29th February 2016 Current Project Budget: US$ 27,595,667.22 Implementing Partner: Cambodian Mine Action and Victim Assistance Authority Country Programme Outcome: National and sub-national capacities strengthened to
develop more diversified, sustainable and equitable economy
IMPACT ASSESSMENT SURVEY REPORT CLEARING FOR RESULTS II PROJECT 2011-2015
CAMBODIA 2015
Prepared by Rukhshona Rajabova Monitoring and Evaluation Officer
CFR II project
2
TABLE OF CONTENTS
ACRONYMS AND ABBREVIATIONS ........................................................................................................... 3
BENEFITS OF MINE CLEARANCE FOR HOUSEHOLDS AND COMMUNITY .................................................. 13
LAND RIGHTS ......................................................................................................................................... 14
LAND DISPUTES ..................................................................................................................................... 16
LAND SIZE AND VALUE BEFORE AND AFTER CLEARANCE ........................................................................ 17
LAND USE .............................................................................................................................................. 19
INCOME GENERATION ........................................................................................................................... 20
Annex I: Survey list of provinces, villages and number of respondents ................................................... 35
Annex II: Survey calendar and team composition………………………………………………………………………………..…36
Annex III : Household Questionnaire ...................................................................................................... 37
Annex IV : Focus group discussion ......................................................................................................... 61
3
ACRONYMS AND ABBREVIATIONS
CMAA
Cambodian Mine Action and Victim Assistance Authority
CfR
Clearing for Results Project
CMAC Cambodian Mine Action Center
DFID
Department for International Development
ERW
Explosive Remnants of War
FGD
Focus Group Discussion
HHQ
Household Questionnaire
IMSMA Information Management System for Mine Action
ID Poor
Identification of Poor
IMSMA
Information Management System for Mine Action
MDG
Millennium Development Goals
MAFF
Ministry of Agriculture Forestry and Fishery
MAPU Mine Action Planning Unit
PCM
Post Clearance Monitoring
SBK
Social Business and Khmer Research and Development
TWG Technical Working Group
UNDP United Nations Development Programme
UXO Unexploded Ordnance
4
EXECUTIVE SUMMARY
After nearly three decades of war and internal conflict, Cambodia remains severely affected by landmines and explosive remnants of war. In 2003, Cambodia has adopted a special ninth Millennium Development Goal (MDGs) to clear all affected land, reduce the casualty rate to zero, and improve survivor assistance by 2015. The Government estimated in 2009 that some 649 sq km of mines contaminated land required clearance over the next 10 to 13 years. Clearing for Results II (CFRII) is a five-year project that aims to enhance national structures and mechanisms that will ensure demining resources are effectively allocated, promoting the release of land for productive use by the poor. To achieve this, the United Nations Development Programme and other development partners are supporting the Cambodian Mine Action and Victim Assistance Authority (CMAA) in leading and managing the implementation of CFRII. This project is shared with key stakeholders through the Mine Action Technical Working Group (TWG) in line with the Royal Government of Cambodia’s principles on aid effectiveness to increase transparency and harmonization of the resources allocated to the sector. The key deliverables for the project is: (1) to ensure all resources are effectively allocated to national priorities as defined by local planning processes and maximize the land available for local development; (2) the CMAA is equipped with the technical and functional capacities required to manage, coordinate, regulate and monitor the sector within an evolving environment; (3) at least 35 sq km of contaminated land is mapped, cleared and released for productive use through local planning which promotes efficiency and transparency. Under CFRII, the project has achieved a cumulative total of about 138.87 km2 of land released (May 2011 to Oct 2015) (including 43.97km2 released by land reclamation non-technical survey). This represents 396.77% of the CFRII project target of 35 km2. CFRII has also been contributing to the decline in landmine casualties in the three western provinces it operates where contamination and a history of reported casualties had been the highest. The project post clearance monitoring reports state that released lands used for agriculture (more than 88% in 2014) for housing and infrastructure such as: construction of roads, schools, temples and historical sites as well as for risk reduction for the community. To measure impact of the CFRII II project against Cambodia’s National Mine Action Strategy (2010-2019) to reduce poverty and enhance economic growth and assess achievements of the project key deliverables the Impact Assessment survey is designed to identify the changes in human livelihoods after release of land. The study should identify changes in livelihoods, community infrastructure and local development in the three targeted provinces: Battambang, Banteay Meanchey and Pailin. In addition, findings and recommendations of the survey will be integrated into mine action sector evaluation in Cambodia.
5
INTRODUCTION For communities living in contaminated areas, mine action sector has enabled safe access to means of production, use of public schools, settlements and better use of infrastructure and shelter. Land release including through mine clearance regenerated safe and sustainable livelihoods in the affected areas. Clearing for Results II project reported its results in mine action traditional terms based on cleared square meters and number of removed unexploded ordnance or mines. Even though such quantitative information is needed for measuring the effectiveness and efficiency of mine field operators and technical achievements, they are not meaningful qualitative indicators of outcomes, particularly livelihood impact and development. The Impact Assessment should address this information gap and provide clear indicators for monitoring and evaluation and livelihood and community development aspects. Analysis of impact, especially understanding the linkages between mine action and development is still in its early stages in Cambodia, therefore the study is considered as a pilot and lessons learned for the future UNDP project Mine Action for Human Development (MAHD). The impact assessment tools were designed to capture households and community development outcomes due to the project intervention rather than technical outputs e.g. cleared square meters or lifted mines and ERWs. This study has also benefited from being implemented concurrently with the Final Evaluation of Clearing for Results II , that was also focused on studying the outcomes and impact of land release contracts implemented over the life of the project. Equally, the Final Evaluation benefited from this study. Additional commentary in this report has been provided by Paul Davies, the consultant who undertook the Final Evaluation. OBJECTIVES The primary objective of the Impact Assessment Survey is to provide comprehensive assessment and explore the effects of land release on human livelihoods based on evidence. These are: socio-economic benefits to communities, safety and security and the link between mine action and development processes. The study is intended to assess the changes before and after mine clearance intervention by answering the following questions:
• How cleared land is being used by beneficiaries? • Did land clearance affect their income? • What are future plans for released land? • If land disputes and ownership are the issues • Households behavior if their lands are not safe to use
6
The specific objectives of the impact assessment are as follows:
• Value of land before and after clearance • Land use • Income generation • Gender and labor effects • Safety and security
METHODOLOGY Sampling Procedure The survey was designed to provide statistically represented information. Data was collected from three provinces Battambang, Banteay Meanchey and Pailin. The study applied random selection technique in 21 urban and rural villages, which implies that larger villages have higher probability for more interviews than smaller villages. A total of 491 households were interviewed in 21 villages. (Annex 1). The scope of the study was focused on the beneficiaries of the land released from May 2011 to early 2013. Based on the Post-Clearance Monitoring data, there are 1,055 households who received cleared land under the CFRII project in the 3 target provinces. The study applied quantitative and qualitative approaches. Three main methods were applied such as: (a) household interviews, (b) focus group discussions and (c) study of relevant documents. Primary Data: The Household Survey The household questionnaire (HHQ) utilized for the household survey was designed and finalized through participation of several stakeholders. The Cambodia Social Business and Khmer Research and Development (SBK), under the supervision of United Nations Developemnt Programme (UNDP) were responsible for conducting survey. Specifically, a total of 3 teams – each composed of four enumerators and one team supervisor – conducted the field work in each province. The teams participated in 2 days training course prior to data collection, including pilot testing of the household questionnaire. The HH questionnaire contained 11 sections: (1) screening - ID Poor Card information, ownership of released land and type of beneficiary; Section (2) housing; Section (3) household information and labor; Section (4) mine and ERW information, perception and benefits; Section (5) land use and productivity; Section (6) agricultural labor; Section (7) livestock; Section (8) expenditure based on additional income from released land; Section (9) assets acquired based on income from released land; Section (10) land disputes and future plan for land use; Section (11) change of occupation after mine clearance; Section (12) loan (Annex 2).
7
FGD Check List The survey gathered information from key informants using a focus group discussion (FGD) checklist. This information provided a useful context to the data collected through HHQ. The FGD contained both open-ended and coded system to score key informant answers. The FGD included 4 sections: (1) village background; (2) land contamination, risk and prioritization criteria’s; (3) impact/benefits of mine clearance; and (4) mine risk education (Annex 3). In each team, facilitator was responsible for leading focus group discussion with community representatives such as: village chief, commune council, school director or teacher, village volunteers and other key informants. Note taker recorded FGDs for preparation of narrative report. One group discussion took place in each target province. Statistical Analyses Tools The SBK was responsible for the data entry of the household questionnaire and preparation of narrative report based on FGDs. UNDP prepared format on CSPro software and then converted into SPSS for data analyses. Data cleaning and analyses were performed by the UNDP team using SPSS software. Notwithstanding, the overall survey design and methodology were prepared based on the prior field visits, household interviews and discussions with community representatives to capture all aspects of land use after mine clearance and identify the value chain of livelihoods after release of land. Some limitations need to be noted: • Baseline Data
In Monitoring and Evaluation activities, the baseline study is an early element of monitoring plan. The baseline survey provides data upon which project’s progress in the generation of outputs and outcomes and impact is assessed. Information on the household level (livelihoods) was not available at the baseline stage to measure changes. Therefore, the study relied on the information provided by households on the changes in livelihoods based on the increased size of safe and usable residential or agricultural lands as a result of mine clearance. FGDs provided information on the changes and affects of land release into community development.
• Identification of Beneficiaries The IMSMA (information management system for mine action) records data on the size of cleared land, number of beneficiaries based on sex and children, infrastructure and etc. However, recorded information was found inconsistent and inaccurate. Therefore, study did not rely on IMSMA and involved provincial Mine Action Planning Units (MAPUs) for identification of households/beneficiaries. Beneficiary identification was based on MAPUs land prioritization and post clearance monitoring reports (PCM).
8
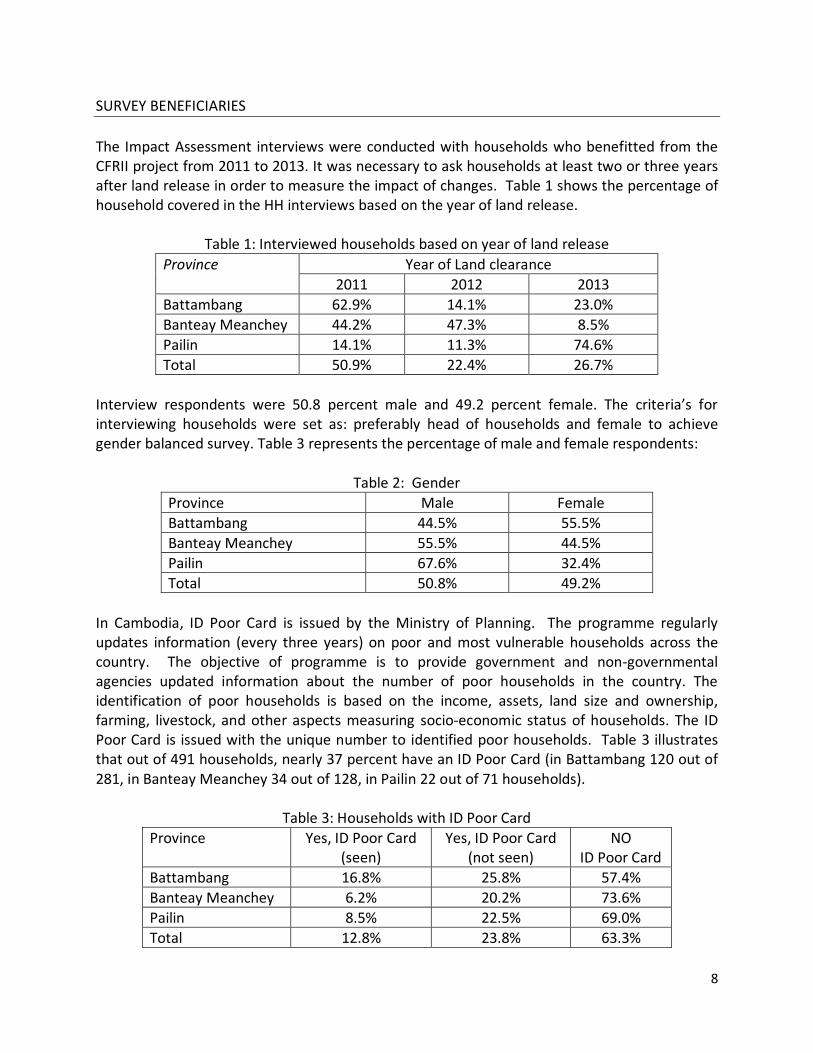
SURVEY BENEFICIARIES The Impact Assessment interviews were conducted with households who benefitted from the CFRII project from 2011 to 2013. It was necessary to ask households at least two or three years after land release in order to measure the impact of changes. Table 1 shows the percentage of household covered in the HH interviews based on the year of land release.
Table 1: Interviewed households based on year of land release Province Year of Land clearance
Interview respondents were 50.8 percent male and 49.2 percent female. The criteria’s for interviewing households were set as: preferably head of households and female to achieve gender balanced survey. Table 3 represents the percentage of male and female respondents:
Table 2: Gender Province Male Female Battambang 44.5% 55.5% Banteay Meanchey 55.5% 44.5% Pailin 67.6% 32.4% Total 50.8% 49.2%
In Cambodia, ID Poor Card is issued by the Ministry of Planning. The programme regularly updates information (every three years) on poor and most vulnerable households across the country. The objective of programme is to provide government and non-governmental agencies updated information about the number of poor households in the country. The identification of poor households is based on the income, assets, land size and ownership, farming, livestock, and other aspects measuring socio-economic status of households. The ID Poor Card is issued with the unique number to identified poor households. Table 3 illustrates that out of 491 households, nearly 37 percent have an ID Poor Card (in Battambang 120 out of 281, in Banteay Meanchey 34 out of 128, in Pailin 22 out of 71 households).
Table 3: Households with ID Poor Card Province Yes, ID Poor Card
(seen) Yes, ID Poor Card
(not seen) NO
ID Poor Card Battambang 16.8% 25.8% 57.4% Banteay Meanchey 6.2% 20.2% 73.6% Pailin 8.5% 22.5% 69.0% Total 12.8% 23.8% 63.3%
9
The CFRII Mid-Term Review’s (MTRs) assertion that the project was relevant because it gave beneficiaries the ability to make use of previously unused or partially used land is not quite as straightforward as suggested (in part due to the numbers using suspect land as mentioned above), but the Final Evaluation and this Household Impact Study confirm that clearance ‘was vital in raising the family income’, although not in most cases above subsistence as asserted by the MTR, bearing in mind that roughly only one third of the beneficiaries identified by the Household study were ID poor, and the vast majority were using some or all of the land cleared under CFRII, again a function of the informal private sector, and self-help village demining. The relevance of focusing a land release mine action project on the poor, on attempting to make it ‘pro-poor’ is questionable since the evidence revealed by both the Final Evaluation of Clearing for Results II and this household study is that almost by definition the real ‘poor’ are landless, or have only very small subsistence plots (less than one hectare), and with only one possible exception1 at no time did any evidence occur to suggest that land release was ‘for the poor’2. In fact to the contrary, most beneficiaries were seen to be either ‘middle class’ or ‘rich’, findings that have also been observed by other recent donor evaluations3. This does not make CFRII any less relevant, but rather suggests the conceptual assumptions underpinning the project’s central output is unrealistic, and not relevant given the actual conditions existing in mine-affected villages. CFRII, and no mine action in Cambodia, exists as a form of land / income re-distribution to the poor (who would likely either not to use sell their land anyway once cleared as they lack the capital to exploit it in an economically efficient way4), and high levels of retention of land by CFRII beneficiaries shows they have the capital to benefit from clearance. This would require some form of agreed land distribution mechanism, which with the exception
1 In Chaeng Village, Chay Meanchay, Banan, a local official suggested that land was given ‘to the handicapped, the rich and the poor with no discrimination’ which was taken to be evidence of some form of distribution of cleared land for the poor, but in fact appears possible to read as another statement of the fact that clearance tasks are typically selected on technical, and not socio-economic factors, and that even in mine-affected areas there is no free land, apart from at extremities of what remains of the ‘frontier’. 2 The poorest typically constitute 5-10% of village populations in the target areas of the project, and these were the proportions observed during the course of field work, although in some villages – such as Tamang, in Thmar Pouk district, Banteay-Meanchay – as many as 45-50% of families were described as having no or not enough land, and having to make a living by foraging in risky areas. 3 Mostly cash crops (corn and cassava are being cultivated in decontaminated and released land and most of the produce is being sold into the Thai market through local traders. The increase in available land is also said to be providing higher profit to traders and to agri-shops who are local retailers of agribusiness products. The people surveyed believed that the “middle class” and “rich families” are the ones who are benefitting most from this development. Poor households are seen to be receiving indirect benefit through increased opportunities for agricultural labour, closer to their homes. Labourers were also said to have benefitted from the demining of the land of “middle class” families because they see their exposure to risk of mine accidents diminish’, 3. Community Impact of MA Programme, 3.1 Key Fundings, Cambodia DFID Country Mission Report, 2013. 4 ‘There are instances where land is released but remains unused despite handover to poor and/or landless beneficiaries. In some cases, beneficiaries engage in seasonal labour migration, leaving the land temporarily due to, for example, a lack of irrigation or developmental support, and then return when weather conditions are more conducive to cultivation. In other cases, households opt to move permanently due to the lack of infrastructure or other agricultural support in place, post-land release. These households are simply too poor to cultivate or otherwise use the released land to sustain their livelihoods. The vacated land is left vulnerable to seizure or competing claims by the State or third parties’. p. 14, Doing No Harm? Mine Action and Land Issues in Cambodia GICHD Report, September 2014
10
of the SLC procedure5, is rarely enacted6. This also implies that there is free land, not being used because of its contaminated state. Neither of these conditions exist in reality, and as has been seen the need to claim, clear and cultivate land to gain title is a motive for risk-taking informal clearance at village level. Furthermore, as discussed below in the effectiveness section, the bottom-up prioritization and planning, especially the task selection processes within the commune and village, are driven more by technical considerations7 than any reference to social situation of the beneficiaries
FINDINGS Findings of the survey are presented below: ID Poor Card - Out of 491 respondents/beneficiaries, nearly 37 percent reported as ID poor card holders. Ownership of released land - Households and farmers own released land (nearly 98 percent).
Benefits of Land Release - The key benefits of land release for households are safety: (1) safe land for farming; and (2)
safe land for housing; and for community: (1) confidence investing in land.
Land Disputes and Land Titles
5 It is possible that the Phnom Teckar Phnom Chaa 317 site in Svay Chek District, Banteay Meanchay province, which has consumed so many CFRII resources, is such a SLC, although it appears to be still under the control of the military. See discussion of this in Annex 6 6 There are cases where landless families have settled on State property that is contaminated. They reside on and/or cultivate the land despite knowing the risk of mine/ERW contamination, in order to meet their socio-economic needs. People who have settled on State private property after the legislative cut-off date (i.e. August 2001 cannot claim possession/ownership rights. In other cases, people have settled on contaminated land that is classified under the Land Law as State public property, such as forests or riverbanks, which means it cannot be privately owned. Mine actors continue to encounter problems in releasing this type of land only to find it cannot be officially allocated to intended beneficiaries during the handover process. The beneficiaries thus remain highly insecure and vulnerable to forced eviction despite the considerable survey/clearance assets used to provide them with safe land for their housing and/or livelihood needs. In rare instances, State property has been allocated to landless households through a Social Land Concession (SLC). For State public property, it is necessary to first reclassify the land as State private property – an additional slow administrative step. While CMAA has intervened in a small number of cases to have State property reclassified and allocated as an SLC to intended beneficiaries of clearance, this mechanism has been used only in exceptional circumstances and is not standard practice. Indeed, few SLCs have been granted in Cambodia to date due to lack of political will and the high cost of supporting poor families to productively use newly allocated land. SLCs could, however, be granted more systematically to provide tenure security post clearance for households already using the land in question, as it is unlikely to require the same level of developmental support as would be necessary for families newly resettled on allocated land. p. 12, Doing No Harm? Mine Action and Land Issues in Cambodia GICHD Report, September 2014 7 Distance of SHA from the residential area was the most important criteria mentioned, although as the DFID study reveals as well, issues of operator access, safety and site suitability for technical assets seemed to be more important than community need in determining actual allocation of tasks.
11
- Land disputes and grabbing has not been observed in any province. Hence land deputes is found to be not an issue.
- Majority of households hold Land Ownership Certificates (Soft or Hard Titles). However, 19 percent of respondents did not have any land titling.
Use of released land - Released land is used for agricultural purposes (nearly 99.5 percent) growing crops. Types of
crops cultivated on the released land are rice and cassava. Rice is cultivated for household consumption mostly and cassava for sell. The data on raising livestock is not significant.
Income Generation In all three provinces, the main income from agricultural production comes from cassava while rice and maize are also income generating crops. The small share of income is from selling fruits too. - In Battambang, the estimated average household income from agricultural production on
the released land is US$3,141 per year, which corresponds to US$261.75 per household, per month.
- In Banteay Meanchey, the average household income is highest compared to other two provinces which is US$3,969 per year, equivalent to US$330.75 per household, per month.
- In Pailin, the estimated household’s average income is US$3,248 per year. This is equivalent to US$270.66 per household, per month.
Expenditure - Food, clothes and health are the main priorities for household expenditures.
Livelihood and Future Plans for the Use of Released Land - As a result of land release, majority of households started to cultivate different types of
crops. Future plans for the use of released land are to use for agricultural purposes. Use of Land that was thought to be contaminated / fear of contamination - Household interviews confirmed that the majority of villagers already used land that they
feared or thought was contaminated. People follow what their relatives or neighbors do. The local practice of checking if the land is safe is burning grass or letting animals to graze in the suspected land or plowing the land. The ways of addressing fear issue were reported as: (1) inform village chief and (2) inform operator MAPU. Field work from the Final Project evaluation suggests that use of suspected hazardous land, is often facilitated by informal mine clearance (referred to as threat reduction as it is not to national standards, nor done by accredited operators).
Loan and Labor Market - Land certificates are the main documents that make farmers eligible for getting a loan. The
amount of loan depends on the utilizable safe land. Hence, after release of safe land
12
farmers were able to borrow more to buy agricultural inputs and hire more agricultural labor.
Mine Risk Education - Households are aware of risks of mines through MAPUs and Village Chiefs. However,
women awareness about risks of mines is very low as they do not attend village meetings or any other gatherings related to community issues.
Land Prioritization Process - Prioritization process is well known to community representatives such as informing village
chiefs or MAPUs on suspected contaminated lands during village meetings. However, village meetings are held only one time per year. The Final Project evaluation suggests that beneficiaries were mostly informed that their land had been selected for clearance. These findings indicate that actual land prioritization does not happen through community meetings but through informing villagers that their lands are selected for clearance works.
Gender - Land Titles: Soft Titles (92.3 percent) are joint titles with spouse, while Hard Titles are less
joint titles (58.8 percent). - Labor Market: due to increase of utilizable safe land, farmers hire more labor and majorities
hire women for certain agricultural works, 91.7 percent of farmers reported hiring women on a seasonal basis.
- Assets: Decisions for buying assets based on the additional income from released land are joint decisions with spouses (85.9 percent of households take joint decisions).
Ownership of Released Land Figure 1 shows that out of 491 interviewed households, nearly 98 percent owned released land. For households (nearly 2 percent) who did not own released land the reason was reported as selling out land to repay loan.
Figure 1: Do you still own cleared land?
Yes, 97.8%
No, 2.2%
13
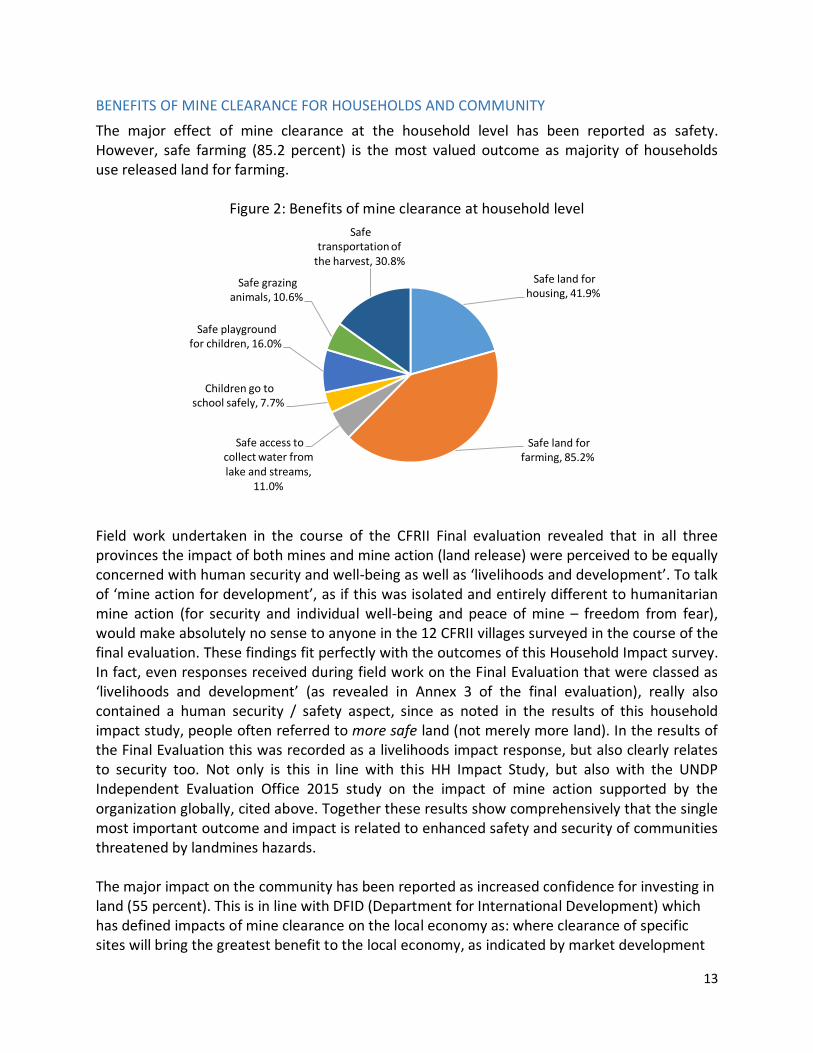
BENEFITS OF MINE CLEARANCE FOR HOUSEHOLDS AND COMMUNITY
The major effect of mine clearance at the household level has been reported as safety. However, safe farming (85.2 percent) is the most valued outcome as majority of households use released land for farming.
Figure 2: Benefits of mine clearance at household level
Field work undertaken in the course of the CFRII Final evaluation revealed that in all three provinces the impact of both mines and mine action (land release) were perceived to be equally concerned with human security and well-being as well as ‘livelihoods and development’. To talk of ‘mine action for development’, as if this was isolated and entirely different to humanitarian mine action (for security and individual well-being and peace of mine – freedom from fear), would make absolutely no sense to anyone in the 12 CFRII villages surveyed in the course of the final evaluation. These findings fit perfectly with the outcomes of this Household Impact survey. In fact, even responses received during field work on the Final Evaluation that were classed as ‘livelihoods and development’ (as revealed in Annex 3 of the final evaluation), really also contained a human security / safety aspect, since as noted in the results of this household impact study, people often referred to more safe land (not merely more land). In the results of the Final Evaluation this was recorded as a livelihoods impact response, but also clearly relates to security too. Not only is this in line with this HH Impact Study, but also with the UNDP Independent Evaluation Office 2015 study on the impact of mine action supported by the organization globally, cited above. Together these results show comprehensively that the single most important outcome and impact is related to enhanced safety and security of communities threatened by landmines hazards. The major impact on the community has been reported as increased confidence for investing in land (55 percent). This is in line with DFID (Department for International Development) which has defined impacts of mine clearance on the local economy as: where clearance of specific sites will bring the greatest benefit to the local economy, as indicated by market development
Safe land for housing, 41.9%
Safe land for farming, 85.2%
Safe access to collect water from lake and streams,
11.0%
Children go to school safely, 7.7%
Safe playground for children, 16.0%
Safe grazing animals, 10.6%
Safe transportation of
the harvest, 30.8%
14
and investment in land and infrastructure. Other major impact recorded as raising more animals (45.7%). Other 10.1 percent stated benefits such as: (1) people can farm more than before; (2) improved and easy farming; (3) feeling happy that the lands are mine free and (4) feeling safer.
Figure 3: Benefits of mine clearance at community level
As above, an enhanced sense of security and confidence in the land, which as this study reveals translates into greatly increased land values, naturally feeds into great confidence in investing in the land.
LAND RIGHTS In Cambodia, there are two types of land title classification such as: Hard Titles and Soft Titles. Hard titles are the strongest form of ownership and duly recognized at a national level by the cadastral office and the Ministry of Land Management. The hard title is issued by the Land Management and Planning office. Soft titles are provided by the District Office or Local Sangkat and are not registered at a national level but still considered as a possessory status. However, in practice majority of property transactions occur with soft titles to avoid ownership transfer fees and taxes. Soft Title The household information shows that majority of households (49 percent) hold Soft Titles, in most of the cases issued by the Local Sangkats. And 51 percent reported that do not have soft titles, major reasons were recorded as: (1) do not know the process of getting it; (2) do not need soft title; (3) applied and it’s under process. Hard Title The information below illustrates that 44.2 percent of households are having a Hard Title. Interestingly, Battambang have highest number of households with hard titles (69.4 percent). Mainly, (98.6 percent) Hard Titles are issued by the Provincial Governor. Those households who
Confidence investing in land,
55.0%
Raising more animals, 45.7%
Other, 10.1%
15
did not have hard titles reported reasons such as: (1) applied under the process; (2) don’t know the process of getting a hard title; (3) too expensive; (4) cannot afford it; and (5) do not need it.
Figure 4: Percentage of household having hard and soft titles
Households without Land Titles Figure 5 illustrates that 80.8 percent of households hold soft or hard titles. However, 19.2 percent do not own any land titles which means they don’t have any land ownership certificate.
Figure 5: Percentage of households with and without land titles
Figure 6 shows that nearly 92.3 percent of Soft Titles are joint title with spouses, while Hard Titles are only 58.8 percent.
39.9%
68.0%
50.7% 49.0%
69.4%
7.8% 9.9%
44.2%
0.0%10.0%20.0%30.0%40.0%50.0%60.0%70.0%80.0%
Battambang Banteay Meanchey Pailin Total all province
Households having Soft Titles Households having Hard Title
Households with Hard and
Soft Titles, 80.8%
Households without land certificates,
19.2%
16
Figure 6: Is Soft Title a joint title with your spouse?
Figure 7: Is hard title a joint title with your spouse?
LAND DISPUTES Figure 8 illustrates that land disputes is not an issue in the three provinces. In total, 95.8 percent respondents stated that they have not experienced land disputes, grabbing or other related problems. Only 4.2 percent of households mentioned that they have experienced disputes (1) due to cash of claim with neighbor; (2) lack of valid legal documents and (3) cash of claim with local authorities.
Yes, 92.3%
No, 7.7%
Yes, 58.8%
No, 41.3%
17
Figure 8: Disputes on the released land
Field work from the CFRII Final Evaluation also revealed similar evidence. However, in one village, Ta Mang in Kouk Romiet commune, Thmar Pouk district, Banteay-Meanchay an economic concession had led to a major land dispute with local villagers. UNDP had prior knowledge of this, and had evidence that it had affected 19 suspected areas that were originally included for release in the 2014 work plan, and some of these sites affected the village of Prasant Tbaeng in Banteay Chhmar commune immediately to the north of Ta Mang village. Although FGDs were held in the course of the Final Evaluation in both villages, the land dispute was only mentioned in Ta Mang. UNDP removed the sites from the 2014 work plan, although some suspected areas within the economic concession had been cleared previously under both CFRII (by CMAC) and by other operators with donor funding in the area. Some of the economic concession was converted on appeal to social concession land, and handed back to the villagers, and further research is currently being undertaken on this issue (due to be completed by end of December 2015).
LAND SIZE AND VALUE BEFORE AND AFTER CLEARANCE There was no baseline study on the exact size and value of household’s utilizable land before clearance. However, people had fresh memories (from 2011 to 2013) on their lands size before the land release. Farmers stated that the value of their land is higher due to increased productivity as they can use their entire land, thanks to clearance. Hence, clearance enabled households to utilize their land in its full potential, subsequently increasing agricultural productivity, which in turn affected value of their lands.
Table 4: The size of land before and after clearance
Province
Total Battambang Banteay Meanchey Pailin Before After Before After Before After Before After
Average size of utilizable residential land (ha) 0.3 0.4 0.1 0.3 0.2 0.2 0.2 0.3
Average size of utilizable agricultural land (ha) 1.4 2.6 1.1 3.3 1.7 2.6 1.3 2.8
3.6%
5.5%
4.2%
4.2%
96.4%
94.5%
95.8%
95.8%
0% 10% 20% 30% 40% 50% 60% 70% 80% 90% 100%
Battambang
Banteay Meanchey
Pailin
Total all provinces
Yes No
18
It is noticeable that in two provinces the size of residential land increased, and in all provinces the size of agricultural land increased after land release, represented here as clearance. These results are likely to be the result of actual clearance, as usually where land has been cancelled (through NTS) or released (through TS) there would be little discernible difference in land area being used (since even suspect land is often used, as documented above). The fact that formal clearance by CFRII has resulted in such an increase in agricultural land is highly significant, and illustrates that although the informal private sector may have opened up sufficient land for subsistence, clearance by the formal sector has made a substantial further contribution. The informal sector, that includes self-help demining by farmers themselves, as well as the work of paid private contractors, may avoid high-risk minefields and many examples were found in the course of the field-work for the final evaluation where the informal sector had cleared part, but not all of a farmer’s land. Evidence from field work in the final evaluation suggested that part-clearance of a farmer’s contaminated land, in order to give ‘enough land’ to subsist on, was quite common, and would explain why formal clearance can add value, and release still more land, increasing the land area available. There were other examples however where villagers either through self-clearance or by paying the private sector, established large plots on hazardous areas as a means of staking a claim to the land (it had to be under cultivation and occupied in order to establish such a claim during the 1998-2001 window before the passing of the Land Law.) These findings are highly significant though, and illustrate that although farmers have both self-cleared, and used the private informal mine action sector to access land, and continue to farm land they consider hazardous (often with evidence of mines turning up, especially during ploughing), the formal mine action sector does contribute and have impact in terms of increasing the availability of safe land for farming. In other cases, evidence from the field work on the final evaluation suggested that villagers using suspect land, cultivated in ways designed to limit the risks, and that once clearance by the formal sector had taken place they were confident to cultivate the land differently, especially with regards to the use of power ploughs and tractors. In turn these changes greatly enhanced efficiency and productivity of farming undertaken on the land. Therefore, even in instances like these where there is no increase in the area of land available for agriculture, the way in which it is being farmed may be far more efficient, directly enhancing livelihoods and community development. Collected information illustrates significant increase on the value of land after the release of lands. This also shows the link between size and value of released land – bigger portions of cleared land and increased safety and agricultural productivity resulted in higher value of residential and agricultural lands. Tables 4, 5, & 6 illustrate changes in prices after project intervention, in each province.
Table 5: The value of Residential Land before and after clearance Province The average price before
clearance (US$ per ha) The average price after clearance (US$ per ha)
LAND USE Table 7 demonstrates that nearly 100% of households use released land for agricultural purposes. Raising livestock reported more in Battambang while people in Banteay Meanchey and Pailin do not practice much raising livestock. The data below represents both housing and agricultural beneficiaries.
Table 7: Use of Released Land
Land Use Battambang Banteay Meanchey Pailin
Growing crops 99.5% 99.2% 100.0% Raising livestock 23.8% 3.3% 11.1% Renting to other farmers 0.5% 0.0% 0.0% Other 1.0% 0.8% 0.0%
Percentage is calculated out of total respondents in each province who could choose up to 4 answers.
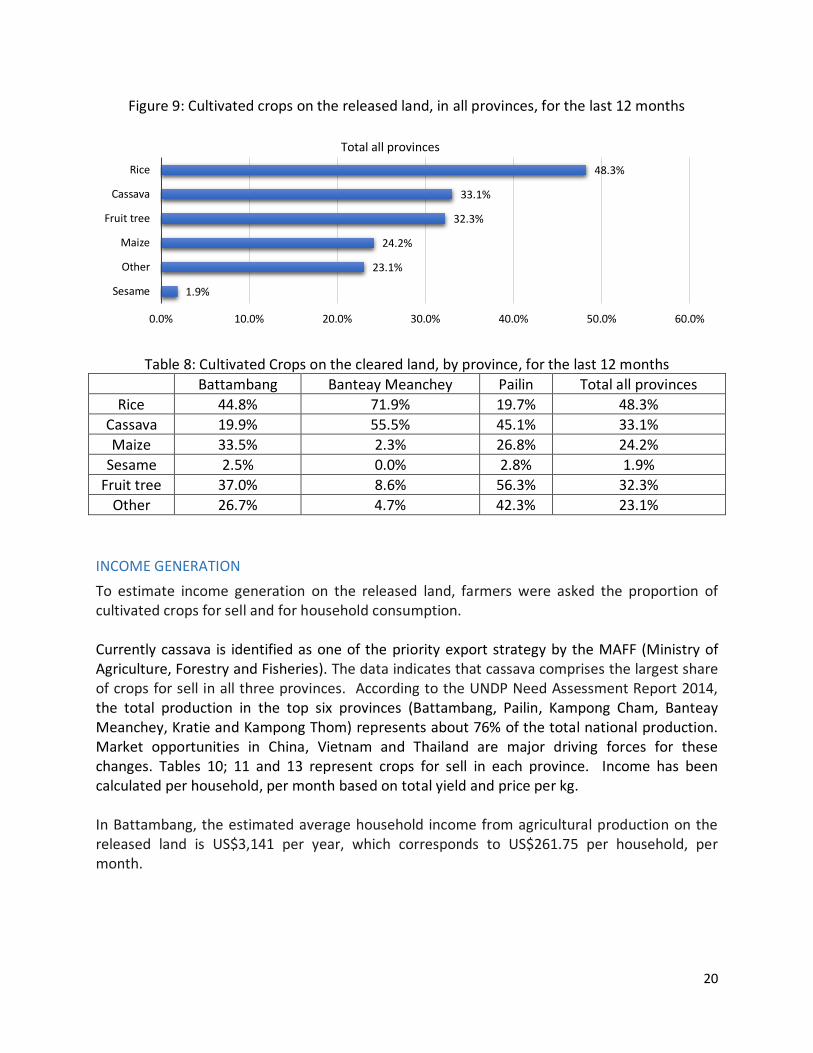
Rice is the most important agricultural commodity in Cambodia and the staple food of the Cambodian people. Figure 9 and Table 8 show that rice cultivation is dominant in Banteay Meanchey (71.9 percent) and Battambang (44.8 percent) while in Pailin, people grow more cassava (45.1 percent). This could be explained by close proximity of Pailin to Thai borders. Farmers reported that there is high demand for cassava from Thailand for the last two years, therefore farmers cultivating more cassava on a seasonal basis and selling the crop through intermediaries.
20
Figure 9: Cultivated crops on the released land, in all provinces, for the last 12 months
Table 8: Cultivated Crops on the cleared land, by province, for the last 12 months Battambang Banteay Meanchey Pailin Total all provinces
Sesame 2.5% 0.0% 2.8% 1.9% Fruit tree 37.0% 8.6% 56.3% 32.3%
Other 26.7% 4.7% 42.3% 23.1%
INCOME GENERATION To estimate income generation on the released land, farmers were asked the proportion of cultivated crops for sell and for household consumption. Currently cassava is identified as one of the priority export strategy by the MAFF (Ministry of Agriculture, Forestry and Fisheries). The data indicates that cassava comprises the largest share of crops for sell in all three provinces. According to the UNDP Need Assessment Report 2014, the total production in the top six provinces (Battambang, Pailin, Kampong Cham, Banteay Meanchey, Kratie and Kampong Thom) represents about 76% of the total national production. Market opportunities in China, Vietnam and Thailand are major driving forces for these changes. Tables 10; 11 and 13 represent crops for sell in each province. Income has been calculated per household, per month based on total yield and price per kg. In Battambang, the estimated average household income from agricultural production on the released land is US$3,141 per year, which corresponds to US$261.75 per household, per month.
48.3%
33.1%
32.3%
24.2%
23.1%
1.9%
0.0% 10.0% 20.0% 30.0% 40.0% 50.0% 60.0%
Rice
Cassava
Fruit tree
Maize
Other
Sesame
Total all provinces
21
Table 10: Battambang - cultivated crops sold in the last 12 months Crop Average total yield (kg)
Average price
(US$/kg) Average income
(US$) Rice 551 0.54 302 Cassava 10,707 0.11 1,247 Maize 4,340 0.19 862 Sesame 182 1.82 235 Fruits 320 0.46 148 Other 429 0.80 347 TOTAL 3,141 In Banteay Meanchey, the average household income is highest compared to other two provinces which is US$3,969 per year, equivalent to US$330.75 per household, per month.
Table 11: Banteay Meanchey - cultivated crops sold in the last 12 months Crop Average total yield (kg)
Average price
(US$/kg) Average income
(US$) Rice 1,524 1.76 2,684 Cassava 15,817 0.06 1,051 Maize 100 0.25 25 Sesame 0 0 0 Fruits 1,004 0.20 209 Other 0 0 0 TOTAL 3,969 In Pailin, the estimated household’s average income is US$3,248 per year. This is equivalent to US$270.66 per household, per month.
Table 12: Pailin - cultivated crops sold in the last 12 months Crop Average total yield (kg)
Average price
(US$/kg) Average income
(US$) Rice 214 0.24 52 Cassava 18,243 0.09 1,755 Maize 5463 0.15 835 Sesame 50 1.26 63 Fruits 165 1.04 173 Other 597 0.61 370 TOTAL 3,248 Crops for household consumption Rice is the largest part of cultivated crops for household consumption. According to the Cambodia Socio-Economic Survey (2004) rice is the most important food item in the daily diet of Cambodians. Rice accounts for almost two-thirds of the total caloric intake, following by fish (8% of caloric intake). Hence, the project provided basic ground for increasing agricultural
22
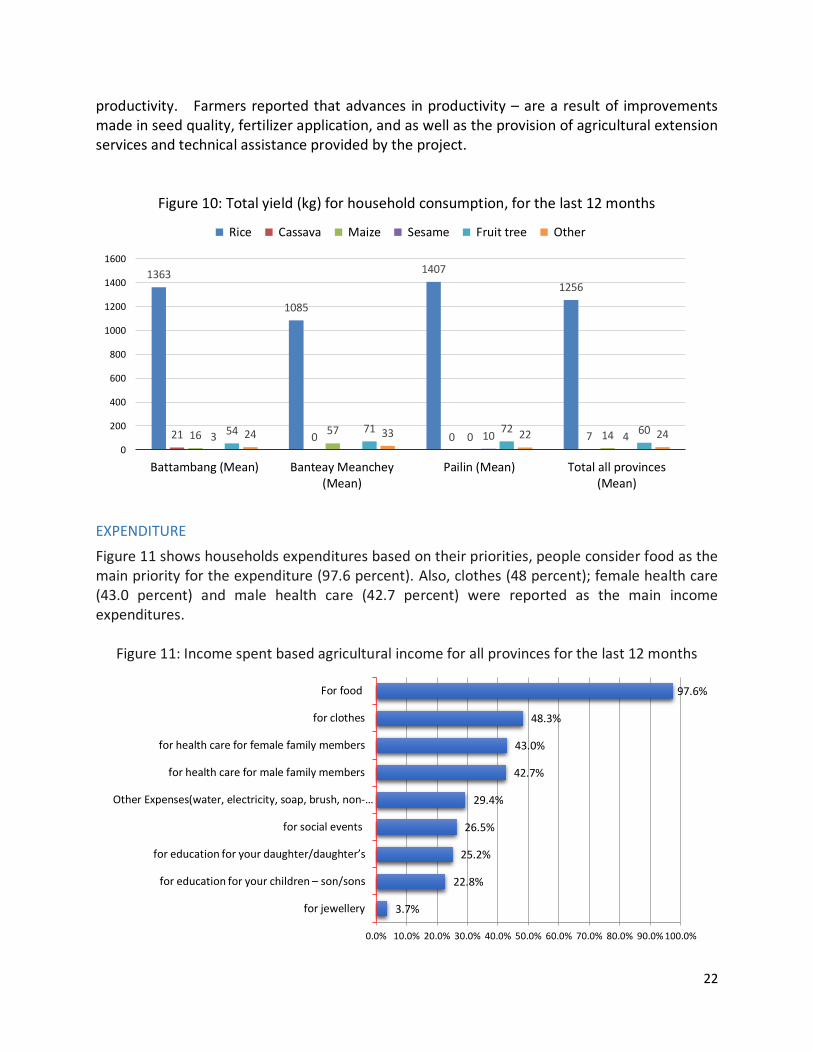
productivity. Farmers reported that advances in productivity – are a result of improvements made in seed quality, fertilizer application, and as well as the provision of agricultural extension services and technical assistance provided by the project.
Figure 10: Total yield (kg) for household consumption, for the last 12 months
EXPENDITURE Figure 11 shows households expenditures based on their priorities, people consider food as the main priority for the expenditure (97.6 percent). Also, clothes (48 percent); female health care (43.0 percent) and male health care (42.7 percent) were reported as the main income expenditures.
Figure 11: Income spent based agricultural income for all provinces for the last 12 months
Other Expenses(water, electricity, soap, brush, non-…
for social events
for education for your daughter/daughter’s
for education for your children – son/sons
for jewellery
23
The results of the households expenditure shows that 40 percent of households spent their additional income from land clearance based on the assets. Figure 12: Have you bought any assets based on the additional income from released land, for
the last 12 months.
Figure 13: Type of assets purchased based on the additional income from cleared land
Respondents were asked if buying assets were joint decision with the spouses, for which 85.9 percent reported that assets acquired were based on the joint decision with their spouses. Figure 14 provides evident data on the decision making within households.
CHANGES IN LIVELIHOOD Data below presents that 74.9 percent of respondents started to grow different types of crops as a result of land clearance, 38.8 percent of stated increase in rice harvest and 30.1 percent raising more livestock, 25.3 percent stated growing more vegetables and fruits and only 2 percent started to raise fish.
Figure 15: As a result of land clearance, have you changed your livelihood?
HOUSEHOLD PLANS FOR THE USE OF CLEARED LAND IN 5 YEARS In the future, majority of households plan to use their land for agricultural purposes. Qualitative information on households showed that due to decreasing soil fertility, crop cultivation characterized by shorter rotations compared to traditional system, therefore farmers change type of cultivated crops due to land exhaustion (55 percent of households).
14.1%
85.9%
0.0%10.0%20.0%30.0%40.0%50.0%60.0%70.0%80.0%90.0%
100.0%
Head of HH only Joint Decision with Spouse
74.9%
38.6%
30.1%
25.3%
24.6%
2.0%
1.3%
0.0% 20.0% 40.0% 60.0% 80.0% 100.0%
Started to grow different types of crops
Started to harvest more rice
Started to raise more livestock (cow, goat,…
Started to grow more vegetables
Started to plant more fruits
Started to raise fish
Other
25
Figure 16: Households plans for the use of cleared land in 5 years
MINE RISK EDUCATION Cambodian Mine Action Authority conducts series of educational activities aimed at raising awareness about mines and ERWs danger, promotes behavior changes through training and liaison with communities. Objectives of awareness campaign are to reduce risk to people, environment and properties. Households were asked about awareness of mine and ERWs risk and sources of campaigns to verify the level awareness in contaminated areas. Figure 17 demonstrates that in the average 98 percent of households received information about the risks of mines and ERWs.
Figure 17: Have you received any information about the risks of mine/ERW?
These figures reveal the saturation of MRE in mine affected communities, such as would be expected at such a mature phase of the Cambodian programme. The Final Evaluation recommends that UNDP and its donors do not support any further MRE in the target provinces, as those who remain vulnerable to mine and ERW hazards are highly unlikely to adjust their risk-taking behavior solely on the basis of information that leads to changes in knowledge. Studies that recommend more MRE to mitigate the risks of incidents with ATMs (resulting on taking old roads or ploughing suspect areas) are seen as naively optimistic. Such risk-taking is
84.0%
55.0%
37.3%
7.5%
4.6%
1.5%
15.0%
0.0% 20.0% 40.0% 60.0% 80.0% 100.0%
Use for farming
Change type of cultivated crops
Raise livestock or poultry
Other
Lease the land
Sell to repay loan
Build a house
96.8% 97.7% 100.0%
3.2% 2.3%
0%
10%
20%
30%
40%
50%
60%
70%
80%
90%
100%
Battambang Banteay Meanchey Pailin
No
Yes
26
engaged in for economic reasons, often in full knowledge of the risks. It is therefore unlikely that MRE will have any impact, or change behavior in this regard. MRE is still required for children, to mitigate against vulnerability that does come from sheer ignorance of the risks, and should be mainstreamed through the school curriculum such as has been the practice in Cambodia for many years. Figure 18 indicates that as a sources of information, mine clearance operators are the main players (76.5 percent), village chiefs and/or commune councils (nearly 61 percent), and relatives/friends (32.1 percent) and posters, signposts and leaflets (31.8 percent) are also one of the main awareness raising actors in the field.
Figure 18: Source of information
FEAR OF CONTAMINATION Collected information illustrates that people are still not free from the fear of landmines. The reasons for having a fear was recorded as lack of confidence that the land is safe (84.5 percent), have seen or found suspicious item (51.2 percent) and heard of accidents in the neighborhood (28.6 percent) and other reasons (12.6 percent).
Figure 19: Fear that community land or areas are still contaminated
Addressing a Fear Issue Respondents were asked if they know how to address the fear or risk issues. Majority of households mentioned: (1) inform village chief (79.4 percent), (2) inform operator MAPU (18.7 percent), and (3) don’t know what to do (0.4 percent). Use of Land that was thought to be contaminated This question was included as many farmers during field visit interviews mentioned that they still use or have used their land that they feared or thought was contaminated. The local practice of checking if the land is safe is burning the grass, letting animals to graze in the suspected land or ploughing the land. The information received from household’s interviews confirmed that 83.5 percent of household used their lands that they feared or thought was contaminated. As noted above, beneficiaries have routinely accessed and used suspect land prior to formal land release, including clearance. Often this has been because they know the area has been ‘threat-reduced’ 8by the informal sector, either by the farmers themselves through burning or informal clearance, or through hiring paid private deminers. There is much evidence from previous research and reports (such as a study commissioned by HI in 2005) about the work of this informal private sector. However, threat-reduced areas are not ‘cleared’ to National Standards, and the residual risk in these areas is far higher than land that has been released according to proper processes specified in National Standards, Thus, whilst threat-reduced land is safer, hence the relatively very low accident rates given that the vast majority of people have been using suspect land for agricultural purposes, it is still land that people fear, or use differently (no power ploughs or tractors, only hoes etc) to mitigate perceived risks. Finally, it should be noted, as stressed in the Final Evaluation that some classes of mines (such as the Type 69, POMZ etc) now have very low levels of functionality. Operators report that hazardous areas with such low risk mines are routinely being farmed across. However, other mines – such as the PMN or PMN2 – should be considered high-risk mines and remain highly functional.
8 Threat reduction is used here in reference to the work of the ‘informal private’ mine action sector (individual private de-miners, sometimes called village deminers, and more organized groups working commercially within a low-priced Cambodian market place for mine action services . Threat-reduction refers to the physical elimination of threat items (mines and items of ERW from an area, but without the level of confidence that comes from clearance to national standards. Threat-reduction in mine action was the way HALO Trust referred to its mobile teams focused on reducing the risks of travel on roads in Angola and elsewhere in the mid-2000s. The did not claim their processes were road clearance as such, but rather sought to reduce the number of threat items on the roads, and therefore the overall risk, to broadly acceptable levels, whilst accepting there remains a residual risk. The advantage of this type of process is that it can make a rapid difference risk levels over a far greater amount of road network, in a relative short period of time.
28
Figure 20: Were you using you land that you feared or thought was contaminated by mines or ERWs before clearance?
The main reasons of using contaminated lands before clearance were recorded as: (1) neighbor or other village residents are doing the same (34.1 percent); (2) used some parts of land that thought was not contaminated (32.7 percent); (3) due to farming needs (28.6 percent); (4) thought that the risk was not serious (13.6 percent); and (4) other reasons (33.2 percent).
These findings indicate that despite of knowing the danger and mine risks, households still use locally practiced traditional ways that they believe reduces the risk. LOAN AND LABOR MARKET Questions on Loan and Labor Market were included into HHQ as field interviews prior to the design of the survey showed connection of these aspects with mine clearance and land release. Majority of farmers (78.1) percent get a loan on a regular basis from the local financial institutions. One of the main documents of getting a loan is land certificates. The size of utilizable safe land make farmers eligible for certain amount of loan. As farmers practice borrowing money from financial institutions for many years this shows that farmers have positive loan repayment records.
Figure 21: Do you get a loan on a regular basis?
Yes, 83.5%
No, 16.5%
73.7%
82.8%
87.3%
78.1%
26.3%
17.2%
12.7%
21.9%
0% 10% 20% 30% 40% 50% 60% 70% 80% 90% 100%
Battambang
Banteay Meanchey
Pailin
Total all provinces
Yes No
29
Main three reasons for taking loan were as follows: (1) to buy agricultural inputs (80 percent), (2) hire agricultural labor (22.4 percent) and (3) to cover health expenses (20 percent).
Figure 22: Reasons for getting a loan
Nearly 81.9 percent of households said that their loan amount depends on their loan size and data shows that 78.8 percent stated that they have been able to borrow more as a result of land clearance. As mentioned above, there is strong correlation between increase in land size and loan amount. Micro Finance Institutions and banks are the main sources for the loan.
Figure 23: Does your loan amount depend on your land size?
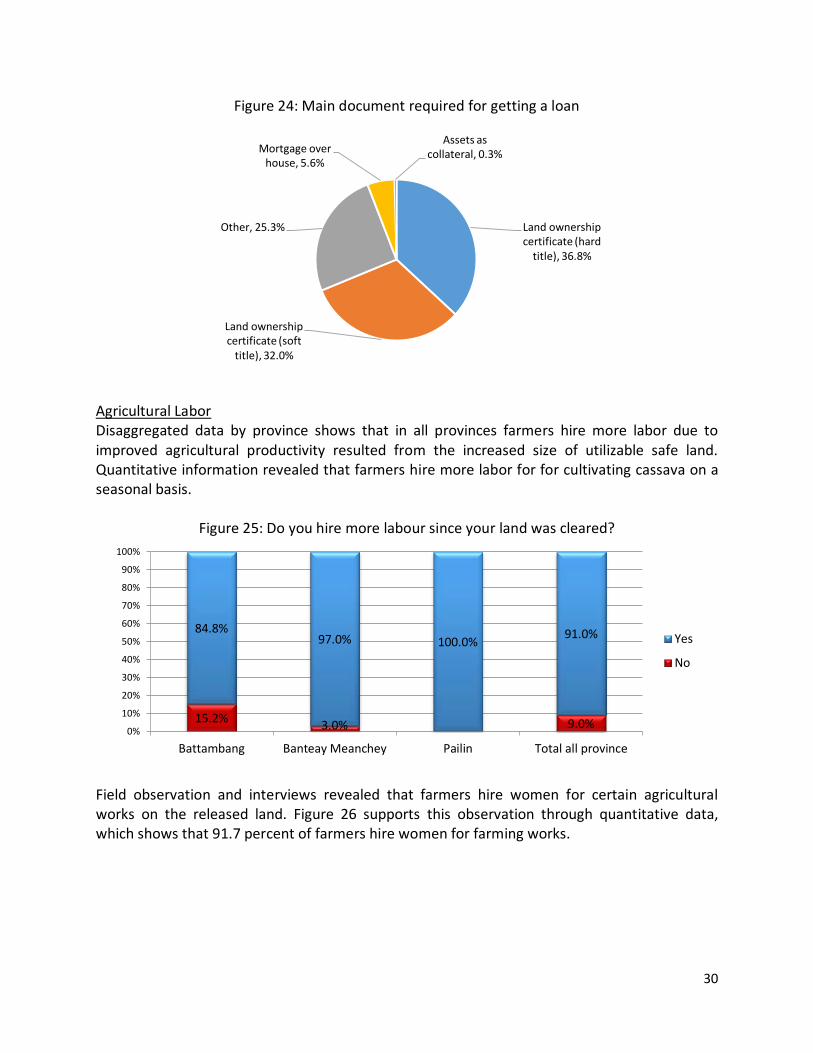
Figure 24 shows that land titles are the main document required by micro finance institutions and banks. Thus, loan amount depends on the size of utilizable safe land. As “Other” required document which made 25.3 percent households mentioned: (1) family book; (2) nationality ID card; and (3) group loan.
To buy agricultural inputs (seed, tools) Hire agricultural labour
To cover health expenses To buy food for household
Business development To repair/reconstruct house
To pay school/education cost for the children To pay back original loan
For social ceremonies, annual celebrations Other
To buy/rent land
Yes, 81.9%
No, 18.1%
30
Figure 24: Main document required for getting a loan
Agricultural Labor Disaggregated data by province shows that in all provinces farmers hire more labor due to improved agricultural productivity resulted from the increased size of utilizable safe land. Quantitative information revealed that farmers hire more labor for for cultivating cassava on a seasonal basis.
Figure 25: Do you hire more labour since your land was cleared?
Field observation and interviews revealed that farmers hire women for certain agricultural works on the released land. Figure 26 supports this observation through quantitative data, which shows that 91.7 percent of farmers hire women for farming works.
Land ownership certificate (hard
title), 36.8%
Land ownership certificate (soft
title), 32.0%
Other, 25.3%
Mortgage over house, 5.6%
Assets as collateral, 0.3%
15.2% 3.0% 9.0%
84.8% 97.0% 100.0% 91.0%
0%
10%
20%
30%
40%
50%
60%
70%
80%
90%
100%
Battambang Banteay Meanchey Pailin Total all province
Yes
No
31
Figure 26: Do you hire women labor for agricultural/farming works?
15.7% 1.5%
8.3%
84.3% 98.5% 100.0% 91.7%
0%
10%
20%
30%
40%
50%
60%
70%
80%
90%
100%
Battambang Banteay Meanchey Pailin Total all province
Yes
No
32
FOCUS GROUP DISCUSSIONS
Focus Group Discussions (FGDs) were held with community representatives such as: village chiefs; commune councils, school teachers and directors, village volunteers and other community representatives in Battambang, Banteay Meanchey and Pailin. Each FGD consisted of 9 to 12 community representatives. FGDs were organized and held by facilitators and note takers. The subjects for discussions were as follows: (1) livelihood constraints (2) land prioritization process; (3) benefits of mine clearance; (4) role of women in land prioritization process; and (5) mine risk education. Livelihood constraints Community representatives mentioned livelihood constraints such as: natural disasters, effects of climate change and decreased demand for rice. People from Banteay Meanchey stated that natural disasters caused less agricultural production which consequently affected farmer’s abilities to repay their loans. In Banteay Meanchey and Pailin land contamination was not mentioned as livelihood constraint but people mentioned that they don’t have confidence that community roads are safe to use as they still hear of accidents in neighborhood or find suspicious items. Also, Battambang community representatives stated that Cambodian Mine Action Center (CMAC) did not clean all mines and they suggest that CMAC should address this issue. Land prioritization process and role of woman in land prioritization process Representatives from Pailin, Battambang and Banteay Meanchey highlighted the process of land prioritization such as village or commune chief invite people to join village meeting where discussion held about contaminated or suspected areas and proposal for land clearance is submitted to CMAC or MAPU for demining. However, Battambang and Banteay Meanchey representatives reported that village meetings held only one time a year. Also, FGDs participants mentioned that usually women are not involved in the land prioritization process and do not attend village and other community gatherings due to being occupied with household works. Benefits of mine clearance Construction of new roads, short proximity to health centers and construction of new schools - increased access to education in villages, cultivation of different types of crops, increased income due to improved agricultural productivity and feeling safer - were mentioned as community benefits from mine and ERW clearance. Mine risks and awareness FGDs information shows that villagers believe that men is in more in danger compared to women, as men does most of the agricultural works and have an increased exposure through going to forests and cultivating contaminated lands. Records show that villagers do not have confidence that agricultural and other community lands are fully safe to use. Community representatives believe that awareness for risks and mine education is higher in men compared to women as majority of men in the villages used to be soldiers and they know
33
about danger of mines and how to address the risks, while women are not equally aware and educated about risks. However, they believe that women education is important as they could pass the knowledge or message about risks of contamination and danger to children. The results of scoring women mine risk education were rated in all three provinces as - poor. Suggested methods of awareness campaigns were as follows: posters and leaflets in schools, TV or radio broadcasts, and campaigns during local festivals. And recommended regularity for awareness campaigns was - three times a year.
34
CONCLUSIONS Based on these observations and findings, land release enhanced the well-being of people in mine affected communities through increasing access to safe lands. On the household level, a major benefit of land release is safety and on the community level is increased confidence investing in land. Land disputes and grabbing cases are very rare. Several years after release of land, beneficiary households in the vast majority of cases still own the land. The majority of households hold land ownership certificates (Soft or Hard titles). Land Titles provide all legal rights and typically are used to get a loan. The loan is usually for buying agricultural inputs and hiring extra labor. There is direct impact of mine clearance on the labor market and work opportunity for women. As a result of increased safe agricultural land, farmers hire more labor on a seasonal basis and for certain work female labor is preferred and hired. On the released land, households grow crops for the market and for domestic consumption (cassava for the market, and rice for household consumption). Based on the generated additional income, priority expenditures are for food and healthcare. Also, release of safe land leads to a marked increase in the value of land. Hence, mine action land release in target areas provides a good basis for improved livelihood and local economic development. Land prioritization through village meetings is not in practice that participative, and these village meetings are held only once a year. In fact, both this study and the Final evaluation found that households typically have been engaged, only when it is time to inform them that their land has been selected for clearance. Usually these decisions are taken between the Village Leader and the MAPU, with the operators having the ability to chose tasks, reject some and even in some cases add in their own priorities for operations, based on their own criteria. People are aware of the risks of mines and existing local structures for demining. However, they have their own ways of managing and reducing risk if their land is believed to be contaminated. Almost all households have used land that they feared was contaminated. Before release by the formal sector. In the recent past, during the lifetime of CFr II, these seemingly high risk practices have been mitigated by informal mine action, both self-help village demining by farmers on their own land, or through employing private informal deminers who have ‘threat-reduced’ (if not cleared to national standards) the land. Equally, some mines have limited functionality, and local risk assessments based on acquired knowledge over the years are often very reliable as to what types of mines are present in hazardous areas, and how functional and therefore risky they are. New evidence from a study of the MAPU planning process has confirmed that high risk A1 minefields will not be cleared by the informal sector. This account for why farmers will use some suspect land, but in many cases not all of it, leaving the areas they believe to have high-risk mines. Education campaigns on mine risks in schools are important factor as children are exposed to risks through playing grounds or exploring forests. Educational campaigns are not considered to be an important aspect for villagers as majority are aware of risks, especially former soldiers, and have advanced risk assessment and mitigation practices, as discussed above.
35
Annex I: Survey list of provinces, villages and number of respondents Province Village Number of Respondents Percent Battambang Prey Pen 13 4.6 Kilo 24 8.5 Pchev 41 14.6 O Trav chou 21 7.5 Chrang Kpos 23 8.2 Ta Toak 40 14.2 Veal Rolim 25 8.9 O Nonoang 18 6.4 Plov Meas 23 8.2 Kork Roka 53 18.9 Total 281 100.0 Banteay Meanchey Tamang 31 24.2 Prasat Tbeng 16 12.5 Dong Rek 22 17.2 Khvav Lech 7 5.5 Domnak Kokos 8 6.3 Banteay Timuy 24 18.8 Don Noy 20 15.6 Total 128 100.0 Pailin Veal Cheng 20 28.2 Kon Damrei 10 14.1 Sre Anteak 11 15.5 Kro Chab 30 42.3 Total 71 100.0
36
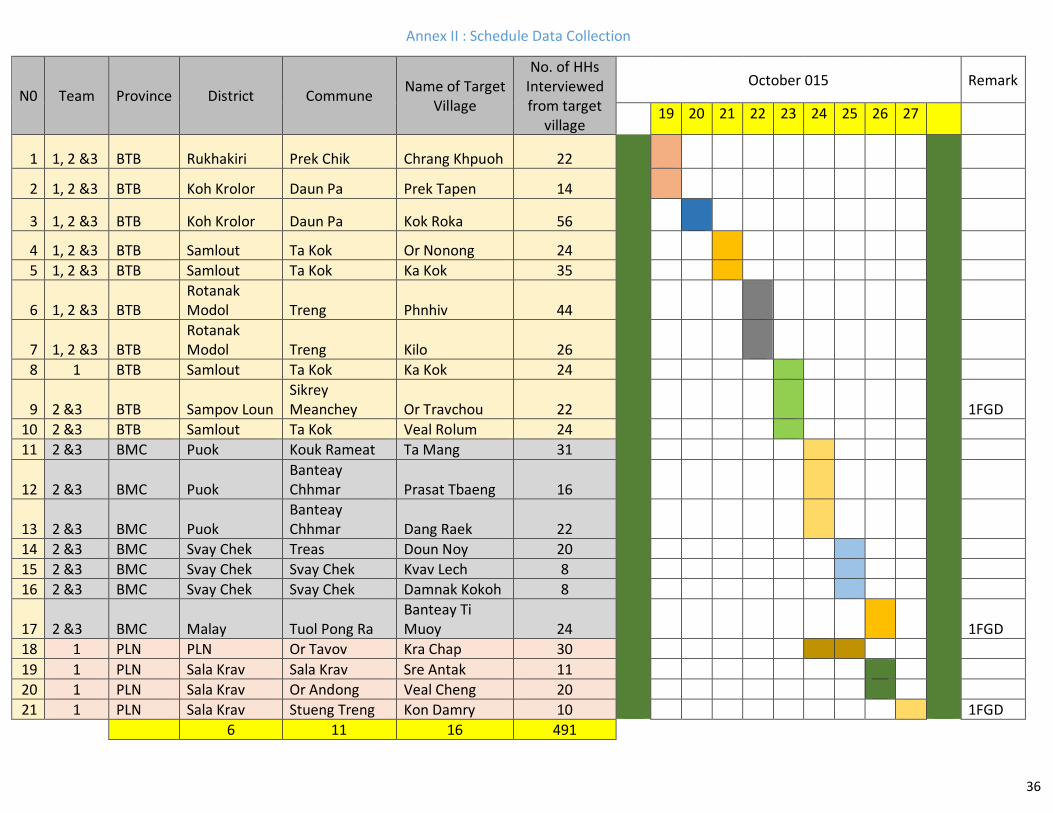
Annex II : Schedule Data Collection
N0 Team Province District Commune Name of Target Village
10 2 &3 BTB Samlout Ta Kok Veal Rolum 24 11 2 &3 BMC Puok Kouk Rameat Ta Mang 31
12 2 &3 BMC Puok Banteay Chhmar Prasat Tbaeng 16
13 2 &3 BMC Puok Banteay Chhmar Dang Raek 22
14 2 &3 BMC Svay Chek Treas Doun Noy 20 15 2 &3 BMC Svay Chek Svay Chek Kvav Lech 8 16 2 &3 BMC Svay Chek Svay Chek Damnak Kokoh 8
17 2 &3 BMC Malay Tuol Pong Ra Banteay Ti Muoy 24 1FGD
18 1 PLN PLN Or Tavov Kra Chap 30 19 1 PLN Sala Krav Sala Krav Sre Antak 11 20 1 PLN Sala Krav Or Andong Veal Cheng 20 21 1 PLN Sala Krav Stueng Treng Kon Damry 10 1FGD
6 11 16 491
37
Annex III : Household Questionnaire
Serial number of questionnaire: ...................
Name of village: .............................. (ID code:............................)
Name of commune: ........................ (ID code:............................)
Name of district: ............................. (ID code:............................)
Name of province: .......................... (ID code:............................)
Name of interviewer:...................
Name of respondent…………………
Head of household name…………..
Date of interview:........................ time Started:............... time Completed:.........
Quality Control Record
Survey Team Leader's Name:.....................................................................
Questions to be checked:...........................................................................
Name of data enterer : ....................................................................
Date of data entered: .....................................................................
Questions to be checked:...................................................................
38
Introduction: We are conducting a survey on the impacts of mine clearance projects . Therefore, we will ask you questions about your household and land
use. Your land was cleared due to financial support of international donors and technical expertise of CMAA and UNDP. As the project ends, we need to
report about impact/changes in project beneficiaries livelihoods after the release of land. The interview usually takes 50 minutes to complete. The
information from this interview is strictly confidential, and will be used only for reporting the outcomes of land released in the post-clearance community.
This is voluntary and you can choose not to answer any or all of the questions if you want. However, we hope that you will participate since your views are
important.
SECTION 1 - SCREENING
1.1 Has this household been identified as poor, and been placed on the List of Poor Households or received an ID Poor? Please show the picture of ID Poor Card and ask household to show the card.
1 = Yes, ID Poor Card Number …………………
2 = Yes, ID Poor Card not seen
3 = No
1.2 When your land was cleared from mines or ERW?
Year ………………………
1.3 Do you still own cleared land
1. Yes 2. No (Go to Q 1.5)
39
1.4 If yes, what types of cleared land? 1. Housing land
2. Agricultural land
3. Both CONTINUE INTERVIEW - GO TO SECTION 2
1.5 Why you don’t own cleared land? (multiple response)
1. Sold land to repay loan
2. Sold land to open business
3. Sold land to cover social events ( wedding, annual festivities, other ceremonies)
4. Sold land to cover household medical expenses
5. Sold land to pay for children school
6. Lost land in disputes
7. Other (specify)______________ END OF INTERVIEW
40
SECTION 2 – HOUSING
2.1 Is this your house
1= Yes
2=Parent, Relative and/or friend’s
3= Rented
4=Other………………………………………………………
SECTION 3 – HOUSEHOLD INFORMATION AND LABOUR
Relationship with hh head
(using code below)
Sex
1=Male 2=Female
Age
(year)
Marital status
(using code below)
Economically active?
(using code below)
3.1 3.2 3.3 3.4 3.5
C
Question 3.1 Question 3.4. Question 3.5
41
1 Household head 2 Husband/wife 3 Sister-/brother-in-law 4 Sibling (brother or
sister) 5 Son or daughter 6 Son/daughter-in-law 7 Grandchild 8 Stepchild 9 Parent 10 Grandparent 11 Niece/Nephew
1 Married 2 Single 3 Divorced 4 Widow/Widowe
r 5 Other……………..
1 Active labour 2 Can do some work 3 Study and work 4 Only study 5 Disabled 6 Too old to work 7 Family work/house
work
Other jobs that earn income (besides household farm work) in the last 12 months, if any (please record based on the highest income).
Codes: 1= farm work within the village, 2= work outside village in Cambodia, 3= work in Thailand, 4= small trade, 5= palm juice/sugar production, 6= collecting resources from forests,
7=government official, 8= other (specify) ............................. 9 No job………………
What job or jobs? (multiple response)
(codes above)
How much earned per month in USD?
How many months worked per year?
3.6 3.7 3.8
42
Total
SECTION 4 – MINE AND ERW INFORMATION, PERCEPTION AND BENEFITS
4.1 Have you received any information about the risks of mine/ERW?
1= Yes
2= No (if No, next Q 4.1.2)
4.1.1. If yes, from what source of information? (multiple answer)
1.Mine clearance operators
2.Relatives/friends
3.Village chiefs/commune councillors
4. Posters, signposts, leaflets
5. Other specify:......................
43
4.1.2 What risks and difficulties have you faced as a result of land contamination? (multiple answer)
1. Lack of land for housing 2. Blocked access to my farmland 3. Blocked forestry access 4. Blocked access to lake and streams for collecting water and/or fishing 5. Lack of grazing ground 6. Lack of playing ground 7. High risks for children to go to school 8. Difficult for transporting farm produces 9. Unsafe travelling 10.Other specify:.........................
4.2 What benefits have you gained from mine clearance?
44
4.2.1 For your household (multiple answers) 1.Safe land for housing 2. Safe land for farming 3. Safe access to collect water from lake and streams 4. Children go to school safely 5. Safe playground for children 6. Confidence investing in land 7. Safe grazing animals 8. Raising more animals 9. Safe transportation of the harvest 10. Other specify……………………………………………………………………………………… Please record any comment ………………………………………………………………………………………. ……………………………………………………………………………………………………………………………………
4.2.2. For community (multiple answers) 1. Decline of casualties 2. Building roads 3. Building health centre
45
4. Building school 5. Community ponds/wells 6. Building marketing centre 7. Building pagoda 8. Safe community gathering place 9. Safe travelling 10. No fear of mine/ERW 11. Attracting migrant workers 12. Other specify:......................... Please record any comment…………………………………………………………………………………………… …………………………………………………………………………………………………………………………………………
4.3 Has your household experienced any incident with mine/ERW since you came to live in this village?
1 = Yes 2=No (Go to Q.4.4)
Total number of deaths:............................
Total seriously injured:..................
Total disabled:........................ Total animal deaths……………………
46
1. Adult male (from 17 y o):...............
1. Adult male (from 17 y o):................
1. Adult male (from 17 y o)
2. Adult female (from 17 y o):............
2. Adult female (from 17 y o):...............
2. Adult female (from 17 y o)
3. Male children (below 16 y o):...........
3. Male children (from 17 y o):.............
3. Male children (from 17 y o)
4. Female children (below 16 y o):..........
4. Female children (from 17 y o):.........
4. Female children (from 17 y o)
4.4 Do you still have a fear that community land or areas, including roads are contaminated?
1=Yes 2=No (if No, next Section 5)
4.5 If yes, why you have a fear? (multiple answer) a) Heard of accidents in the neighbourhoods
b) Lack of confidence that the land is safe
c) Have seen or found suspicious items
d) Other (specify)……………
4.6 Do you know how to address fear or risk issues? (one answer, only)
1. Inform village chief 2. Inform operator/MAPU 3. Burn grass on suspected land before the use 4. Plough land before utilization
47
5. Inform police 6. Don’t know what to do 7. Other (specify)……………………….. Please record any comment on fear or risk and its impact to household member’s behaviour …………………………………………………………………………………………………………… ……………………………………………………………………………………………………………………………
SECTION 5 – LAND USE AND PRODUCTIVITY Residential Land 5.1 Did you have residential land which was contaminated by landmine/ERW between 2011 - 2013?
1= Yes (if yes, NEXT Q 5.1.1) 2=No (If no go to Q.5.2) Agricultural Land
5.1.1 Were you using your residential land that you feared or thought was contaminated by mine or ERW before clearance?
1= Yes (If Yes, go to Q 5.1.2) 2=No (If No, go to Q 5.1.3)
5.1.2 If yes, why? (multiple answer)
1. Due to farming needs 2. My neighbor or other village residents are doing the same
48
3. Thought that the risk was not serious 4. Used only parts that was not contaminated 5. Other specify……………………… NEXT Q 5.1.3
5.1.3 What was the portion of homestead cleared of mine/ERW? (Please circle appropriate response below (only one response)
5.1.4 The size of your residential usable land before and after clearance? 1= Size of residential usable land before clearance…………………….ha 2=Size of residential usable land after clearance……………………………………….ha (Note: If less than one hectare, please record in ha, for ex: o.8 ha)
5.1.5 The value of your residential land before and after clearance? 1=Price before clearance (per ha)……………………………………USD 2=Price after clearance (per ha)…………………………………USD
Agricultural Land
49
5.2 Does your household own agricultural land?
1=Yes 2=No (If No, next Q.5.2.7)
5.2.1 If yes, the portion of the agricultural land cleared of mine/ERW between 2011-2013? (Please circle appropriate response (only one response)
1= All cleared 2= 1/4 cleared 3= 2/4 cleared 4= 3/4 cleared 5=Was not contaminated with mine or ERW (If was not contaminated NEXT Q 5.3)
5.2.2 Were you using your agricultural land that you feared or thought was contaminated by mine or ERW before clearance?
1= Yes (If Yes, go to Q 5.2.3) 2=No (If No, go to Q 5.2.4)
5.2.3 If yes, why (multiple answer) 1. Due to farming needs 2. My neighbor or other village residents was doing the same 3. Thought that the risk was not serious 4. Used only parts that was not contaminated 5. Other specify……………………… NEXT Q 5.2.4
50
5.2.4 The size of your usable agricultural land before and after clearance?
1= Size of agricultural land before clearance…………………….ha 2=Size of agricultural land after clearance……………………… ha (Note: If less than one hectare, please record in ha, for ex: o.8 ha)
5.2.5 The value of your usable agricultural land before and after clearance? 1=Price before clearance (per ha)………………………………USD 2=Price after clearance (per ha)…………………………………USD
5.2.6 How do you use your agricultural land? (multiple responses)
1= growing crops 2= raising livestock 3= renting to other farmers 4= other specify:……………………………..
5.2.7 If you don’t own agricultural land, why (multiple responses)? 1=Cannot afford it 2= came to resettle in the village after land distribution 3=sale after receiving of the released land because no saving to invest in farming 4=sale after receiving because of mine-contamination 5=sale to cope with natural disasters (floods, droughts, storm, insect infestation, etc)
51
6=Other reasons (specify)............................................... NEXT Q 5.3
5.3 Type of cultivated Crops for Sale and for Household Consumption on the cleared land, for the last 12 months
6.1 Do you hire agricultural/farming labour on a seasonal basis? 1=Yes 2=No (if No, next Q 7.1)
52
6.2 If yes, do you hire more labor since your land was cleared? 1=Yes 2=No (If No, next Q 7.1)
6.3 Do you hire women labour for agricultural/farming works? 1=Yes 2=No (If No, go to Q 6.3.3)
6.3.1 If Yes, why you hire women for agricultural/farming works? (multiple answers)
1= Would like to provide work opportunity for women too 2= Type of agricultural work is specifically for women 3= Women labour is easy to find 4= Other (specify)……………………………………….. (NEXT Q 7.1)
6.3.2 If no, why you don’t hire women for agricultural/farming works? (multiple answers)
1= Women are physically not fit to do farming works 2= Hard to find women labour 3=Women paid more compared to men 4=Other specify……………………….
SECTION 7 - LIVESTOCK
7.1 – Do you raise livestock or fish on the cleared land? 1=Yes 2= No (If No, NEXT SEC 8)
53
Type Please tick (√) Raised for sale (kg/unit)
Total Value In USD Raised for
Household consumption (kg)
1. Cow
2. Buffalo
3. Pig
4. Chicken
5. Duck
6. Goats
7. Sheep
8. Fishery
9. Other, specify…………
Total
54
SECTION 8 - EXPENDITURE BASED ON ADDITIONAL INCOME FROM LAND CLEARANCE
8.1 Do you earn additional income based on cleared land (for ex: grown and sold crops and/or raised sold livestock and any other)
2. for education for your daughter/daughter’s 3. for education for your children – son/sons 4. for health care for female family members? 5. for health care for male family members? 6. for clothes 7. for jewellery 8. for social events (festivals, weddings, parties, funerals, etc………) 9. Other Expenses (water, electricity, soap, brush, non-production cost
and etc)……………………………………………………………………………………………………..
55
SECTION 9 –ASSETS ACQUIRED BASED ON INCOME FROM LAND CLEARANCE in the last 12 months (please refer to sold crops and livestock on the cleared land)
9.1 Have you bought assets with the additional income from clearance? 1= Yes 2= No (If No, go to Section 10)
9.2 If yes, please specify them below.
Type Number Value in USD Type Number Value in USD
1. Car 11. Motorboat
2. Motorcycle 12. House
3. Bicycle 13. Television
4. Cart (animal) 14. Radio/Stereo
5. Rowing boat 15. Karaoke
6. Tractor 16. Fan
7. Land 17. Telephone
8. Water pump 18. Jewelleries
9. Generator 19. Other (specify)……………….
10 Sewing machine
Total
Total
9.3. Who made decision to buy these assets?
1= Head of HH only 2= Joint Decision with Spouse
56
SECTION 10 – LAND OWNERSHIP, DIPUTS AND FUTURE PLANS FOR LAND USE
10.1 Have you experienced disputes for the cleared land? 1=Yes 2=No (if No, next Q 10.3)
10.2 If yes, why? (multiple answers) 1= lack of valid legal documents 2=clash of claim with neighbor 3=clash of claim with local authorities 4= Other specify……………..
10.3 Do you have land ownership paper/soft title? 1=Yes 2=No (if No, next Q 10.5)
10.4 If yes, who issued soft title? 1=Local commune/sangkat 2 Provincial governor 3. Other (specify)………………… NEXT Q 10.6
10.5 Why you don’t have land ownership paper/soft title? (multiple answer) 1= Too expensive, cannot afford 2=Don’t know the process of getting soft title 3=Do not need it 4=Applied already, under the process 5=Other (specify)………… NEXT Q 10.7
57
10.6 Is it a joint title with your spouse? 1=Yes 2=No
10. 7 Do you have land ownership paper/hard title certificate? 1=Yes 2=No ( If No, NEXT Q 10.9)
10.8 If yes, who issued hard title? 1=Local commune/sangkat 2=Provincial governor 3. Other (specify)………………… NEXT Q 10.10
10.9 Why you don’t have land ownership paper/hard title? (multiple answer)
1= Too expensive, cannot afford 2=Don’t know the process of getting soft title 3=Do not need it 4=Applied already, under the process 5=Other (specify)…………
10.10 Is it a joint title with your spouse? 1=Yes 2=No
10.11 What is your plan in 5 years for the use of cleared land? (multiple answers)
1=use for farming 2=raise livestock or poultry 3=change type of cultivated crops 4=build a house
58
5=lease the land 6=sell to repay loan 7=Other (specify)…………… Please record any comment…………………………………………………………………………...........
SECTION 11 – CHANGE OF OCUPATION AFTER MINE CLEARANCE
11.1 Before your land was cleared, did you do any work for others or migrated to other places for work?
1=Yes 2=No (If No, next Q 11.4)
11.2 If yes, please refer to the types of works listed (multiple answer) 1=Agricultural/farming 2=Construction 3=Garment factory work 4=Tuk-tuk or moto driver 5=Labour migrant 6=Other (specify) ………………..
11.3 As a result of land clearance, did you stop working for others? 1= Yes
59
2=No
11.4 As a result of land clearance, have you changed your livelihood? (multiple answer)
1= Yes (If Yes, pls tick relevant)
2= No (if No, Next Section 12)
1. Agriculture/farming
a) Started to grow different types of crops
b) Started to grow more vegetables
c) Started to harvest more rice
d) Started to raise more livestock (cow, goat, chicken and etc)
e) Started to plant more fruits
f) Started to raise fish
g) Other specify…………………….. 1. Business
i) Started private business (please specify type of business) ……………………….
60
SECTION 12 – LOAN
12.1 Do you get loan? 1=Yes
2=No (End the interview)
12.2 If yes, what is the main document for getting a loan? (one answer)
1. Land ownership certificate (soft title) 2. Land ownership certificate (hard title) 3. Mortgage over house 4. Assets as collateral 5. Other (specify) ………………..
12.3 What are the reasons of getting a loan? (multiple answers)
1. To buy agricultural inputs (seed, tools) 2. Hire agricultural labour 3. To pay school/education cost for the children 4. To buy food for household 5. To cover health expenses 6. To pay back original loan 7. For social ceremonies, annual celebrations 8. Business development 9. To repair/reconstruct house A. To buy/rent land O. Other (specify)………………………………..
61
12.4 Does your loan amount depend on your land size? 1=Yes 2=No
12.5 Have you been able to borrow, or borrow more, as a result of clearance?
1=Yes 2=No (if No, END THE INTERVIEW)
Annex IV : Focus group discussion
Name of village: ..............................
Name of commune: ........................
Name of district: .............................
Name of province: ..........................
Name of FGD Facilitator:...................
Name of Note Taker/Recorder…………………
Number of FGD participants…………………..
Date of FGD:........................
time Started:............... time Completed:.........
Signature………………….
Date: ..........................
Introduction: We are conducting a survey on the impacts of mine clearance projects. Therefore, we will ask you questions about land use after clearance
and changes occurred in the community after land release. The focus group discussion (FGD) usually takes 1 hour and 30 minutes to complete. The
information from this FGD is strictly confidential, and will be used only for reporting the outcomes of land released in the post-clearance community. This is
voluntary and you can choose not to answer any or all of the questions if you want. However, we hope that you will participate since your views are
important.
62
1. Village Background
1.1 When was the village established? 1.2 Have there been any changes in livelihoods of people as of now? 1.3 Have there been any changes in education and healthcare access as of now? 1.4 What is the main business opportunity for farmers for the last two, three or four years? Please explain why 1.5 What are the livelihood constraints now? How do people address these constraints?
2. Land Contamination, Risks and Prioritization Criteria’s 2.1 Do you think land contamination and risks are important to discuss during the village meetings? 2.2 How many times a year land contamination and risks issues was discussed during the village meetings? (if any)
63
2.3 How often farmers raise the problems associated with land contamination? What are the problems? 2.4 If village resident complains about risk or land contamination, how would you address it? (ask community leaders or else) 2.5 What is the process of land prioritization for clearance in the village? 2.6 Are women included in the process of prioritization? 2.7 What are the criteria’s for land clearance prioritization? 2.8 Which groups of people are at high risk of mine victim? And how? Are men and women affected differently, how?
3. Impacts (benefits) of mine clearance
3.1 Do you think land clearance contributed to village infrastructure development? If yes, describe village situation (roads, access to health centre, access to schools and etc) before and after land clearance 3.2 What are the cleared lands are mostly used for (access to markets, school, health center, short-cut to access other roads, some cleared lands are not in use, other specify)?
64
3.3 Do you think land clearance had an impact to farmer’s business or any other developments? If yes, How? 3.4 Did the poor and non-poor, equally benefit from mine clearance? If yes why and how? If no, why and how? 3.5 Did female-headed households equally benefit from mine clearance? If yes why and how? If no, why and how? 3.6 Do you think it is important to focus on widows, female headed households, if new project is implemented? Pease explain why?
4. Mine Risk Education 4.1 How would you score village residents mine risk awareness for female? (please rate based on the scores)
1- excellent 2- good 3 - average 4 - poor
4.2 How would you score village residents mine risk awareness for male? (please rate based on the scores)
1- excellent 2- good 3 - average 4 - poor
4.3 Which communication method you think is applicable and/or efficient for mine risk awareness in your village? (posters, leaflets, training of trainers, teachers, other – specify)
65
4.4 How often awareness campaigns should be conducted per year? 4.5 Do you think women and children should be specifically targeted for awareness campaigns? If yes, why and how?