+ All Categories
Home > Documents > Clearwater Plateau Nitrate Groundwater Data Analysis...i Clearwater Plateau Nitrate Groundwater Data...

Clearwater Plateau Nitrate Groundwater Data Analysis...i Clearwater Plateau Nitrate Groundwater Data...

Date post: 13-Mar-2020
Category:
Upload: others
View: 7 times
Download: 0 times
Share this document with a friend
70
Clearwater Plateau Nitrate Groundwater Data Analysis Groundwater Technical Report #20 Lewis and Idaho County, Idaho Prepared by: Alyssa Douglas 2003 Idaho Department of Environmental Quality Lewiston Regional Office
Transcript

i

Clearwater Plateau Nitrate GroundwaterData Analysis

Groundwater Technical Report #20

Lewis and Idaho County, Idaho

Prepared by:Alyssa Douglas

2003

Idaho Department of Environmental QualityLewiston Regional Office

i

TABLE OF CONTENTS

List of Figures ....................................................................................................................................iiList of Tables .....................................................................................................................................iiiAcknowledgments..............................................................................................................................ivAbstract ..............................................................................................................................................vIntroduction........................................................................................................................................2

Purpose and Objectives..........................................................................................................3Subarea Review and Data Sources ........................................................................................3

Study Area .........................................................................................................................................5Location .................................................................................................................................5Climate...................................................................................................................................5Land use .................................................................................................................................6Geography..............................................................................................................................6Hydrology and Hydrogeology ...............................................................................................Water Levels ..........................................................................................................................

Results and Discussion ......................................................................................................................Nitrate Samples......................................................................................................................Nitrogen Isotopes ...................................................................................................................Statistical Analysis.................................................................................................................Nitrate Data Source Analysis.................................................................................................Well Log Analysis .................................................................................................................Seal Depth..............................................................................................................................Seal Type ...............................................................................................................................

Conclusions........................................................................................................................................Recommendations..................................................................................................................

Literature Cited ..................................................................................................................................

Appendix A. Nitrate Contour and Shaded Cell Maps for each Data Source.....................................Appendix B. Well Attributes for the Idaho Department of Water Resources ...................................Appendix C. Well Attributes for the Camas Prairie Report ..............................................................Appendix D. Well Attributes for the Public Water System Wells ....................................................Appendix E. Well Attributes for the Department of Agriculture ......................................................Appendix F. Well Information...........................................................................................................Appendix G. Well Log Details ..........................................................................................................

ii

LIST OF FIGURES

Figure 1. Location of the Clearwater Plateau Subarea ......................................................................Figure 2. Generalized Map of the Clearwater Plateau Subarea .........................................................Figure 3. Water Level Contours for Wells with Total Depth < 200 ft ..............................................Figure 4. Water Level Contours for Wells with Total Depth 200-400 ft ..........................................Figure 5. Water Level Contours for Wells with Total Depth > 400 ft ..............................................Figure 6. Map from Dennis................................................................................................................Figure 7. IDWR Nitrate Contour and Shaded Cell Maps ..................................................................Figure 8. Camas Prairie Nitrate Contour and Shaded Cell Maps ......................................................Figure 9. Department of Agriculture Nitrate Contour and Shaded Cell Maps ..................................Figure 10. All Data Sources Nitrate Contour and Shaded Cell Maps ...............................................Figure 11. Histogram of All Wells ....................................................................................................Figure 12. Histogram of All Nitrate Samples ....................................................................................Figure 13. Distribution of Sources for each Nitrate Concentration Range........................................Figure 14. Statistics for Each Source.................................................................................................Figure 15. Camas Prairie Data ...........................................................................................................Figure 16. IDWR Sample Data..........................................................................................................Figure 17. IDWR Well Data ..............................................................................................................Figure 18. Dept. of Ag. Sample Data.................................................................................................Figure 19. Dept. of Ag. Well Data.....................................................................................................Figure 20. PWS Well Data.................................................................................................................Figure 21. PWS Sample Data ............................................................................................................Figure 22. All Wells...........................................................................................................................Figure 23. All Samples ......................................................................................................................Figure 24. Nitrate vs. Well Depth for Each Data Source...................................................................Figure 25. Comparison between Nitrate Concentrations and Casing Depth .....................................Figure 26. Distribution of Data Sources for each Range ...................................................................Figure 27. Depth Comparison............................................................................................................Figure 28. Nitrate Concentration Comparisons .................................................................................Figure 29. Nitrate Concentration vs. Seal Depth of 18 ft. .................................................................Figure 30. Nitrate vs. Seal Depth > 18 ft. ..........................................................................................Figure 31. Nitrate Concentration < 2 mg/L vs. Seal Types ...............................................................Figure 32. Nitrate Concentrations > 2 mg/L vs. Seal Types..............................................................

iii

LIST OF TABLES

Table 1. IDWR Nitrate Concentrations ............................................................................................

Table 2. IDWR Chemistry Data........................................................................................................

Table 3. Camas Prairie Nitrate Concentrations.................................................................................

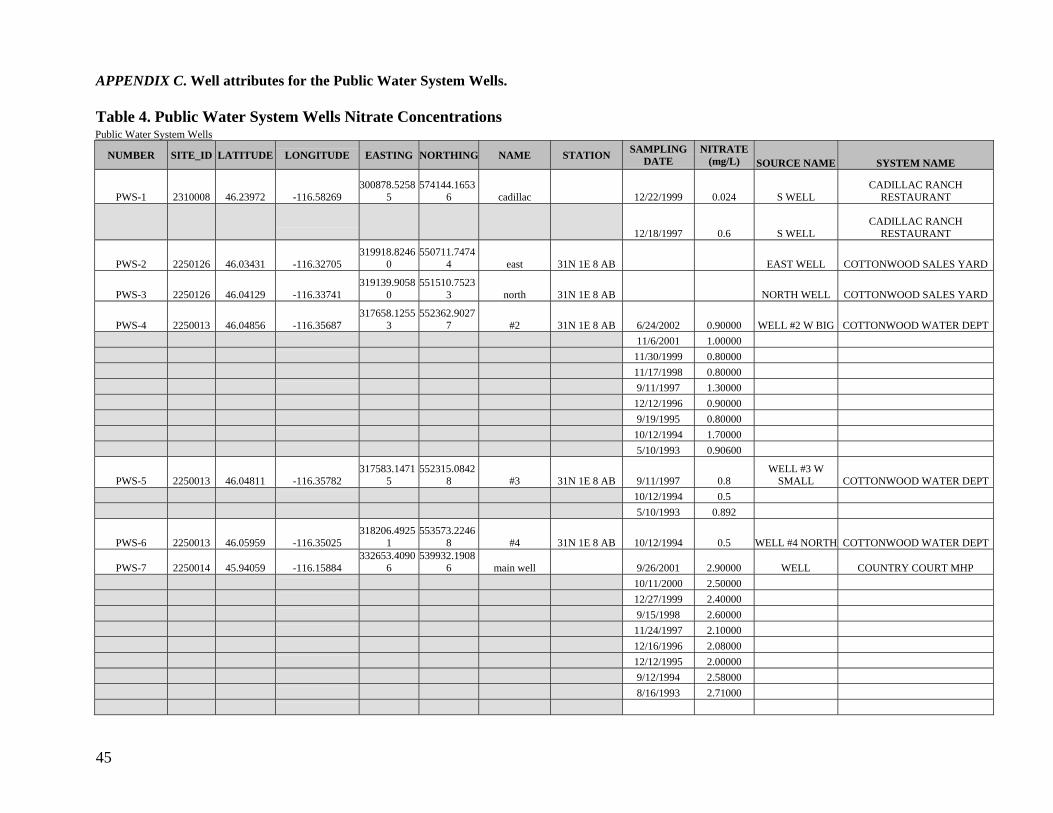
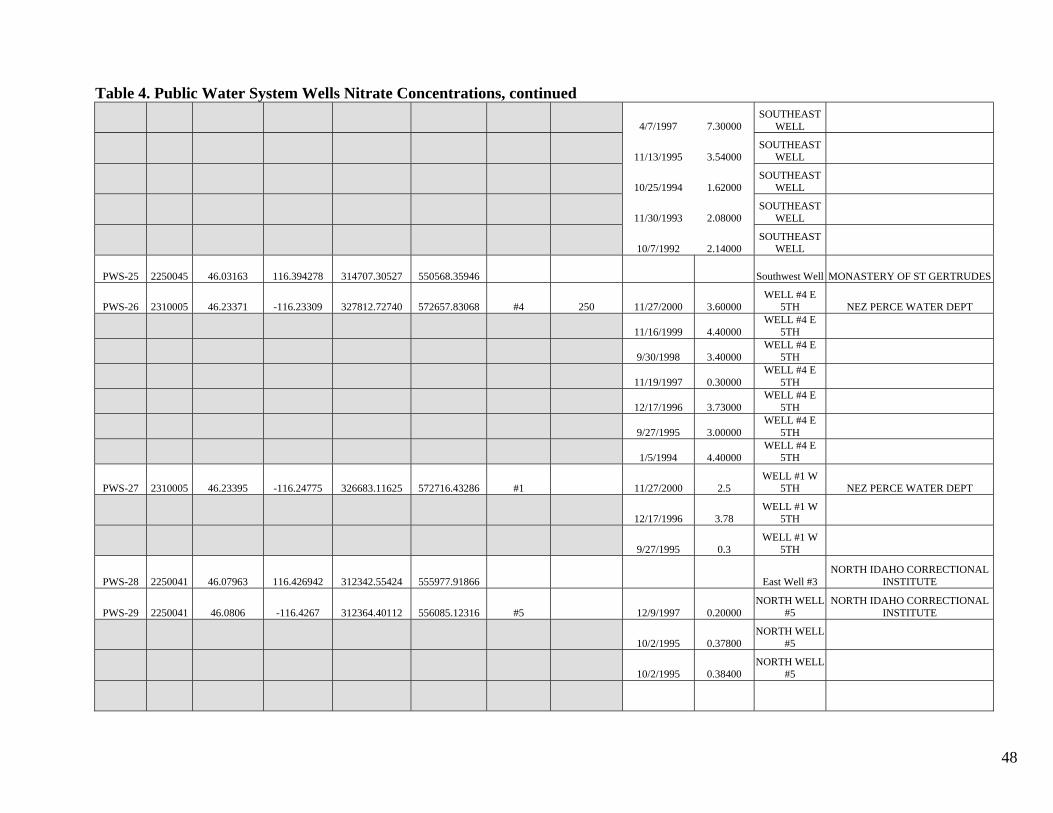
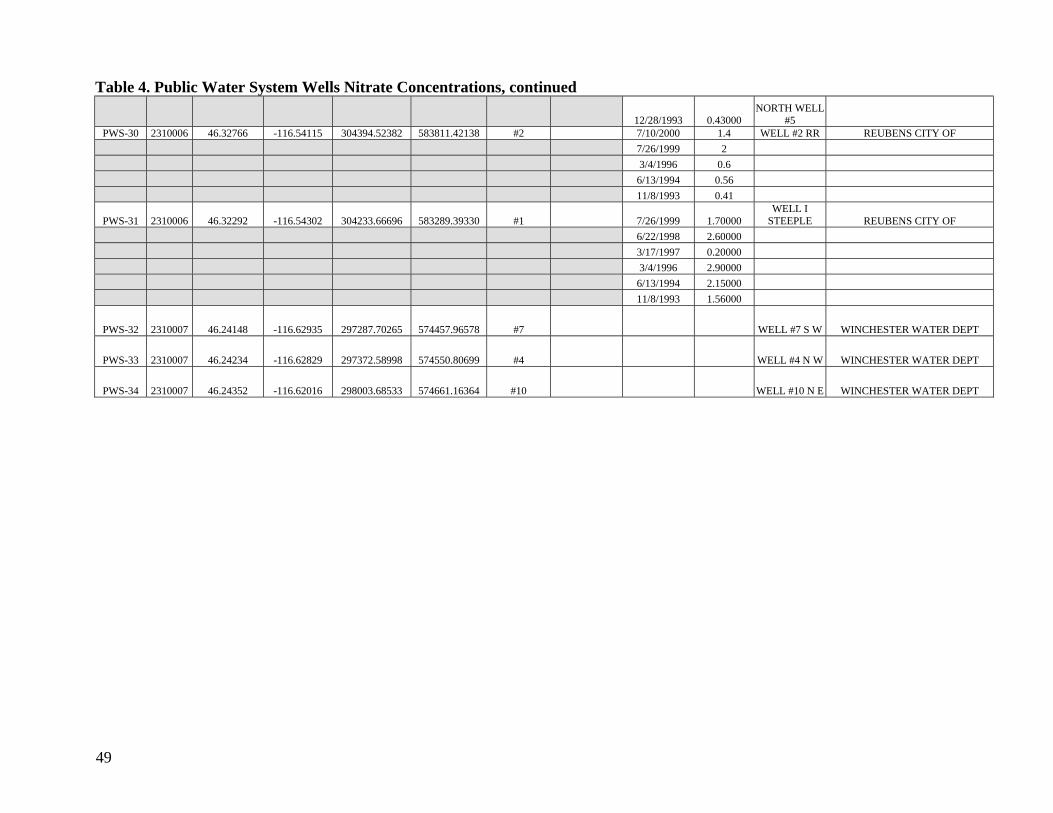
Table 4. Public Water System Wells Nitrate Concentrations ...........................................................

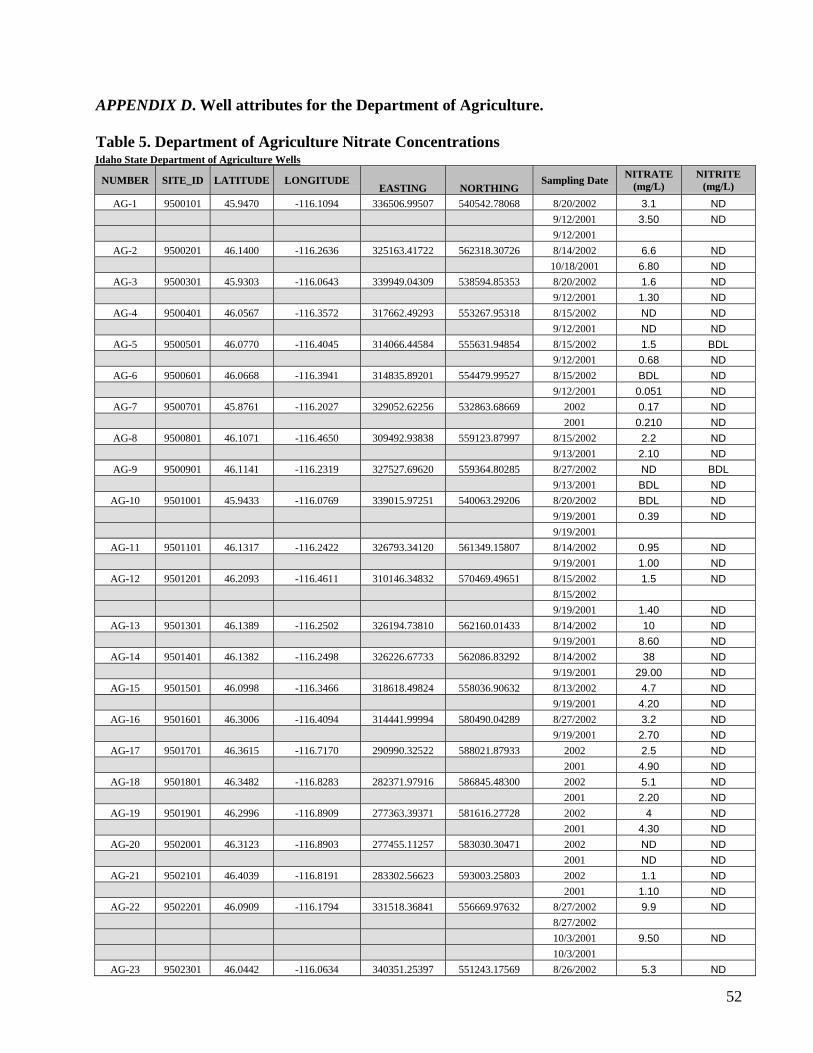
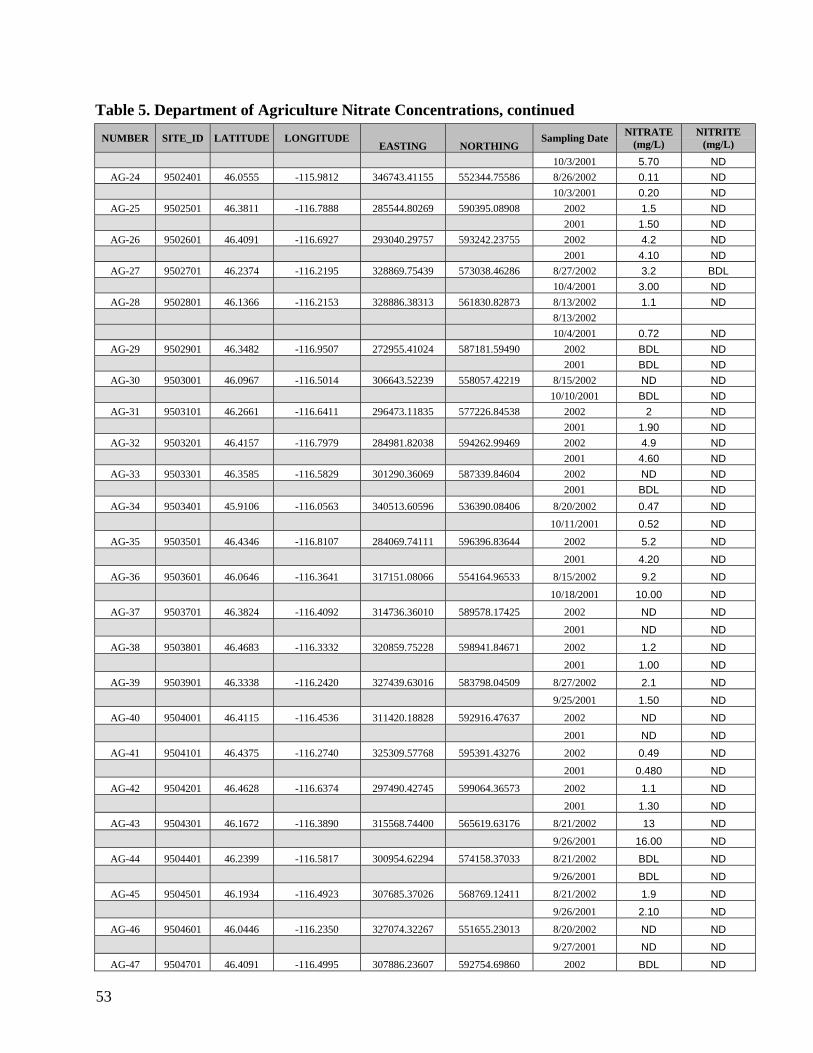
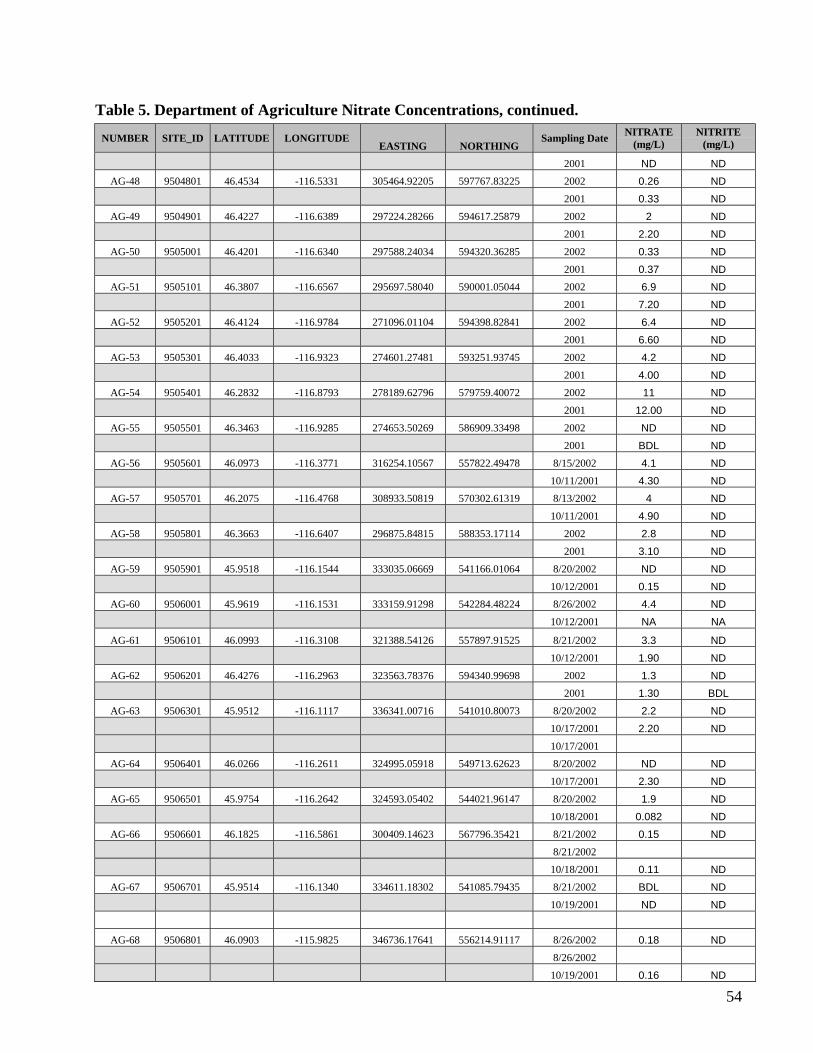
Table 5. Department of Agriculture Nitrate Concentrations ............................................................

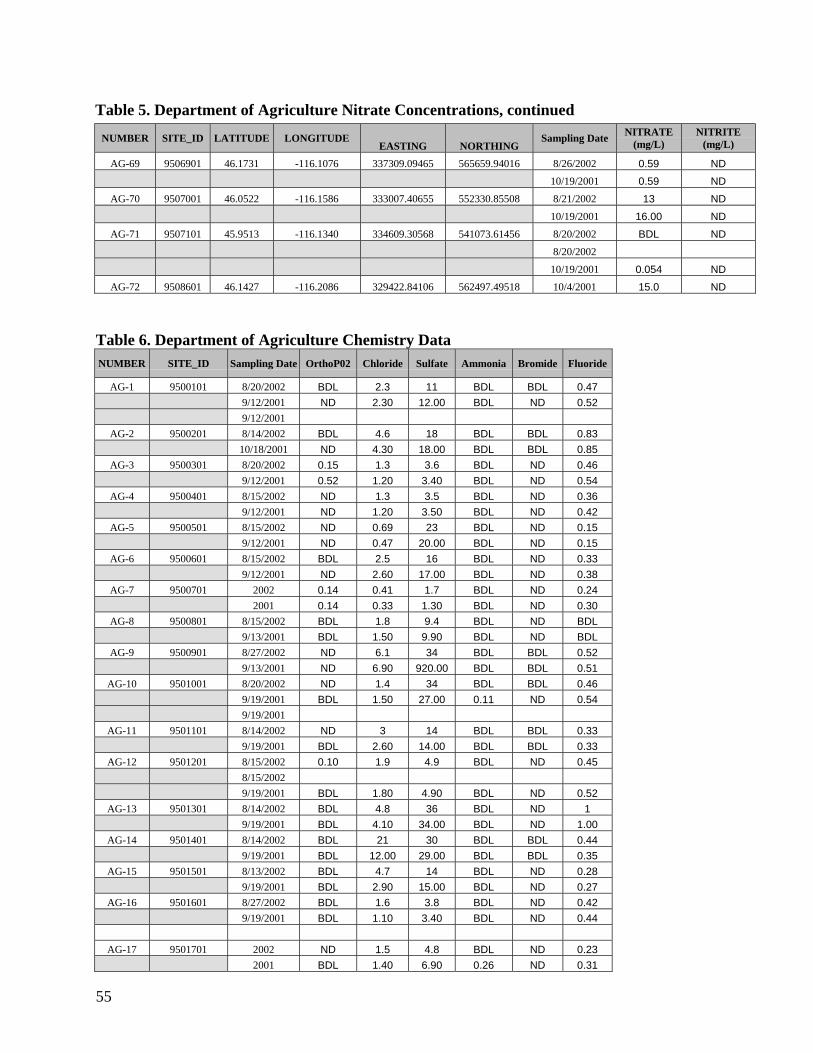
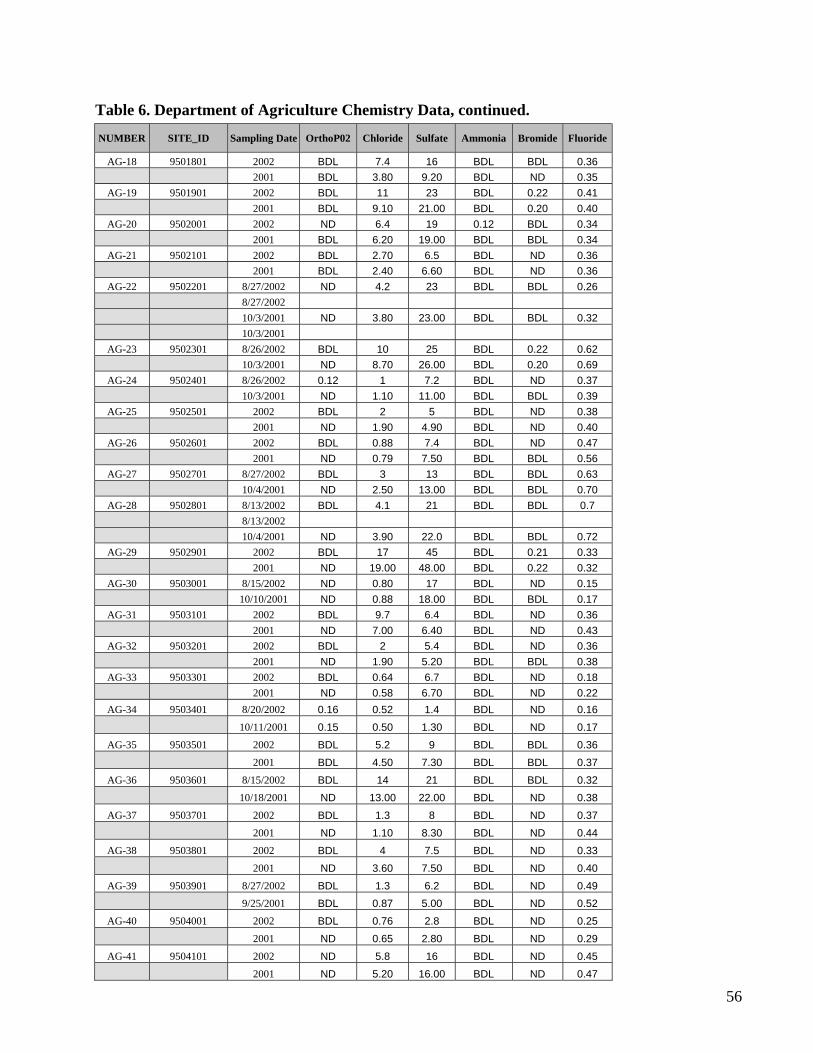
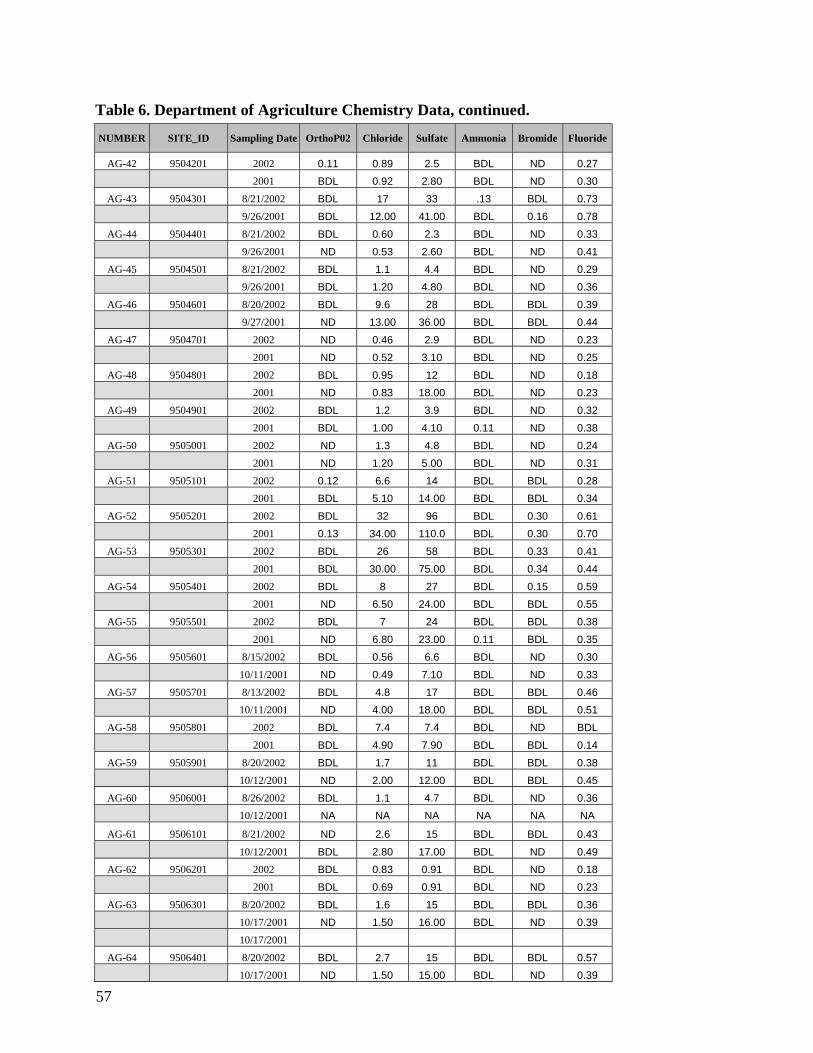
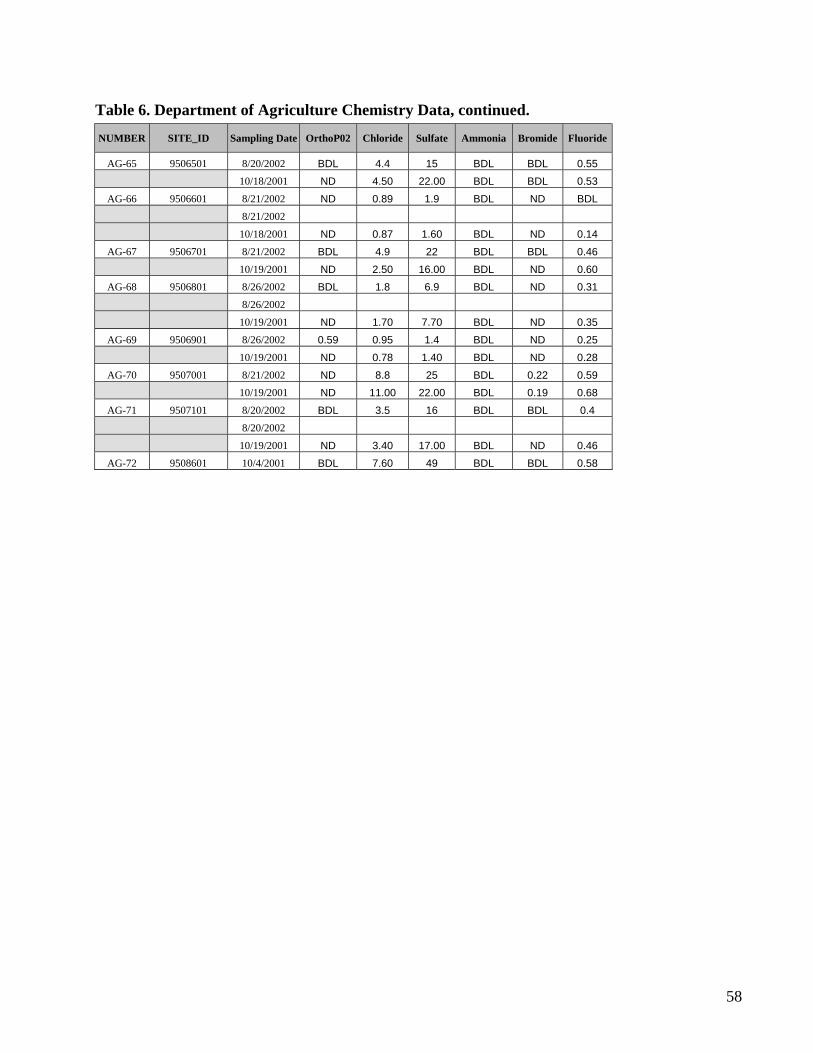
Table 6. Department of Agriculture Chemistry Data........................................................................

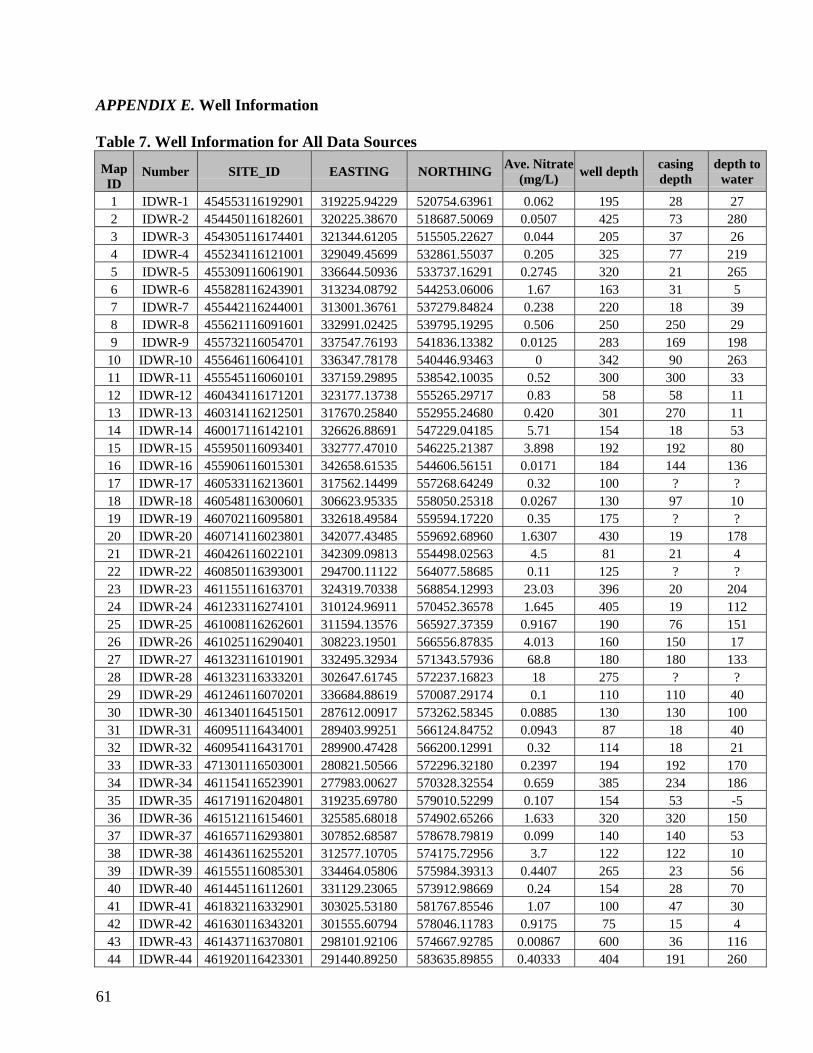
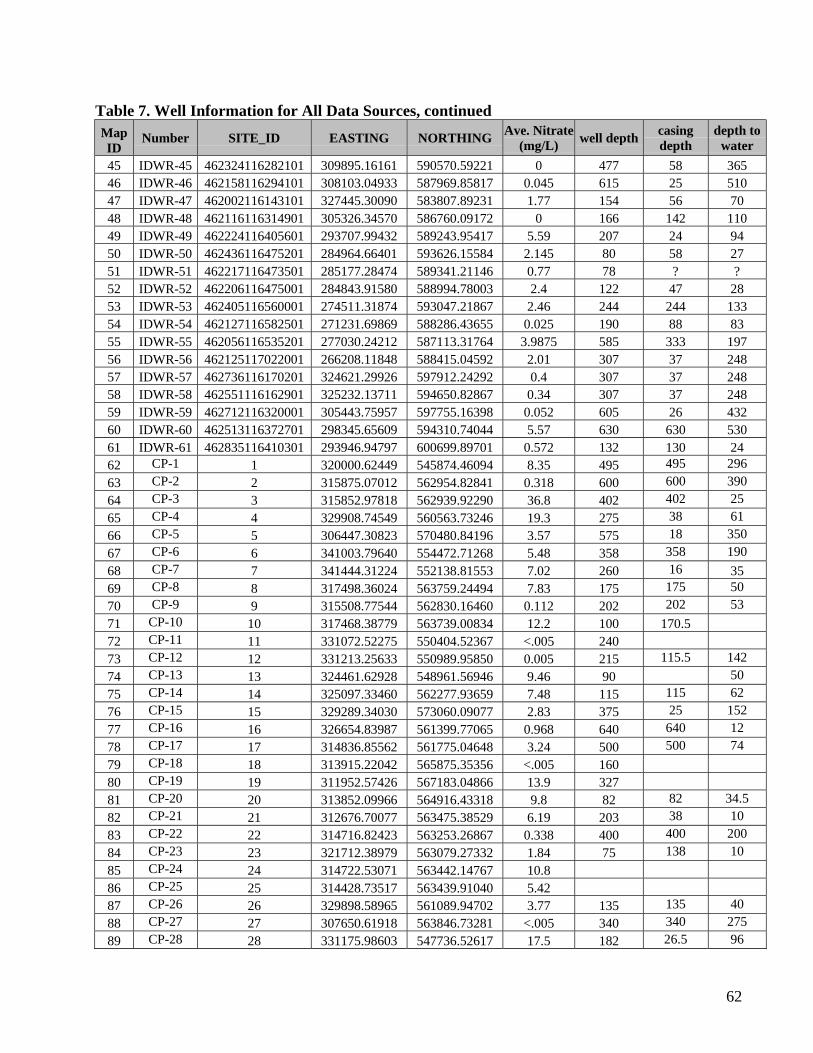
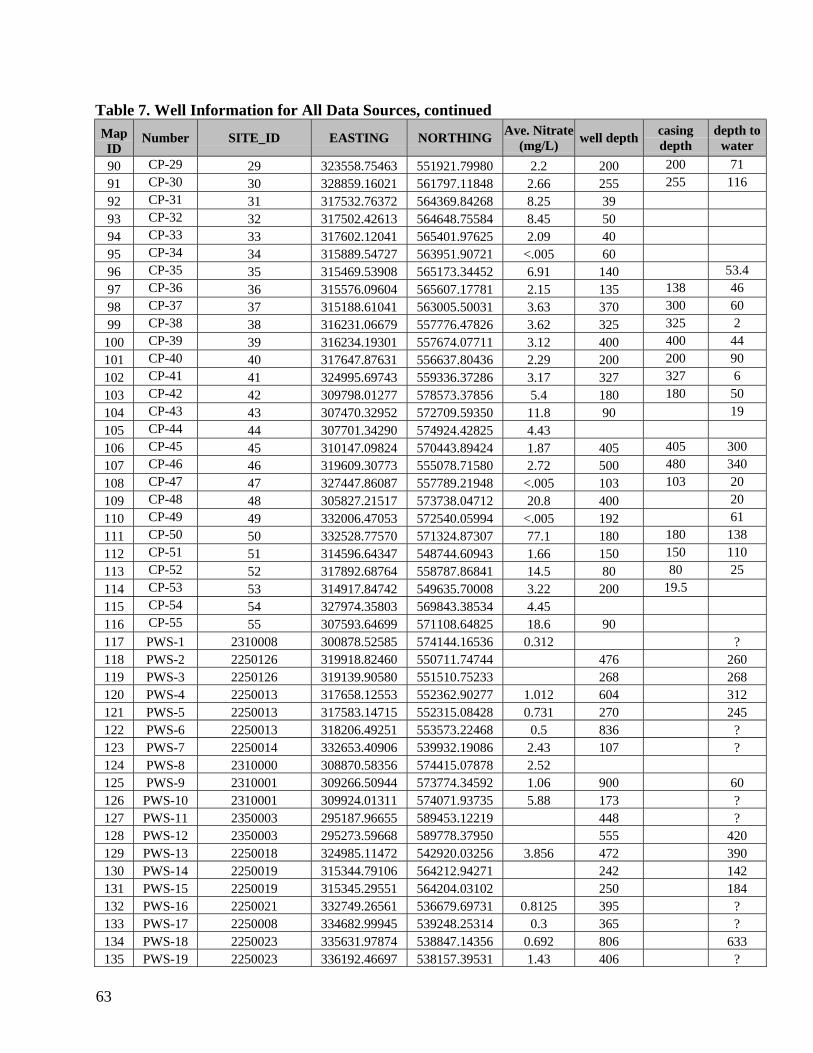
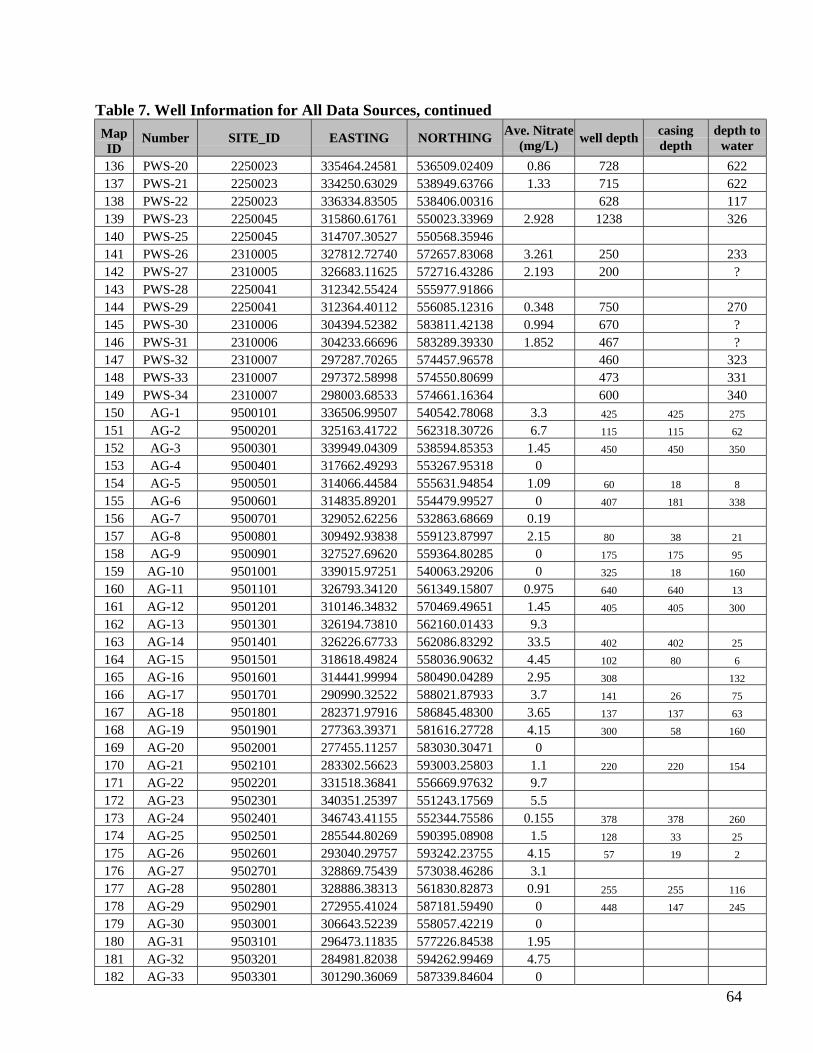
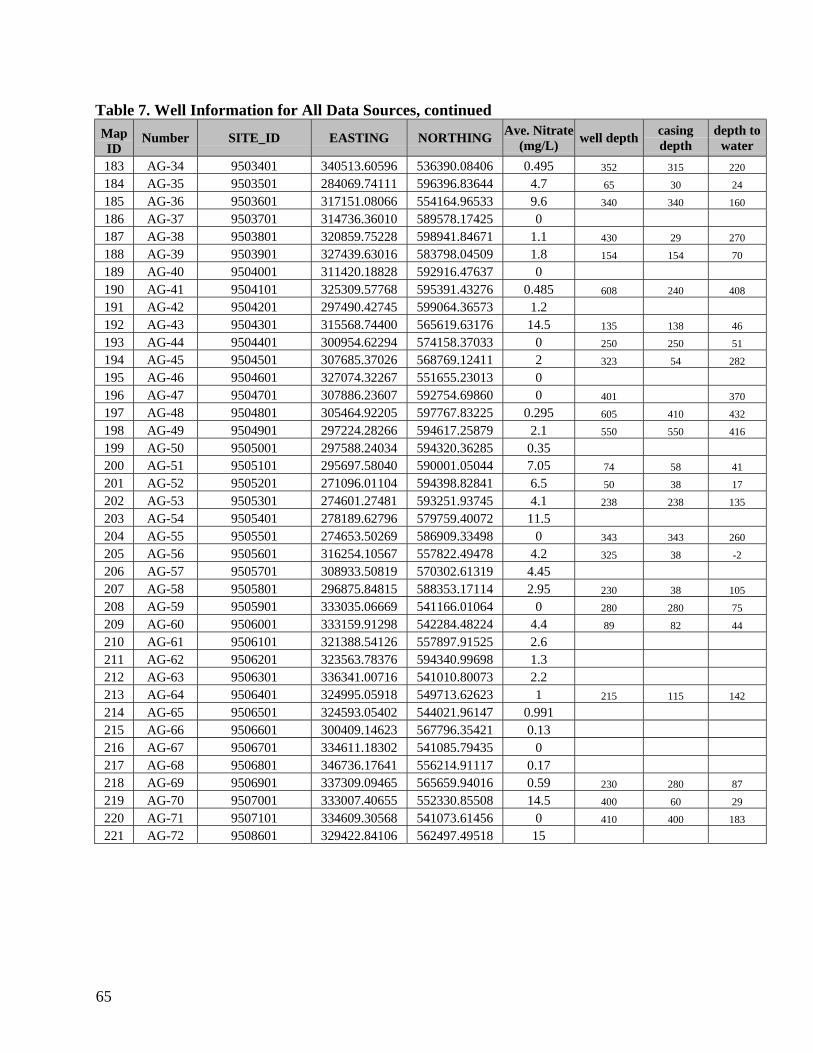
Table 7. Well Information for All Data Sources...............................................................................

Table 8. Well Characteristics............................................................................................................

Table 9. Nitrogen Sources Associated with 15N Values ..................................................................

Table 10. Statistics for Each Data Source (mg/L) .............................................................................

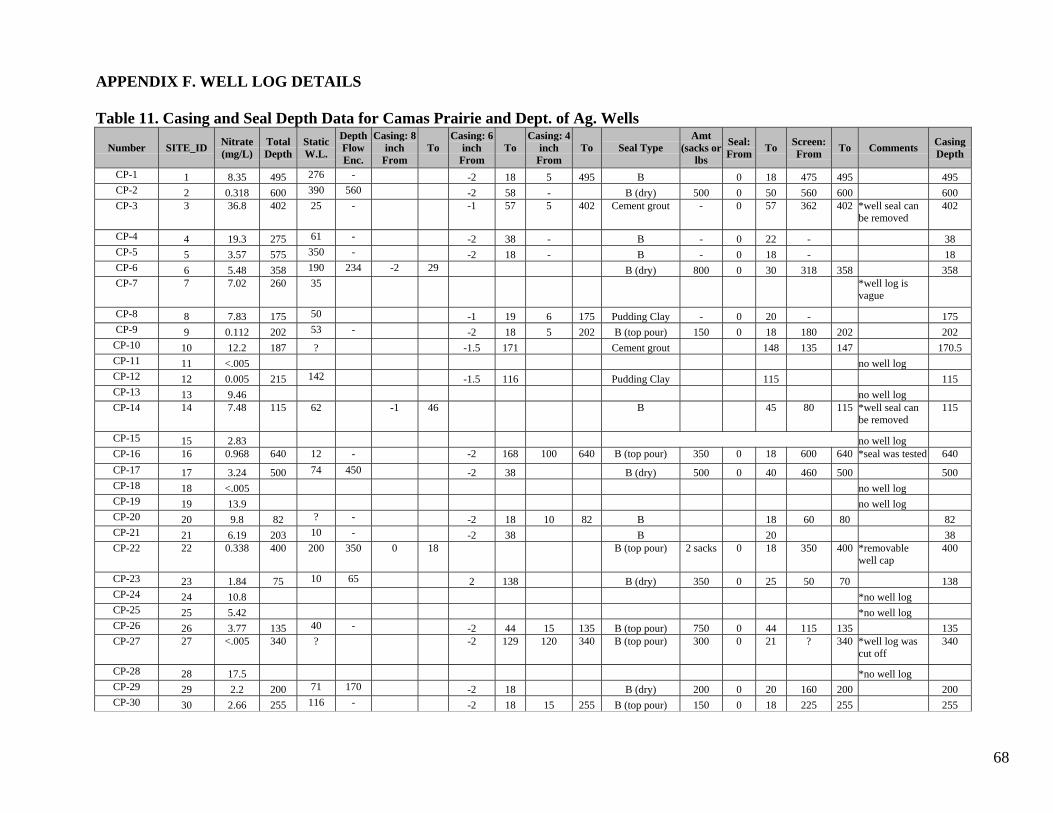
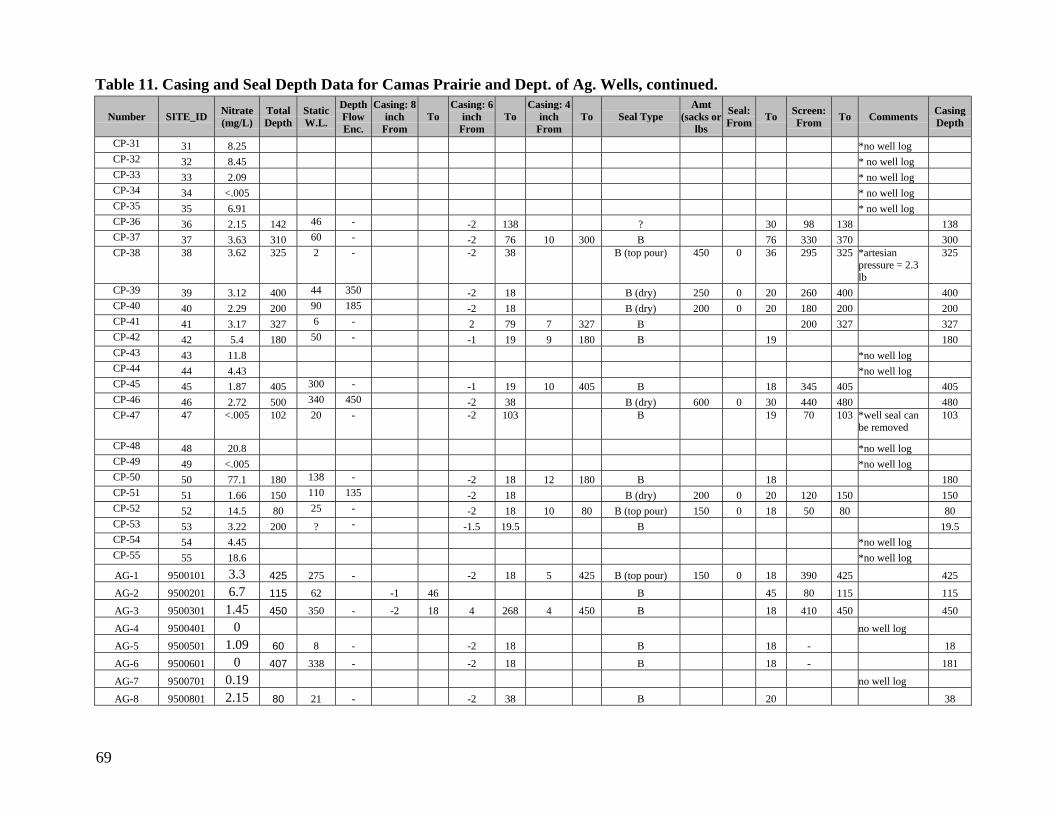
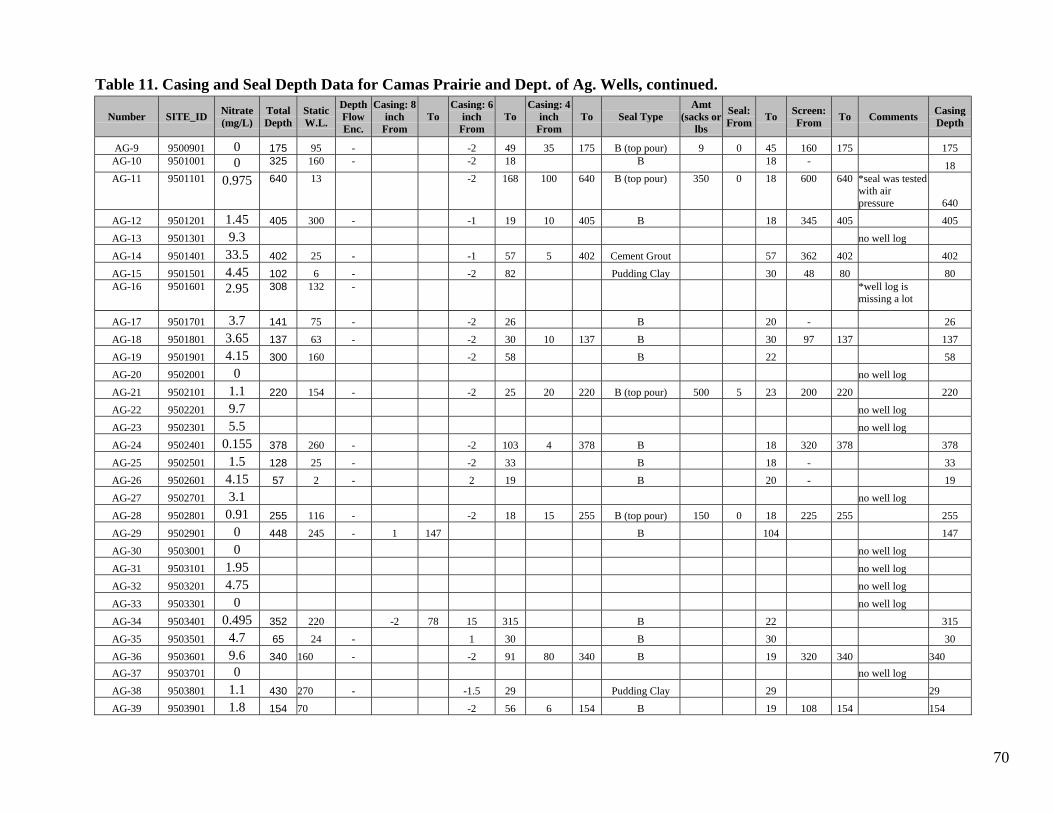
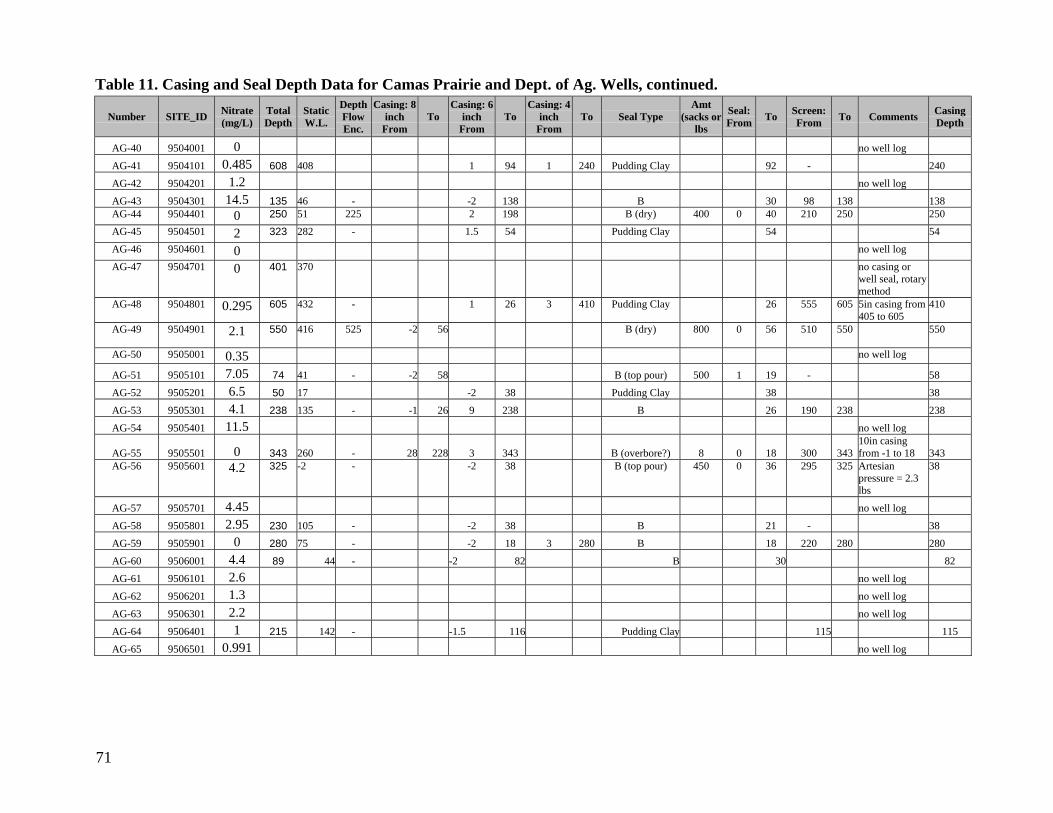
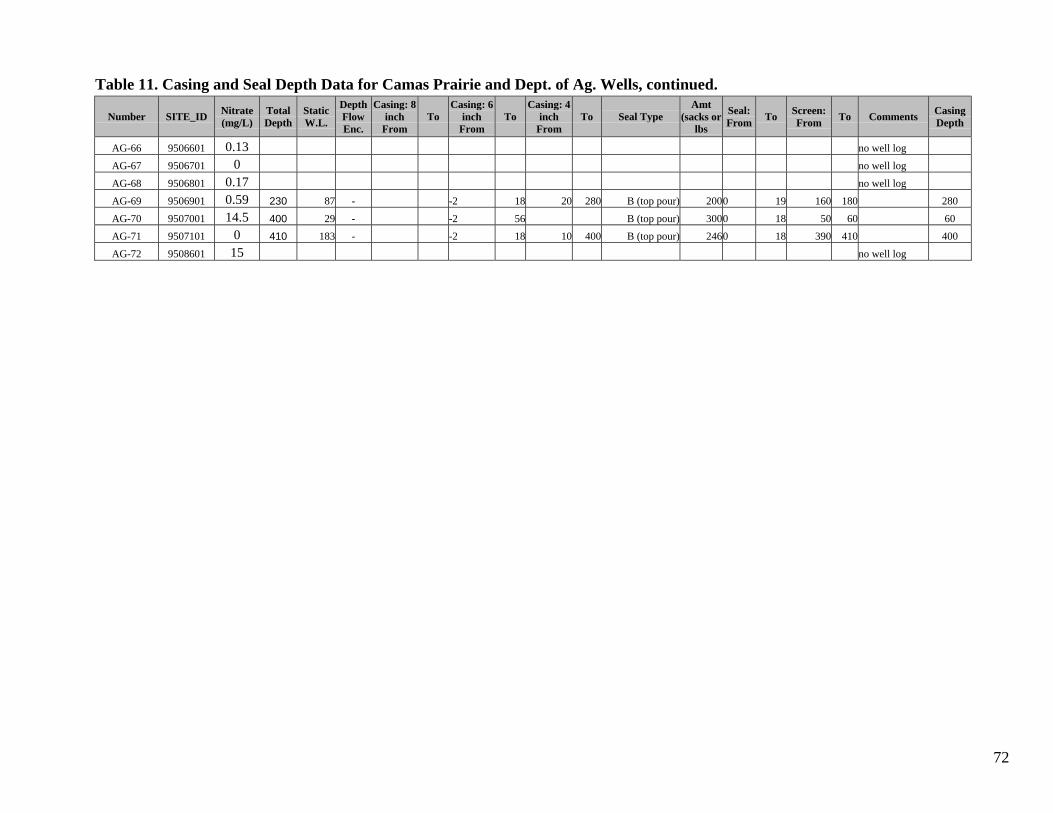
Table 11. Casing and Seal Depth Data for Camas Prairie and Dept. of Ag. Wells ...........................

iv

ACKNOWLEDGEMENTS

v

ABSTRACT

This report summarizes the status of nitrate concentrations in the Clearwater PlateauHydrogeologic Subarea as determined from data collected through the Statewide AmbientGround Water Quality Monitoring Program, the Camas Prairie Report, the Public Water System,and the Idaho State Department of Agriculture. Nitrate is commonly found as a ground watercontaminant in public water supply systems throughout Idaho. Several studies have addressedthe concern of nitrates in the ground water in an attempt to identify the reasons for the elevatednitrate levels.

The federal drinking water Maximum Contaminant Level (MCL) and Idaho ground water qualityconcentration standard for nitrate is set at 10 mg/L. Idaho’s drinking water is mostly supplied byground water; therefore, the leaching of nitrates and the associated health risks are majorconcerns. The Clearwater Plateau study area is considered a Nitrate Priority Area by the IdahoDepartment of Environmental Quality due to nitrate concentrations that exceed the MCL in morethan 20% of the wells within the study area

This report summarizes the results of the previous studies conducted within the study area andattempts to correlate well properties with associated nitrate concentrations.

Based on the results of this study, recommendations are as follows:

• Ensure that the required well logs are readable.

• Improve well logs database access.

• Well casing requirement should be extended to entire well depth.

• A positive displacement bentonite slurry seal should be placed from well bottom to top.

• Require annular seal on all new wells.

• Extend seal to water level.

• Continue nitrogen isotope samples analysis.

• Continue annual nitrate ground water sampling.

2

INTRODUCTION

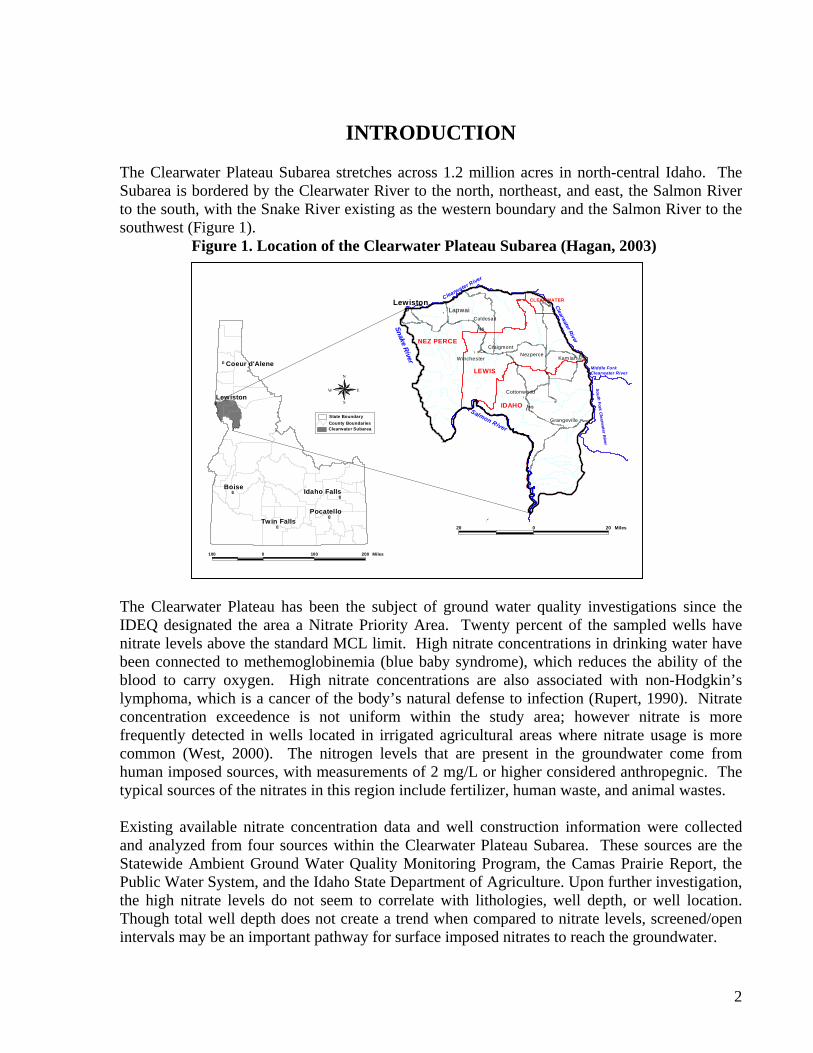
The Clearwater Plateau Subarea stretches across 1.2 million acres in north-central Idaho. TheSubarea is bordered by the Clearwater River to the north, northeast, and east, the Salmon Riverto the south, with the Snake River existing as the western boundary and the Salmon River to thesouthwest (Figure 1).

Figure 1. Location of the Clearwater Plateau Subarea (Hagan, 2003)

The Clearwater Plateau has been the subject of ground water quality investigations since theIDEQ designated the area a Nitrate Priority Area. Twenty percent of the sampled wells havenitrate levels above the standard MCL limit. High nitrate concentrations in drinking water havebeen connected to methemoglobinemia (blue baby syndrome), which reduces the ability of theblood to carry oxygen. High nitrate concentrations are also associated with non-Hodgkin’slymphoma, which is a cancer of the body’s natural defense to infection (Rupert, 1990). Nitrateconcentration exceedence is not uniform within the study area; however nitrate is morefrequently detected in wells located in irrigated agricultural areas where nitrate usage is morecommon (West, 2000). The nitrogen levels that are present in the groundwater come fromhuman imposed sources, with measurements of 2 mg/L or higher considered anthropegnic. Thetypical sources of the nitrates in this region include fertilizer, human waste, and animal wastes.

Existing available nitrate concentration data and well construction information were collectedand analyzed from four sources within the Clearwater Plateau Subarea. These sources are theStatewide Ambient Ground Water Quality Monitoring Program, the Camas Prairie Report, thePublic Water System, and the Idaho State Department of Agriculture. Upon further investigation,the high nitrate levels do not seem to correlate with lithologies, well depth, or well location.Though total well depth does not create a trend when compared to nitrate levels, screened/openintervals may be an important pathway for surface imposed nitrates to reach the groundwater.

ÊÚr

r

rrr r

r

r

Lewiston

NEZ PERCE

LEWIS

IDAHO

CLEARWATER

Middle Fork Clearwater River

Sou th Fork C le arwat er R

i ver

Salmon River

Clearwater River

Clearwater River

Kamiah

Culdesac

CraigmontNezperce

Winchester

Cottonwood

Grangeville

Lapwai

Snake River(/9 5

(/9 5

20 0 20 Miles

ÊÚ

ÊÚ

ÊÚÊÚ

ÊÚ

ÊÚ

Boise

Lewiston

PocatelloTwin Falls

Idaho Falls

Coeur d'Alene

100 0 100 200 Miles

N

EW

S

Clearwater SubareaCounty BoundariesState Boundary

3

The area primarily consists of dry-land farming practices that lie within a semi-arid region. Withlow precipitation and no added source of recharge from irrigation, the fact that recently(<100yrs) deposited nitrates are measured in high levels in deep wells indicates the potential forextremely rapid transport processes, most likely due to poor well head construction.

If a surface seal is poorly constructed or improperly placed, poor quality shallow ground watercould quickly migrate into deeper ground water systems through the unnatural pathway createdduring well construction. Likewise, if a well is only cased in the upper portion of the bore hole,contaminated shallow ground water can cascade into the bore hole and contaminate the deeperground water within that well.

Purpose and ObjectivesThe purpose of this study was to compile all of the nitrate data for wells sampled in theClearwater Plateau study area and create a map displaying all of the combined well locations.

The specific objectives of this study include:

1.) Review and summarize existing information on the basin

2.) Create maps of all of the combined data locations and concentration levels throughout thestudy area.

3.) Evaluate the adequacy of the nitrate data

4.) Identify any potential trends in the data through statistical analysis

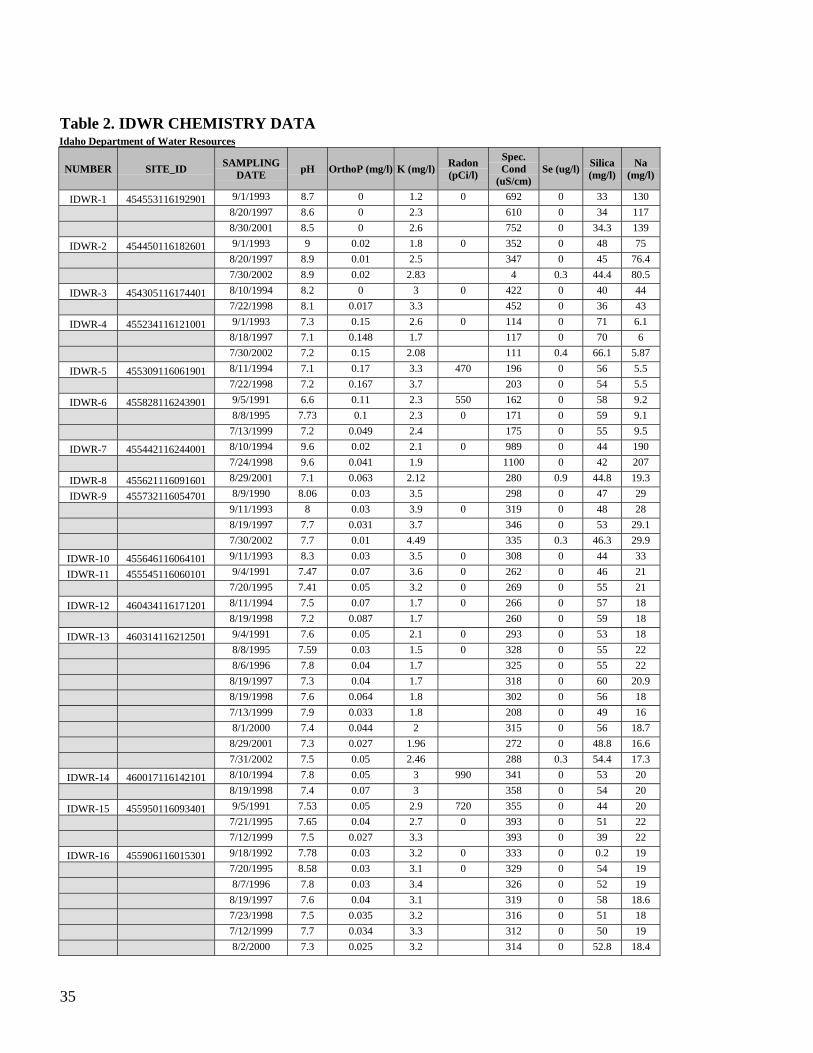
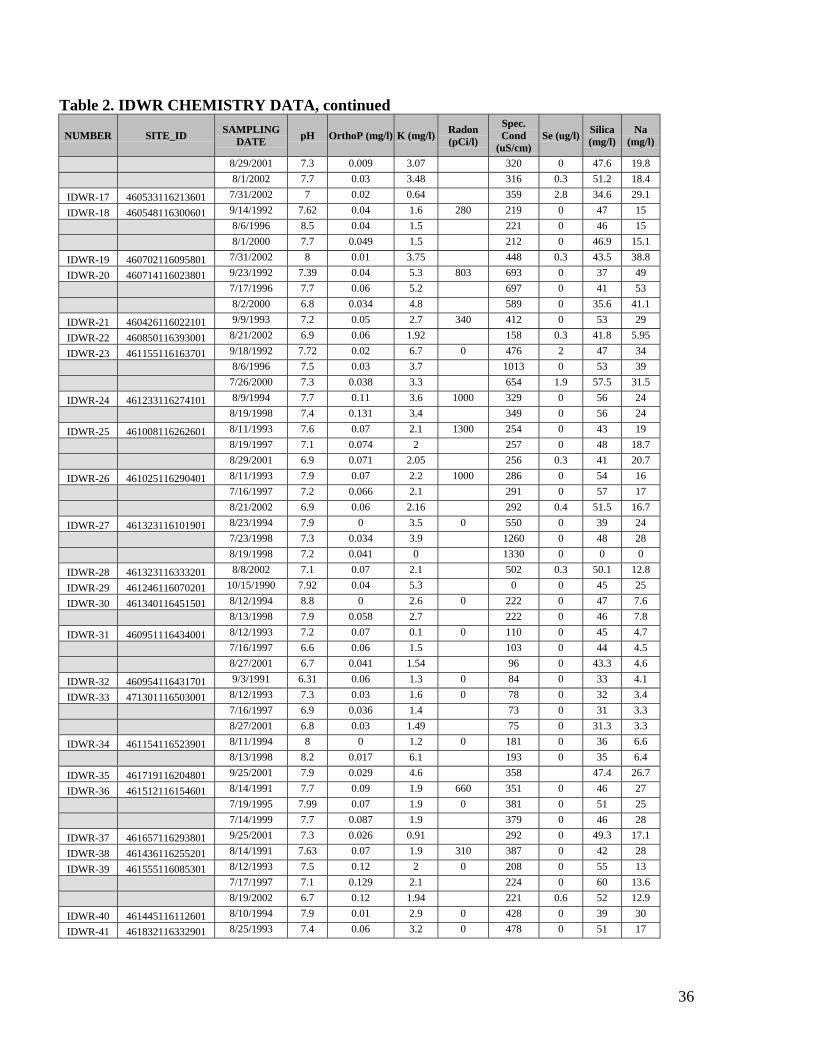
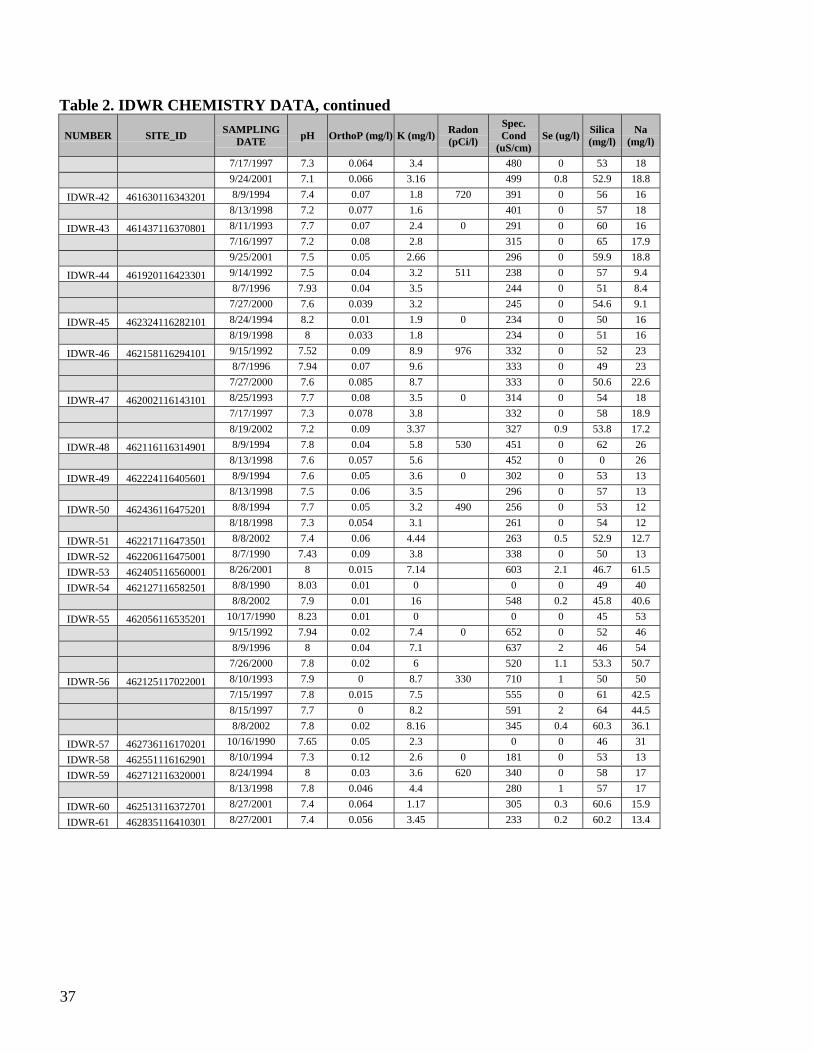
Subarea Review and Data SourcesIn 1989, the Idaho State Legislature passed the Ground Water Quality Protection Act, whichauthorized a comprehensive approach for improving and maintaining Idaho’s ground waterquality. From this Act, the Ground Water Quality Council was created, and in turn produced theIdaho Ground Water Quality Plan in 1992. This plan stressed the importance of ground waterquality monitoring at the statewide, regional, and local levels. The Idaho Department of WaterResources (IDWR) became responsible for implementing a statewide ambient ground waterquality monitoring network. Regional and local monitoring responsibilities were assigned to theIdaho Department of Environmental Quality (IDEQ) and the Idaho State Department ofAgriculture (ISDA).

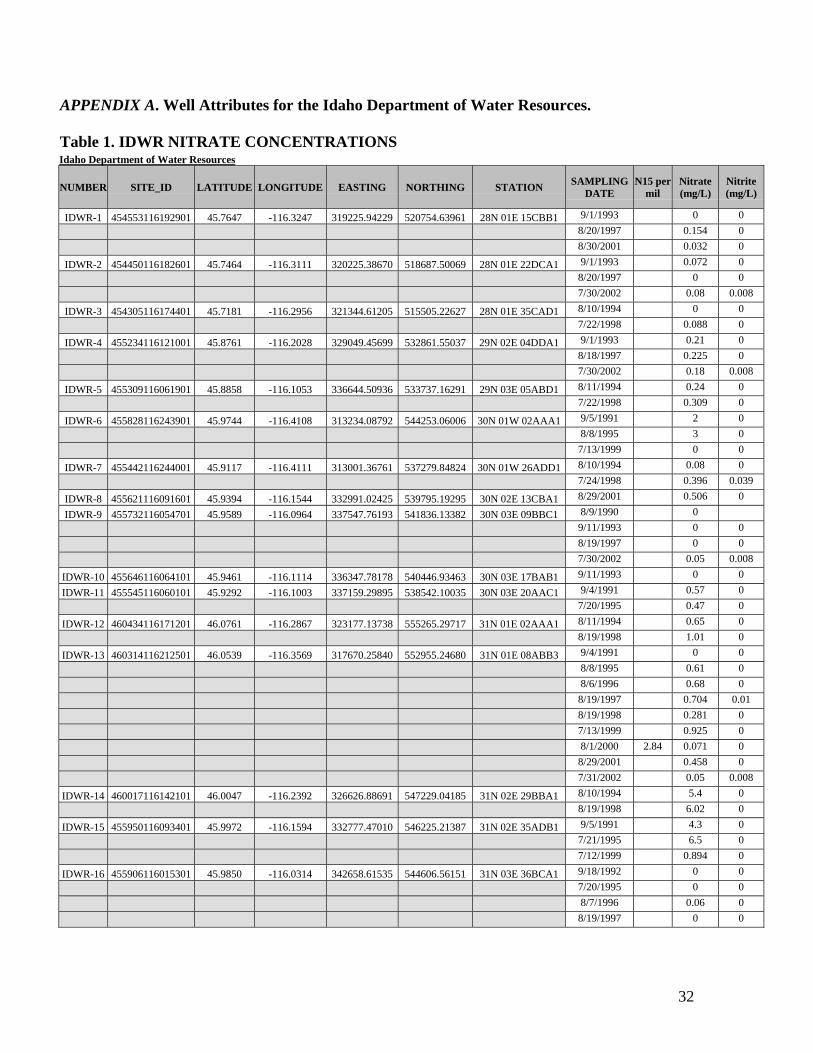
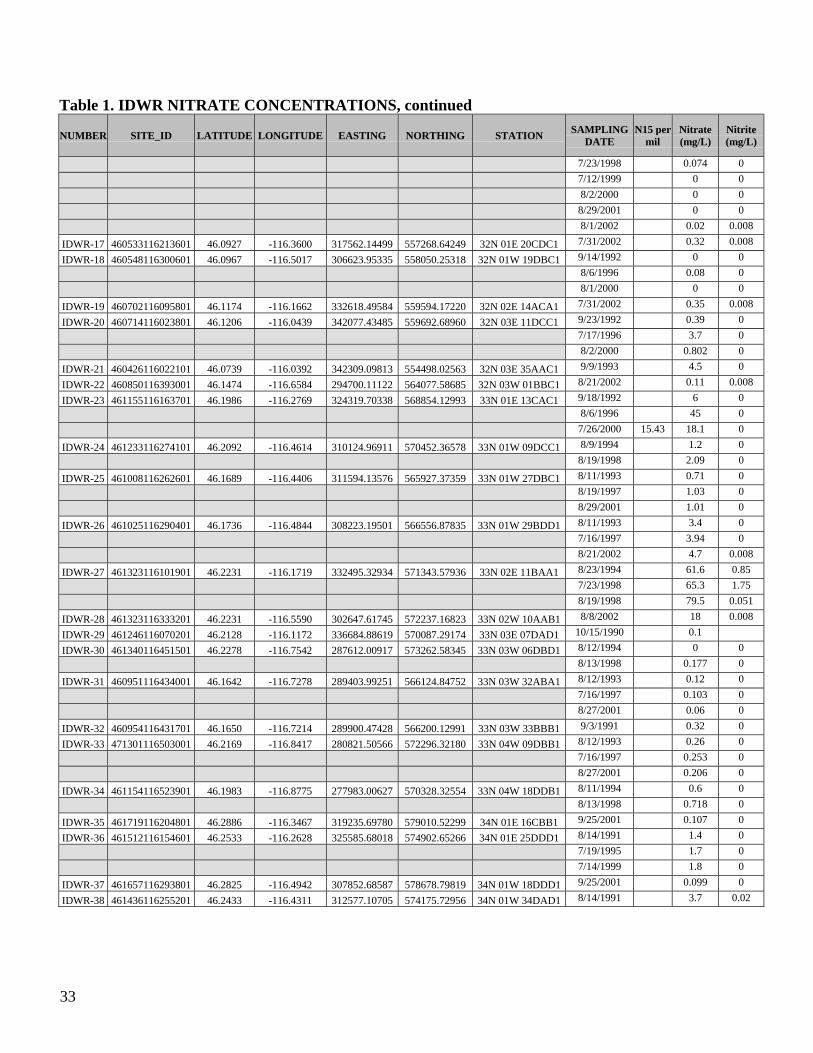
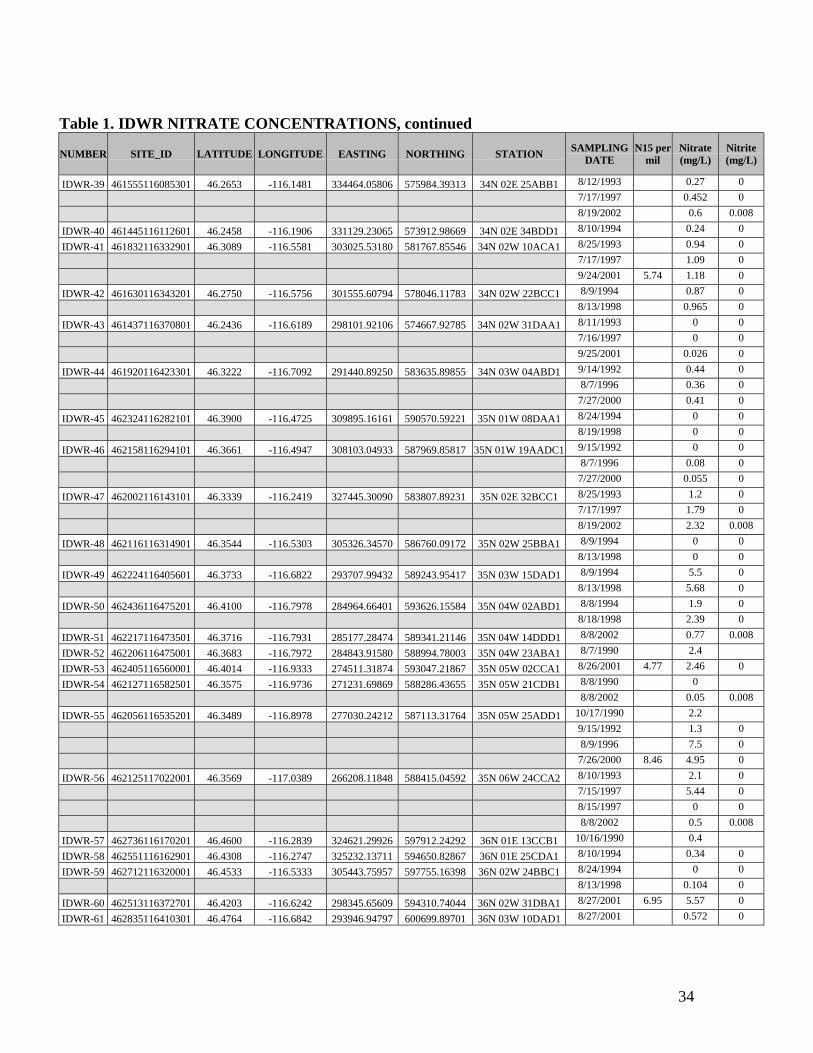
Statewide Ambient Ground Water Quality Monitoring ProgramThere are 61 Statewide Program sites (Appendix A, Table 1, 2) that have available nitrate data inthe Clearwater Plateau Subarea. Nine sites have been dropped from the program and 11 siteswere added during 2001-2002. Thus, 52 sites in the study area are currently being monitoringthrough this program.

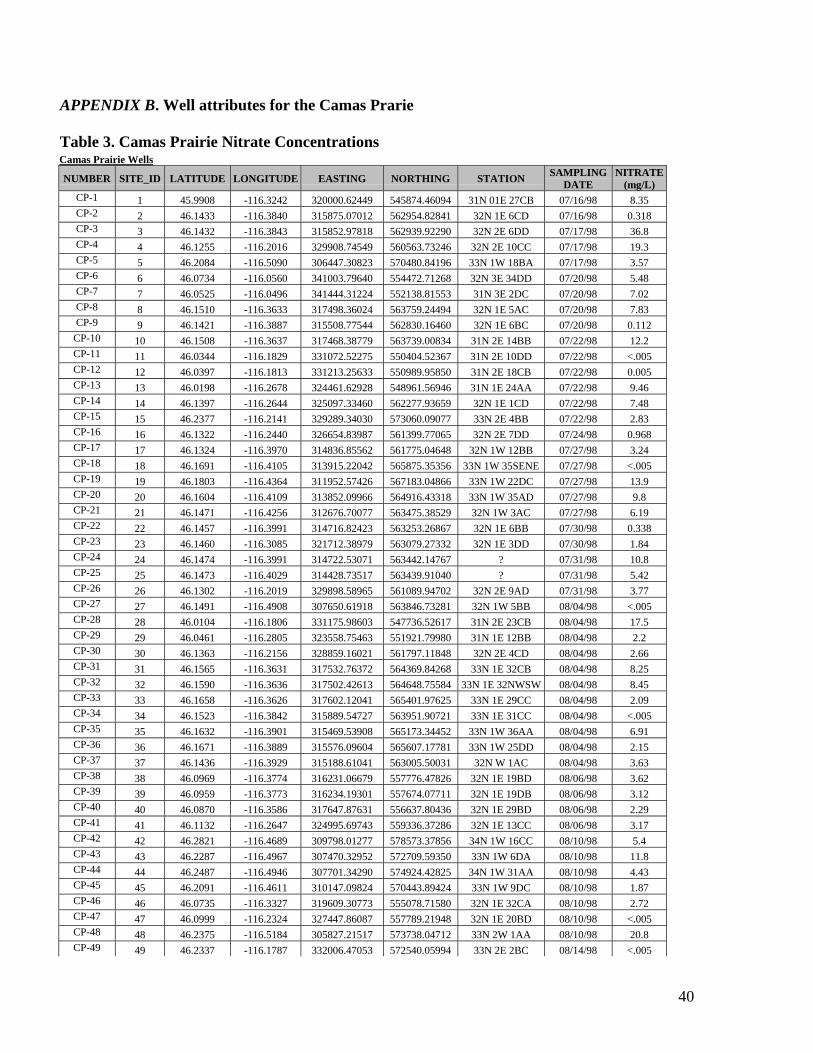
Camas Prairie Ground Water ReportIn 1998, the Department of Environmental Quality developed a plan to investigate ground waterquality of the Camas prairie. The goal of the study was to collect nitrate data from available

aluft
Note
Cancelled set by aluft
aluft
Note
None set by aluft

4

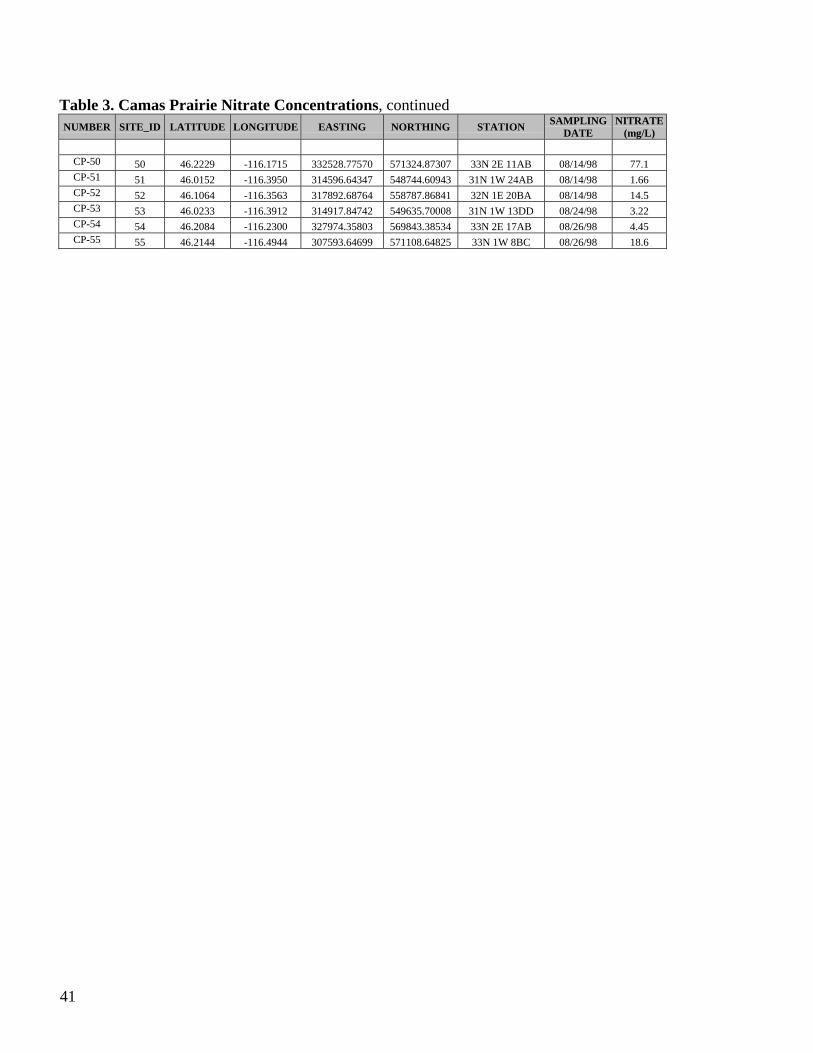
sources and sample new private wells to assess the ground water quality. Fifty-five domesticwells (Appendix B, Table 3) were selected and sampled within the designated study area. Thesesamples were analyzed for nitrate plus nitrite as nitrogen. Results from this report indicated thatthere were no precise conclusions as to specific contaminant sources; however, elevated nitrateconcentrations indicated that the Camas Prairie ground water was vulnerable to nitratecontamination.

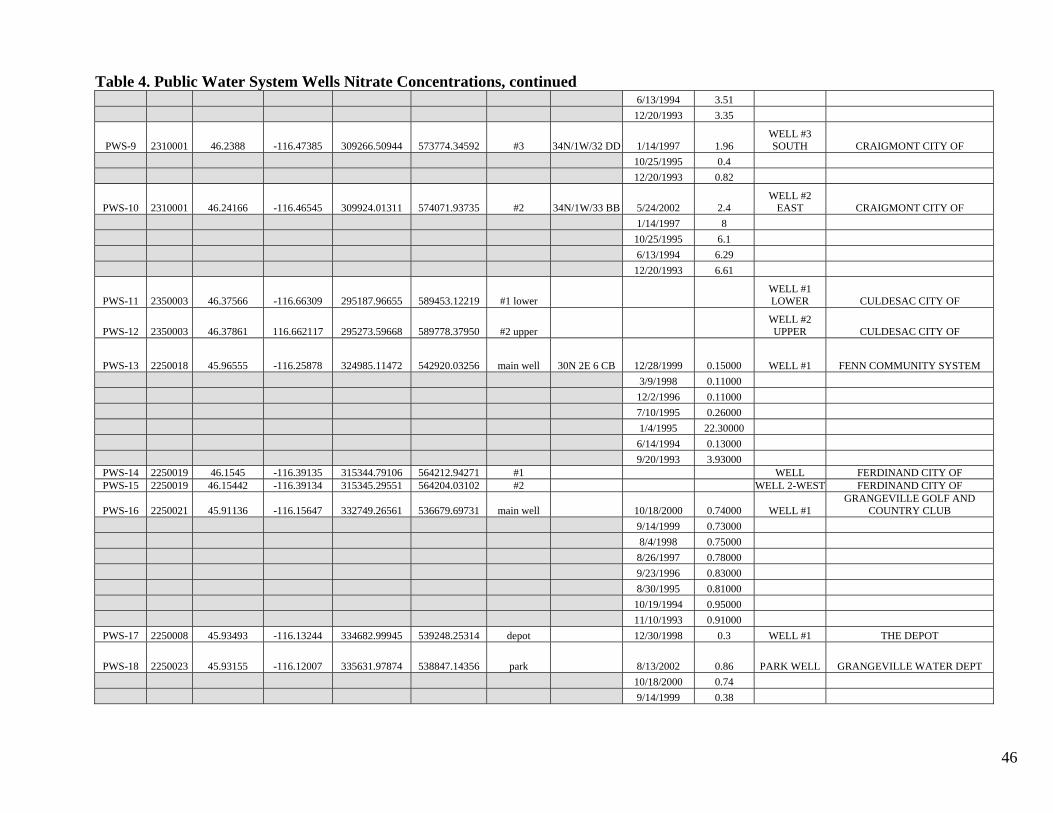
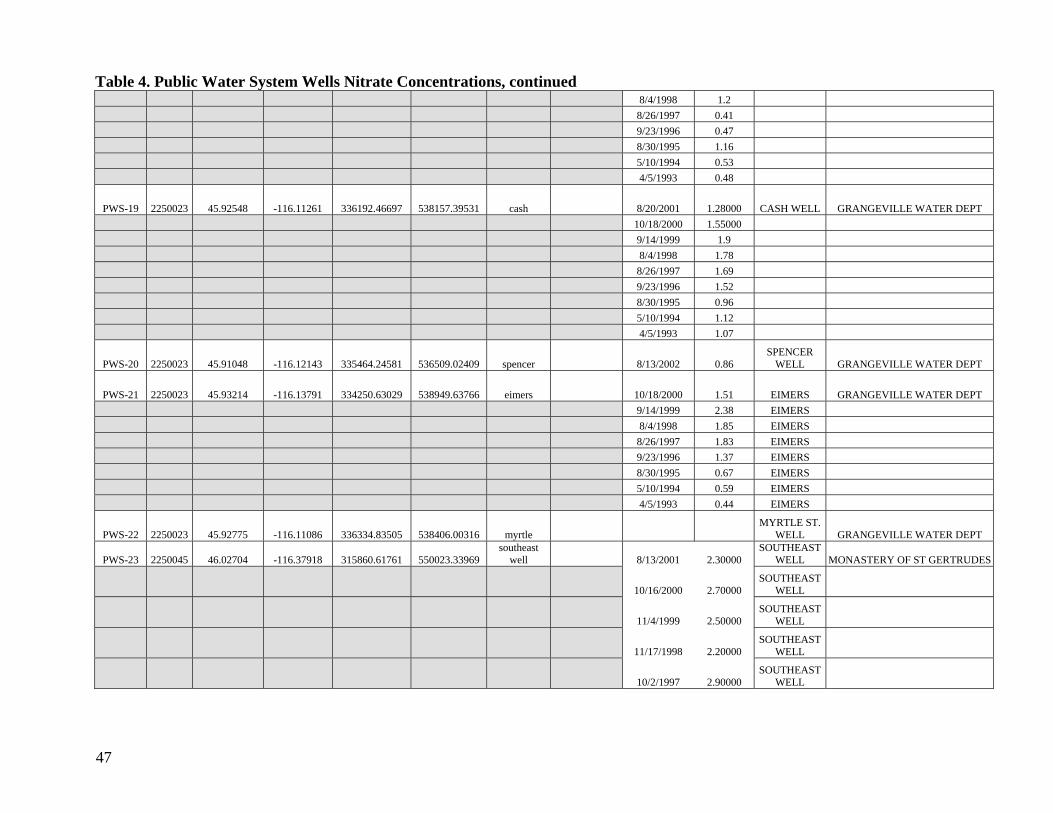
Public Water System DataPublic water system data (Appendix C, Table 4) for this study are divided into two categories.These two categories are: systems with greater than twenty-five connections and systems withless than twenty-five connections. DEQ is responsible for regulating systems with more than 25connections, and the North Central District Health Department is responsible for regulatingsystems with 25 connections or less. However, samples for the public water system wells arepossibly collected after treatment and storage. Therefore, determining exactly what the waterquality indicates from these samples can create interpretation problems.

Idaho State Department of AgricultureAs a follow up to previous monitoring by the Idaho Department of Water Resources and theDepartment of Environmental Quality, the Idaho State Department of Agriculture began its ownground water quality monitoring program in 2001, entitled the Southern Clearwater PlateauVolcanic Aquifer. Currently 72 domestic wells (Appendix D, Table 5, 6) in the ClearwaterPlateau Subarea are included in the regional ground water quality monitoring project and aresampled for nitrates and pesticides.

5

STUDY AREA

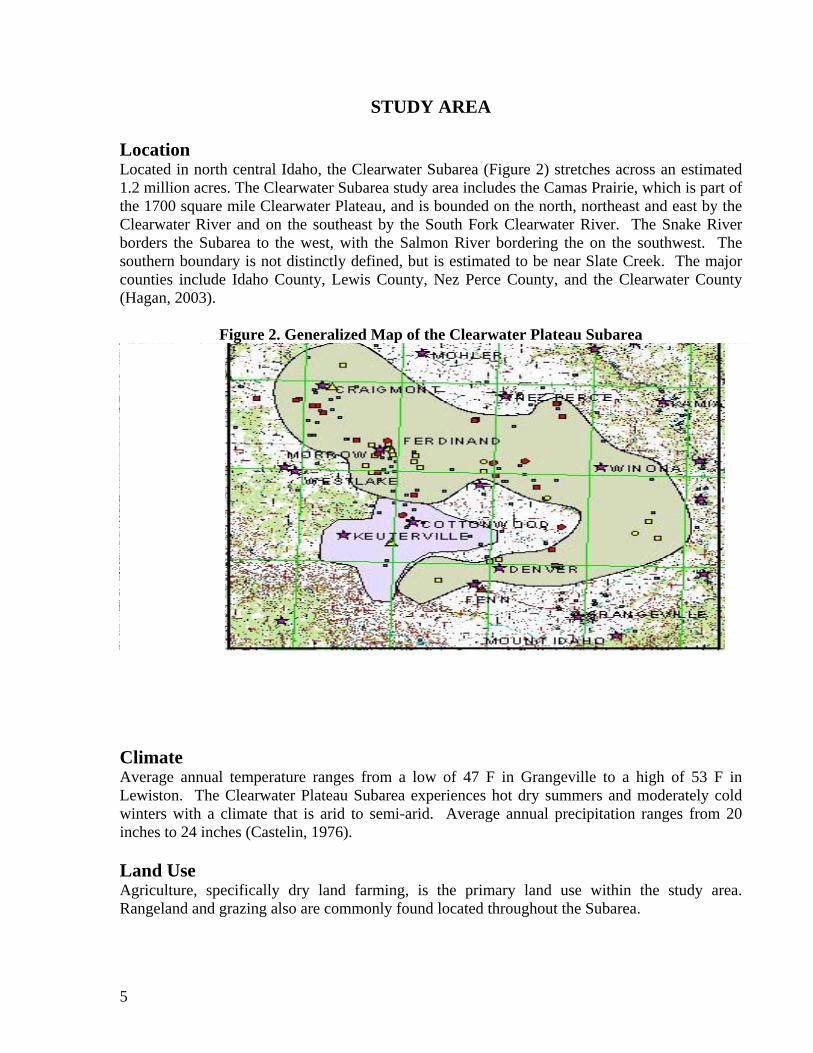
LocationLocated in north central Idaho, the Clearwater Subarea (Figure 2) stretches across an estimated1.2 million acres. The Clearwater Subarea study area includes the Camas Prairie, which is part ofthe 1700 square mile Clearwater Plateau, and is bounded on the north, northeast and east by theClearwater River and on the southeast by the South Fork Clearwater River. The Snake Riverborders the Subarea to the west, with the Salmon River bordering the on the southwest. Thesouthern boundary is not distinctly defined, but is estimated to be near Slate Creek. The majorcounties include Idaho County, Lewis County, Nez Perce County, and the Clearwater County(Hagan, 2003).

Figure 2. Generalized Map of the Clearwater Plateau Subarea

ClimateAverage annual temperature ranges from a low of 47 F in Grangeville to a high of 53 F inLewiston. The Clearwater Plateau Subarea experiences hot dry summers and moderately coldwinters with a climate that is arid to semi-arid. Average annual precipitation ranges from 20inches to 24 inches (Castelin, 1976).

Land UseAgriculture, specifically dry land farming, is the primary land use within the study area.Rangeland and grazing also are commonly found located throughout the Subarea.

6

GeographyThe Clearwater Plateau Subarea is divided into six physiographic features, which are theLewiston Basin, the Soldiers Meadow Slope, the Nezperce Plateau, the Camas Prairie, WhitebirdBasin, and the Dairy Mountain Slope (Bond 1963). The Salmon River, Clearwater River, SouthFork of the Clearwater River and the Snake River Watersheds are all encountered in theClearwater Plateau Subarea.

Hydrology and HydrogeologyThe geology of the Clearwater Plateau Subarea is characterized by the Columbia River Basalts.The Subarea lies within the Clearwater Embayment, which is the easternmost portion of theColumbia River Basalt flows (Hagan, 2003). The Clearwater Embayment consists of basalt unitsthat formed when lava flows filled in the pre-existing basement rock topography during theMiocene era (Stevens et. al, 2003). The basement rocks consist of volcanics associated with theSeven Devils Complex, granitoids associated with the Idaho Batholith, and metasedimentaryunits associated with the Belt Supergroup (Hagan, 2003). Majority of the area is capped with athin layer of loess.

Ground water existing in the Clearwater Plateau Subarea is most commonly found in the basaltaquifers and occasionally in the alluvial valley aquifers and basement rocks. More specifically,ground water occurs in fractures in the rock bodies, pore spaces of sedimentary material, andinterflow zones of basalt flows (Castelin, 1976). Unconfined and confined conditions are foundin both the regional and local flow systems. The regional direction of ground water flow is fromhigher elevations in the southern and southeastern sections of the Subarea toward the north,where ground water eventually discharges into the Clearwater River (Hagan, 2003). Local flowsystems are more unpredictable, as they are controlled by faults, fractures, and buried streamchannels.

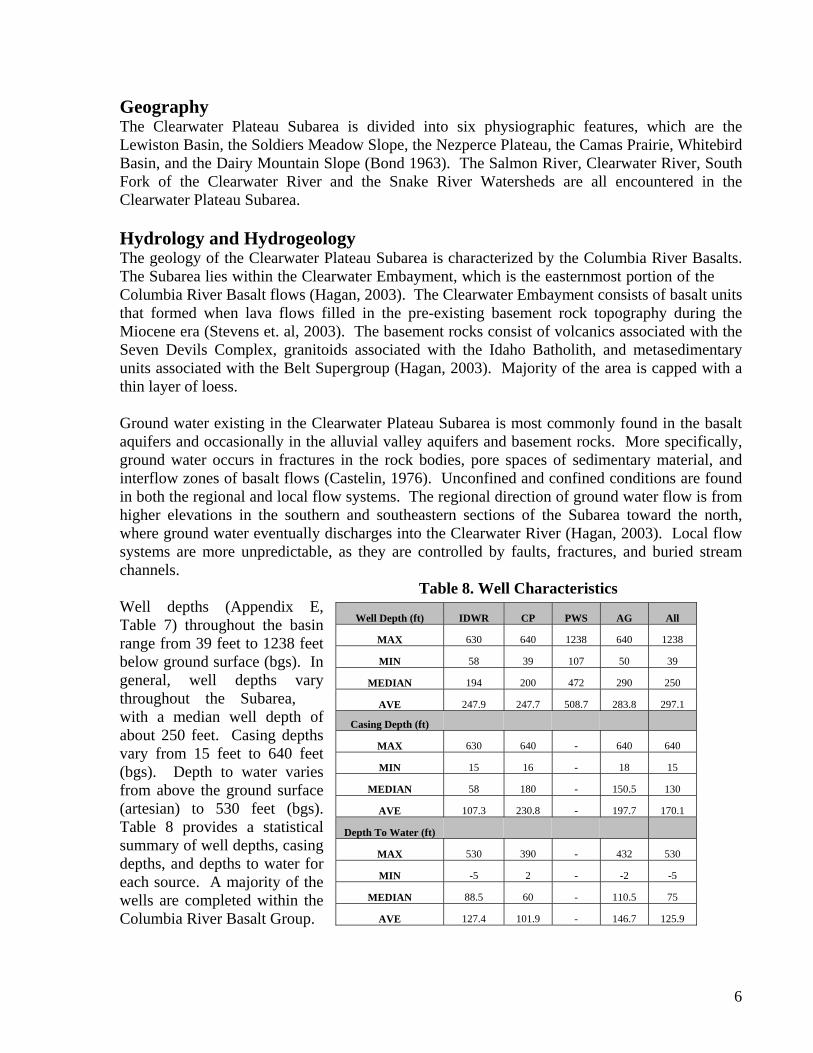
Table 8. Well CharacteristicsWell depths (Appendix E,Table 7) throughout the basinrange from 39 feet to 1238 feetbelow ground surface (bgs). Ingeneral, well depths varythroughout the Subarea,with a median well depth ofabout 250 feet. Casing depthsvary from 15 feet to 640 feet(bgs). Depth to water variesfrom above the ground surface(artesian) to 530 feet (bgs).Table 8 provides a statisticalsummary of well depths, casingdepths, and depths to water foreach source. A majority of thewells are completed within theColumbia River Basalt Group.

Well Depth (ft) IDWR CP PWS AG All

MAX 630 640 1238 640 1238

MIN 58 39 107 50 39

MEDIAN 194 200 472 290 250

AVE 247.9 247.7 508.7 283.8 297.1

Casing Depth (ft)

MAX 630 640 - 640 640

MIN 15 16 - 18 15

MEDIAN 58 180 - 150.5 130

AVE 107.3 230.8 - 197.7 170.1

Depth To Water (ft)

MAX 530 390 - 432 530

MIN -5 2 - -2 -5

MEDIAN 88.5 60 - 110.5 75

AVE 127.4 101.9 - 146.7 125.9

7

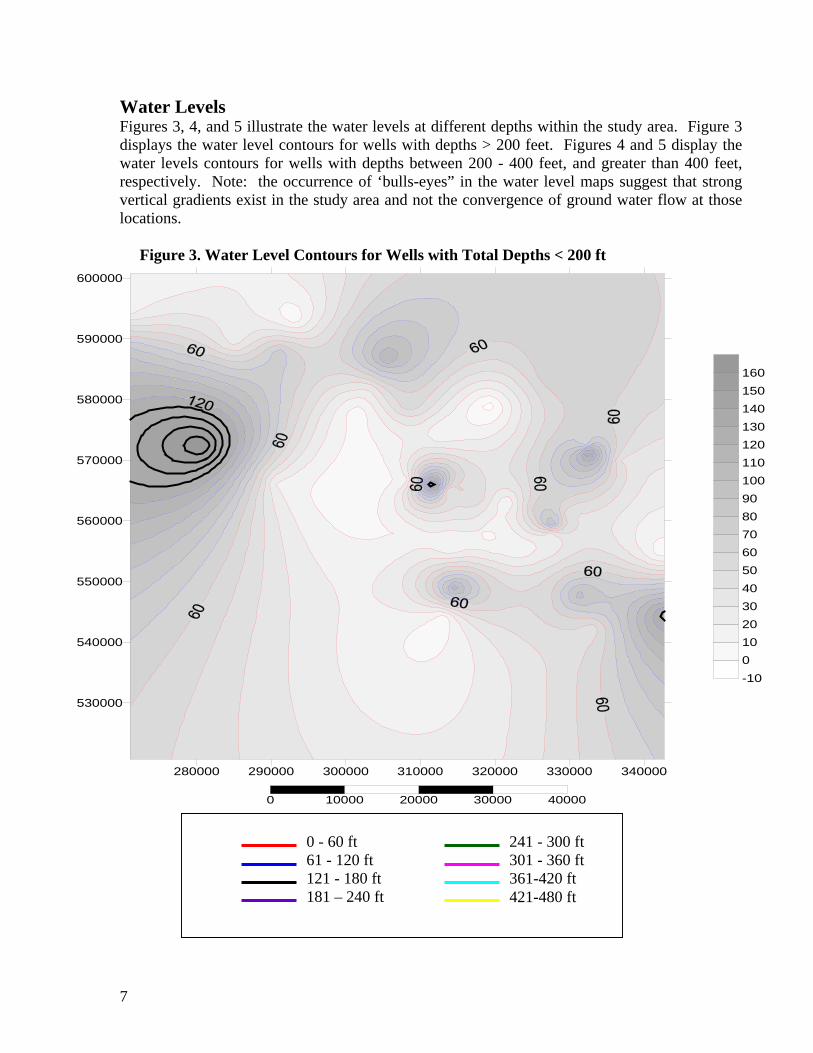
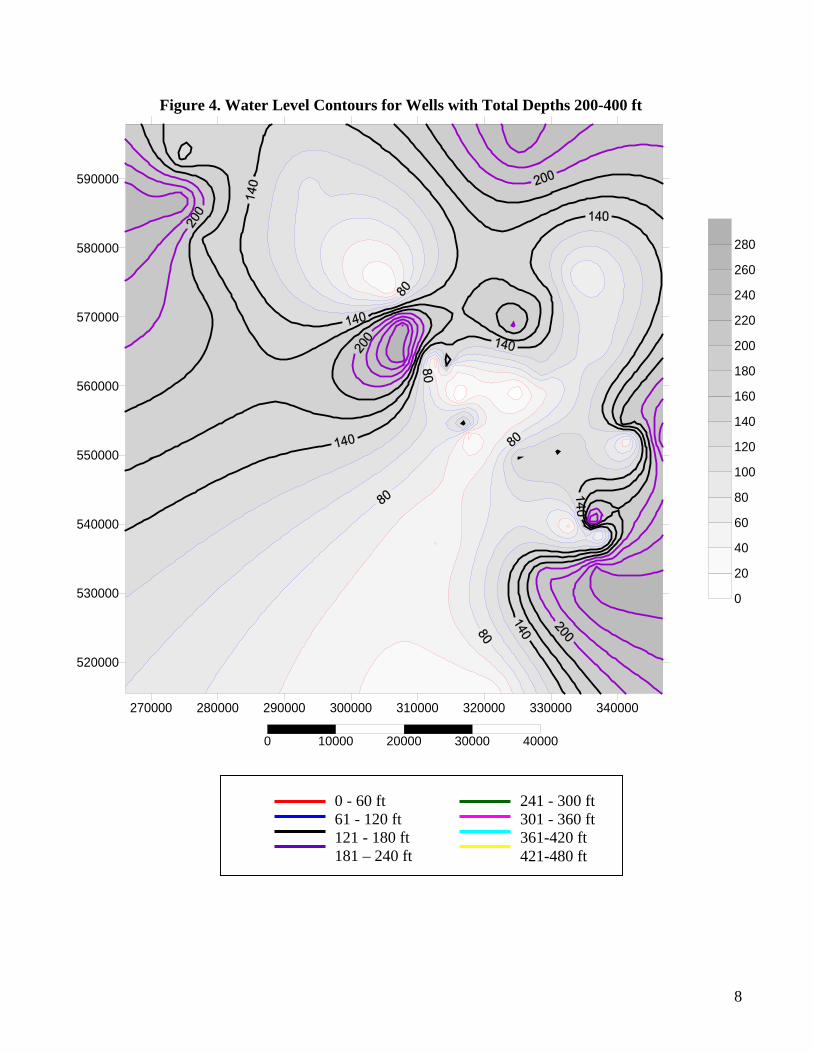
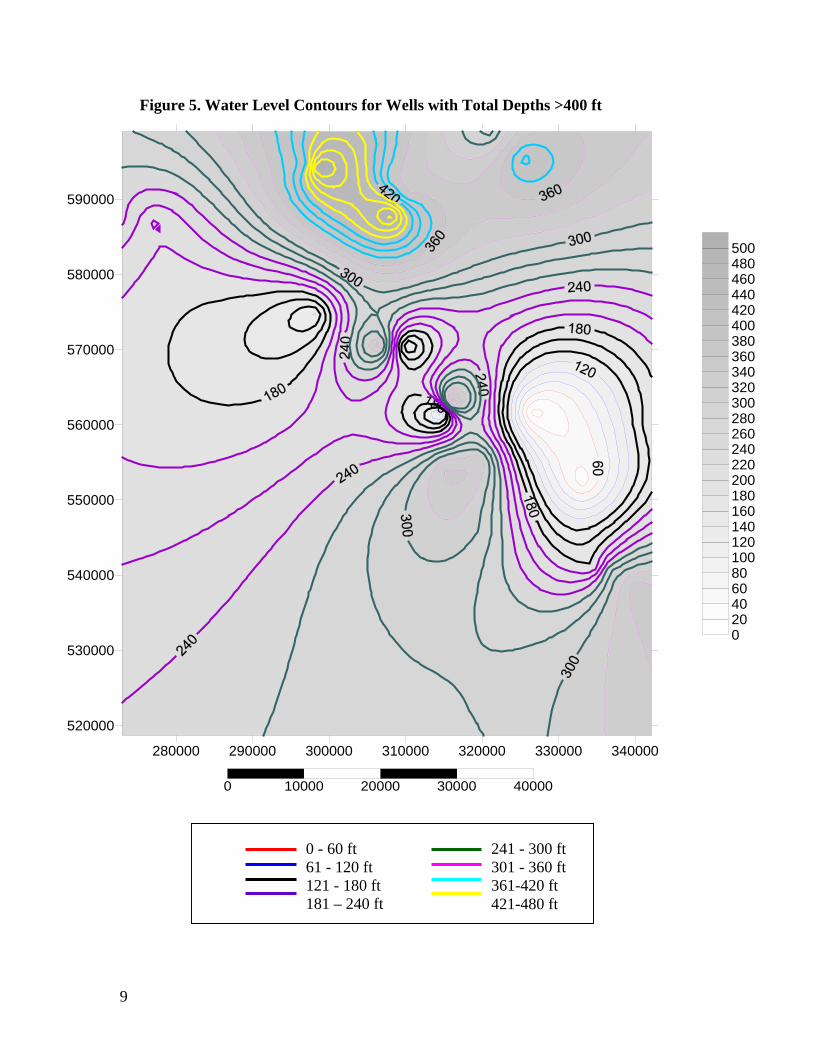
Water LevelsFigures 3, 4, and 5 illustrate the water levels at different depths within the study area. Figure 3displays the water level contours for wells with depths > 200 feet. Figures 4 and 5 display thewater levels contours for wells with depths between 200 - 400 feet, and greater than 400 feet,respectively. Note: the occurrence of ‘bulls-eyes” in the water level maps suggest that strongvertical gradients exist in the study area and not the convergence of ground water flow at thoselocations.

Figure 3. Water Level Contours for Wells with Total Depths < 200 ft

280000 290000 300000 310000 320000 330000 340000

530000

540000

550000

560000

570000

580000

590000

600000

-100102030405060708090100110120130140150160

0 10000 20000 30000 40000

0 - 60 ft61 - 120 ft121 - 180 ft181 – 240 ft

241 - 300 ft301 - 360 ft361-420 ft421-480 ft

8

Figure 4. Water Level Contours for Wells with Total Depths 200-400 ft

0 - 60 ft61 - 120 ft121 - 180 ft181 – 240 ft

241 - 300 ft301 - 360 ft361-420 ft421-480 ft

270000 280000 290000 300000 310000 320000 330000 340000

520000

530000

540000

550000

560000

570000

580000

590000

0

20

40

60

80

100

120

140

160

180

200

220

240

260

280

0 10000 20000 30000 40000

9

Figure 5. Water Level Contours for Wells with Total Depths >400 ft

280000 290000 300000 310000 320000 330000 340000

520000

530000

540000

550000

560000

570000

580000

590000

020406080100120140160180200220240260280300320340360380400420440460480500

0 10000 20000 30000 40000

0 - 60 ft61 - 120 ft121 - 180 ft181 – 240 ft

241 - 300 ft301 - 360 ft361-420 ft421-480 ft

10

RESULTS AND DISCUSSION

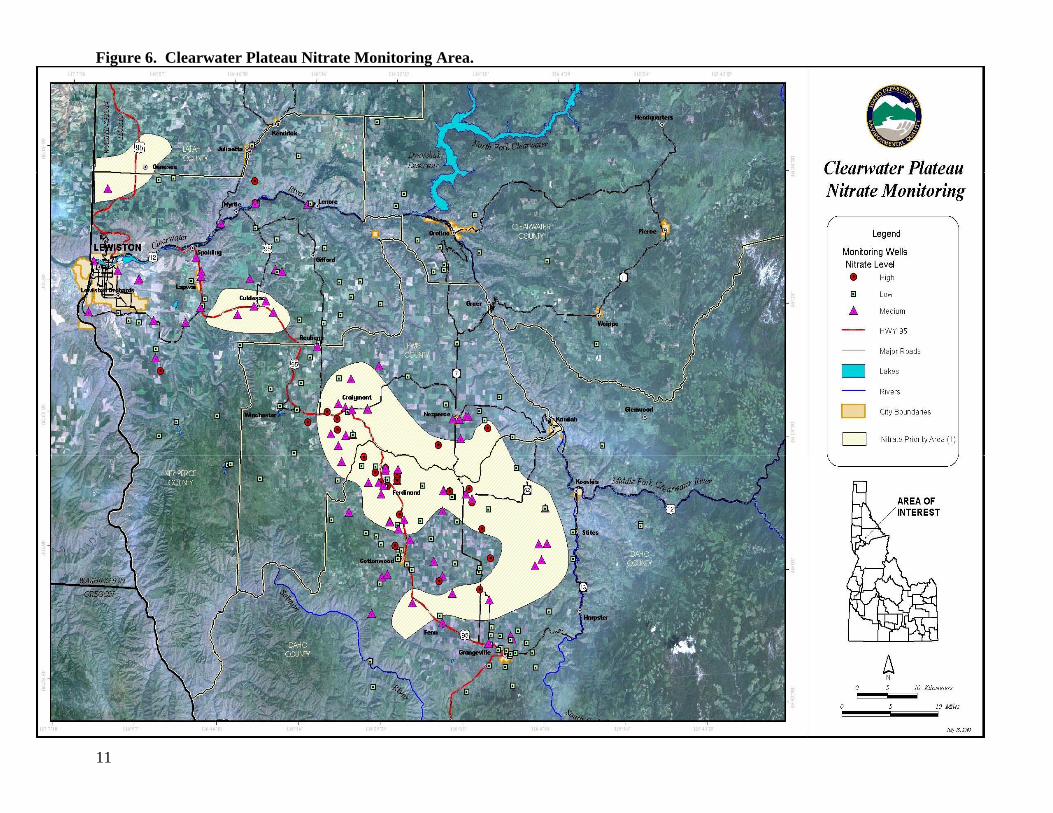
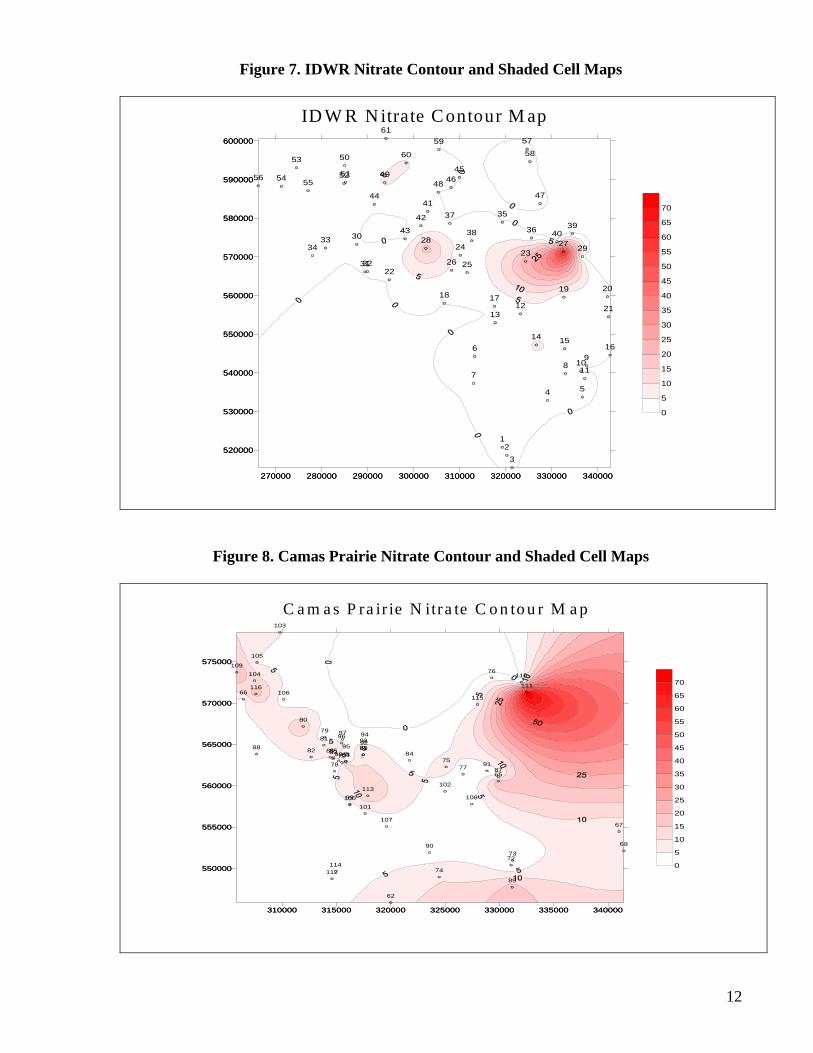
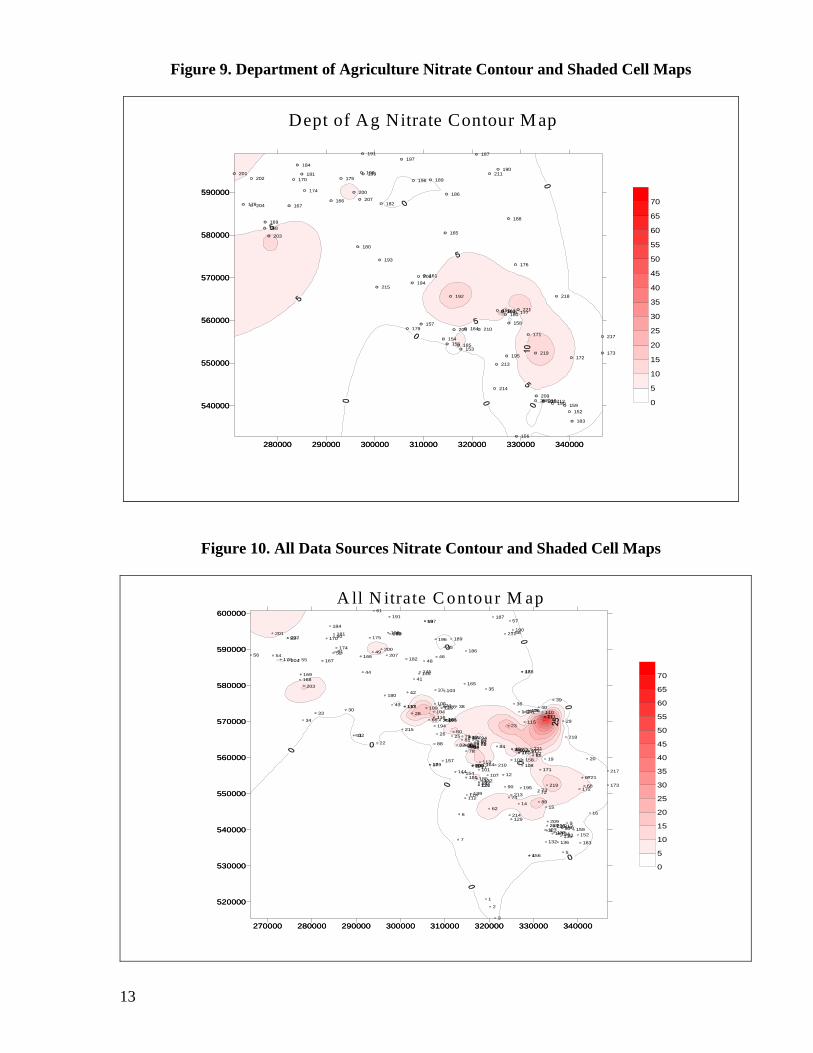
Nitrate SamplesNitrate data from the Statewide Ambient Monitoring Program, Idaho Department ofEnvironmental Quality, Idaho State Department of Agriculture, and the Public Water SystemData were compiled and analyzed. The total number of wells included for this study is 222, with209 having nitrate concentration data (Figure 6). Some of these wells have been sampled morethen once for a total of 453 nitrate samples from all the wells. There are currently 61 wells fromthe Statewide Ambient Monitoring Program through the Idaho Department of Water Resources(IDWR), 55 wells from the Camas Prairie Ground Water report by the Department ofEnvironmental Quality (DEQ), 34 Public Water System Wells (PWS), and 72 Idaho StateDepartment of Agriculture (ISDA) wells. Nitrate concentrations are contoured for eachsource of data separately and as a combined data set, figures 7 to 10. It is evident from all ofthese contour maps that nitrate concentrations are highest in the northeast portion of the Subarea.

11

Figure 6. Clearwater Plateau Nitrate Monitoring Area.

12

Figure 7. IDWR Nitrate Contour and Shaded Cell Maps

270000 280000 290000 300000 310000 320000 330000 340000

520000

530000

540000

550000

560000

570000

580000

590000

600000

0

5

10

15

20

25

30

35

40

45

50

55

60

65

70

12

3

4 5

6

78

91011

1213

14 1516

171819 20

21

22

2324

2526

272829

30

3132

3334

35

36

37

3839

40

41

42

43

44

4546

4748

49

50

5152

53

54 5556

5758

59

60

61

270000 280000 290000 300000 310000 320000 330000 340000

520000

530000

540000

550000

560000

570000

580000

590000

600000

ID W R N itrate C ontour M ap

Figure 8. Camas Prairie Nitrate Contour and Shaded Cell Maps

310000 315000 320000 325000 330000 335000 340000

550000

555000

560000

565000

570000

575000

0

5

10

15

20

25

30

35

40

45

50

55

60

65

70

62

6364

65

66

67

68

6970

71

7273

74

75

76

7778

79

80

81

82 83 848586

87

88

89

90

91

929394

95

9697

98

99100101

102

103

104

105

106

107

108

109

110

111

112

113

114

115

116

310000 315000 320000 325000 330000 335000 340000

550000

555000

560000

565000

570000

575000

C a m a s P ra ir ie N itra te C o n to u r M a p

13

Figure 9. Department of Agriculture Nitrate Contour and Shaded Cell Maps

280000 290000 300000 310000 320000 330000 340000

540000

550000

560000

570000

580000

590000

0

5

10

15

20

25

30

35

40

45

50

55

60

65

70

150

151

152

153

154155

156

157 158

159

160

161

162163

164

165

166167

168169

170

171

172173

174

175

176

177

178

179

180

181

182

183

184

185

186

187

188

189

190

191

192

193

194

195

196

197

198199

200

201202

203

204

205

206

207

208209

210

211

212

213

214

215

216

217

218

219

220

221

280000 290000 300000 310000 320000 330000 340000

540000

550000

560000

570000

580000

590000

Dept of Ag Nitrate Contour Map

Figure 10. All Data Sources Nitrate Contour and Shaded Cell Maps

A ll N itrate C ontour M ap

270000 280000 290000 300000 310000 320000 330000 340000

520000

530000

540000

550000

560000

570000

580000

590000

600000

0

5

10

15

20

25

30

35

40

45

50

55

60

65

70

1

2

3

45

6

7

8

910

11

12

13

1415

16

171819 20

21

22

2324

2526

2728

29

30

3132

33

34

35

36

37

3839

40

41

42

43

44

45

46

47

48

49

50

5152

53

5455

56

57

58

59

60

61

62

6364

65

66

67

68

6970

71

7273

74

75

76

7778

7980

8182 83 848586

87

88

89

90

91

92939495

9697

98

99100101

102

103

104

105

106

107

108

109110111

112

113

114

115116

117

120121122

123

124125126

129

132

133134135136

137

139

141142

144

145146

150

151

152

153

154155

156

157 158

159

160

161

162163

164

165

166167

168169

170

171

172173

174

175

176

177

178

179

180

181

182

183

184

185

186

187

188

189

190

191

192

193

194

195

196

197

198199

200

201202

203

204

205

206

207

208209

210

211

212

213

214

215

216

217

218

219

220

221

270000 280000 290000 300000 310000 320000 330000 340000

520000

530000

540000

550000

560000

570000

580000

590000

600000

14

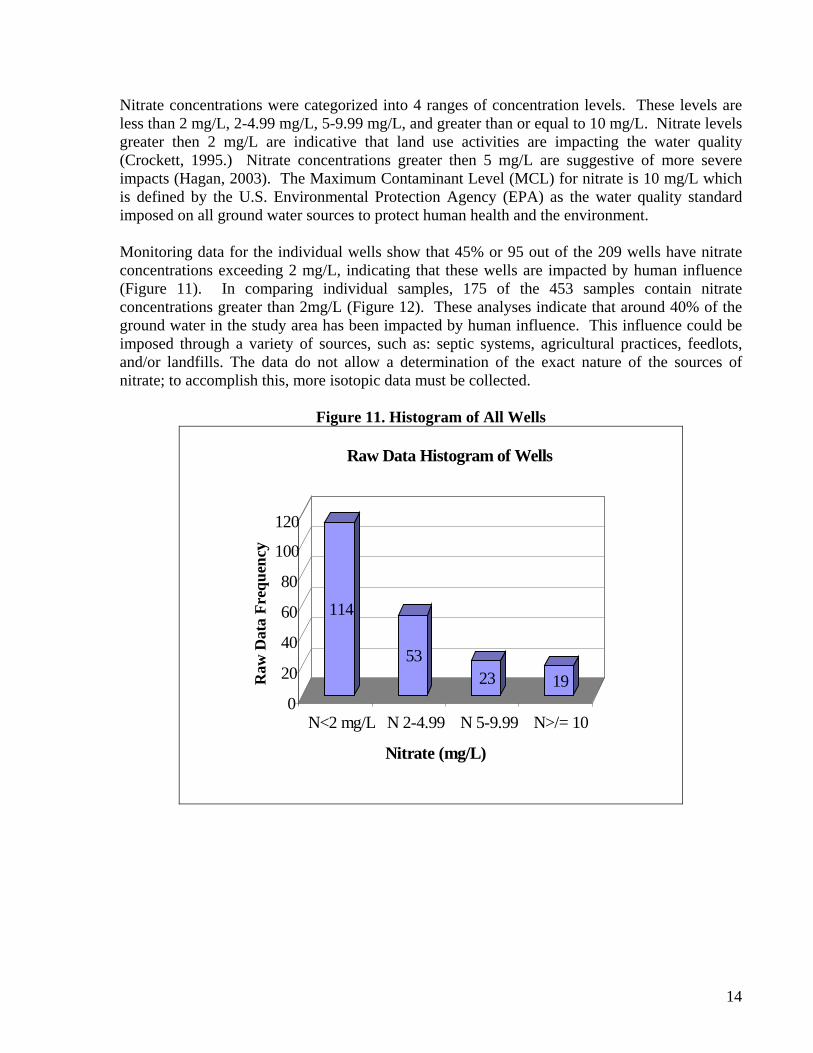
Nitrate concentrations were categorized into 4 ranges of concentration levels. These levels areless than 2 mg/L, 2-4.99 mg/L, 5-9.99 mg/L, and greater than or equal to 10 mg/L. Nitrate levelsgreater then 2 mg/L are indicative that land use activities are impacting the water quality(Crockett, 1995.) Nitrate concentrations greater then 5 mg/L are suggestive of more severeimpacts (Hagan, 2003). The Maximum Contaminant Level (MCL) for nitrate is 10 mg/L whichis defined by the U.S. Environmental Protection Agency (EPA) as the water quality standardimposed on all ground water sources to protect human health and the environment.

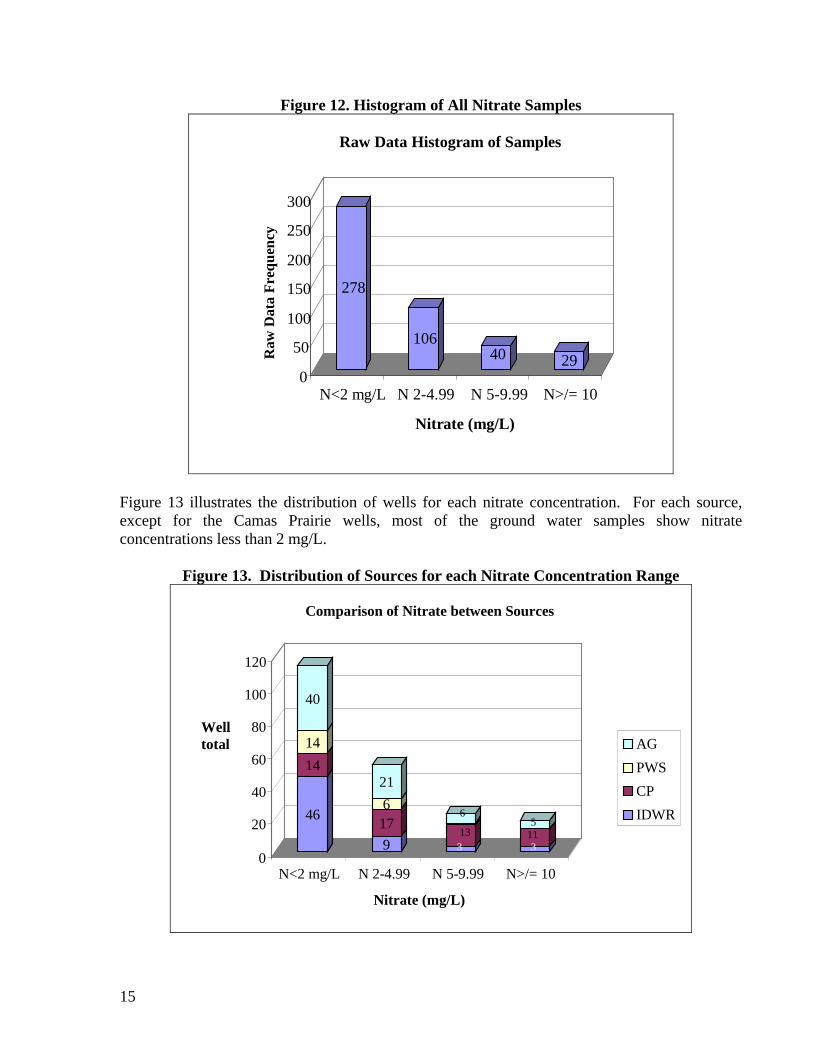
Monitoring data for the individual wells show that 45% or 95 out of the 209 wells have nitrateconcentrations exceeding 2 mg/L, indicating that these wells are impacted by human influence(Figure 11). In comparing individual samples, 175 of the 453 samples contain nitrateconcentrations greater than 2mg/L (Figure 12). These analyses indicate that around 40% of theground water in the study area has been impacted by human influence. This influence could beimposed through a variety of sources, such as: septic systems, agricultural practices, feedlots,and/or landfills. The data do not allow a determination of the exact nature of the sources ofnitrate; to accomplish this, more isotopic data must be collected.

Figure 11. Histogram of All Wells

114

5323 19

0

20

40

60

80

100

120

Raw

Dat

a Fr

eque

ncy

N<2 mg/L N 2-4.99 N 5-9.99 N>/= 10

Nitrate (mg/L)

Raw Data Histogram of Wells

15

Figure 12. Histogram of All Nitrate Samples

278

10640 29

0

50

100

150

200

250

300

Raw

Dat

a Fr

eque

ncy

N<2 mg/L N 2-4.99 N 5-9.99 N>/= 10

Nitrate (mg/L)

Raw Data Histogram of Samples

Figure 13 illustrates the distribution of wells for each nitrate concentration. For each source,except for the Camas Prairie wells, most of the ground water samples show nitrateconcentrations less than 2 mg/L.

Figure 13. Distribution of Sources for each Nitrate Concentration Range

46

1414

40

917621

313

6

3115

0

20

40

60

80

100

120

Welltotal

N<2 mg/L N 2-4.99 N 5-9.99 N>/= 10

Nitrate (mg/L)

Comparison of Nitrate between Sources

AGPWSCPIDWR

16

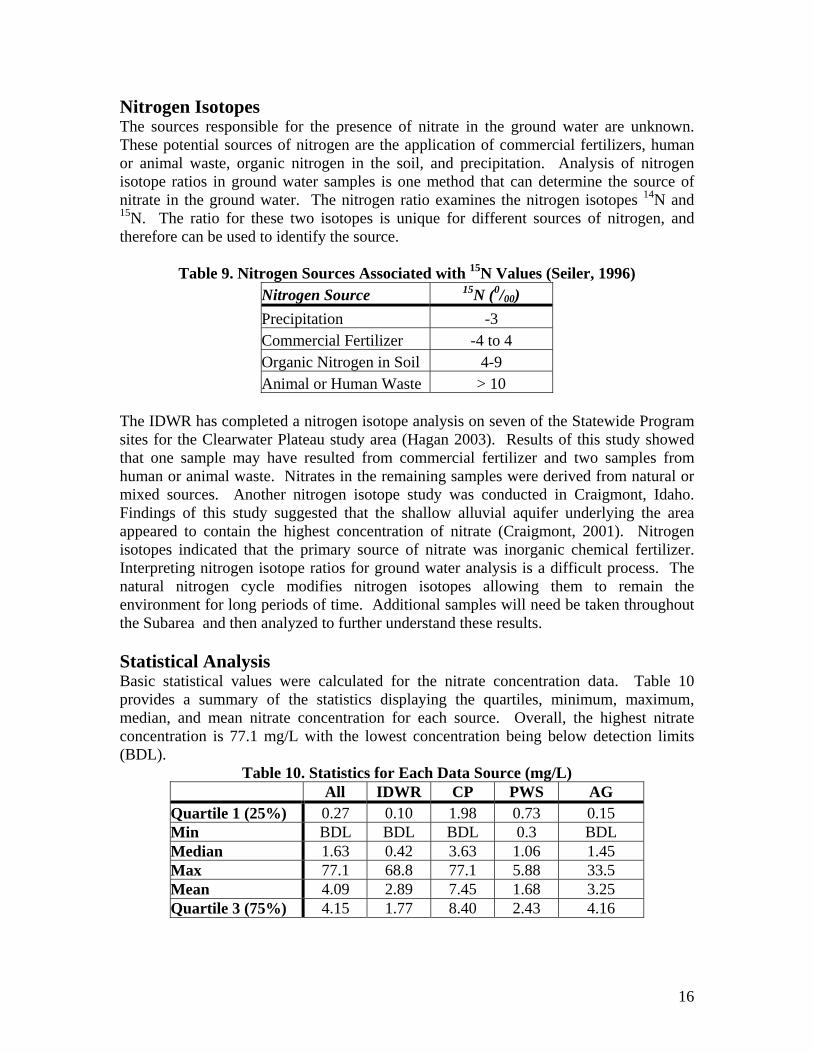
Nitrogen IsotopesThe sources responsible for the presence of nitrate in the ground water are unknown.These potential sources of nitrogen are the application of commercial fertilizers, humanor animal waste, organic nitrogen in the soil, and precipitation. Analysis of nitrogenisotope ratios in ground water samples is one method that can determine the source ofnitrate in the ground water. The nitrogen ratio examines the nitrogen isotopes 14N and15N. The ratio for these two isotopes is unique for different sources of nitrogen, andtherefore can be used to identify the source.

Table 9. Nitrogen Sources Associated with 15N Values (Seiler, 1996)Nitrogen Source 15N (0/00)Precipitation -3Commercial Fertilizer -4 to 4Organic Nitrogen in Soil 4-9Animal or Human Waste > 10

The IDWR has completed a nitrogen isotope analysis on seven of the Statewide Programsites for the Clearwater Plateau study area (Hagan 2003). Results of this study showedthat one sample may have resulted from commercial fertilizer and two samples fromhuman or animal waste. Nitrates in the remaining samples were derived from natural ormixed sources. Another nitrogen isotope study was conducted in Craigmont, Idaho.Findings of this study suggested that the shallow alluvial aquifer underlying the areaappeared to contain the highest concentration of nitrate (Craigmont, 2001). Nitrogenisotopes indicated that the primary source of nitrate was inorganic chemical fertilizer.Interpreting nitrogen isotope ratios for ground water analysis is a difficult process. Thenatural nitrogen cycle modifies nitrogen isotopes allowing them to remain theenvironment for long periods of time. Additional samples will need be taken throughoutthe Subarea and then analyzed to further understand these results.

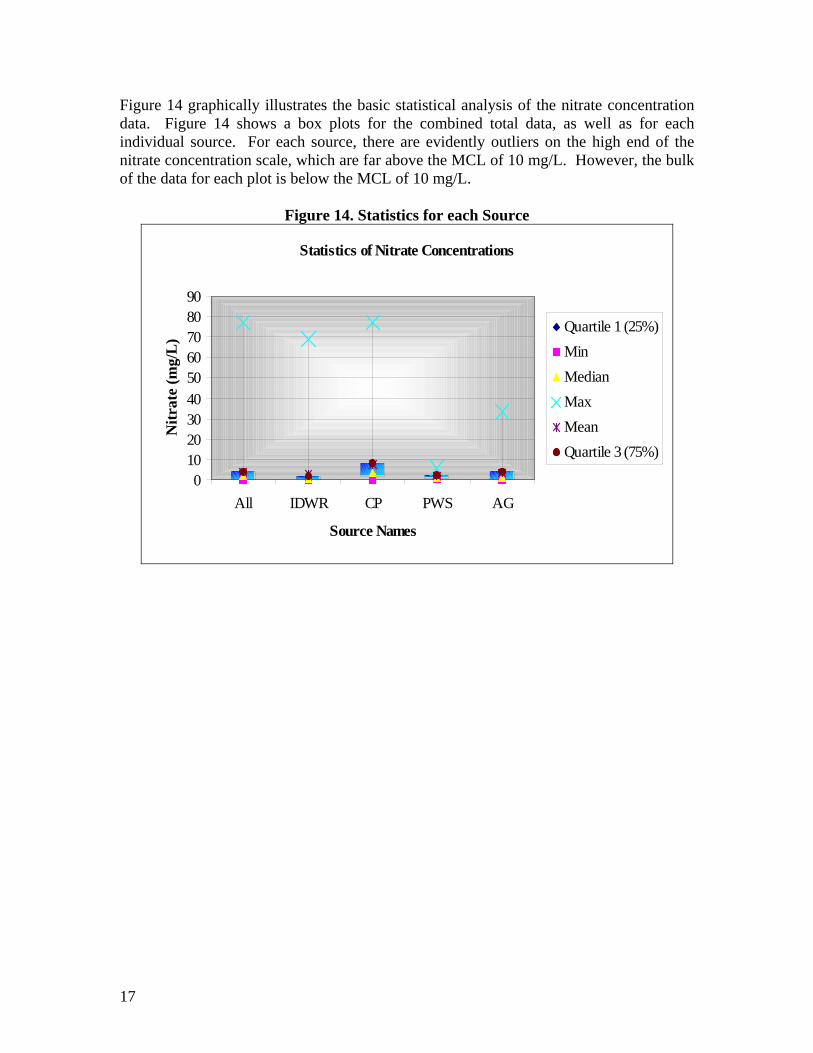
Statistical AnalysisBasic statistical values were calculated for the nitrate concentration data. Table 10provides a summary of the statistics displaying the quartiles, minimum, maximum,median, and mean nitrate concentration for each source. Overall, the highest nitrateconcentration is 77.1 mg/L with the lowest concentration being below detection limits(BDL).

Table 10. Statistics for Each Data Source (mg/L) All IDWR CP PWS AG

Quartile 1 (25%) 0.27 0.10 1.98 0.73 0.15Min BDL BDL BDL 0.3 BDLMedian 1.63 0.42 3.63 1.06 1.45Max 77.1 68.8 77.1 5.88 33.5Mean 4.09 2.89 7.45 1.68 3.25Quartile 3 (75%) 4.15 1.77 8.40 2.43 4.16

17

Figure 14 graphically illustrates the basic statistical analysis of the nitrate concentrationdata. Figure 14 shows a box plots for the combined total data, as well as for eachindividual source. For each source, there are evidently outliers on the high end of thenitrate concentration scale, which are far above the MCL of 10 mg/L. However, the bulkof the data for each plot is below the MCL of 10 mg/L.

Figure 14. Statistics for each Source

Statistics of Nitrate Concentrations

0102030405060708090

All IDWR CP PWS AG

Source Names

Nitr

ate

(mg/

L)

Quartile 1 (25%)MinMedianMaxMeanQuartile 3 (75%)

18

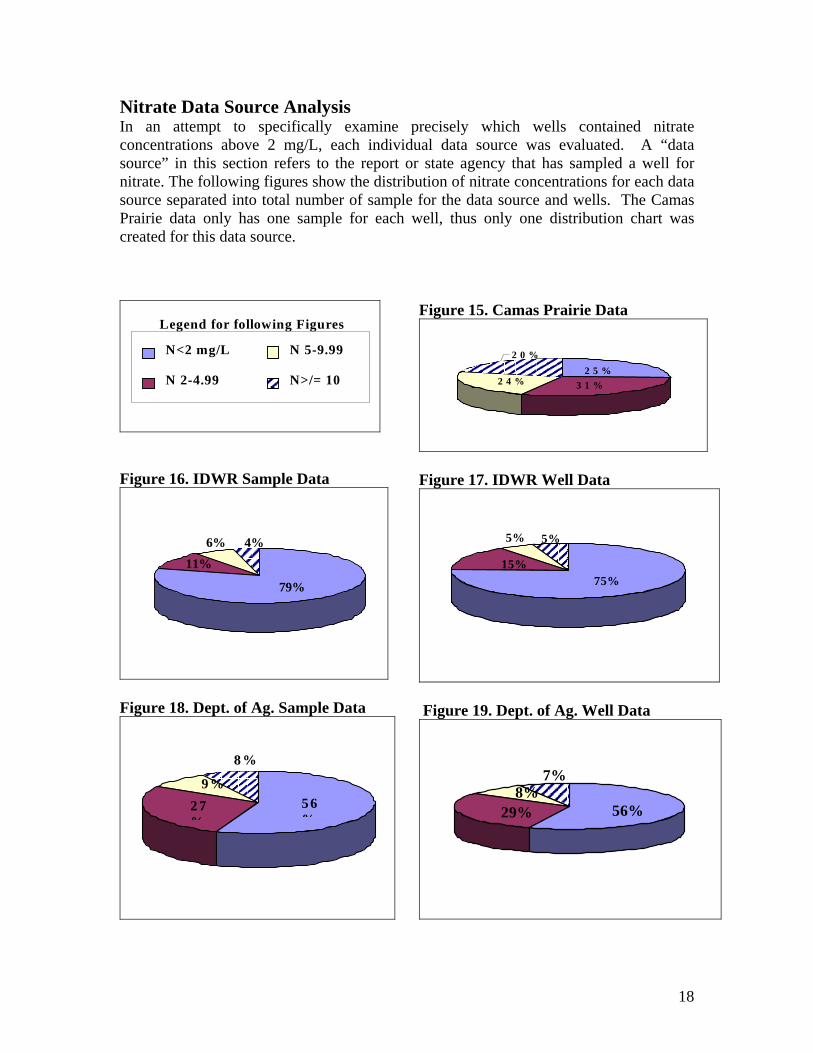
Nitrate Data Source AnalysisIn an attempt to specifically examine precisely which wells contained nitrateconcentrations above 2 mg/L, each individual data source was evaluated. A “datasource” in this section refers to the report or state agency that has sampled a well fornitrate. The following figures show the distribution of nitrate concentrations for each datasource separated into total number of sample for the data source and wells. The CamasPrairie data only has one sample for each well, thus only one distribution chart wascreated for this data source.

Legend for following Figures

N<2 mg/L

N 2-4.99

N 5-9.99

N>/= 10

Figure 16. IDWR Sample Data

79%

4% 6% 11%

Figure 18. Dept. of Ag. Sample Data

5 6%

2 7%

8 %

9 %

Figure 15. Camas Prairie Data

2 5 % 3 1 % 2 4 %

2 0 %

Figure 17. IDWR Well Data

75%15%

5% 5%

Figure 19. Dept. of Ag. Well Data

56%29%8%

7%

19

Figure 20. PWS Well Data

0% 5%

29% 66%

Figure 21. PWS Sample Data

1% 4%

31% 64%

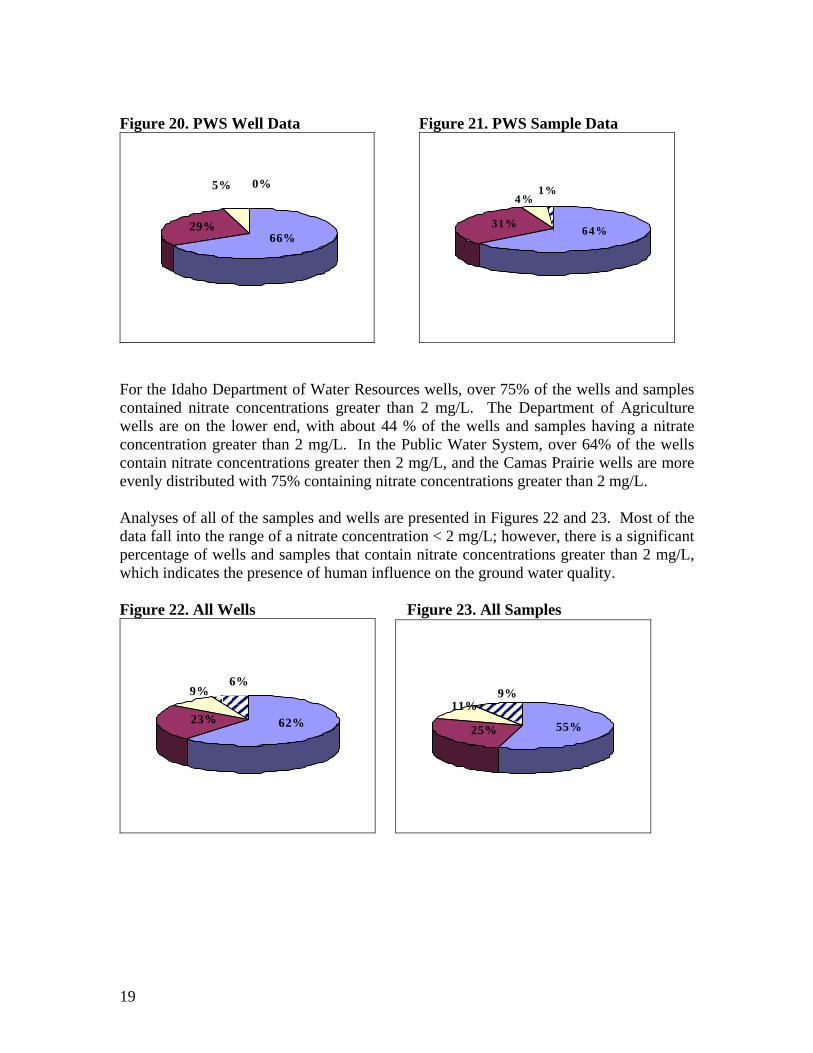
For the Idaho Department of Water Resources wells, over 75% of the wells and samplescontained nitrate concentrations greater than 2 mg/L. The Department of Agriculturewells are on the lower end, with about 44 % of the wells and samples having a nitrateconcentration greater than 2 mg/L. In the Public Water System, over 64% of the wellscontain nitrate concentrations greater then 2 mg/L, and the Camas Prairie wells are moreevenly distributed with 75% containing nitrate concentrations greater than 2 mg/L.

Analyses of all of the samples and wells are presented in Figures 22 and 23. Most of thedata fall into the range of a nitrate concentration < 2 mg/L; however, there is a significantpercentage of wells and samples that contain nitrate concentrations greater than 2 mg/L,which indicates the presence of human influence on the ground water quality.

Figure 22. All Wells Figure 23. All Samples

62% 23%

9% 6%

55% 25%

11%9%

20

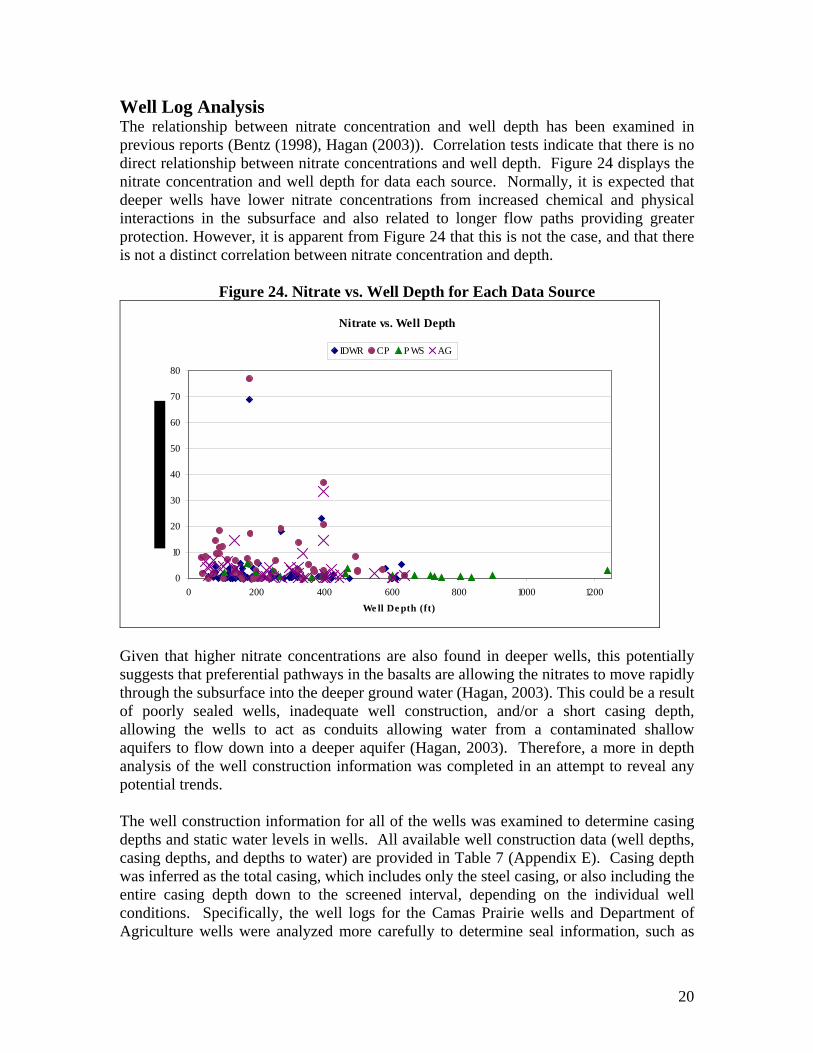
Well Log AnalysisThe relationship between nitrate concentration and well depth has been examined inprevious reports (Bentz (1998), Hagan (2003)). Correlation tests indicate that there is nodirect relationship between nitrate concentrations and well depth. Figure 24 displays thenitrate concentration and well depth for data each source. Normally, it is expected thatdeeper wells have lower nitrate concentrations from increased chemical and physicalinteractions in the subsurface and also related to longer flow paths providing greaterprotection. However, it is apparent from Figure 24 that this is not the case, and that thereis not a distinct correlation between nitrate concentration and depth.

Figure 24. Nitrate vs. Well Depth for Each Data Source

Nitrate vs. Well Depth

0

10

20

30

40

50

60

70

80

0 200 400 600 800 1000 1200We ll De pth (ft)

IDWR CP P WS AG

Given that higher nitrate concentrations are also found in deeper wells, this potentiallysuggests that preferential pathways in the basalts are allowing the nitrates to move rapidlythrough the subsurface into the deeper ground water (Hagan, 2003). This could be a resultof poorly sealed wells, inadequate well construction, and/or a short casing depth,allowing the wells to act as conduits allowing water from a contaminated shallowaquifers to flow down into a deeper aquifer (Hagan, 2003). Therefore, a more in depthanalysis of the well construction information was completed in an attempt to reveal anypotential trends.

The well construction information for all of the wells was examined to determine casingdepths and static water levels in wells. All available well construction data (well depths,casing depths, and depths to water) are provided in Table 7 (Appendix E). Casing depthwas inferred as the total casing, which includes only the steel casing, or also including theentire casing depth down to the screened interval, depending on the individual wellconditions. Specifically, the well logs for the Camas Prairie wells and Department ofAgriculture wells were analyzed more carefully to determine seal information, such as

21

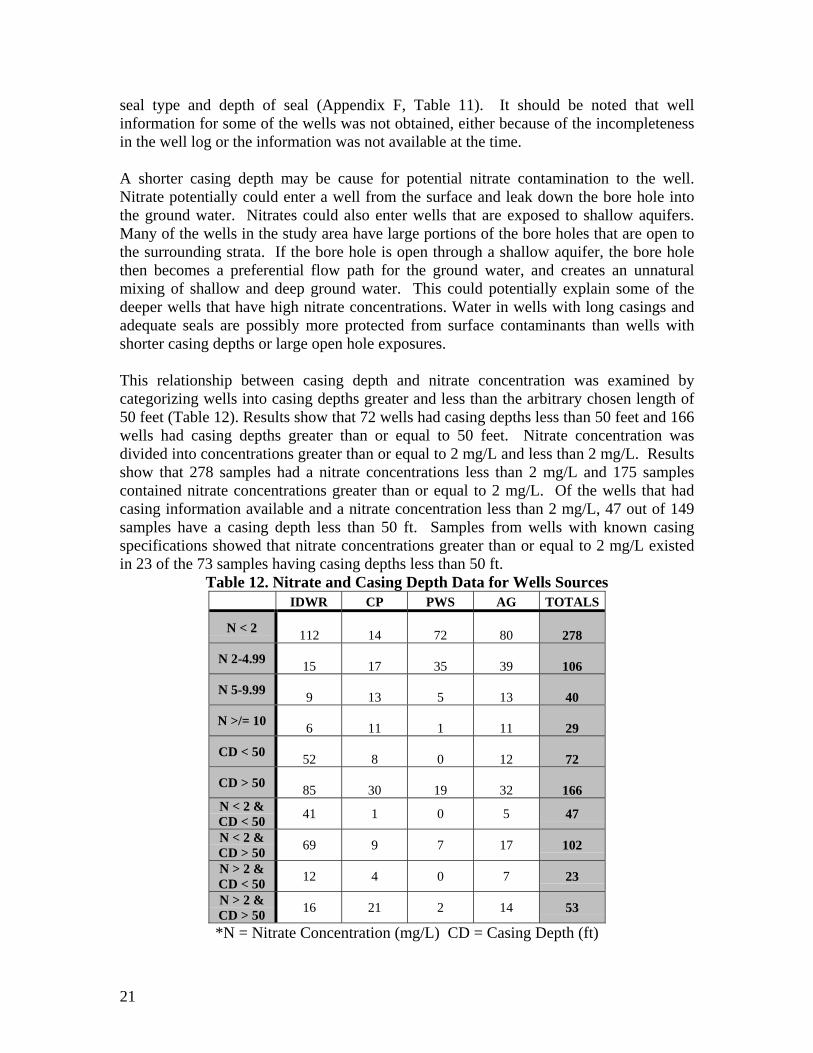
seal type and depth of seal (Appendix F, Table 11). It should be noted that wellinformation for some of the wells was not obtained, either because of the incompletenessin the well log or the information was not available at the time.

A shorter casing depth may be cause for potential nitrate contamination to the well.Nitrate potentially could enter a well from the surface and leak down the bore hole intothe ground water. Nitrates could also enter wells that are exposed to shallow aquifers.Many of the wells in the study area have large portions of the bore holes that are open tothe surrounding strata. If the bore hole is open through a shallow aquifer, the bore holethen becomes a preferential flow path for the ground water, and creates an unnaturalmixing of shallow and deep ground water. This could potentially explain some of thedeeper wells that have high nitrate concentrations. Water in wells with long casings andadequate seals are possibly more protected from surface contaminants than wells withshorter casing depths or large open hole exposures.

This relationship between casing depth and nitrate concentration was examined bycategorizing wells into casing depths greater and less than the arbitrary chosen length of50 feet (Table 12). Results show that 72 wells had casing depths less than 50 feet and 166wells had casing depths greater than or equal to 50 feet. Nitrate concentration wasdivided into concentrations greater than or equal to 2 mg/L and less than 2 mg/L. Resultsshow that 278 samples had a nitrate concentrations less than 2 mg/L and 175 samplescontained nitrate concentrations greater than or equal to 2 mg/L. Of the wells that hadcasing information available and a nitrate concentration less than 2 mg/L, 47 out of 149samples have a casing depth less than 50 ft. Samples from wells with known casingspecifications showed that nitrate concentrations greater than or equal to 2 mg/L existedin 23 of the 73 samples having casing depths less than 50 ft.

Table 12. Nitrate and Casing Depth Data for Wells SourcesIDWR CP PWS AG TOTALS

N < 2 112 14 72 80 278

N 2-4.99 15 17 35 39 106

N 5-9.99 9 13 5 13 40

N >/= 10 6 11 1 11 29

CD < 50 52 8 0 12 72

CD > 50 85 30 19 32 166N < 2 &CD < 50 41 1 0 5 47

N < 2 &CD > 50 69 9 7 17 102

N > 2 &CD < 50 12 4 0 7 23

N > 2 &CD > 50 16 21 2 14 53

*N = Nitrate Concentration (mg/L) CD = Casing Depth (ft)

22

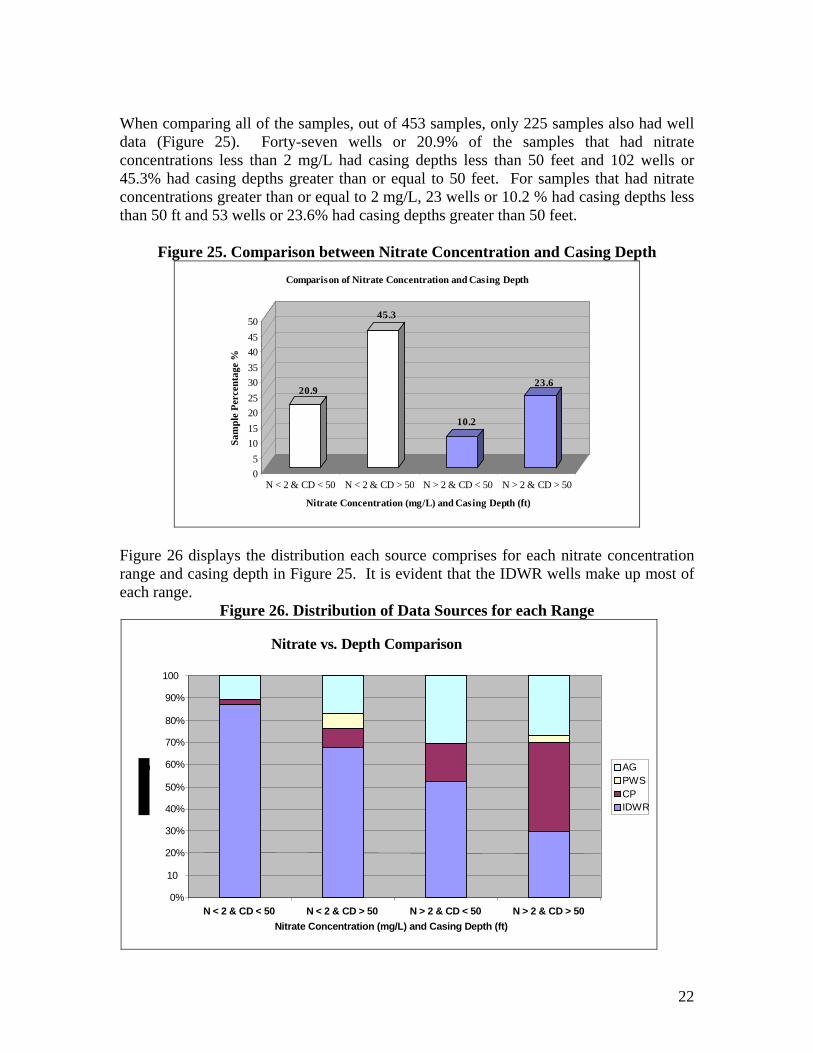
When comparing all of the samples, out of 453 samples, only 225 samples also had welldata (Figure 25). Forty-seven wells or 20.9% of the samples that had nitrateconcentrations less than 2 mg/L had casing depths less than 50 feet and 102 wells or45.3% had casing depths greater than or equal to 50 feet. For samples that had nitrateconcentrations greater than or equal to 2 mg/L, 23 wells or 10.2 % had casing depths lessthan 50 ft and 53 wells or 23.6% had casing depths greater than 50 feet.

Figure 25. Comparison between Nitrate Concentration and Casing Depth

20.9

45.3

10.2

23.6

05

101520253035404550

Sam

ple

Perc

enta

ge %

N < 2 & CD < 50 N < 2 & CD > 50 N > 2 & CD < 50 N > 2 & CD > 50

Nitrate Concentration (mg/L) and Casing Depth (ft)

Comparison of Nitrate Concentration and Casing Depth

Figure 26 displays the distribution each source comprises for each nitrate concentrationrange and casing depth in Figure 25. It is evident that the IDWR wells make up most ofeach range.

Figure 26. Distribution of Data Sources for each Range

Nitrate vs. Depth Comparison

0% 10

20% 30% 40% 50% 60% 70% 80% 90% 100

N < 2 & CD < 50 N < 2 & CD > 50 N > 2 & CD < 50 N > 2 & CD > 50 Nitrate Concentration (mg/L) and Casing Depth (ft)

AG PWS CP IDWR

23

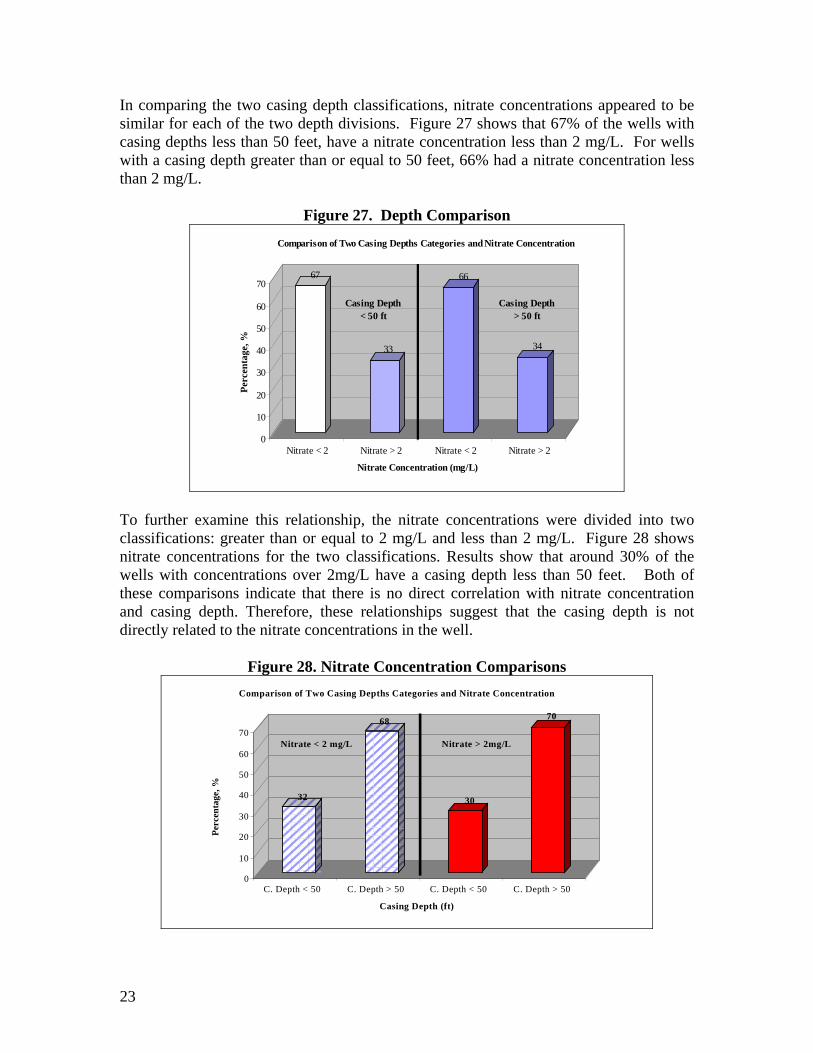
In comparing the two casing depth classifications, nitrate concentrations appeared to besimilar for each of the two depth divisions. Figure 27 shows that 67% of the wells withcasing depths less than 50 feet, have a nitrate concentration less than 2 mg/L. For wellswith a casing depth greater than or equal to 50 feet, 66% had a nitrate concentration lessthan 2 mg/L.

Figure 27. Depth Comparison

67

33

66

34

0

10

20

30

40

50

60

70

Perc

enta

ge, %

Nitrate < 2 Nitrate > 2 Nitrate < 2 Nitrate > 2

Nitrate Concentration (mg/L)

Comparison of Two Casing Depths Categories and Nitrate Concentration

Casing Depth < 50 ft

Casing Depth > 50 ft

To further examine this relationship, the nitrate concentrations were divided into twoclassifications: greater than or equal to 2 mg/L and less than 2 mg/L. Figure 28 showsnitrate concentrations for the two classifications. Results show that around 30% of thewells with concentrations over 2mg/L have a casing depth less than 50 feet. Both ofthese comparisons indicate that there is no direct correlation with nitrate concentrationand casing depth. Therefore, these relationships suggest that the casing depth is notdirectly related to the nitrate concentrations in the well.

Figure 28. Nitrate Concentration Comparisons

32

68

30

70

0

10

20

30

40

50

60

70

Perc

enta

ge, %

C. Depth < 50 C. Depth > 50 C. Depth < 50 C. Depth > 50

Casing Depth (ft)

Comparison of Two Casing Depths Categories and Nitrate Concentration

Nitrate < 2 mg/L Nitrate > 2mg/L

24

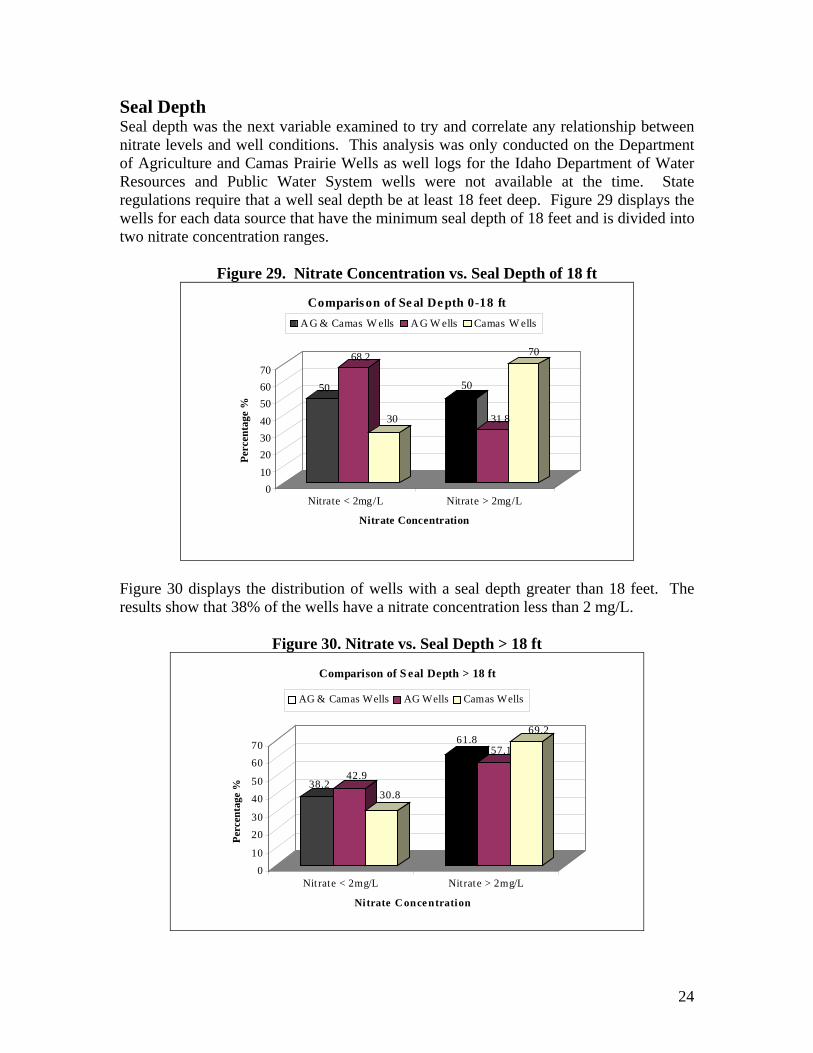
Seal DepthSeal depth was the next variable examined to try and correlate any relationship betweennitrate levels and well conditions. This analysis was only conducted on the Departmentof Agriculture and Camas Prairie Wells as well logs for the Idaho Department of WaterResources and Public Water System wells were not available at the time. Stateregulations require that a well seal depth be at least 18 feet deep. Figure 29 displays thewells for each data source that have the minimum seal depth of 18 feet and is divided intotwo nitrate concentration ranges.

Figure 29. Nitrate Concentration vs. Seal Depth of 18 ft

50

68.2

30

50

31.8

70

010203040506070

Perc

enta

ge %

Nitrate < 2mg/L Nitrate > 2mg/L

Nitrate Concentration

Comparis on of Se al De pth 0-18 ftAG & Camas W ells AG W ells Camas W ells

Figure 30 displays the distribution of wells with a seal depth greater than 18 feet. Theresults show that 38% of the wells have a nitrate concentration less than 2 mg/L.

Figure 30. Nitrate vs. Seal Depth > 18 ft

38.242.9

30.8

61.857.1

69.2

010

2030

4050

6070

Perc

enta

ge %

Nitrate < 2mg/L Nitrate > 2mg/L

Nitrate C oncentration

Comparison of S eal Depth > 18 ft

AG & Camas Wells AG Wells Camas Wells

25

Thus examination of seal depths in inconclusive and more detailed examination of otherwells should be analyzed before any direct correlations can be made.

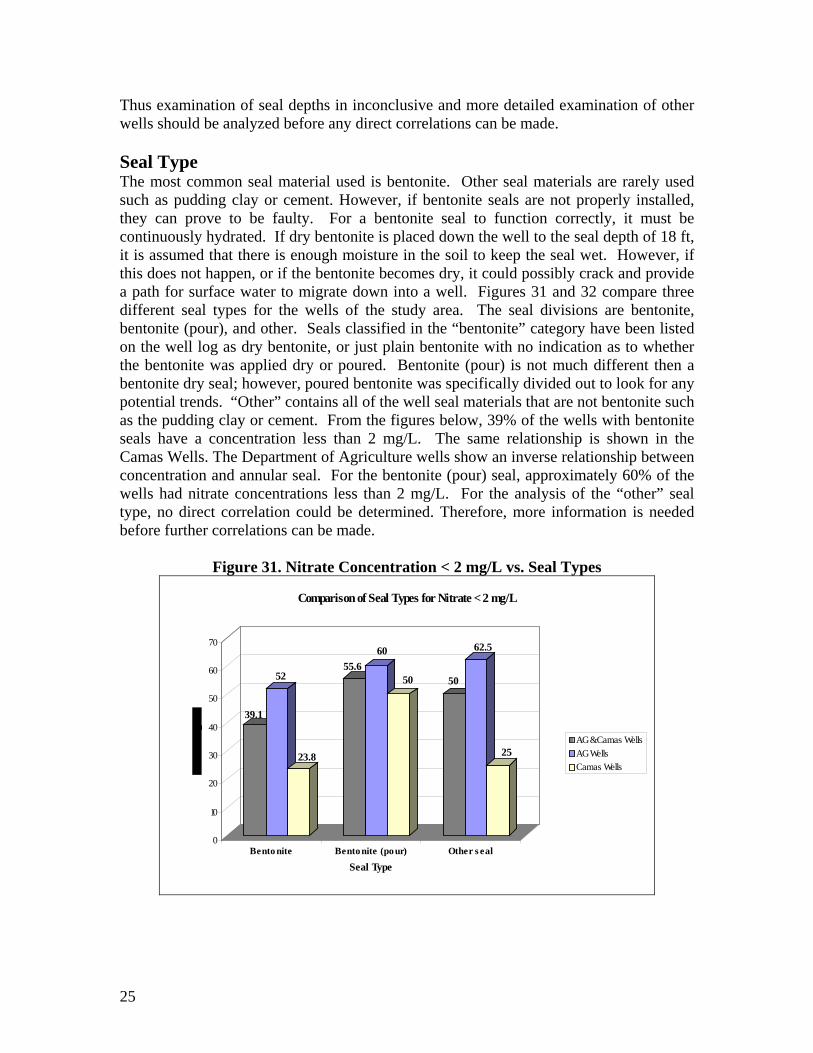
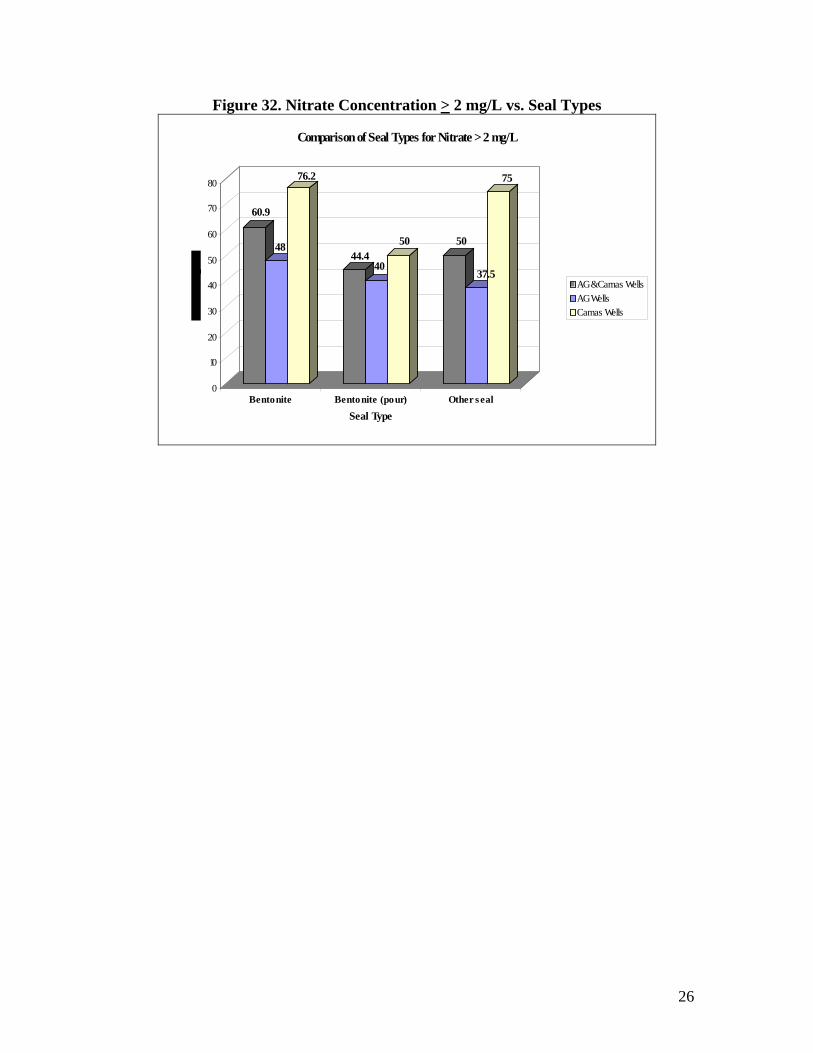
Seal TypeThe most common seal material used is bentonite. Other seal materials are rarely usedsuch as pudding clay or cement. However, if bentonite seals are not properly installed,they can prove to be faulty. For a bentonite seal to function correctly, it must becontinuously hydrated. If dry bentonite is placed down the well to the seal depth of 18 ft,it is assumed that there is enough moisture in the soil to keep the seal wet. However, ifthis does not happen, or if the bentonite becomes dry, it could possibly crack and providea path for surface water to migrate down into a well. Figures 31 and 32 compare threedifferent seal types for the wells of the study area. The seal divisions are bentonite,bentonite (pour), and other. Seals classified in the “bentonite” category have been listedon the well log as dry bentonite, or just plain bentonite with no indication as to whetherthe bentonite was applied dry or poured. Bentonite (pour) is not much different then abentonite dry seal; however, poured bentonite was specifically divided out to look for anypotential trends. “Other” contains all of the well seal materials that are not bentonite suchas the pudding clay or cement. From the figures below, 39% of the wells with bentoniteseals have a concentration less than 2 mg/L. The same relationship is shown in theCamas Wells. The Department of Agriculture wells show an inverse relationship betweenconcentration and annular seal. For the bentonite (pour) seal, approximately 60% of thewells had nitrate concentrations less than 2 mg/L. For the analysis of the “other” sealtype, no direct correlation could be determined. Therefore, more information is neededbefore further correlations can be made.

Figure 31. Nitrate Concentration < 2 mg/L vs. Seal Types

39.1

52

23.8

55.660

50 50

62.5

25

0

10

20

30

40

50

60

70

Bento nite Bentonite (pour) Other s eal

Seal Type

Comparison of Seal Types for Nitrate < 2 mg/L

AG & Camas WellsAG WellsCamas Wells

26

Figure 32. Nitrate Concentration > 2 mg/L vs. Seal Types

60.9

48

76.2

44.440

50 50

37.5

75

0

10

20

30

40

50

60

70

80

Bentonite Bentonite (pour) Other s eal

Seal Type

Comparison of Seal Types for Nitrate > 2 mg/L

AG & Camas WellsAG WellsCamas Wells

27

CONCLUSIONS

Overall it is evident that nitrate concentrations in the Clearwater Plateau Subarea varyunpredictably throughout the study area. Analysis of well construction details indicatesthere are no apparent trends in relationship between well construction and nitrateconcentrations. Therefore, each well must be treated as an individual situation.However, it is important to note that well logs were very difficult to interpret based onuncertainty and readability in the information and values given.

RecommendationsBased on the results of this study, recommendations are as follows:

• Ensure that the required well logs are readable.

• Improve well logs database access.

• Well casing requirement should be extended to entire well depth.

• A positive displacement bentonite slurry seal should be placed from well bottomto top.

• Require annular seal on all new wells.

• Extend seal to water level.

• Continue nitrogen isotope samples analysis.

• Continue annual nitrate ground water sampling.

This study was limited in analysis and was primarily a summary of currently availabledata. This report is intended to provide a foundation for further studies to be developedand pursued.

28

LITERATURE CITED

Bahr, G., and Carlson, R., 2002. Ground Water Quality of Southern Clearwater PlateauVolcanic Aquifer. Idaho Sate Department of Agriculture Division of AgriculturalResources, ISDA Technical Results Summary #9.

Bentz, B., 1998. A Reconnaissance of Nitrite/Nitrate in Camas Prairie Ground WaterVolume I, Lewis and Idaho County, Idaho. Idaho Department of EnvironmentalQuality Lewiston Regional Office.

Bond, J.G., 1963. Geology of the Clearwater Embayment, Idaho Bureau of Mines andGeology, Moscow Idaho.

Castelin, PM., 1976, Reconnaissance of the Water Resources of the Clearwater Plateau,Nez Perce, Lewis and Northern Idaho Counties, Idaho: Idaho Department ofWater Resources, Water Information Bulletin No. 41.

Crockett, J.K., 1995. Idaho Statewide Ground Water Quality Monitoring Program,Summary of Results 1991-1993, Idaho Department of Water Resources, WaterInformation Bulletin No. 50 Part 2.

Hagan, E., 2003. Ground Water Quality Clearwater Plateau Hydrogeologic Subarea,1990-2002. Idaho Department of Water Resources Water Information BulletinNo. 50, Part 6.

Idaho Department of Environmental Quality, 2001. Ground Water Quality EvaluationCraigmont, Idaho. Idaho Department of Environmental Quality Publication.

Idaho State Department of Agriculture, 2001. Idaho State Department of AgricultureGround Water Monitoring Program, A Summary of Regional Project 950,Including Clearwater Plateau, 13pp.

Rupert, 1990

Seiler, R.L., 1996. Methods for Identifying Sources of Nitrogen Contamination ofGround Water in Valleys in Washoe County, Nevada: U.U. Geological SurveyOpen-Filed Report 96-461.

Stevens, G., Garwood, D., and Ralston, D., 2003. Report of Geologic/HydrogeologicServices City of NezPerce Lewis County, Idaho. Idaho Water ResourcesResearch Institute. Final report for Technical Assistance for Rural Ground WaterDevelopment with Idaho Program. 13pp.

29

Stevens, G., Garwood, D., and Ralston, D., 2003. Report of Geologic/HydrogeologicServices City of Ferdinand Idaho County, Idaho. Idaho Water ResourcesResearch Institute. Final report for Technical Assistance for Rural Ground WaterDevelopment with Idaho Program. 12pp.

Stevens, G., Garwood, D., and Ralston, D., 2003. Report of Geologic/HydrogeologicServices City of Craigmont Lewis County, Idaho. Idaho Water ResourcesResearch Institute. Final report for Technical Assistance for Rural Ground WaterDevelopment with Idaho Program. 13pp.

West, D, and Yashan, D., 2000. Protecting Drinking Water Sources in Idaho. IdahoDepartment of Environmental Quality, DEQ Source Water Protection Publication.

30

APPENDIX A

32

APPENDIX A. Well Attributes for the Idaho Department of Water Resources.

Table 1. IDWR NITRATE CONCENTRATIONSIdaho Department of Water Resources

NUMBER SITE_ID LATITUDE LONGITUDE EASTING NORTHING STATION SAMPLINGDATE

N15 permil

Nitrate(mg/L)

Nitrite(mg/L)

IDWR-1 454553116192901 45.7647 -116.3247 319225.94229 520754.63961 28N 01E 15CBB1 9/1/1993 0 0

8/20/1997 0.154 0

8/30/2001 0.032 0

IDWR-2 454450116182601 45.7464 -116.3111 320225.38670 518687.50069 28N 01E 22DCA1 9/1/1993 0.072 0

8/20/1997 0 0

7/30/2002 0.08 0.008

IDWR-3 454305116174401 45.7181 -116.2956 321344.61205 515505.22627 28N 01E 35CAD1 8/10/1994 0 0

7/22/1998 0.088 0

IDWR-4 455234116121001 45.8761 -116.2028 329049.45699 532861.55037 29N 02E 04DDA1 9/1/1993 0.21 0

8/18/1997 0.225 0

7/30/2002 0.18 0.008

IDWR-5 455309116061901 45.8858 -116.1053 336644.50936 533737.16291 29N 03E 05ABD1 8/11/1994 0.24 0

7/22/1998 0.309 0

IDWR-6 455828116243901 45.9744 -116.4108 313234.08792 544253.06006 30N 01W 02AAA1 9/5/1991 2 0

8/8/1995 3 0

7/13/1999 0 0

IDWR-7 455442116244001 45.9117 -116.4111 313001.36761 537279.84824 30N 01W 26ADD1 8/10/1994 0.08 0

7/24/1998 0.396 0.039

IDWR-8 455621116091601 45.9394 -116.1544 332991.02425 539795.19295 30N 02E 13CBA1 8/29/2001 0.506 0

IDWR-9 455732116054701 45.9589 -116.0964 337547.76193 541836.13382 30N 03E 09BBC1 8/9/1990 0

9/11/1993 0 0

8/19/1997 0 0

7/30/2002 0.05 0.008

IDWR-10 455646116064101 45.9461 -116.1114 336347.78178 540446.93463 30N 03E 17BAB1 9/11/1993 0 0

IDWR-11 455545116060101 45.9292 -116.1003 337159.29895 538542.10035 30N 03E 20AAC1 9/4/1991 0.57 0

7/20/1995 0.47 0

IDWR-12 460434116171201 46.0761 -116.2867 323177.13738 555265.29717 31N 01E 02AAA1 8/11/1994 0.65 0

8/19/1998 1.01 0

IDWR-13 460314116212501 46.0539 -116.3569 317670.25840 552955.24680 31N 01E 08ABB3 9/4/1991 0 0

8/8/1995 0.61 0

8/6/1996 0.68 0

8/19/1997 0.704 0.01

8/19/1998 0.281 0

7/13/1999 0.925 0

8/1/2000 2.84 0.071 0

8/29/2001 0.458 0

7/31/2002 0.05 0.008

IDWR-14 460017116142101 46.0047 -116.2392 326626.88691 547229.04185 31N 02E 29BBA1 8/10/1994 5.4 0

8/19/1998 6.02 0

IDWR-15 455950116093401 45.9972 -116.1594 332777.47010 546225.21387 31N 02E 35ADB1 9/5/1991 4.3 0

7/21/1995 6.5 0

7/12/1999 0.894 0

IDWR-16 455906116015301 45.9850 -116.0314 342658.61535 544606.56151 31N 03E 36BCA1 9/18/1992 0 0

7/20/1995 0 0

8/7/1996 0.06 0

8/19/1997 0 0

33

Table 1. IDWR NITRATE CONCENTRATIONS, continued

NUMBER SITE_ID LATITUDE LONGITUDE EASTING NORTHING STATION SAMPLINGDATE

N15 permil

Nitrate(mg/L)

Nitrite(mg/L)

7/23/1998 0.074 0

7/12/1999 0 0

8/2/2000 0 0

8/29/2001 0 0

8/1/2002 0.02 0.008

IDWR-17 460533116213601 46.0927 -116.3600 317562.14499 557268.64249 32N 01E 20CDC1 7/31/2002 0.32 0.008

IDWR-18 460548116300601 46.0967 -116.5017 306623.95335 558050.25318 32N 01W 19DBC1 9/14/1992 0 0

8/6/1996 0.08 0

8/1/2000 0 0

IDWR-19 460702116095801 46.1174 -116.1662 332618.49584 559594.17220 32N 02E 14ACA1 7/31/2002 0.35 0.008

IDWR-20 460714116023801 46.1206 -116.0439 342077.43485 559692.68960 32N 03E 11DCC1 9/23/1992 0.39 0

7/17/1996 3.7 0

8/2/2000 0.802 0

IDWR-21 460426116022101 46.0739 -116.0392 342309.09813 554498.02563 32N 03E 35AAC1 9/9/1993 4.5 0

IDWR-22 460850116393001 46.1474 -116.6584 294700.11122 564077.58685 32N 03W 01BBC1 8/21/2002 0.11 0.008

IDWR-23 461155116163701 46.1986 -116.2769 324319.70338 568854.12993 33N 01E 13CAC1 9/18/1992 6 0

8/6/1996 45 0

7/26/2000 15.43 18.1 0

IDWR-24 461233116274101 46.2092 -116.4614 310124.96911 570452.36578 33N 01W 09DCC1 8/9/1994 1.2 0

8/19/1998 2.09 0

IDWR-25 461008116262601 46.1689 -116.4406 311594.13576 565927.37359 33N 01W 27DBC1 8/11/1993 0.71 0

8/19/1997 1.03 0

8/29/2001 1.01 0

IDWR-26 461025116290401 46.1736 -116.4844 308223.19501 566556.87835 33N 01W 29BDD1 8/11/1993 3.4 0

7/16/1997 3.94 0

8/21/2002 4.7 0.008

IDWR-27 461323116101901 46.2231 -116.1719 332495.32934 571343.57936 33N 02E 11BAA1 8/23/1994 61.6 0.85

7/23/1998 65.3 1.75

8/19/1998 79.5 0.051

IDWR-28 461323116333201 46.2231 -116.5590 302647.61745 572237.16823 33N 02W 10AAB1 8/8/2002 18 0.008

IDWR-29 461246116070201 46.2128 -116.1172 336684.88619 570087.29174 33N 03E 07DAD1 10/15/1990 0.1

IDWR-30 461340116451501 46.2278 -116.7542 287612.00917 573262.58345 33N 03W 06DBD1 8/12/1994 0 0

8/13/1998 0.177 0

IDWR-31 460951116434001 46.1642 -116.7278 289403.99251 566124.84752 33N 03W 32ABA1 8/12/1993 0.12 0

7/16/1997 0.103 0

8/27/2001 0.06 0

IDWR-32 460954116431701 46.1650 -116.7214 289900.47428 566200.12991 33N 03W 33BBB1 9/3/1991 0.32 0

IDWR-33 471301116503001 46.2169 -116.8417 280821.50566 572296.32180 33N 04W 09DBB1 8/12/1993 0.26 0

7/16/1997 0.253 0

8/27/2001 0.206 0

IDWR-34 461154116523901 46.1983 -116.8775 277983.00627 570328.32554 33N 04W 18DDB1 8/11/1994 0.6 0

8/13/1998 0.718 0

IDWR-35 461719116204801 46.2886 -116.3467 319235.69780 579010.52299 34N 01E 16CBB1 9/25/2001 0.107 0

IDWR-36 461512116154601 46.2533 -116.2628 325585.68018 574902.65266 34N 01E 25DDD1 8/14/1991 1.4 0

7/19/1995 1.7 0

7/14/1999 1.8 0

IDWR-37 461657116293801 46.2825 -116.4942 307852.68587 578678.79819 34N 01W 18DDD1 9/25/2001 0.099 0

IDWR-38 461436116255201 46.2433 -116.4311 312577.10705 574175.72956 34N 01W 34DAD1 8/14/1991 3.7 0.02

34

Table 1. IDWR NITRATE CONCENTRATIONS, continued

NUMBER SITE_ID LATITUDE LONGITUDE EASTING NORTHING STATION SAMPLINGDATE

N15 permil

Nitrate(mg/L)

Nitrite(mg/L)

IDWR-39 461555116085301 46.2653 -116.1481 334464.05806 575984.39313 34N 02E 25ABB1 8/12/1993 0.27 0

7/17/1997 0.452 0

8/19/2002 0.6 0.008

IDWR-40 461445116112601 46.2458 -116.1906 331129.23065 573912.98669 34N 02E 34BDD1 8/10/1994 0.24 0

IDWR-41 461832116332901 46.3089 -116.5581 303025.53180 581767.85546 34N 02W 10ACA1 8/25/1993 0.94 0

7/17/1997 1.09 0

9/24/2001 5.74 1.18 0

IDWR-42 461630116343201 46.2750 -116.5756 301555.60794 578046.11783 34N 02W 22BCC1 8/9/1994 0.87 0

8/13/1998 0.965 0

IDWR-43 461437116370801 46.2436 -116.6189 298101.92106 574667.92785 34N 02W 31DAA1 8/11/1993 0 0

7/16/1997 0 0

9/25/2001 0.026 0

IDWR-44 461920116423301 46.3222 -116.7092 291440.89250 583635.89855 34N 03W 04ABD1 9/14/1992 0.44 0

8/7/1996 0.36 0

7/27/2000 0.41 0

IDWR-45 462324116282101 46.3900 -116.4725 309895.16161 590570.59221 35N 01W 08DAA1 8/24/1994 0 0

8/19/1998 0 0

IDWR-46 462158116294101 46.3661 -116.4947 308103.04933 587969.85817 35N 01W 19AADC1 9/15/1992 0 0

8/7/1996 0.08 0

7/27/2000 0.055 0

IDWR-47 462002116143101 46.3339 -116.2419 327445.30090 583807.89231 35N 02E 32BCC1 8/25/1993 1.2 0

7/17/1997 1.79 0

8/19/2002 2.32 0.008

IDWR-48 462116116314901 46.3544 -116.5303 305326.34570 586760.09172 35N 02W 25BBA1 8/9/1994 0 0

8/13/1998 0 0

IDWR-49 462224116405601 46.3733 -116.6822 293707.99432 589243.95417 35N 03W 15DAD1 8/9/1994 5.5 0

8/13/1998 5.68 0

IDWR-50 462436116475201 46.4100 -116.7978 284964.66401 593626.15584 35N 04W 02ABD1 8/8/1994 1.9 0

8/18/1998 2.39 0

IDWR-51 462217116473501 46.3716 -116.7931 285177.28474 589341.21146 35N 04W 14DDD1 8/8/2002 0.77 0.008

IDWR-52 462206116475001 46.3683 -116.7972 284843.91580 588994.78003 35N 04W 23ABA1 8/7/1990 2.4

IDWR-53 462405116560001 46.4014 -116.9333 274511.31874 593047.21867 35N 05W 02CCA1 8/26/2001 4.77 2.46 0

IDWR-54 462127116582501 46.3575 -116.9736 271231.69869 588286.43655 35N 05W 21CDB1 8/8/1990 0

8/8/2002 0.05 0.008

IDWR-55 462056116535201 46.3489 -116.8978 277030.24212 587113.31764 35N 05W 25ADD1 10/17/1990 2.2

9/15/1992 1.3 0

8/9/1996 7.5 0

7/26/2000 8.46 4.95 0

IDWR-56 462125117022001 46.3569 -117.0389 266208.11848 588415.04592 35N 06W 24CCA2 8/10/1993 2.1 0

7/15/1997 5.44 0

8/15/1997 0 0

8/8/2002 0.5 0.008

IDWR-57 462736116170201 46.4600 -116.2839 324621.29926 597912.24292 36N 01E 13CCB1 10/16/1990 0.4

IDWR-58 462551116162901 46.4308 -116.2747 325232.13711 594650.82867 36N 01E 25CDA1 8/10/1994 0.34 0

IDWR-59 462712116320001 46.4533 -116.5333 305443.75957 597755.16398 36N 02W 24BBC1 8/24/1994 0 0

8/13/1998 0.104 0

IDWR-60 462513116372701 46.4203 -116.6242 298345.65609 594310.74044 36N 02W 31DBA1 8/27/2001 6.95 5.57 0

IDWR-61 462835116410301 46.4764 -116.6842 293946.94797 600699.89701 36N 03W 10DAD1 8/27/2001 0.572 0

35

Table 2. IDWR CHEMISTRY DATAIdaho Department of Water Resources

NUMBER SITE_ID SAMPLINGDATE pH OrthoP (mg/l) K (mg/l) Radon

(pCi/l)

Spec.Cond

(uS/cm)Se (ug/l) Silica

(mg/l)Na

(mg/l)

IDWR-1 454553116192901 9/1/1993 8.7 0 1.2 0 692 0 33 130

8/20/1997 8.6 0 2.3 610 0 34 117

8/30/2001 8.5 0 2.6 752 0 34.3 139

IDWR-2 454450116182601 9/1/1993 9 0.02 1.8 0 352 0 48 75

8/20/1997 8.9 0.01 2.5 347 0 45 76.4

7/30/2002 8.9 0.02 2.83 4 0.3 44.4 80.5

IDWR-3 454305116174401 8/10/1994 8.2 0 3 0 422 0 40 44

7/22/1998 8.1 0.017 3.3 452 0 36 43

IDWR-4 455234116121001 9/1/1993 7.3 0.15 2.6 0 114 0 71 6.1

8/18/1997 7.1 0.148 1.7 117 0 70 6

7/30/2002 7.2 0.15 2.08 111 0.4 66.1 5.87

IDWR-5 455309116061901 8/11/1994 7.1 0.17 3.3 470 196 0 56 5.5

7/22/1998 7.2 0.167 3.7 203 0 54 5.5

IDWR-6 455828116243901 9/5/1991 6.6 0.11 2.3 550 162 0 58 9.2

8/8/1995 7.73 0.1 2.3 0 171 0 59 9.1

7/13/1999 7.2 0.049 2.4 175 0 55 9.5

IDWR-7 455442116244001 8/10/1994 9.6 0.02 2.1 0 989 0 44 190

7/24/1998 9.6 0.041 1.9 1100 0 42 207

IDWR-8 455621116091601 8/29/2001 7.1 0.063 2.12 280 0.9 44.8 19.3

IDWR-9 455732116054701 8/9/1990 8.06 0.03 3.5 298 0 47 29

9/11/1993 8 0.03 3.9 0 319 0 48 28

8/19/1997 7.7 0.031 3.7 346 0 53 29.1

7/30/2002 7.7 0.01 4.49 335 0.3 46.3 29.9

IDWR-10 455646116064101 9/11/1993 8.3 0.03 3.5 0 308 0 44 33

IDWR-11 455545116060101 9/4/1991 7.47 0.07 3.6 0 262 0 46 21

7/20/1995 7.41 0.05 3.2 0 269 0 55 21

IDWR-12 460434116171201 8/11/1994 7.5 0.07 1.7 0 266 0 57 18

8/19/1998 7.2 0.087 1.7 260 0 59 18

IDWR-13 460314116212501 9/4/1991 7.6 0.05 2.1 0 293 0 53 18

8/8/1995 7.59 0.03 1.5 0 328 0 55 22

8/6/1996 7.8 0.04 1.7 325 0 55 22

8/19/1997 7.3 0.04 1.7 318 0 60 20.9

8/19/1998 7.6 0.064 1.8 302 0 56 18

7/13/1999 7.9 0.033 1.8 208 0 49 16

8/1/2000 7.4 0.044 2 315 0 56 18.7

8/29/2001 7.3 0.027 1.96 272 0 48.8 16.6

7/31/2002 7.5 0.05 2.46 288 0.3 54.4 17.3

IDWR-14 460017116142101 8/10/1994 7.8 0.05 3 990 341 0 53 20

8/19/1998 7.4 0.07 3 358 0 54 20

IDWR-15 455950116093401 9/5/1991 7.53 0.05 2.9 720 355 0 44 20

7/21/1995 7.65 0.04 2.7 0 393 0 51 22

7/12/1999 7.5 0.027 3.3 393 0 39 22

IDWR-16 455906116015301 9/18/1992 7.78 0.03 3.2 0 333 0 0.2 19

7/20/1995 8.58 0.03 3.1 0 329 0 54 19

8/7/1996 7.8 0.03 3.4 326 0 52 19

8/19/1997 7.6 0.04 3.1 319 0 58 18.6

7/23/1998 7.5 0.035 3.2 316 0 51 18

7/12/1999 7.7 0.034 3.3 312 0 50 19

8/2/2000 7.3 0.025 3.2 314 0 52.8 18.4

36

Table 2. IDWR CHEMISTRY DATA, continued

NUMBER SITE_ID SAMPLINGDATE pH OrthoP (mg/l) K (mg/l) Radon

(pCi/l)

Spec.Cond

(uS/cm)Se (ug/l) Silica

(mg/l)Na

(mg/l)

8/29/2001 7.3 0.009 3.07 320 0 47.6 19.8

8/1/2002 7.7 0.03 3.48 316 0.3 51.2 18.4

IDWR-17 460533116213601 7/31/2002 7 0.02 0.64 359 2.8 34.6 29.1

IDWR-18 460548116300601 9/14/1992 7.62 0.04 1.6 280 219 0 47 15

8/6/1996 8.5 0.04 1.5 221 0 46 15

8/1/2000 7.7 0.049 1.5 212 0 46.9 15.1

IDWR-19 460702116095801 7/31/2002 8 0.01 3.75 448 0.3 43.5 38.8

IDWR-20 460714116023801 9/23/1992 7.39 0.04 5.3 803 693 0 37 49

7/17/1996 7.7 0.06 5.2 697 0 41 53

8/2/2000 6.8 0.034 4.8 589 0 35.6 41.1

IDWR-21 460426116022101 9/9/1993 7.2 0.05 2.7 340 412 0 53 29

IDWR-22 460850116393001 8/21/2002 6.9 0.06 1.92 158 0.3 41.8 5.95

IDWR-23 461155116163701 9/18/1992 7.72 0.02 6.7 0 476 2 47 34

8/6/1996 7.5 0.03 3.7 1013 0 53 39

7/26/2000 7.3 0.038 3.3 654 1.9 57.5 31.5

IDWR-24 461233116274101 8/9/1994 7.7 0.11 3.6 1000 329 0 56 24

8/19/1998 7.4 0.131 3.4 349 0 56 24

IDWR-25 461008116262601 8/11/1993 7.6 0.07 2.1 1300 254 0 43 19

8/19/1997 7.1 0.074 2 257 0 48 18.7

8/29/2001 6.9 0.071 2.05 256 0.3 41 20.7

IDWR-26 461025116290401 8/11/1993 7.9 0.07 2.2 1000 286 0 54 16

7/16/1997 7.2 0.066 2.1 291 0 57 17

8/21/2002 6.9 0.06 2.16 292 0.4 51.5 16.7

IDWR-27 461323116101901 8/23/1994 7.9 0 3.5 0 550 0 39 24

7/23/1998 7.3 0.034 3.9 1260 0 48 28

8/19/1998 7.2 0.041 0 1330 0 0 0

IDWR-28 461323116333201 8/8/2002 7.1 0.07 2.1 502 0.3 50.1 12.8

IDWR-29 461246116070201 10/15/1990 7.92 0.04 5.3 0 0 45 25

IDWR-30 461340116451501 8/12/1994 8.8 0 2.6 0 222 0 47 7.6

8/13/1998 7.9 0.058 2.7 222 0 46 7.8

IDWR-31 460951116434001 8/12/1993 7.2 0.07 0.1 0 110 0 45 4.7

7/16/1997 6.6 0.06 1.5 103 0 44 4.5

8/27/2001 6.7 0.041 1.54 96 0 43.3 4.6

IDWR-32 460954116431701 9/3/1991 6.31 0.06 1.3 0 84 0 33 4.1

IDWR-33 471301116503001 8/12/1993 7.3 0.03 1.6 0 78 0 32 3.4

7/16/1997 6.9 0.036 1.4 73 0 31 3.3

8/27/2001 6.8 0.03 1.49 75 0 31.3 3.3

IDWR-34 461154116523901 8/11/1994 8 0 1.2 0 181 0 36 6.6

8/13/1998 8.2 0.017 6.1 193 0 35 6.4

IDWR-35 461719116204801 9/25/2001 7.9 0.029 4.6 358 47.4 26.7

IDWR-36 461512116154601 8/14/1991 7.7 0.09 1.9 660 351 0 46 27

7/19/1995 7.99 0.07 1.9 0 381 0 51 25

7/14/1999 7.7 0.087 1.9 379 0 46 28

IDWR-37 461657116293801 9/25/2001 7.3 0.026 0.91 292 0 49.3 17.1

IDWR-38 461436116255201 8/14/1991 7.63 0.07 1.9 310 387 0 42 28

IDWR-39 461555116085301 8/12/1993 7.5 0.12 2 0 208 0 55 13

7/17/1997 7.1 0.129 2.1 224 0 60 13.6

8/19/2002 6.7 0.12 1.94 221 0.6 52 12.9

IDWR-40 461445116112601 8/10/1994 7.9 0.01 2.9 0 428 0 39 30

IDWR-41 461832116332901 8/25/1993 7.4 0.06 3.2 0 478 0 51 17

37

Table 2. IDWR CHEMISTRY DATA, continued

NUMBER SITE_ID SAMPLINGDATE pH OrthoP (mg/l) K (mg/l) Radon

(pCi/l)

Spec.Cond

(uS/cm)Se (ug/l) Silica

(mg/l)Na

(mg/l)

7/17/1997 7.3 0.064 3.4 480 0 53 18

9/24/2001 7.1 0.066 3.16 499 0.8 52.9 18.8

IDWR-42 461630116343201 8/9/1994 7.4 0.07 1.8 720 391 0 56 16

8/13/1998 7.2 0.077 1.6 401 0 57 18

IDWR-43 461437116370801 8/11/1993 7.7 0.07 2.4 0 291 0 60 16

7/16/1997 7.2 0.08 2.8 315 0 65 17.9

9/25/2001 7.5 0.05 2.66 296 0 59.9 18.8

IDWR-44 461920116423301 9/14/1992 7.5 0.04 3.2 511 238 0 57 9.4

8/7/1996 7.93 0.04 3.5 244 0 51 8.4

7/27/2000 7.6 0.039 3.2 245 0 54.6 9.1

IDWR-45 462324116282101 8/24/1994 8.2 0.01 1.9 0 234 0 50 16

8/19/1998 8 0.033 1.8 234 0 51 16

IDWR-46 462158116294101 9/15/1992 7.52 0.09 8.9 976 332 0 52 23

8/7/1996 7.94 0.07 9.6 333 0 49 23

7/27/2000 7.6 0.085 8.7 333 0 50.6 22.6

IDWR-47 462002116143101 8/25/1993 7.7 0.08 3.5 0 314 0 54 18

7/17/1997 7.3 0.078 3.8 332 0 58 18.9

8/19/2002 7.2 0.09 3.37 327 0.9 53.8 17.2

IDWR-48 462116116314901 8/9/1994 7.8 0.04 5.8 530 451 0 62 26

8/13/1998 7.6 0.057 5.6 452 0 0 26

IDWR-49 462224116405601 8/9/1994 7.6 0.05 3.6 0 302 0 53 13

8/13/1998 7.5 0.06 3.5 296 0 57 13

IDWR-50 462436116475201 8/8/1994 7.7 0.05 3.2 490 256 0 53 12

8/18/1998 7.3 0.054 3.1 261 0 54 12

IDWR-51 462217116473501 8/8/2002 7.4 0.06 4.44 263 0.5 52.9 12.7

IDWR-52 462206116475001 8/7/1990 7.43 0.09 3.8 338 0 50 13

IDWR-53 462405116560001 8/26/2001 8 0.015 7.14 603 2.1 46.7 61.5

IDWR-54 462127116582501 8/8/1990 8.03 0.01 0 0 0 49 40

8/8/2002 7.9 0.01 16 548 0.2 45.8 40.6

IDWR-55 462056116535201 10/17/1990 8.23 0.01 0 0 0 45 53

9/15/1992 7.94 0.02 7.4 0 652 0 52 46

8/9/1996 8 0.04 7.1 637 2 46 54

7/26/2000 7.8 0.02 6 520 1.1 53.3 50.7

IDWR-56 462125117022001 8/10/1993 7.9 0 8.7 330 710 1 50 50

7/15/1997 7.8 0.015 7.5 555 0 61 42.5

8/15/1997 7.7 0 8.2 591 2 64 44.5

8/8/2002 7.8 0.02 8.16 345 0.4 60.3 36.1

IDWR-57 462736116170201 10/16/1990 7.65 0.05 2.3 0 0 46 31

IDWR-58 462551116162901 8/10/1994 7.3 0.12 2.6 0 181 0 53 13

IDWR-59 462712116320001 8/24/1994 8 0.03 3.6 620 340 0 58 17

8/13/1998 7.8 0.046 4.4 280 1 57 17

IDWR-60 462513116372701 8/27/2001 7.4 0.064 1.17 305 0.3 60.6 15.9

IDWR-61 462835116410301 8/27/2001 7.4 0.056 3.45 233 0.2 60.2 13.4

38

APPENDIX B

40

APPENDIX B. Well attributes for the Camas Prarie

Table 3. Camas Prairie Nitrate ConcentrationsCamas Prairie Wells

NUMBER SITE_ID LATITUDE LONGITUDE EASTING NORTHING STATION SAMPLINGDATE

NITRATE(mg/L)

CP-1 1 45.9908 -116.3242 320000.62449 545874.46094 31N 01E 27CB 07/16/98 8.35CP-2 2 46.1433 -116.3840 315875.07012 562954.82841 32N 1E 6CD 07/16/98 0.318CP-3 3 46.1432 -116.3843 315852.97818 562939.92290 32N 2E 6DD 07/17/98 36.8CP-4 4 46.1255 -116.2016 329908.74549 560563.73246 32N 2E 10CC 07/17/98 19.3CP-5 5 46.2084 -116.5090 306447.30823 570480.84196 33N 1W 18BA 07/17/98 3.57CP-6 6 46.0734 -116.0560 341003.79640 554472.71268 32N 3E 34DD 07/20/98 5.48CP-7 7 46.0525 -116.0496 341444.31224 552138.81553 31N 3E 2DC 07/20/98 7.02CP-8 8 46.1510 -116.3633 317498.36024 563759.24494 32N 1E 5AC 07/20/98 7.83CP-9 9 46.1421 -116.3887 315508.77544 562830.16460 32N 1E 6BC 07/20/98 0.112

CP-10 10 46.1508 -116.3637 317468.38779 563739.00834 31N 2E 14BB 07/22/98 12.2CP-11 11 46.0344 -116.1829 331072.52275 550404.52367 31N 2E 10DD 07/22/98 <.005CP-12 12 46.0397 -116.1813 331213.25633 550989.95850 31N 2E 18CB 07/22/98 0.005CP-13 13 46.0198 -116.2678 324461.62928 548961.56946 31N 1E 24AA 07/22/98 9.46CP-14 14 46.1397 -116.2644 325097.33460 562277.93659 32N 1E 1CD 07/22/98 7.48CP-15 15 46.2377 -116.2141 329289.34030 573060.09077 33N 2E 4BB 07/22/98 2.83CP-16 16 46.1322 -116.2440 326654.83987 561399.77065 32N 2E 7DD 07/24/98 0.968CP-17 17 46.1324 -116.3970 314836.85562 561775.04648 32N 1W 12BB 07/27/98 3.24CP-18 18 46.1691 -116.4105 313915.22042 565875.35356 33N 1W 35SENE 07/27/98 <.005CP-19 19 46.1803 -116.4364 311952.57426 567183.04866 33N 1W 22DC 07/27/98 13.9CP-20 20 46.1604 -116.4109 313852.09966 564916.43318 33N 1W 35AD 07/27/98 9.8CP-21 21 46.1471 -116.4256 312676.70077 563475.38529 32N 1W 3AC 07/27/98 6.19CP-22 22 46.1457 -116.3991 314716.82423 563253.26867 32N 1E 6BB 07/30/98 0.338CP-23 23 46.1460 -116.3085 321712.38979 563079.27332 32N 1E 3DD 07/30/98 1.84CP-24 24 46.1474 -116.3991 314722.53071 563442.14767 ? 07/31/98 10.8CP-25 25 46.1473 -116.4029 314428.73517 563439.91040 ? 07/31/98 5.42CP-26 26 46.1302 -116.2019 329898.58965 561089.94702 32N 2E 9AD 07/31/98 3.77CP-27 27 46.1491 -116.4908 307650.61918 563846.73281 32N 1W 5BB 08/04/98 <.005CP-28 28 46.0104 -116.1806 331175.98603 547736.52617 31N 2E 23CB 08/04/98 17.5CP-29 29 46.0461 -116.2805 323558.75463 551921.79980 31N 1E 12BB 08/04/98 2.2CP-30 30 46.1363 -116.2156 328859.16021 561797.11848 32N 2E 4CD 08/04/98 2.66CP-31 31 46.1565 -116.3631 317532.76372 564369.84268 33N 1E 32CB 08/04/98 8.25CP-32 32 46.1590 -116.3636 317502.42613 564648.75584 33N 1E 32NWSW 08/04/98 8.45CP-33 33 46.1658 -116.3626 317602.12041 565401.97625 33N 1E 29CC 08/04/98 2.09CP-34 34 46.1523 -116.3842 315889.54727 563951.90721 33N 1E 31CC 08/04/98 <.005CP-35 35 46.1632 -116.3901 315469.53908 565173.34452 33N 1W 36AA 08/04/98 6.91CP-36 36 46.1671 -116.3889 315576.09604 565607.17781 33N 1W 25DD 08/04/98 2.15CP-37 37 46.1436 -116.3929 315188.61041 563005.50031 32N W 1AC 08/04/98 3.63CP-38 38 46.0969 -116.3774 316231.06679 557776.47826 32N 1E 19BD 08/06/98 3.62CP-39 39 46.0959 -116.3773 316234.19301 557674.07711 32N 1E 19DB 08/06/98 3.12CP-40 40 46.0870 -116.3586 317647.87631 556637.80436 32N 1E 29BD 08/06/98 2.29CP-41 41 46.1132 -116.2647 324995.69743 559336.37286 32N 1E 13CC 08/06/98 3.17CP-42 42 46.2821 -116.4689 309798.01277 578573.37856 34N 1W 16CC 08/10/98 5.4CP-43 43 46.2287 -116.4967 307470.32952 572709.59350 33N 1W 6DA 08/10/98 11.8CP-44 44 46.2487 -116.4946 307701.34290 574924.42825 34N 1W 31AA 08/10/98 4.43CP-45 45 46.2091 -116.4611 310147.09824 570443.89424 33N 1W 9DC 08/10/98 1.87CP-46 46 46.0735 -116.3327 319609.30773 555078.71580 32N 1E 32CA 08/10/98 2.72CP-47 47 46.0999 -116.2324 327447.86087 557789.21948 32N 1E 20BD 08/10/98 <.005CP-48 48 46.2375 -116.5184 305827.21517 573738.04712 33N 2W 1AA 08/10/98 20.8CP-49 49 46.2337 -116.1787 332006.47053 572540.05994 33N 2E 2BC 08/14/98 <.005

41

Table 3. Camas Prairie Nitrate Concentrations, continuedNUMBER SITE_ID LATITUDE LONGITUDE EASTING NORTHING STATION SAMPLING

DATENITRATE

(mg/L)

CP-50 50 46.2229 -116.1715 332528.77570 571324.87307 33N 2E 11AB 08/14/98 77.1CP-51 51 46.0152 -116.3950 314596.64347 548744.60943 31N 1W 24AB 08/14/98 1.66CP-52 52 46.1064 -116.3563 317892.68764 558787.86841 32N 1E 20BA 08/14/98 14.5CP-53 53 46.0233 -116.3912 314917.84742 549635.70008 31N 1W 13DD 08/24/98 3.22CP-54 54 46.2084 -116.2300 327974.35803 569843.38534 33N 2E 17AB 08/26/98 4.45CP-55 55 46.2144 -116.4944 307593.64699 571108.64825 33N 1W 8BC 08/26/98 18.6

43

APPENDIX C

45

APPENDIX C. Well attributes for the Public Water System Wells.

Table 4. Public Water System Wells Nitrate ConcentrationsPublic Water System Wells

NUMBER SITE_ID LATITUDE LONGITUDE EASTING NORTHING NAME STATION SAMPLINGDATE

NITRATE(mg/L) SOURCE NAME SYSTEM NAME

PWS-1 2310008 46.23972 -116.58269300878.5258

5574144.1653

6 cadillac 12/22/1999 0.024 S WELLCADILLAC RANCH

RESTAURANT

12/18/1997 0.6 S WELLCADILLAC RANCH

RESTAURANT

PWS-2 2250126 46.03431 -116.32705319918.8246

0550711.7474

4 east 31N 1E 8 AB EAST WELL COTTONWOOD SALES YARD

PWS-3 2250126 46.04129 -116.33741319139.9058

0551510.7523

3 north 31N 1E 8 AB NORTH WELL COTTONWOOD SALES YARD

PWS-4 2250013 46.04856 -116.35687317658.1255

3552362.9027

7 #2 31N 1E 8 AB 6/24/2002 0.90000 WELL #2 W BIG COTTONWOOD WATER DEPT 11/6/2001 1.00000 11/30/1999 0.80000 11/17/1998 0.80000 9/11/1997 1.30000 12/12/1996 0.90000 9/19/1995 0.80000 10/12/1994 1.70000 5/10/1993 0.90600

PWS-5 2250013 46.04811 -116.35782317583.1471

5552315.0842

8 #3 31N 1E 8 AB 9/11/1997 0.8WELL #3 W

SMALL COTTONWOOD WATER DEPT 10/12/1994 0.5 5/10/1993 0.892

PWS-6 2250013 46.05959 -116.35025318206.4925

1553573.2246

8 #4 31N 1E 8 AB 10/12/1994 0.5 WELL #4 NORTH COTTONWOOD WATER DEPT

PWS-7 2250014 45.94059 -116.15884332653.4090

6539932.1908

6 main well 9/26/2001 2.90000 WELL COUNTRY COURT MHP 10/11/2000 2.50000 12/27/1999 2.40000 9/15/1998 2.60000 11/24/1997 2.10000 12/16/1996 2.08000 12/12/1995 2.00000 9/12/1994 2.58000 8/16/1993 2.71000

46

Table 4. Public Water System Wells Nitrate Concentrations, continued 6/13/1994 3.51 12/20/1993 3.35

PWS-9 2310001 46.2388 -116.47385 309266.50944 573774.34592 #3 34N/1W/32 DD 1/14/1997 1.96WELL #3SOUTH CRAIGMONT CITY OF

10/25/1995 0.4 12/20/1993 0.82

PWS-10 2310001 46.24166 -116.46545 309924.01311 574071.93735 #2 34N/1W/33 BB 5/24/2002 2.4WELL #2

EAST CRAIGMONT CITY OF 1/14/1997 8 10/25/1995 6.1 6/13/1994 6.29 12/20/1993 6.61

PWS-11 2350003 46.37566 -116.66309 295187.96655 589453.12219 #1 lower WELL #1LOWER CULDESAC CITY OF

PWS-12 2350003 46.37861 116.662117 295273.59668 589778.37950 #2 upper WELL #2UPPER CULDESAC CITY OF

PWS-13 2250018 45.96555 -116.25878 324985.11472 542920.03256 main well 30N 2E 6 CB 12/28/1999 0.15000 WELL #1 FENN COMMUNITY SYSTEM 3/9/1998 0.11000 12/2/1996 0.11000 7/10/1995 0.26000 1/4/1995 22.30000 6/14/1994 0.13000 9/20/1993 3.93000

PWS-14 2250019 46.1545 -116.39135 315344.79106 564212.94271 #1 WELL FERDINAND CITY OFPWS-15 2250019 46.15442 -116.39134 315345.29551 564204.03102 #2 WELL 2-WEST FERDINAND CITY OF

PWS-16 2250021 45.91136 -116.15647 332749.26561 536679.69731 main well 10/18/2000 0.74000 WELL #1GRANGEVILLE GOLF AND

COUNTRY CLUB 9/14/1999 0.73000 8/4/1998 0.75000 8/26/1997 0.78000 9/23/1996 0.83000 8/30/1995 0.81000 10/19/1994 0.95000 11/10/1993 0.91000

PWS-17 2250008 45.93493 -116.13244 334682.99945 539248.25314 depot 12/30/1998 0.3 WELL #1 THE DEPOT

PWS-18 2250023 45.93155 -116.12007 335631.97874 538847.14356 park 8/13/2002 0.86 PARK WELL GRANGEVILLE WATER DEPT 10/18/2000 0.74 9/14/1999 0.38

47

Table 4. Public Water System Wells Nitrate Concentrations, continued 8/4/1998 1.2 8/26/1997 0.41 9/23/1996 0.47 8/30/1995 1.16 5/10/1994 0.53 4/5/1993 0.48

PWS-19 2250023 45.92548 -116.11261 336192.46697 538157.39531 cash 8/20/2001 1.28000 CASH WELL GRANGEVILLE WATER DEPT 10/18/2000 1.55000 9/14/1999 1.9 8/4/1998 1.78 8/26/1997 1.69 9/23/1996 1.52 8/30/1995 0.96 5/10/1994 1.12 4/5/1993 1.07

PWS-20 2250023 45.91048 -116.12143 335464.24581 536509.02409 spencer 8/13/2002 0.86SPENCER

WELL GRANGEVILLE WATER DEPT

PWS-21 2250023 45.93214 -116.13791 334250.63029 538949.63766 eimers 10/18/2000 1.51 EIMERS GRANGEVILLE WATER DEPT 9/14/1999 2.38 EIMERS 8/4/1998 1.85 EIMERS 8/26/1997 1.83 EIMERS 9/23/1996 1.37 EIMERS 8/30/1995 0.67 EIMERS 5/10/1994 0.59 EIMERS 4/5/1993 0.44 EIMERS

PWS-22 2250023 45.92775 -116.11086 336334.83505 538406.00316 myrtle MYRTLE ST.

WELL GRANGEVILLE WATER DEPT

PWS-23 2250045 46.02704 -116.37918 315860.61761 550023.33969southeast

well 8/13/2001 2.30000SOUTHEAST

WELL MONASTERY OF ST GERTRUDES

10/16/2000 2.70000SOUTHEAST

WELL

11/4/1999 2.50000SOUTHEAST

WELL

11/17/1998 2.20000SOUTHEAST

WELL

10/2/1997 2.90000SOUTHEAST

WELL

48

Table 4. Public Water System Wells Nitrate Concentrations, continued

4/7/1997 7.30000SOUTHEAST

WELL

11/13/1995 3.54000SOUTHEAST

WELL

10/25/1994 1.62000SOUTHEAST

WELL

11/30/1993 2.08000SOUTHEAST

WELL

10/7/1992 2.14000SOUTHEAST

WELL

PWS-25 2250045 46.03163 116.394278 314707.30527 550568.35946 Southwest Well MONASTERY OF ST GERTRUDES

PWS-26 2310005 46.23371 -116.23309 327812.72740 572657.83068 #4 250 11/27/2000 3.60000WELL #4 E

5TH NEZ PERCE WATER DEPT

11/16/1999 4.40000WELL #4 E

5TH

9/30/1998 3.40000WELL #4 E

5TH

11/19/1997 0.30000WELL #4 E

5TH

12/17/1996 3.73000WELL #4 E

5TH

9/27/1995 3.00000WELL #4 E

5TH

1/5/1994 4.40000WELL #4 E

5TH

PWS-27 2310005 46.23395 -116.24775 326683.11625 572716.43286 #1 11/27/2000 2.5WELL #1 W

5TH NEZ PERCE WATER DEPT

12/17/1996 3.78WELL #1 W

5TH

9/27/1995 0.3WELL #1 W

5TH

PWS-28 2250041 46.07963 116.426942 312342.55424 555977.91866 East Well #3NORTH IDAHO CORRECTIONAL

INSTITUTE

PWS-29 2250041 46.0806 -116.4267 312364.40112 556085.12316 #5 12/9/1997 0.20000NORTH WELL

#5NORTH IDAHO CORRECTIONAL

INSTITUTE

10/2/1995 0.37800NORTH WELL

#5

10/2/1995 0.38400NORTH WELL

#5

49

Table 4. Public Water System Wells Nitrate Concentrations, continued

12/28/1993 0.43000NORTH WELL

#5 PWS-30 2310006 46.32766 -116.54115 304394.52382 583811.42138 #2 7/10/2000 1.4 WELL #2 RR REUBENS CITY OF

7/26/1999 2 3/4/1996 0.6 6/13/1994 0.56 11/8/1993 0.41

PWS-31 2310006 46.32292 -116.54302 304233.66696 583289.39330 #1 7/26/1999 1.70000WELL I

STEEPLE REUBENS CITY OF 6/22/1998 2.60000 3/17/1997 0.20000 3/4/1996 2.90000 6/13/1994 2.15000 11/8/1993 1.56000

PWS-32 2310007 46.24148 -116.62935 297287.70265 574457.96578 #7 WELL #7 S W WINCHESTER WATER DEPT

PWS-33 2310007 46.24234 -116.62829 297372.58998 574550.80699 #4 WELL #4 N W WINCHESTER WATER DEPT

PWS-34 2310007 46.24352 -116.62016 298003.68533 574661.16364 #10 WELL #10 N E WINCHESTER WATER DEPT

50

APPENDIX D

52

APPENDIX D. Well attributes for the Department of Agriculture.

Table 5. Department of Agriculture Nitrate ConcentrationsIdaho State Department of Agriculture Wells

NUMBER SITE_ID LATITUDE LONGITUDEEASTING NORTHING

Sampling Date NITRATE(mg/L)

NITRITE(mg/L)

AG-1 9500101 45.9470 -116.1094 336506.99507 540542.78068 8/20/2002 3.1 ND 9/12/2001 3.50 ND 9/12/2001

AG-2 9500201 46.1400 -116.2636 325163.41722 562318.30726 8/14/2002 6.6 ND 10/18/2001 6.80 ND

AG-3 9500301 45.9303 -116.0643 339949.04309 538594.85353 8/20/2002 1.6 ND 9/12/2001 1.30 ND

AG-4 9500401 46.0567 -116.3572 317662.49293 553267.95318 8/15/2002 ND ND 9/12/2001 ND ND

AG-5 9500501 46.0770 -116.4045 314066.44584 555631.94854 8/15/2002 1.5 BDL 9/12/2001 0.68 ND

AG-6 9500601 46.0668 -116.3941 314835.89201 554479.99527 8/15/2002 BDL ND 9/12/2001 0.051 ND

AG-7 9500701 45.8761 -116.2027 329052.62256 532863.68669 2002 0.17 ND 2001 0.210 ND

AG-8 9500801 46.1071 -116.4650 309492.93838 559123.87997 8/15/2002 2.2 ND 9/13/2001 2.10 ND

AG-9 9500901 46.1141 -116.2319 327527.69620 559364.80285 8/27/2002 ND BDL 9/13/2001 BDL ND

AG-10 9501001 45.9433 -116.0769 339015.97251 540063.29206 8/20/2002 BDL ND 9/19/2001 0.39 ND 9/19/2001

AG-11 9501101 46.1317 -116.2422 326793.34120 561349.15807 8/14/2002 0.95 ND 9/19/2001 1.00 ND

AG-12 9501201 46.2093 -116.4611 310146.34832 570469.49651 8/15/2002 1.5 ND 8/15/2002 9/19/2001 1.40 ND

AG-13 9501301 46.1389 -116.2502 326194.73810 562160.01433 8/14/2002 10 ND 9/19/2001 8.60 ND

AG-14 9501401 46.1382 -116.2498 326226.67733 562086.83292 8/14/2002 38 ND 9/19/2001 29.00 ND

AG-15 9501501 46.0998 -116.3466 318618.49824 558036.90632 8/13/2002 4.7 ND 9/19/2001 4.20 ND

AG-16 9501601 46.3006 -116.4094 314441.99994 580490.04289 8/27/2002 3.2 ND 9/19/2001 2.70 ND

AG-17 9501701 46.3615 -116.7170 290990.32522 588021.87933 2002 2.5 ND 2001 4.90 ND

AG-18 9501801 46.3482 -116.8283 282371.97916 586845.48300 2002 5.1 ND 2001 2.20 ND

AG-19 9501901 46.2996 -116.8909 277363.39371 581616.27728 2002 4 ND 2001 4.30 ND

AG-20 9502001 46.3123 -116.8903 277455.11257 583030.30471 2002 ND ND 2001 ND ND

AG-21 9502101 46.4039 -116.8191 283302.56623 593003.25803 2002 1.1 ND 2001 1.10 ND

AG-22 9502201 46.0909 -116.1794 331518.36841 556669.97632 8/27/2002 9.9 ND 8/27/2002 10/3/2001 9.50 ND 10/3/2001

AG-23 9502301 46.0442 -116.0634 340351.25397 551243.17569 8/26/2002 5.3 ND

53

Table 5. Department of Agriculture Nitrate Concentrations, continued

NUMBER SITE_ID LATITUDE LONGITUDEEASTING NORTHING

Sampling Date NITRATE(mg/L)

NITRITE(mg/L)

10/3/2001 5.70 NDAG-24 9502401 46.0555 -115.9812 346743.41155 552344.75586 8/26/2002 0.11 ND

10/3/2001 0.20 NDAG-25 9502501 46.3811 -116.7888 285544.80269 590395.08908 2002 1.5 ND

2001 1.50 NDAG-26 9502601 46.4091 -116.6927 293040.29757 593242.23755 2002 4.2 ND

2001 4.10 NDAG-27 9502701 46.2374 -116.2195 328869.75439 573038.46286 8/27/2002 3.2 BDL

10/4/2001 3.00 NDAG-28 9502801 46.1366 -116.2153 328886.38313 561830.82873 8/13/2002 1.1 ND

8/13/2002 10/4/2001 0.72 ND

AG-29 9502901 46.3482 -116.9507 272955.41024 587181.59490 2002 BDL ND 2001 BDL ND

AG-30 9503001 46.0967 -116.5014 306643.52239 558057.42219 8/15/2002 ND ND 10/10/2001 BDL ND

AG-31 9503101 46.2661 -116.6411 296473.11835 577226.84538 2002 2 ND 2001 1.90 ND

AG-32 9503201 46.4157 -116.7979 284981.82038 594262.99469 2002 4.9 ND 2001 4.60 ND

AG-33 9503301 46.3585 -116.5829 301290.36069 587339.84604 2002 ND ND 2001 BDL ND

AG-34 9503401 45.9106 -116.0563 340513.60596 536390.08406 8/20/2002 0.47 ND 10/11/2001 0.52 ND

AG-35 9503501 46.4346 -116.8107 284069.74111 596396.83644 2002 5.2 ND 2001 4.20 ND

AG-36 9503601 46.0646 -116.3641 317151.08066 554164.96533 8/15/2002 9.2 ND 10/18/2001 10.00 ND

AG-37 9503701 46.3824 -116.4092 314736.36010 589578.17425 2002 ND ND 2001 ND ND

AG-38 9503801 46.4683 -116.3332 320859.75228 598941.84671 2002 1.2 ND 2001 1.00 ND

AG-39 9503901 46.3338 -116.2420 327439.63016 583798.04509 8/27/2002 2.1 ND 9/25/2001 1.50 ND

AG-40 9504001 46.4115 -116.4536 311420.18828 592916.47637 2002 ND ND 2001 ND ND

AG-41 9504101 46.4375 -116.2740 325309.57768 595391.43276 2002 0.49 ND 2001 0.480 ND

AG-42 9504201 46.4628 -116.6374 297490.42745 599064.36573 2002 1.1 ND 2001 1.30 ND

AG-43 9504301 46.1672 -116.3890 315568.74400 565619.63176 8/21/2002 13 ND 9/26/2001 16.00 ND

AG-44 9504401 46.2399 -116.5817 300954.62294 574158.37033 8/21/2002 BDL ND 9/26/2001 BDL ND

AG-45 9504501 46.1934 -116.4923 307685.37026 568769.12411 8/21/2002 1.9 ND 9/26/2001 2.10 ND

AG-46 9504601 46.0446 -116.2350 327074.32267 551655.23013 8/20/2002 ND ND 9/27/2001 ND ND

AG-47 9504701 46.4091 -116.4995 307886.23607 592754.69860 2002 BDL ND

54

Table 5. Department of Agriculture Nitrate Concentrations, continued.

NUMBER SITE_ID LATITUDE LONGITUDEEASTING NORTHING

Sampling Date NITRATE(mg/L)

NITRITE(mg/L)

2001 ND NDAG-48 9504801 46.4534 -116.5331 305464.92205 597767.83225 2002 0.26 ND

2001 0.33 NDAG-49 9504901 46.4227 -116.6389 297224.28266 594617.25879 2002 2 ND

2001 2.20 NDAG-50 9505001 46.4201 -116.6340 297588.24034 594320.36285 2002 0.33 ND

2001 0.37 NDAG-51 9505101 46.3807 -116.6567 295697.58040 590001.05044 2002 6.9 ND

2001 7.20 NDAG-52 9505201 46.4124 -116.9784 271096.01104 594398.82841 2002 6.4 ND

2001 6.60 NDAG-53 9505301 46.4033 -116.9323 274601.27481 593251.93745 2002 4.2 ND

2001 4.00 NDAG-54 9505401 46.2832 -116.8793 278189.62796 579759.40072 2002 11 ND

2001 12.00 NDAG-55 9505501 46.3463 -116.9285 274653.50269 586909.33498 2002 ND ND

2001 BDL NDAG-56 9505601 46.0973 -116.3771 316254.10567 557822.49478 8/15/2002 4.1 ND

10/11/2001 4.30 NDAG-57 9505701 46.2075 -116.4768 308933.50819 570302.61319 8/13/2002 4 ND

10/11/2001 4.90 NDAG-58 9505801 46.3663 -116.6407 296875.84815 588353.17114 2002 2.8 ND

2001 3.10 NDAG-59 9505901 45.9518 -116.1544 333035.06669 541166.01064 8/20/2002 ND ND

10/12/2001 0.15 NDAG-60 9506001 45.9619 -116.1531 333159.91298 542284.48224 8/26/2002 4.4 ND

10/12/2001 NA NA

AG-61 9506101 46.0993 -116.3108 321388.54126 557897.91525 8/21/2002 3.3 ND 10/12/2001 1.90 ND

AG-62 9506201 46.4276 -116.2963 323563.78376 594340.99698 2002 1.3 ND 2001 1.30 BDL

AG-63 9506301 45.9512 -116.1117 336341.00716 541010.80073 8/20/2002 2.2 ND 10/17/2001 2.20 ND 10/17/2001

AG-64 9506401 46.0266 -116.2611 324995.05918 549713.62623 8/20/2002 ND ND 10/17/2001 2.30 ND

AG-65 9506501 45.9754 -116.2642 324593.05402 544021.96147 8/20/2002 1.9 ND 10/18/2001 0.082 ND

AG-66 9506601 46.1825 -116.5861 300409.14623 567796.35421 8/21/2002 0.15 ND 8/21/2002 10/18/2001 0.11 ND

AG-67 9506701 45.9514 -116.1340 334611.18302 541085.79435 8/21/2002 BDL ND 10/19/2001 ND ND

AG-68 9506801 46.0903 -115.9825 346736.17641 556214.91117 8/26/2002 0.18 ND 8/26/2002 10/19/2001 0.16 ND

55

Table 5. Department of Agriculture Nitrate Concentrations, continued

NUMBER SITE_ID LATITUDE LONGITUDEEASTING NORTHING

Sampling Date NITRATE(mg/L)

NITRITE(mg/L)

AG-69 9506901 46.1731 -116.1076 337309.09465 565659.94016 8/26/2002 0.59 ND 10/19/2001 0.59 ND

AG-70 9507001 46.0522 -116.1586 333007.40655 552330.85508 8/21/2002 13 ND 10/19/2001 16.00 ND

AG-71 9507101 45.9513 -116.1340 334609.30568 541073.61456 8/20/2002 BDL ND 8/20/2002 10/19/2001 0.054 ND

AG-72 9508601 46.1427 -116.2086 329422.84106 562497.49518 10/4/2001 15.0 ND

Table 6. Department of Agriculture Chemistry DataNUMBER SITE_ID Sampling Date OrthoP02 Chloride Sulfate Ammonia Bromide Fluoride

AG-1 9500101 8/20/2002 BDL 2.3 11 BDL BDL 0.47 9/12/2001 ND 2.30 12.00 BDL ND 0.52 9/12/2001

AG-2 9500201 8/14/2002 BDL 4.6 18 BDL BDL 0.83 10/18/2001 ND 4.30 18.00 BDL BDL 0.85

AG-3 9500301 8/20/2002 0.15 1.3 3.6 BDL ND 0.46 9/12/2001 0.52 1.20 3.40 BDL ND 0.54

AG-4 9500401 8/15/2002 ND 1.3 3.5 BDL ND 0.36 9/12/2001 ND 1.20 3.50 BDL ND 0.42

AG-5 9500501 8/15/2002 ND 0.69 23 BDL ND 0.15 9/12/2001 ND 0.47 20.00 BDL ND 0.15

AG-6 9500601 8/15/2002 BDL 2.5 16 BDL ND 0.33 9/12/2001 ND 2.60 17.00 BDL ND 0.38

AG-7 9500701 2002 0.14 0.41 1.7 BDL ND 0.24 2001 0.14 0.33 1.30 BDL ND 0.30

AG-8 9500801 8/15/2002 BDL 1.8 9.4 BDL ND BDL 9/13/2001 BDL 1.50 9.90 BDL ND BDL

AG-9 9500901 8/27/2002 ND 6.1 34 BDL BDL 0.52 9/13/2001 ND 6.90 920.00 BDL BDL 0.51

AG-10 9501001 8/20/2002 ND 1.4 34 BDL BDL 0.46 9/19/2001 BDL 1.50 27.00 0.11 ND 0.54 9/19/2001

AG-11 9501101 8/14/2002 ND 3 14 BDL BDL 0.33 9/19/2001 BDL 2.60 14.00 BDL BDL 0.33

AG-12 9501201 8/15/2002 0.10 1.9 4.9 BDL ND 0.45 8/15/2002 9/19/2001 BDL 1.80 4.90 BDL ND 0.52

AG-13 9501301 8/14/2002 BDL 4.8 36 BDL ND 1 9/19/2001 BDL 4.10 34.00 BDL ND 1.00

AG-14 9501401 8/14/2002 BDL 21 30 BDL BDL 0.44 9/19/2001 BDL 12.00 29.00 BDL BDL 0.35

AG-15 9501501 8/13/2002 BDL 4.7 14 BDL ND 0.28 9/19/2001 BDL 2.90 15.00 BDL ND 0.27

AG-16 9501601 8/27/2002 BDL 1.6 3.8 BDL ND 0.42 9/19/2001 BDL 1.10 3.40 BDL ND 0.44

AG-17 9501701 2002 ND 1.5 4.8 BDL ND 0.23 2001 BDL 1.40 6.90 0.26 ND 0.31

56

Table 6. Department of Agriculture Chemistry Data, continued.

NUMBER SITE_ID Sampling Date OrthoP02 Chloride Sulfate Ammonia Bromide Fluoride

AG-18 9501801 2002 BDL 7.4 16 BDL BDL 0.36 2001 BDL 3.80 9.20 BDL ND 0.35

AG-19 9501901 2002 BDL 11 23 BDL 0.22 0.41 2001 BDL 9.10 21.00 BDL 0.20 0.40

AG-20 9502001 2002 ND 6.4 19 0.12 BDL 0.34 2001 BDL 6.20 19.00 BDL BDL 0.34

AG-21 9502101 2002 BDL 2.70 6.5 BDL ND 0.36 2001 BDL 2.40 6.60 BDL ND 0.36

AG-22 9502201 8/27/2002 ND 4.2 23 BDL BDL 0.26 8/27/2002 10/3/2001 ND 3.80 23.00 BDL BDL 0.32 10/3/2001

AG-23 9502301 8/26/2002 BDL 10 25 BDL 0.22 0.62 10/3/2001 ND 8.70 26.00 BDL 0.20 0.69

AG-24 9502401 8/26/2002 0.12 1 7.2 BDL ND 0.37 10/3/2001 ND 1.10 11.00 BDL BDL 0.39

AG-25 9502501 2002 BDL 2 5 BDL ND 0.38 2001 ND 1.90 4.90 BDL ND 0.40

AG-26 9502601 2002 BDL 0.88 7.4 BDL ND 0.47 2001 ND 0.79 7.50 BDL BDL 0.56

AG-27 9502701 8/27/2002 BDL 3 13 BDL BDL 0.63 10/4/2001 ND 2.50 13.00 BDL BDL 0.70

AG-28 9502801 8/13/2002 BDL 4.1 21 BDL BDL 0.7 8/13/2002 10/4/2001 ND 3.90 22.0 BDL BDL 0.72

AG-29 9502901 2002 BDL 17 45 BDL 0.21 0.33 2001 ND 19.00 48.00 BDL 0.22 0.32

AG-30 9503001 8/15/2002 ND 0.80 17 BDL ND 0.15 10/10/2001 ND 0.88 18.00 BDL BDL 0.17

AG-31 9503101 2002 BDL 9.7 6.4 BDL ND 0.36 2001 ND 7.00 6.40 BDL ND 0.43

AG-32 9503201 2002 BDL 2 5.4 BDL ND 0.36 2001 ND 1.90 5.20 BDL BDL 0.38

AG-33 9503301 2002 BDL 0.64 6.7 BDL ND 0.18 2001 ND 0.58 6.70 BDL ND 0.22

AG-34 9503401 8/20/2002 0.16 0.52 1.4 BDL ND 0.16 10/11/2001 0.15 0.50 1.30 BDL ND 0.17

AG-35 9503501 2002 BDL 5.2 9 BDL BDL 0.36 2001 BDL 4.50 7.30 BDL BDL 0.37

AG-36 9503601 8/15/2002 BDL 14 21 BDL BDL 0.32 10/18/2001 ND 13.00 22.00 BDL ND 0.38

AG-37 9503701 2002 BDL 1.3 8 BDL ND 0.37 2001 ND 1.10 8.30 BDL ND 0.44

AG-38 9503801 2002 BDL 4 7.5 BDL ND 0.33 2001 ND 3.60 7.50 BDL ND 0.40

AG-39 9503901 8/27/2002 BDL 1.3 6.2 BDL ND 0.49 9/25/2001 BDL 0.87 5.00 BDL ND 0.52

AG-40 9504001 2002 BDL 0.76 2.8 BDL ND 0.25 2001 ND 0.65 2.80 BDL ND 0.29

AG-41 9504101 2002 ND 5.8 16 BDL ND 0.45 2001 ND 5.20 16.00 BDL ND 0.47

57

Table 6. Department of Agriculture Chemistry Data, continued.

NUMBER SITE_ID Sampling Date OrthoP02 Chloride Sulfate Ammonia Bromide Fluoride

AG-42 9504201 2002 0.11 0.89 2.5 BDL ND 0.27 2001 BDL 0.92 2.80 BDL ND 0.30

AG-43 9504301 8/21/2002 BDL 17 33 .13 BDL 0.73 9/26/2001 BDL 12.00 41.00 BDL 0.16 0.78

AG-44 9504401 8/21/2002 BDL 0.60 2.3 BDL ND 0.33 9/26/2001 ND 0.53 2.60 BDL ND 0.41

AG-45 9504501 8/21/2002 BDL 1.1 4.4 BDL ND 0.29 9/26/2001 BDL 1.20 4.80 BDL ND 0.36

AG-46 9504601 8/20/2002 BDL 9.6 28 BDL BDL 0.39 9/27/2001 ND 13.00 36.00 BDL BDL 0.44

AG-47 9504701 2002 ND 0.46 2.9 BDL ND 0.23 2001 ND 0.52 3.10 BDL ND 0.25

AG-48 9504801 2002 BDL 0.95 12 BDL ND 0.18 2001 ND 0.83 18.00 BDL ND 0.23

AG-49 9504901 2002 BDL 1.2 3.9 BDL ND 0.32 2001 BDL 1.00 4.10 0.11 ND 0.38

AG-50 9505001 2002 ND 1.3 4.8 BDL ND 0.24 2001 ND 1.20 5.00 BDL ND 0.31

AG-51 9505101 2002 0.12 6.6 14 BDL BDL 0.28 2001 BDL 5.10 14.00 BDL BDL 0.34

AG-52 9505201 2002 BDL 32 96 BDL 0.30 0.61 2001 0.13 34.00 110.0 BDL 0.30 0.70

AG-53 9505301 2002 BDL 26 58 BDL 0.33 0.41 2001 BDL 30.00 75.00 BDL 0.34 0.44

AG-54 9505401 2002 BDL 8 27 BDL 0.15 0.59 2001 ND 6.50 24.00 BDL BDL 0.55

AG-55 9505501 2002 BDL 7 24 BDL BDL 0.38 2001 ND 6.80 23.00 0.11 BDL 0.35

AG-56 9505601 8/15/2002 BDL 0.56 6.6 BDL ND 0.30 10/11/2001 ND 0.49 7.10 BDL ND 0.33

AG-57 9505701 8/13/2002 BDL 4.8 17 BDL BDL 0.46 10/11/2001 ND 4.00 18.00 BDL BDL 0.51

AG-58 9505801 2002 BDL 7.4 7.4 BDL ND BDL 2001 BDL 4.90 7.90 BDL BDL 0.14

AG-59 9505901 8/20/2002 BDL 1.7 11 BDL BDL 0.38 10/12/2001 ND 2.00 12.00 BDL BDL 0.45

AG-60 9506001 8/26/2002 BDL 1.1 4.7 BDL ND 0.36 10/12/2001 NA NA NA NA NA NA

AG-61 9506101 8/21/2002 ND 2.6 15 BDL BDL 0.43 10/12/2001 BDL 2.80 17.00 BDL ND 0.49

AG-62 9506201 2002 BDL 0.83 0.91 BDL ND 0.18 2001 BDL 0.69 0.91 BDL ND 0.23

AG-63 9506301 8/20/2002 BDL 1.6 15 BDL BDL 0.36 10/17/2001 ND 1.50 16.00 BDL ND 0.39 10/17/2001

AG-64 9506401 8/20/2002 BDL 2.7 15 BDL BDL 0.57 10/17/2001 ND 1.50 15.00 BDL ND 0.39

58

Table 6. Department of Agriculture Chemistry Data, continued.

NUMBER SITE_ID Sampling Date OrthoP02 Chloride Sulfate Ammonia Bromide Fluoride

AG-65 9506501 8/20/2002 BDL 4.4 15 BDL BDL 0.55 10/18/2001 ND 4.50 22.00 BDL BDL 0.53

AG-66 9506601 8/21/2002 ND 0.89 1.9 BDL ND BDL 8/21/2002 10/18/2001 ND 0.87 1.60 BDL ND 0.14

AG-67 9506701 8/21/2002 BDL 4.9 22 BDL BDL 0.46 10/19/2001 ND 2.50 16.00 BDL ND 0.60

AG-68 9506801 8/26/2002 BDL 1.8 6.9 BDL ND 0.31 8/26/2002 10/19/2001 ND 1.70 7.70 BDL ND 0.35

AG-69 9506901 8/26/2002 0.59 0.95 1.4 BDL ND 0.25 10/19/2001 ND 0.78 1.40 BDL ND 0.28

AG-70 9507001 8/21/2002 ND 8.8 25 BDL 0.22 0.59 10/19/2001 ND 11.00 22.00 BDL 0.19 0.68

AG-71 9507101 8/20/2002 BDL 3.5 16 BDL BDL 0.4 8/20/2002 10/19/2001 ND 3.40 17.00 BDL ND 0.46

AG-72 9508601 10/4/2001 BDL 7.60 49 BDL BDL 0.58

59

APPENDIX E

61

APPENDIX E. Well Information

Table 7. Well Information for All Data SourcesMapID

Number SITE_ID EASTING NORTHING Ave. Nitrate(mg/L) well depth casing

depthdepth to

water

1 IDWR-1 454553116192901 319225.94229 520754.63961 0.062 195 28 272 IDWR-2 454450116182601 320225.38670 518687.50069 0.0507 425 73 2803 IDWR-3 454305116174401 321344.61205 515505.22627 0.044 205 37 264 IDWR-4 455234116121001 329049.45699 532861.55037 0.205 325 77 2195 IDWR-5 455309116061901 336644.50936 533737.16291 0.2745 320 21 2656 IDWR-6 455828116243901 313234.08792 544253.06006 1.67 163 31 57 IDWR-7 455442116244001 313001.36761 537279.84824 0.238 220 18 398 IDWR-8 455621116091601 332991.02425 539795.19295 0.506 250 250 299 IDWR-9 455732116054701 337547.76193 541836.13382 0.0125 283 169 198

10 IDWR-10 455646116064101 336347.78178 540446.93463 0 342 90 26311 IDWR-11 455545116060101 337159.29895 538542.10035 0.52 300 300 3312 IDWR-12 460434116171201 323177.13738 555265.29717 0.83 58 58 1113 IDWR-13 460314116212501 317670.25840 552955.24680 0.420 301 270 1114 IDWR-14 460017116142101 326626.88691 547229.04185 5.71 154 18 5315 IDWR-15 455950116093401 332777.47010 546225.21387 3.898 192 192 8016 IDWR-16 455906116015301 342658.61535 544606.56151 0.0171 184 144 13617 IDWR-17 460533116213601 317562.14499 557268.64249 0.32 100 ? ?18 IDWR-18 460548116300601 306623.95335 558050.25318 0.0267 130 97 1019 IDWR-19 460702116095801 332618.49584 559594.17220 0.35 175 ? ?20 IDWR-20 460714116023801 342077.43485 559692.68960 1.6307 430 19 17821 IDWR-21 460426116022101 342309.09813 554498.02563 4.5 81 21 422 IDWR-22 460850116393001 294700.11122 564077.58685 0.11 125 ? ?23 IDWR-23 461155116163701 324319.70338 568854.12993 23.03 396 20 20424 IDWR-24 461233116274101 310124.96911 570452.36578 1.645 405 19 11225 IDWR-25 461008116262601 311594.13576 565927.37359 0.9167 190 76 15126 IDWR-26 461025116290401 308223.19501 566556.87835 4.013 160 150 1727 IDWR-27 461323116101901 332495.32934 571343.57936 68.8 180 180 13328 IDWR-28 461323116333201 302647.61745 572237.16823 18 275 ? ?29 IDWR-29 461246116070201 336684.88619 570087.29174 0.1 110 110 4030 IDWR-30 461340116451501 287612.00917 573262.58345 0.0885 130 130 10031 IDWR-31 460951116434001 289403.99251 566124.84752 0.0943 87 18 4032 IDWR-32 460954116431701 289900.47428 566200.12991 0.32 114 18 2133 IDWR-33 471301116503001 280821.50566 572296.32180 0.2397 194 192 17034 IDWR-34 461154116523901 277983.00627 570328.32554 0.659 385 234 18635 IDWR-35 461719116204801 319235.69780 579010.52299 0.107 154 53 -536 IDWR-36 461512116154601 325585.68018 574902.65266 1.633 320 320 15037 IDWR-37 461657116293801 307852.68587 578678.79819 0.099 140 140 5338 IDWR-38 461436116255201 312577.10705 574175.72956 3.7 122 122 1039 IDWR-39 461555116085301 334464.05806 575984.39313 0.4407 265 23 5640 IDWR-40 461445116112601 331129.23065 573912.98669 0.24 154 28 7041 IDWR-41 461832116332901 303025.53180 581767.85546 1.07 100 47 3042 IDWR-42 461630116343201 301555.60794 578046.11783 0.9175 75 15 443 IDWR-43 461437116370801 298101.92106 574667.92785 0.00867 600 36 11644 IDWR-44 461920116423301 291440.89250 583635.89855 0.40333 404 191 260

62

Table 7. Well Information for All Data Sources, continuedMapID

Number SITE_ID EASTING NORTHING Ave. Nitrate(mg/L) well depth casing

depthdepth to

water45 IDWR-45 462324116282101 309895.16161 590570.59221 0 477 58 36546 IDWR-46 462158116294101 308103.04933 587969.85817 0.045 615 25 51047 IDWR-47 462002116143101 327445.30090 583807.89231 1.77 154 56 7048 IDWR-48 462116116314901 305326.34570 586760.09172 0 166 142 11049 IDWR-49 462224116405601 293707.99432 589243.95417 5.59 207 24 9450 IDWR-50 462436116475201 284964.66401 593626.15584 2.145 80 58 2751 IDWR-51 462217116473501 285177.28474 589341.21146 0.77 78 ? ?52 IDWR-52 462206116475001 284843.91580 588994.78003 2.4 122 47 2853 IDWR-53 462405116560001 274511.31874 593047.21867 2.46 244 244 13354 IDWR-54 462127116582501 271231.69869 588286.43655 0.025 190 88 8355 IDWR-55 462056116535201 277030.24212 587113.31764 3.9875 585 333 19756 IDWR-56 462125117022001 266208.11848 588415.04592 2.01 307 37 24857 IDWR-57 462736116170201 324621.29926 597912.24292 0.4 307 37 24858 IDWR-58 462551116162901 325232.13711 594650.82867 0.34 307 37 24859 IDWR-59 462712116320001 305443.75957 597755.16398 0.052 605 26 43260 IDWR-60 462513116372701 298345.65609 594310.74044 5.57 630 630 53061 IDWR-61 462835116410301 293946.94797 600699.89701 0.572 132 130 2462 CP-1 1 320000.62449 545874.46094 8.35 495 495 29663 CP-2 2 315875.07012 562954.82841 0.318 600 600 39064 CP-3 3 315852.97818 562939.92290 36.8 402 402 2565 CP-4 4 329908.74549 560563.73246 19.3 275 38 6166 CP-5 5 306447.30823 570480.84196 3.57 575 18 35067 CP-6 6 341003.79640 554472.71268 5.48 358 358 19068 CP-7 7 341444.31224 552138.81553 7.02 260 16 3569 CP-8 8 317498.36024 563759.24494 7.83 175 175 5070 CP-9 9 315508.77544 562830.16460 0.112 202 202 5371 CP-10 10 317468.38779 563739.00834 12.2 100 170.5 72 CP-11 11 331072.52275 550404.52367 <.005 240 73 CP-12 12 331213.25633 550989.95850 0.005 215 115.5 14274 CP-13 13 324461.62928 548961.56946 9.46 90 5075 CP-14 14 325097.33460 562277.93659 7.48 115 115 6276 CP-15 15 329289.34030 573060.09077 2.83 375 25 15277 CP-16 16 326654.83987 561399.77065 0.968 640 640 1278 CP-17 17 314836.85562 561775.04648 3.24 500 500 7479 CP-18 18 313915.22042 565875.35356 <.005 160 80 CP-19 19 311952.57426 567183.04866 13.9 327 81 CP-20 20 313852.09966 564916.43318 9.8 82 82 34.582 CP-21 21 312676.70077 563475.38529 6.19 203 38 1083 CP-22 22 314716.82423 563253.26867 0.338 400 400 20084 CP-23 23 321712.38979 563079.27332 1.84 75 138 1085 CP-24 24 314722.53071 563442.14767 10.8 86 CP-25 25 314428.73517 563439.91040 5.42 87 CP-26 26 329898.58965 561089.94702 3.77 135 135 4088 CP-27 27 307650.61918 563846.73281 <.005 340 340 27589 CP-28 28 331175.98603 547736.52617 17.5 182 26.5 96

63

Table 7. Well Information for All Data Sources, continuedMapID

Number SITE_ID EASTING NORTHING Ave. Nitrate(mg/L) well depth casing

depthdepth to

water90 CP-29 29 323558.75463 551921.79980 2.2 200 200 7191 CP-30 30 328859.16021 561797.11848 2.66 255 255 11692 CP-31 31 317532.76372 564369.84268 8.25 39 93 CP-32 32 317502.42613 564648.75584 8.45 50 94 CP-33 33 317602.12041 565401.97625 2.09 40 95 CP-34 34 315889.54727 563951.90721 <.005 60 96 CP-35 35 315469.53908 565173.34452 6.91 140 53.497 CP-36 36 315576.09604 565607.17781 2.15 135 138 4698 CP-37 37 315188.61041 563005.50031 3.63 370 300 6099 CP-38 38 316231.06679 557776.47826 3.62 325 325 2

100 CP-39 39 316234.19301 557674.07711 3.12 400 400 44101 CP-40 40 317647.87631 556637.80436 2.29 200 200 90102 CP-41 41 324995.69743 559336.37286 3.17 327 327 6103 CP-42 42 309798.01277 578573.37856 5.4 180 180 50104 CP-43 43 307470.32952 572709.59350 11.8 90 19105 CP-44 44 307701.34290 574924.42825 4.43 106 CP-45 45 310147.09824 570443.89424 1.87 405 405 300107 CP-46 46 319609.30773 555078.71580 2.72 500 480 340108 CP-47 47 327447.86087 557789.21948 <.005 103 103 20109 CP-48 48 305827.21517 573738.04712 20.8 400 20110 CP-49 49 332006.47053 572540.05994 <.005 192 61111 CP-50 50 332528.77570 571324.87307 77.1 180 180 138112 CP-51 51 314596.64347 548744.60943 1.66 150 150 110113 CP-52 52 317892.68764 558787.86841 14.5 80 80 25114 CP-53 53 314917.84742 549635.70008 3.22 200 19.5 115 CP-54 54 327974.35803 569843.38534 4.45 116 CP-55 55 307593.64699 571108.64825 18.6 90 117 PWS-1 2310008 300878.52585 574144.16536 0.312 ?118 PWS-2 2250126 319918.82460 550711.74744 476 260119 PWS-3 2250126 319139.90580 551510.75233 268 268120 PWS-4 2250013 317658.12553 552362.90277 1.012 604 312121 PWS-5 2250013 317583.14715 552315.08428 0.731 270 245122 PWS-6 2250013 318206.49251 553573.22468 0.5 836 ?123 PWS-7 2250014 332653.40906 539932.19086 2.43 107 ?124 PWS-8 2310000 308870.58356 574415.07878 2.52 125 PWS-9 2310001 309266.50944 573774.34592 1.06 900 60126 PWS-10 2310001 309924.01311 574071.93735 5.88 173 ?127 PWS-11 2350003 295187.96655 589453.12219 448 ?128 PWS-12 2350003 295273.59668 589778.37950 555 420129 PWS-13 2250018 324985.11472 542920.03256 3.856 472 390130 PWS-14 2250019 315344.79106 564212.94271 242 142131 PWS-15 2250019 315345.29551 564204.03102 250 184132 PWS-16 2250021 332749.26561 536679.69731 0.8125 395 ?133 PWS-17 2250008 334682.99945 539248.25314 0.3 365 ?134 PWS-18 2250023 335631.97874 538847.14356 0.692 806 633135 PWS-19 2250023 336192.46697 538157.39531 1.43 406 ?

64

Table 7. Well Information for All Data Sources, continuedMapID

Number SITE_ID EASTING NORTHING Ave. Nitrate(mg/L) well depth casing

depthdepth to

water136 PWS-20 2250023 335464.24581 536509.02409 0.86 728 622137 PWS-21 2250023 334250.63029 538949.63766 1.33 715 622138 PWS-22 2250023 336334.83505 538406.00316 628 117139 PWS-23 2250045 315860.61761 550023.33969 2.928 1238 326140 PWS-25 2250045 314707.30527 550568.35946 141 PWS-26 2310005 327812.72740 572657.83068 3.261 250 233142 PWS-27 2310005 326683.11625 572716.43286 2.193 200 ?143 PWS-28 2250041 312342.55424 555977.91866 144 PWS-29 2250041 312364.40112 556085.12316 0.348 750 270145 PWS-30 2310006 304394.52382 583811.42138 0.994 670 ?146 PWS-31 2310006 304233.66696 583289.39330 1.852 467 ?147 PWS-32 2310007 297287.70265 574457.96578 460 323148 PWS-33 2310007 297372.58998 574550.80699 473 331149 PWS-34 2310007 298003.68533 574661.16364 600 340150 AG-1 9500101 336506.99507 540542.78068 3.3 425 425 275151 AG-2 9500201 325163.41722 562318.30726 6.7 115 115 62152 AG-3 9500301 339949.04309 538594.85353 1.45 450 450 350153 AG-4 9500401 317662.49293 553267.95318 0 154 AG-5 9500501 314066.44584 555631.94854 1.09 60 18 8155 AG-6 9500601 314835.89201 554479.99527 0 407 181 338156 AG-7 9500701 329052.62256 532863.68669 0.19 157 AG-8 9500801 309492.93838 559123.87997 2.15 80 38 21158 AG-9 9500901 327527.69620 559364.80285 0 175 175 95159 AG-10 9501001 339015.97251 540063.29206 0 325 18 160160 AG-11 9501101 326793.34120 561349.15807 0.975 640 640 13161 AG-12 9501201 310146.34832 570469.49651 1.45 405 405 300162 AG-13 9501301 326194.73810 562160.01433 9.3 163 AG-14 9501401 326226.67733 562086.83292 33.5 402 402 25164 AG-15 9501501 318618.49824 558036.90632 4.45 102 80 6165 AG-16 9501601 314441.99994 580490.04289 2.95 308 132166 AG-17 9501701 290990.32522 588021.87933 3.7 141 26 75167 AG-18 9501801 282371.97916 586845.48300 3.65 137 137 63168 AG-19 9501901 277363.39371 581616.27728 4.15 300 58 160169 AG-20 9502001 277455.11257 583030.30471 0 170 AG-21 9502101 283302.56623 593003.25803 1.1 220 220 154171 AG-22 9502201 331518.36841 556669.97632 9.7 172 AG-23 9502301 340351.25397 551243.17569 5.5 173 AG-24 9502401 346743.41155 552344.75586 0.155 378 378 260174 AG-25 9502501 285544.80269 590395.08908 1.5 128 33 25175 AG-26 9502601 293040.29757 593242.23755 4.15 57 19 2176 AG-27 9502701 328869.75439 573038.46286 3.1 177 AG-28 9502801 328886.38313 561830.82873 0.91 255 255 116178 AG-29 9502901 272955.41024 587181.59490 0 448 147 245179 AG-30 9503001 306643.52239 558057.42219 0 180 AG-31 9503101 296473.11835 577226.84538 1.95 181 AG-32 9503201 284981.82038 594262.99469 4.75 182 AG-33 9503301 301290.36069 587339.84604 0

65

Table 7. Well Information for All Data Sources, continuedMapID

Number SITE_ID EASTING NORTHING Ave. Nitrate(mg/L) well depth casing

depthdepth to

water183 AG-34 9503401 340513.60596 536390.08406 0.495 352 315 220184 AG-35 9503501 284069.74111 596396.83644 4.7 65 30 24185 AG-36 9503601 317151.08066 554164.96533 9.6 340 340 160186 AG-37 9503701 314736.36010 589578.17425 0 187 AG-38 9503801 320859.75228 598941.84671 1.1 430 29 270188 AG-39 9503901 327439.63016 583798.04509 1.8 154 154 70189 AG-40 9504001 311420.18828 592916.47637 0 190 AG-41 9504101 325309.57768 595391.43276 0.485 608 240 408191 AG-42 9504201 297490.42745 599064.36573 1.2 192 AG-43 9504301 315568.74400 565619.63176 14.5 135 138 46193 AG-44 9504401 300954.62294 574158.37033 0 250 250 51194 AG-45 9504501 307685.37026 568769.12411 2 323 54 282195 AG-46 9504601 327074.32267 551655.23013 0 196 AG-47 9504701 307886.23607 592754.69860 0 401 370197 AG-48 9504801 305464.92205 597767.83225 0.295 605 410 432198 AG-49 9504901 297224.28266 594617.25879 2.1 550 550 416199 AG-50 9505001 297588.24034 594320.36285 0.35 200 AG-51 9505101 295697.58040 590001.05044 7.05 74 58 41201 AG-52 9505201 271096.01104 594398.82841 6.5 50 38 17202 AG-53 9505301 274601.27481 593251.93745 4.1 238 238 135203 AG-54 9505401 278189.62796 579759.40072 11.5 204 AG-55 9505501 274653.50269 586909.33498 0 343 343 260205 AG-56 9505601 316254.10567 557822.49478 4.2 325 38 -2206 AG-57 9505701 308933.50819 570302.61319 4.45 207 AG-58 9505801 296875.84815 588353.17114 2.95 230 38 105208 AG-59 9505901 333035.06669 541166.01064 0 280 280 75209 AG-60 9506001 333159.91298 542284.48224 4.4 89 82 44210 AG-61 9506101 321388.54126 557897.91525 2.6 211 AG-62 9506201 323563.78376 594340.99698 1.3 212 AG-63 9506301 336341.00716 541010.80073 2.2 213 AG-64 9506401 324995.05918 549713.62623 1 215 115 142214 AG-65 9506501 324593.05402 544021.96147 0.991 215 AG-66 9506601 300409.14623 567796.35421 0.13 216 AG-67 9506701 334611.18302 541085.79435 0 217 AG-68 9506801 346736.17641 556214.91117 0.17 218 AG-69 9506901 337309.09465 565659.94016 0.59 230 280 87219 AG-70 9507001 333007.40655 552330.85508 14.5 400 60 29220 AG-71 9507101 334609.30568 541073.61456 0 410 400 183221 AG-72 9508601 329422.84106 562497.49518 15

66

APPENDIX F

68

APPENDIX F. WELL LOG DETAILS

Table 11. Casing and Seal Depth Data for Camas Prairie and Dept. of Ag. Wells

Number SITE_ID Nitrate(mg/L)

TotalDepth

StaticW.L.

DepthFlowEnc.

Casing: 8inch

FromTo

Casing: 6inch

FromTo

Casing: 4inch

FromTo Seal Type

Amt(sacks or

lbs

Seal:From To Screen:

From To Comments CasingDepth

CP-1 1 8.35 495 276 - -2 18 5 495 B 0 18 475 495 495CP-2 2 0.318 600 390 560 -2 58 - B (dry) 500 0 50 560 600 600CP-3 3 36.8 402 25 - -1 57 5 402 Cement grout - 0 57 362 402 *well seal can

be removed402

CP-4 4 19.3 275 61 - -2 38 - B - 0 22 - 38CP-5 5 3.57 575 350 - -2 18 - B - 0 18 - 18CP-6 6 5.48 358 190 234 -2 29 B (dry) 800 0 30 318 358 358CP-7 7 7.02 260 35 *well log is

vague

CP-8 8 7.83 175 50 -1 19 6 175 Pudding Clay - 0 20 - 175CP-9 9 0.112 202 53 - -2 18 5 202 B (top pour) 150 0 18 180 202 202

CP-10 10 12.2 187 ? -1.5 171 Cement grout 148 135 147 170.5CP-11 11 <.005 no well log CP-12 12 0.005 215 142 -1.5 116 Pudding Clay 115 115CP-13 13 9.46 no well log CP-14 14 7.48 115 62 -1 46 B 45 80 115 *well seal can

be removed115

CP-15 15 2.83 no well log CP-16 16 0.968 640 12 - -2 168 100 640 B (top pour) 350 0 18 600 640 *seal was tested 640CP-17 17 3.24 500 74 450 -2 38 B (dry) 500 0 40 460 500 500CP-18 18 <.005 no well log CP-19 19 13.9 no well log CP-20 20 9.8 82 ? - -2 18 10 82 B 18 60 80 82CP-21 21 6.19 203 10 - -2 38 B 20 38CP-22 22 0.338 400 200 350 0 18 B (top pour) 2 sacks 0 18 350 400 *removable

well cap400

CP-23 23 1.84 75 10 65 2 138 B (dry) 350 0 25 50 70 138CP-24 24 10.8 *no well log CP-25 25 5.42 *no well log CP-26 26 3.77 135 40 - -2 44 15 135 B (top pour) 750 0 44 115 135 135CP-27 27 <.005 340 ? -2 129 120 340 B (top pour) 300 0 21 ? 340 *well log was

cut off340

CP-28 28 17.5 *no well log CP-29 29 2.2 200 71 170 -2 18 B (dry) 200 0 20 160 200 200CP-30 30 2.66 255 116 - -2 18 15 255 B (top pour) 150 0 18 225 255 255

69

Table 11. Casing and Seal Depth Data for Camas Prairie and Dept. of Ag. Wells, continued.

Number SITE_ID Nitrate(mg/L)

TotalDepth

StaticW.L.

DepthFlowEnc.

Casing: 8inch

FromTo

Casing: 6inch

FromTo

Casing: 4inch

FromTo Seal Type

Amt(sacks or

lbs

Seal:From To Screen:

From To Comments CasingDepth

CP-31 31 8.25 *no well log CP-32 32 8.45 * no well log CP-33 33 2.09 * no well log CP-34 34 <.005 * no well log CP-35 35 6.91 * no well log CP-36 36 2.15 142 46 - -2 138 ? 30 98 138 138CP-37 37 3.63 310 60 - -2 76 10 300 B 76 330 370 300CP-38 38 3.62 325 2 - -2 38 B (top pour) 450 0 36 295 325 *artesian

pressure = 2.3lb

325

CP-39 39 3.12 400 44 350 -2 18 B (dry) 250 0 20 260 400 400CP-40 40 2.29 200 90 185 -2 18 B (dry) 200 0 20 180 200 200CP-41 41 3.17 327 6 - 2 79 7 327 B 200 327 327CP-42 42 5.4 180 50 - -1 19 9 180 B 19 180CP-43 43 11.8 *no well log CP-44 44 4.43 *no well log CP-45 45 1.87 405 300 - -1 19 10 405 B 18 345 405 405CP-46 46 2.72 500 340 450 -2 38 B (dry) 600 0 30 440 480 480CP-47 47 <.005 102 20 - -2 103 B 19 70 103 *well seal can

be removed103

CP-48 48 20.8 *no well log CP-49 49 <.005 *no well log CP-50 50 77.1 180 138 - -2 18 12 180 B 18 180CP-51 51 1.66 150 110 135 -2 18 B (dry) 200 0 20 120 150 150CP-52 52 14.5 80 25 - -2 18 10 80 B (top pour) 150 0 18 50 80 80CP-53 53 3.22 200 ? - -1.5 19.5 B 19.5CP-54 54 4.45 *no well log CP-55 55 18.6 *no well log

AG-1 9500101 3.3 425 275 - -2 18 5 425 B (top pour) 150 0 18 390 425 425

AG-2 9500201 6.7 115 62 -1 46 B 45 80 115 115

AG-3 9500301 1.45 450 350 - -2 18 4 268 4 450 B 18 410 450 450

AG-4 9500401 0 no well log

AG-5 9500501 1.09 60 8 - -2 18 B 18 - 18

AG-6 9500601 0 407 338 - -2 18 B 18 - 181

AG-7 9500701 0.19 no well log

AG-8 9500801 2.15 80 21 - -2 38 B 20 38

70

Table 11. Casing and Seal Depth Data for Camas Prairie and Dept. of Ag. Wells, continued.

Number SITE_ID Nitrate(mg/L)

TotalDepth

StaticW.L.

DepthFlowEnc.

Casing: 8inch

FromTo

Casing: 6inch

FromTo

Casing: 4inch

FromTo Seal Type

Amt(sacks or

lbs

Seal:From To Screen:

From To Comments CasingDepth

AG-9 9500901 0 175 95 - -2 49 35 175 B (top pour) 9 0 45 160 175 175AG-10 9501001 0 325 160 - -2 18 B 18 - 18AG-11 9501101 0.975 640 13 -2 168 100 640 B (top pour) 350 0 18 600 640 *seal was tested

with airpressure 640

AG-12 9501201 1.45 405 300 - -1 19 10 405 B 18 345 405 405

AG-13 9501301 9.3 no well log

AG-14 9501401 33.5 402 25 - -1 57 5 402 Cement Grout 57 362 402 402

AG-15 9501501 4.45 102 6 - -2 82 Pudding Clay 30 48 80 80AG-16 9501601 2.95 308 132 - *well log is

missing a lot

AG-17 9501701 3.7 141 75 - -2 26 B 20 - 26

AG-18 9501801 3.65 137 63 - -2 30 10 137 B 30 97 137 137

AG-19 9501901 4.15 300 160 -2 58 B 22 58

AG-20 9502001 0 no well log

AG-21 9502101 1.1 220 154 - -2 25 20 220 B (top pour) 500 5 23 200 220 220

AG-22 9502201 9.7 no well log

AG-23 9502301 5.5 no well log

AG-24 9502401 0.155 378 260 - -2 103 4 378 B 18 320 378 378

AG-25 9502501 1.5 128 25 - -2 33 B 18 - 33

AG-26 9502601 4.15 57 2 - 2 19 B 20 - 19

AG-27 9502701 3.1 no well log

AG-28 9502801 0.91 255 116 - -2 18 15 255 B (top pour) 150 0 18 225 255 255

AG-29 9502901 0 448 245 - 1 147 B 104 147

AG-30 9503001 0 no well log

AG-31 9503101 1.95 no well log

AG-32 9503201 4.75 no well log

AG-33 9503301 0 no well log

AG-34 9503401 0.495 352 220 -2 78 15 315 B 22 315

AG-35 9503501 4.7 65 24 - 1 30 B 30 30

AG-36 9503601 9.6 340 160 - -2 91 80 340 B 19 320 340 340AG-37 9503701 0 no well log

AG-38 9503801 1.1 430 270 - -1.5 29 Pudding Clay 29 29

AG-39 9503901 1.8 154 70 -2 56 6 154 B 19 108 154 154

71

Table 11. Casing and Seal Depth Data for Camas Prairie and Dept. of Ag. Wells, continued.

Number SITE_ID Nitrate(mg/L)

TotalDepth

StaticW.L.

DepthFlowEnc.

Casing: 8inch

FromTo

Casing: 6inch

FromTo

Casing: 4inch

FromTo Seal Type

Amt(sacks or

lbs

Seal:From To Screen:

From To Comments CasingDepth

AG-40 9504001 0 no well log

AG-41 9504101 0.485 608 408 1 94 1 240 Pudding Clay 92 - 240

AG-42 9504201 1.2 no well log

AG-43 9504301 14.5 135 46 - -2 138 B 30 98 138 138AG-44 9504401 0 250 51 225 2 198 B (dry) 400 0 40 210 250 250

AG-45 9504501 2 323 282 - 1.5 54 Pudding Clay 54 54

AG-46 9504601 0 no well log

AG-47 9504701 0 401 370 no casing orwell seal, rotarymethod

AG-48 9504801 0.295 605 432 - 1 26 3 410 Pudding Clay 26 555 605 5in casing from405 to 605

410

AG-49 9504901 2.1 550 416 525 -2 56 B (dry) 800 0 56 510 550 550

AG-50 9505001 0.35 no well log

AG-51 9505101 7.05 74 41 - -2 58 B (top pour) 500 1 19 - 58

AG-52 9505201 6.5 50 17 -2 38 Pudding Clay 38 38

AG-53 9505301 4.1 238 135 - -1 26 9 238 B 26 190 238 238

AG-54 9505401 11.5 no well log

AG-55 9505501 0 343 260 - 28 228 3 343 B (overbore?) 8 0 18 300 34310in casingfrom -1 to 18 343

AG-56 9505601 4.2 325 -2 - -2 38 B (top pour) 450 0 36 295 325 Artesianpressure = 2.3lbs

38

AG-57 9505701 4.45 no well log

AG-58 9505801 2.95 230 105 - -2 38 B 21 - 38

AG-59 9505901 0 280 75 - -2 18 3 280 B 18 220 280 280

AG-60 9506001 4.4 89 44 - -2 82 B 30 82

AG-61 9506101 2.6 no well log

AG-62 9506201 1.3 no well log

AG-63 9506301 2.2 no well log

AG-64 9506401 1 215 142 - -1.5 116 Pudding Clay 115 115

AG-65 9506501 0.991 no well log

72

Table 11. Casing and Seal Depth Data for Camas Prairie and Dept. of Ag. Wells, continued.

Number SITE_ID Nitrate(mg/L)

TotalDepth

StaticW.L.

DepthFlowEnc.

Casing: 8inch

FromTo

Casing: 6inch

FromTo

Casing: 4inch

FromTo Seal Type

Amt(sacks or

lbs

Seal:From To Screen:

From To Comments CasingDepth

AG-66 9506601 0.13 no well log

AG-67 9506701 0 no well log

AG-68 9506801 0.17 no well log

AG-69 9506901 0.59 230 87 - -2 18 20 280 B (top pour) 2000 19 160 180 280

AG-70 9507001 14.5 400 29 - -2 56 B (top pour) 3000 18 50 60 60

AG-71 9507101 0 410 183 - -2 18 10 400 B (top pour) 2460 18 390 410 400

AG-72 9508601 15 no well log


Recommended