61
& Growing CLEARWATER SEAFOODS INCORPORATED 2016 MANAGEMENT DISCUSSION AND ANALYSIS

& GrowingCLEARWATER SEAFOODS INCORPORATED 2016 MANAGEMENT DISCUSSION AND ANALYSIS
1 | P a g e
Management Discussion and Analysis
Table of Contents Page # Clearwater overview 4 Selected annual information Mission, value proposition and strategies Capability to deliver results Key performance indicators Explanation of 2016 results
12 5 9
15 14
Capital structure 31 Liquidity 36 Commitments 41 Outlook 43 Risks and uncertainties 45 Critical accounting policies 49 Related party transactions 52 Summary of quarterly results 54 Definitions and reconciliations 55 Corporate information 63
2 | P a g e
MANAGEMENT’S DISCUSSION AND ANALYSIS This Management’s Discussion and Analysis (“MD&A”) was prepared effective March 8, 2017. The Audit Committee and the Board of Directors of Clearwater Seafoods Incorporated (“Clearwater”, or “the Company”) have reviewed and approved the contents of this MD&A, the financial statements and the 2016 fourth quarter news release. This MD&A should be read in conjunction with the 2016 annual financial statements and the 2016 Annual Information Form, which are available on Sedar at www.sedar.com as well as Clearwater’s website, www.clearwater.ca. COMMENTARY REGARDING FORWARD-LOOKING STATEMENTS This report may contain “forward-looking information” as defined in applicable Canadian securities legislation. All statements other than statements of historical fact, including, without limitation, statements regarding future plans and objectives of Clearwater, constitute forward-looking information that involve various known and unknown risks, uncertainties, and other factors outside management’s control. Forward-looking information is based on a number of factors and assumptions which have been used to develop such information but which may prove to be incorrect, including, but not limited to, total allowable catch levels, selling prices, weather, exchange rates, fuel and other input costs. There can be no assurance that such information will prove to be accurate and actual results and future events could differ materially from those anticipated in such forward-looking information. In addition, this report contains forward-looking information relating to Clearwater’s acquisition of Macduff Shellfish Group Limited (“Macduff”), financing of the acquisition, enhancement of Clearwater’s scale of operations and accelerated growth, as well as expectations regarding sales, adjusted EBITDA, adjusted earnings and leverage. This forward-looking information is based on a number of factors and assumptions which have been used to develop such information but which may prove to be incorrect including, but not limited to, Clearwater’s ability to successfully integrate or grow the business of Macduff as planned, total allowable catch levels, selling prices, weather, exchange rates, fuel and other input costs. There can be no assurance that such information will prove to be accurate and actual results and future events could differ materially from those anticipated in such forward-looking information. Risk factors that could cause actual results to differ materially from those indicated by forward-looking information include risks and uncertainties related to: (i) the timing and extent of changes in interest rates, prices and demand, and (ii) economic conditions and related uncertainties. For additional information with respect to risk factors applicable to Clearwater, reference should be made to Clearwater's continuous disclosure materials filed from time to time with securities regulators, including, but not limited to, Clearwater's Annual Information Form. The forward-looking information contained in this report is made as of the date of this release and Clearwater does not undertake to update publicly or revise the forward-looking information contained in this report, whether as a result of new information, future events or otherwise, except as required by applicable securities laws. No regulatory authority has approved or disapproved the adequacy or accuracy of this report.
3 | P a g e
NON-IFRS MEASURES This MD&A makes reference to several non-IFRS measures to supplement the analysis of Clearwater’s results. These measures are provided to enhance the reader’s understanding of our current financial performance. They are included to provide investors and management with an alternative method for assessing our operating results in a manner that is focused on the performance of our ongoing operations and to provide a consistent basis for comparison between periods. These non-IFRS measures are not recognized measures under IFRS, and therefore they may not to be comparable to similar measures presented by other companies. Management believes that in addition to sales, net earnings and cash provided by operating activities, these non-IFRS measures are useful terms from which to determine Clearwater’s ability to generate cash for investment in working capital, capital expenditures, debt service, income tax and dividends. These non-IFRS measures include gross margin, adjusted EBITDA, adjusted earnings, free cash flows, leverage, and return on assets. Gross Margin Gross margin consists of sales less cost of goods sold which includes harvesting, distribution, direct manufacturing costs, manufacturing overhead, certain administration expenses and depreciation related to manufacturing operations. Adjusted Earnings Before Interest, Tax, Depreciation and Amortization (“Adjusted EBITDA”) Adjusted EBITDA is defined as EBITDA excluding extraordinary, non-operating, non-recurring or non-routine items that are unusual and are deemed not to be a part of normal operations of the business. Items that are excluded from adjusted EBITDA include restructuring and reorganization expenses, gains and losses on investment activities, costs associated with acquisitions to the extent not capitalized, financing and refinancing costs, net gains on insurance claims and stock based compensation. In addition, recurring accounting gains and losses on foreign exchange (other than realized gains and losses on forward exchange contracts), have been excluded from the calculation of Adjusted EBITDA. Unrealized gains and losses on forward exchange contracts relate to economic hedging on future operational transactions and by adjusting for them, the results more closely reflect the economic effect of the hedging relationships in the period to which they relate. Adjusted Earnings Adjusted Earnings is defined as earnings excluding items such as refinancing and reorganization costs, acquisition related costs and recurring accounting gains and losses on foreign exchange (other than realized gains and losses on forward exchange contracts). Unrealized gains and losses on forward exchange contracts relate to economic hedging on future operational transactions and by adjusting for them, the results more closely reflect the economic effect of the hedging relationships in the period to which they relate. In addition adjustments to stock based compensation have been excluded from Adjusted Earnings as they do not relate to the general operations of the business. Free Cash Flow Free cash flow is defined as cash flows from operating activities, less planned capital expenditures (net of any borrowings of debt designated to fund such expenditures), scheduled payments on long-term debt and distributions to non-controlling interests. Items excluded from the free cash flow include discretionary items such as debt refinancing and repayments changes in the revolving loan and discretionary financing and investing activities.

4 | P a g e
Leverage Leverage calculations are calculated by dividing the current and preceding annual adjusted EBITDA (excluding non-controlling interest) by the total debt (excluding non-controlling interest) on the balance sheet adjusted for cash reserves (excluding non-controlling interest). Return on assets Return on assets is defined as the ratio of adjusted earnings before interest and taxes (“EBIT”) to average total quarterly assets including all working capital assets. Refer to non-IFRS measures reconciliations for further information. CLEARWATER OVERVIEW Leading Global Provider of Wild-Caught Shellfish Clearwater is North America’s largest vertically integrated harvester, processor and distributor of premium shellfish. With harvesting operations in Canada, Argentina and the UK, Clearwater is recognized for its consistent quality, wide diversity, and reliable delivery of premium, wild, eco-labeled seafood, including scallops, lobster, clams, coldwater shrimp, crab and groundfish with approximately 93 million pounds sold in 2016. Powerful Industry Fundamentals Global demand for premium wild caught seafood among aging boomers and a rising middle class in the Asian-Pacific region is outpacing resource supply. This in combination with conservatively managing seafood fisheries to protect the long term health of the industry is creating new opportunities from the rising demand for high-quality sustainable seafood. Clearwater’s Vertical Integration Creates Barriers To Entry and Sustainable Competitive Advantage Clearwater is the largest holder of shellfish quotas and licenses within Canada and maintains the widest selection of Marine Stewardship Council (“MSC”)-certified species of any shellfish harvester worldwide. These quotas are a key barrier to entry as regulatory authorities strictly control access and rarely grant new licenses. In addition, the financial resources to acquire and harvest fishing quotas create barriers to entry. Clearwater continues to create competitive advantage through investment in R&D, technology and intellectual property that has resulted in state-of-the-art factory vessels with harvesting and processing technologies that enable high productivity and frozen-at-sea products that deliver superior tasting and higher quality products. Clearwater maintains a global, direct sales force that is capable of interacting with and selling directly to diverse markets worldwide. Our channel mix in food service, retail and other food industries ensures a diverse community of customers and we have no single customer representing more than 5% of total sales. The vertical integration of Clearwater’s quotas and licences, sustainable fishing practices, at-sea processing of shellfish, onshore processing and distribution network and global sales forces combine to make Clearwater the industry leader in shellfish. Proven and Experienced Leadership Team Clearwater continues to build upon its world class capabilities in quality control and food safety, operations, new product development and leadership through the addition of key resources to complement its existing team. Through its deep industry knowledge and talent, our team will continue to deliver on our operational and financial growth opportunities.
5 | P a g e
CLEARWATER’S MISSION, VALUE PROPOSITION AND STRATEGIES Mission Clearwater’s mission is to build the world’s most extraordinary, wild seafood company, dedicated to sustainable seafood excellence. We define:
� “extraordinary” as sustainable, growth in revenue, margins, adjusted EBITDA, free cash flows and the creation of long term shareholder value;
� “wild seafood” as premium wild shellfish, including our core species (scallops, lobster, clams,
langoustines and coldwater shrimp); and
� “sustainable seafood excellence” as delivering best-in-class, quality, food safety, traceability and certified sustainability.
We believe that the fulfillment of this mission will result in extraordinary value creation for shareholders, customers, employees and for the communities in which we work and live. Value Proposition At Clearwater, we have a passion for wild seafood and strive to deliver a highly differentiated and competitively advantaged value proposition to a global customer base. Key elements of Clearwater’s unique value proposition are:
� Great tasting, nutritious, highest quality, frozen-at-sea, premium shellfish.
� Expertise in premium shellfish science, harvesting, processing and logistics technology to ensure quality and safety from “ocean to plate”.
� Marine Stewardship Council (“MSC”) certification for sustainability of species to ensure both the traceability and long-term health of our wild resource.
� Competitively advantaged global customer service with local market understanding and insight.
� Scale in license and quota ownership guaranteeing exclusive and stable supply to service even the largest global retail and food service customers.
Strategies Clearwater’s six core strategies are designed to strengthen a competitive and differentiated value proposition. They are:
1. Expanding Access to Supply - Expanding access to supply of core species and other complementary, high demand, premium, wild and sustainably harvested seafood through improved utilization and productivity of core licenses as well as acquisitions, partnerships, joint ventures and commercial agreements.

6 | P a g e
• Modernizing Our Fleet In 2016, Clearwater announced plans to invest $70 million in another new and innovative vessel for its Canadian clam fleet. Entering service in early 2018, The Anne Risley is a sister-ship to Clearwater’s new clam vessel, the Belle Carnell and will replace a veteran clam vessel that has served the company well for 28 years. Like the “Belle,” The Anne Risley will be a state-of-the-art harvest platform and frozen-at-sea factory providing significant productivity and efficiency improvements. This new investment completes Clearwater’s fleet modernization program, positioning the company to execute its extraordinary growth plans over the next five years. Following the launch of the Anne Risley, Clearwater does not anticipate any major new vessel capital expenditures until 2021.
• Largest Holder of Shellfish Licenses and Quotas in Canada Operating from ocean-to-plate, Clearwater is the largest holder of shellfish licenses and quotas in Canada, including Arctic Surf Clam, Offshore Lobster, Canadian Sea Scallops and Coldwater Shrimp, in addition to Argentine Scallops in Argentina. Licensing, quotas and strategic procurement provide Clearwater with a consistent and renewable supply of premium, wild-caught, sustainably-harvested seafood for distribution around the globe. In 2017, Clearwater expects to harvest all of its quotas and secure access to additional supply through harvest and procurement contracts, growing overall volumes, including Macduff, by more than 10 per cent versus 2016.
• Macduff Shellfish Group
Macduff is now fully integrated. Together, both companies will continue to grow as one of the world’s leading vertically-integrated harvesters, processors and distributors of premium, wild shellfish. Closely complementing Clearwater’s product offerings, Macduff provides access to an additional 7,000 metric tons of premium, wild-caught, safe and traceable shellfish, including King and Queen Scallops, Langoustine, Brown Crab and Whelk. In addition to being a leading harvester, Macduff is one of the largest processors of wild shellfish in the UK with tremendous opportunity for future growth.
2. Target Profitable & Growing Markets, Channels & Customers – Clearwater targets growing
markets, consumers, channels and customers on the basis of size, profitability, demand for eco-label seafood and ability to win. Our focus is to win in key channels and with customers that are winning with consumers.
• Growing Globally - In Every Region In Europe, Clearwater expects to benefit from increased sales of all Scallop species, Crab, Processed Lobster, Langoustine and the launch of Arctic Surf Clams into most major European markets. In addition, the early ratification of the Comprehensive European Trade Agreement (“CETA”) by the European Parliament will remove millions of dollars of tariffs on Clearwater’s Canadian seafood exports to the largest seafood import market in the world. In the Americas, Clearwater expects to continue to benefit from duty-free access to the US market by profitably growing volume in virtually every core Clearwater species and expanding the distribution of Macduff products, including Langoustine and Brown Crab. In Arctic Surf Clams, Clearwater will expand distribution within the sushi, Asian grocery and processor segments with new value-added formats.

7 | P a g e
In Asia, Clearwater will continue to grow sales and distribution of all species with a particular emphasis on Arctic Surf Clam, Live Lobster, Brown Crab and Whelk. In China, Clearwater expects to benefit from the expansion of foodservice distribution to more Tier 2 cities, retail distribution expansion in Tier 1 cities, as well as the rapid growth of the company’s China Ecommerce partnerships with Alibaba’s Tmall and JD.com. Both ecommerce platforms represent a huge opportunity for Clearwater to capitalize on China’s booming $830 billion online market (which is growing at over 38 per cent), while providing Chinese consumers with the ability to purchase authentic Clearwater products. As the number of online shoppers in China increases, Clearwater will continue to leverage ecommerce to target profitable and growing markets, channels and customers.
• Channels and Consumers Clearwater boasts an experienced global sales force selling directly to a diverse group of customers in over 40 countries. Supplying to retailers, foodservice operators and distributors, processors, importers and wholesalers throughout the world, products are sold globally under Clearwater, Macduff and other popular private label brands, with no single customer representing more than seven per cent of total sales revenue.
3. Innovate and Position Products to Deliver Superior Customer Satisfaction and Value – We
continue to work with customers on new products and formats as we innovate and position our premium seafood to deliver superior satisfaction and value that’s relevantly differentiated on the dimensions of taste, quality, safety, sustainability, wellness, convenience and fair labour practices.
• Frozen Arctic Surf Clam Sushi-Ready Slices Clearwater announced a new investment in a ready to eat “prime cut” clam line to support expanded distribution and growth of the Arctic Surf Clam business in Europe and North America. Trimmed, sliced and cleaned, Frozen Arctic Surf Clam Sushi Ready Slices provide an ideal ready-to-use format for foodservice operators, while eliminating preparation time and cost. This innovative investment allows Clearwater to continue to diversify its markets to build the value of Arctic Surf Clam and grow its consumption globally.
4. Increase Margins by Improving Price Realization and Cost Management - Leverage the scarcity of seafood supply and increasing global demand, in addition to continuing to invest in, innovate and adopt state-of-the-art technology, systems and processes.
• Ocean Floor Mapping Clearwater continues to be a world leading shellfish harvester, with a fleet of vessels now fully equipped with habitat mapping, innovative gear and geographic positioning technology. Ocean floor mapping allows for increased productivity and more valuable use of Clearwater’s fleet, targeting only those areas that can be fished most efficiently, while leaving sensitive habitats undisturbed.
• Fleet Based Innovation – Automatic Shucking Technology Clearwater continues to make investments in innovative technology and solutions to deliver superior products to customers around the globe. This includes Clearwater’s patented onboard Automatic Scallop Shucking technology, enabling the production of fresh frozen-at-sea scallops. Harvested and frozen within an hour of catch, frozen-at-sea (FAS) scallops deliver a superior tasting and higher quality product to Clearwater’s discerning customers.
8 | P a g e
• Clam Dredging Technology Clearwater has implemented a state-of-the-art clam dredging technology for its Canadian clam fleet, which has led to significantly higher catch rates, improved productivity and reduced the company’s carbon footprint. This specialized technology also reduced Clearwater’s number of clam vessels from 4 to 3, avoiding $70 million in capital expenditures and millions of dollars in operating costs.
5. Pursue and Preserve the Long Term Sustainability of Resources on Land and Sea - As a leading global supplier of wild-harvested seafood, sustainability remains at the core of our business and our mission. Investing in the long-term health and the responsible harvesting of the oceans and the bounty is every harvester’s responsibility and the only proven way to ensure access to a reliable, stable, renewable and long-term supply of seafood. Sustainability is not just good business, like innovation it’s in our DNA. That’s why Clearwater has been recognized by the Marine Stewardship Council (“MSC”) as a leader in sustainable harvesting for wild fisheries and how Clearwater can offer the widest selection of sustainably-certified species of any seafood harvester worldwide.
• Commitment to Sustainability
Together, Clearwater and Macduff continue to make investments in science and technology to ensure the sustainable harvesting of seafood. Clearwater offers the widest selection of MSC certified species of any shellfish harvester worldwide. As awareness grows for sustainable seafood products, consumers can be assured that our products originate from fisheries that meet MSC’s strict environmental standards for sustainable and well-managed fisheries.
6. Build Organizational Capability, Capacity & Engagement – We attract, train and retain the best
talent to build business system and process excellence company-wide.
• In 2016, Clearwater continued to invest in talent and programs to build world-class capabilities through-out its organization.
CAPABILITY TO DELIVER RESULTS Clearwater's revenues and earnings are dependent primarily on its ability to harvest, purchase, and market shellfish. Supply is dependent to a large extent on the annual total allowable catch (“TAC”) for each species. The annual TAC is related to the health of the stock of the particular species as determined by the relevant government fishery management organizations. All stocks are managed sustainably providing assurance of the long term availability of the resource, however annual fluctuations in supply of a natural resource are normal. Short term impacts of such fluctuations can normally be offset within Clearwater’s species portfolio and/or by making adjustments within each business unit. The primary shellfish stocks that Clearwater harvests are Canadian sea, Argentine and UK scallops, clams, lobster and coldwater shrimp, which are harvested in offshore fisheries that have a limited number of participants. Clearwater harvests scallops and clams with its own vessels. Clearwater obtains its lobster and coldwater shrimp through harvesting with its own vessels and through purchases from independent fishermen. Clearwater obtains its supply of crab, whelk, and langoustines through purchases from independent fishermen.

9 | P a g e
� The Canadian sea scallop resource typically fluctuates within a stable range. Clearwater anticipates TACs within the normal range in upcoming years. Clearwater lands virtually all its sea scallop quota each year and may from time to time harvest quotas for other industry participants or purchase raw material supply from other industry participants.
� The Arctic surf clam resource is stable. Clearwater has quota allocations on both Banquereau
Bank and the Grand Banks in Canada. Total annual landings are based upon the harvesting capacity of our three vessels. 2016 marked the first time in the history of these fisheries that the company harvested the entire quota. This was achieved through its significant investments in a new factory-at-sea vessel which was launched in the fourth quarter of 2015 and proprietary investments in harvesting technologies.
� The Argentine scallop volumes are stable and are expected to be in line or modestly higher than recent years. Argentina is the first scallop fishery in the world to have earned the rigorous Marine Stewardship Council (MSC) independent certification.
� Coldwater shrimp - The Northern shrimp TAC has declined from historic highs over the last five years and is expected to continue to decline at a similar rate over the next five years as the cod species, a natural predator of shrimp, return to this fishery. Clearwater holds access to quotas directly through licences and through long term harvesting agreements. Clearwater procures shrimp from the inshore fishery for its cooked and peeled business and supplements this with raw material from its offshore vessels.
� The offshore Canadian lobster resource is healthy with a consistent offshore TAC. Clearwater harvests all of its lobster quota each year. During 2016, Clearwater purchased approximately 80% of its lobster from inshore lobster fishermen. The quality of lobster has seen a decline in this fishery as harvesters move further offshore, resulting in higher mortality.
� The UK scallop landings are stable, with total 2016 landings coming down slightly from the recent high levels. The fishery is managed under a combination of effort days, gear regulation and minimum landing size which vary by area.
Clearwater maintains the largest, most modern fleet of factory freezer vessels in Canada together with vessels that are used to harvest Clearwater's offshore lobster and to complete research and development. The Company also operates a fleet of 13 scallop trawlers in the UK. Clearwater grades investments in property, plant, equipment and licenses as either return on investment (“ROI”) or maintenance capital. Significant expenditures that are expected to have a return in excess of the cost of capital are classified as ROI, and all refits and expenditures that are expected to return less than the average cost of capital are classified as maintenance. Clearwater spent the following on capital expenditures and repairs and maintenance over the last three years:
10 | P a g e
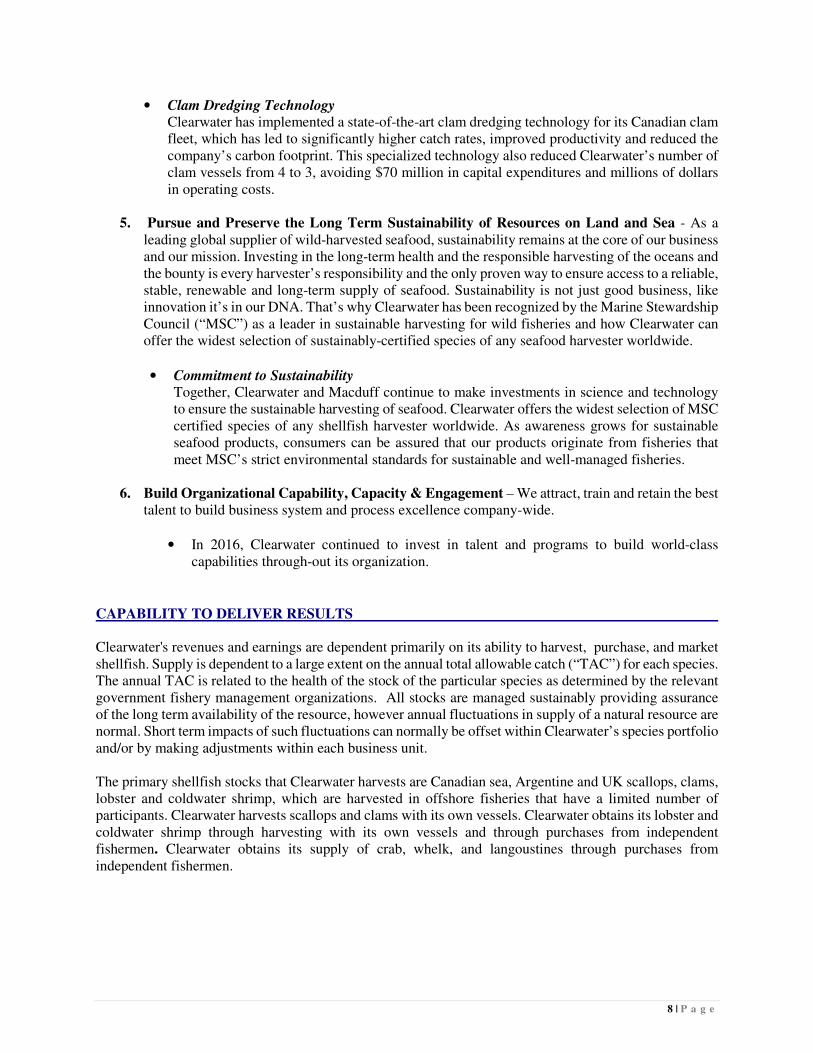
(In 000’s)
For the years ended December 31 2016 2015 2014 Total
Vessels $ 44,343 $ 49,748 $ 72,700 $ 166,791
Plants and other 11,989 13,642 10,609 36,240
$ 56,332 $ 63,390 $ 83,309 $ 203,031
Return on investment capital $ 31,913 $ 50,370 $ 60,417 $ 142,700
Maintenance capital 24,419 13,019 22,892 60,330
$ 56,332 $ 63,389 $ 83,309 $ 203,030
Maintenance capital $ 24,418 $ 13,019 $ 22,892 $ 60,329
Repairs and maintenance expense 24,135 19,714 14,149 57,998
$ 48,553 $ 32,733 $ 37,041 $ 118,327
Depreciation/Amortization $ 38,634 $ 29,732 $ 23,753 $ 92,119
Maintenance spending as a % of depreciation 125.7% 110.1% 155.9% 128.5%
In 2016 Clearwater invested $56.3 million in capital expenditures of which $25.9 million of investment capital related to a replacement clam harvesting vessel and $24.2 million of maintenance capital related to vessel refits and $6.2 million to improve operational efficiencies in our plants and information systems. In 2015 Clearwater invested $63.4 million in capital expenditures, excluding the acquisition of Macduff. Of these amounts, $25.9 million related to the construction of the Belle Carnell, a new clam vessel, which had a total cost of approximately $65 million and was fully operational in late 2015, $7.1 million for the purchase and conversion of a research vessel, $18.7 million related to maintenance capital investments and $11.7 million to improve operational efficiencies in our plants and information systems. In 2014 Clearwater had a record investment in capital expenditures of $83.3 million. Capital expenditures included $36.4 million related to the construction of the Belle Carnell vessel. Also in 2014, Clearwater invested $16.7 million to complete the conversion of an Argentine scallop vessel which began harvesting early in the first quarter of 2015. Additional investments in 2014 included $7.3 million for an enterprise resource planning system, $18.2 million on refits including $12.5 million for a life extending refit of a shrimp vessel and $4.7 million on other planned maintenance. In addition to the annual amounts capitalized above, Clearwater historically has spent and expensed on average about $19.3 million a year over the past three years on the maintenance of its fleet and processing plants. This reflects Clearwater’s commitment to ensuring that the assets are kept in top condition, enabling it to harvest and process its allowable catch efficiently and providing sufficient capacity. Clearwater’s largest fleet investments are in its nine factory vessels located within Canada and Argentina. These vessels are used in the harvesting of Canadian scallops, Argentine scallops, shrimp and clams. Of the nine factory vessels:
� Two are used to harvest shrimp and are on average 23 years old. These vessels have a capacity to harvest 14,000 to 18,000 metric tons of our 20,000 metric ton quota and our entire 1,900 metric ton turbot quota in a ready for market form. One of the vessels was built in 1985 and in 2014 Clearwater invested $12.5 million in a late-life refit, thereby extending its useful life.

11 | P a g e
Four are used to harvest sea and Argentine scallops with the sea scallop vessels being on average 18 years old and the Argentine scallop vessels being on average 21 years old. In 2014, an idle vessel was converted from harvesting sea scallops to harvesting Argentine scallops and began operations in early 2015.
� Three of Clearwater’s vessels are used to harvest clams and are on average 15 years old. In
2015, Clearwater completed construction of a new clam harvesting vessel which was operational in the third quarter of 2015 with product reaching the market in the fourth quarter of 2015. In 2016, Clearwater began the construction of a new clam harvesting vessel which will replace an existing vessel and is expected to be added to the fleet in the first quarter of 2018.
With the acquisition of Macduff, Clearwater’s fleet now includes 13 mid-shore scallop harvesting vessels within the UK with average useful lives between 5-15 years. In 2017 Clearwater expects to invest approximately $90.0 million in capital projects with the most significant investments relating to the new clam harvesting vessel, refits and land-based processing capacity expansion. SELECTED ANNUAL INFORMATION
(In 000's except per share amounts)
For the year ended December 31 2016 2015 2014
Sales $ 611,551 $ 504,945 $ 444,742
Gross margin 144,621 132,188 102,834
Net earnings (loss) 59,596 (20,671) 9,797
Basic and diluted earnings (loss) per share 0.71 (0.65) (0.05)
Adjusted EBITDA1 120,937 109,734 87,368
Adjusted earnings attributable to shareholders1 23,766 43,457 22,571
Adjusted earnings per share1 0.38 0.76 0.41
Total assets 729,735 753,195 464,397
Long-term debt $ 436,414 $ 480,769 $ 273,041

12 | P a g e
2016 Financial Achievements Clearwater reported record sales and adjusted EBITDA for 2016 of $611.6 million and $120.9 million, versus 2015 comparative figures of $504.9 million and $109.7 million, respectively. This represents double digit growth rates for sales of 21.1% and adjusted EBITDA of 10.2%, marking Clearwater’s seventh consecutive year of top and bottom line growth. Sales and adjusted EBITDA were positively impacted by strong selling prices for scallops, higher sales volumes for clams, lobster, langoustine, whelks and crab and higher average foreign exchange rates for the US dollar, Yen and the Euro. Our Macduff Shellfish operation in the UK had a very successful year delivering strong volumes and earnings. Selling prices and foreign exchange were favorable for the operation and enabled delivery of the strongest financial performance in its history. In Arctic Surf Clam, Clearwater harvested the Grand Banks for the first time since 2006. This was made possible with the addition of the Belle Carnell to our fleet. This when combined with our proprietary advancements in harvesting technology resulted in the complete harvest of the TAC for the first time in the history of the fishery and increased our sales volumes of this unique sushi and sashimi focused product. Cash flows from working capital improved in the fourth quarter of 2016, by $31.3 million to $64.6 million, as compared to the same period in 2015, as several species finished harvesting Clearwater’s quota earlier in the year and these inventories were sold in the normal course of business.

13 | P a g e
EXPLANATION OF 2016 FINANCIAL RESULTS Overview The following statements reflect the results of Clearwater for the 13 weeks and years ended December 31, 2016 and 2015:
13 weeks ended
December 31Year ended
December 31
In 000's of Canadian dollars 2016 2015 2016 2015
Sales $ 165,690 $ 165,503 $ 611,551 $ 504,945
Cost of goods sold1 136,737 122,404 466,930 372,757
Gross margin 28,953 43,099 144,621 132,188
17.5% 26.0% 23.6% 26.2%
Administrative and selling 9,814 16,852 58,492 51,363
Net Finance costs 4,602 1,105 26,948 21,634
(Gains) Losses on contract derivatives (8,372) 7,450 (7,279) 26,763
Foreign exchange (gains) losses on long term debt 4,449 18,950 (7,295) 46,287
Other expense (income) (855) (147) (5,209) 444
Research and development 643 822 2,922 1,981
10,281 45,032 68,579 148,472
Earnings (loss) before income taxes 18,672 (1,933) 76,042 (16,284)
Income tax expense 6,261 1,860 16,446 4,387
Earnings (loss) $ 12,411 $ (3,793) $ 59,596 $ (20,671)
Earnings (loss) attributable to:
Non-controlling interest $ 3,800 $ 3,267 $ 15,668 $ 16,937
Shareholders of Clearwater 8,611 (7,060) 43,928 (37,608)
$ 12,411 $ (3,793) $ 59,596 $ (20,671)
1 – In 2015 there was $2.1 million included in cost of goods sold related to fair value adjustment for inventory and depreciation that resulted from
IFRS requirements on purchase price accounting on the acquisition of Macduff.
14 | P a g e
Key Performance Indicators1
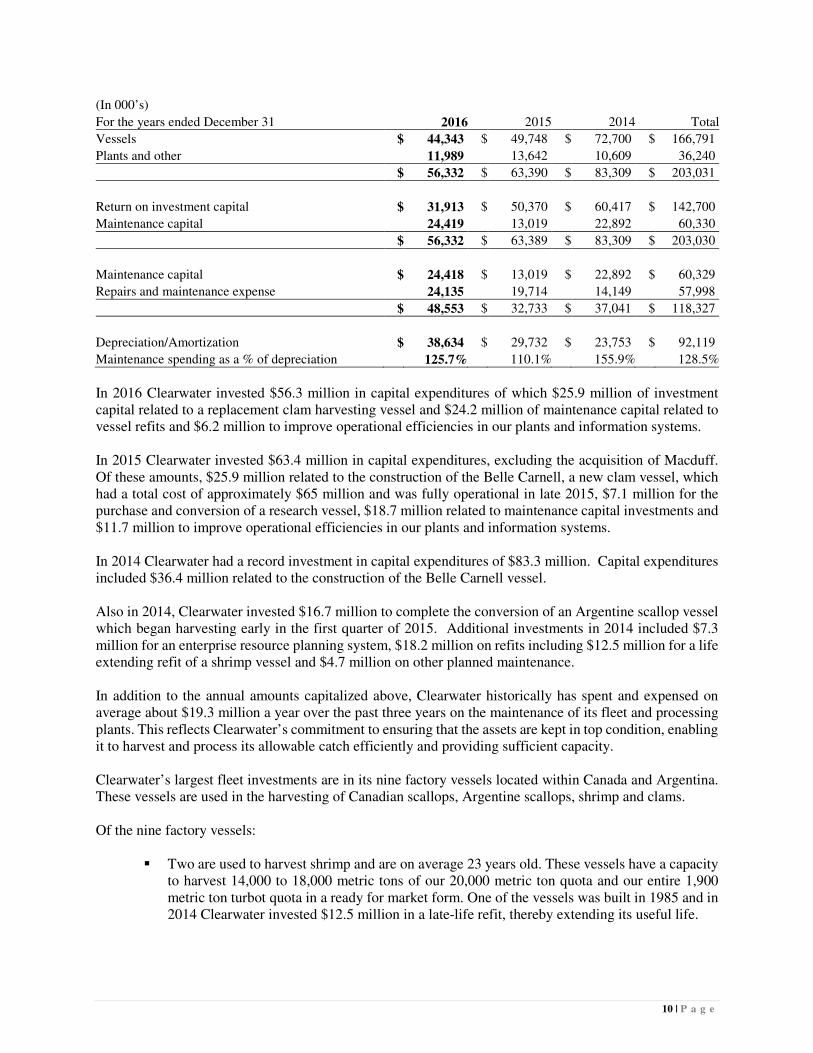
In 000's of Canadian dollars
As At December 31 2016 2015 2014
Profitability
Adjusted EBITDA1 $ 120,937 $ 109,734 $ 87,368
Adjusted EBITDA (as a % of sales) 19.8% 21.7% 19.6%
Sales $ 611,551 $ 504,945 $ 444,742
Sales growth 21.1% 13.5% 14.4%
Free Cash Flows and Leverage Targets
Free cash flows1 $ 10,242 $ 39,089 $ 30,856
Leverage1 4.2 4.4 3.3
Returns
Return on assets1 11.0% 13.8% 13.9%

1 – Refer to discussion on non-IFRS measures, definitions and reconciliations 15 | P a g e
2016 Financial Results Clearwater reported record sales and adjusted EBITDA1 of $611.6 million and $120.9 million respectively for 2016 versus 2015 comparative results of $504.9 million and $109.7 million. This represents growth rates of 21.1% for sales and 10.2% for adjusted EBITDA marking Clearwater’s seventh consecutive year of top and bottom line growth. Sales and adjusted EBITDA were positively impacted by strong sales prices for scallops and higher sales volumes for clams, lobster, langoustine, whelks and crab. Higher average foreign exchange rates for the US dollar, Yen and the Euro had a net positive impact of $7.0 million, contributing to the improvement in sales. Earnings for the year increased $80.3 million to $59.6 million in 2016 primarily as a result of improvements in gross margin from strong sales prices for the majority of core species and the impact of lower average foreign exchange rates. The changes in foreign exchange rates resulted in non-cash unrealized foreign exchange gains on long term debt and forward contracts as the Canadian dollar strengthened against the US dollar and the GBP. We faced challenges in several core species during the year that resulted in lower than expected sales and earnings. The Total Allowable Catch (“TAC”) for coldwater shrimp was reduced and reallocated in 2016 resulting in decline in our coldwater shrimp sales and margins. The decline in TAC from historic highs is in natural response to the decline of the coldwater shrimp biomass as the cod species return to the Northern Atlantic fishery. The TAC for Canadian sea scallops was at its lowest level in 11 years resulting in lower sales and earnings compared to 2015. Lower available supply enabled stronger prices for this high demand species. In the live lobster business, higher volumes resulted in increased sales. Margins were weaker in this species however due to poor quality received from the inshore fishery and an increase in low-priced competition in the China wholesale market as prices could not be increased quickly enough in the latter part of the year to offset higher procurement prices and mortality. In Arctic Surf Clam, harvested volumes increased rapidly in the second half of the year with the resulting supply outstripping the capacity of our existing channels and customers. Heavier promotional activity resulted in higher sales. A smaller size mix in the clams and a reduction in selling prices to increase consumer demand resulted in an overall reduction in margins. Our Argentine scallop species had its strongest year in recent history with increased volumes, higher selling prices and lower costs. Our Macduff business also had its strongest year with high volumes, pricing and increased access to supply through procurement arrangements. The weaker Sterling versus Euro had a favorable impact on results although this was partially offset when translated to Canadian dollars. The higher proportion of procured products through the Macduff operations had a dilutive effect on margin as a percent of sales. The combined effect of these items resulted in a decline in gross margin as a percent of sales of 2.6% for the 2016 year compared to 2015.

1 – Refer to discussion on non-IFRS measures, definitions and reconciliations 16 | P a g e
Reductions in coldwater shrimp and sea scallop Total Allowable Catch (“TAC”) and poor live lobster quality, from the inshore fishery, combined with high shore prices resulted in lower margins. Lower average foreign exchange rates as the Canadian dollar strengthened against the US dollar, Euro and GBP resulted in a negative impact to sales of $5.2 million. Despite these challenges, our business fundamentals remain strong and we are positioned well for another year of significant growth in 2017. Earnings in the fourth quarter of 2016 increased $16.2 million to $12.4 million primarily as a result of higher average foreign exchange rates as the US dollar and GBP had strengthened against the Canadian collar in the fourth quarter of 2015, resulting in higher non-cash unrealized foreign exchange losses on US dollar and GBP denominated debt. In addition general and administrative expenses declined in the fourth quarter of 2016 as a result of a reduction in variable and share based compensation expense as compared to the same period in 2015. The cash flows used in working capital increased against 2015 by $2.3 million to a use of $21.1 million for 2016. The increased level of working capital resulted primarily from high inventory levels for clams and certain procured species, partially offset by timing of collections of accounts receivable. Inventory levels increased during the third and fourth quarters of 2016 to higher than anticipated levels following successful harvesting in our clam fleet. With the addition of the third vessel into the fishery in the latter part of 2015 combined with improved efficiency through the implementation of advanced harvesting technology and equipment, harvesting volumes increased significantly and therefore the Company was able to catch the full clam quota for the first time in 2016. Overall inventory levels increased through the second half of 2016 resulting in year end clam inventories closing $23.9 million higher than 2015. Clam sales volumes increased 22.7% over the prior year with pricing adjustments, investments in marketing, promotion and distribution expansion initiated to increase sales. The benefits of these investments were not fully realized in 2016 as it will take time to effect expanded distribution of clams. Management anticipates the benefits will be realized through 2017 and inventories will return to normal levels by the end of the year. Free cash flows1 were $10.2 million in 2016 as compared to $39.1 million in 2015. Higher adjusted EBITDA was offset by higher working capital balances from inventory. Other contributing factors included higher interest expense that resulted from higher inventory balances and timing of payments to non-controlling interests, that reduced free cash flow balances by approximately $12.7 million in 2016. Cash taxes were also higher by $5.2 million as a result of a full year of Macduff operations. Leverage1 decreased to 4.2x adjusted EBITDA as at December 31, 2016 compared to 4.4x at the end of 2015 and was slightly higher than management’s initial expectations as a result of higher working capital balances. Clearwater continues to have a long-term target for leverage of 3.0x and plans to be in line with this target within the next two years or less. Return on assets1 (“ROA”) declined from 13.8% in 2015 to 11.0% in 2016. The full year impact of the addition of Macduff diluted ROA due to the higher proportion of procured species sold at lower margins. Average total assets for 2016 versus 2015 also increased with the completion of the Belle Carnell vessel later in 2015 and the ERP system investment completed early in 2016. Growth in EBIT was modestly higher than the increase in depreciation expense of $8.9 million resulting from these additions. 2016 represents a continued strong track record for both top and bottom line growth despite our challenges. By focusing on our six core strategies, including increasing access to supply, targeting profitable and growing markets, and building organizational capacity we successfully reported another record year that builds our foundation for the next four years.

1 – Refer to discussion on non-IFRS measures, definitions and reconciliations 17 | P a g e
EXPLANATION OF CHANGE IN EARNINGS Overview The following table reflects the changes in earnings for Clearwater for the 13 weeks ended and year ended December 31, 2016:
13 weeks ended
December 31 Year ended
December 31
In 000's of Canadian dollars 2016 2016
Earnings (loss) - 2015 $ (3,793) $ (20,671)
Explanation of changes in earnings (loss) related to operations:
Higher (lower) gross margin (14,146) 12,433
Lower (higher) administrative and selling 7,038 (7,129)
Higher interest expense (1,248) (6,553)
Higher realized foreign exchange gains 6,343 3,689
(2,013) 2,440 Explanation of changes in earnings (loss) related to non-operational items:
Higher unrealized foreign exchange gains on long term debt and working capital and forward contracts. 23,095 88,869
Higher income tax expense (4,401) (12,059)
Accretion on deferred consideration (821) (3,562)
Higher fair value adjustments on embedded derivative (1,051) (766)
16,822 72,482
All other 1,395 5,345
Earnings (loss) - 2016 12,411 59,596

1 – Refer to discussion on non-IFRS measures, definitions and reconciliations 18 | P a g e
Sales by region
13 weeks ended
December 31 Year ended
December 31
In 000's of Canadian dollars 2016 2015 Change 2016 2015 Change
Europe $ 75,830 $ 75,241 $ 589 $ 246,909 $ 183,881 $ 63,028
China 28,089 32,413 (4,324) 94,623 95,140 (517)
Japan 15,079 17,208 (2,129) 76,230 66,401 9,829
Other Asia 6,618 5,852 766 36,036 18,113 17,923
Asia 49,786 55,473 (5,687) 206,889 179,654 27,235
United States 23,661 21,265 2,396 85,385 80,668 4,717
Canada 16,381 12,799 3,582 72,275 58,696 13,579
North America 40,042 34,064 5,978 157,660 139,364 18,296
Other 32 725 (693) 93 2,046 (1,953)
$ 165,690 $ 165,503 $ 187 $ 611,551 $ 504,945 $ 106,606
Summary
Clearwater reported sales and adjusted EBITDA1 for 2016 of $611.6 million and $120.9 million, versus 2015 comparative figures of $504.9 million and $109.7 million, respectively.
Europe
Europe is Clearwater’s largest scallop market and it is an important market for coldwater shrimp, langoustines, crab and lobster products. European sales increased $63.0 million, or 34.3% to $246.9 million for 2016 versus 2015. The increase in sales was primarily as a result of higher sales volumes for King and Queen scallops, langoustines and brown crab. Higher available supply for Argentine scallops also resulted in increased sales . Lower available supply for sea scallops and coldwater shrimp reduced sales. Lower market demand that reduced average selling prices for cooked and peeled shrimp, a non-core species, partially offset the improvement in sales.
Sales that are primarily transacted in Euro, GBP and Danish Kroner were negatively impacted in 2016 by lower average foreign exchange rates1 that had a net impact on sales of $4.9 million. For the fourth quarter, higher sales volumes were offset by lower average foreign exchange rates of $5.5 million as the Canadian dollar strengthened against the Euro and the GBP in the last quarter of 2016 as compared to the same period of 2015. China China is a key market for clams, coldwater shrimp, lobster and turbot. For the year, sales to customers in China remained consistent at $94.6 million as higher sales volumes for clams and lobster and higher average foreign exchange rates for the US dollar were offset by reductions in available supply for shrimp. Sales in China are almost exclusively transacted in US dollars. The US dollar strengthened against the Canadian dollar for 2016 contributing $1.8 million to the increase in sales.

1 – Refer to discussion on risks and uncertainties 19 | P a g e
Fourth quarter 2016 sales volumes were impacted negatively by lower TAC levels for both sea scallops and coldwater shrimp, resulting in lower sales in comparison to the same period of 2015. Japan Clams, lobster, coldwater shrimp and turbot are the main species sold in Japan. Sales to customers in Japan increased $9.8 million, or 14.8% to $76.2 million for 2016 primarily as a result of higher sales volumes for clams, strong sales prices for shrimp and higher average foreign exchange rates as the Yen strengthened against the Canadian dollar. Sales, which were primarily transacted in Yen, were positively impacted in 2016 by approximately $7.8 million related to an increase of 9.1% in foreign exchange rates1 over the same period in 2015. In the fourth quarter, sales to Japan declined $2.1 million primarily as a result of lower available supply for coldwater shrimp and average sales prices for clams, partially offset by higher sales volumes for clams and higher average Yen exchange rates. Other Asia
The Other Asia region includes Korea, Taiwan, Singapore and other Asian countries. Whelk, clams and lobster are key products for these markets. Sales in this region increased $17.9 million to $36.0 million for 2016 in comparison to 2015 primarily as a result of sales for Whelk.
United States Scallops, coldwater shrimp, lobster and clams are the primary species sold in the United States. Sales for 2016 and for the fourth quarter increased $4.7 million and $2.3 million, respectively primarily as a result of higher sales volumes for lobster. Lower sales prices, resulting from a smaller size mix and volumes for scallops and clams partially offset the increase in sales. Sales for 2016 were positively impacted by $1.5 million due to stronger foreign exchange rates as the US dollar strengthened against the Canadian dollar. Average foreign exchange rates1 for the US dollar increased by 1.8% to 1.319 in 2016. Canada Canada is a large market for lobster, scallops, snow crab, clams and coldwater shrimp. Sales within Canada increased $13.6 million, or 23.1% to $72.3 million for 2016 primarily as a result of an increase in sales prices for snow crab and sea scallops as well as higher sales volumes for clams, scallops and lobster. Lower average sales prices for lobster and clams and timing of sales volumes for snow crab, partially offset the improvement in sales.
Sales within Canada increased $3.6 million for
the fourth quarter of 2016 as compared to the
same quarter in 2015 primarily as a result of an
increase in sales volume for lobster.
1 – Refer to discussion on risks and uncertainties 20 | P a g e
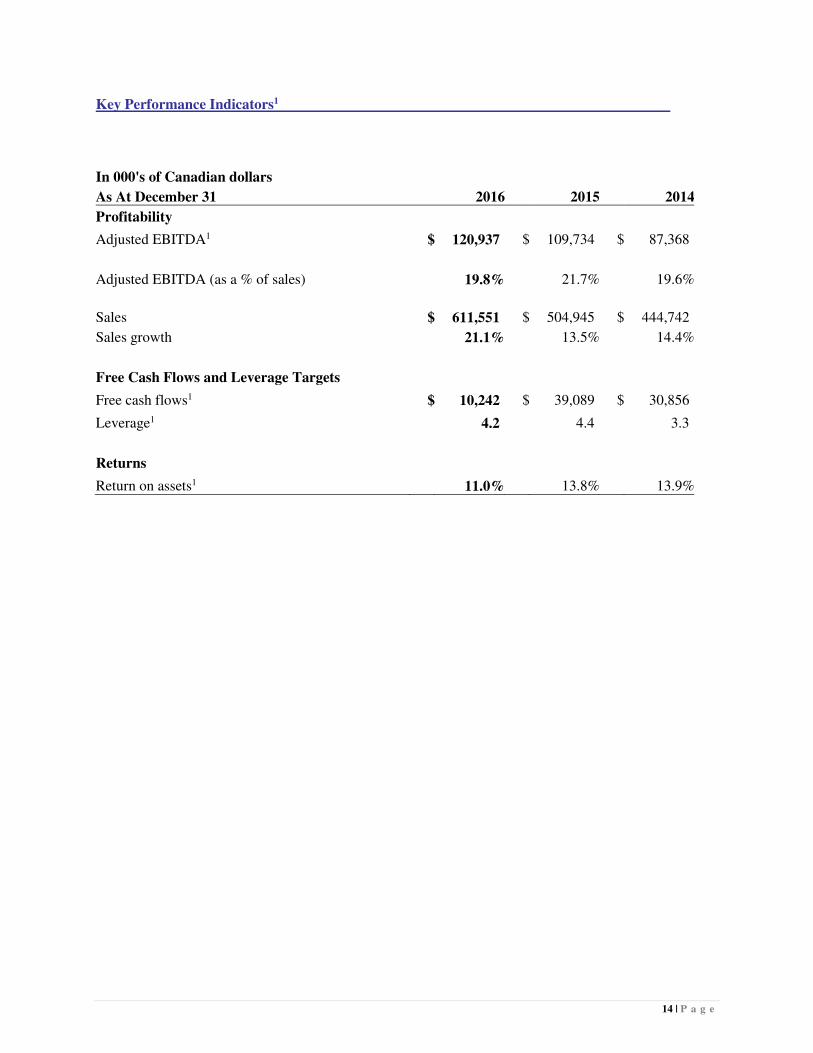
Sales by species1
13 weeks ended
December 31 Year ended
December 31
In 000's of Canadian dollars 2016 2015 Change 2016 2015 Change
Scallops $ 47,644 $ 59,787 $ (12,143) $ 188,421 $ 165,544 $ 22,877
Lobster 29,022 21,863 7,159 108,402 92,589 15,813
Coldwater shrimp 29,126 37,299 (8,173) 93,250 109,963 (16,713)
Clams 30,846 32,288 (1,442) 91,918 84,350 7,568
Langoustine 13,441 7,873 5,568 47,572 7,873 39,699
Crab 11,154 4,798 6,356 38,243 26,141 12,102
Whelks 3,361 878 2,483 22,204 878 21,326
Ground fish and other shellfish 1,096 717 379 21,541 17,607 3,934
$ 165,690 $ 165,503 $ 187 $ 611,551 $ 504,945 $ 106,606
Sales increased $106.6 million for 2016 to $611.6 million versus sales of $504.9 million in 2015 primarily as a result of higher sales volumes for clams, lobster, scallops, langoustines and whelk. Higher average foreign exchange rates1, had a $7.0 million positive impact on sales, as the US dollar, Yen and Euro strengthened against the Canadian dollar. Sales volumes for coldwater shrimp decreased due to a necessary reduction in Total Allowable Catch (“TAC”) to preserve the health of the species. The TAC and volumes are expected to continue to decline as the species comes into balance from historical levels with the return of its natural predator, the cod. Canadian sea scallop volumes were below 2015 as the TAC was at its lowest annual level in 11 years. This is a normal natural cycle for the species and is expected to increase in the future. Strong sea scallops prices and expanded access to supply resulted in strong growth in sales. Clearwater is a leader in sustainable seafood harvesters which is a responsibility that we take seriously. Clearwater maintains Marine Stewardship Council certification (“MSC”) in all harvested species within North America and Argentina. This certification reflects our commitment to sustainability, environmental impact and good management practices. This responsibility sometimes requires taking less to ensure the long-term health of the resource which has impacted sales in the short-term but provides for sustainable resources into the future. Sales of clams increased following the reintroduction of a third clam vessel into the Grand Banks fishery. Clearwater successfully harvested the full TAC for the first time in the history of the fishery. Cost of Goods Sold Cost of goods sold includes harvesting and procurement costs, manufacturing costs, depreciation, transportation and administration. Cost of goods sold increased $94.2 million for the 2016 and $14.3 million for the fourth quarter, as compared to the same periods of 2015, primarily due to higher sales volumes. Higher procurement prices for lobster, crab and shrimp and lower catch rates for frozen-at-sea shrimp resulted in higher average costs per pound, contributing to the increase in cost of goods sold.

21 | P a g e
Harvesting and procurement include all costs incurred in the operation of the vessels including labour, fuel, repairs and maintenance, fishing gear, supplies, other costs and fees plus procured raw material costs for lobster, shrimp, scallops and crab. Gross margin Gross margin increased $12.4 million in 2016 to $144.6 million as a result of higher sales volumes for clams, lobster, scallops, langoustines and whelk, partially offset by declines in sales volumes for shrimp. Gross margins as a percentage of sales declined 2.6% for 2016 and 8.5% for the fourth quarter of 2016 in comparison to the same periods in 2015. The reduction in gross margin as a percentage of sales was primarily a result of lower sales prices for clams and lobster and higher procurement prices for both lobster and shrimp. Canadian sea scallop harvest occurred earlier in 2016 thus fewer sea scallops were available for sale for the year and for the fourth quarter. Lower volumes of coldwater shrimp due to quota reductions and reallocations also resulted in lower margins for the year and quarter. Increased volumes of new procured species including langoustine, whelk and crab which generate a lower gross margin further contributed to the decline in gross margin as a percentage of sales. For the year, strong sales prices for scallops and higher average foreign exchange rates1 as the US dollar and Yen strengthened against the Canadian dollar had a $10.8 million positive impact that partially offset the decline in margins.
13 weeks ended
December 31 Year ended
December 31
2016 2015 2016 2015
Currency % sales realized 1 % sales realized1 % sales realized1 % sales realized1
US dollars 36.6% 1.336 37.4% 1.35 37.4% 1.319 43.2% 1.296
Euros 26.2% 1.428 30.2% 1.475 27.0% 1.459 22.7% 1.438
Canadian dollar and other 16.9% 10.2% 12.9% 12.1%
UK pounds 11.3% 1.662 7.3% 2.03 10.0% 1.760 5.6% 1.993
Japanese Yen 7.5% 0.012 8.8% 0.011 9.6% 0.012 10.0% 0.011
Danish Kroner 1.5% 0.194 6.1% 0.196 3.1% 0.199 6.4% 0.192
100.0% 100.0% 100.0% 100.0%
1 – Refer to discussion on risks and uncertainties 22 | P a g e
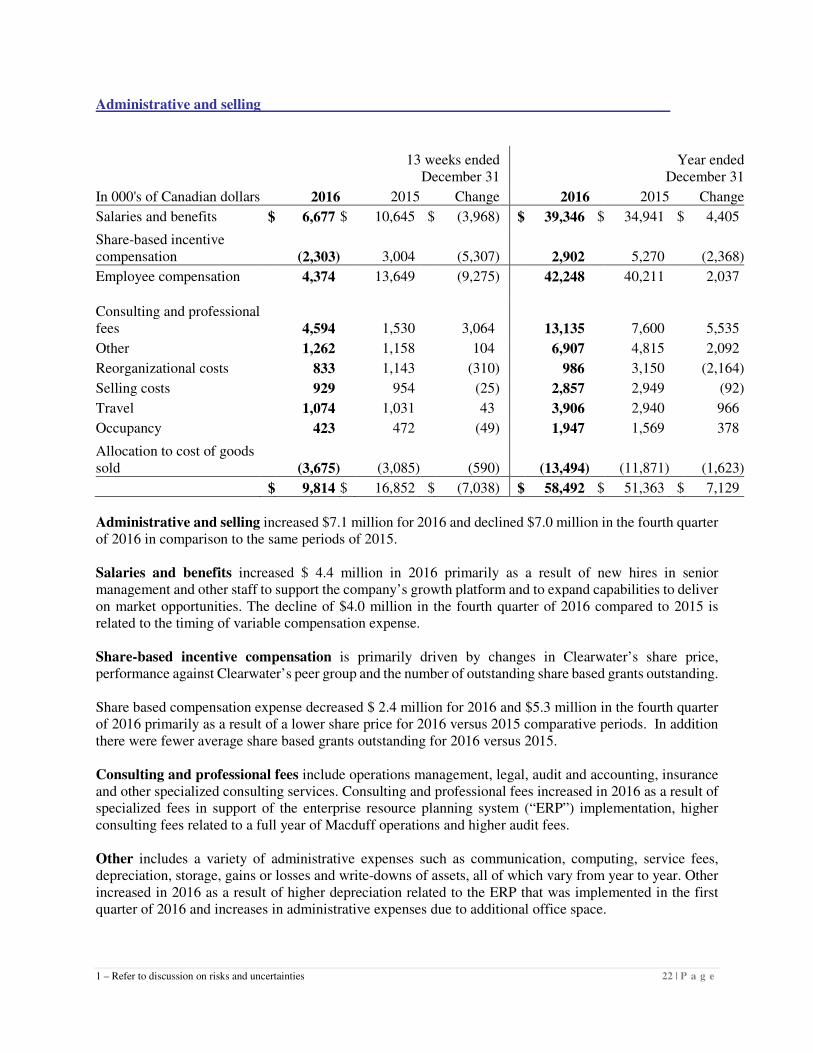
Administrative and selling
13 weeks ended
December 31 Year ended
December 31
In 000's of Canadian dollars 2016 2015 Change 2016 2015 Change
Salaries and benefits $ 6,677 $ 10,645 $ (3,968) $ 39,346 $ 34,941 $ 4,405
Share-based incentive compensation (2,303) 3,004 (5,307) 2,902 5,270 (2,368)
Employee compensation 4,374 13,649 (9,275) 42,248 40,211 2,037
Consulting and professional fees 4,594 1,530 3,064 13,135 7,600 5,535
Other 1,262 1,158 104 6,907 4,815 2,092
Reorganizational costs 833 1,143 (310) 986 3,150 (2,164)
Selling costs 929 954 (25) 2,857 2,949 (92)
Travel 1,074 1,031 43 3,906 2,940 966
Occupancy 423 472 (49) 1,947 1,569 378
Allocation to cost of goods sold (3,675) (3,085) (590) (13,494) (11,871) (1,623)
$ 9,814 $ 16,852 $ (7,038) $ 58,492 $ 51,363 $ 7,129
Administrative and selling increased $7.1 million for 2016 and declined $7.0 million in the fourth quarter of 2016 in comparison to the same periods of 2015. Salaries and benefits increased $ 4.4 million in 2016 primarily as a result of new hires in senior management and other staff to support the company’s growth platform and to expand capabilities to deliver on market opportunities. The decline of $4.0 million in the fourth quarter of 2016 compared to 2015 is related to the timing of variable compensation expense. Share-based incentive compensation is primarily driven by changes in Clearwater’s share price, performance against Clearwater’s peer group and the number of outstanding share based grants outstanding. Share based compensation expense decreased $ 2.4 million for 2016 and $5.3 million in the fourth quarter of 2016 primarily as a result of a lower share price for 2016 versus 2015 comparative periods. In addition there were fewer average share based grants outstanding for 2016 versus 2015. Consulting and professional fees include operations management, legal, audit and accounting, insurance and other specialized consulting services. Consulting and professional fees increased in 2016 as a result of specialized fees in support of the enterprise resource planning system (“ERP”) implementation, higher consulting fees related to a full year of Macduff operations and higher audit fees. Other includes a variety of administrative expenses such as communication, computing, service fees, depreciation, storage, gains or losses and write-downs of assets, all of which vary from year to year. Other increased in 2016 as a result of higher depreciation related to the ERP that was implemented in the first quarter of 2016 and increases in administrative expenses due to additional office space.

1 – Refer to discussion on risks and uncertainties 23 | P a g e
Selling costs include advertising, marketing, trade shows, samples, product development and bad debt expenses. Reorganization costs for 2015 included a provision for severance related to certain executives and long term employees affected by the reorganization. Allocation to cost of goods sold reflects costs that are attributable to the production of goods and are allocated on a proportionate basis based on production volumes. Net Finance costs
13 weeks ended
December 31 Year ended
December 31
In 000's of Canadian dollars 2016 2015 Change 2016 2015 Change
Interest and bank charges $ 6,778 $ 5,467 1,311 $ 24,776 $ 19,002 5,774
Amortization of deferred financing charges and accretion 478 541 (63) 2,113 1,334 779
7,256 6,008 1,248 26,889 20,336 6,553
Interest rate swaps and caps (1,665) (2,550) 885 (2,027) 2,908 (4,935)
Accretion on deferred consideration 821 - 821 3,562 - 3,562
Fair value adjustment on embedded derivative (1,710) (2,761) 1,051 (1,350) (2,118) 768
Debt refinancing fees and other (100) 408 (508) (126) 508 (634)
$ 4,602 $ 1,105 3,497 $ 26,948 $ 21,634 5,314
Interest and bank charges increased $5.8 million for 2016 and $1.3 million for the fourth quarter of 2016 as compared to the same periods in 2015 due to higher average debt balances throughout the year, primarily resulting from the acquisition of Macduff on October 30, 2015. Higher US dollar denominated debt facilities resulted in an increase in foreign exchange expense, which contributed to the increase in interest expense for the year. Higher amortization of deferred financing charges and accretion relates primarily to charges from the financing of the Macduff acquisition. The interest rate swaps and caps relates to non-cash mark to market gains and losses on USD $100 million and CAD $24 million swaps and caps that were entered into in 2015. The change in the mark to market represents changes in relative expected future interest rates and foreign exchange impacts as the Canadian dollar strengthened against the US dollar in 2016.

1 – Refer to discussion on risks and uncertainties 24 | P a g e
The accretion on deferred consideration arises for the deferred consideration obligation associated with the acquisition of Macduff as the notes are non-interest bearing. The fair value adjustment on the embedded derivatives on Term Loan B relates to a Libor floor provision in the loan agreement and the earnings impact represents the change in the estimated fair values. (Gains) losses1 on contract derivatives
13 weeks ended
December 31 Year ended
December 31
In 000's of Canadian dollars 2016 2015 Change 2016 2015 Change
Realized loss
Forward foreign exchange contracts $ 238 $ 4,343 (4,105) $ 7,345 $ 15,595 (8,250)
Unrealized loss (gain)
Forward foreign exchange contracts (8,610) 3,107 (11,717) (14,624) 11,168 (25,792)
$ (8,372) $ 7,450 (15,822) $ (7,279) $ 26,763 (34,042)
Gains on forward contract derivatives in the fourth quarter of 2016 and for the year as compared to the same periods of 2015, primarily resulted from unrealized gains in 2016 related to USD contracts where the contracted rates are higher than the relative spot rate. In 2015, USD contracted rates were lower than the relative spot rate at the date of the financial statements. Realized losses of $7.3 million for 2016 are primarily a result of the Yen, Euro and the USD contracts for which contracted rates were below spot rates at time of settlement. Clearwater is primarily an export company with approximately 87.9% of our sales taking place outside Canada and in foreign currencies. We have a business model built on access to a limited resource and diversity of species, markets and customers and have operated successfully in a variety of exchange rate environments.
As part of our risk management strategy we enter into short-term currency and interest rate instruments and loan agreements to give us certainty regarding exchange rates and cash flows for a period of time. We recognize and include in our earnings any realized gains and losses on these instruments and loans as they mature and are settled.
We are also required to record and include any unrealized non-cash gains and losses on these instruments in our earnings by assuming the settlement of these currency and interest rate instruments prior to their maturity and at each period end. To reflect this accounting, we obtain estimates of the fair value of the hedging instruments and convert them, as well as any foreign currency denominated debt, to Canadian dollars at each balance sheet date.
This results in unrealized non-cash gains or losses that are included in earnings for the period. As these gains and losses do not relate to operating results of the period, we exclude these gains and losses when

1 – Refer to discussion on risks and uncertainties 25 | P a g e
calculating Adjusted EBITDA, Adjusted Earnings Attributable to Shareholders of Clearwater and Free Cash Flows.
Foreign exchange 1 (gains) losses on long term debt and working capital
13 weeks ended
December 31 Year ended
December 31
In 000's of Canadian dollars 2016 2015 Change 2016 2015 Change
Realized (gain) loss
Working capital and other $ 776 $ 3,900 (3,124) $ 7,803 $ (1,690) 9,493 Unrealized (gain) loss
Foreign exchange on long term debt and working capital 5,881 17,547 (11,666) (18,045) 51,168 (69,213)
Cross currency swaps and cap (2,208) (2,497) 289 2,947 (3,191) 6,138
$ 4,449 $ 18,950 (14,501) $ (7,295) $ 46,287 (53,582)
Foreign exchange gains on long term debt and working capital increased by $53.6 million from a loss of $46.3 million for 2015 to a gain of $7.3 million in 2016. The increase was primarily a result of non-cash unrealized gains on the translation of $183.8 in million US dollar denominated debt as the Canadian dollar strengthened against the US dollar by 3.0%. Realized foreign exchange losses on working capital and other increased $9.5 million from a gain of $1.7 million for 2015 to a loss of $7.8 million for the same period of 2016 primarily as a result of realized losses on intercompany accounts to wholly owned subsidiaries classified as foreign operations for accounting purposes. Also contributing to the increase in foreign exchange gains were non-cash unrealized gains on the translation of the deferred consideration and the earnout obligations denominated in GBP as the Canadian dollar also strengthened against the GBP in 2016. For 2015 the US dollar and Sterling strengthened against the Canadian dollar. Unrealized exchange gains on cross currency swaps declined in 2016 versus 2015 as a result of the changes in US dollar exchange rates. In the fourth quarter of 2016 foreign exchange losses on long term debt and working capital of $5.9 million compared to $17.5 million in 2015 was primarily a result of $183.8 million of US denominated debt as the average foreign exchange rates for the US dollar were higher and strengthened against the Canadian dollar in the fourth quarter of 2015.

26 | P a g e
Other income
13 weeks ended
December 31 Year ended
December 31
In 000's of Canadian dollars 2016 2015 Change 2016 2015 Change
Acquisition related costs $ 1,287 $ 2,185 (898) $ 2,561 $ 3,240 (679)
Share of earnings of equity-accounted investee (872) (623) (249) (1,185) (2,591) 1,406
Royalties, interest and other fees (749) (129) (620) (1,379) (664) (715)
Other (income) fees (602) (1,580) 978 (1,950) 459 (2,409)
Fair value adjustment on earn-out liability 150 - 150 (1,110) - (1,110)
Export rebate income (69) - (69) (2,146) - (2,146)
$ (855) $ (147) (708) $ (5,209) $ 444 (5,653)
Acquisition related costs for 2015 and 2016 related to the acquisition and integration of Macduff Shellfish. Share of earnings in equity-accounted investee declined in 2016 primarily as a result of lower total available catch (“TAC”) for sea scallops which resulted in a decline in sales and earnings. Royalties, interest and other fees includes income related to quota rental, commissions, processing fees and other miscellaneous income and expense that vary based upon the operations of the business. The fair value adjustment on earn-out liability relates to the Macduff acquisition. The earn-out liability is an unsecured additional consideration to be paid dependent on the future financial performance of Macduff and is recognized using fair value, with adjustments included in profit and loss. The export rebate income relates to incentives received and accrued by our Argentine subsidiary for exports from certain economic zones in Argentina. Late in 2016, the Argentina government announced a change to the export rebate program that will result in a reduction to the incentive program effective immediately. Management expects to receive all accrued balances in due course. Research and Development Research and development relates to new harvesting, processing and storage technology and research into ocean habitats and fishing grounds. Research and development can vary year to year depending on the scope, timing and volume of research completed. Clearwater’s business plans expect a consistent investment in research and development for the 2017 fiscal year.

27 | P a g e
Income taxes Income taxes primarily relate to taxable subsidiaries in Argentina, the United States, the United Kingdom and Canada. Deferred tax assets are being recognized based on management’s estimate that it is more likely than not that Clearwater will earn sufficient taxable profit to utilize these losses. The increase in deferred tax expense for the year was a result of expected higher taxable income. Earnings attributable to non-controlling interest Non-controlling interest relates to minority share of earnings from Clearwater’s majority investments in a shrimp/turbot joint venture and subsidiaries in Argentina and Newfoundland and Labrador. The decrease in earnings attributable to non-controlling interest of $1.3 million for 2016 and relates primarily to lower landings for shrimp as a result of lower quotas and difficult weather conditions in northern fishing zones. For the fourth quarter, earnings attributable to non-controlling interest increased by $0.5 million due to timing of landings. It is important to note that the earnings attributable to non-controlling interest relates to the portion of Clearwater’s partnerships owned by other parties. Income taxes are included in earnings attributable to shareholders for Clearwater’s share of partnership earnings, whereas the earnings attributable to non-controlling interest are not tax affected. For those investors that would like to understand the breakdown of adjusted EBITDA attributable to non-controlling interest and shareholders please refer to the reconciliation of adjusted EBITDA within the non-IFRS measures, definitions and reconciliations section of the MD&A. Earnings attributable to shareholders Earnings increased $80.3 million to $59.6 million in 2016 primarily as a result of improvements in gross margin from strong sales prices for the majority of core species and the impact of lower average foreign exchange rates. The changes in foreign exchange resulted in non-cash unrealized foreign exchange gains on long term debt and forward contracts as the Canadian dollar strengthened against the US dollar and the GBP. Adjusted Earnings attributable to shareholders To assist readers in understanding our earnings we have included a calculation of adjusted earnings.
Management believes that in addition to earnings and cash provided by operating activities, adjusted
earnings is a useful supplemental measure from which to determine Clearwater’s earnings from operations
and ability to generate cash available for debt service, working capital, capital expenditures, income taxes
and dividends.
For those readers that would like to understand the calculation of adjusted earnings please refer to the
reconciliation of adjusted earnings within the non-IFRS measures, definitions and reconciliations section
of the MD&A.
Adjusted earnings attributable to shareholders declined $19.7 million to $23.8 million in 2016 primarily as a result of higher interest expense resulting from higher working capital balances and income tax expense.
28 | P a g e
Refer to the Management Discussion and Analysis for a breakdown of the non-IFRS measure and the related earnings attributable to shareholders. Capital Structure Clearwater’s capital structure includes a combination of equity and various types of debt facilities. Clearwater’s goal is to have a cost effective capital structure that supports its growth plans, while maintaining flexibility, reducing interest rate risk and reducing exchange risk by borrowing when in currencies other than the Canadian dollar when appropriate. Clearwater uses leverage, in particular revolving and term debt to lower its cost of capital. The amount of debt available to Clearwater under its lending facilities is a function of Adjusted EBITDA1 less net earnings attributable to minority interest. Adjusted EBITDA can be impacted by known and unknown risks, uncertainties, and other factors outside Clearwater’s control including, but not limited to, total allowable catch levels, selling prices, weather, exchange rates, fuel and other input costs. Clearwater maintains flexibility in its capital structure by regularly reviewing forecasts and multi-year business plans and making any required changes to its debt and equity facilities on a proactive basis. These changes can include early repayment of debt, issuing or repurchasing shares, issuing new debt, utilizing surplus cash, extending the term of existing debt facilities and, selling surplus assets to repay debt. Clearwater’s capital structure was as follows as at December 31, 2016 and 2015:

29 | P a g e
In 000's of Canadian dollars
As at December 31 2016 2015
Equity
Share capital $ 210,860 $ 157,161
Contributed surplus 1,419 547
Deficit (4,793) (36,333)
Accumulated other comprehensive income (38,931) (1,625)
168,555 119,750
Non-controlling interest 19,930 29,325
188,485 149,075
Long term debt
Senior debt, non-amortizing
Revolving debt, due in 2018 23,400 16,400
Term loan, due in 2017 13,459 13,953
Term loan, due in 2091 3,500 3,500
40,359 33,853
Senior debt, amortizing
Term Loan A, due 2018 (net of deferred financing charges of $0.4 million (December 31, 2015 - $0.7 million)). 50,218 55,562
Term Loan B, due 2019 (including embedded derivative, net of deferred financing charges of $1.1 million) 307,210 335,024
Marine mortgage, due in 2017 - 457
Other loans 222 277
357,650 391,320
Deferred Obligation 29,298 43,035
Earnout liability 9,107 12,561
Total long term debt 436,414 480,769
Total capital $ 624,899 $ 629,844
There are 63,934,698 shares outstanding as of December 31, 2016 (December 31, 2015 - 59,958,998). On June 21, 2016, Clearwater issued 2,895,700 shares for $13.90 per share yielding gross proceeds of approximately $40.3 million. Concurrently, Clearwater completed a non-brokered private placement with certain existing shareholders for 1,080,000 shares at $13.90 per share for approximate gross proceeds of $15.0 million. The total approximate gross proceeds from the offering were $55.3 million and the approximate proceeds net of expenses were $53.1 million. Transactions costs were net of deferred taxes of $0.7 million.

30 | P a g e
On June 30, 2015, Clearwater issued 3,755,900 shares at $12.25 per share yielding gross proceeds of approximately $46 million. Concurrently, Clearwater completed a non-brokered private placement with certain existing shareholders for 1,225,000 shares at $12.25 per share for gross proceeds of approximately $15 million. The total gross proceeds from the offering was approximately $61 million and the proceeds net of expenses were $58.6 million. Long term debt consists of a revolving loan, non-amortizing and amortizing senior debt:
• The revolving loan allows Clearwater to borrow a maximum of CDN $100 million (denominated in either Canadian or the US dollar equivalent) and it matures in June 2018. The balance was $23.4 million at December 31, 2016 (December 31, 2015 - $16.4 million). The CDN balances bear interest at the banker’s acceptance rate plus 3.25%. The USD balances bear interest at the US Libor rate plus 3.25%. The availability on this loan is reduced by the amount outstanding on a US $10 million non-amortizing term loan and as such the availability as at December 31, 2016 was $63.1 million (December 31, 2015 - $69.6 million).
• Non-amortizing debt consists of a US $10 million loan due in June 2017 and a CAD $3.5 million loan due in 2091.
• Amortizing senior debt consists of a Term Loan A and Term Loan B.
Term Loan A - has principal outstanding as at December 31, 2016 of CDN $50.6 million (December 31, 2015 – CDN $56.3 million). The balance is shown net of deferred financing charges of $0.4 million (December 31, 2015 - $0.7 million).
The initial portion of term loan A has a principal outstanding as at December 31, 2016 of CDN $24.2 million (December 31, 2015 – CDN $27.0 million). The balance is shown net of deferred financing charges of CDN $0.1 million (December 31, 2015 - $0.1 million). The loan is repayable in quarterly instalments of CDN $0.4 million from September 2015 to June 2017, and CDN $0.8 million from September 2017 to March 2018 with the balance due at maturity in June 2018. It bears interest at the applicable banker’s acceptance rate plus 3.25%. As at December 31, 2016 this resulted in an effective rate of approximately 4.14%. The second portion of the term loan A (a delayed draw portion) has a principal outstanding as at December 31, 2016 of CDN $26.4 million (December 31, 2015 – CDN $29.3 million). The balance is shown net of deferred financing charges of CDN $0.3 million (December 31, 2015 - $0.6 million). The loan is repayable in quarterly instalments of CDN $0.4 million. The facility matures in June 2018 and bears interest payable monthly at the banker’s acceptance rate plus 3.25%.
Term Loan B - The principal outstanding as at December 31, 2016 was USD $178.5 million (December 31, 2015 - $189.7 million) and CAD $70.4 million (December 31, 2015 - $74.8 million).
The USD loan is repayable in quarterly instalments of USD $0.5 million with the balance due at maturity in June 2019. It bears interest payable monthly at US Libor plus 3.5% with a Libor interest rate floor of 1.25%. As of December 31, 2016 this resulted in an effective rate of 4.75%. The Libor interest rate floor of 1.25% is accounted for separately as embedded derivative and is recorded at the estimated fair market value. The change in fair market value of the embedded derivative is recorded through profit or loss.

31 | P a g e
The CAD loan is repayable in quarterly instalments of CAD $0.2 million with the balance due at maturity in June 2019. It bears interest payable monthly at the banker’s acceptance rate plus 3.50%. As of December 31, 2016 this resulted in an effective rate of 4.39%.
• The Deferred Obligation and Earn out relate to the acquisition of Macduff in 2015 and work as follows:
The Deferred Obligation relates to 33.75% of the shares of Macduff Shellfish Group Limited acquired by Clearwater (the "Earn Out Shares"). The principal amount of the deferred obligation at December 31, 2016 was £21.0 million and is recorded at a discounted amount of £17.7 million (CDN $29.3 million) (December 31, 2015 - £20.9 million, CDN $43.0 million) based on estimated timing of payment and is being accreted to the principal amount over the estimated term using the effective interest method with an effective average interest rate of 7.8%. In each year, the holders of the Earn Out Shares can elect to be paid up to 20% of the Deferred Obligation. Clearwater has the right to exercise the payout of 20% of the Deferred Obligation annually commencing two years after the date of closing. The percentage of the Deferred Obligation remaining unpaid will impact the fair value of the future performance component of the additional consideration, the Earnout. The fair value of the Deferred Obligation was estimated as of the acquisition date based on discounting the projected future cash out flows. On October 30, 2016 the holders of the Earn Out Shares elected to be paid 20% of the outstanding deferred obligation. As a result a payment £5.2 million (CDN - $8.7 million) was made on November 15, 2016. The Earnout liability is unsecured additional consideration to be paid dependent upon the future financial performance of Macduff and the percentage of Deferred Obligation remaining unpaid at the time of payment (refer to Deferred Obligation above). The estimated fair value of the Earnout at December 31, 2016 was £5.5 million (CDN - $9.1 million) (December 31, 2015 - £6.1 million, CDN - $12.6 million) based on forecast earnings and probability assessments. The actual Earnout payments are to be paid over the next five years.
The amount of the total Earnout is calculated as follows: The greater of:
i. £3.8 million; OR ii. up to 33.75% (dependent upon the percentage of Deferred obligation remaining unpaid
each year) of the increase in equity value of the business over five years calculated as 7.5x adjusted EBITDA less the outstanding debt of Macduff; and
iii. 10% of adjusted EBITDA above £10 million (dependent upon the percentage of Deferred obligation remaining unpaid each year)
The Earnout liability is recorded at fair value on the balance sheet at each reporting period until paid in cash, with changes in the estimated fair value being recorded as a component of other expense on the statement of operations.

32 | P a g e
Clearwater has entered into interest rate swap and cross-currency swap arrangements whereby:
• CDN $12 million of Term Loan A is fixed at 6.25% to June 2018.
• CDN $12 million of Term Loan A is capped at 5.85% to June 2018.
• USD $50 million of the Term Loan B is fixed at 6.15% to June 2019.
• USD $50 million of the Term Loan B is fixed at 6.49% to June 2019.
• USD $75 million of the Term Loan B debt has been swapped into Canadian dollars at an effective
exchange rate of 1.32 until June 26, 2018.
Taking into account the above interest rate swaps and excluding revolving loans, deferred compensation and the related earnout, Clearwater has effectively fixed the interest rate on 46% of its debt. Clearwater includes the change in market value for all interest rate swap and foreign exchange swap arrangements in earnings during the period in finance costs.
The revolver, term loan A and term loan B are secured by a first charge on cash and cash equivalents, accounts receivable, inventory, marine vessels, licenses and quotas, and Clearwater’s investments in certain subsidiaries. Clearwater’s debt facilities are subject to certain financial and non-financial covenants. Clearwater is in compliance with all covenants associated with its debt facilities. Acquisition and financing of Macduff Shellfish Group Limited On October 30, 2015 Clearwater completed its acquisition of Macduff, one of Europe’s leading wild shellfish companies. The total fair value of the consideration paid or payable by Clearwater in connection with the acquisition as of the closing was £81 million (CDN $164 million) plus the repayment of Macduff outstanding debt facilities of £19 million (CDN $39 million) and management fees of £1.6 million (CDN $3.2 million) for a total of £102 million (CDN $206 million). Macduff was acquired for cash consideration and an unsecured deferred consideration obligation of £27.0 million (the “Deferred Consideration”) (CDN - $54.7 million) with a contingent consideration component that will be a minimum of £3.8 million (CDN - $7.7 million).
Clearwater financed the cash portion of the acquisition from existing loan facilities including:
• CAD $75 million increase in Term Loan B facility
• CAD $25 million increase in Revolving Loan Facility
• CAD $51 million borrowing on existing Revolving Loan Facility and cash on hand

1 – Refer to discussion on non-IFRS measures, definitions and reconciliations 33 | P a g e
Liquidity Clearwater has a number of treasury management policies and objectives to promote strong liquidity and continued access to capital to fund its growth. These include policies and strategies with respect to liquidity, leverage, foreign exchange management, free cash flows and dividends. Management continuously evaluates its capital structure in light of these policies and strategies:
• Liquidity – As of December 31, 2016 Clearwater had $39.5 million in cash, and a $100.0 million revolving loan, of which $ $63.1 million was available for drawing upon. The cash balance, together with available credit on the revolving loan, is used to manage seasonal working capital demands, capital expenditures, and other commitments.
Clearwater’s operations experience a predictable seasonal pattern in which sales, margins and adjusted EBITDA are higher in the second half of the year whereas investments in capital expenditures and working capital are lower, resulting in higher free cash flows and lower leverage in the second half of the year. This typically results in lower free cash flow, higher debt balances and higher leverage in the first half of the year.
• Leverage1 – Clearwater’s long-term leverage target calculated as net debt to adjusted EBITDA is 3.0x or lower. Periodically, leverage may be higher due to planned investments, or lower due to seasonality but over time Clearwater manages to this target. As of December 31, 2016 leverage decreased to 4.2x from 4.4x as of December 31, 2015. The decrease is primarily due to a lower GBP exchange rate on the Deferred Obligation and Earnout Liability and the US dollar exchange rate on USD denominated debt compared to 2015. Leverage is not a recognized measure under IFRS, and therefore is unlikely to be comparable to similar measures presented by other companies. Management believes leverage to be a useful term when discussing liquidity and manages its leverage. In addition, as leverage is a measure frequently analyzed for public companies, Clearwater has calculated the amount in order to assist readers in this review. Leverage should not be construed as a measure of cash flows. Clearwater’s leverage measure is based on the ratio of Clearwater’s share of adjusted EBITDA to its outstanding debt, net of cash balances.

34 | P a g e
In 000's of Canadian dollars
As at December 31 2016 2015 2014
Adjusted EBITDA1,4 (excluding non-controlling interest) $ 98,447 $ 101,310 $ 70,651
Debt2,3 (excluding non-controlling interest) 436,834 475,685 272,554
Less cash (excluding non-controlling interest) (25,110) (32,938) (40,712)
Net debt $ 411,724 $ 442,747 $ 231,842 Leverage 4.2 4.4 3.3
1 - Refer to discussion on non-IFRS measures, definitions and reconciliations.
2 - Debt at December 31, 2016 has been adjusted to include the USD $75 million cross-currency swap at contracted rates of 1.3235 that was entered into in the third quarter 2015.
3 - Debt is net of deferred financing charges of $2.0 million (December 31, 2015 - $2.3 million; December 31, 2014 - $0.6 million)
4 - Adjusted EBITDA for 2015 includes an adjustment of $11.9 million to include the trailing earnings of Macduff which were acquired on October 3, 2015.
1 – Refer to discussion on risks and uncertainties 35 | P a g e
• Foreign Exchange Management1
Clearwater’s plan to mitigate foreign exchange risk is as follows:
(1) Diversify sales geographically, which reduces the impact of any country-specific economic and exchange risks on its business.
(2) Execute on pricing strategies so as to offset the impact of exchange rates
(3) Limit the amount of long-term sales contracts – Clearwater has very few long-term sales contracts with any customers. Contracts are typically less than six months.
(4) Use conservative exchange estimates – Clearwater regularly reviews economist estimates of
future exchange rates and uses conservative estimates when managing its business.
(5) Foreign exchange risk management - Clearwater has a targeted foreign exchange program. This program focuses on using forward contracts to lock in exchange rates up to 15 months for sales currencies (the US dollar, Euro, Yen and Sterling) thereby lowering the potential volatility in cash flows from changes in exchange rates.
As of March 8, 2017 Clearwater had forward exchange contracts to be settled in 2017 and 2018 of: � US dollar $70.4 million at an average rate of 1.30; � 2.8 billion Yen at an average rate of .012; � 35.8 million Euro at an average rate of 1.47; � 11.8 million Euro to GBP at an average rate of 0.86; � US dollar $3.9 million US to GBP at an average rate of 0.81; and � 2.6 million Euro to CDN at an average rate of 1.41.
The purpose of these contracts is to give certainty to Clearwater on the exchange rates it receives on a portion of its foreign currency sales1. The foreign exchange contracts effectively adjust the cash proceeds received on sales receipts to the rates that Clearwater planned for and contracted for as part of this annual planning cycle and its foreign exchange management program. When spot exchange rates are above contract rates at the date of maturity of the contracts Clearwater realizes a loss and conversely, when spot exchange rates are lower it realizes a gain. At the same time, given that Clearwater only hedges up to 75% of its net exposures and that higher or lower spot exchange rates are reflected in sales, any losses or gains on contracts are more than offset by the impact on sales.

1 – Refer to discussion on non-IFRS measures, definitions and reconciliations 36 | P a g e
• Free cash flows1 - Clearwater has a goal to generate strong cash flows from operations in order to fund scheduled loan payments and capital expenditures and in turn to use this free cash flow to invest in growth investments. Clearwater’s goal is to grow free cash flows such that it can fund growth, target leverage of approximately 3x Adjusted EBITDA and pay a sustainable dividend to its shareholders.
13 weeks ended
December 31
Year Ended December 31
2016 2015 2016 2015 2014
Adjusted EBITDA1 $ 29,460 $ 39,000 $ 120,937 $ 109,732 $ 87,368
Less:
Cash Interest (6,778) (5,471) (24,776) (19,006) (14,938)
Cash taxes (2,349) 736 (7,078) (1,896) (2,585)
Other income and expense items (5,591) (926) (4,955) (1,590) (5,295)
Operating cash flow before changes in working capital 14,742 33,339 84,128 87,240 64,550
Changes in working capital 64,745 33,482 (21,088) (18,746) 3,476
Cash flows from operating activities 79,487 66,821 63,040 68,494 68,026
Use of cash:
Purchase of property, plant, equipment, quota and other assets (13,158) (4,292) (56,332) (63,390) (83,309)
Disposal of fixed assets - 4,517 1,131 4,584 5
Less: Designated borrowingsA 5,703 230 25,883 35,097 63,431
Scheduled payments on long-term debt (1,519) (1,669) (6,475) (5,461) (8,360)
Payments on long-term incentive plans - - 5,670 8,953 -
Distribution to non-controlling interests (5,097) (2,781) (24,560) (11,817) (10,427)
Dividends received from joint venture - - - - 1,490
Other financing activities - 676 - 676 -
Non-routine project costs 684 888 1,885 1,953 -
Free cash flows1 $ 66,100 $ 64,390 $ 10,242 $ 39,089 $ 30,856
Add/(less):
Other debt borrowings (repayments) of debt, use of cashB (50,743) 90,261 (46,306) 78,099 (60,398)
Issuance of equity (25) - 53,024 58,628 32,487
Payments on long-term incentive plans - - (5,670) (8,953) -
Other investing activitiesC (2,203) (144,033) (2,513) (148,930) 1,805
Other financing activities (6,696) (5,555) (20,369) (14,425) (3,611)
Change in cash flows for the period $ 6,433 $ 5,063 $ (11,592)$ 3,508 $ 1,139
A – Designated borrowings relate to capital projects for which there is long-term financing and therefore they will not be financed with
operating cash flows. For 2016 the periods covered in this table includes the replacement of the Ocean Concord clam vessel. For the purpose
of free cash flow calculations the amount invested (up to the total amount of the related financing) during the period on these projects is
backed out of the calculation of free cash flows irrespective of the timing of the related borrowing.
B – Other debt borrowings (repayments) of debt includes $25.9 million of cash invested in designated capital projects.
C - Other investing activities for 2015 includes $151.1 million for the acquisition of Macduff, less cash acquired in the acquisition of $9.1
million.

37 | P a g e
Cash flow generated by Clearwater’s operations along with cash on deposit and available credit on the revolving loan are used to fund current operations, seasonal operations, seasonal working capital demands, capital expenditures, and other commitments. Free cash flows were $10.2 million for the year ended December 31 as compared to $39.1 million for the comparative period in 2015. Increase in distributions to non-controlling interests, increased investment in working capital, higher interest and taxes, partially offset by higher adjusted EBITDA resulting in lower free cash flows. Distributions to non-controlling interests were higher due to the timing of payments. Increases in working capital were due to increases in inventory primarily due to increased clam harvesting and the addition of the Macduff portfolio of products.. Higher cash interest was due to increased loan facilities as a result of the MacDuff acquisition in late 2015. Higher taxes were primarily due to higher income before tax. Certain large investments in longer term assets such as, vessel conversion and/or acquisitions, are funded with long term capital such as amortizing term loans. As a result Clearwater adds back the funding on those capital expenditures in the determination of free cash flows and deducts the related debt payments.
• Changes in working capital
13 weeks ended
December 31 Year ended
December 31
In 000's of Canadian dollars 2016 2015 2016 2015
Decrease (increase) in inventory $ 33,179 $ 16,680 $ (22,030) $ (7,297)
(Decrease) increase in accounts payable 13,154 3,291 (7,786) 5,025
Decrease (increase) in accounts receivable 20,722 17,562 3,775 (13,564)
(Increase) decrease in prepaids (2,309) (4,051) 4,953 (2,908)
$ 64,746 $ 33,482 $ (21,088) $ (18,744)
Working capital for the year ended December 31, 2016 was an investment of $21.1 million versus $18.7 million in the same period of 2015 primarily as a result of strong harvesting conditions for clams and procurement opportunities that increased inventory levels. Clearwater is focused on managing its free cash flows through:
• Managing working capital - Clearwater manages its investment in trade receivables through a combination of tight collection terms and when appropriate, discounting. Clearwater has a policy of utilizing a combination of credit reporting agencies, credit insurance, letters of credit and secured forms of payment to mitigate customer and country specific credit risk. As a result, Clearwater does not have any significant concentration of credit risk. Clearwater manages its investment in inventories through tight review of supply and production plans versus sales forecasts, and through continuous improvements in the integration of its fleet and sales plans.

38 | P a g e
• Capital spending - Clearwater grades investments in property, plant, equipment and licences as either return on investment (“ROI”) or maintenance capital and tracks each project. Significant expenditures that are expected to have a return in excess of the cost of capital are classified as ROI, and all refits and expenditures that are expected to return less than the average cost of capital are classified as maintenance. On average, Clearwater expects to invest $15-20 million a year in maintaining its fixed assets with a further $10-15 million of repairs and maintenance expensed and included in the cost of goods sold. In 2017 Clearwater expects to invest approximately $90 million in capital expenditures with the largest portion relating the purchase and conversion of the clam replacement vessel, vessel maintenance and refits.
• Dividends – On March 8, 2017 the Board of Directors approved and declared a dividend of $0.05 per share payable on April 3, 2017 to shareholders of record as of March 17, 2017. In making the determination of dividend levels Clearwater's Board gives consideration to several key principles including:
• expected future earnings;
• free cash flows that should be retained to reinvest in the business;
• the assurance that all obligations can be met with respect to existing loan agreements; and
• the desire to increase the dividend in the future as the business continues to grow and expand.
The Board will continue to review the policy on a regular basis to ensure the dividend level remains consistent with Clearwater’s long term dividend policy. These dividends are eligible dividends as defined for the purposes of the Income Tax Act (Canada) and applicable provincial legislation and, therefore, qualify for the favorable tax treatment applicable to such dividends.

39 | P a g e
Commitments In the normal course of business, Clearwater is obligated to make future payments, including contractual obligations for non-derivative and derivative financial instruments, operating leases and other commitments. The table includes undiscounted cash flows of financial liabilities, operating lease and other commitments, interest and principal cash flows based on the earliest date on which Clearwater is required to pay.
December 31, 2016 Carrying Amount
Total Contractual Cash Flow 2017 2018 2019 2020 2021 >2022
Interest - long-term debt 58,065 16,674 14,698 6,893 275 275 19,250
Principal repayments - long-term debt 435,711 67,005 58,463 295,172 9,608 1,963 3,500
Total long-term debt 436,414 493,776 83,679 73,161 302,065 9,883 2,238 22,750
Trade and other payables 75,953 75,953 75,953 - - - - -
Operating leases and other - 16,912 7,687 3,100 2,204 1,934 905 1,081
Capital and maintenance projects - 30,308 30,308 - - - - -
Derivative financial instruments - asset (4,821) (4,821) (4,821) - - - - -
Derivative financial instruments - liabilities 5,640 5,640 5,640 - - - - -
$ 513,185 $ 617,767 $ 198,446 $ 76,261 $ 304,269 $ 11,817 $ 3,143 $ 23,831
OUTLOOK Global demand for seafood is outpacing supply, creating favorable market dynamics for vertically integrated producers such as Clearwater which have strong resource access. Demand has been driven by growing worldwide population, shifting consumer tastes towards healthier diets, and rising purchasing power of middle class consumers in emerging economies.
The supply of wild seafood is limited and is expected to continue to lag behind the growing global demand. This supply-demand imbalance has created a marketplace in which purchasers of seafood are increasingly willing to pay a premium to suppliers that can provide consistent quality and food safety, wide diversity and reliable delivery of premium, wild, sustainably harvested seafood.
Clearwater, like other vertically integrated seafood companies, is well positioned to take advantage of this opportunity because of its licenses, premium product quality, diversity of species, global sales footprint, and year-round harvest and delivery capability.
2016 will be recorded the seventh consecutive year of record top and bottom line results for Clearwater. The single largest contributor to year over year growth was the addition of Macduff Shellfish, acquired in October 2015. Excluding Macduff, Clearwater’s core business financial performance was below expectations as the company felt the combined effects of shortages of supply in northern shrimp and sea scallops. The addition of the Belle Carnell combined with our proprietary advancements in harvesting technology across the clam fleet resulted in the complete harvest of the Arctic surf clam Total Allowable Catch (“TAC”) for the first time in the history of the fishery. While this bodes well for a strong 2017, the
40 | P a g e
rapid increase in supply was not anticipated and outstripped the near term capacity of our existing channels and customers to the detriment of prices, margins and year-end inventory levels. In 2017, we expect to deliver another year of record sales and adjusted EBITDA with growth in virtually every market, channel and species. Harvest conditions challenged us in 2016 but our scale access to supply, advanced harvesting and processing technology, diversity of species and breadth of markets channels and customers positions us well for sustainable and profitable growth in 2017 and beyond. Core Strategies Expanding Access to Supply - Clearwater will continue to actively invest in access to supply of core species and other complementary, high demand, premium, wild and sustainably harvested seafood through improved utilization and productivity of core licenses as well as acquisitions, partnerships, joint ventures and commercial agreements.
Target Profitable & Growing Markets, Channels & Customers –In 2017, Clearwater will continue to target markets, consumers, channels and customers on the basis of size, profitability, demand for eco-label seafood and ability to win. Our focus is to win in key channels and with customers that are winning with consumers.
• In Europe, Clearwater expects to benefit from the early ratification of the Comprehensive European Trade Agreement (CETA) by the European Parliament. As the largest seafood import market in the world, the millions of dollars of tariffs removed will enable expanded profitable growth for Clearwater and its customers.
• In Asia, Clearwater will continue to grow sales and distribution of all species with a particular emphasis on Arctic surf clam, live lobster, crab and whelk. In China, Clearwater expects to benefit from the expansion of foodservice distribution to more Tier 2 cities, retail distribution expansion in Tier 1 cities, as well as the rapid growth of the company’s China Ecommerce partnerships with Alibaba’s T-mall and JD.com. Both ecommerce platforms represent a large opportunity for Clearwater to capitalize on China’s booming $830 billion online market, providing Chinese consumers with the ability to purchase authentic Clearwater products. As the number of online shoppers in China increases, Clearwater will continue to leverage ecommerce to target profitable and growing markets, channels and customers.
Innovate and Position Products to Deliver Superior Customer Satisfaction and Value – Clearwater will continue to work with customers on new products and formats as we innovate and position our premium seafood to deliver superior satisfaction and value that is relevantly differentiated on the dimensions of taste, quality, safety, sustainability, wellness, convenience and fair labour practices. Increase Margins by Improving Price Realization and Cost Management - In 2017, Clearwater will continue expand our “ocean to shelf” global supply chain cost savings program to achieve greater efficiency and improved productivity throughout our global operations. This includes leveraging the scarcity of seafood supply versus increasing global demand to continuously improve price realization, revenue and margins. It also includes investing in innovative state-of-the-art technology, systems and processes that maximize value, minimize cost, reduce waste, increase yield and improve quality, reliability and safety of our products and people.

41 | P a g e
Pursue and Preserve the Long Term Sustainability of Resources on Land and Sea - Clearwater will continue to invest in science and sustainable harvesting technology and practices to add value to all fisheries in which we participate in Canada, Argentina and the United Kingdom. Build Organizational Capability, Capacity & Engagement – A high level of performance can only be achieved by a talented, engaged and high performing global workforce at sea and on land, employing well communicated strategies and plans with measurable objectives. Clearwater will continue to invest in our talented and engaged global workforce to continue to deliver on the operational and growth opportunities available to us. RISKS AND UNCERTAINTIES The performance of Clearwater’s business is susceptible to a number of risks which affect income, liquidity and cash flow, including risks related to resource supply, food processing and product liability, suppliers, customers, competition and foreign exchange exposure and lawsuits in the normal course of business. For further disclosure of additional risk factors please refer to the Annual Information Form, which is available on Sedar at www.sedar.com as well as Clearwater’s website at www.clearwater.ca. Foreign exchange risk
Clearwater’s financial results are subject to volatility as a result of foreign exchange rate fluctuations.
The majority of Clearwater’s sales are to locations outside Canada and are transacted in currencies other than the Canadian dollar whereas the majority of its expenses are in Canadian dollars. As a result, fluctuations in the foreign exchange rates of these currencies can have a material impact on the financial condition and operating results. In addition Clearwater has a subsidiary which operates in the offshore scallop fishery in Argentina which exposes Clearwater to changes in the value of the Argentine Peso. Risks associated with foreign exchange are partially mitigated by the following strategies:
(1) Diversify sales internationally which reduces the impact of any country-specific economic risks.
(2) Execute on pricing strategies so as to offset the impact of exchange rates. (3) Limit the amount of long-term sales contracts – Clearwater has very few long-term sales
contracts with any customers. Contracts are typically less than 6 months and are based on list prices that provide a margin for exchange rate fluctuations.
(4) Plan conservatively - Clearwater regularly reviews economist estimates of future exchange rates and uses conservative estimates when managing its business, and
(5) Foreign exchange hedging program - that focuses on using forward contracts to enable Clearwater to lock in exchange rates up to 15 months for key sales currencies (the US dollar, Euro, Yen and Sterling) thereby lowering the potential volatility in cash flows through derivative contracts.
In 2016 approximately 37% of Clearwater’s sales were denominated in US dollars. Based on 2016 sales and excluding the impact of its hedging program,
• a change of 0.01 in the U.S. dollar rate converted to Canadian dollars would result in a $1.7 million change in sales.
42 | P a g e
• a change of 0.01 in the Euro rate as converted to Canadian dollars would result in a $1.1 million change in sales.
• a change of 0.001 in the Yen rate as converted to Canadian dollars would result in a change of $4.8 million in sales.
As of March 8, 2017 Clearwater had forward exchange contracts to be settled in 2017 and 2018 of:
� US dollar $70.4 million at an average rate of 1.30; � 2.8 billion Yen at an average rate of .012; � 35.8 million Euro at an average rate of 1.47; � 11.8 million Euro to GBP at an average rate of 0.86; � US dollar $3.9 million US to GBP at an average rate of 0.81; and � 2.6 million Euro to CDN at an average rate of 1.41.
The purpose of these contracts is to give certainty to Clearwater on the exchange rates that it expects to receive on a portion of its foreign currency sales. The foreign exchange contracts effectively adjust the cash proceeds received on sales receipts to the rates that Clearwater planned for and contracted for as part of this annual planning cycle and its foreign exchange management program. When spot exchange rates are above contract rates at the date of maturity of the contracts Clearwater realizes a loss and conversely, when spot exchange rates are lower it realizes a gain.
Political risk
Our international operations are subject to economic and political risks, which could materially and adversely affect our business. Our operations and investments are subject to numerous risks, including fluctuations in foreign currency, exchange rates and controls, expropriation of our assets, nationalization, renegotiation, forced divestiture, modification or nullification of our contracts and changes in foreign laws or other regulatory policies of foreign governments and having to submit to the jurisdiction of a foreign court or arbitration panel or having to enforce the judgment of a foreign court or arbitration panel against a sovereign nation within its own territory. Argentina In December 2015 and largely the first half of 2016 our Argentine operation has been subject to fluctuations in foreign currency related to volatility with the Argentine Peso. Clearwater continues to monitor these fluctuations and any risks that the volatility in the exchange rates could cause Clearwater to report its Argentine operations using IAS 29 – Financial Reporting in Hyperinflationary Economies. Our operations in Argentina and elsewhere may be negatively affected by both foreign exchange and expropriation losses as well as the increased cost and risks of doing business in developing markets. We mitigate this risk through maintaining a policy of repatriating our share of the earnings from Argentina through dividends and we do not maintain any material financial assets that are surplus to our needs to operate the business outside of Canada. We do not carry financial assets in Pesos to mitigate exchange risk. In addition we have structured our operations in Argentina with an Argentine partner who owns 20% of the Argentine business and who is actively managing the business. In certain previous years, Clearwater has been unable to repatriate dividends from Argentina.
43 | P a g e
To compensate for the potential restriction on dividend payouts Clearwater put in place domestic loan financing in Argentina related to the purchase of a replacement vessel. The replacement of this vessel will necessitate that some funds be used for the related loan domestic payments, thus alleviating the need for any material dividend payments for the short term. No assurance can be given that our operations will not be adversely impacted as a result of existing or future legislation. United Kingdom On June 23, 2016, the United Kingdom (“UK”) voted to leave the European Union (“EU”). Although the vote has taken place, our understanding is that this vote initiates a negotiation process between the UK and the EU over the terms of the withdrawal and the country’s future relationship with the EU. This negotiation process is likely to take several years and as such it will take some time to develop the full details of the exit plan. With the acquisition of Macduff, Clearwater and Macduff are confident that we will see continued strength and growth in our business. We are confident in our ability to mitigate any negative impacts on the business and continue to monitor the impact on operations. At this time we do not expect any material impacts on the business as a result of this decision. We will continue to analyze the detailed impacts on the business as the details of the exit agreement become known. United States NAFTA is a comprehensive trade agreement that sets the rules of trade and investment between Canada, the United States, and Mexico. Since the agreement entered into force on January 1, 1994, NAFTA has systematically eliminated most tariff and non-tariff barriers to free trade and investment between the three NAFTA countries. The current President of the United States, has expressed his intent to change the existing NAFTA, however the specifics related to these changes are unknown at this time and therefore the impact to Canada and Clearwater is indeterminable. Approximately 14% of total sales for 2016 were in the United States. Management continues to review, assess and monitor for any changes to NAFTA that could significantly impact Clearwater. Europe In February 2017, the European Union (“EU”) approved a deal which will drop barriers between the EU and Canada (the “Comprehensive Economic and Trade Agreement” or “CETA”). Europe is one of the world’s top consumption markets for seafood. The EU imported in excess of CAD $25 billion of seafood with exports of only CAD $5.7 billion. Europe is a major export market for Clearwater products, representing approximately 40% of total sales or $246 million in 2016. With CETA, Clearwater and its’ European customers expect to see a financial benefit through tariff reduction. Clearwater also anticipates the reduction in tariffs to lead to accelerated growth in the European market. China and Japan On January 30, 2017, the Government of the United States officially withdrew from the Trans-Pacific Partnership Agreement (“TPP”). As much of the TPP was negotiated around specific U.S. conditions, the status of the TPP is unknown and therefore, the impact to Canada and Clearwater is indeterminable. In the absence of TPP, the Governments of Canada, China and Japan have expressed interest in exploring bilateral free trade agreements. Ratified bilateral free trade agreements would be expected to have positive benefits to Clearwater’s sales and margins through reductions of tariffs and duties.
44 | P a g e
Contingent Liability From time to time Clearwater is subject to claims and lawsuits arising in the ordinary course of operations. In the opinion of management, the ultimate resolution of such pending legal proceedings will not have a material effect on Clearwater’s consolidated financial position. . Resource supply risk A material change in the population and biomass of scallop, lobster, clam, langoustine, crab, whelk or coldwater shrimp stocks in the fisheries in which we operate would materially and adversely affect our business. Clearwater's business is dependent on our allocated quotas of the annual Total Allowable Catch (TAC) for the species of seafood we harvest. The annual TAC is generally related to the health of the stock of the particular species as measured by a scientific survey of the resource. The population and biomass of shellfish stocks are subject to natural fluctuations some of which are beyond our control and which may be exacerbated by factors such as water temperatures, food availability, the presence of predators, disease, disruption in the food chain, reproductive problems or other biological issues. We are unable to fully predict the timing and extent of fluctuations in the population and biomass of the shellfish stocks we harvest and process, and we therefore may not be able to engage in effective measures to alleviate the adverse effects of these fluctuations. In addition, the population models utilized by scientists evaluating the fisheries in which we operate are constantly evolving. Certain changes in the population models could negatively impact future biomass estimates. Any material reduction in the population and biomass or TAC of the stocks from which we source seafood would materially and adversely affect our business. Any material increase in the population and biomass or TAC could dramatically reduce the market price of any of our products. The source of all Clearwater’s supply of products comes from fisheries in Canada, the United Kingdom and Argentina. The governments of Canada, the UK and EU and Argentina set the annual TAC and/or define fishing regulations for each species by reviewing scientific studies of the resource and then consulting with key stakeholders including ourselves and our competitors to determine acceptable catch levels. The potentially differing interests of our competitors may result in conflicting positions on issues around resource management, including the establishment of TACs and other management measures potentially limiting our ability to grow, to fully capitalize on our investments in harvesting capacity, or to achieve targeted yields from the resource, which may adversely affect our financial condition and results of operations. Resource supply risk is managed through adherence with government policies and regulations related to fishing in Canada and Argentina and Clearwater’s investment in science and technology, which enables Clearwater to understand the species that it harvests. Clearwater has invested in projects with the scientific community, such as ocean floor mapping and the resource assessment surveys to ensure access to the best available science information. Resource management plans, developed by DFO, are developed through an open and transparent process with strong input from industry participants. Clearwater engages in these processes to promote best in class, robust, and sustainable management of the resource. The Marine Stewardship Council certification of all of our core species demonstrates that the resources that Clearwater harvests meet the leading global standard for sustainable fisheries management practice. Clearwater further mitigates the risk associated with resource supply and competition through the diversification across species.

45 | P a g e
The northern shrimp resource is declining from record high levels and on July 15, 2016, the Government of Canada announced a decrease in the TAC for the Northern coldwater shrimp fishery area (SFA) 6. The decline in the TAC reverses the tremendous growth in the resource and is a reversal that has been expected by scientists and industry participants. Clearwater will continue to pursue adjustments to the business as required to find additional efficiencies and market value to offset the volume declines. The diversity in Clearwater’s species portfolio also helps to mitigate the impact of shrimp declines in the business.
Other risks
For further disclosure of additional risk factors please refer to the Annual Information Form. CRITICAL ACCOUNTING POLICIES Clearwater’s critical accounting policies are those that are important to the portrayal of Clearwater’s financial position and operations and may require management to make judgments based on underlying estimates and assumptions about future events and their effects. These estimates can include but are not limited to estimates regarding inventory valuation, accounts receivable valuation allowances, estimates of expected useful lives of vessels and plant facilities, and estimates of future cash flows for impairment tests. Underlying estimates and assumptions are based on historical experience and other factors that are believed by management to be reasonable under the circumstances. These estimates and assumptions are subject to change as new events occur, as more experience is acquired, as additional information is obtained, and as the operating environment changes. Clearwater has considered recent market conditions including changes to its cost of capital in making these estimates. Refer to the notes to the annual financial statements for a complete listing of critical accounting policies and estimates used in the preparation of the consolidated financial statements. Disclosure Controls and Internal Controls Over Financial Reporting Clearwater has established and maintains disclosure controls and procedures over financial reporting, as defined under the rules adopted by the Canadian Securities Regulators in instrument 52-109. The Chief Executive Officer (“CEO”) and Chief Financial Officer (“CFO”) have evaluated the design and effectiveness of Clearwater’s disclosure controls and procedures as of December 31, 2016 and have concluded that such procedures are adequate and effective to provide reasonable assurance that material information relating to Clearwater and its consolidated subsidiaries would be made known to them by others within those entities to allow for accurate and complete disclosures in annual filings. The Management of Clearwater, with the participation of the CEO and the CFO (collectively “Management”), is responsible for establishing and maintaining adequate internal controls over financial reporting. Clearwater’s internal controls over financial reporting are designed to provide reasonable assurance regarding the reliability of financial reporting and preparation of financial statements in accordance with International Financial Reporting Standards (“IFRS”). Management evaluated the design and effectiveness of Clearwater’s internal controls over financial reporting as at December 31, 2016. In making this assessment, management used the criteria set forth by the Committee of Sponsoring Organizations of the Treadway Commission in its report “Internal Control – Integrated Framework (2013)”. This evaluation included reviewing controls in key risk areas, assessing the design of these controls, testing these controls to determine their effectiveness, reviewing the results and then developing an overall conclusion.

46 | P a g e
For the year ended December 31, 2016, Macduff Shellfish was incorporated into management’s review and assessment of internal controls over financial reporting and in February 2016, Clearwater successfully completed the implementation of its new ERP system (SAP), including general ledger, sales distribution, supply chain and transportation modules, replacing its legacy systems. Based on management’s evaluation, the CEO and the CFO have concluded that as of December 31, 2016, Clearwater’s internal controls over financial reporting are effective in providing reasonable assurance regarding the reliability of financial reporting and the preparation of financial statements in accordance with IFRS. Adoption of new and revised standards
The IASB has issued the following standards that have not been applied in preparing these consolidated financial statements as their effective dates fall within annual periods beginning subsequent to the current reporting period. Foreign Currency Transactions and Advance Consideration (IFRIC 22)
On December 6, 2016, the IASB issued IFRIC 22, Foreign Currency Transactions and Advance Consideration which clarifies the date of the transaction, for the purpose of determining the exchange rate to use on initial recognition of the related asset, expense or income, is the date on which an entity has received or paid advance consideration. The Company intends to adopt IFRIC 22 in its financial statements for the annual period beginning on January 1, 2018. The extent of the impact of adoption of IFRIC 22 has not yet been determined.
Disclosure Initiative (Amendments to IAS 7)
On January 7, 2016 the IASB issued Disclosure Initiative (Amendments to IAS 7). The amendments require disclosures that enable users of financial statements to evaluate changes in liabilities arising from financing activities, including both changes arising from cash flow and non-cash changes. One way to meet this new disclosure requirement is to provide a reconciliation between the opening and closing balances for liabilities from financing activities.
The Company intends to adopt the amendments to IAS 7 in its financial statements for the annual period beginning on January 1, 2017. To meet the disclosure requirement, the company will provide a reconciliation of the opening and closing balances of long-term debt.
Recognition of Deferred Tax Assets for Unrealized Losses (Amendments to IAS 12)
The amendments clarify that the existence of a deductible temporary difference depends solely on a comparison of the carrying amount of an asset and its tax base at the end of the reporting period, and is not affected by possible future changes in the carrying amount or expected manner of recovery of the asset. The amendments also clarify the methodology to determine the future taxable profits used for assessing the utilization of deductible temporary differences.
The Company intends to adopt the amendments to IAS 12 in its financial statements for the annual period beginning on January 1, 2017. The extent of the impact of adoption of the amendments is not expected to have a material impact on the consolidated financial statements.

47 | P a g e
IFRS 15 – Revenue from Contracts with Customers
The standard contains a single model that applies to contracts with customers and two approaches to recognising revenue: at a point in time or over time. The model features a contract-based five-step analysis of transactions to determine whether, how much and when revenue is recognized. New estimates and judgmental thresholds have been introduced, which may affect the amount and/or timing of revenue recognized. The new standard applies to contracts with customers. It does not apply to insurance contracts, financial instruments or lease contracts, which fall in the scope of other IFRSs. The Company intends to adopt IFRS 15 in its financial statements for the annual period beginning on January 1, 2018. The extent of the impact of adoption of the standard has not yet been determined.
IFRS 9 – Financial Instruments
IFRS 9 (2014) introduces new requirements for the classification and measurement of financial assets. Under IFRS 9 (2014), financial assets are classified and measured based on the business model in which they are held and the characteristics of their contractual cash flows. The standard introduces additional changes relating to financial liabilities. It also amends the impairment model by introducing a new ‘expected credit loss’ model for calculating impairment. IFRS 9 (2014) also includes a new general hedge accounting standard which aligns hedge accounting more closely with risk management. This new standard does not fundamentally change the types of hedging relationships or the requirement to measure and recognize ineffectiveness; however it will provide more hedging strategies that are used for risk management to qualify for hedge accounting and introduce more judgment to assess the effectiveness of a hedging relationship. Special transitional requirements have been set for the application of the new general hedging model.
The Company intends to adopt IFRS 9 (2014) in its financial statements for the annual period beginning on January 1, 2018. The extent of the impact of adoption of the standard has not yet been determined.
IFRS 16 Leases
On January 13, 2016 the IASB issued IFRS 16 Leases. This standard introduces a single lessee accounting model and requires a lessee to recognize assets and liabilities for all leases with a term of more than 12 months, unless the underlying asset is of low value. A lessee is required to recognize a right-of-use asset representing its right to use the underlying asset and a lease liability representing its obligation to make lease payments. This standard substantially carries forward the lessor accounting requirements of IAS 17, while requiring enhanced disclosures to be provided by lessors. Other areas of the lease accounting model have been impacted, including the definition of a lease. Transitional provisions have been provided. The Company intends to adopt IFRS 16 in its financial statements for the annual period beginning on January 1, 2019. The extent of the impact of adoption of the standard has not yet been determined.

48 | P a g e
Transfer of assets between an investor and its associate or joint venture (amendments to IFRS 10)
On September 11, 2014 the IASB issued Sale or Contribution of Assets between an Investor and its Associate or Joint Venture (Amendments to IFRS 10 and IAS 28). The amendments were to be applied prospectively for annual periods beginning on or after January 1, 2016, however, on December 17, 2015 the IASB decided to defer the effective date for these amendments indefinitely. The amendments address an acknowledged inconsistency between the requirements in IFRS 10 and those in IAS 28 (2011), in dealing with the sale or contribution of assets between an investor and its associate or joint venture. Specifically, under the existing consolidation standard the parent recognises the full gain on the loss of control, whereas under the existing guidance on associates and joint ventures the parent recognises the gain only to the extent of unrelated investors’ interests in the associate or joint venture. The main consequence of the amendments is that a full gain/loss is recognised when the assets transferred meet the definition of a ‘business’ under IFRS 3 Business Combinations. A partial gain/loss is recognised when the assets transferred do not meet the definition of a business, even if these assets are housed in a subsidiary. The Company will evaluate the impact if and when the IASB determines an effective date.
IFRS 2 Share-Based Payment
In June 2016, the IASB issued amendments to IFRS 2 Share-Based Payment. The amendments provide
clarification on how to account for certain types of share-based payment transactions.
The Company intends to adopt the amendments to IFRS 2 in its consolidated financial statements for the
annual period beginning January 1, 2018. The extent of the impact of adoption of the amendments has not yet been determined.

49 | P a g e
Related Party Transactions Clearwater often transacts in the normal course of business with other related parties. The details are as follows for the year ended December 31, 2016 and 2015: Clearwater rents office space to Clearwater Fine Foods Incorporated (“CFFI”) (the controlling shareholder of Clearwater) and provides computer network support services to CFFI. The net amount due to CFFI in respect of these transactions was $0.04 million (December 31, 2015 – net amount due to CFFI of $0.05 million), is unsecured and due on demand. In June 2016, Clearwater sold an idle vessel to the joint venture, the sales price of CDN $13.5 million dollars was the book value at the time of the sale plus refit costs. For the year ended December 31, 2016, Clearwater expensed approximately $0.4 million in factory and equipment rentals from companies related to a member of its management team (December 31, 2015- $0.07 million). Clearwater incurred $0.04 million in legal fees paid to a law firm in which a Director of Clearwater is a partner (December 31, 2015 - $0.1 million). In addition, for the year ended December 31, 2016, Clearwater expensed approximately $0.1 million for goods and services from companies related to its parent (December 31, 2015 - $0.2 million). The transactions are recorded at the exchange amount and the balance due to these companies was $0.05 million as at December 31, 2016 (December 31, 2015 - $0.01 million). At December 31, 2016 Clearwater had a balance of $1.4 million (December 31, 2015 - $1.3 million), included in long term receivables, for interest bearing loans made to a non-controlling interest shareholder in a subsidiary.

50 | P a g e
SUMMARY OF QUARTERLY RESULTS The following table provides historical data for the nine most recently completed quarters.
First Second Third Fourth
In 000's of Canadian dollars Quarter Quarter Quarter Quarter
Fiscal 2016
Sales $ 116,225 $ 140,180 $ 189,457 $ 165,690
Earnings 15,812 13,514 17,859 12,411
Earnings per share ("EPS") 0.24 0.16 0.17 0.14
Diluted earnings per share1 0.24 0.16 0.17 0.14
Weighted average shares outstanding 59,958,998 60,439,577 63,934,698 63,934,698
Fiscal 2015
Sales $ 75,362 $ 116,748 $ 147,332 $ 165,503
Earnings (loss) (28,336) 9,739 1,717 (3,793)
Earnings (loss) per share ("EPS") (0.57) 0.10 (0.08) (0.07)
Diluted earnings (loss) per share (0.57) 0.10 (0.09) (0.07)
Fiscal 2014
Sales $ 77,771 $ 113,403 $ 134,069 $ 119,498
Earnings (loss) (12,144) 18,850 2,959 130
Earnings (loss) per share ("EPS") (0.27) 0.30 (0.02) (0.07)
Diluted earnings (loss) per share (0.27) 0.30 (0.02) (0.07)
1 - Diluted earnings (loss) per share are anti-dilutive for the first nine months of 2016, for the fourth quarter of 2015 and for all periods in 2014.
For a more detailed analysis of each quarter’s results, please refer to our quarterly reports and our annual reports. In general, sales increase with each successive quarter with the highest revenues in the third and fourth quarter of each year which is consistent with Clearwater’s seasonality. Volatility in exchange rates can have a significant impact on earnings. The volatility is partially offset by Clearwater’s foreign exchange management program. Net loss in the first and fourth quarter of 2015 includes unrealized foreign exchange losses on the translation of the US dollar denominated debt. Earnings in the second quarter of 2014 include unrealized foreign exchange gains of $17.7 million on the translation of long-term debt and marking forward contracts to market. This offsets the unrealized foreign exchange losses of $15.2 million on translation of long-term debt and marking forward contracts to market incurred in the first quarter of 2014.

51 | P a g e
NON- IFRS MEASURES, DEFINITIONS AND RECONCILIATIONS
Gross margin Gross margin consists of sales less cost of goods sold which includes harvesting, distribution, direct manufacturing costs, manufacturing overhead, certain administration expenses and depreciation related to manufacturing operations. Adjusted earnings before interest, tax, depreciation and amortization (“adjusted EBITDA”) Adjusted earnings before interest, tax, depreciation and amortization (“adjusted EBITDA”) is not a
recognized measure under IFRS, and therefore is unlikely to be comparable to similar measures presented
by other companies. Management believes that in addition to net earnings and cash provided by operating
activities, adjusted EBITDA is a useful supplemental measure from which to determine Clearwater’s ability
to generate cash available for debt service, working capital, capital expenditures, income taxes and
dividends. In addition, as adjusted EBITDA is a measure frequently analyzed for public companies,
Clearwater has calculated adjusted EBITDA in order to assist readers in this review. Adjusted EBITDA
should not be construed as an alternative to net earnings determined in accordance with IFRS as a measure
of liquidity, or as a measure of cash flows.
Adjusted EBITDA is defined as EBITDA excluding extraordinary, non-operating, non-recurring or non-
routine items that are unusual and are deemed not to be a part of normal operations of the business. Items
that are excluded from adjusted EBITDA include restructuring and reorganization expenses, gains and
losses on investment activities, costs associated with acquisitions to the extent not capitalized, financing
and refinancing costs, net gains on insurance claims and stock based compensation. In addition recurring
accounting gains and losses on foreign exchange (other than realized gains and losses on forward exchange
contracts), have been excluded from the calculation of Adjusted EBITDA. Unrealized gains and losses on
forward exchange contracts relate to economic hedging on future operational transactions and by adjusting
for them, the results more closely reflect the economic effect of the hedging relationships in the period to
which they relate.
Reconciliation of net earnings (loss) to adjusted EBITDA for the 13 weeks ended, the years ended December 31, 2016 and 2015 is as follows:

52 | P a g e
13 weeks ended Year Ended
December 31 December 31 December 31 December 31 December 31
2016 2015 2016 2015 2014
Earnings (loss) $ 12,411 $ (3,793) $ 59,596 $ (20,671) $ 9,797
Add (deduct):
Income taxes 6,261 1,860 16,446 4,387 5,949
Taxes and depreciation for equity investment 530 285 960 1,154 1,265
Depreciation and amortization 9,781 8,835 33,501 29,414 24,544
Interest on long-term debt and bank charges 7,256 6,008 26,889 20,336 15,716
Earnings before interest, taxes, depreciation and amortization $ 36,239 $ 13,195 $ 137,392 $ 34,620 $ 57,271
Add (deduct) other items:
Unrealized foreign exchange and derivative loss (income) (5,779) 15,607 (28,190) 62,053 17,288
Fair market value on embedded derivative (1,710) (2,761) (1,350) (2,118) (1,229)
Realized foreign exchange loss (gain) on working capital 776 3,900 7,803 (1,690) 1,172
Restructuring and refinancing costs 2,237 6,055 2,380 11,299 1,981
Stock based compensation (recovery) expense (2,303) 3,004 2,902 5,270 8,948
Loss (gain) on disposal of assets and quota - - - - 1,937
Loss on insurance claim - - - 300 -
Adjusted EBITDA $ 29,460 $ 39,000 $ 120,937 $ 109,734 $ 87,368
Adjusted EBITDA attributed to:
Non-controlling interests $ 4,382 $ 5,576 $ 22,491 $ 22,829 16,718
Shareholders of Clearwater 25,078 33,424 98,446 86,905 70,650
$ 29,460 $ 39,000 $ 120,937 $ 109,734 $ 87,368

53 | P a g e
Adjusted Earnings attributable to shareholders To assist readers in estimating our earnings we have included a calculation of adjusted earnings.
Management believes that in addition to earnings and cash provided by operating activities, adjusted
earnings is a useful supplemental measure from which to determine Clearwater’s earnings from operations
and ability to generate cash available for debt service, working capital, capital expenditures, income taxes
and dividends.
Reconciliation of net earnings to adjusted earnings for the 13 weeks and years ended December 31, 2016 and 2015 is as follows:
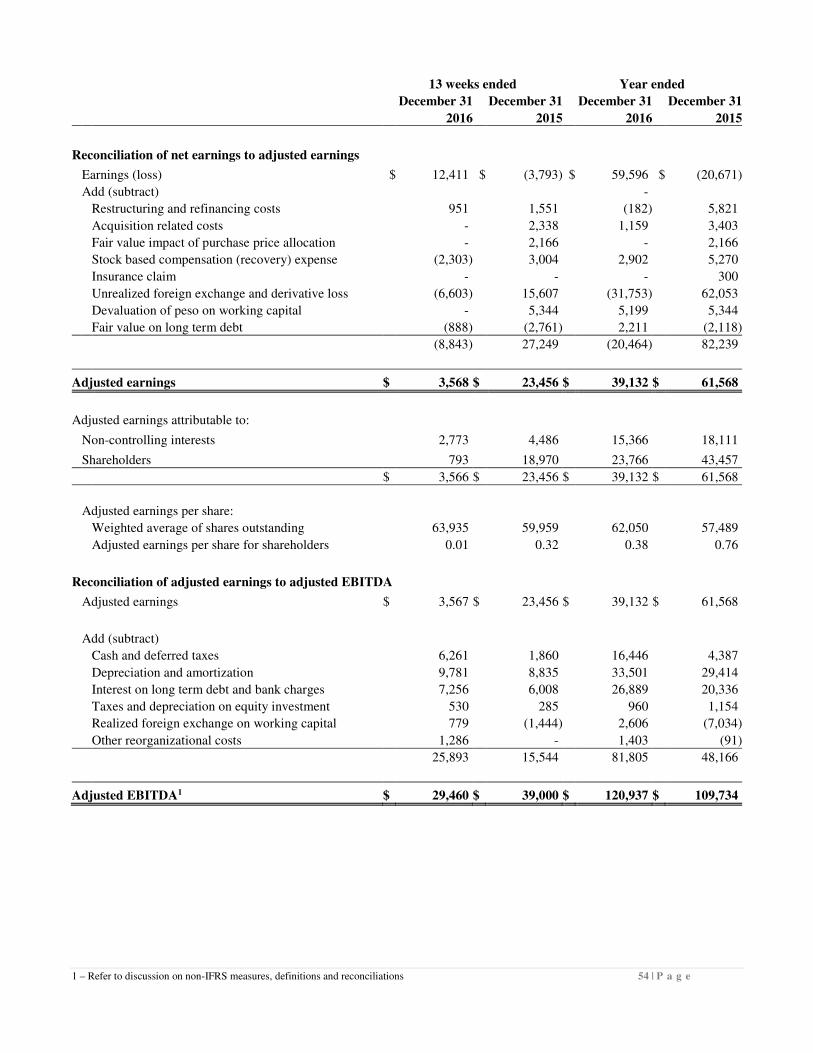
1 – Refer to discussion on non-IFRS measures, definitions and reconciliations 54 | P a g e
13 weeks ended Year ended
December 31 December 31 December 31 December 31
2016 2015 2016 2015
Reconciliation of net earnings to adjusted earnings
Earnings (loss) $ 12,411 $ (3,793) $ 59,596 $ (20,671)
Add (subtract) -
Restructuring and refinancing costs 951 1,551 (182) 5,821
Acquisition related costs - 2,338 1,159 3,403
Fair value impact of purchase price allocation - 2,166 - 2,166
Stock based compensation (recovery) expense (2,303) 3,004 2,902 5,270
Insurance claim - - - 300
Unrealized foreign exchange and derivative loss (6,603) 15,607 (31,753) 62,053
Devaluation of peso on working capital - 5,344 5,199 5,344
Fair value on long term debt (888) (2,761) 2,211 (2,118)
(8,843) 27,249 (20,464) 82,239
Adjusted earnings $ 3,568 $ 23,456 $ 39,132 $ 61,568
Adjusted earnings attributable to:
Non-controlling interests 2,773 4,486 15,366 18,111
Shareholders 793 18,970 23,766 43,457
$ 3,566 $ 23,456 $ 39,132 $ 61,568
Adjusted earnings per share:
Weighted average of shares outstanding 63,935 59,959 62,050 57,489
Adjusted earnings per share for shareholders 0.01 0.32 0.38 0.76
Reconciliation of adjusted earnings to adjusted EBITDA
Adjusted earnings $ 3,567 $ 23,456 $ 39,132 $ 61,568
Add (subtract)
Cash and deferred taxes 6,261 1,860 16,446 4,387
Depreciation and amortization 9,781 8,835 33,501 29,414
Interest on long term debt and bank charges 7,256 6,008 26,889 20,336
Taxes and depreciation on equity investment 530 285 960 1,154
Realized foreign exchange on working capital 779 (1,444) 2,606 (7,034)
Other reorganizational costs 1,286 - 1,403 (91)
25,893 15,544 81,805 48,166
Adjusted EBITDA1 $ 29,460 $ 39,000 $ 120,937 $ 109,734

55 | P a g e
Leverage Leverage is not a recognized measure under IFRS, and therefore is unlikely to be comparable to similar
measures presented by other companies. Management believes leverage to be a useful term when
discussing liquidity and does monitor and manage leverage. In addition, as leverage is a measure
frequently analyzed for public companies, Clearwater has calculated the amount in order to assist readers
in this review. Leverage should not be construed as a measure of liquidity or as a measure of cash flows.
Leverage for banking purposes differs from the below calculations as agreements require the exclusion of
certain cash from the calculation and EBITDA excludes non-controlling interests and most significant non-
cash and non-recurring items. Clearwater is in compliance with all of the non-financial and financial
covenants associated with its debt facilities.
Reconciliation of adjusted EBITDA (excluding non-controlling interest) to debt (net of deferred financing charges) for the years ended December 31, 2016 and 2015 is as follows:
In 000's of Canadian dollars
As at December 31 2016 2015 2014
Adjusted EBITDA1,4 (excluding non-controlling interest) $ 98,447 $ 101,310 $ 70,651
Debt2,3 (excluding non-controlling interest) 436,834 475,685 272,554
Less cash (excluding non-controlling interest) (25,110) (32,938) (40,712)
Net debt $ 411,724 $ 442,747 $ 231,842 Leverage 4.2 4.4 3.3
1 - Refer to discussion on non-IFRS measures, definitions and reconciliations.
2 - Debt at December 31, 2016 has been adjusted to include the USD $75 million cross-currency swap at contracted rates of 1.3235 that was entered into in the third quarter 2015.
3 - Debt is net of deferred financing charges of $2.0 million (December 31, 2015 - $2.3 million; December 31, 2014 - $0.6 million)
4 - Adjusted EBITDA for 2015 includes an adjustment of $11.9 million to include the trailing earnings of Macduff which were acquired on October 3, 2015.
56 | P a g e
Free cash flows Free cash flow is not a recognized measure under IFRS, and therefore is unlikely to be comparable to
similar measures presented by other companies. Management believes that in addition to net earnings and
cash provided by operating activities, free cash flow is a useful supplemental measure from which to
determine Clearwater’s ability to generate cash available for debt service, working capital, capital
expenditures and distributions. Free cash flow should not be construed as an alternative to net earnings
determined in accordance with IFRS, as a measure of liquidity, or as a measure of cash flows.
Free cash flow is defined as cash flows from operating activities, less planned capital expenditures (net of
any borrowings of debt designated to fund such expenditures), scheduled payments on long term debt and
distributions to non-controlling interests. Items excluded from the free cash flow include discretionary
items such as debt refinancing and repayments changes in the revolving loan and discretionary financing
and investing activities.
Reconciliation for the 13 weeks and year ended December 31, 2016 and 2015 is as follows:
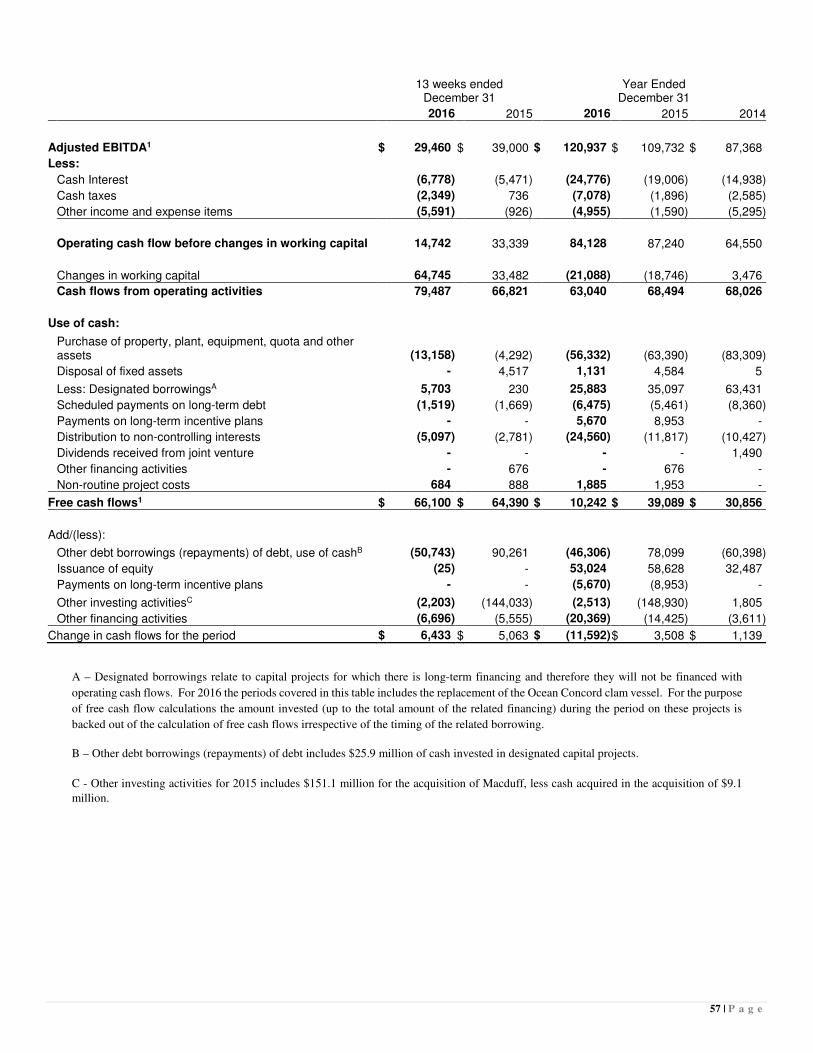
57 | P a g e
13 weeks ended December 31
Year Ended December 31
2016 2015 2016 2015 2014
Adjusted EBITDA1 $ 29,460 $ 39,000 $ 120,937 $ 109,732 $ 87,368
Less:
Cash Interest (6,778) (5,471) (24,776) (19,006) (14,938)
Cash taxes (2,349) 736 (7,078) (1,896) (2,585)
Other income and expense items (5,591) (926) (4,955) (1,590) (5,295)
Operating cash flow before changes in working capital 14,742 33,339 84,128 87,240 64,550
Changes in working capital 64,745 33,482 (21,088) (18,746) 3,476
Cash flows from operating activities 79,487 66,821 63,040 68,494 68,026
Use of cash:
Purchase of property, plant, equipment, quota and other assets (13,158) (4,292) (56,332) (63,390) (83,309)
Disposal of fixed assets - 4,517 1,131 4,584 5
Less: Designated borrowingsA 5,703 230 25,883 35,097 63,431
Scheduled payments on long-term debt (1,519) (1,669) (6,475) (5,461) (8,360)
Payments on long-term incentive plans - - 5,670 8,953 -
Distribution to non-controlling interests (5,097) (2,781) (24,560) (11,817) (10,427)
Dividends received from joint venture - - - - 1,490
Other financing activities - 676 - 676 -
Non-routine project costs 684 888 1,885 1,953 -
Free cash flows1 $ 66,100 $ 64,390 $ 10,242 $ 39,089 $ 30,856
Add/(less):
Other debt borrowings (repayments) of debt, use of cashB (50,743) 90,261 (46,306) 78,099 (60,398)
Issuance of equity (25) - 53,024 58,628 32,487
Payments on long-term incentive plans - - (5,670) (8,953) -
Other investing activitiesC (2,203) (144,033) (2,513) (148,930) 1,805
Other financing activities (6,696) (5,555) (20,369) (14,425) (3,611)
Change in cash flows for the period $ 6,433 $ 5,063 $ (11,592)$ 3,508 $ 1,139
A – Designated borrowings relate to capital projects for which there is long-term financing and therefore they will not be financed with
operating cash flows. For 2016 the periods covered in this table includes the replacement of the Ocean Concord clam vessel. For the purpose
of free cash flow calculations the amount invested (up to the total amount of the related financing) during the period on these projects is
backed out of the calculation of free cash flows irrespective of the timing of the related borrowing.
B – Other debt borrowings (repayments) of debt includes $25.9 million of cash invested in designated capital projects.
C - Other investing activities for 2015 includes $151.1 million for the acquisition of Macduff, less cash acquired in the acquisition of $9.1
million.

58 | P a g e
Return on Assets
Return on assets is not a recognized measure under IFRS, and therefore is unlikely to be comparable to
similar measures presented by other companies. Management believes that return on assets measures the
efficiency of the use of total assets to generate income. Return on assets should not be construed as an
alternative to net earnings determined in accordance with IFRS.
Return on assets is defined as the ratio of rolling 12 month adjusted earnings before interest and taxes
(“EBIT”) to average total quarterly assets including all working capital assets.
The calculation of adjusted earnings before interest and taxes to total assets for the twelve months ended December 31, 2016 and December 31, 2015 is as follows: In (000's) of Canadian dollars As at December 31 2016 2015 2014
Adjusted EBITDA1 $ 120,938 $ 109,734 $ 87,368
Depreciation and amortization 38,634 29,732 23,753
Adjusted earnings before interest and taxes 82,304 80,002 63,615 Average quarterly total assets $ 746,896 $ 581,253 $ 456,628
11.0% 13.8% 13.9%

59 | P a g e
CORPORATE INFORMATION
HEAD OFFICE OF CLEARWATER SEAFOODS INCORPORATED 757 Bedford Highway Bedford, Nova Scotia B4A 3Z7 902-443-0550 DIRECTORS OF CLEARWATER SEAFOODS INCORPORATED
EXECUTIVE OF CLEARWATER SEAFODS INCORPORATED
Colin E. MacDonald, Chairman of the Board John C. Risley President, Clearwater Fine Foods Inc. Harold Giles, Chair of Human Resource Development and Compensation (‘HRDCC”) Committee Independent Consultant Larry Hood, Chair of Audit Committee Former Audit Partner, KPMG Jane Craighead Senior Vice President, Scotiabank Mickey MacDonald President, Micco Companies Brendan Paddick Chief Executive Officer, Columbus Capital Corporation Stan Spavold, Chair of Finance Committee Executive Vice President, Clearwater Fine Foods Inc. Jim Dickson, Chair of Governance Committee Counsel, Stewart McKelvey
Ian Smith Chief Executive Officer Teresa Fortney Vice-President, Finance and Chief Financial Officer Ronald van der Giesen President, Global Supply Chain Greg Morency President, Global Markets and Chief Commercial Officer Christine Penney Vice-President, Sustainability & Public Affairs David Kavanagh Vice-President and General Counsel Dieter Gautschi Vice-President, Human Resources Kirk Rothenberger Chief Information Officer, Information Services INVESTOR RELATIONS
Investor relations (902) 443-0550 [email protected] AUDITORS
KPMG LLP Halifax, Nova Scotia SHARES LISTED
Toronto Stock Exchange SHARE Symbol: CLR TRANSFER AGENT
Computershare Investor Services Inc.

60 | P a g e
Clearwater Seafoods Incorporated 757 Bedford Highway, Bedford, Nova Scotia, Canada, B4A 3Z7 Tel. (902) 443-0550 Fax. (902) 443-7797 www.clearwater.ca


