Page 1
7/27/2019 climate analysis workshop
http://slidepdf.com/reader/full/climate-analysis-workshop 1/69
Understanding Weather Files and Visualizing DataUsing Computerized Tools
Climate Analysis
RESULTSLOADSGEOMETRY
Harvard Graduate School of Design
Diego Ibarra, M.Arch, MDesS, Doctoral Student. Sustainable Design.
Digital Workshops Series
Page 2
7/27/2019 climate analysis workshop
http://slidepdf.com/reader/full/climate-analysis-workshop 2/69
Weather Files (EPW, WEA, etc)
Overview of the Weather Tool
Overview of Climate Consultant 4
Demo: Visualization of EPW’s using
Weather Tool
Demo: Editing EPW’s using Excel
Agenda
Diego Ibarra
Page 3
7/27/2019 climate analysis workshop
http://slidepdf.com/reader/full/climate-analysis-workshop 3/69
Diego Ibarra
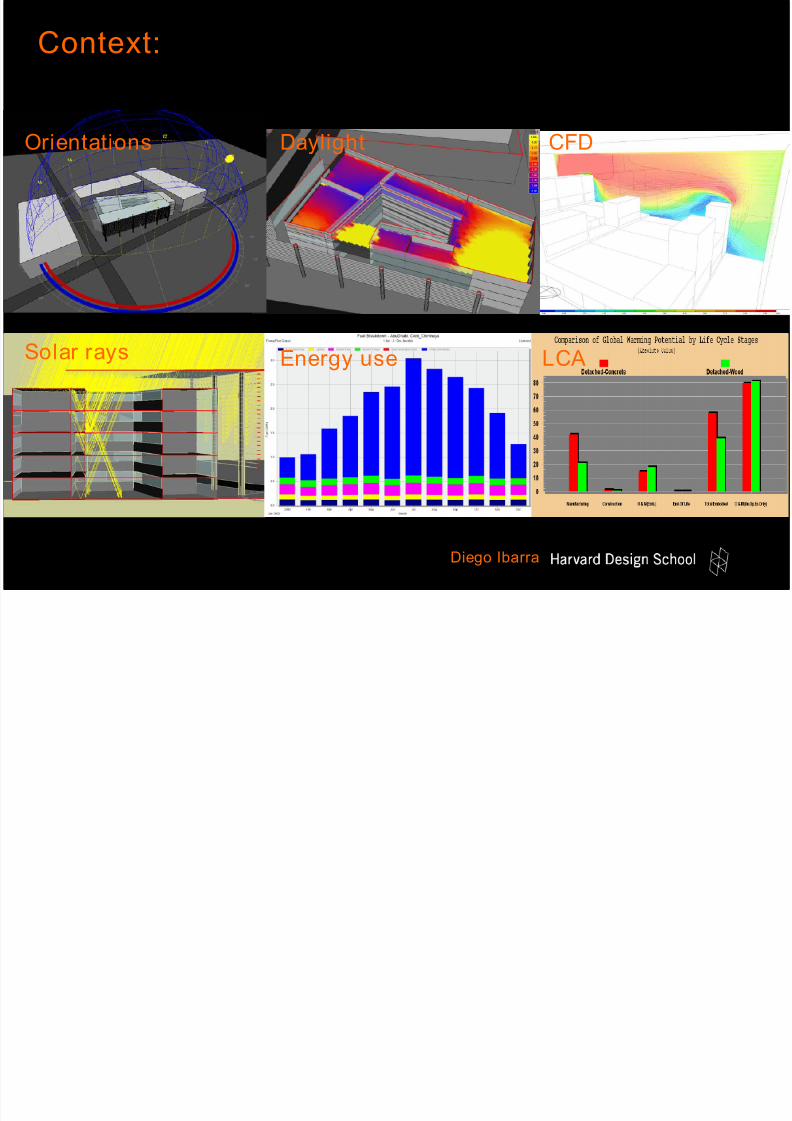
Context: All Environmental Design starts with a
comprehensive Climate Analysis.
12
34
Orientations Daylight CFD
Solar rays Energy use LCA
Page 4
7/27/2019 climate analysis workshop
http://slidepdf.com/reader/full/climate-analysis-workshop 4/69
Sustainable Design…It all starts by analyzing the local
environmental conditions….
Diego Ibarra
Page 5
7/27/2019 climate analysis workshop
http://slidepdf.com/reader/full/climate-analysis-workshop 5/69
Different GUIs for visualizing
Weather Data
OVERVIEW
Weather Files
(i.e. Energy Plus Weather FilesEPW)
Graphical User Interfaces
Other..Weather Data(EPW)
Page 6
7/27/2019 climate analysis workshop
http://slidepdf.com/reader/full/climate-analysis-workshop 6/69
A TMY is a data set of hourly values of solar radiation and meteorological
elements for a 1-year period.
It consists of months selected from individual years and concatenated to form
a complete year. Because of the selection criteria, TMYs are not appropriate
for simulations of wind energy conversion systems.
A TMY provides a standard for hourly data for solar radiation and other
meteorological elements that permit performance comparisons of system
types and configurations for one or more locations.
A TMY in not necessarily a good indicator of conditions over the next year, or
even the next 5 years. Rather, it represents conditions judged to be typicalover a long period of time, such as 30 years. Because they represent typical
rather than extreme conditions, they are not suited for designing systems and
their components to meet the worst-case conditions occurring at a location.
(User's Manual for TMY2s)
Fundamentals: Typical Meteorological Year -
A Description
Diego Ibarra
Page 7
7/27/2019 climate analysis workshop
http://slidepdf.com/reader/full/climate-analysis-workshop 7/69
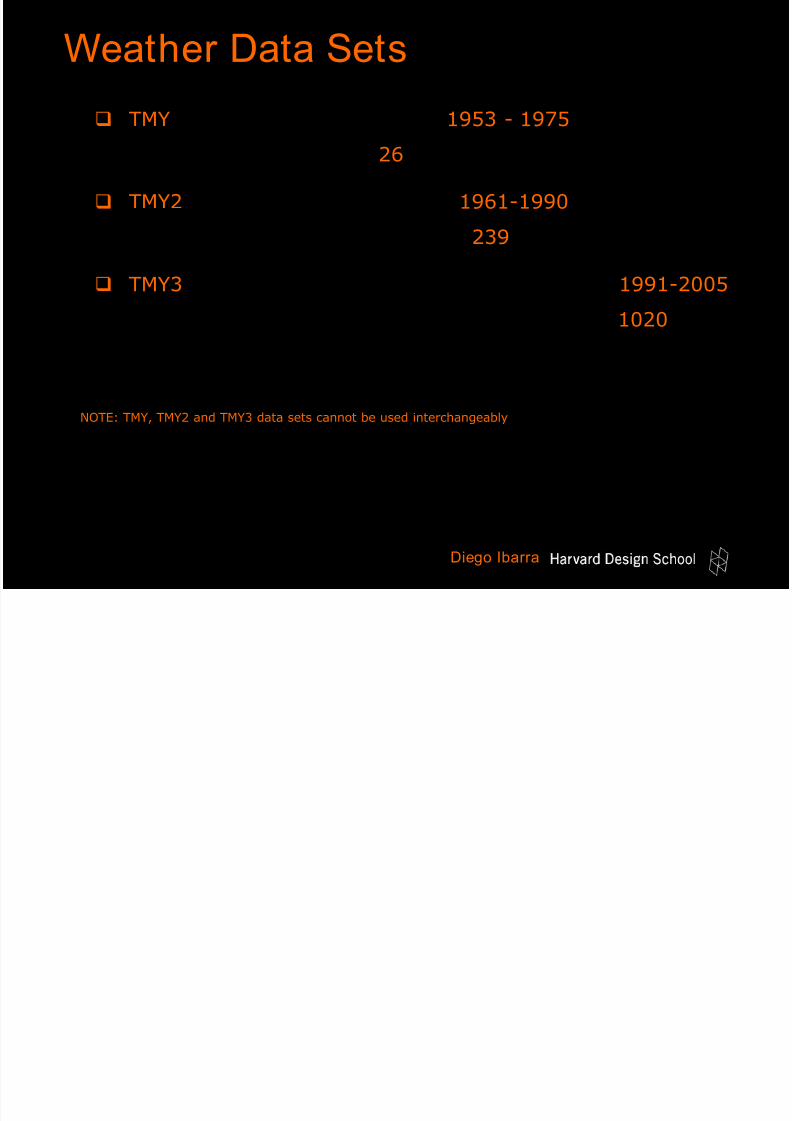
TMY data sets derived from the 1953 - 1975 National Climatic
Data Center (NCDC), for 26 stations.
TMY2 data sets derived from the 1961-1990 National SolarRadiation Data Base (NSRDB), for 239 stations.
TMY3 data sets derived from the 1961-1990 and 1991-2005
National Solar Radiation Data Base (NSRDB), for 1020
stations.
NOTE: TMY, TMY2 and TMY3 data sets cannot be used interchangeably because of differences in time (solar
versus local), formats, elements, and units. Unless they are revised, programs designed for TMY data will not
work with TMY2 data.
All illuminance and luminance values for all TMY3 stations from January 2 to 31 should be multiplied by 100
to obtain the correct units of Lux and Candela per square meter. NREL will be posting a corrected data set in
the near future (older TMY3s).
Weather Data Sets
Diego Ibarra
Page 8
7/27/2019 climate analysis workshop
http://slidepdf.com/reader/full/climate-analysis-workshop 8/69
WEA: Weather Data File
EPW: Energy Plus Weather Data files
IWEC (Data set: new International
Weather for Energy Calculations format
from ASHRAE)
Weather Files
Diego Ibarra
Page 9
7/27/2019 climate analysis workshop
http://slidepdf.com/reader/full/climate-analysis-workshop 9/69
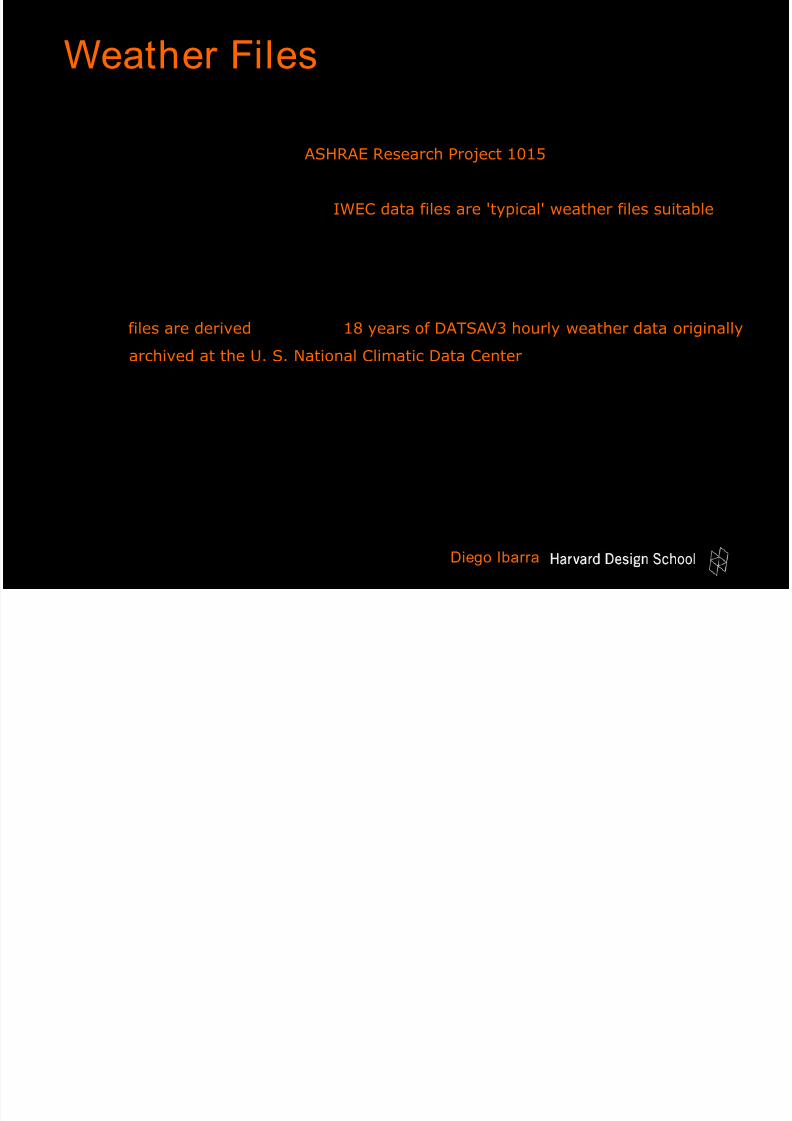
International Weather for Energy Calculations (IWEC)
The IWEC are the result of ASHRAE Research Project 1015 by Numerical Logics and
Bodycote Materials Testing Canada for ASHRAE Technical Committee 4.2
Weather Information. The IWEC data files are 'typical' weather files suitable for
use with building energy simulation programs for 227 locations outside the USA
and Canada. All 227 locations in the IWEC data set are available for download in
EnergyPlus weather format.
The files are derived from up to 18 years of DATSAV3 hourly weather data originally
archived at the U. S. National Climatic Data Center. The weather data is
supplemented by solar radiation estimated on an hourly basis from earth-sun
geometry and hourly weather elements, particularly cloud amount information.The IWEC CD-ROM is available from ASHRAE. The reference for the IWEC is:
ASHRAE. 2001. International Weather for Energy Calculations (IWEC Weather Files)
Users Manual and CD-ROM, Atlanta: ASHRAE
Weather Files
Diego Ibarra
Page 10
7/27/2019 climate analysis workshop
http://slidepdf.com/reader/full/climate-analysis-workshop 10/69
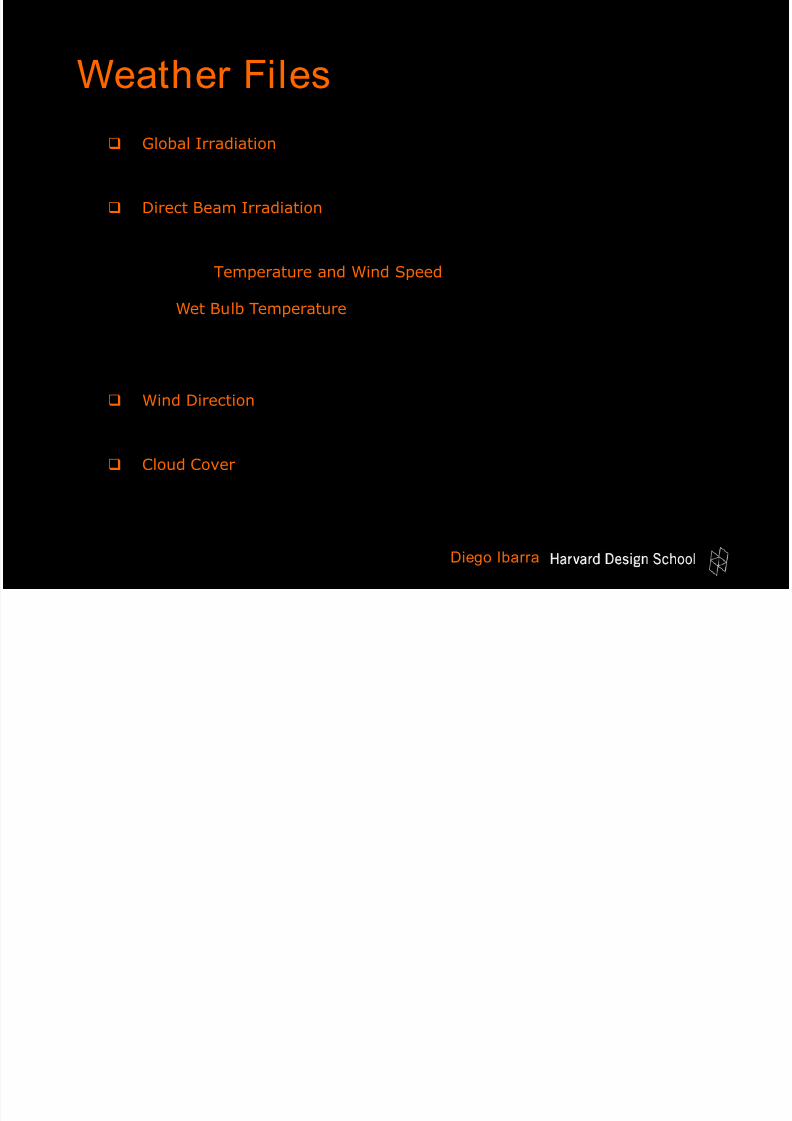
Global Irradiation is the amount of energy striking a horizontal surface
during the hour.
Direct Beam Irradiation gives the irradiation striking a plate perpendicular
to the sun's rays but does not include diffuse radiation.
Dry Bulb Temperature and Wind Speed are averaged over the hour.
The Wet Bulb Temperature is the temperature shown by a thermometerbulb surrounded by a damp wick. The WBT varies from the dry bulb
temperature according to the amount of evaporation and thus the humidity.
Wind Direction shows the compass points from which the wind is coming.
Usually measured at 10mts high at an unobstructed location (airports).
Cloud Cover is a visual estimate of the proportion of cloud covering the sky.
In this case it is in eights so 0 is no cloud and 8 is full cloud cover.
Weather Files
Diego Ibarra
Page 11
7/27/2019 climate analysis workshop
http://slidepdf.com/reader/full/climate-analysis-workshop 11/69
Hourly temperatures
Solar radiation (global and direct)
Humidity
Wind (direction and speed)
Cloud cover
Weather Files summary…
Diego Ibarra
Page 12
7/27/2019 climate analysis workshop
http://slidepdf.com/reader/full/climate-analysis-workshop 12/69
The Weather Tool uses its own proprietary .WEA fileformat, also used by all Square One products.
File sizes were once an issue…. some ASCII weather filesare “larger”, such as the TMY2 format for example,weighing in at over 1.2Meg. The WEA file comes in at139K, stores roughly the same data and compresses
down to less than 55K.
It DOES NOT store the same number of data validation
flags as EPWs, however this is not necessary for the usesto which it is put in a weather visualization tool. Be surein the future to run energy simulations with EPW files.
WeatherTool File Format: .WEA
Diego Ibarra
Page 13
7/27/2019 climate analysis workshop
http://slidepdf.com/reader/full/climate-analysis-workshop 13/69
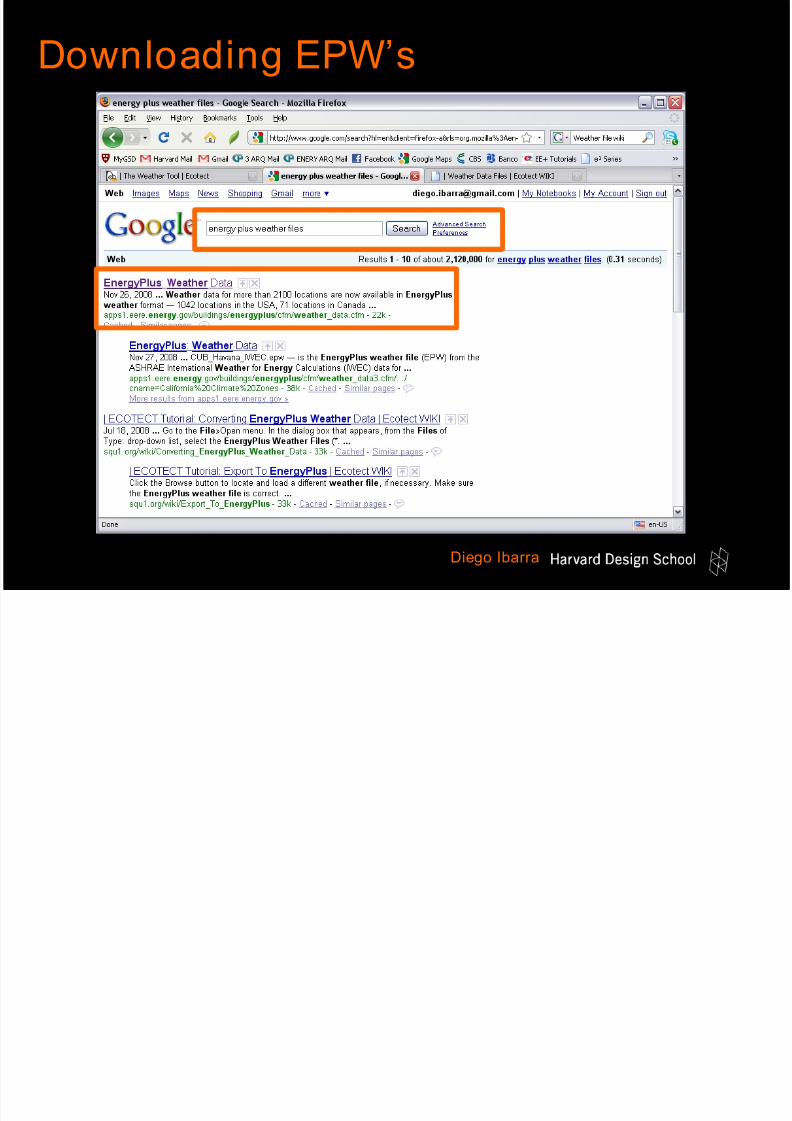
Weather data for more than 2100 locations are now
available in EnergyPlus weather format — 1042
locations in the USA, 71 locations in Canada, and
more than 1000 locations in 100 other countriesthroughout the world. (Compiled from TMY, TMY2,
TMY3, and other international data sets).
EPW: U.S. Department of Energy
Diego Ibarra
Page 14
7/27/2019 climate analysis workshop
http://slidepdf.com/reader/full/climate-analysis-workshop 14/69
Downloading EPW’s
Diego Ibarra
Page 15
7/27/2019 climate analysis workshop
http://slidepdf.com/reader/full/climate-analysis-workshop 15/69
Downloading EPW’s
Diego Ibarra
Page 16
7/27/2019 climate analysis workshop
http://slidepdf.com/reader/full/climate-analysis-workshop 16/69
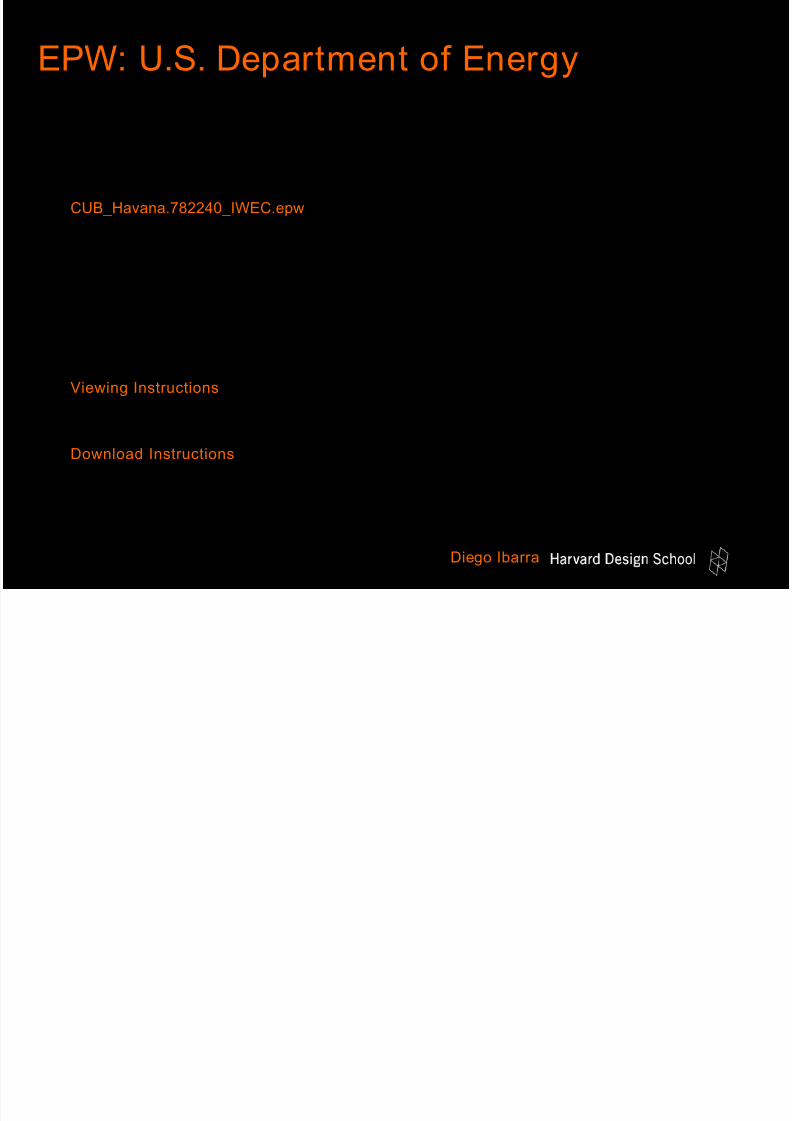
Each file is named using the ISO standard three-letter country abbreviation (i.e. CUB for Cuba), followed by the location name, World Meteorological Organization designation
(WMO) and the source format (CTZ2, CWEC, CityUHK, CSWD, CTYW, ETMY, IGDG, IMGW,
IMS, INETI, ISHRAE, ITMY, IWEC, KISR, NIWA, RMY, SWEC, SWERA, or TMY3). Thus,
CUB_Havana.782240_IWEC.epw — is the EnergyPlus weather file (EPW) from the ASHRAE International Weather for Energy Calculations (IWEC) data for Havana, Cuba,
WMO 782240.
There are three files associated with each location: EnergyPlus weather fi les (EPW), a
summary report on the data (STAT), and a compressed file (ZIP) which contains the EPW,STAT, and DDY (design conditions) fi les for the location. Note: all IWEC files only have
STAT and ZIP fi les.
Viewing Instructions
You can view the individual EPW and STAT files by clicking on one of the buttons above.
Download Instructions
For a specific location, you can download either Individual weather data files (EPW
format) or a data summary report (STAT format). File sizes range from 0.9 - 1.4 MB.
Or a ZIP fi le containing both weather data and summary report, EPW, and STAT formats.Files sizes range from 190 - 250 KB.
EPW: U.S. Department of Energy
Diego Ibarra
Page 17
7/27/2019 climate analysis workshop
http://slidepdf.com/reader/full/climate-analysis-workshop 17/69
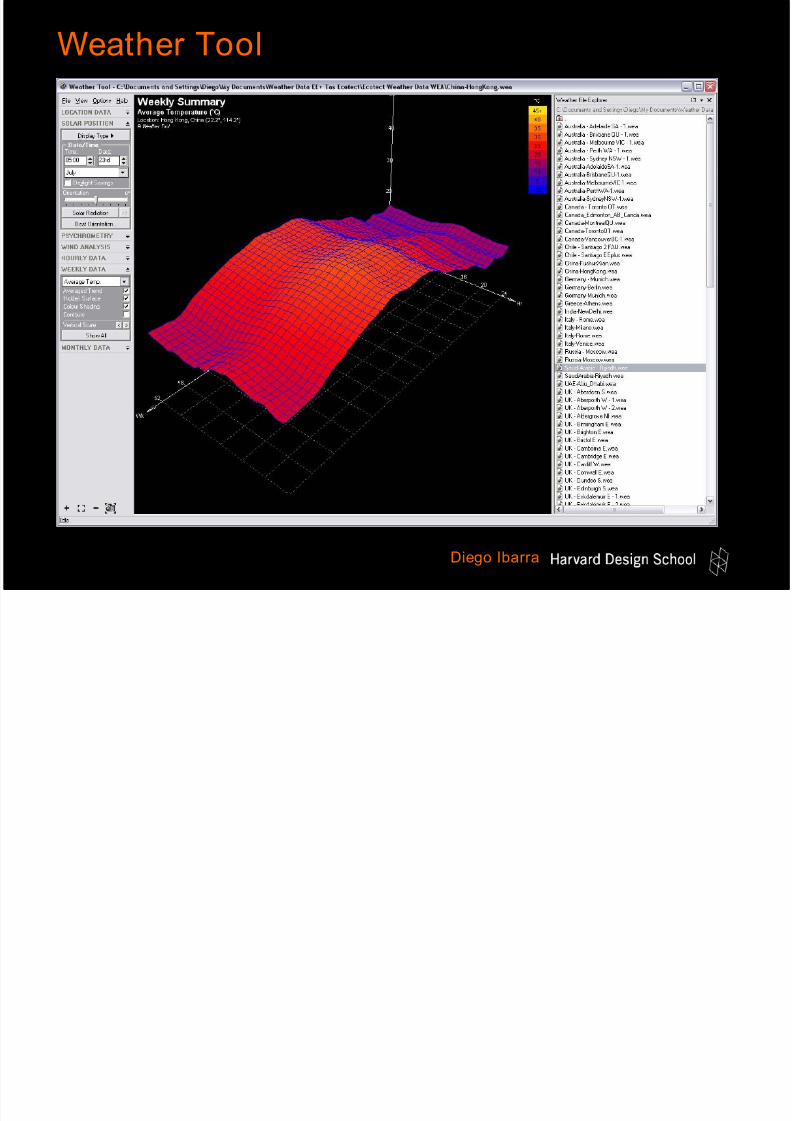
The Weather Tool is a
visualization and analysis
program for hourly climate
data. It recognizes a wide
range of international
weather file formats.
Weather Tool (Originally Square One bought by Autodesk…)
Graphical User Interface
Diego Ibarra
Page 18
7/27/2019 climate analysis workshop
http://slidepdf.com/reader/full/climate-analysis-workshop 18/69
Very user friendly Graphical User Interface. If you are
using ECOTECT, it comes with the suite. Maintains a
design expression of a report or presentation.
Flashy visualizations: loved by architects and great
impact on clients.
Easier to identify SOME patterns and subtle details that
characterize each different climate. (Solar)
Thresholds are less customizable and less detailed.
No available detailed technical information about the
passive strategies criteria (black box).
Weather Tool- Benefits
Diego Ibarra
Page 19
7/27/2019 climate analysis workshop
http://slidepdf.com/reader/full/climate-analysis-workshop 19/69
No available detailed technical information about
the passive strategies criteria (black box).
USE MAINLY TO DERIVE GENERAL CLIMATIC
CONDITIONS or TO CARRY OUT CLIMATE
COMPARISONS. (Relative Differences)
For detailed quantitative analysis the use of Climate Consultant is suggested.
Weather Tool- Benefits
Diego Ibarra
Page 20
7/27/2019 climate analysis workshop
http://slidepdf.com/reader/full/climate-analysis-workshop 20/69
Diego Ibarra
Weather Tool
Page 21
7/27/2019 climate analysis workshop
http://slidepdf.com/reader/full/climate-analysis-workshop 21/69
Diego Ibarra
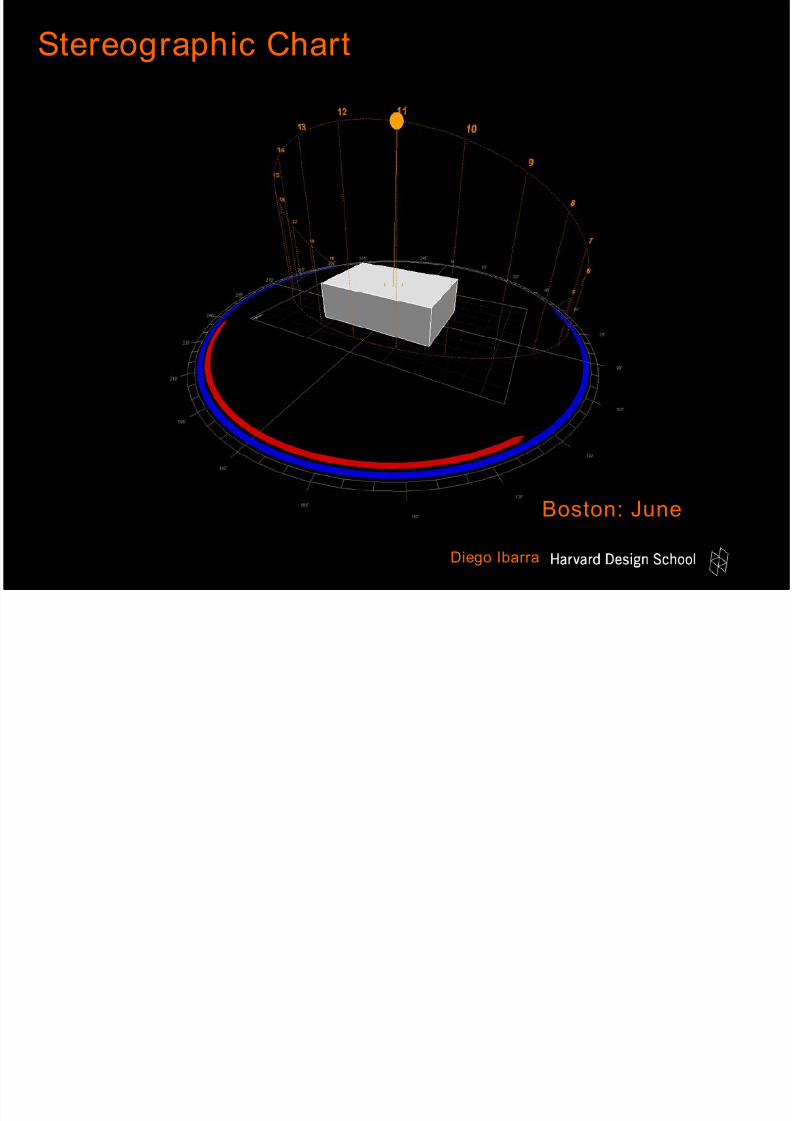
Stereographic Chart
Shifting the curve to the left
12
34
Boston: June
Page 22
7/27/2019 climate analysis workshop
http://slidepdf.com/reader/full/climate-analysis-workshop 22/69
Diego Ibarra
Stereographic Chart
Shifting the curve to the left
12
34
Boston: October
Page 23
7/27/2019 climate analysis workshop
http://slidepdf.com/reader/full/climate-analysis-workshop 23/69
Diego Ibarra
Stereographic Chart
Shifting the curve to the left
12
34
Boston: December
Page 24
7/27/2019 climate analysis workshop
http://slidepdf.com/reader/full/climate-analysis-workshop 24/69
Diego Ibarra
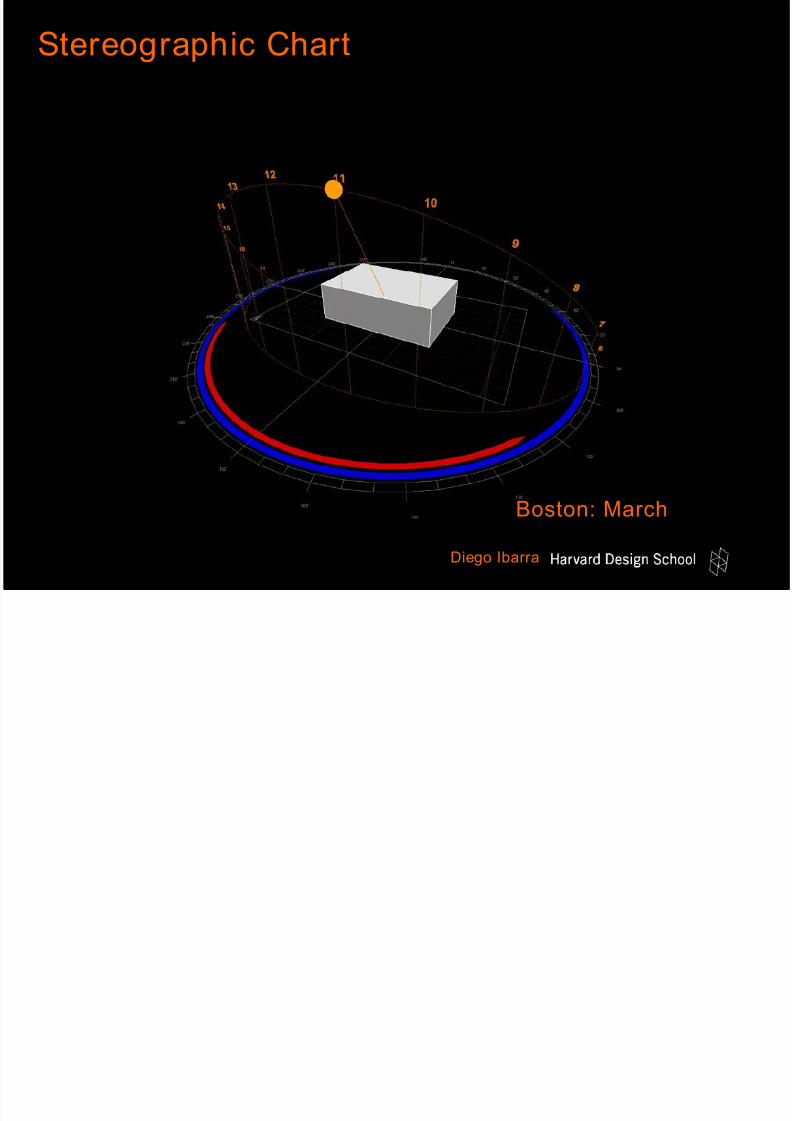
Stereographic Chart
Shifting the curve to the left
12
34
Boston: March
Page 25
7/27/2019 climate analysis workshop
http://slidepdf.com/reader/full/climate-analysis-workshop 25/69
Diego Ibarra
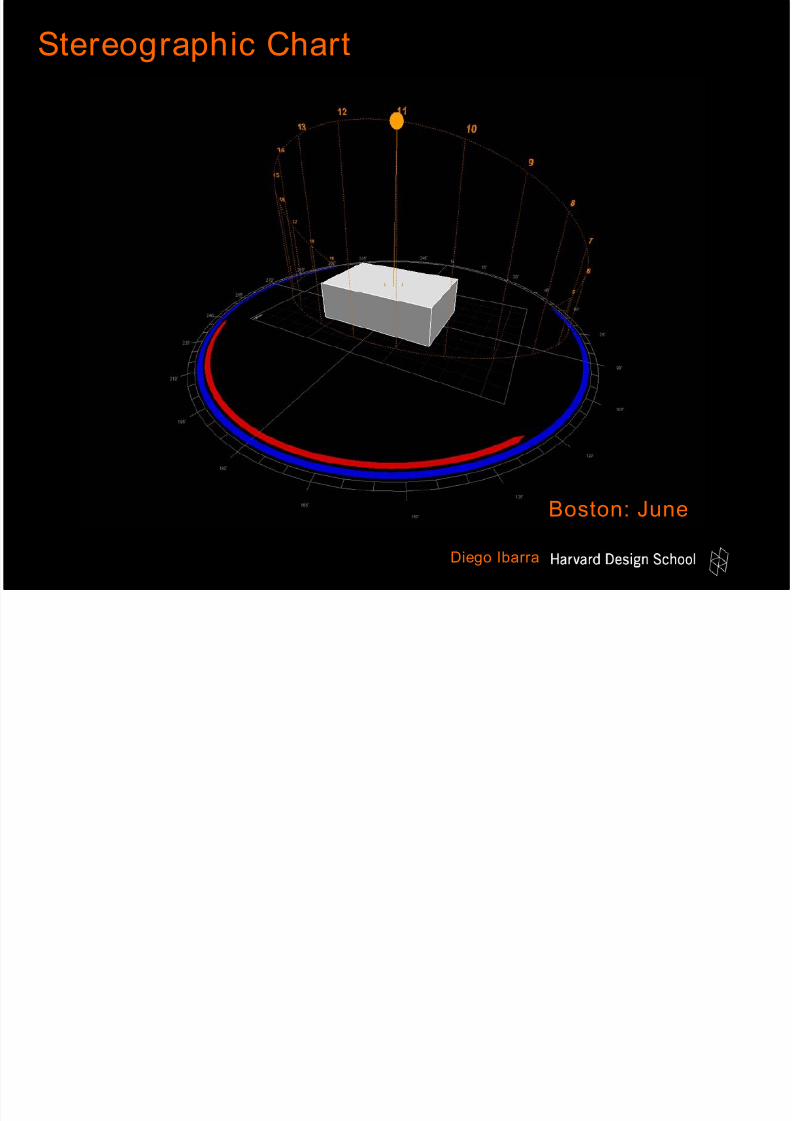
Stereographic Chart
Shifting the curve to the left
12
34
Boston: June
Page 26
7/27/2019 climate analysis workshop
http://slidepdf.com/reader/full/climate-analysis-workshop 26/69
Diego Ibarra
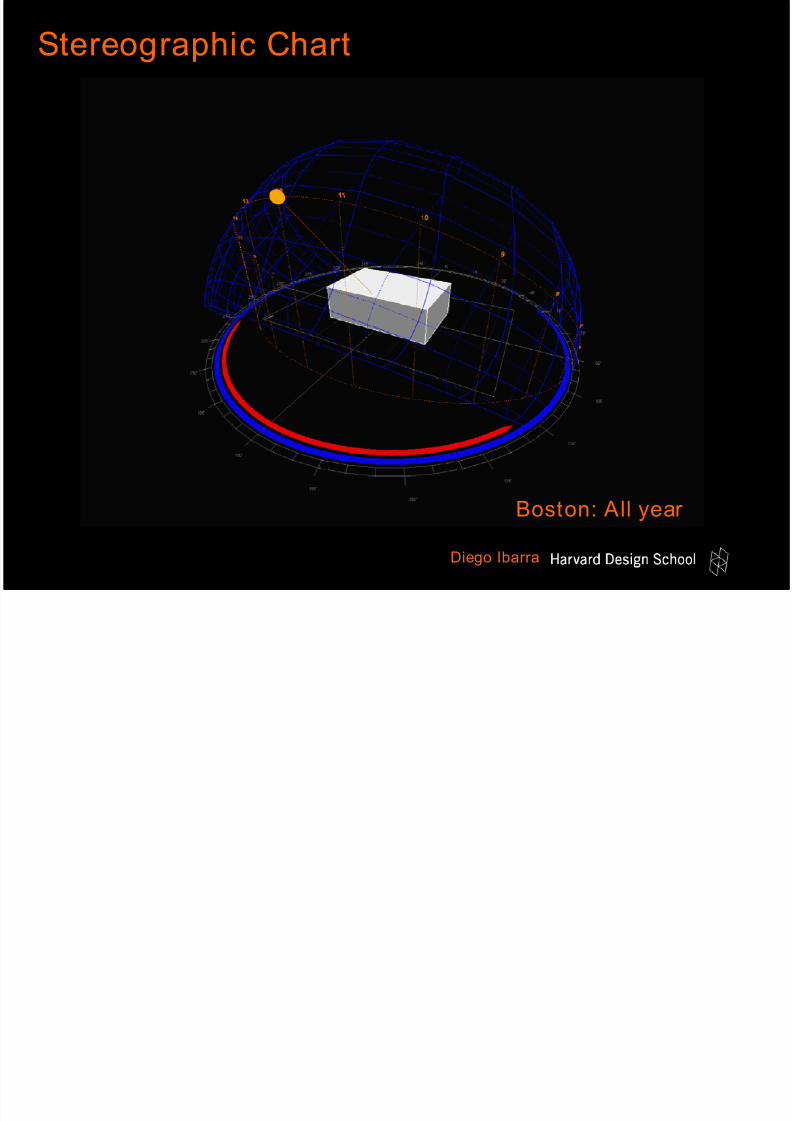
Stereographic Chart
Shifting the curve to the left
12
34
Boston: All year
Page 27
7/27/2019 climate analysis workshop
http://slidepdf.com/reader/full/climate-analysis-workshop 27/69
Diego Ibarra
Stereographic Chart
Shifting the curve to the left
12
34
Boston: All year
Page 28
7/27/2019 climate analysis workshop
http://slidepdf.com/reader/full/climate-analysis-workshop 28/69
Diego Ibarra
Stereographic Chart
Shifting the curve to the left
12
34
Boston: All year plan view
Page 29
7/27/2019 climate analysis workshop
http://slidepdf.com/reader/full/climate-analysis-workshop 29/69
Diego Ibarra
Stereographic Chart
Shifting the curve to the left
12
34
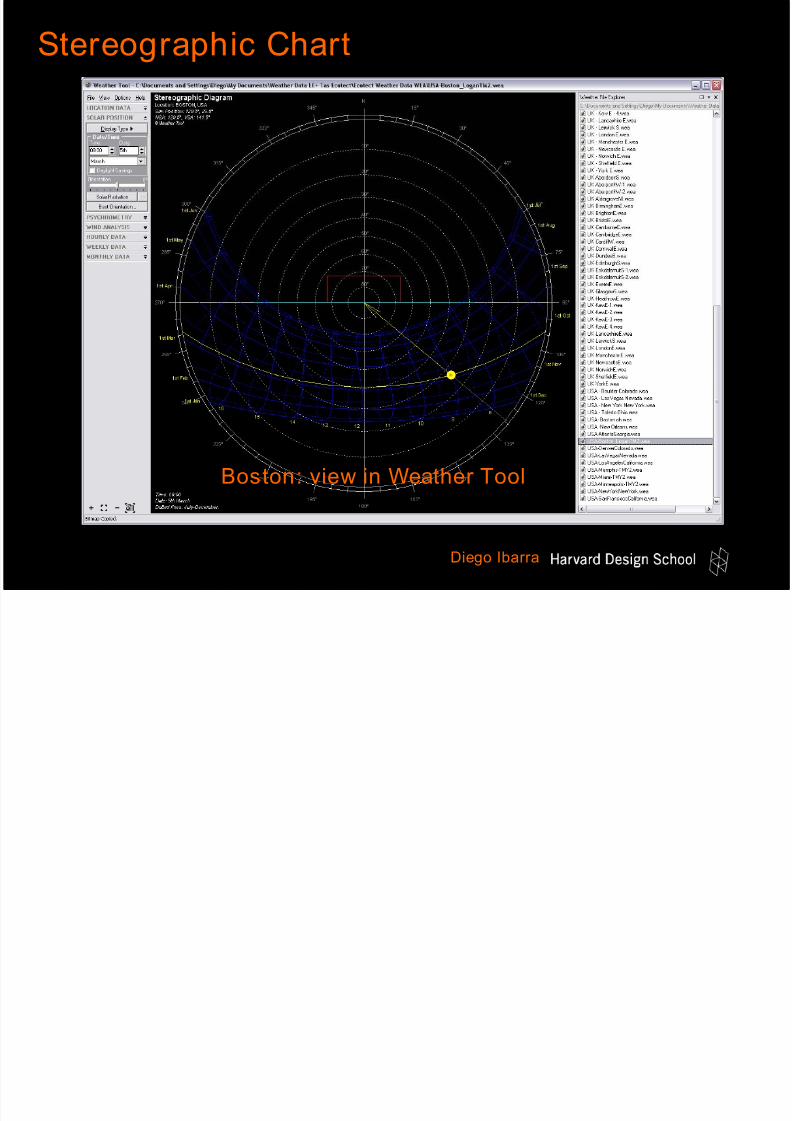
Boston: view in Weather Tool
Page 30
7/27/2019 climate analysis workshop
http://slidepdf.com/reader/full/climate-analysis-workshop 30/69
Diego Ibarra
Stereographic Chart
Shifting the curve to the left
12
34
How to read the chart…
Page 31
7/27/2019 climate analysis workshop
http://slidepdf.com/reader/full/climate-analysis-workshop 31/69
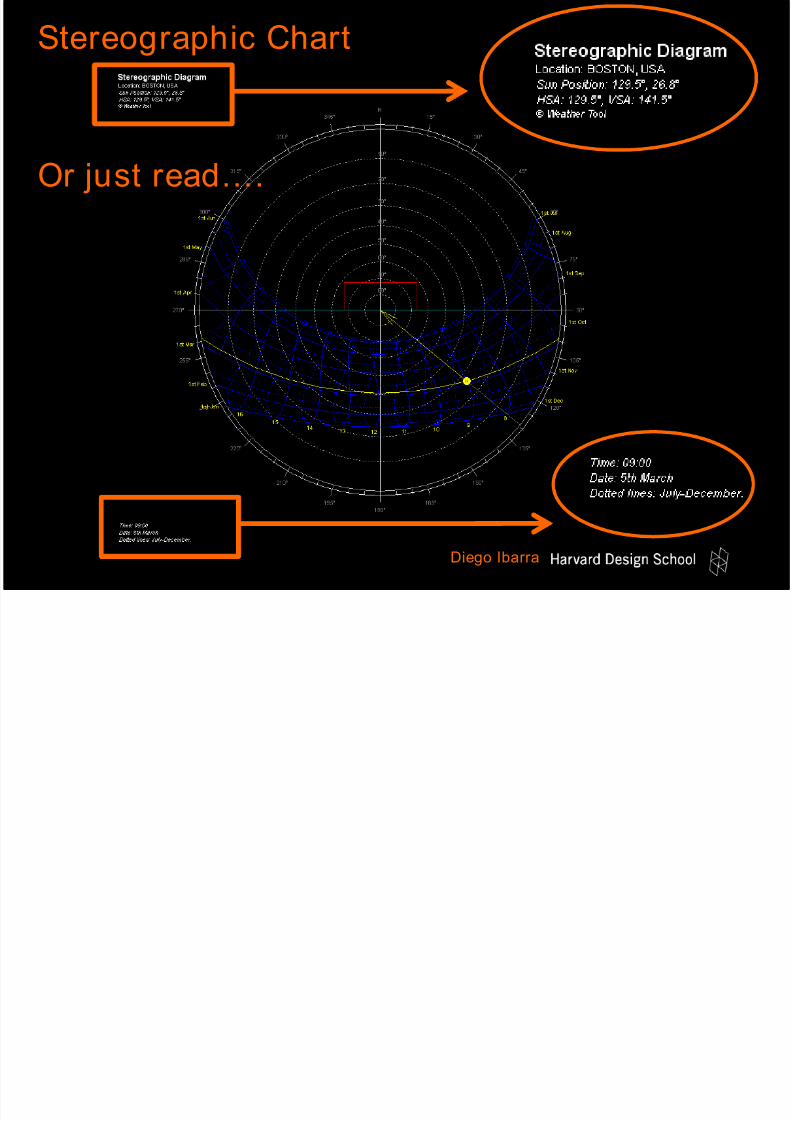
Diego Ibarra
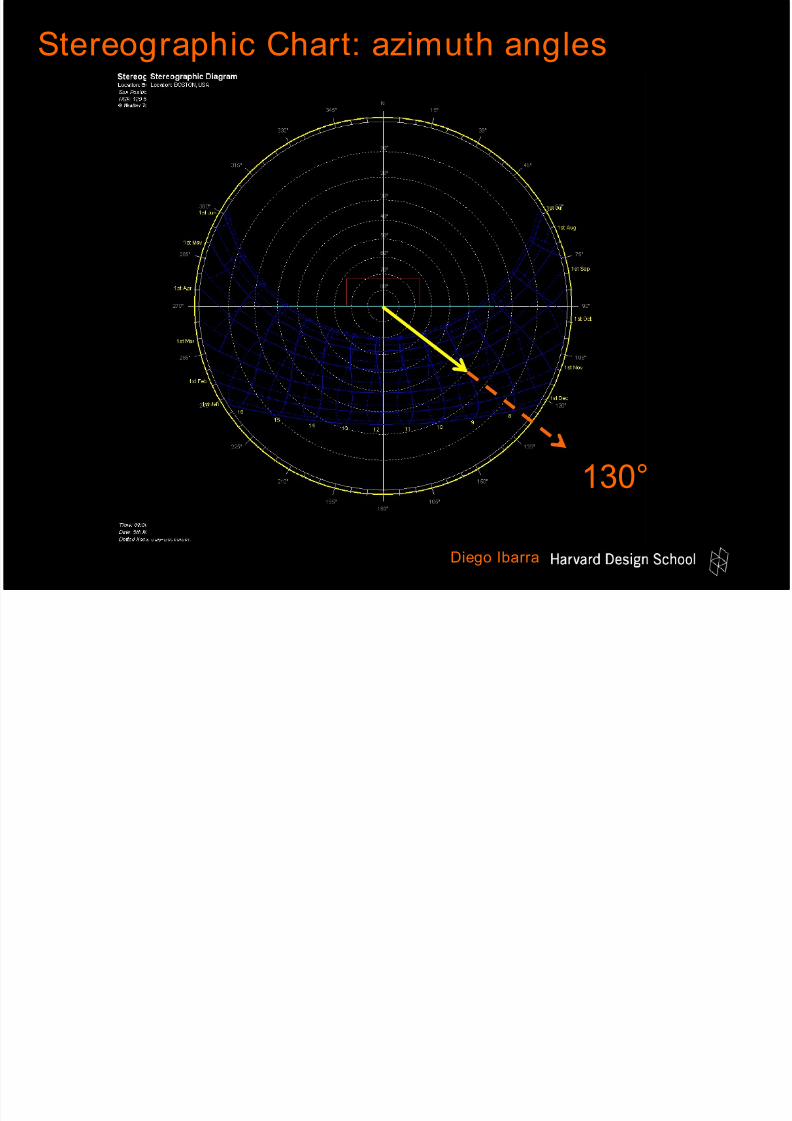
Stereographic Chart: azimuth angles
Shifting the curve to the left
12
34
130°
Page 32
7/27/2019 climate analysis workshop
http://slidepdf.com/reader/full/climate-analysis-workshop 32/69
Diego Ibarra
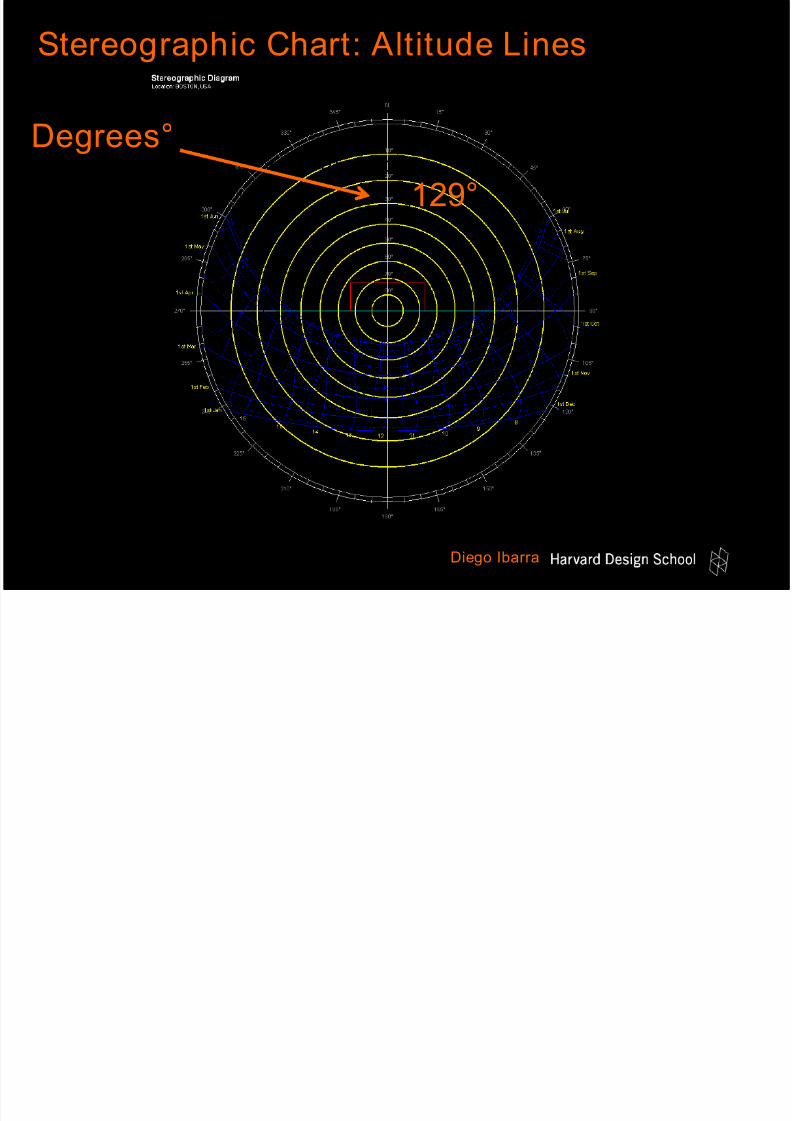
Stereographic Chart: Altitude Lines
Shifting the curve to the left
12 129°
Degrees°
Page 33
7/27/2019 climate analysis workshop
http://slidepdf.com/reader/full/climate-analysis-workshop 33/69
Diego Ibarra
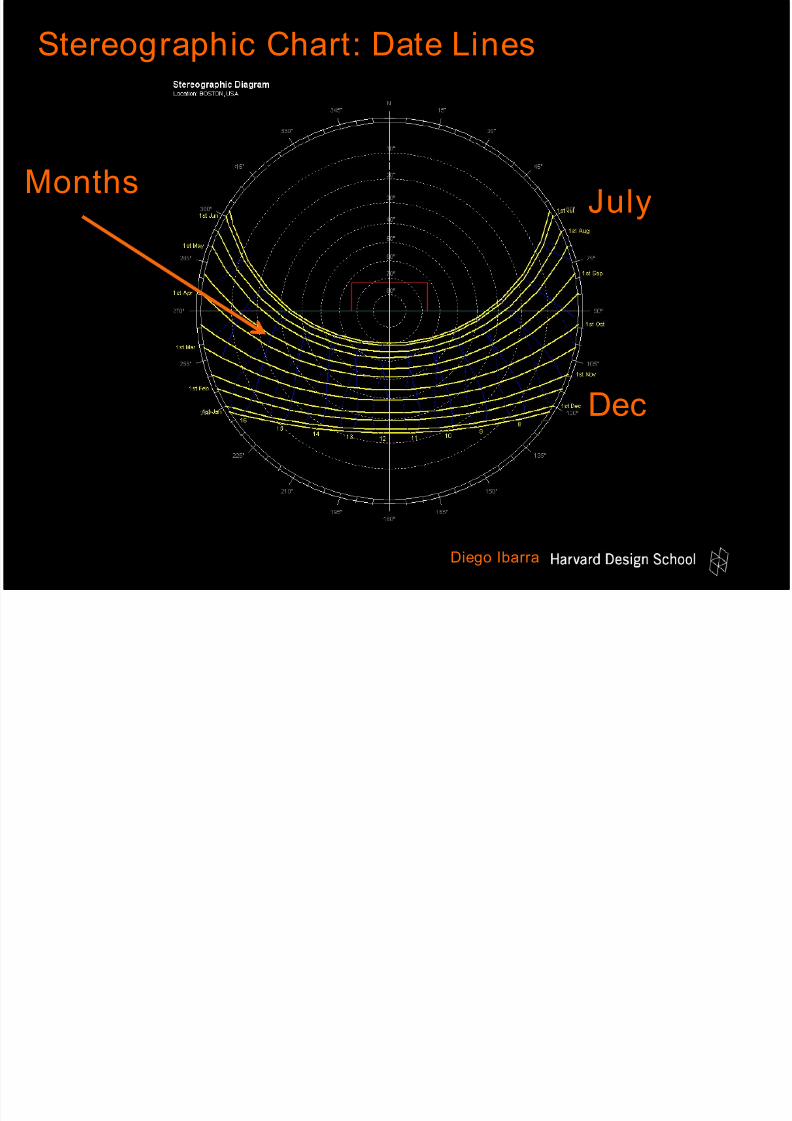
Stereographic Chart: Date Lines
Shifting the curve to the left
12 July
Months
Dec
Page 34
7/27/2019 climate analysis workshop
http://slidepdf.com/reader/full/climate-analysis-workshop 34/69
Diego Ibarra
Stereographic Chart: Hour Lines
Shifting the curve to the left
1
9:00am
Hours
Page 35
7/27/2019 climate analysis workshop
http://slidepdf.com/reader/full/climate-analysis-workshop 35/69
Diego Ibarra
Stereographic Chart
Shifting the curve to the left
12
34
Or just read….
Page 36
7/27/2019 climate analysis workshop
http://slidepdf.com/reader/full/climate-analysis-workshop 36/69
Diego Ibarra
Psychrometric Chart
Shifting the curve to the left
12
34
How to read the chart…
Page 37
7/27/2019 climate analysis workshop
http://slidepdf.com/reader/full/climate-analysis-workshop 37/69
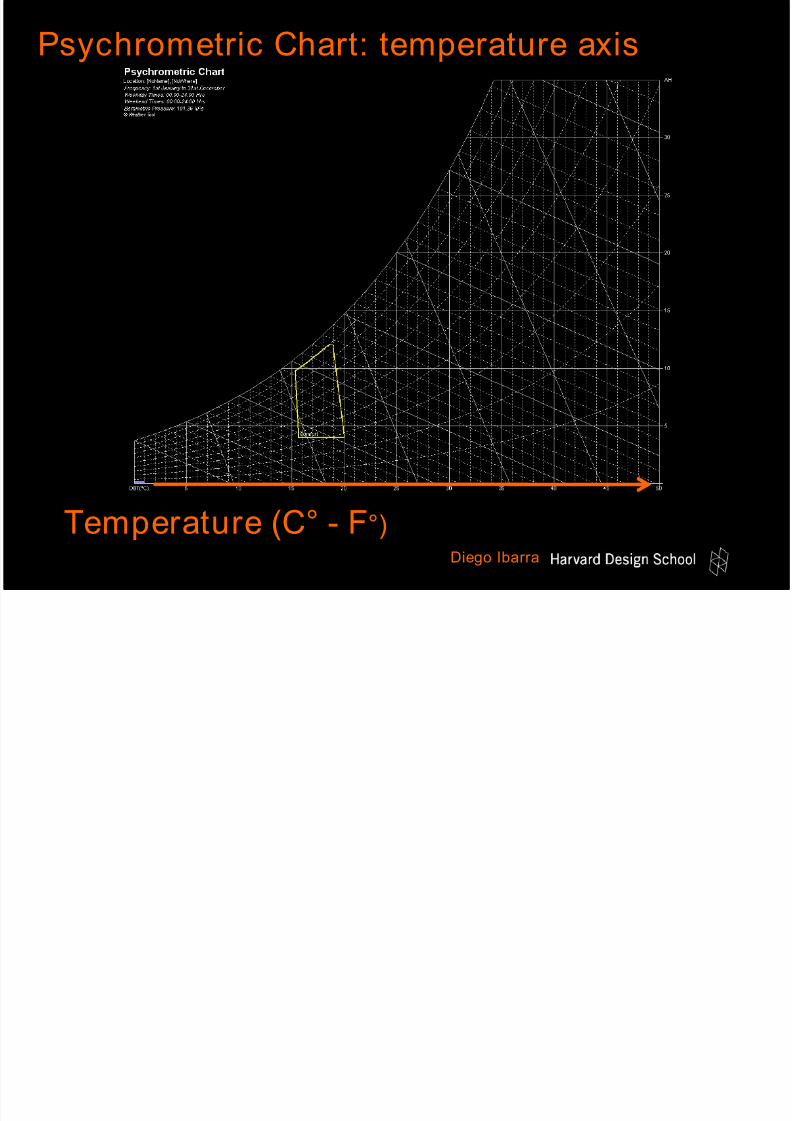
Diego Ibarra
Psychrometric Chart: temperature axis
Shifting the curve to the left
12
34
Temperature (C° - F°)
Page 38
7/27/2019 climate analysis workshop
http://slidepdf.com/reader/full/climate-analysis-workshop 38/69
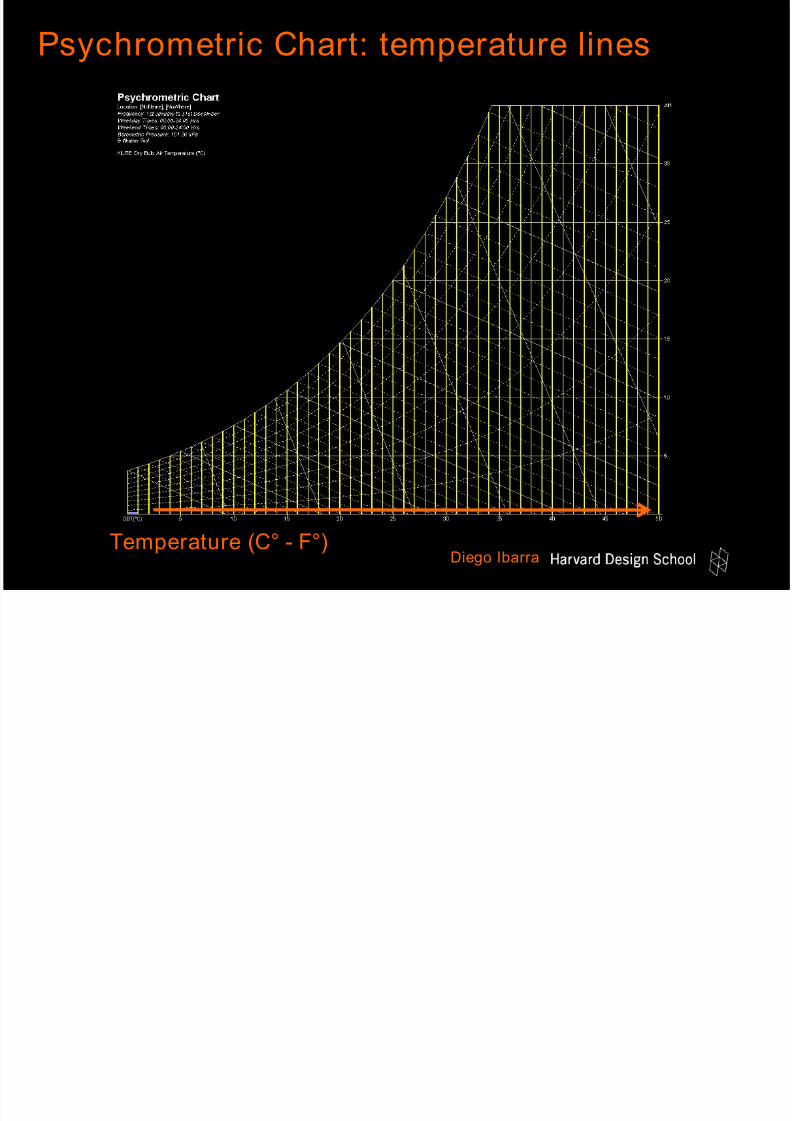
Diego Ibarra
Psychrometric Chart: temperature lines
Shifting the curve to the left
12
34
Temperature (C° - F°)
Page 39
7/27/2019 climate analysis workshop
http://slidepdf.com/reader/full/climate-analysis-workshop 39/69
Diego Ibarra
Psychrometric Chart: absolute humidity axis
Shifting the curve to the left
12
34
Absolute Humidity
W
(g/kga)
Page 40
7/27/2019 climate analysis workshop
http://slidepdf.com/reader/full/climate-analysis-workshop 40/69
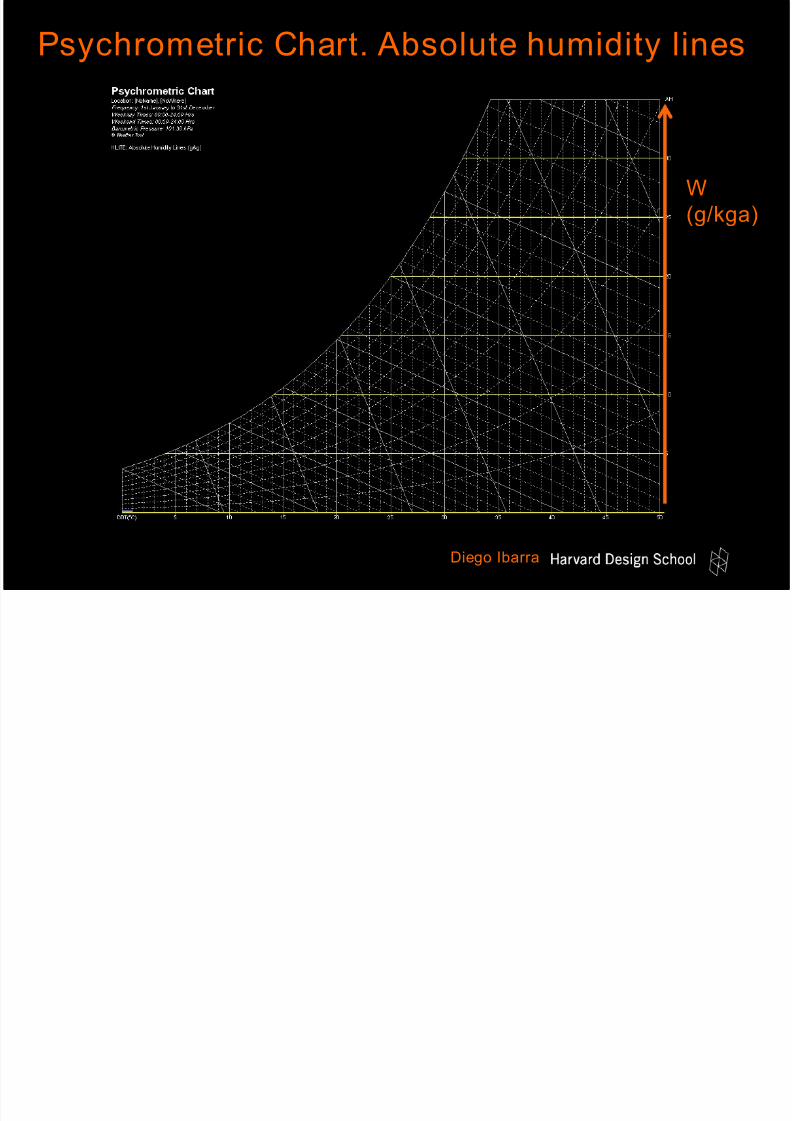
Diego Ibarra
Psychrometric Chart. Absolute humidity lines
Shifting the curve to the left
12
34
Temperature
W
(g/kga)
Page 41
7/27/2019 climate analysis workshop
http://slidepdf.com/reader/full/climate-analysis-workshop 41/69
Diego Ibarra
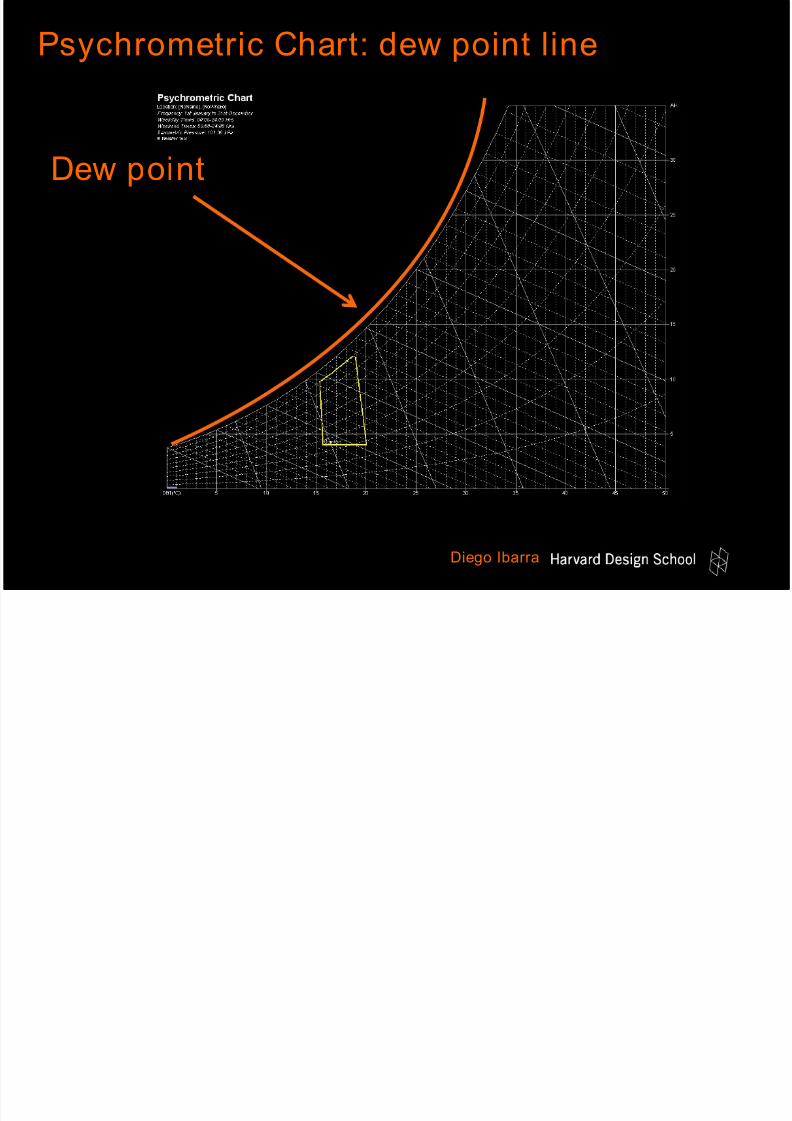
Psychrometric Chart: dew point line
Shifting the curve to the left
12
34
Dew point
Page 42
7/27/2019 climate analysis workshop
http://slidepdf.com/reader/full/climate-analysis-workshop 42/69
Diego Ibarra
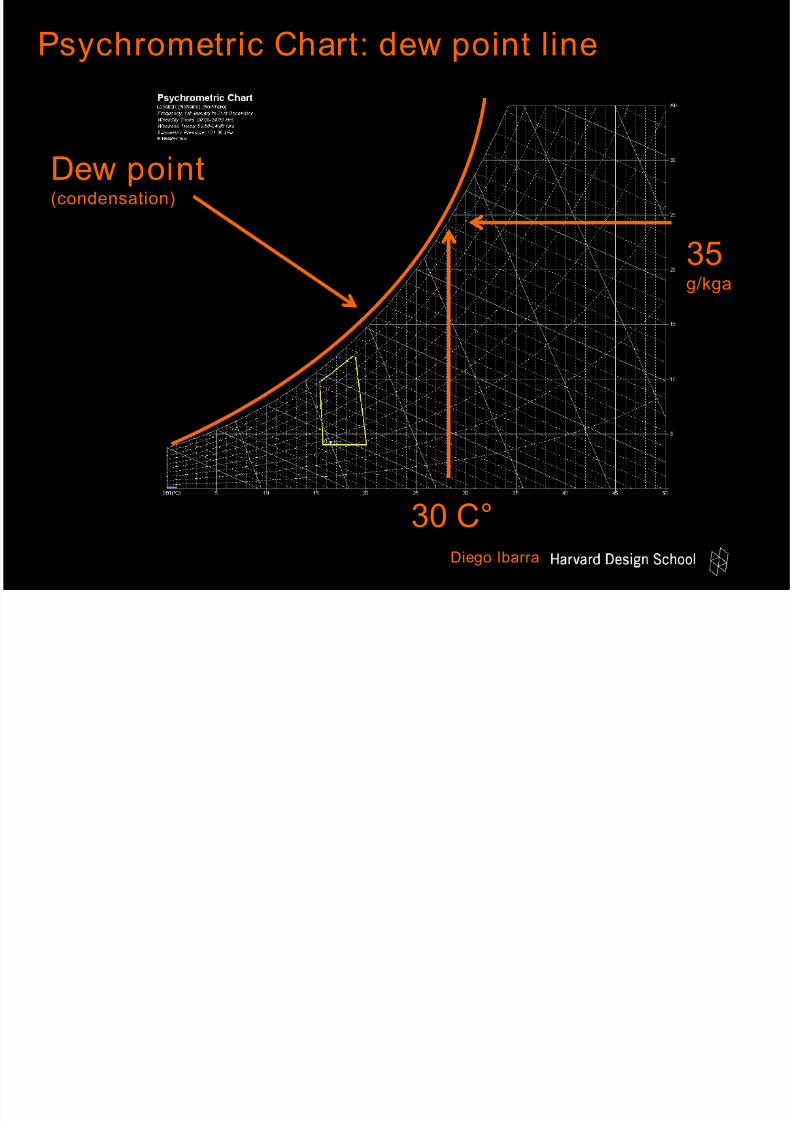
Psychrometric Chart: dew point line
Shifting the curve to the left
12
34
Dew point(condensation)
30 C°
35g/kga
Page 43
7/27/2019 climate analysis workshop
http://slidepdf.com/reader/full/climate-analysis-workshop 43/69
Diego Ibarra
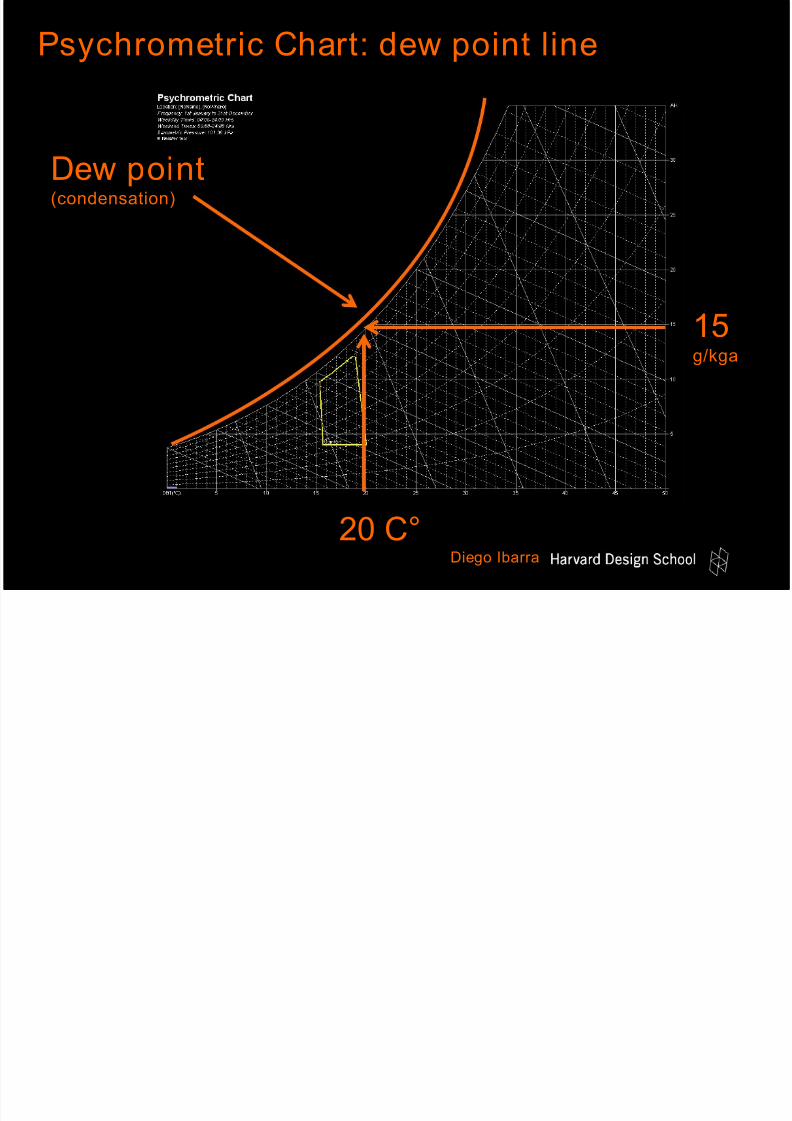
Psychrometric Chart: dew point line
Shifting the curve to the left
12
34
Dew point(condensation)
20 C°
15g/kga
Page 44
7/27/2019 climate analysis workshop
http://slidepdf.com/reader/full/climate-analysis-workshop 44/69
Diego Ibarra
Psychrometric Chart: relative humidity idea
Shifting the curve to the left
30 C°
50 %
75 %
25 %
100 %
0 %
Page 45
7/27/2019 climate analysis workshop
http://slidepdf.com/reader/full/climate-analysis-workshop 45/69
Diego Ibarra
Psychrometric Chart: Relative Humidity lines
Shifting the curve to the left
12
Relative Humidity LinesConnecting the lines at each
specific temperature
Shifting the curve to the left
50 %
75 %
25 %
P h i Ch WBT ( b lb )
Page 46
7/27/2019 climate analysis workshop
http://slidepdf.com/reader/full/climate-analysis-workshop 46/69
Diego Ibarra
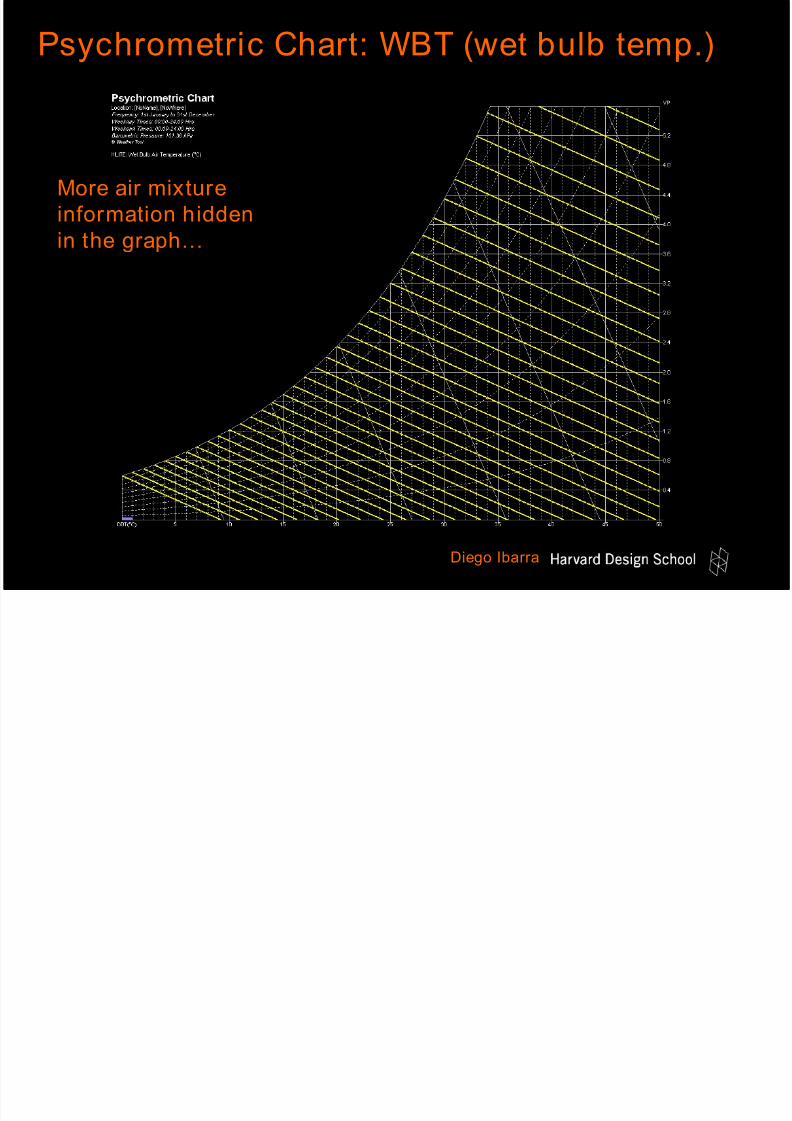
Psychrometric Chart: WBT (wet bulb temp.)
Shifting the curve to the left
12
34
More air mixture
information hiddenin the graph…
P h t i Ch t E th l
Page 47
7/27/2019 climate analysis workshop
http://slidepdf.com/reader/full/climate-analysis-workshop 47/69
Diego Ibarra
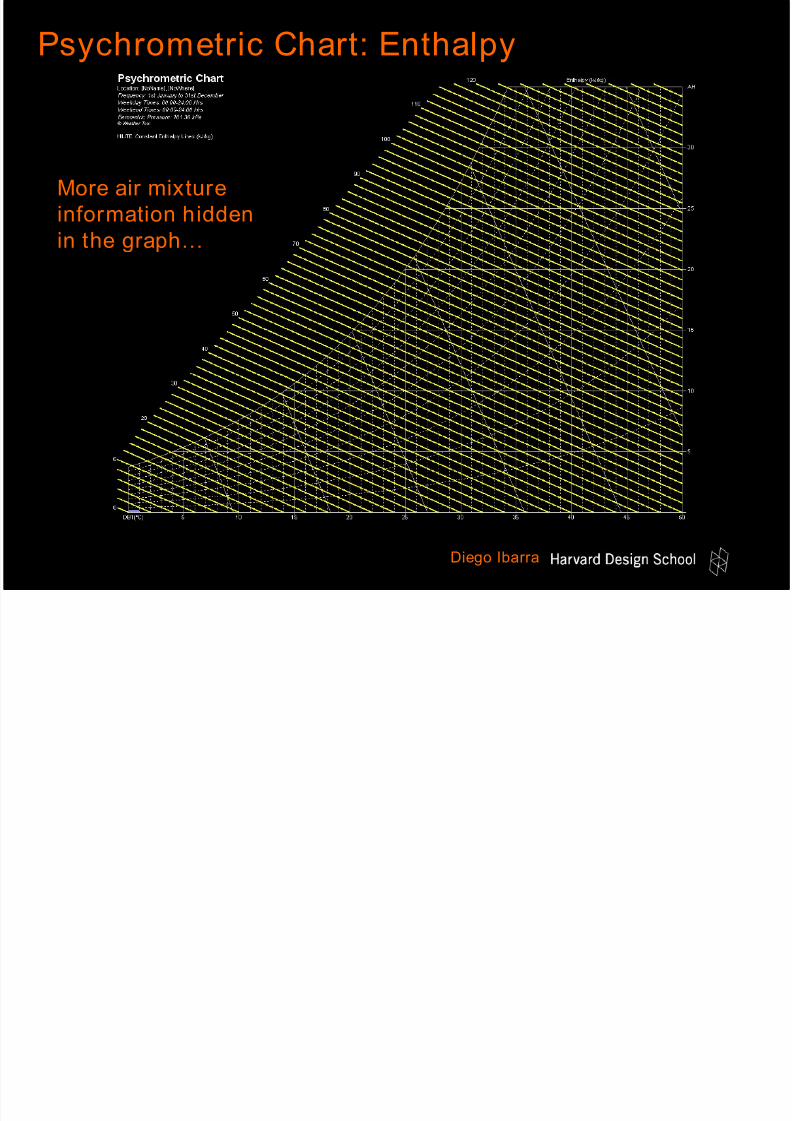
Psychrometric Chart: Enthalpy
Shifting the curve to the left
12
34
More air mixture
information hiddenin the graph…
Joules/Kg of dry air(20.000-110.000)
P h t i Ch t S ifi V l
Page 48
7/27/2019 climate analysis workshop
http://slidepdf.com/reader/full/climate-analysis-workshop 48/69
Diego Ibarra
Psychrometric Chart: Specific Volume
Shifting the curve to the left
12
34
More air mixture
information hiddenin the graph…
m3/Kg of dry air
P h t i Ch t
Page 49
7/27/2019 climate analysis workshop
http://slidepdf.com/reader/full/climate-analysis-workshop 49/69
Diego Ibarra
Psychrometric Chart
Shifting the curve to the left
12
34
Comfort Zone
St hi Ch t
Page 50
7/27/2019 climate analysis workshop
http://slidepdf.com/reader/full/climate-analysis-workshop 50/69
Diego Ibarra
Stereographic Chart
Shifting the curve to the left
12
34
Boston: view in Weather Tool
W th T l
Page 51
7/27/2019 climate analysis workshop
http://slidepdf.com/reader/full/climate-analysis-workshop 51/69
Diego Ibarra
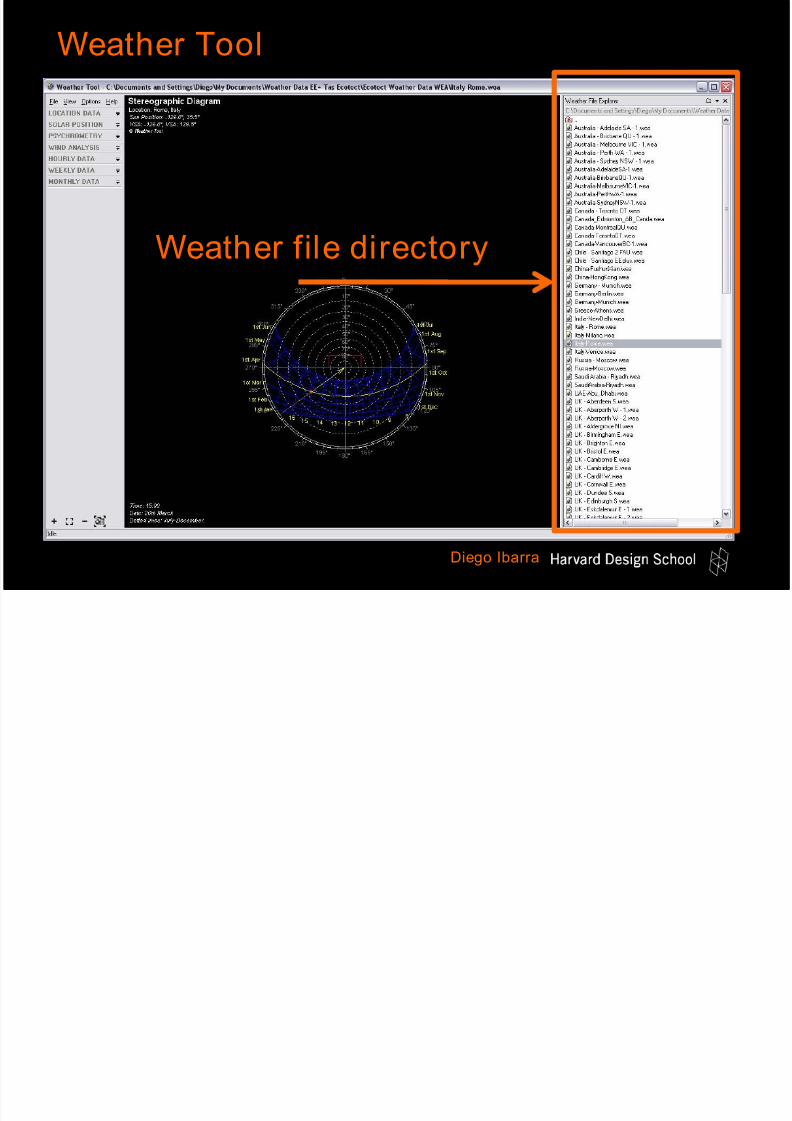
Weather Tool
Weather file directory
W th T l
Page 52
7/27/2019 climate analysis workshop
http://slidepdf.com/reader/full/climate-analysis-workshop 52/69
Diego Ibarra
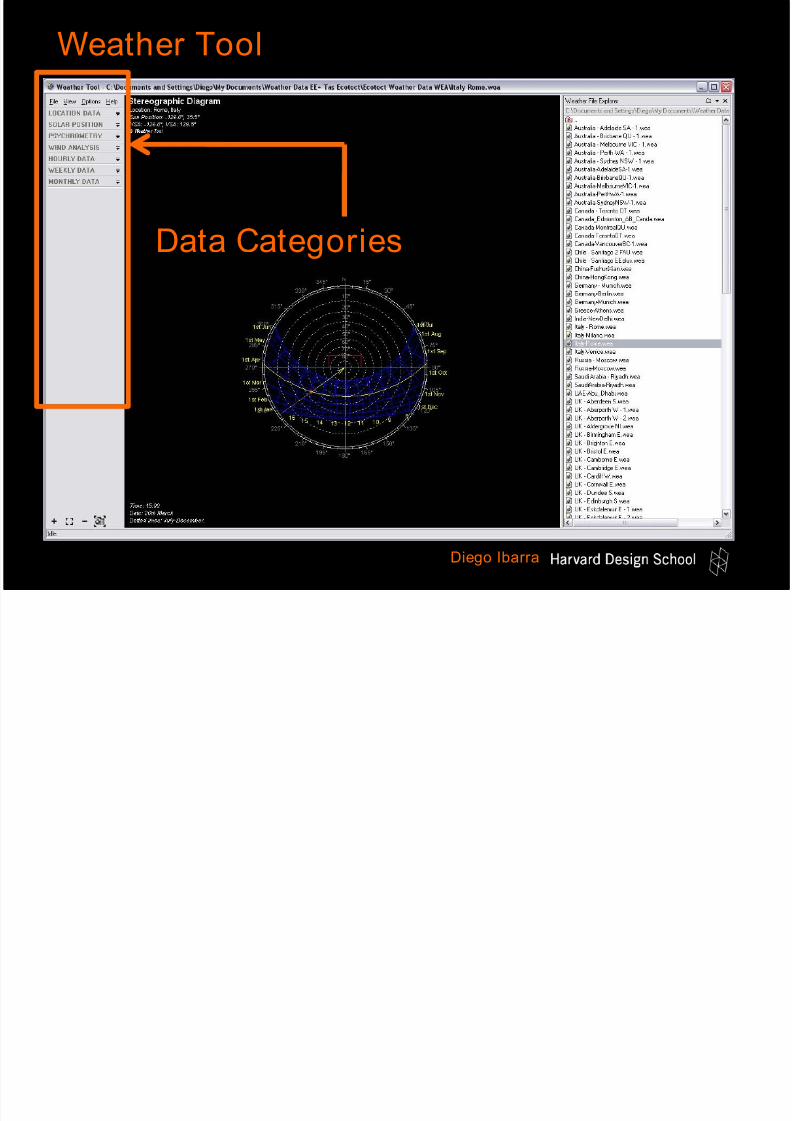
Weather Tool
Data Categories
W th T l
Page 53
7/27/2019 climate analysis workshop
http://slidepdf.com/reader/full/climate-analysis-workshop 53/69
Diego Ibarra
Weather Tool
Data visualization
W th T l
Page 54
7/27/2019 climate analysis workshop
http://slidepdf.com/reader/full/climate-analysis-workshop 54/69
Diego Ibarra
Weather Tool
Analysis Techniques: Climate Comparison
Page 55
7/27/2019 climate analysis workshop
http://slidepdf.com/reader/full/climate-analysis-workshop 55/69
Diego Ibarra
Analysis Techniques: Climate Comparison
ABU DHABI: Average Dry Bulb Temperature
Max: 43° C
BOSTON: Average Dry Bulb Temperature
Max: 20 ° C
Analysis Techniques: Climate Comparison
Page 56
7/27/2019 climate analysis workshop
http://slidepdf.com/reader/full/climate-analysis-workshop 56/69
Diego Ibarra
Analysis Techniques: Climate Comparison
ABU DHABI :Direct Solar Radiation
Max. aprox: 900 W/m2
BOSTON:Direct Solar Radiation
Max. aprox: 500 W/m2
Analysis Techniques: Absolute values
Page 57
7/27/2019 climate analysis workshop
http://slidepdf.com/reader/full/climate-analysis-workshop 57/69
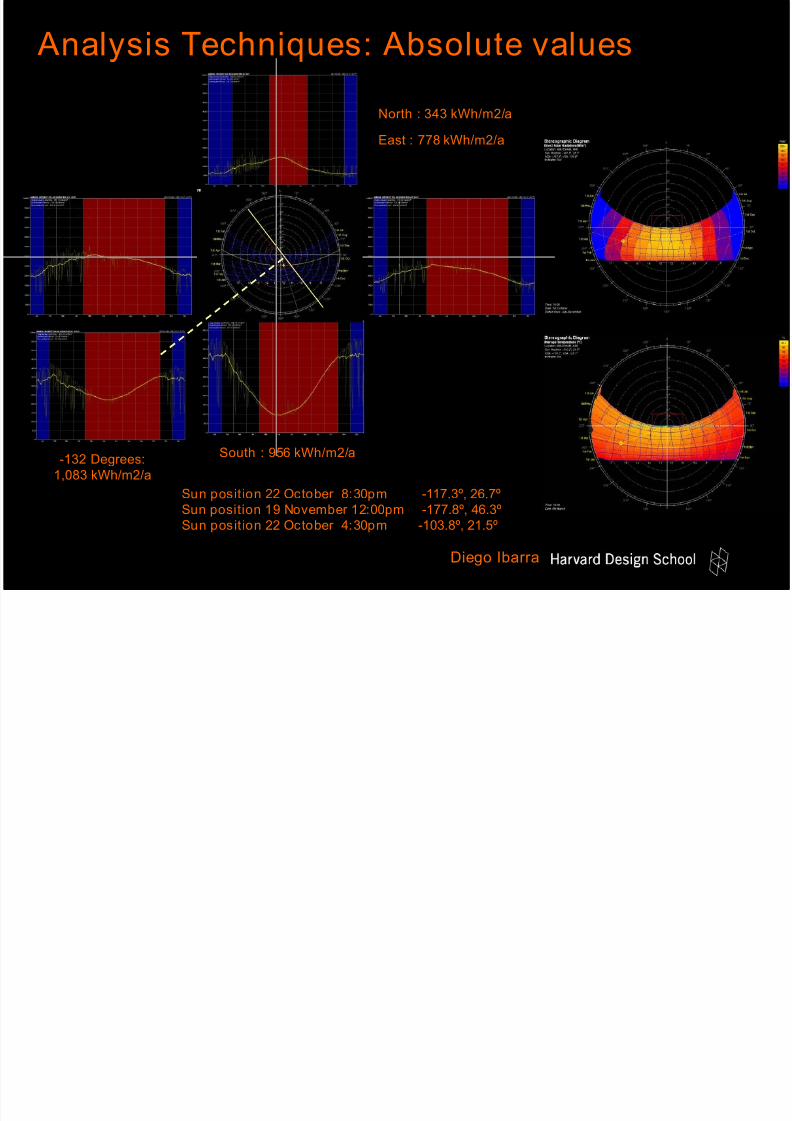
Diego Ibarra
Sun posit ion 22 October 8:30pm -117.3º, 26.7º
Sun position 19 November 12:00pm -177.8º, 46.3º
Sun posit ion 22 October 4:30pm -103.8º, 21.5º
South : 956 kWh/m2/a
East : 778 kWh/m2/a
-132 Degrees:
1,083 kWh/m2/a
North : 343 kWh/m2/a
Analysis Techniques: Absolute values
Page 58
7/27/2019 climate analysis workshop
http://slidepdf.com/reader/full/climate-analysis-workshop 58/69
Developed by the Department of
Architecture and Urban Design.
University of California, Los
Angeles.
Graphically displays climate data
in either metric or imperial units
in dozens of ways useful toarchitects.
Climate Consultant 4
Graphical User Interface
Diego Ibarra
Page 59
7/27/2019 climate analysis workshop
http://slidepdf.com/reader/full/climate-analysis-workshop 59/69
Easier to identify unique patterns and subtle details that
characterize each different climate.
Thresholds and comfort zones are more flexible.
In contrast to The Weather Tool, detailed technical
information about the passive strategies criteria is
documented and freely available.
Climate Consultant 4 - Benefits
Diego Ibarra
Page 60
7/27/2019 climate analysis workshop
http://slidepdf.com/reader/full/climate-analysis-workshop 60/69
The “Wind Wheel” graphics shows velocity and
direction correlated with temperature and
humidity, and can be animated hourly or daily or
monthly.
The psychrometric analysis recommends the most
appropriate passive design strategies as outlined
in Givoni’s Man Climate and Architecture.
Climate Consultant is written in Java and runs on
both Windows and Mac OS X computers.
Climate Consultant 4
Diego Ibarra
Climate Consultant 4
Page 61
7/27/2019 climate analysis workshop
http://slidepdf.com/reader/full/climate-analysis-workshop 61/69
Diego Ibarra
Climate Consultant 4
Climate Consultant 4
Page 62
7/27/2019 climate analysis workshop
http://slidepdf.com/reader/full/climate-analysis-workshop 62/69
Diego Ibarra
Climate Consultant 4
Climate Consultant 4
Page 63
7/27/2019 climate analysis workshop
http://slidepdf.com/reader/full/climate-analysis-workshop 63/69
Diego Ibarra
Climate Consultant 4
Top 20 Passive Design Guidelines
Page 64
7/27/2019 climate analysis workshop
http://slidepdf.com/reader/full/climate-analysis-workshop 64/69
It now calculates a set of the top 20 Design Guidelines
based on your unique climate and the passive design
strategies you selected on the Psychrometric Chart.
Each Guideline has a sketch illustrating how it applies. The
Guidelines and their accompanying sketches were based in
part on Watson and Labs Climatic Building Design, and on
Loftness,.et.al, Regional Guidelines for Building Passive
Energy Conserving Homes.
Diego Ibarra
Top 20 Passive Design Guidelines
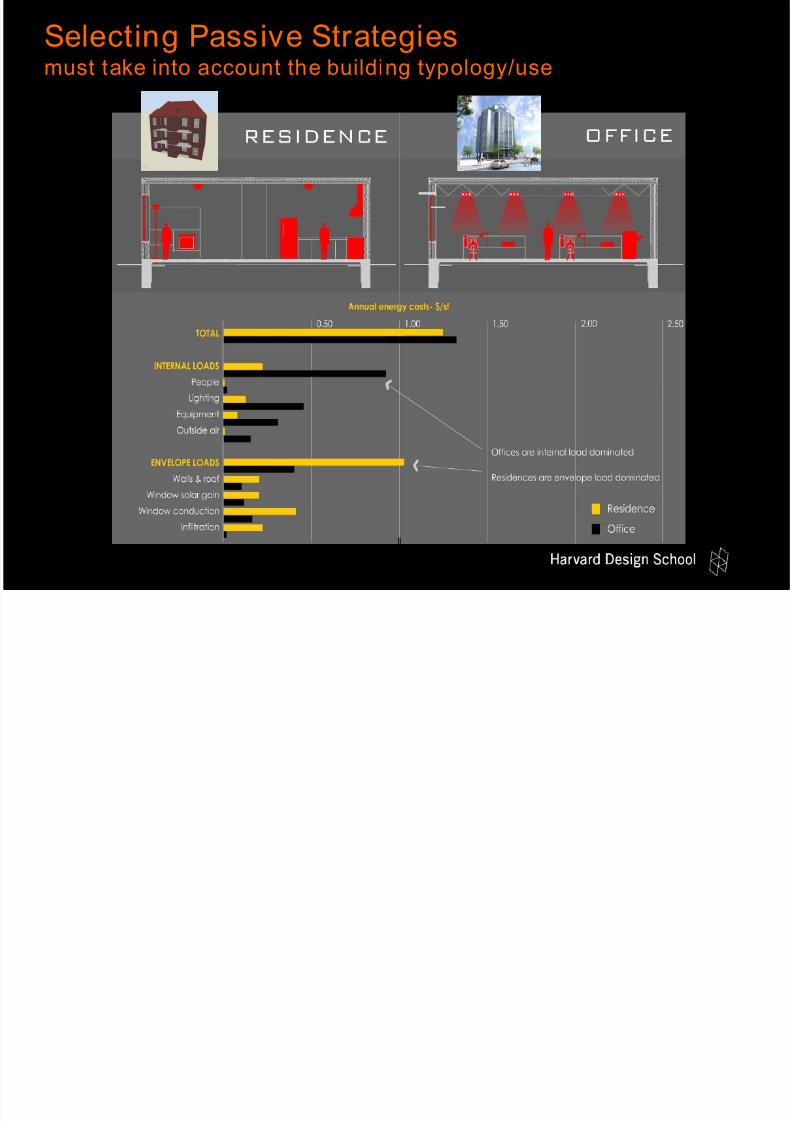
Selecting Passive Strategies
Page 65
7/27/2019 climate analysis workshop
http://slidepdf.com/reader/full/climate-analysis-workshop 65/69
GSD 6413 – ZED WORKSHOP – RESEARCH NAME
18 SEP 2009
* source: Energy center of WisconsinDiego Ibarra
Selecting Passive Strategiesmust take into account the building typology/use
Windows VISTA installation issues
Page 66
7/27/2019 climate analysis workshop
http://slidepdf.com/reader/full/climate-analysis-workshop 66/69
Vista users sometimes have installation problems. In the
current version, the C:\Program Files has a stringent
security mechanism that has resulted in many complaints.
Users cannot explicitly create files in this directory hierarchy.
Vista 7 may allow users to lower this level of security. Here
is a workaround. When you install the program, explicitly
change the target directory to C:\CC4 in order to bypass the
C:\Program Files security restriction then the installation
should finish without error.
Windows VISTA installation issues
Diego Ibarra
Technical Paper – Climate Consultant
Page 67
7/27/2019 climate analysis workshop
http://slidepdf.com/reader/full/climate-analysis-workshop 67/69
For more information download the technical paper for Climate
Consultant:
“Climate Consultant 3.0: A Tool for Visualizing Building Energy
Implications of Climates” Murray Milne, Robin Liggett, and Rashed
Al-Shaali, Proceedings of the American Solar Energy Association
Conference, Cleveland, Ohio, July, 2007.
http://www2.aud.ucla.edu/energy-design-tools/papers.html
Developers: Professor Murray Milne
Department of Architecture and Urban Design
University of California, Los Angeles
Los Angeles, California 90095-1467
[email protected]
Technical Paper Climate Consultant
Diego Ibarra
Page 68
7/27/2019 climate analysis workshop
http://slidepdf.com/reader/full/climate-analysis-workshop 68/69
Demo…
Diego Ibarra
The Weather Tool
Climate Consultant 4
Importing EPW’s
Editing EPW’s in Excel
Page 69
7/27/2019 climate analysis workshop
http://slidepdf.com/reader/full/climate-analysis-workshop 69/69
Questions…
[email protected]