Australia’s National Science Agency Climate change and dam sedimentation in the Upper Indus Pakistan: potential implications on Sindh’s water security Model scenarios configuration, results and analyses Joel P Stewart, Mobin-ud-Din Ahmad, Geoff M Podger 24 January 2020
Transcript
Australia’s National Science Agency
Climate change and dam sedimentation in the Upper Indus Pakistan: potential implications on Sindh’s water security Model scenarios configuration, results and analyses
Joel P Stewart, Mobin-ud-Din Ahmad, Geoff M Podger
24 January 2020
ii | Climate change and dam sedimentation in the Upper Indus Pakistan: potential implications on Sindh’s water security
Citation
Stewart JP, Ahmad MD, Podger GM (2020) Climate change and dam sedimentation in the Upper Indus Pakistan: potential implications on Sindh’s water security. Model scenarios configuration, results and analyses. Technical report. Sustainable Development Investment Portfolio project. CSIRO, Australia.
Copyright
With the exception of the Australian Government crest, and the Australian Aid and CSIRO logos, and where otherwise noted, all material in this publication is provided under a Creative Commons Attribution 4.0 International License http://creativecommons.org/licenses/by/4.0/legalcode
CSIRO advises that the information contained in this publication comprises general statements based on scientific research. The reader is advised and needs to be aware that such information may be incomplete or unable to be used in any specific situation. No reliance or actions must therefore be made on that information without seeking prior expert professional, scientific and technical advice. To the extent permitted by law, CSIRO (including its employees and consultants) excludes all liability to any person for any consequences, including but not limited to all losses, damages, costs, expenses and any other compensation, arising directly or indirectly from using this publication (in part or in whole) and any information or material contained in it.
The views and interpretations in this publication are those of the editors and authors and they are not necessarily attributable to their organisations.
Ethics
The activities reported herein have been conducted in accordance with CSIRO Social Science Human Research Ethics approval 011/17.
This report designed and implemented by CSIRO contributes to the South Asia Sustainable Development Investment Portfolio and is supported by the Australian aid program. Further details on CSIRO SDIP projects are available from http://research.csiro.au/sdip.
SDIP’s goal is increased water, food and energy security in South Asia to support climate resilient livelihoods and economic growth, benefiting the poor and vulnerable, particularly women and girls
SDIP 2020 objective: Key actors are using and sharing evidence, and facilitating private sector engagement, to improve the integrated management of water, energy and food across two or more countries - addressing gender and climate change.
All CSIRO SDIP projects consider gender. In this report we have assumed that an improved, quantitative understanding of the impacts on Sindh’s water security of climate change and dam sedimentation in the Upper Indus Basin has the potential to benefit all, regardless of gender and other social factors. Excluding gender analysis, however, can lead to ‘gender blind’ tools, findings and decisions that reinforce existing gender inequities. This gap should be borne in mind when interpreting this report, and any application of its findings will need to integrate gender-specific and other social considerations to ensure benefits are distributed equitably.
Climate change and dam sedimentation in the Upper Indus Pakistan: potential implications on Sindh’s water security | iii
Contents
Acknowledgments......................................................................................................................................... vi
Executive summary ...................................................................................................................................... vii
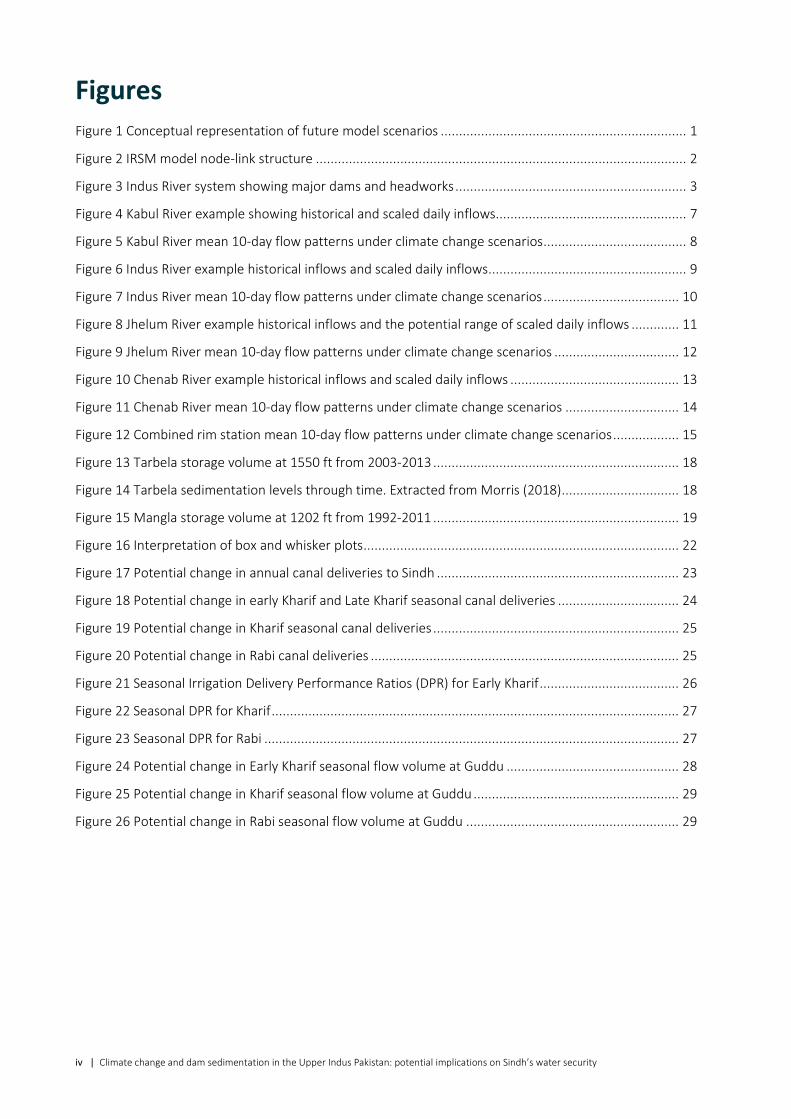
Figure 20 Potential change in Rabi canal deliveries .................................................................................... 25
Figure 21 Seasonal Irrigation Delivery Performance Ratios (DPR) for Early Kharif ...................................... 26
Figure 22 Seasonal DPR for Kharif ............................................................................................................... 27
Figure 23 Seasonal DPR for Rabi ................................................................................................................. 27
Figure 24 Potential change in Early Kharif seasonal flow volume at Guddu ............................................... 28
Figure 25 Potential change in Kharif seasonal flow volume at Guddu ........................................................ 29
Figure 26 Potential change in Rabi seasonal flow volume at Guddu .......................................................... 29
Climate change and dam sedimentation in the Upper Indus Pakistan: potential implications on Sindh’s water security | v
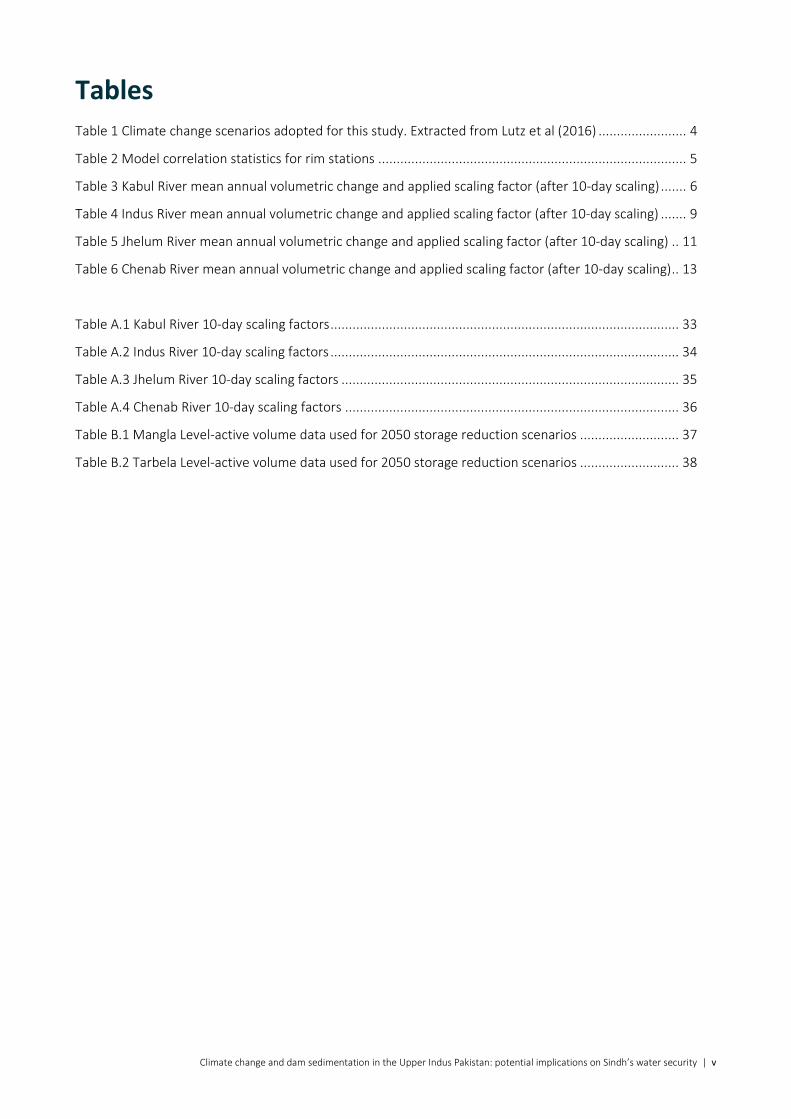
Tables Table 1 Climate change scenarios adopted for this study. Extracted from Lutz et al (2016) ........................ 4
Table 2 Model correlation statistics for rim stations .................................................................................... 5
Table 3 Kabul River mean annual volumetric change and applied scaling factor (after 10-day scaling) ....... 6
Table 4 Indus River mean annual volumetric change and applied scaling factor (after 10-day scaling) ....... 9
Table 5 Jhelum River mean annual volumetric change and applied scaling factor (after 10-day scaling) .. 11
Table 6 Chenab River mean annual volumetric change and applied scaling factor (after 10-day scaling) .. 13
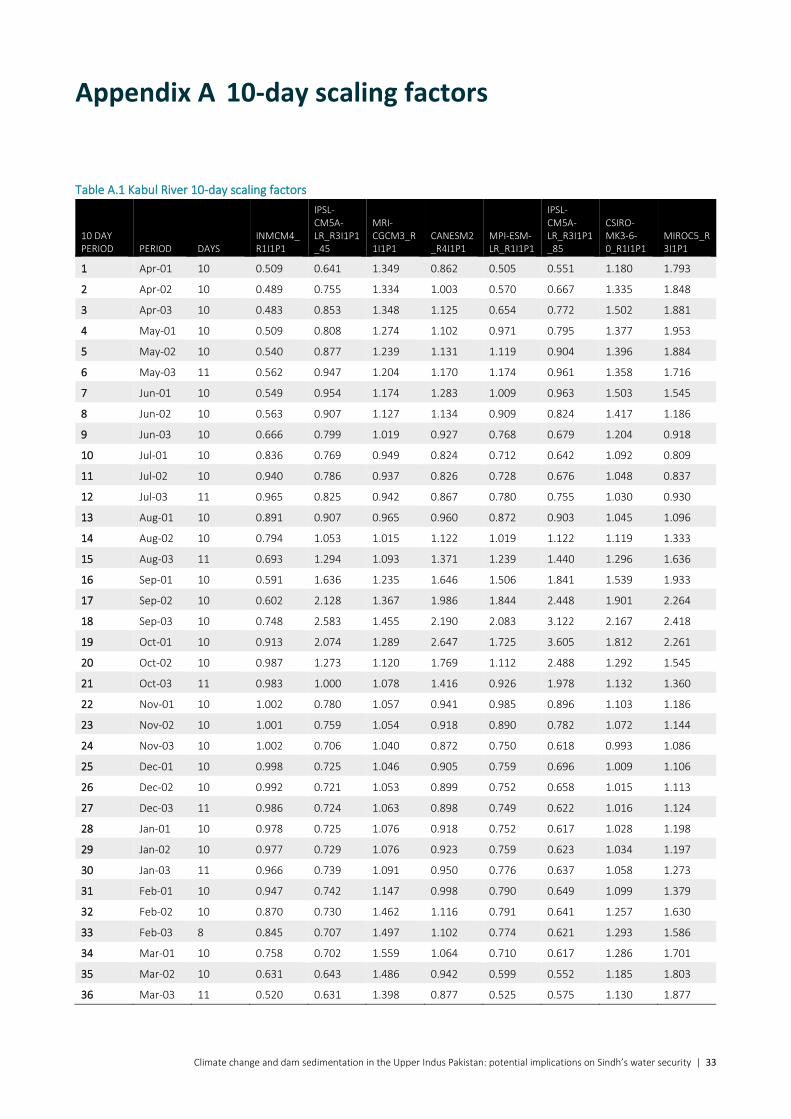
Table A.1 Kabul River 10-day scaling factors ............................................................................................... 33
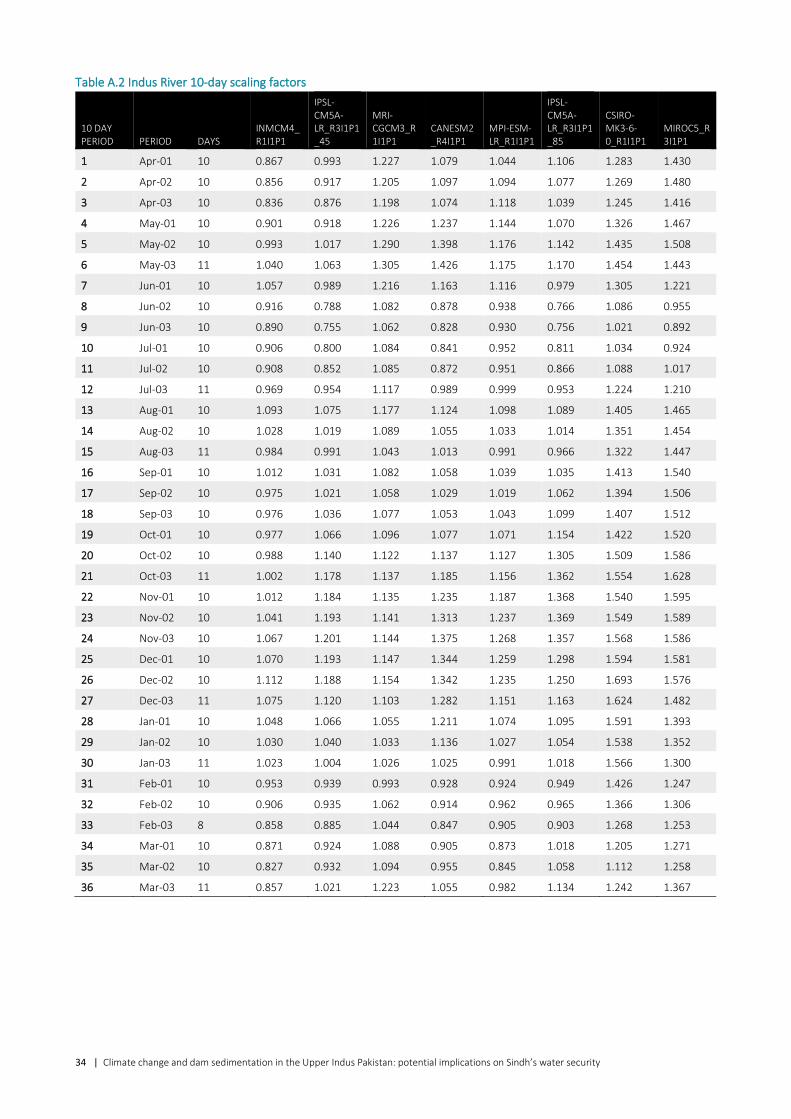
Table A.2 Indus River 10-day scaling factors ............................................................................................... 34
Table A.3 Jhelum River 10-day scaling factors ............................................................................................ 35
Table A.4 Chenab River 10-day scaling factors ........................................................................................... 36
Table B.1 Mangla Level-active volume data used for 2050 storage reduction scenarios ........................... 37
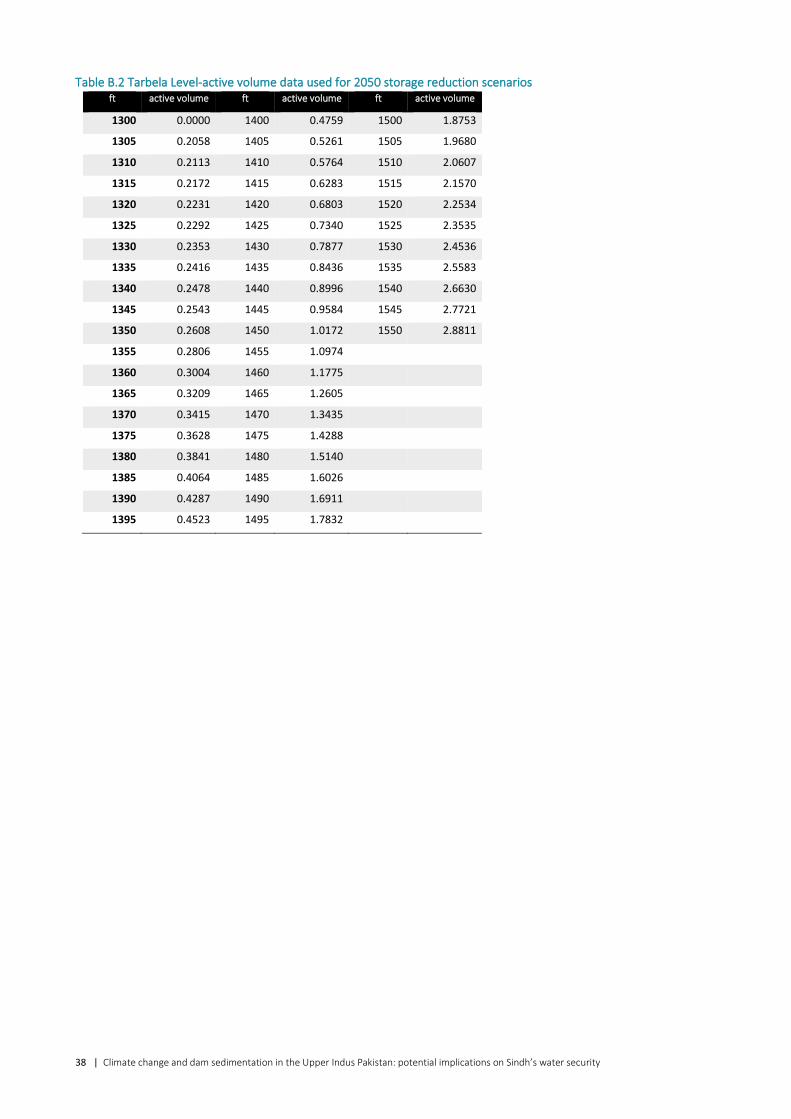
Table B.2 Tarbela Level-active volume data used for 2050 storage reduction scenarios ........................... 38
vi | Climate change and dam sedimentation in the Upper Indus Pakistan: potential implications on Sindh’s water security
Acknowledgments
We would like to acknowledge the support of the Government of Australia through its Department of Foreign Affairs and Trade (DFAT) in financing this study. We also thank the Australian High Commission in Islamabad, the Pakistan High Commission in Canberra and Dr John Dore (DFAT Sustainable Development Investment Portfolio (SDIP) adviser) and Ms Paula Richardson (DFAT SDIP coordinator) for their active engagement in the project.
We would like to thank the Pakistan Ministry of Water Resources and the Government of Sindh for their interest, advice and support, including the provision of data and expertise, hosting the project team on field visits, and provision of guidance throughout the project.
World Bank colleagues, Greg Browder, Toru Konishi and Lixin Gu, have actively engaged with the project team and we thank them for their interest and feedback.
We thank the Sindh Irrigation Department (SID), Indus River System Authority (IRSA) and Water and Power Development Authority (WAPDA) for the provision of data and technical advice on the implementation of inter-provincial water apportionment accord in Pakistan.
We are thankful to our reviewers within CSIRO, Susan Cuddy and Dave Penton for their careful reviews that have improved the quality and presentation of this report.
Our special thanks are extended to Lutz et al (2016) for kindly providing access to their climate change modelling results for the Upper Indus and also once again to Dave Penton for providing model results for the Kabul River.
Climate change and dam sedimentation in the Upper Indus Pakistan: potential implications on Sindh’s water security | vii
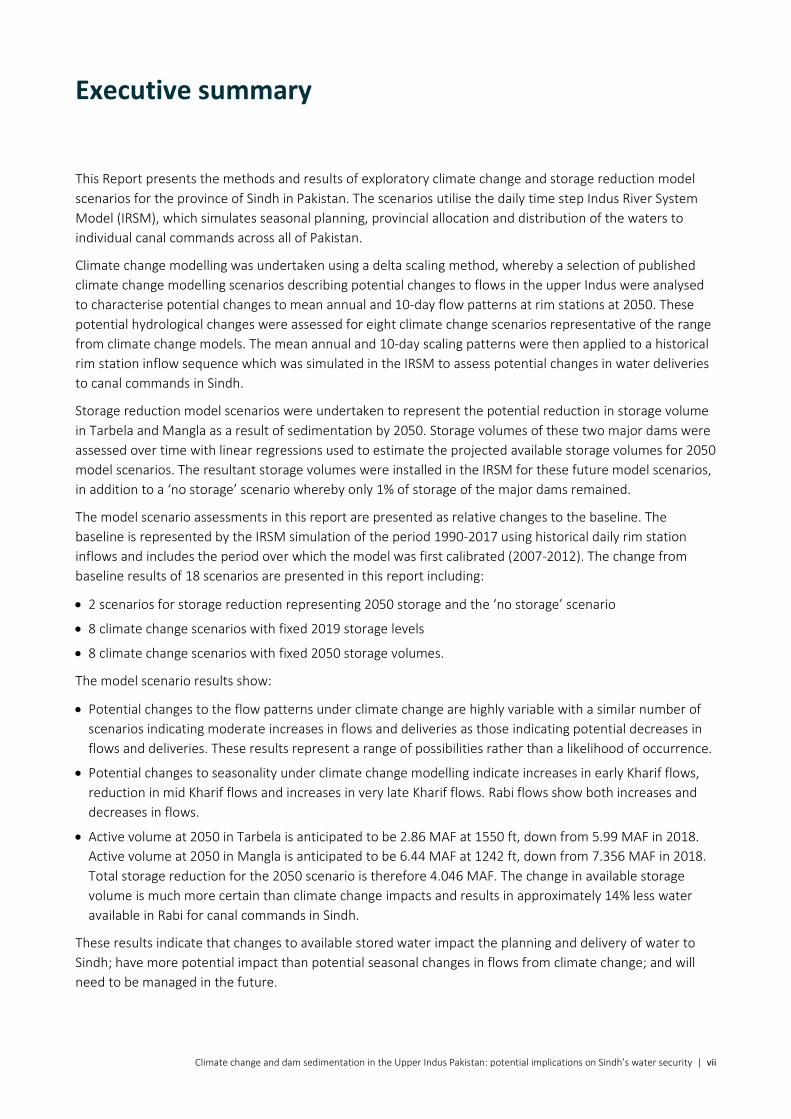
Executive summary
This Report presents the methods and results of exploratory climate change and storage reduction model scenarios for the province of Sindh in Pakistan. The scenarios utilise the daily time step Indus River System Model (IRSM), which simulates seasonal planning, provincial allocation and distribution of the waters to individual canal commands across all of Pakistan.
Climate change modelling was undertaken using a delta scaling method, whereby a selection of published climate change modelling scenarios describing potential changes to flows in the upper Indus were analysed to characterise potential changes to mean annual and 10-day flow patterns at rim stations at 2050. These potential hydrological changes were assessed for eight climate change scenarios representative of the range from climate change models. The mean annual and 10-day scaling patterns were then applied to a historical rim station inflow sequence which was simulated in the IRSM to assess potential changes in water deliveries to canal commands in Sindh.
Storage reduction model scenarios were undertaken to represent the potential reduction in storage volume in Tarbela and Mangla as a result of sedimentation by 2050. Storage volumes of these two major dams were assessed over time with linear regressions used to estimate the projected available storage volumes for 2050 model scenarios. The resultant storage volumes were installed in the IRSM for these future model scenarios, in addition to a ‘no storage’ scenario whereby only 1% of storage of the major dams remained.
The model scenario assessments in this report are presented as relative changes to the baseline. The baseline is represented by the IRSM simulation of the period 1990-2017 using historical daily rim station inflows and includes the period over which the model was first calibrated (2007-2012). The change from baseline results of 18 scenarios are presented in this report including:
• 2 scenarios for storage reduction representing 2050 storage and the ‘no storage’ scenario
• 8 climate change scenarios with fixed 2019 storage levels
• 8 climate change scenarios with fixed 2050 storage volumes.
The model scenario results show:
• Potential changes to the flow patterns under climate change are highly variable with a similar number of scenarios indicating moderate increases in flows and deliveries as those indicating potential decreases in flows and deliveries. These results represent a range of possibilities rather than a likelihood of occurrence.
• Potential changes to seasonality under climate change modelling indicate increases in early Kharif flows, reduction in mid Kharif flows and increases in very late Kharif flows. Rabi flows show both increases and decreases in flows.
• Active volume at 2050 in Tarbela is anticipated to be 2.86 MAF at 1550 ft, down from 5.99 MAF in 2018. Active volume at 2050 in Mangla is anticipated to be 6.44 MAF at 1242 ft, down from 7.356 MAF in 2018. Total storage reduction for the 2050 scenario is therefore 4.046 MAF. The change in available storage volume is much more certain than climate change impacts and results in approximately 14% less water available in Rabi for canal commands in Sindh.
These results indicate that changes to available stored water impact the planning and delivery of water to Sindh; have more potential impact than potential seasonal changes in flows from climate change; and will need to be managed in the future.
Climate change and dam sedimentation in the Upper Indus Pakistan: potential implications on Sindh’s water security | 1
1 Introduction
The province of Sindh in Pakistan requires an assessment of the impacts of climate change, population growth and changes to cropping patterns on the water balance of canal commands in the province. CSIRO’s role in this work is to undertake initial water balance modelling and scenario assessments for Sindh including exploratory climate change impact assessments on projected inflows to Sindh using the Indus River System Model (IRSM). In addition to these modelling assessments, CSIRO’s role is to also provide more detailed modelling assessments on the Nara Canal water balance and advice on the framework of a Sindh Hydro-informatics Program to maintain and leverage water data in Sindh.
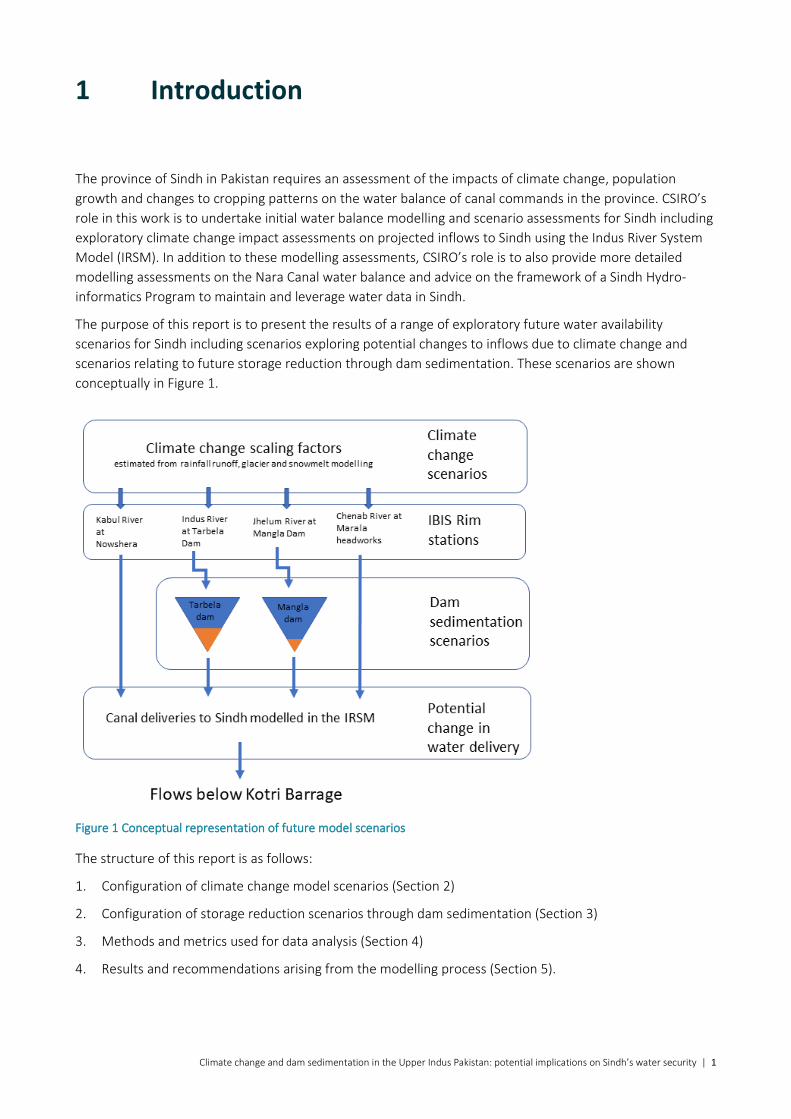
The purpose of this report is to present the results of a range of exploratory future water availability scenarios for Sindh including scenarios exploring potential changes to inflows due to climate change and scenarios relating to future storage reduction through dam sedimentation. These scenarios are shown conceptually in Figure 1.
Figure 1 Conceptual representation of future model scenarios
The structure of this report is as follows:
1. Configuration of climate change model scenarios (Section 2)
2. Configuration of storage reduction scenarios through dam sedimentation (Section 3)
3. Methods and metrics used for data analysis (Section 4)
4. Results and recommendations arising from the modelling process (Section 5).
2 | Climate change and dam sedimentation in the Upper Indus Pakistan: potential implications on Sindh’s water security
1.1 The Indus River System Modelling framework
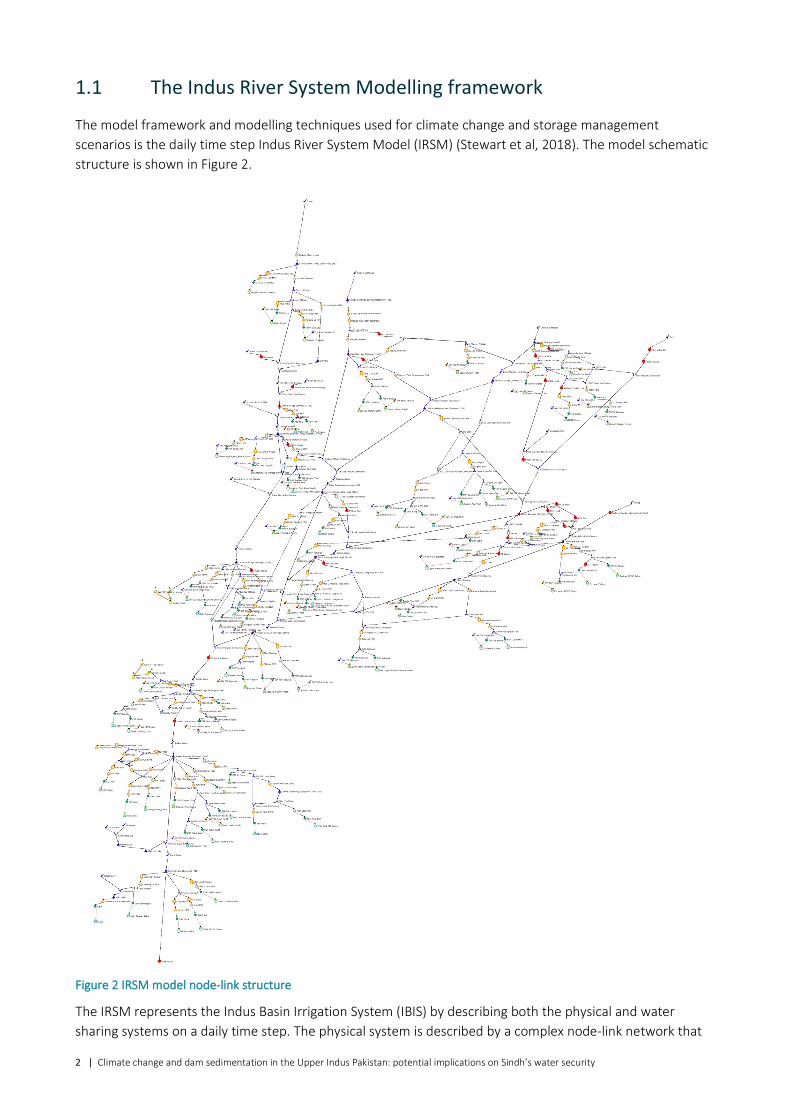
The model framework and modelling techniques used for climate change and storage management scenarios is the daily time step Indus River System Model (IRSM) (Stewart et al, 2018). The model schematic structure is shown in Figure 2.
Figure 2 IRSM model node-link structure
The IRSM represents the Indus Basin Irrigation System (IBIS) by describing both the physical and water sharing systems on a daily time step. The physical system is described by a complex node-link network that
Climate change and dam sedimentation in the Upper Indus Pakistan: potential implications on Sindh’s water security | 3
commences at major inflow points known as rim stations (Kabul River at Nowshera, Indus River at Tarbela Dam, Jhelum River at Mangla Dam and Chenab River at Marala Barrage) and includes 2 major supply reservoirs (Tarbela and Mangla), Ghazi-Botha scheme, 16 barrages (including Chashma), 14 main link canals and 73 irrigation supply canals and associated irrigation demands and ends below Kotri Barrage. The model accounts for major supply reservoir sedimentation over time, flow routing and distribution losses. The model also considers energy generation at Tarbela, Mangla, Ghazi-Botha scheme and hydro capable barrages. The water sharing system reproduces seasonal inflow forecasts at rim stations, the 1991 water apportionment accord sharing arrangements as well as provincial sharing at the command canal level. The water delivery system manages constraints and the delivery of water via multiple supply paths and storages. This IRSM is the first daily modelling framework to allow federal and provincial agencies to simulate the planning and delivery of water to the canal command level.
Figure 3 Indus River system showing major dams and headworks
The aspirational aim of this model is to provide a standalone tool for national and provincial water management agencies to simulate planning and seasonal operational decisions on the Indus River. The IRSM is modelled in eWater Source, Australia’s National Hydrological Modelling platform. Details of model construction can be found in Stewart et al (2018).
The climate change and sedimentation impacts are assessed in the IRSM with modifications as outlined in this report.
4 | Climate change and dam sedimentation in the Upper Indus Pakistan: potential implications on Sindh’s water security
2 Configuration of climate change model scenarios
This section of the report outlines the climate change scaling methods and associated results on inputs used to undertake climate change modelling in the IRSM.
2.1 Climate inputs
The key input to the IRSM is daily time series of flows at the rim stations Kabul River at Nowshera, Indus River upstream of Tarbela, Jhelum upstream of Mangla Dam, Chenab River upstream of Marala and Eastern Rivers inflows for the Sutlej and Ravi Rivers. In addition to these inflows, a number of other smaller inflows such as the Soan, Haro, Kurram and Gomal rivers are included as inputs to the IRSM. For simplification purposes, the Eastern Rivers and other small inputs to the IRSM have not been scaled and have been retained as historical inflow sequences. Only the four rim station inflows are scaled.
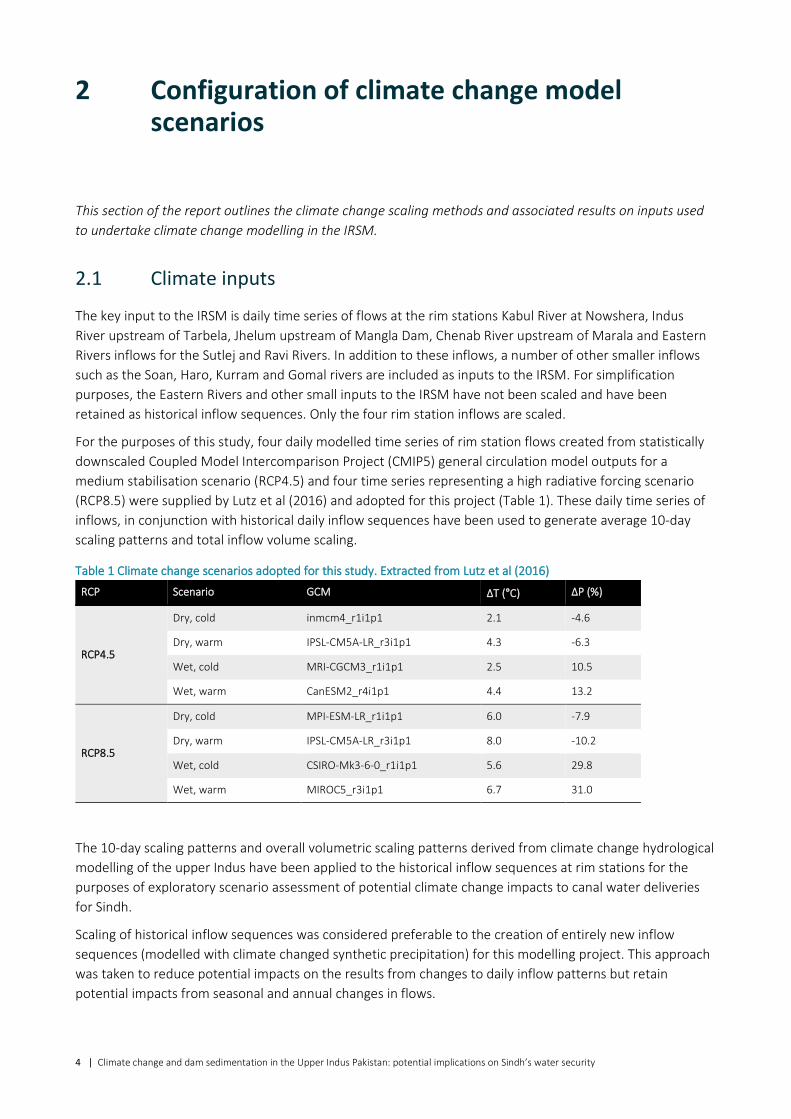
For the purposes of this study, four daily modelled time series of rim station flows created from statistically downscaled Coupled Model Intercomparison Project (CMIP5) general circulation model outputs for a medium stabilisation scenario (RCP4.5) and four time series representing a high radiative forcing scenario (RCP8.5) were supplied by Lutz et al (2016) and adopted for this project (Table 1). These daily time series of inflows, in conjunction with historical daily inflow sequences have been used to generate average 10-day scaling patterns and total inflow volume scaling.
Table 1 Climate change scenarios adopted for this study. Extracted from Lutz et al (2016)
RCP Scenario GCM ΔT (°C) ΔP (%)
RCP4.5
Dry, cold inmcm4_r1i1p1 2.1 -4.6
Dry, warm IPSL-CM5A-LR_r3i1p1 4.3 -6.3
Wet, cold MRI-CGCM3_r1i1p1 2.5 10.5
Wet, warm CanESM2_r4i1p1 4.4 13.2
RCP8.5
Dry, cold MPI-ESM-LR_r1i1p1 6.0 -7.9
Dry, warm IPSL-CM5A-LR_r3i1p1 8.0 -10.2
Wet, cold CSIRO-Mk3-6-0_r1i1p1 5.6 29.8
Wet, warm MIROC5_r3i1p1 6.7 31.0
The 10-day scaling patterns and overall volumetric scaling patterns derived from climate change hydrological modelling of the upper Indus have been applied to the historical inflow sequences at rim stations for the purposes of exploratory scenario assessment of potential climate change impacts to canal water deliveries for Sindh.
Scaling of historical inflow sequences was considered preferable to the creation of entirely new inflow sequences (modelled with climate changed synthetic precipitation) for this modelling project. This approach was taken to reduce potential impacts on the results from changes to daily inflow patterns but retain potential impacts from seasonal and annual changes in flows.
Climate change and dam sedimentation in the Upper Indus Pakistan: potential implications on Sindh’s water security | 5
The data analysis methods applied in the Lutz et al (2016) study and associated results are described in the following sections.
2.2 Historical rim station inflow scaling methodology
Climate change assessments on canal water deliveries were undertaken using the IRSM by scaling the historical inflow sequence (1990-2017) on a 10-day and mean annual flow basis reflecting potential changes modelled by Lutz et al (2016) for the Indus, Jhelum and Chenab rivers and CSIRO (unpublished) for the Kabul River.
In the case of the Indus, Jhelum and Chenab rim station inflows, modelling undertaken by Lutz et al (2016) produced a reasonable model agreement for the historical inflow sequence as measured by the Nash Sutcliffe coefficient of efficiency and overall bias for the post Tarbla period (1976-2007). In the case of the Kabul River, modelling undertaken by Lutz et al (2016) did not correlate as well with historical rim station inflow sequences with regards to seasonal timing (Table 2). This is likely a consequence of the model parameter sets chosen for the entire Upper Indus not reflecting the hydrological processes of this particular catchment.
Table 2 Model correlation statistics for rim stations
Model time series (Lutz et al 2016) CSIRO Source model
Indus Jhelum Chenab Kabul Kabul
Overall Bias 110% 87% 84% 234% 84%
Overall 10-day NSE 0.71 0.93 0.89 -1.29 0.75
Early Kharif
Bias 119% 92% 70% 127% 97%
10-day NSE 0.81 0.83 0.74 0.46 0.83
Late Kharif
Bias 108% 86% 85% 190% 81%
10-day NSE 0.80 0.87 0.75 -3.91 0.66
Rabi
Bias 113% 89% 75% 170% 90%
10-day NSE 0.59 0.75 0.61 -1.41 0.69
In the cases (of the Indus Jhelum and Chenab rivers), the following method was adopted to modify the historical daily rim station IRSM inflows:
1. Modelled flows estimated from climate change were compared to the modelled historical sequence and for each climate change run, the mean change in the flow pattern for each 10-day period was calculated, in addition to the overall mean change in inflow volume. The 10-day periods were preferred over annual or monthly scaling factors as these allotments of flow periods are used extensively throughout the seasonal planning and forecasting system in Pakistan.
2. The mean 10-day changes in inflow patterns for each climate change run are expressed as a percentage of baseline (historical) modelled mean inflow. A single percentage change figure for each 10-day period for each rim station and for each climate change scenario is generated in this way.
6 | Climate change and dam sedimentation in the Upper Indus Pakistan: potential implications on Sindh’s water security
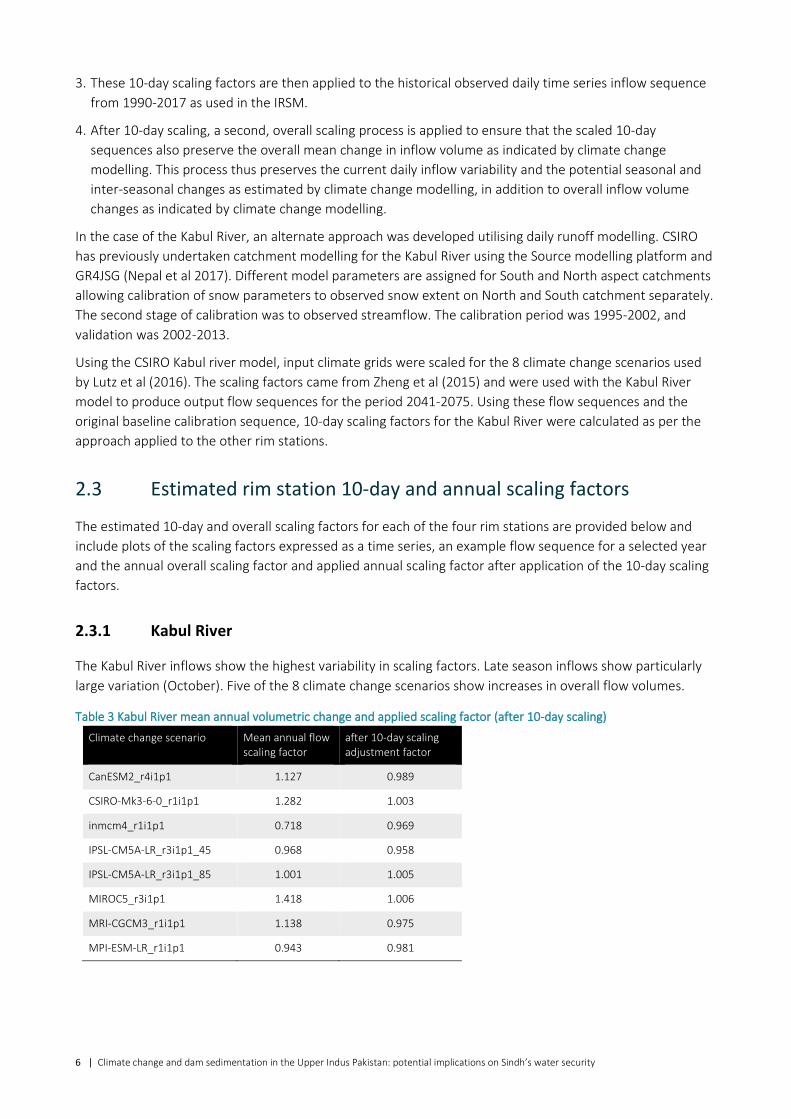
3. These 10-day scaling factors are then applied to the historical observed daily time series inflow sequence from 1990-2017 as used in the IRSM.
4. After 10-day scaling, a second, overall scaling process is applied to ensure that the scaled 10-day sequences also preserve the overall mean change in inflow volume as indicated by climate change modelling. This process thus preserves the current daily inflow variability and the potential seasonal and inter-seasonal changes as estimated by climate change modelling, in addition to overall inflow volume changes as indicated by climate change modelling.
In the case of the Kabul River, an alternate approach was developed utilising daily runoff modelling. CSIRO has previously undertaken catchment modelling for the Kabul River using the Source modelling platform and GR4JSG (Nepal et al 2017). Different model parameters are assigned for South and North aspect catchments allowing calibration of snow parameters to observed snow extent on North and South catchment separately. The second stage of calibration was to observed streamflow. The calibration period was 1995-2002, and validation was 2002-2013.
Using the CSIRO Kabul river model, input climate grids were scaled for the 8 climate change scenarios used by Lutz et al (2016). The scaling factors came from Zheng et al (2015) and were used with the Kabul River model to produce output flow sequences for the period 2041-2075. Using these flow sequences and the original baseline calibration sequence, 10-day scaling factors for the Kabul River were calculated as per the approach applied to the other rim stations.
2.3 Estimated rim station 10-day and annual scaling factors
The estimated 10-day and overall scaling factors for each of the four rim stations are provided below and include plots of the scaling factors expressed as a time series, an example flow sequence for a selected year and the annual overall scaling factor and applied annual scaling factor after application of the 10-day scaling factors.
2.3.1 Kabul River
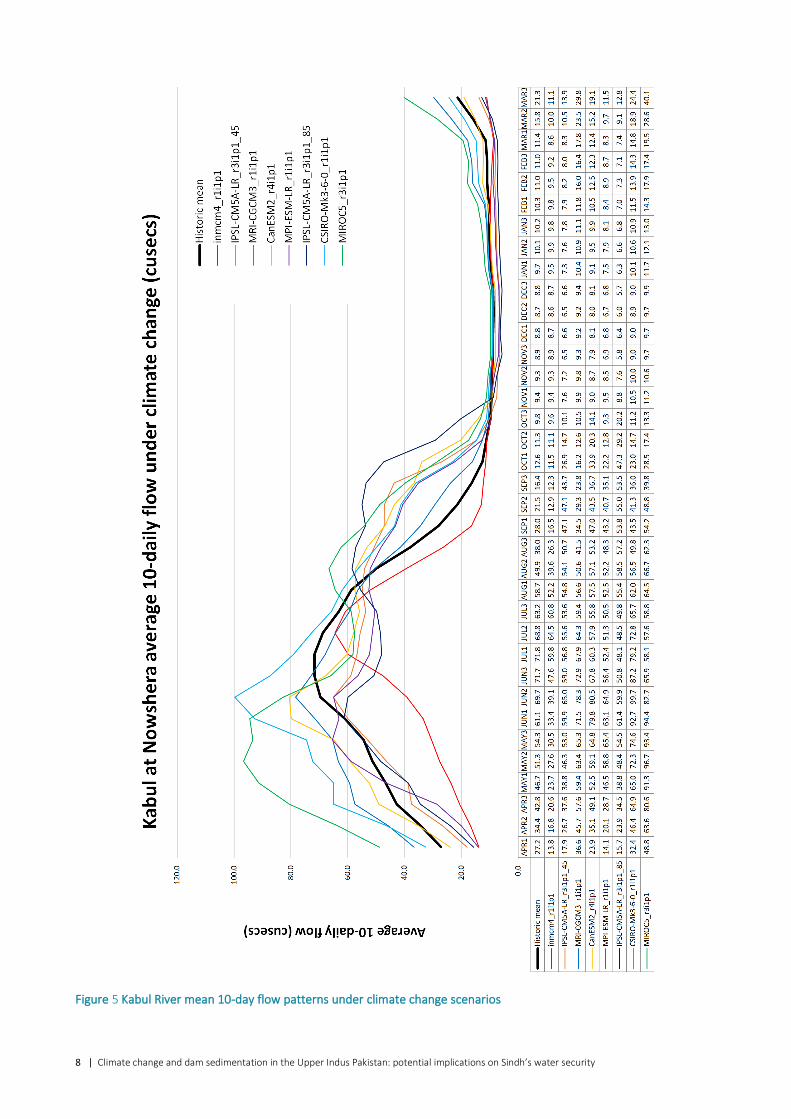
The Kabul River inflows show the highest variability in scaling factors. Late season inflows show particularly large variation (October). Five of the 8 climate change scenarios show increases in overall flow volumes.
Table 3 Kabul River mean annual volumetric change and applied scaling factor (after 10-day scaling)
Climate change scenario Mean annual flow scaling factor
after 10-day scaling adjustment factor
CanESM2_r4i1p1 1.127 0.989
CSIRO-Mk3-6-0_r1i1p1 1.282 1.003
inmcm4_r1i1p1 0.718 0.969
IPSL-CM5A-LR_r3i1p1_45 0.968 0.958
IPSL-CM5A-LR_r3i1p1_85 1.001 1.005
MIROC5_r3i1p1 1.418 1.006
MRI-CGCM3_r1i1p1 1.138 0.975
MPI-ESM-LR_r1i1p1 0.943 0.981
Climate change and dam sedimentation in the Upper Indus Pakistan: potential implications on Sindh’s water security | 7
Figure 4 Kabul River example showing historical and scaled daily inflows
8 | Climate change and dam sedimentation in the Upper Indus Pakistan: potential implications on Sindh’s water security
Figure 5 Kabul River mean 10-day flow patterns under climate change scenarios
Climate change and dam sedimentation in the Upper Indus Pakistan: potential implications on Sindh’s water security | 9
2.3.2 Indus River
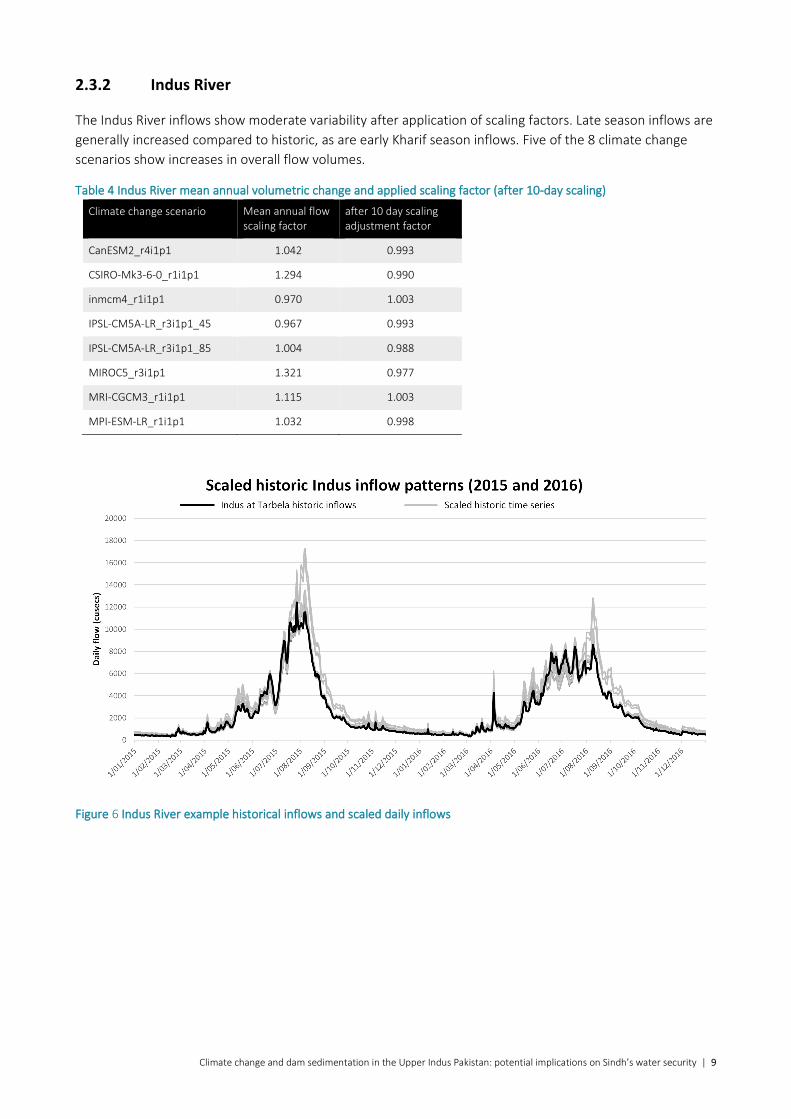
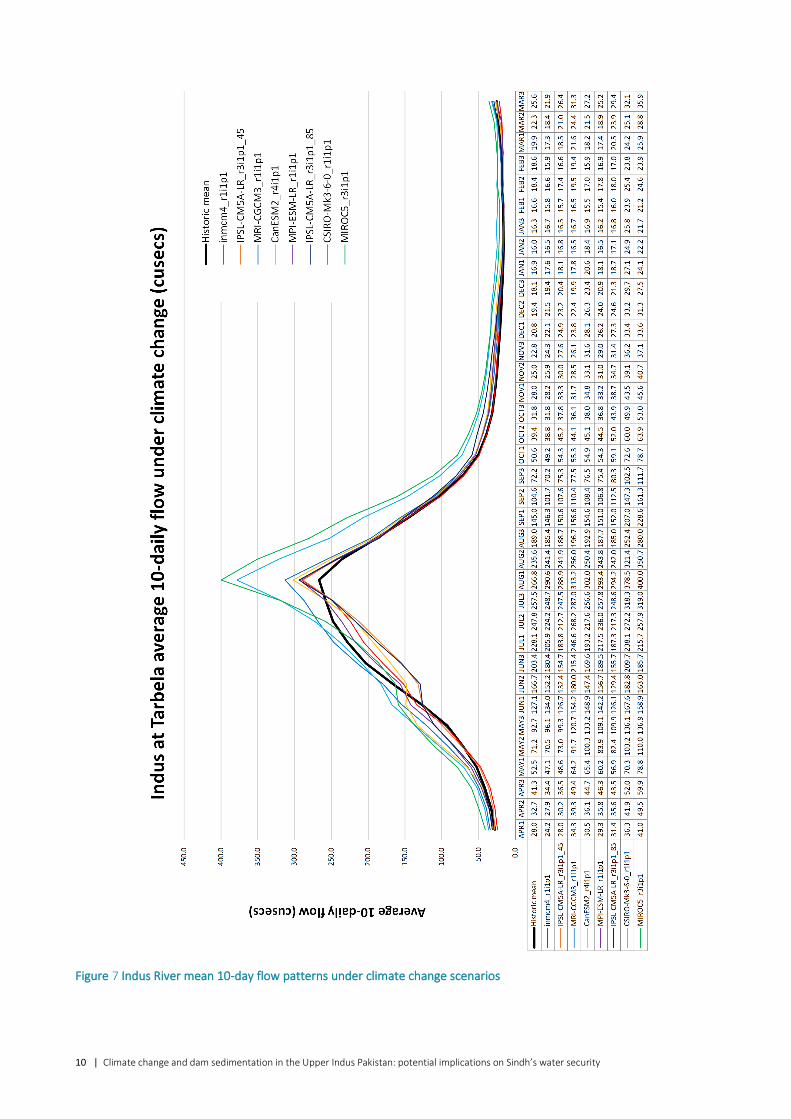
The Indus River inflows show moderate variability after application of scaling factors. Late season inflows are generally increased compared to historic, as are early Kharif season inflows. Five of the 8 climate change scenarios show increases in overall flow volumes.
Table 4 Indus River mean annual volumetric change and applied scaling factor (after 10-day scaling)
Climate change scenario Mean annual flow scaling factor
after 10 day scaling adjustment factor
CanESM2_r4i1p1 1.042 0.993
CSIRO-Mk3-6-0_r1i1p1 1.294 0.990
inmcm4_r1i1p1 0.970 1.003
IPSL-CM5A-LR_r3i1p1_45 0.967 0.993
IPSL-CM5A-LR_r3i1p1_85 1.004 0.988
MIROC5_r3i1p1 1.321 0.977
MRI-CGCM3_r1i1p1 1.115 1.003
MPI-ESM-LR_r1i1p1 1.032 0.998
Figure 6 Indus River example historical inflows and scaled daily inflows
10 | Climate change and dam sedimentation in the Upper Indus Pakistan: potential implications on Sindh’s water security
Figure 7 Indus River mean 10-day flow patterns under climate change scenarios
Climate change and dam sedimentation in the Upper Indus Pakistan: potential implications on Sindh’s water security | 11
2.3.3 Jhelum River
The Jhelum River inflows show high variability after application of scaling factors. Early Kharif and mid Kharif flows are generally reduced, however the very late part of Kharif preceding Rabi show almost all higher flows indicating a seasonal shift. Late season inflows are generally increased compared to historic, as are early Kharif season inflows. Only three of the eight climate change scenarios indicate an overall increase in flow volume.
Table 5 Jhelum River mean annual volumetric change and applied scaling factor (after 10-day scaling)
Climate change scenario Mean annual flow scaling factor
after 10 day scaling adjustment factor
CanESM2_r4i1p1 0.991 1.010
CSIRO-Mk3-6-0_r1i1p1 1.607 1.008
inmcm4_r1i1p1 0.911 1.004
IPSL-CM5A-LR_r3i1p1_45 0.836 1.007
IPSL-CM5A-LR_r3i1p1_85 0.787 0.997
MIROC5_r3i1p1 1.250 0.997
MRI-CGCM3_r1i1p1 1.156 1.008
MPI-ESM-LR_r1i1p1 0.854 1.011
Figure 8 Jhelum River example historical inflows and the potential range of scaled daily inflows
12 | Climate change and dam sedimentation in the Upper Indus Pakistan: potential implications on Sindh’s water security
Figure 9 Jhelum River mean 10-day flow patterns under climate change scenarios
Climate change and dam sedimentation in the Upper Indus Pakistan: potential implications on Sindh’s water security | 13
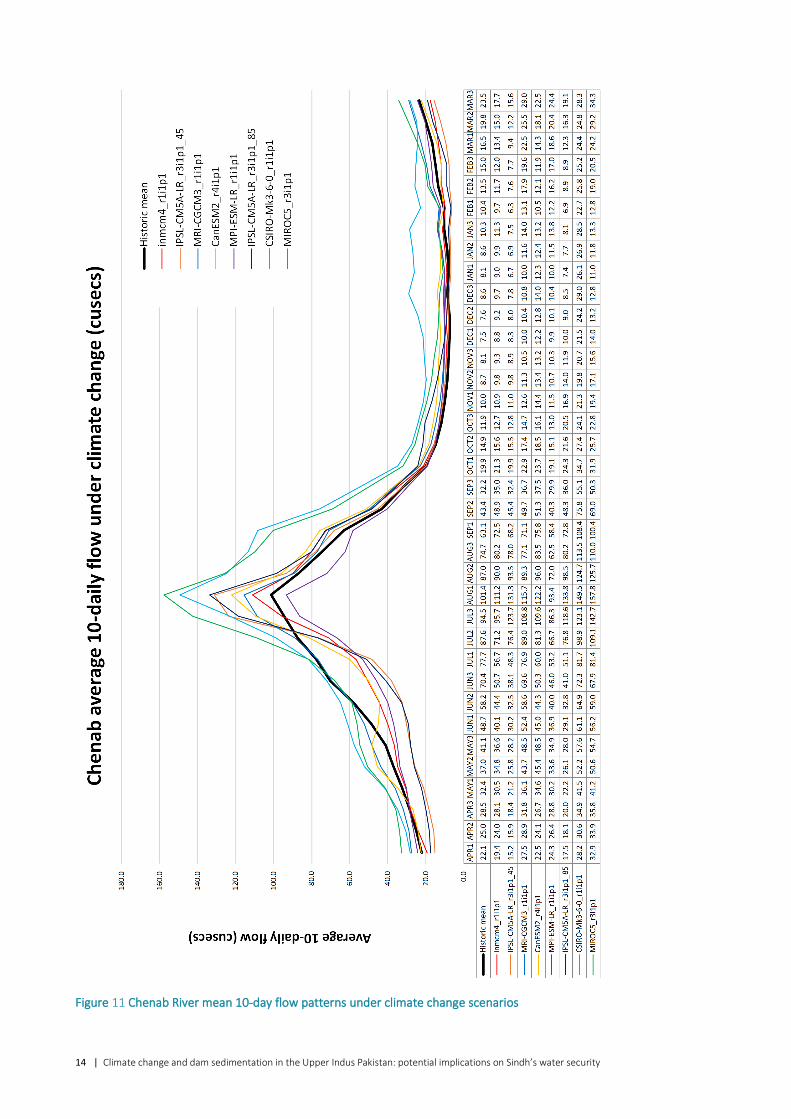
2.3.4 Chenab River
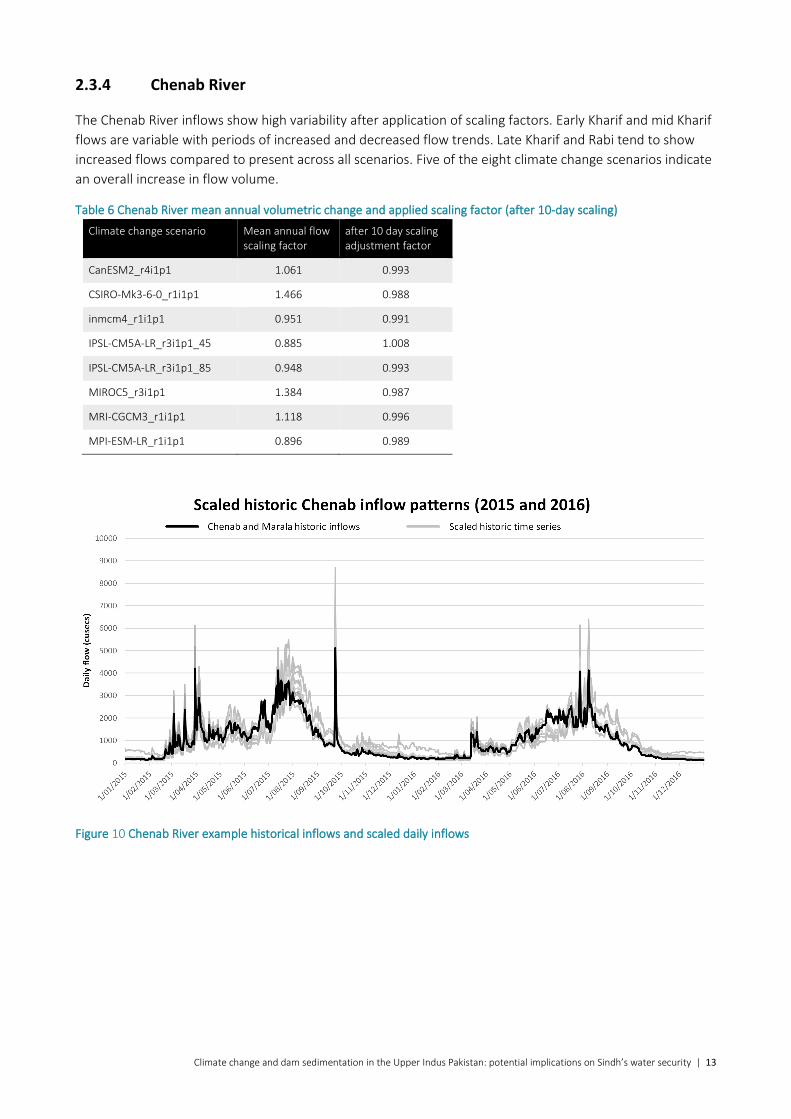
The Chenab River inflows show high variability after application of scaling factors. Early Kharif and mid Kharif flows are variable with periods of increased and decreased flow trends. Late Kharif and Rabi tend to show increased flows compared to present across all scenarios. Five of the eight climate change scenarios indicate an overall increase in flow volume.
Table 6 Chenab River mean annual volumetric change and applied scaling factor (after 10-day scaling)
Climate change scenario Mean annual flow scaling factor
after 10 day scaling adjustment factor
CanESM2_r4i1p1 1.061 0.993
CSIRO-Mk3-6-0_r1i1p1 1.466 0.988
inmcm4_r1i1p1 0.951 0.991
IPSL-CM5A-LR_r3i1p1_45 0.885 1.008
IPSL-CM5A-LR_r3i1p1_85 0.948 0.993
MIROC5_r3i1p1 1.384 0.987
MRI-CGCM3_r1i1p1 1.118 0.996
MPI-ESM-LR_r1i1p1 0.896 0.989
Figure 10 Chenab River example historical inflows and scaled daily inflows
14 | Climate change and dam sedimentation in the Upper Indus Pakistan: potential implications on Sindh’s water security
Figure 11 Chenab River mean 10-day flow patterns under climate change scenarios
Climate change and dam sedimentation in the Upper Indus Pakistan: potential implications on Sindh’s water security | 15
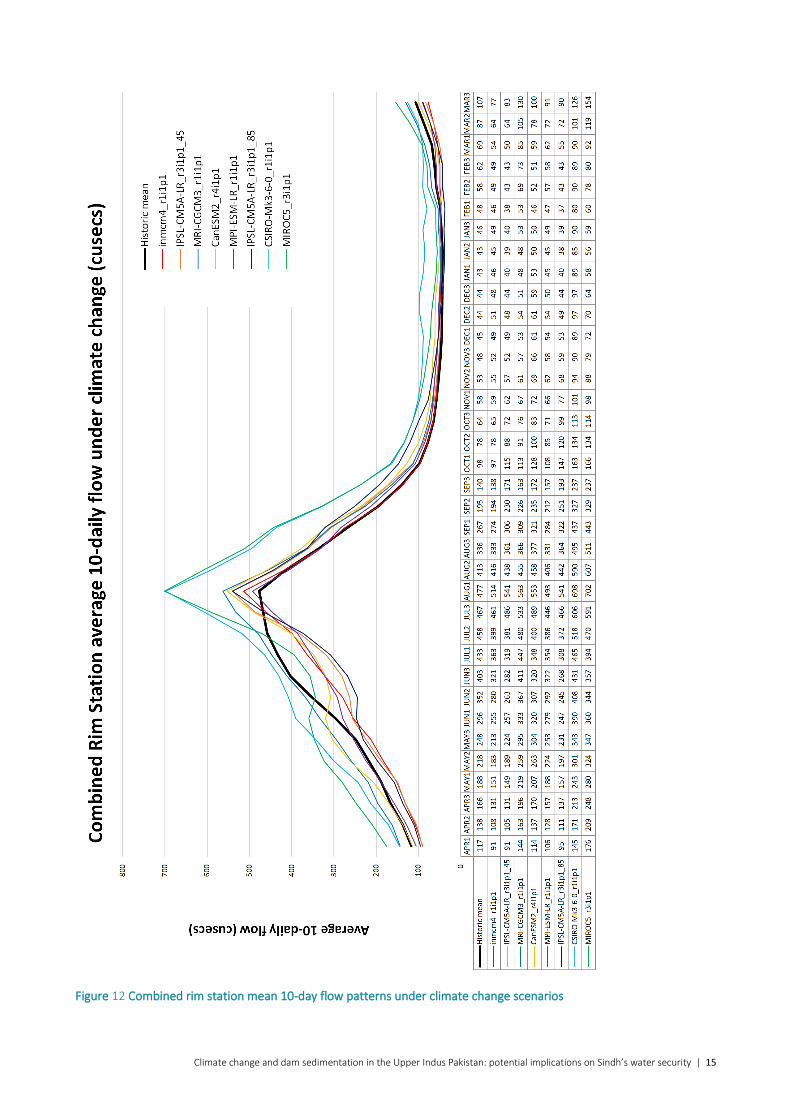
Figure 12 Combined rim station mean 10-day flow patterns under climate change scenarios
16 | Climate change and dam sedimentation in the Upper Indus Pakistan: potential implications on Sindh’s water security
2.4 Application of altered rim station inflows in the IRSM
Generation of daily climate change inflow data sets for the IRSM follows the following procedure:
• The 10-day scaling factors are applied to the rim station inflows for the period 1990-2017 (the current extended run period of the IRSM)
• The overall volume change in the rim station inflows (1990-2017) is calculated and compared with the mean annual flow scaling factors
• Secondary scaling is applied using the scaling adjustment factors to ensure that overall volume change is in proportion to that found through climate change rainfall-runoff modelling.
The resultant daily inflow time series are imported to the IRSM for model runs between 2036 and 2063 (centred around 2050). In addition to the change in inflow, the storage volume in Tarbela and Mangla is fixed at 2018/19 storage availability. No other significant changes are made to the IRSM to account for the changed inflow patterns such as potential changes that may occur through upstream development either inside or outside of Pakistan. This limitation is discussed in more detail in Section 5.5.
The planning scheme implemented in the IRSM remains unchanged for the climate change scenarios. This is an important limitation of the current modelling approach and is one of the key reasons why this modelling study is considered to be an exploratory first step with the application of the IRSM. Specific potential limitations of this approach are as follows:
• The lookup tables relating seasonal inflow to forecast inflow are non-linear and will return forecast values different than what might be returned if all available years of inflow are included in the lookup. In practice, all prior years of inflow are added to the knowledge database for forecasting next season’s inflows and if the exact same pre-season inflow volume were to occur 10 years apart, the forecast volume resulting from the pre-season inflow will be different. The climate change IRSM scenarios do not take this into account and use fixed lookup tables relating pre-season inflow to seasonal forecast inflow.
• Probability tables are not updated in the climate change IRSM scenarios. The IRSM currently uses the 2014 probability table which distributes seasonal forecast volumes across a daily inflow pattern to then distribute across canals. In practice, these are updated every 1-2 years and the complexity of this process is beyond the scope of these exploratory scenarios.
• The typical canal extraction patterns are unchanged. These patterns are based on historical patterns in the IRSM and generally are distributed according to the province-wide water availability. These patterns, along with canal closures, dictate the maximum amount and timing of water extractions at all canal commands. (Extractions are also limited by head at barrages and headworks capacities). Under climate change, some significant changes in seasonal timing to water availability may occur and provinces will likely adapt to this to take advantage. The IRSM does not try to adapt in this way.
Although these limitations may seem significant, we note that the IRSM was successful in estimating the long term mean annual canal extractions across a number of years with highly variable inflows between seasons. The inflow changes modelled in the climate change scenarios generally fall within the existing variability in inflows in historical inflows to the IRSM, providing some confidence that assessment and comparison of long-term model outputs will provide useful indications of potential long term trends in water availability under climate change.
Climate change and dam sedimentation in the Upper Indus Pakistan: potential implications on Sindh’s water security | 17
3 Configuration of storage sedimentation model scenarios
This section of the report outlines methods used to estimate the reduction in available storage volume resulting from sedimentation in Tarbela and Mangla dams and the associated results for the 2050 future scenarios.
The key input to the IRSM for 2050 scenarios are level-volume-area curves reflecting storage characteristics in the dams. This section outlines how these curves have been derived and how they are implemented in the IRSM scenarios.
3.1 Loss of storage volume due to sedimentation
Loss of available storage due to sedimentation is historically more pronounced in Tarbela compared to Mangla. Storage capacity is a major driver of regulating river flows in the IRSM and holding over water for Rabi season. The IRSM uses storages in a number of ways in the planning and regulation of seasonal flows. In the planning phase, available air space is used to indicate water that must be set aside for filling in Kharif. In Rabi, this water is then released for use. Operating target levels try to keep the storages within certain limits at different times of the year. Reductions in available storage volume will therefore typically lead to more water being available in Kharif (as it does not need to be set aside for storage, and less water available in Rabi as it could not be stored).
The estimation of future storage volumes is undertaken separately for Tarbela and Mangla. For the purposes of these exploratory scenarios, Chashma storage volume changes are not considered, and neither are storage augmentation options considered in the 2050 scenarios.
3.1.1 Tarbela
The IRSM utilises a number of level/volume observations from 1998-2013 to progressively account for storage reduction changes. Observations from the latest 10 years (2003-2013) show a consistent linear downward trajectory of Tarbela volume at the 1550 ft level (full capacity).
18 | Climate change and dam sedimentation in the Upper Indus Pakistan: potential implications on Sindh’s water security
Figure 13 Tarbela storage volume at 1550 ft from 2003-2013
The linear regression equation relates volume (MAF) to time (days). The slope of the regression shows the reduction in volume at 1550 ft per day in MAF.
Using this regression and projecting out to 2050 yields a volume at 1550 ft of 3.549 MAF. As an exploratory study, this investigation does not consider non-linear changes to the sedimentation rates under climate change inflow scenarios, however future studies may take this into account.
In addition to this reduction in volume due to sedimentation, the minimum operating level has also been increasing to halt the sediment front from reaching the dam wall and threatening energy generation and water release infrastructure.
Morris (2018) reports that over 38 years since 1975, the minimum operating level went from 1320 ft to 1378 ft, averaging this rate of increase results in 1.5 ft/yr. Therefore in 2050, the dead storage level might be somewhere near 1434 ft. At 1 ft/yr increase in operating level, the operating level becomes 1415 ft in 2050.
Figure 14 Tarbela sedimentation levels through time. Extracted from Morris (2018)
Climate change and dam sedimentation in the Upper Indus Pakistan: potential implications on Sindh’s water security | 19
Factoring in the change in dead storage level of 1.5 ft/yr (from the 2013 level of 1378 ft) yields a dead storage level of 1.025 MAF at approximately 1434 ft and active volume in 2050 of 2.523 MAF. Relaxing the increase in dead storage level to 1ft/yr results in dead storage level of 1415 ft and provides an active volume of 2.774 MAF.
For the setup of the IRSM, the above estimates of active volume of 2.774 MAF and 2.523 MAF average to 2.648 MAF. A Level-Volume-Area relationship has been generated to install in the model that reaches 2.64 MAF active volume with the existing outlet setup. This total volume has 2.86 MAF total storage at 1550 ft.
Scaling the 2018 survey to match the projected volume at 2050 of 2.86 MAF results in the level volume area curve used in the IRSM storage reduction scenarios.
3.1.2 Mangla
Estimation of sedimentation rates in Mangla follows a slightly different method than that used for Tarbela due to the dam wall raising in 2004 to 2009. Storage volume at 1202 ft, the pre-2004 maximum conservation level, is shown in Figure 15 with an associated linear regression line.
Figure 15 Mangla storage volume at 1202 ft from 1992-2011
The linear regression from 1992 to 2011 (18.7 years) suggests an average reduction in storage volume of 0.0178 MAF/yr. This is in high contrast to the sedimentation rate at Tarbela. Past reports suggest similar storage reduction rates and possible reasons for this low sedimentation rate preserving and extending the life of the reservoir:
• UI Haq (1994) reports a loss of 0.52 MAF in the first 27 years of operation resulting in an average rate of storage loss due to sedimentation of 0.019 MAF/yr. UI Haq (1994) attributes the low sedimentation rate in Mangla to watershed management: "From the very start of the project, extensive watershed management was carried out in the catchment area of the reservoir in Pakistan. Thousands of check dams and millions of trees were planted to check erosion of the soft sedimentary rocks in the catchment. Life of the reservoir which was estimated to be 100 years is expected to be more than 125 years.”
• More recently, Munir et al (2014) reports a loss of 0.89 MAF to 2012 since operation resulting in an average rate of storage loss due to sedimentation of 0.0197 MAF/yr.
20 | Climate change and dam sedimentation in the Upper Indus Pakistan: potential implications on Sindh’s water security
For modelling purposes, the linear regression line rate shown in Figure 15 is used to estimate reservoir volume in 2050. Consistent with the methods used for Tarbela reservoir, this exploratory study did not consider potential changes to the sedimentation rate under different climate change inflow patterns. Using this regression and projecting out to 2050 from the 2011 storage survey yields a volume at 1202 ft of 3.908 MAF and 6.44 MAF at 1242 ft (post dam wall raising conservation level) compared to a volume of 7.356 MAF at 1242 ft in 2018.
Scaling the 2011 survey to match the projected volume at 2050 of 3.908 MAF at 1202 ft results in the level volume area curve used in the IRSM storage reduction scenarios.
3.1.3 Chashma
For modelling purposes, storage loss at Chashma is not considered in future scenarios due to the relatively small size of this storage.
Climate change and dam sedimentation in the Upper Indus Pakistan: potential implications on Sindh’s water security | 21
4 Data analysis methods and metrics
This Section describes the methods and metrics used to report and compare model scenarios.
4.1 Metrics
This study is focussed on Sindh and all reporting typically relates to change in water available to Sindh from baseline modelling (1990-2017) under individual scenarios.
For reporting purposes, model results are generally expressed as changes from baseline, or current conditions rather than absolute volumetric values. This is consistent with the scaling method used in this study where historical inflows or storage volume availability was changed in isolation to other potential factors to indicate the potential change from current conditions.
Metrics used for all scenarios include:
1. percentage change in annual and seasonal water availability at Guddu Barrage (water availability), the inflow point to Sindh
2. percentage change in annual and seasonal water extracted at all canals in Sindh (canal deliveries)
3. Delivery Performance Ratio (DPR) where the DPR is given as the ratio of water delivered to intended delivery as defined by the 1991 Water Apportionment Accord (an absolute measure).
4.2 Interpreting box and whisker plots
The percentage change data has been created by comparing the model scenario data against the baseline data for matching years and seasons, that is, for the ‘no storage’ scenario year 1995, the canal deliveries to Sindh for Early Kharif, late Kharif, Rabi and total annual deliveries are evaluated and the percentage difference calculated. This time series of percentage differences are used to create the box and whisker plots in the Results section.
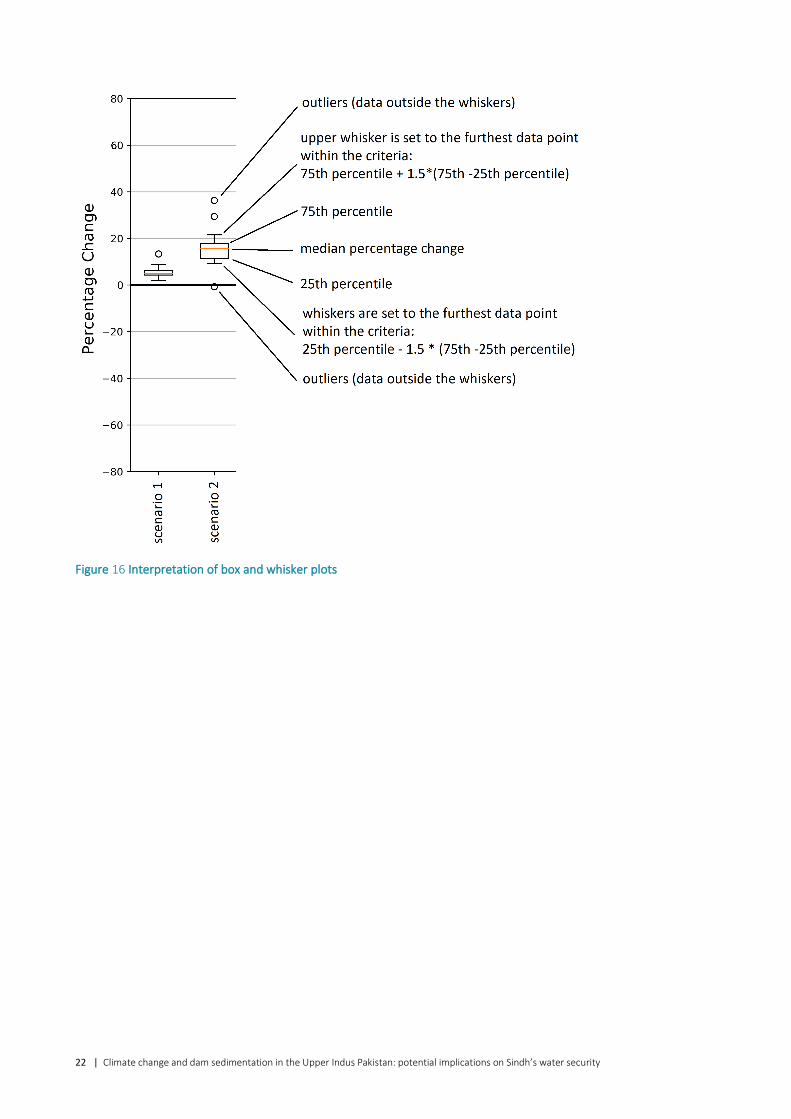
The data is then evaluated in box and whisker plots (Figure 16) as follows:
• the median percentage change is shown as the orange line of the box
• the 25th percentile and 75th percentiles make up the lower and upper segments of the box
• the whiskers of the plots represent the value of 25th or 75th percentile + 1.5 x the interquartile range (25th-75th percentile). This assumes the data are normally distributed
• the outliers represent percentage change data that lie outside of the whiskers.
22 | Climate change and dam sedimentation in the Upper Indus Pakistan: potential implications on Sindh’s water security
Figure 16 Interpretation of box and whisker plots
Climate change and dam sedimentation in the Upper Indus Pakistan: potential implications on Sindh’s water security | 23
5 Results and recommendations
This section presents results, using the metrics described in Section 4, and proposes recommendations to address study limitations.
5.1 Change in water deliveries to canals
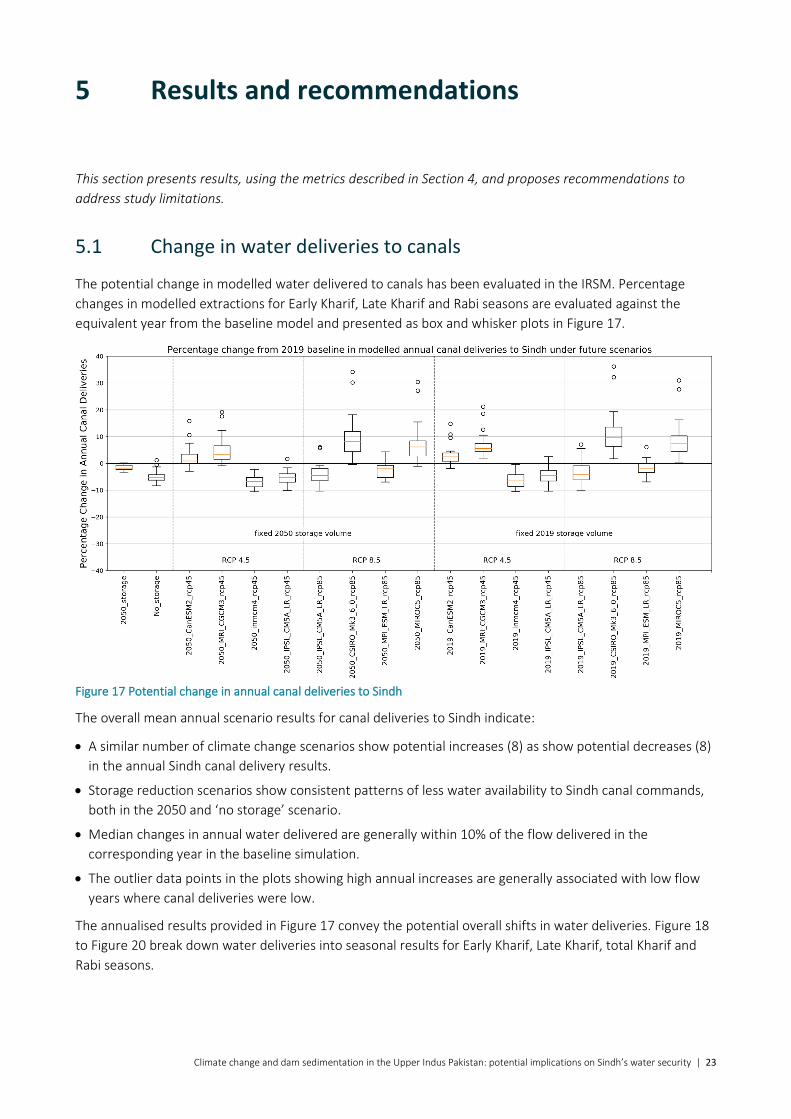
The potential change in modelled water delivered to canals has been evaluated in the IRSM. Percentage changes in modelled extractions for Early Kharif, Late Kharif and Rabi seasons are evaluated against the equivalent year from the baseline model and presented as box and whisker plots in Figure 17.
Figure 17 Potential change in annual canal deliveries to Sindh
The overall mean annual scenario results for canal deliveries to Sindh indicate:
• A similar number of climate change scenarios show potential increases (8) as show potential decreases (8) in the annual Sindh canal delivery results.
• Storage reduction scenarios show consistent patterns of less water availability to Sindh canal commands, both in the 2050 and ‘no storage’ scenario.
• Median changes in annual water delivered are generally within 10% of the flow delivered in the corresponding year in the baseline simulation.
• The outlier data points in the plots showing high annual increases are generally associated with low flow years where canal deliveries were low.
The annualised results provided in Figure 17 convey the potential overall shifts in water deliveries. Figure 18 to Figure 20 break down water deliveries into seasonal results for Early Kharif, Late Kharif, total Kharif and Rabi seasons.
24 | Climate change and dam sedimentation in the Upper Indus Pakistan: potential implications on Sindh’s water security
Figure 18 Potential change in early Kharif and Late Kharif seasonal canal deliveries
The potential changes in Early Kharif and Late Kharif indicate that many scenarios show a potential increase in canal deliveries. Generally, when upstream storage is reduced, canal deliveries in Early Kharif and Late Kharif increase, with more flows available in Early Kharif as there is less requirement to begin to store them in Tarbela and Mangla as per the seasonal planning scheme. However, the distributions show considerable scatter. The combined Kharif seasonal percentage change plot is shown in Figure 19.
Climate change and dam sedimentation in the Upper Indus Pakistan: potential implications on Sindh’s water security | 25
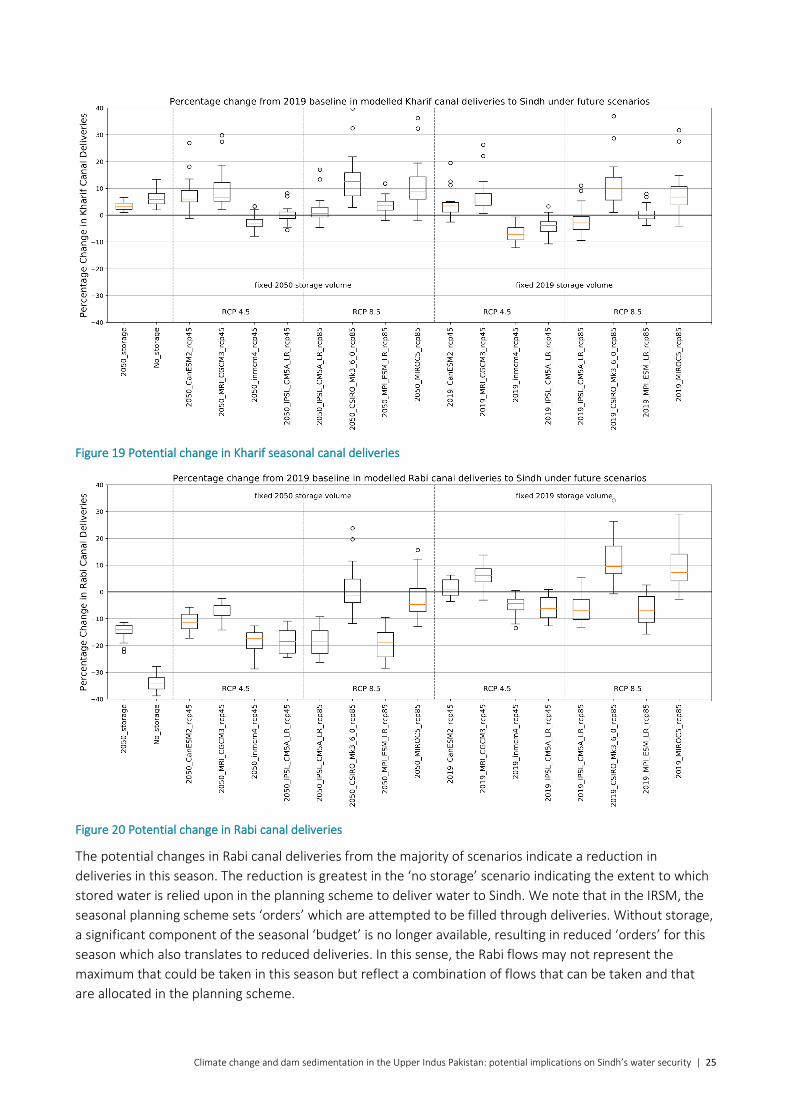
Figure 19 Potential change in Kharif seasonal canal deliveries
Figure 20 Potential change in Rabi canal deliveries
The potential changes in Rabi canal deliveries from the majority of scenarios indicate a reduction in deliveries in this season. The reduction is greatest in the ‘no storage’ scenario indicating the extent to which stored water is relied upon in the planning scheme to deliver water to Sindh. We note that in the IRSM, the seasonal planning scheme sets ‘orders’ which are attempted to be filled through deliveries. Without storage, a significant component of the seasonal ‘budget’ is no longer available, resulting in reduced ‘orders’ for this season which also translates to reduced deliveries. In this sense, the Rabi flows may not represent the maximum that could be taken in this season but reflect a combination of flows that can be taken and that are allocated in the planning scheme.
26 | Climate change and dam sedimentation in the Upper Indus Pakistan: potential implications on Sindh’s water security
5.2 Irrigation Delivery Performance Ratio
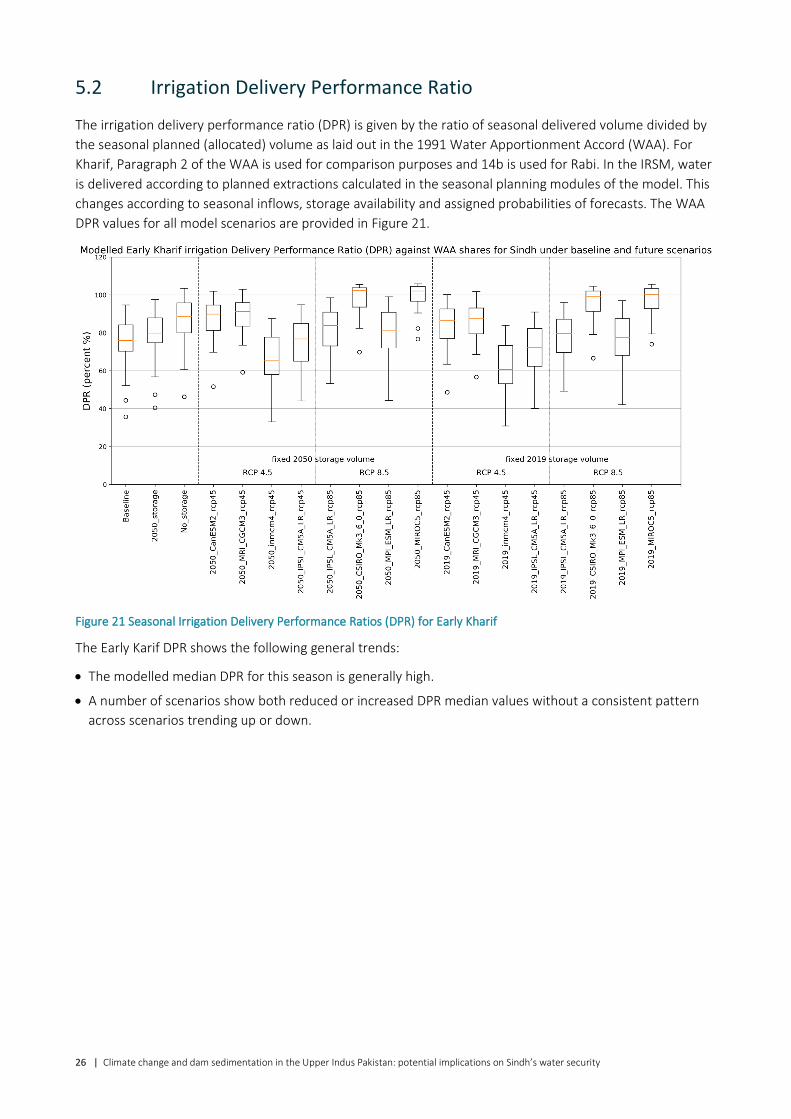
The irrigation delivery performance ratio (DPR) is given by the ratio of seasonal delivered volume divided by the seasonal planned (allocated) volume as laid out in the 1991 Water Apportionment Accord (WAA). For Kharif, Paragraph 2 of the WAA is used for comparison purposes and 14b is used for Rabi. In the IRSM, water is delivered according to planned extractions calculated in the seasonal planning modules of the model. This changes according to seasonal inflows, storage availability and assigned probabilities of forecasts. The WAA DPR values for all model scenarios are provided in Figure 21.
Figure 21 Seasonal Irrigation Delivery Performance Ratios (DPR) for Early Kharif
The Early Karif DPR shows the following general trends:
• The modelled median DPR for this season is generally high.
• A number of scenarios show both reduced or increased DPR median values without a consistent pattern across scenarios trending up or down.
Climate change and dam sedimentation in the Upper Indus Pakistan: potential implications on Sindh’s water security | 27
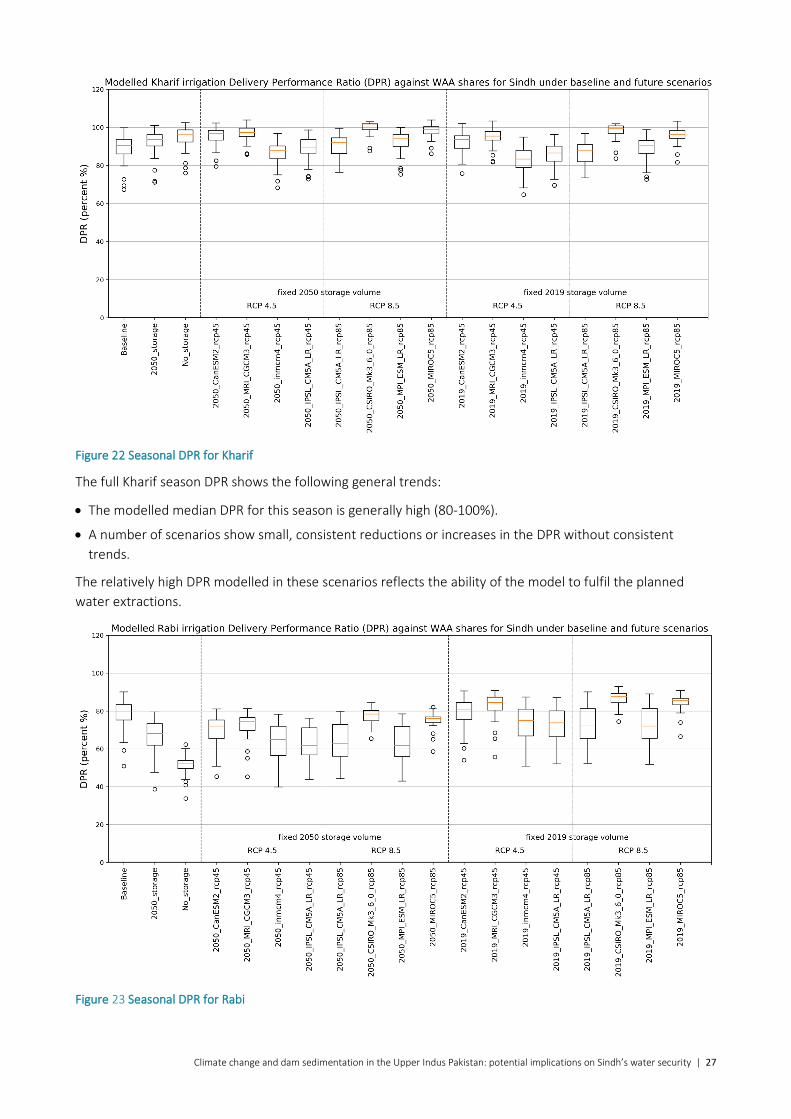
Figure 22 Seasonal DPR for Kharif
The full Kharif season DPR shows the following general trends:
• The modelled median DPR for this season is generally high (80-100%).
• A number of scenarios show small, consistent reductions or increases in the DPR without consistent trends.
The relatively high DPR modelled in these scenarios reflects the ability of the model to fulfil the planned water extractions.
Figure 23 Seasonal DPR for Rabi
28 | Climate change and dam sedimentation in the Upper Indus Pakistan: potential implications on Sindh’s water security
The Rabi DPR comparisons between scenarios show both increases and decreases in water availability when storage is maintained at 2019 levels. With reduced storage, which is likely to occur without augmentation, all climate change scenarios indicate less water will be available in Rabi. Under the ‘No storage’ scenario, the delivered water is significantly less on average than the baseline, highlighting the dependence on stored water to deliver appropriate flows in Rabi.
5.3 Change in seasonal water arriving at Guddu Barrage
The potential change in water arriving at Guddu provides an indication of both increases or decreases in water that can be extracted, in addition to increases or decreases in large events that pass into Sindh (and potentially exceed canal capacity or require temporary closure of offtake canals). Large seasonal increases in flows at Guddu without accompanying large increases in total canal extractions indicate flood flows that have not been captured by Tarbela and Mangla.
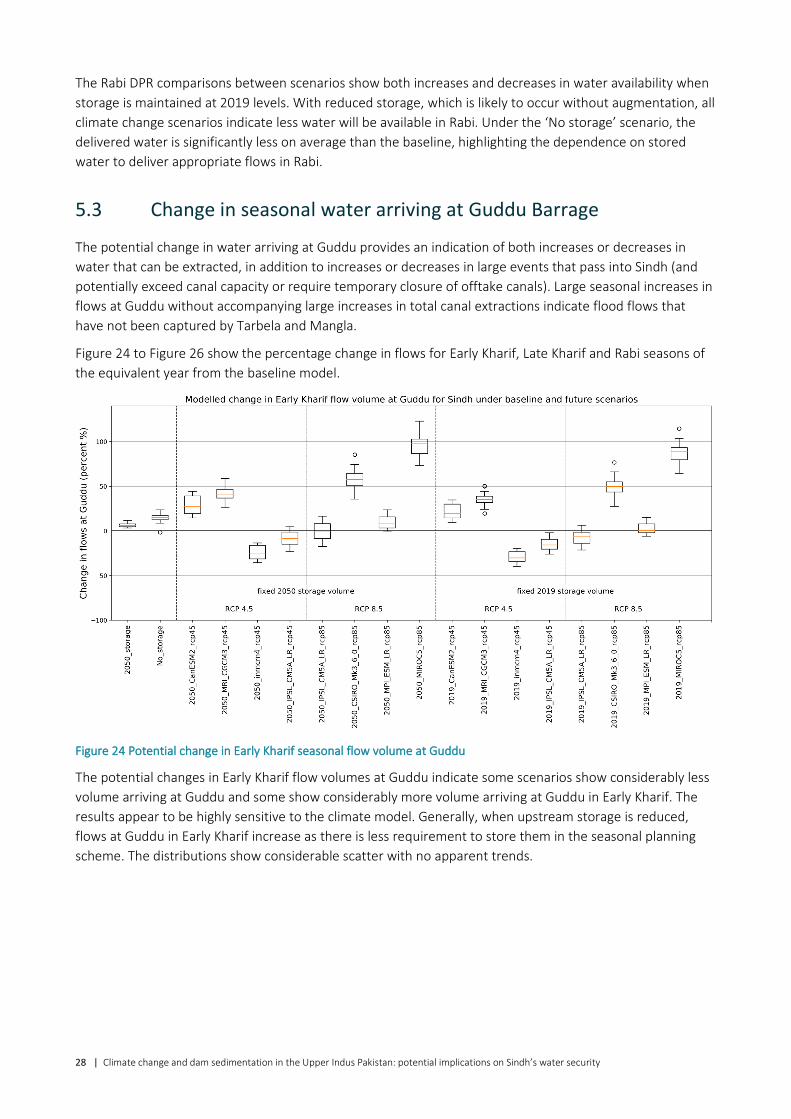
Figure 24 to Figure 26 show the percentage change in flows for Early Kharif, Late Kharif and Rabi seasons of the equivalent year from the baseline model.
Figure 24 Potential change in Early Kharif seasonal flow volume at Guddu
The potential changes in Early Kharif flow volumes at Guddu indicate some scenarios show considerably less volume arriving at Guddu and some show considerably more volume arriving at Guddu in Early Kharif. The results appear to be highly sensitive to the climate model. Generally, when upstream storage is reduced, flows at Guddu in Early Kharif increase as there is less requirement to store them in the seasonal planning scheme. The distributions show considerable scatter with no apparent trends.
Climate change and dam sedimentation in the Upper Indus Pakistan: potential implications on Sindh’s water security | 29
Figure 25 Potential change in Kharif seasonal flow volume at Guddu
The potential changes in Kharif flow volumes at Guddu indicate some scenarios show moderately less volume arriving at Guddu and some show considerably more volume arriving at Guddu, but with less variability than that modelled for Early Kharif. It comes as no surprise that the scenarios showing the highest increase in flows at Guddu are also associated with the highest Kharif DPR and highest increase in canal extractions. The relationship between increases in flows at Guddu and increases in canal extractions are not 1:1. This indicates that a significant proportion of the extra Guddu flows are flood flows that may result in canal closures or significant flooding. Alternatively, they may also indicate opportunity for canals such as Raini canal or storages such as Chotiari to be filled. These opportunistic scenarios are not considered in this modelling report.
Figure 26 Potential change in Rabi seasonal flow volume at Guddu
30 | Climate change and dam sedimentation in the Upper Indus Pakistan: potential implications on Sindh’s water security
The potential changes in Rabi flow volumes at Guddu indicate some scenarios show moderately less or similar volumes as the baseline arriving at Guddu with only two climate change scenarios showing considerable increase. Flow volumes arriving at canals during Rabi depend heavily on the use of stored water with the ‘no storage’ scenario showing the least amount of water arriving at Guddu in Rabi.
5.4 Results summary
The model scenario results show:
• A similar number of climate change scenarios show potential increases as show potential decreases in the annual Sindh canal delivery results. This indicates that we do not know if water deliveries will increase or decrease in the future.
• Storage reduction scenarios show consistent patterns of less water availability to Sindh canal commands, both in the 2050 and ‘no storage’ scenario (2-5% reduction in median annual delivery).
• Median changes in annual water delivered are generally within 10% of the flow delivered in the corresponding year in the baseline simulation.
• The potential changes in Early Kharif and Late Kharif indicate that many scenarios show a potential increase in canal deliveries. When upstream storage is reduced, canal deliveries in Early Kharif and Late Kharif increase, with more flows available in Early Kharif as there is less requirement to begin to store them in Tarbela and Mangla.
• The potential changes in Rabi canal deliveries from the majority of scenarios indicate a reduction in deliveries in this season. The reduction is greatest in the ‘no storage’ scenario.
• Results for water availability arriving at Guddu show the largest potential changes between scenarios with some scenarios showing considerable increases in water arriving at Guddu. Scenarios showing the highest increase in flows at Guddu are also associated with the highest Kharif DPR and highest increased in canal extractions.
• The relationship between increases in flows at Guddu and increases in canal extractions are not 1:1 indicating that some of the extra flows arriving at Guddu may be flood flows or they may represent opportunities for additional extraction in alternate ‘adaptive’ future scenarios.
Climate change and dam sedimentation in the Upper Indus Pakistan: potential implications on Sindh’s water security | 31
5.5 Study limitations and recommendations for future studies
This study presents the results of a number of exploratory scenarios looking at potential changes to canal deliveries in Sindh under climate change and storage reduction through sedimentation. As an exploratory study, this modelling has a number of limitations including:
1. Utilisation of a limited range of rainfall-runoff modelling frameworks to estimate changes to rim station inflows. Although the rim station runoff modelling undertaken by Lutz et al (2016) is comprehensive in terms of spatial and temporal scale, use of this single model conceptualisation for the majority of this work limits the potential scope of the output. An ensemble approach, utilising more than one rainfall-runoff model conceptualisation, in combination with the climate change input forcing would enable more comprehensive examination of the potential seasonal and overall rim station inflow changes, allowing more comprehensive assessment of potential seasonal changes. Individual hydrological calibration and sensitivity analysis of rim station catchments would make this analysis more robust.
We recommend the modelling be extended to include an ensemble of locally calibrated rainfall-runoff models in upper Indus basins to be able to draw more firm conclusions on potential seasonal changes in water availability to Sindh canals.
2. The planning scheme implemented in the IRSM is fixed for the climate change scenarios. In practice, seasonal inflow forecasts would adapt over time to consider potential changed inflow patterns.
We recommend future model scenarios to factor in updated seasonal forecast lookup tables, and probability tables as a default response to potential changes associated with climate change.
3. The typical canal extraction patterns for Sindh remain unchanged for the climate change scenarios. These patterns, along with canal closures, dictate the maximum amount and timing of water extractions at all canal commands. An adaptation scenario may involve a shift in pattern water requirements, particularly if climatic patterns also suggest a shift in water demand through earlier planting or changes to cropping patterns.
We recommend investigating an adaptation scenario to explore potential advantages to changing the typical canal extraction patterns for Sindh.
4. The more likely storage scenario for the future may be the reduction in Tarbela and Mangla available volumes combined and offset by new upstream storages. As the storage reduction scenarios show consistent trends, regardless of the climate change it would be worthwhile exploring the opportunities that arise from increased supply reliability and volume through an augmented storage scenario.
We recommend undertaking an augmented (increased) storage scenario to investigate supply reliability and volumetric changes for the canals of Sindh.
5. The modelling scenarios consider potential changes to flow patterns due to climate change but do not consider the potential changes due to upstream development outside of the control of Pakistan from new upstream storages. The reduced inflow climate change scenarios may give some indication of the potential impact of reduced flows at one or more rim stations, however it would be worthwhile exploring the potential impacts specifically from potential additional storages and diversions on rim station inflows.
We recommend undertaking a potential diversion scenario to investigate supply reliability and volumetric changes for the canals of Sindh if rim station inflows were altered by upstream development.
32 | Climate change and dam sedimentation in the Upper Indus Pakistan: potential implications on Sindh’s water security
References
Lutz AF, Immerzeel WW, Kraaijenbrink PDA, Shrestha AB, Bierkens MFP (2016) Climate Change Impacts on the Upper Indus Hydrology: Sources, Shifts and Extremes. PLoS ONE 11(11): e0165630. doi:10.1371/journal.pone.0165630
UI Haq I (1994) 26 Years Operation of Mangla Dam. XIII IC SM FE, 1994. New Delhi, India. https://www.issmge.org/uploads/publications/1/32/1994_03_0003.pdf
Munir M, Zia-ul-Hasan, Bakhsh Sufi A (2014) Addressing Water and Power Needs of Pakistan Through Construction of Major Storage Dams. Paper 744 in Proc. 72nd Annual Session of Pakistan Engineering Congress. https://pecongress.org.pk/images/upload/books/13-Muhammad%20Munir%20Ch..pdf
Morris G (2018) Indus Water System and Sustainable Sediment Management at Tarbela Dam, Pakistan. 19-20 October 2018 Supreme Court Building Islamabad, Pakistan (expanded handout Oct. 31, 2018)
Nepal S, Chen J, Penton D, Neumann L, Zheng H, Wahid S (2017) Spatial GR4J conceptualization of the Tamor glaciated alpine catchment in Eastern Nepal: Evaluation of GR4JSG against streamflow and MODIS snow extent. Hydrological Processes 31(1):51-68.
Stewart JP, Podger GM, Ahmad MD, Shah MA, Bodla H, Khero Z, Rana MKI (2018) Indus River System Model (IRSM) – a planning tool to explore water management options in Pakistan: model conceptualisation, configuration and calibration. August 2018. Technical report. South Asia Sustainable Development Investment Portfolio (SDIP) Project. CSIRO, Australia. 155p. https://doi.org/10.25919/5b7326bcd1554
Zheng H, Chiew F, Charles S (2015) Database of CMIP5 climate change projections across South Asia. CSIRO Land and Water, Australia.
38 | Climate change and dam sedimentation in the Upper Indus Pakistan: potential implications on Sindh’s water security
Table B.2 Tarbela Level-active volume data used for 2050 storage reduction scenarios ft active volume ft active volume ft active volume
1300 0.0000 1400 0.4759 1500 1.8753
1305 0.2058 1405 0.5261 1505 1.9680
1310 0.2113 1410 0.5764 1510 2.0607
1315 0.2172 1415 0.6283 1515 2.1570
1320 0.2231 1420 0.6803 1520 2.2534
1325 0.2292 1425 0.7340 1525 2.3535
1330 0.2353 1430 0.7877 1530 2.4536
1335 0.2416 1435 0.8436 1535 2.5583
1340 0.2478 1440 0.8996 1540 2.6630
1345 0.2543 1445 0.9584 1545 2.7721
1350 0.2608 1450 1.0172 1550 2.8811
1355 0.2806 1455 1.0974
1360 0.3004 1460 1.1775
1365 0.3209 1465 1.2605
1370 0.3415 1470 1.3435
1375 0.3628 1475 1.4288
1380 0.3841 1480 1.5140
1385 0.4064 1485 1.6026
1390 0.4287 1490 1.6911
1395 0.4523 1495 1.7832
As Australia’s national science agency and innovation catalyst, CSIRO is solving the greatest challenges through innovative science and technology.
CSIRO. UNLOCKING A BETTER FUTURE FOR EVERYONE
FOR FURTHER INFORMATION CSIRO Land and Water Dr Mobin-ud-Din Ahmad Project Leader – Indus SDIP Pakistan +61 2 6246 5936 [email protected] research.csiro.au/sdip/projects/indus/ 1300 363 400 +61 3 9545 2176 [email protected] www.csiro.au