Unit Title: Climate Change and the Lake Erie Watershed: Is there a connection between increased rainfall and water quality? Topic and unit description: There is strong scientific evidence that global climate change is happening and that the earth’s atmosphere is getting warmer. One result of climate change appears to be an increase in the frequency and intensity of severe rainstorms, particularly in the Midwest region of the United States. As severe rainstorms increase, scientists are expressing growing concern about the impact of increased runoff on water quality in the Great Lakes watersheds, particularly with respect to Lake Erie. In this investigation, students will learn about climate change and severe weather patterns, and then analyze real data from the Lake Erie watershed to explore the question of whether or not increasing amounts of rainfall, in particular severe rainstorms, appear to have a damaging effect on water quality. Students will analyze data and generate their own explanatory models to explore and model the relationships at work in these dynamic processes. The unit will end with students learning about eutrophication and algae blooms, which appear to be directly related to increased runoff of agricultural fertilizers into the watershed. Finally, students will make conjectures about other Great Lakes and suggest steps that might be taken to protect our water quality. As optional extensions to the unit, teachers will have the opportunity to engage students in different forms of extended projectbased learning in which students organize and present their findings in more formalized, authentic ways. Overarching Essential Question: How does climate change appear to be affecting the Lake Erie watershed? In particular, what is the relationship between increasingly severe rain events and water quality on the Lake Erie watershed? How can I explain and represent this relationship? 1
Transcript
Unit Title:
Climate Change and the Lake Erie Watershed: Is there a connection between increased rainfall and water quality?
Topic and unit description:
There is strong scientific evidence that global climate change is happening and that the earth’s atmosphere is getting warmer. One result of climate change appears to be an increase in the frequency and intensity of severe rainstorms, particularly in the Midwest region of the United States. As severe rainstorms increase, scientists are expressing growing concern about the impact of increased runoff on water quality in the Great Lakes watersheds, particularly with respect to Lake Erie. In this investigation, students will learn about climate change and severe weather patterns, and then analyze real data from the Lake Erie watershed to explore the question of whether or not increasing amounts of rainfall, in particular severe rainstorms, appear to have a damaging effect on water quality. Students will analyze data and generate their own explanatory models to explore and model the relationships at work in these dynamic processes. The unit will end with students learning about eutrophication and algae blooms, which appear to be directly related to increased runoff of agricultural fertilizers into the watershed. Finally, students will make conjectures about other Great Lakes and suggest steps that might be taken to protect our water quality. As optional extensions to the unit, teachers will have the opportunity to engage students in different forms of extended projectbased learning in which students organize and present their findings in more formalized, authentic ways.
Overarching Essential Question:
How does climate change appear to be affecting the Lake Erie watershed? In particular, what is the relationship between increasingly severe rain events and water quality on the Lake Erie watershed? How can I explain and represent this relationship?
1
Enduring Understandings:
Climate change is having an impact on many different interconnected natural processes and cycles. Warmer air holds more water vapor, so as average temperatures increase, it appears that the intensity of severe weather such as rainstorms is also increasing. Increased intense rainfalls lead to increases in storm runoff, which leads to more shortterm nutrient loading in water bodies near agricultural areas. This in turn has the potential to increase eutrophication and algae blooms, and appears to harm general water quality in these areas. There are many other factors involved as well, but these relationships do seem very clear.
Summative Assessment Task:
Students will develop a claim about the relationship between severe weather events and water quality, and they will use their data analysis to generate evidence to support their claims. Students, working in small groups, will develop and deliver whiteboard presentations in which they state their claim, support it with data representations on a whiteboard or poster, and explain how the data supports the claim using relevant science concepts and vocabulary from the unit. Provided participating teachers have time, students will then develop, or at least plan, an infographic that answers the following questions:
How does climate change appear to be affecting the Lake Erie watershed? In particular, what is the relationship between increasingly severe rain events and water quality on the Lake Erie
watershed? How can I explain and represent this relationship?
Learning Objectives
Students will be able to identify and summarize evidence that climate change appears to be causing an increase in severe weather events, and they will then be able to generate predictions as to how these trends might affect water quality in bodies of water like Lake Erie. Students will be able to explain and represent how severe weather events like rainstorms can have a negative impact on water quality and contribute to problems such as eutrophication and excessive algal blooms.
2
Standards: Next Generation Science Standards 3Dimensional Connections
Performance Expectations Disciplinary Core Ideas
HSESS22. Analyze geoscience data to make the claim that one change to Earth's surface can create feedbacks that cause changes to other Earth systems.
ESS2.D. Weather and Climate The foundation of Earth’s global climate systems is the electromagnetic radiation from the Sun, as well as its reflection, absorption, storage, and redistribution among the atmosphere, ocean, and land systems, and this energy’s reradiation into space. ESS2.A. Earth Materials and Systems Earth’s systems, being dynamic and interacting, cause feedback effects that can increase or decrease the original changes.
HSESS35. Analyze geoscience data and the results from global climate models to make an evidencebased forecast of the current rate of global or regional climate change and associated future impacts to Earth systems.
ESS3.D. Global Climate Change Though the magnitudes of human impacts are greater than they have ever been, so too are human abilities to model, predict, and manage current and future impacts.
HSESS36. Use a computational representation to illustrate the relationships among Earth systems and how those relationships are being modified due to human activity.
ESS3.D. Global Climate Change Through computer simulations and other studies, important discoveries are still being made about how the ocean, the atmosphere, and the biosphere interact and are modified in response to human activities.
Scientific Practices
Analyzing and Interpreting Data Constructing Explanations Developing and Using Models
Crosscutting Concepts
Patterns Cause and Effect Systems and System Models
3
Scope and Sequence Topic(s) Resources/Materials Learning Objectives Activities
Lesson 1
Climate change and the increasing frequency of severe weather events.
PowerPoint presentation Guided Reading
Students will be able to identify and summarize evidence that climate change appears to be causing an increase in severe weather events, and they will then be able to generate predictions as to how these trends might affect water quality in bodies of water like Lake Erie.
Interactive PPT to generate questions and activate prior knowledge. Context setting for the investigation through a guided reading activity on climate change and the increasing frequency of severe weather events.
Lesson 2
Lab introduction: Water quality, water quality indicators; and data analysis plans
Students will be able to make predictions about relationships between extreme precipitation events and variables related to water quality. Students will be able to develop a data analysis plan to explore patterns and relationships between extreme precipitation events and water quality variables.
Begin to define water quality and explore indicators. Learn some Excel basics, view data sample, and plan approach to data analysis.
Lesson 3
Data analysis: looking for relationships between precipitation and water quality indicators
Students will be able to identify and describe relationships between precipitation levels and water quality indicators through data analysis, and they will develop initial claims based upon these analyses.
Use different Excel operations to look for patterns in the data; use template to record observations and thinking.
Lesson 4
Generating claims from the evidence; representing data to support claims.
Data analysis template Excel database Computers PowerPoint presentation Whiteboards or chart paper
Working in groups, students will be able to develop a data representation that supports their claim, and they will explain how this data representation supports their claim.
Finish data analysis, discuss and generate claims, and then develop data representation to support claim. Gallery walk to compare claims and evidence.
Lesson 5
System impacts: Eutrophication and algal blooms.
PowerPoint presentation Guided reading Video link
Students will be able to explain and represent how severe weather events like rainstorms can have a negative impact on water quality and contribute to problems such as eutrophication and excessive algal blooms.
Guided reading activity leading to an outline or rough draft of an infographic, plan for an infographic; and development of infographic if time allows.
4
Lesson 1 Title:
Climate Change, Rainfall Patterns, and Severe Weather Events
Overview and Objective:
In the launch lesson for this unit, students will ask initial questions based on observations as they are introduced to the focal phenomena; describe and discuss prior knowledge related to core ideas and scientific vocabulary; and analyze information and data in text about climate change and its impacts (including increases in the frequency and intensity of heavy precipitation events and related impacts on water quality). Learning Objective: Students will be able to identify and summarize evidence that climate change appears to be causing an increase in severe weather events, and they will then be able to generate predictions as to how these trends might affect water quality in bodies of water like Lake Erie.
Additional vocabulary terms: troposphere; water vapor; season; flooding; erosion; pollution; ecosystem; growing season; water quality; agriculture; runoff
Instructional Resources
Lesson 1: Introduction to climate change and extreme precipitation events, PowerPoint Lesson 1 Reading: Climate Change and Extreme Weather Handouts: Three reading guide options for use with the text
Reading with embedded boxes for questions and reflection Graphic organizer for identifying and describing evidence related to climate change and extreme weather events Jigsaw activity guide
Supplementary Resources & Opportunities for Extension and Differentiation
EPA A Student’s Guide to Global Climate Change: Changing Rain and Snow Patterns http://www3.epa.gov/climatechange/kids/impacts/signs/precippatterns.html This site contains a short reading that provides additional information about why increased temperatures are associated with changing precipitation patterns. The text is accompanied by a graphic that provides information about rates of precipitation change in the United States between 1901 and 2012. (This resource could be projected for the class if needed to reinforce this idea or individual students could explore this site to support making these connections.)
NPR What is farm runoff doing to the water? Scientists wade in http://www.npr.org/sections/thesalt/2013/07/09/199095108/WhatsInTheWaterSearchingMidwestStreamsForCropRunoff This story addresses ways in which scientists are studying the relationships between rain events, agricultural runoff and water quality. Students could read or listen to this story following the conclusion of Lesson 1, before they begin to explore water quality data in the simulation, or at another point in the unit.
This lesson begins with a PowerPoint, so a computer and projector is needed. Students will also need markers and large sheets of chart paper for the listgrouplabel activity. Since the listgrouplabel activity will be completed in groups, you may want to have students seated at groups to begin the lesson. You may also want to consider which guided reading or which combination of the guided readings you want students to use and how to best group students based on this activity and accompanying resources.
Lesson Sequence: Starter
1. Begin the lesson by projecting the Lesson 1 PowerPoint and engaging students in observing and discussing the images on the slides. a. Slide 1 What’s the connection? Tell students that they will be introduced to a series of images. As they observe the images in
the slides, they will (1) make observations (jot what they notice) of the individual images and (2) be thinking about how these images might be related to one another. Ask students to get out a sheet of paper and number it from 15 (leaving enough space to stop and jot notes about their observations of each image). An observation, in this case, is a general description of what students see in the image.
b. Slides 26: Move through slides 26, pausing long enough on each slide for students to record their observations of the images. Remind students that although they are just making quick notes about their observations of the images, these notes should be detailed enough that they could clearly describe the image to someone who has not seen it.
c. Slide 7: Once students have recorded observations of each of the images, have them answer the question on Slide 7 beneath their notes: What do you think these images have to do with each other?
d. Slide 8: When you move to Slide 8, ask students to study the images in the order they appear on this slide. Have students turnandtalk with a partner about the following questions: (1) What is the connection among these images? (2) What story do they tell when placed together in this order? (3) With your turnandtalk partner, based on your observations of the images record questions to clarify or seek additional information about relationships among the images. This is similar to the ThinkPuzzleExplore Visible Thinking Routine.
e. Facilitate wholeclass discussion: (1) Invite students to share their ideas about how these images are connected and the story they tell. Instruct students to listen for and identify similarities and differences in their observations and their descriptions of how the images are connected. (2) Have students share the questions they generated with their turnandtalk partner. As different students share their questions, ask the rest of the class to evaluate whether the shared questions are “testable” and if so, how scientists might investigate them in order to clarify or seek additional information. (You may want to capture students’ questions by having them record them on a sheet of chart paper, the white board, or a SMARTboard.)
2. Listgrouplabel is a vocabulary activity that builds on students’ prior knowledge, helps students organize their understanding of
vocabulary, and engages students in learning new vocabulary related to a particular topic or concept.To begin listgrouplabel, tell students that they will be exploring ideas related climate change and water quality. Write each topic on a sheet of chart paper (one sheet for each topic) posted on the wall or whiteboard. First, have students brainstorm all the words they can think of that are related to climate change and list their responses on the paper. At this point, try to refrain from critiquing students’ responses, even though some of the words students’ brainstorm may not reflect core ideas related to the topic. Follow the same procedure to elicit and record students’ ideas related to water quality. Next, divide the class into small groups of three to four students. Half of the groups should be instructed to work with the list of words related to climate change; the other half should be instructed to work with the list of words related to water quality. Each small group of students will work to group their assigned list of words into subcategories. As students identify groups of words, encourage them to explain their reasoning for grouping certain words. Finally, instruct students to suggest a label that characterizes each group of words they created specific to their topic. Allow students to share and compare their groupings. Make sure to save these products (e.g., post paper copies somewhere visible in the classroom, allow students to take pictures with cell phones, etc.) so students can return to them throughout the unit to add words or revise groupings.
Direct instruction and guided inquiry:
3. Now that students have brainstormed their prior knowledge and have had the opportunity to discuss their current understandings related to the topics of climate change and water quality, have students proceed through the guided reading. There are a few different ways you can organize the reading activity. The Climate Change and Extreme Weather reading can be read by students in pairs or individually, and then students can use the Graphic Organizer to synthesize important information from the text. This is the quickest, most direct way to work with the text, but students might need more support. Strong, independent readers might prefer this option. There is also a version of the text with an embedded reading guide (chunked text with Stop and Jot and Turn and Talk processing opportunities built in). This will take longer, but will likely result in better comprehension. Students should have assigned partners for
Turn and Talks if you use this option. You can have students read and process the article, and then use the graphic organizer to pull ideas together (or you can skip the organizer). Using either of these formats, you can circulate, confer, and provide more direct support to any students who might need it. Alternatively, you might use a more guided approach. You could do this in two ways: (1) have students work in pairs on each chunk, and then check in with them after the chunk, asking students to share their responses; (2) if you feel that being responsible for small portions of this text would help your students better manage this activity, have students jigsaw the reading (a guide for this is included in the resources). This would involve assigning students groups to read and analyze only one section of the text in reading groups, and then reconfigure into “teaching groups” that include students who read different sections of the text. They then share their findings with each other and complete the jigsaw guide. In this option, it is important to use lots of questioning to make sure that students actually attend to and think about the sections they did NOT read.
a. However you have students do the reading, be sure not to just collect it and assign points. The point of the chunking and process is to have students engage with the ideas in the text on a more thoughtful level. After reading, go back through each chunk with the students and have different students quickly share their responses. This provides a quick formative assessment of their understanding of the text. As they share, you can ask the class if others have very different responses. You can also clarify any points of confusion by asking probing questions and directing students back into the text as needed. Make sure to ask students how the graphical representations of climate data within the reading supports or extends their thinking and have a quick discussion about it.
Independent practice:
4. After discussing the reading as a class, explain to students that they are going to work with a partner (or with the group they worked with to complete the reading) to create a representation (e.g., flowchart or diagram) of the relationship between the climate change and water quality based on their current understanding. You can instruct students to use a particular format or allow them to create their own representation. Because students are just beginning to work with some of these ideas, it is unlikely that they will have a clear understanding at this point about how features of climate change are related to water quality. If students need support in thinking about how to represent such relationships, you can use slide #9 from the PowerPoint to prompt their thinking with an ifthen statement model, question prompts, and sample graphic organizer templates they might use.
This quick activity is designed to allow students to get these ideas down on paper after viewing the inquiry presentation (PPT), brainstorming the topics of climate change and water quality broadly (listgrouplabel), and completing the guided reading about climate change. Encourage students to bring all of these activities to bare in their representation (i.e., encourage students to use terms from the listgrouplabel and the reading to explain their representation). For example, students should be able to identify the relationship between increasing temperatures, the ability of warm air to hold more water vapor, increases in precipitation, increases in severe weather events, and that these changes in climate are related to water quality. However, most students may not yet be able to explain the precise
8
connection between these factors (i.e., the relationship between increased precipitation events, agricultural runoff, and nutrient loading and nearby bodies of water).
Reflection and Assessment:
5. Conclude Lesson 1 by asking students to make a prediction about how climate change may impact water quality. Briefly revisit the questions students brainstormed at the beginning of the lesson. Do students have any additional questions to add? Ask students which of the questions they might be able to investigate in order to clarify the relationship between climate change and water quality. What additional information might they need to better understand the nature and impact of this relationship? Create a visible list of questions that can revisited during the unit in order to model the scientific practice of generating questions to drive research and analysis.
Handouts, Slides, and Other Printables:
PowerPoint Lesson 1: Introduction to climate change and extreme precipitation events Note: As described above, there are different ways to approach the reading, and depending upon which you organize the activity, you will need different resources from the materials below. Text (with no builtin scaffolds): Climate Change and Extreme Weather Reading guide / organizer: Graphic organizer for identifying and describing evidence related to climate change and extreme weather events Text with embedded reading guide: Reading with embedded boxes for questions and reflection Group Processing: Jigsaw activity guide
What is water quality and how do we study it? Previewing data and planning for analysis
Overview and Objective:
In this lesson, students brainstorm water quality indicators (variables) and make conjectures about how they are measured. They then explore several indicators that scientists consider to determine water quality, and explore precipitation data and water quality data from Lake Erie in order to develop a data analysis plan. Learning Objective(s): Students will make predictions about relationships between extreme precipitation events and variables related to water quality. Students will develop a data analysis plan to explore patterns and relationships between extreme precipitation events and water quality variables.
Key Concepts:
Water quality Precipitation Daily Discharge (Q) Suspended Solid (SS) Total Phosphorus Load (TP) Soluble Reactive Phosphorus Load (SRP) Nitrate + Nitrite Load (NO) Total Kjeldahl Nitrogen Load (TKN) Average Biomass (Algal Biomass)
Data analysis plan template Computer, projector, and screen
Supplementary Resources:
Supplementary text resources providing additional information about the water quality indicators are embedded within the Water Quality Indicators text.
Teacher Preparation and Notes:
This lesson includes a PowerPoint, so a computer and projector are needed. In addition, students will need access to the Excel spreadsheet with the data for this unit. Students will develop a data analysis plan and begin analyzing water quality data in this lesson. Since these activities will be completed in data analysis teams, you may want to have students seated in groups to begin the lesson. Also, having students already seated in their data analysis groups would allow them to easily share and compare their initial predictions that they make as they complete the reading at the beginning of the lesson.
Lesson Sequence: Starter
1. Lesson 1 concluded by asking students to make a prediction about how climate change may impact water quality. Begin this lesson by revisiting the concept of “water quality” and asking students to brainstorm ideas about the meaning of water quality. To elicit students’ initial ideas, have them engage in a Think Pair Share around the following questions: (1) What is water quality? (2) What does it mean that water may have different levels of quality? (3) What are indicators of water quality and how can we measure them? After students have had a few minutes to think about these questions and discuss them with a partner, give pairs an opportunity to share their thinking with the class. You may want to record their ideas on chart paper or a SMARTboard, if available.
2. Using the Lesson 2 PowerPoint, use Slide 2 to introduce students to the data, which include precipitation rates and water quality indicator
data from the Maumee River watershed and western basin of Lake Erie. The water quality indicators include the following: daily discharge, suspended solid, total phosphorus load, soluble reactive phosphorus load, nitrate + nitrite load, total Kjeldahl nitrogen load, and average biomass or biovolume. Draw students’ attention to any connections between the water quality indicators in this list and those they brainstormed during the thinkpair share. For example, students might have mentioned something along the lines of pollution, and you can tell them that these indicators include very specific types of pollution.
3. After introducing the focal indicators, have students proceed through the reading, Lesson 2 Water Quality Indicators, which describes the
concept of water quality and also defines and contextualizes each indicator. The reading begins with a brief description of what scientists mean when they talk about water quality, then defines each indicator, describes where each comes from, and explains how it is
measured. Below the brief description of what scientists mean when they talk about water quality (at the beginning of the reading) there is a prompt for students to Turn and Talk about the following question: Why would there be different standards for drinking water than for water used in industry? Then, below each description of the variables related to water quality is a box that prompts students to make predictions as to how these indicators might vary based on precipitation and daily discharge.
There are a few different ways you can organize the reading activity. The Water Quality Indicators reading can be read by students individually or in pairs. If students are reading independently, they may make individual predictions (Stop and Jot) after reading about each indicator, which they can later share with their data analysis group. Strong, independent readers might prefer this option. This is the quickest, most direct way to work with the text, but students might need more support. If students are reading in pairs, they may collaboratively discuss and develop predictions with their partner. Using the same text, students may read about each indicator and engage in a Turn and Talk with their partner as they pause to make their predictions. This will take longer, but will likely result in better comprehension. Students should have assigned partners for Turn and Talks if you use this option.
Using either of these formats, you can circulate, confer, and provide more direct support to any students who might need it. Alternatively, you might use a more guided approach. You could do this by having students work in pairs on each chunk, and then check in with them after the chunk, asking students to share their responses.
However you chose to do the reading, be sure not to just collect it and assign points. The point of having students read about each indicator is to have students engage with the ideas on a more thoughtful level and consider the following in relation to each indicator: What is it? Where does it come from? How is it measured? The goal of having students make predictions about how each indicator may vary in relation to amount of precipitation is to help students begin making connections among variables prior to being introduced to the full data set. This will support them as they develop a data analysis plan later in this lesson. After reading, go back through each indicator with the students and have different students quickly share (and possibly explain) their predictions. This provides a quick formative assessment of their understanding of the text. As they share, you can ask the class if others had the same or different predictions. You can also clarify any points of confusion by asking probing questions and directing students back into the text as needed.
Direct Instruction
4. Next, preview the data students will be working with, using the Lesson 2 PowerPoint.
a. Slide 3: Tell students about the types of data and the locations of data collection. Help them connect the information in the text to the locations on the map.
b. Slide 4: When you move to Slide 4, point out where the Maumee River enters Lake Erie as indicated on the aerial view. Have
students do a quick Turn and Talk about the question printed on the slide: Why do you think one part of the lake has green in it and the other part does not? Allow a few pairs to share their thinking with the class after they have had the opportunity to discuss the question. Ask students if they have any questions about water quality based on this image.
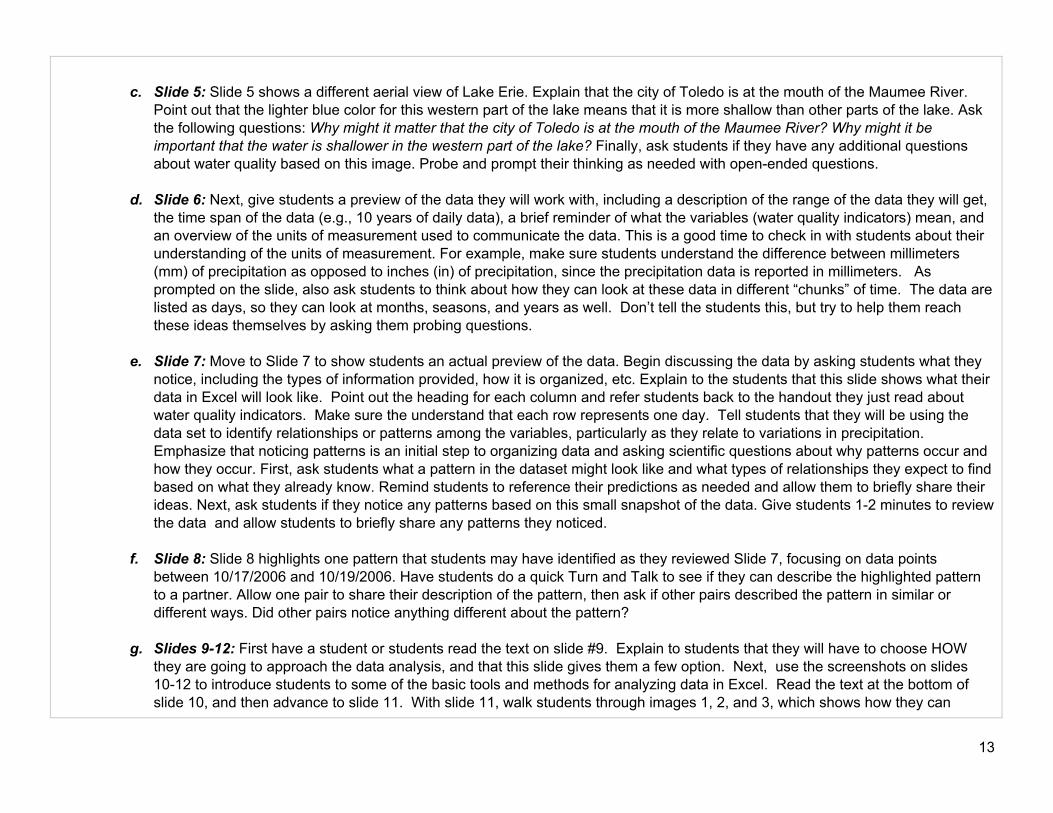
c. Slide 5: Slide 5 shows a different aerial view of Lake Erie. Explain that the city of Toledo is at the mouth of the Maumee River.
Point out that the lighter blue color for this western part of the lake means that it is more shallow than other parts of the lake. Ask the following questions: Why might it matter that the city of Toledo is at the mouth of the Maumee River? Why might it be important that the water is shallower in the western part of the lake? Finally, ask students if they have any additional questions about water quality based on this image. Probe and prompt their thinking as needed with openended questions.
d. Slide 6: Next, give students a preview of the data they will work with, including a description of the range of the data they will get,
the time span of the data (e.g., 10 years of daily data), a brief reminder of what the variables (water quality indicators) mean, and an overview of the units of measurement used to communicate the data. This is a good time to check in with students about their understanding of the units of measurement. For example, make sure students understand the difference between millimeters (mm) of precipitation as opposed to inches (in) of precipitation, since the precipitation data is reported in millimeters. As prompted on the slide, also ask students to think about how they can look at these data in different “chunks” of time. The data are listed as days, so they can look at months, seasons, and years as well. Don’t tell the students this, but try to help them reach these ideas themselves by asking them probing questions.
e. Slide 7: Move to Slide 7 to show students an actual preview of the data. Begin discussing the data by asking students what they
notice, including the types of information provided, how it is organized, etc. Explain to the students that this slide shows what their data in Excel will look like. Point out the heading for each column and refer students back to the handout they just read about water quality indicators. Make sure the understand that each row represents one day. Tell students that they will be using the data set to identify relationships or patterns among the variables, particularly as they relate to variations in precipitation. Emphasize that noticing patterns is an initial step to organizing data and asking scientific questions about why patterns occur and how they occur. First, ask students what a pattern in the dataset might look like and what types of relationships they expect to find based on what they already know. Remind students to reference their predictions as needed and allow them to briefly share their ideas. Next, ask students if they notice any patterns based on this small snapshot of the data. Give students 12 minutes to review the data and allow students to briefly share any patterns they noticed.
f. Slide 8: Slide 8 highlights one pattern that students may have identified as they reviewed Slide 7, focusing on data points
between 10/17/2006 and 10/19/2006. Have students do a quick Turn and Talk to see if they can describe the highlighted pattern to a partner. Allow one pair to share their description of the pattern, then ask if other pairs described the pattern in similar or different ways. Did other pairs notice anything different about the pattern?
g. Slides 912: First have a student or students read the text on slide #9. Explain to students that they will have to choose HOW
they are going to approach the data analysis, and that this slide gives them a few option. Next, use the screenshots on slides 1012 to introduce students to some of the basic tools and methods for analyzing data in Excel. Read the text at the bottom of slide 10, and then advance to slide 11. With slide 11, walk students through images 1, 2, and 3, which shows how they can
13
identify the top 10% of each variable. Box #1 shows what pops up when you click on Conditional Formatting. If they select Top/Bottom Rules, then the image #2 appears, and then can then selection Top 10%. If they do this, then the box in #3 shows up, and they can choose to look at the top 10%, or they can change it and look at the top 5%, for example. In the section that says “Format with,” they can choose the color of the highlighting. When they click on OK, it will then highlight the top 10% of that particular variable. Students can then look to see if there are patterns across the top 10% of different variables. Next talk students through slide 12, which shows them how to access the function tool and develop averages or sum totals for different variables.
If time allows, you might quickly model the use of these basic tools for the students so they can use them in their analyses of the data as needed. For example, you may want to help students calculate the average for a few fields so they have an idea about how to proceed, using these calculations and tools to support their analysis of the data and identification of patterns. If time or resources are tight, you might also choose to assign students one particular way to look at the data. This is not recommended as the goal of this unit is to give students experiences in planning for data analysis, and perhaps struggling along the way, but when time and resources are tight, tough choices have to be made!
Independent practice / guided inquiry
5. To conclude this lesson, students will make a plan for how they will investigate the data to explore relationships and identify patterns between extreme precipitation events and the other water quality variables. Students will work in data analysis teams (this could be groups of 23 students) to develop their data analysis plan, using a data analysis plan template. As a part of their plan, students will select at least 2 of the 5 indicators (in addition to precipitation) to analyze, develop a plan for how they will organize and look at these indicators, describe how they will connect the indicators to rainfall and discharge rate, and explain how they will take season and time of year into account. Students should complete this plan prior to the beginning of Lesson 3. Pass out the accompanying Excel Instruction Sheet handout so that when students begin their analysis, they will have a guide as to how to approach it. This sheet might also help them develop their plan.
Reflection and Assessment
6. At the end of the planning period, use a quick, classlevel formative assessment technique like thumbsup / thumbsdown to get a sense of whether or not students are prepared to shift into data analysis. Students show a thumbsup if they are ready, thumbssideways if they are almost ready or just have a small question or two, or thumbsdown if they are having trouble with their plan. Check in first with the thumbsdown groups to assess where they are at and provide more guidance as needed.
Quickly review student teams’ data analysis plans to make sure they make sense. If students appear to have struggled with their plans, at this point you might choose to select and assign a basic analysis approach from the Excel Instruction Sheet and model that for students. As will be explained in Lesson 3, there will also be some options for differentiation.
Handouts, Slides, and Other Printables:
Lesson 2: PowerPoint Handouts:
Lesson 2 Reading: Water Quality Indicators Excel Instruction Sheet Data analysis plan template
Students will implement their data analysis plan and use different Excel operations to look for relationships between precipitation levels and water quality indicators. Learning Objective: Students will identify and describe relationships between precipitation levels and water quality indicators through data analysis, and they will develop tentative claims based upon these analyses.
Key Concepts
Water quality Precipitation Daily Discharge (Q) Suspended Solid (SS) Total Phosphorus Load (TP) Soluble Reactive Phosphorus Load (SRP) Nitrate + Nitrite Load (NO) Total Kjeldahl Nitrogen Load (TKN) Average Biomass (Algal Biomass)
Excel databases (There are four different versions of the data spreadsheet explained below). Computers Students will also need the Excel Instruction Sheet from Lesson 2, as well as the Data Analysis Template.
This lesson uses a fairly large data set in an Excel spreadsheet. The data cover 12 years, and include precipitation and water quality indicators for every day across those years, and some data already organized at the annual level. These are a lot of data, so there are some options as to how you present them. As noted above, there are four different versions of the data spreadsheet, titled as follows:
Water Quality Data_No coding. Water Quality Data_Top% Water Quality Data by Year_Spring and Summer Water Quality Data_Heavy Rain Days_Table included
It is not necessary to provide all versions, but certainly an option. These different files all contain the same data, but some are organized differently and/or have some of the work already done for students. The different files provide a way to differentiate as needed.
The base version with no work done is Water Quality Data_No coding. This is the most complex version that demands the highest level of analysis.
Water Quality Data_Top% already has the top 10% values for each variable identified and highlighted in red (or pink).
Using this file will allow students to more quickly focus in on patterns, but also does some of the work for them so there is less rigor.
Water Quality Data by Year_Spring and Summer has a separate sheet created for the Spring/Summer months of each year, and has
averages already calculated at the bottom of each column. This file is really just sorted differently, but less analysis is done. Students can more quickly make yearly/seasonal comparisons
by quickly calculating and charting annual averages for different variables.
Water Quality Data_Heavy Rain Days_Table has identified the days with more than 23 mm of rain, and then an added sheet with data tables that show the averages for water quality indicators on these high precipitation days in comparison to all the other days, and an added table with high precipitation days plus the three days that come after them.
This dataset already has some analysis done as well, and allows students to quickly focus in on days with heavy precipitation. The ideal way to implement this lesson is to give students the basic data sheet with no work done, but it may be necessary because of time or differentiation needs to provide more supports to students and give them versions of the data set with analysis already done. If this is the case, be sure to note that some of the instructions in the Excel Instruction Sheet might not be necessary as the some of the work is already done. For example, if you provide students with the dataset with the top 10% values already shaded, they don’t need to use the Excel operation
17
to identify the top 10%, and you should be clear about this with them. Whichever data file you use, please explain it to students and walk them through what is contained there and how it is organized. Notes on data analysis: One way to look through this large data set is to look at average precipitation during each month and trace this precipitation with the water quality metrics for those same months or the months following. This would also allow for students to trace seasonal patterns; in other words does it seem that the water quality indicators are higher [i.e., indicating high levels of total phosphorous or other negative water quality features] during certain seasons or months across these years?
In the dataset with the top 10% already coded, on the tab labeled “Yearly Data” there are averages for each month’s precipitation and the other water quality measures. The data was averaged using excel formulas and was also highlighted to indicate the top 10% of these averages across the yearly data. These are highlighted in RED.
It is important to note that averages can mask variation and variability in these data. There are periods of significant weather that are lost in the averages. However, patterns do emerge to show the relationship of precipitation and water quality indicators during certain months across years. Because averages mask variability, we would recommend that students couple the monthly averages with the daily data to seek additional explanations and patterns among the water quality indicators and precipitation.
Students could also create their own yearly averages for the water quality metrics to display data or provide graphs to supplement explanations. To create averages, students could look at the formulas on the “Yearly Data” tab: (FORMULA: =average, and then highlight the appropriate cells). “Average” is a formula provided by excel and can be used on any total number of cells and will be summed and divided by that total.
Yearly bloom and yearly precipitation is also provided on the “Yearly Data” sheet and could also be used to provide explanations about these relationships. “Annual bloom” is a measurement of a certain type of algae in the water and show the extent of harmful algae blooms that are connected to high phosphorous levels in the water. Be prepared to direct the attention of student groups to these data to prompt their thinking and get the asking questions. Explain as needed to develop their thinking.
18
Lesson Sequence: Starter
1. This lesson is a direct carry over from Lesson 2. Students should begin the lesson in their data analysis groups. Ask each group to quickly review the predictions they made in Lesson 2 about how changes in precipitation might affect water quality indicators. Ask each group to share a prediction about one variable in relation to precipitation.
Direct the groups to review their data analysis plans and make sure that each group actually has their plan on hand. Explain to the students that they are going explore the data in Excel and use different methods of organizing and analyzing the data to look for patterns and relationships.
Direct Instruction
2. Explain to the students that they will need to keep track of their thinking, procedures, and observations in a Data Analysis Template. . Pass out the template and review the format with them. Reemphasize that they are looking for patterns in the data, and that by the end of the lesson, they should have found some sort of pattern of relationships between heavy precipitation and water quality indicators.
Review the following information with students as well (you might want to project these instructions, or even revisit the slides from Lesson 2 that showed how to approach data analysis):
Student “Tips” for Data Analysis: The “Yearly Data” tab provides you monthly averages to investigate patterns of the precipitation and water quality metrics. The top 10% of these averages are highlighted in red. You can create your own averages using formulas in excel if you want to manipulate and interpret the data further. Some questions you could consider include: 1. What are monthly or seasonal patterns that you notice? 2. How do extreme daily weather events affect the water quality metrics? 3. What is the explanation for the largest amount of algae bloom in 2011?
Make sure that students have their Excel Instruction Sheet as well, and review this as needed. Also as needed, model the procedure you will use to give students access to the Excel database (how they will actually get and open the Excel file). Explain to students that as they work, they need to look for patterns and then think about how they can represent these patterns when they find them. In other words, they will need to capture and represent these relationships in summary tables, graphs, diagrams, etc.
Emphasize the importance of keeping track of the procedures they use, the patterns they notice, and the conclusions they reach. They can also begin to create basic tables, graphs, etc. as they work if they have some experience with Excel.
Independent practice / guided inquiry
3. Direct students to begin their data analysis using the provided template. Move from group to group, supporting their work as needed. You may find it helpful to assign different roles in your groups, such as timekeeper, process recorder, Excel guide, data organizer etc. Remind them to use the ideas in the Excel Instruction Sheet as needed. Be sure they are keeping track of their thinking, procedures, and conclusions on the template.
Reflection and Assessment
4. Monitor students’ progress in their groups. When students have identified clear patterns and had some time to think about how these patterns show up in the data, you can choose to move towards the next lesson. There is a TON of data in this unit, and students will not have time to analyze it all. The goal here is to give them structured time working directly with data, and they need enough time to see clear patterns, but they do not need to complete full analyses.
When they have clearly identified some patterns or relationships, direct students to complete the final task on their Data Analysis Template. They are to develop a databased claim about the relationship between precipitation and water quality. Move among the groups to make sure that each group is on track and has a clear claim. As needed, explain to groups that a claim can be thought of as the conclusion they are making in answer to their research question (which is on their Data Analysis Template) and that is supported by their data analysis..
Handouts, Slides, and Other Printables:
Excel Instruction Sheet from Lesson 2 Data Analysis Template
Representing data to support a claim: How precipitation influences water quality
Overview and Objective:
Students will review their data analysis, refine their claim, and then develop a data representation model that supports their claim using a basic Claims, Evidence, and Reasoning template. Students will then view and discuss the work of other groups. Learning Objective: Working in groups, students will develop a data representation that supports the claim they developed in Lesson 3, and they will explain how this data representation supports their claim.
Key Concepts:
Modeling Data representation Repeat of concepts from Lesson 3
Introduction to Modeling Data Representation Samples
Students will need: Their completed Data Analysis Template Computers with access to the data set in Excel Whiteboards, chart paper, or computers with PowerPoint
http://www.hws.edu/about/green/pdf/hoering.pdf (the above is an academic article that shows similar types of data representations) https://www.southalabama.edu/geography/fearn/480page/2011/11Walsh.pdf (p. 5 has an interesting model of data representation)
Teacher Preparation and Notes:
In this lesson, students will be finalizing their claims and then generating an initial data representation that supports the claim. They may need access to the computers to review their data, and they will definitely need their analysis templates from lesson 3. They will also need small whiteboards, or chart paper, or even computers with PowerPoint or some other program so that they can develop their data representations in the CER framework. There is a PowerPoint for this lesson to help students think about what it means to represent data, so you will also need access to a projector and screen again.
Lesson Sequence: Starter
1. Begin the lesson by projecting the Lesson 4 PowerPoint.
a. Slide 2: Show students slide 2 and have a student volunteer read the data descriptions on the slide. Have students quickly Turn and Talk in response to the questions at the top of the slide. How might they show some of these patterns or relationships with tables, chart, graphs, etc.?
b. Slide 3: Tell students that part of the work scientists do includes pursuing a research question, analyzing data, identifying
patterns, and beginning to make claims. Explain then that scientists must also consider how to be represent and explain the relationships they are identifying among variables. Developing representations that highlight patterns and relationships and developing clear explanations of phenomena are important for clearly and effectively communicating your findings to others.
Next tell students that the kinds of models or representations scientists and science educators use vary widely. These include things like physical models, statistical models, diagrams, and other graphs or graphic representations. At this point, you could pause and allow students a few minutes to Turn and Talk with their research teams to brainstorm initial ideas of ways they could potentially represent some of the patterns they’ve been identifying in the data that they have been analyzing in previous lessons.
For example, can they think of ways they might use the examples on the slide or are they other options for representing the data that they think might be useful?
c. Slide 4: Slide 4 shows five different examples of ways that scientists might represent or model relationships or patterns in
scientific data. Each of the examples included represents data related to climate change (some of these graphics will be familiar to students as they were included in a Lesson 1 Reading). A few questions you may use to guide discussion include: i. Broadly, why might scientists choose a particular way to represent data (e.g. a table versus a graph versus a diagram)? ii. For each representation, or a subset of the representations:
1. What does this representation or model communicate? What patterns or relationships can you identify from this representation?
2. Why do you think the creator of this representation chose to present their data in this way? What are the benefits? 3. Is there another way this data could be represented?
Tell students that as they conclude their data analysis, they will need to consider the advantages of different ways of representing their data in order to communicate the patterns and relationships they have identified most clearly and effectively.
d. Slide 5: Tell students that in addition to developing models or representations of their data, they are also working toward
analyzing and interpreting their data to develop an explanation of the phenomena they are investigating. In order to explain the patterns and relationships they have identified, they will need to develop a claim, identify evidence to support their claim, and then connect their evidence to their claim through reasoning that shows why or how their data counts as evidence. Use the information on the slide to review what claims, evidence, and reasoning are.
e. Slide 6: Finally, introduce students to the template they will use for their poster presentation, which includes recording their
research question at the top, writing their claim, providing a representation of their data and describing their evidence that supports the claim, and then finally concluding their explanation by providing reasoning that connects their evidence to their claim by showing how their data counts as evidence.
Direct Instruction
1. To reinforce and expand upon some of the ideas introduced in the Lesson 4 PowerPoint, have students proceed through the Lesson 4 Introduction to Modeling reading. This short text can be read by students in pairs or individually, however, students reading individually should still work with a partner to respond to the embedded Turn and Talk questions.
You can circulate, confer, and provide more direct support to any students who might need it. For students who may benefit from a more guided approach, you could have students work in pairs on each chunk leading up to each Turn and Talk prompt, and then check in with them after the chunk, asking students to share their responses. After reading, go back through each chunk with the students and have different students quickly share their responses. This provides a quick formative assessment of their understanding of the text. This also enables you to clarify any points of confusion by asking probing questions and directing students back to the text as needed.
If you are pressed for time, or if your students are already familiar with the concept of modeling, you might choose to skip this reading. However, these concepts are very important in the practice of science, so they are worth exploring with students.
2. After everyone finishes reading and debriefing the text, tell students that they will continue the data analysis and interpretation work they began in Lessons 2 and 3. The goal for Lesson 4, however, is for students to begin trying to narrow their focus and describe a clear relationship between variables. Then, students will work towards making a claim about the relationship between precipitation and at least 23 other variables they investigated, identify data that they can use as evidence to support their claim, develop a data representation that illustrates the relationships or patterns they identified, and then provide reasoning that connects the evidence to their claim and shows why and how the data supports their claim. Finally, students will extend their claim to make conjectures about the relationship between climate change and water quality. Some students may find it beneficial to revisit the Lesson 1 climate change readings to support their conjectures.
3. At this point, explain to students that scientists use language in different ways to show how certain they are about different relationships.
Show the students slide 7 from the PowerPoint. Read through the information on the slide and have students Turn and Talk about the differences between the three examples. Explain that they need to be careful how they use language when they make claims, and that they should word their claims to match what they are seeing in the data and to match their level of certainty about their conclusions.
Independent practice / guided inquiry
4. On whiteboards, chart paper, or on a PowerPoint slide, students will begin preparing their poster presentation using the template in the Lesson 4 PowerPoint. If students did not take notes about ClaimEvidenceReasoning (CER) or what was included in the template, you could provide handouts of the PowerPoints slides, or keep them projected as students plan their poster presentation. In their research groups, students should copy the template from Slide 6 onto the whiteboard, chart paper, or PowerPoint template, go back into the Excel data set as needed to develop their data representation, as well as record their research question, develop a clear claim, and their final explanation/reasoning. Emphasize that the data representation that students develop should support their claim and that the reasoning they include should describe how and why this data serves as evidence for their claim. Show students Slide 7 and review the examples with them to help them understand how they might use language in different ways to state their claims. Then show them Slide 8 to provide an example of what their poster or whiteboard might look like. Call their attention the types of words used and the ways that certainty is or is not expressed.
5. Now direct students to work in their research teams to prepare their poster presentations. Circulate, confer, and provide more direct
support to any students or teams of students who might need it.
6. As students complete their posters, ask them to generate a list of remaining questions. These could include: a. Questions that arise from their data analysis, such as unexpected findings, outliers, or unclear relationships b. Questions about the nature of relationships between variables c. Questions about how to clarify or refine their model, data representation, or explanation
d. Questions that could be potentially be investigated by gathering and analyzing more data (e.g. questions for future research)
Reflection and Assessment
7. To conclude Lesson 4, have students deliver a brief presentation explaining the connection between their data and the claim. As data analysis teams present, you can use the See Think Wonder routine to support the audience to provide feedback to presenters. For instance, as the audience listens to the presentation and views the poster, the audience could jot notes related to the following questions about each presentation: (1) What do you see/notice (about the claim, data representation, evidence, reasoning, and the relationships among the components)? (2) What do you think about that? (3) What does it make you wonder? What questions do you have for the presenters?
An alternative or additional way you could have students provide feedback on the content of other teams’ poster presentations, is to have students engage in a Gallery Walk, where each poster (on whiteboards, chart paper, or computer screens) are placed around the room and each group rotates and provides feedback as they read and evaluate each poster. For instance, students could still use the See Think Wonder routine to guide their feedback, but for the gallery walk they could provide their noticings, evaluations, and questions on postit notes that they could stick to the wall beside the posters or on the table beside the computer (if the poster is digital). If you have the instructional time, another option is to engage students in a gallery walk first, allow teams to rotate through a few of the posters (approximately 5 per poster) and provide feedback. Then give data analysis teams an opportunity to read the feedback and incorporate any suggestions or clarify any questions that they choose. Finally, after teams have the opportunity to respond to feedback and make revisions as they see fit, students could deliver their brief oral presentations to the whole class.
Handouts, Slides, and Other Printables:
Lesson 4 PowerPoint Introduction to Modeling (reading) Data Representation Samples
Eutrophication and algal blooms: Why too many nutrients can be a bad thing
Overview and Objective: (what skills and activities are addressed in this lesson one sentence)
In this lesson, students will move towards making predictions and conjectures about the significance of the findings from their data analysis, and they will then learn about eutrophication and algal blooms through direct instruction and reading activities. Overall, they will be challenged to think across texts and lessons to generate conclusions and synthesize information from the lab and class readings to create a visual model that connects climate change to algal blooms and explains why this is a problem worth trying to solve. Learning Objective: Students will be able to explain and represent how severe weather events like rainstorms can have a negative impact on water quality and contribute to problems such as eutrophication and excessive algal blooms.
Key Concepts:
Nutrients Nutrient loading Eutrophication Point source Non point source
Lesson 5: Eutrophication and algal blooms, PowerPoint Lesson 5 Reading: Eutrophication Overview… Nutrients in the water Handout: Climate change and water quality relationships: Developing an Infographic Computer, projector, and screen Internet access
Supplementary Resources:
Additional lesson plans from other sources: http://new.coolclassroom.org/files/adventures/1/Eutrophication_Teacher.pdf
This lesson will ask students to reflect on the findings from their data analysis, so students should have access to their data presentations. In addition, the lesson has a PowerPoint, so a computer and projector is needed. Students will also need markers and large sheets of newsprint or chart paper. The lesson can be shortened if needed in a variety of ways. Options include using the reading without the video, or vice versa, or assigning the final product as individual homework, or as group work to be done as homework online through a site like padlet.com. Teachers will have to consider their own schedule and resources to make this decision. We strongly recommend keeping the reading however, as students can be asked to watch the video for homework with less support needed as compared to the reading. Students will do some work in their data analysis groups, so it makes sense to have them start the lesson sitting in their groups. The final project for the unit is an infographic. Teachers will have different options with respect to how this project is carried out. If time is available, students can work on these in class in small groups. If not, it can be assigned as an individual, outofschool project, although this has some clear drawbacks as students might need more support. Another timesaving option is to have students complete the planning sheet for the infographic without actually developing the final product. Issues of time and scheduling will drive these decisions.
Lesson Sequence: Set purpose, explain vocabulary
1. Begin the lesson with the PowerPoint for Lesson 5, sharing the title slide with students and then moving to slide #2. Ask students to engage in the Stop and Jot as directed on the slide. This opening is meant to engage students of all levels with an open ended question to get them thinking. After students have jotted down some ideas (no more than a minute or two) ask them to Turn and Talk with a partner to share their thinking. Keep this very focused and short. Give students no more than 6090 seconds. Next ask a few students to share an idea from their conversations. Explain to the students that this lesson will take up this question with respect to levels of nutrients like phosphates and nitrates in bodies of water like Lake Erie, and will help them understand why the results of their data analysis are important and have clear connections to real world problems.
2. If students are not already seated with their data analysis groups, ask them to move and sit with their group members. Advance to slide
#3 in the PowerPoint. Ask each group to quickly review their findings from the data analysis as a refresher, and after two or three
minutes, call on two or three groups to again share the big picture of their findings. Then, as suggested on the slide, check in with the class by asking for specific information about what substances increased in the water after periods of heavy rainfall. Students should, at least, identify phosphates and nitrates. Next have students engage with the Table Talk questions on the slide and make a prediction about possible impacts of more phosphates and nitrates in the water. After a few minutes, call on groups who haven’t already spoken to share their thinking. Ask if other groups have very different predictions. Summarize their predictions and find a way to record them, such as by writing them on the board and taking a picture, or just creating a document that you save. You will revisit this later.
3. Explain to the students that they are going to do a reading now that will help them evaluate and refine the thinking they put into their
predictions. Pass out the Lesson 5 Reading: Eutrophication Overview. Have students look at the title of the handout and introduce them to the term eutrophication. Ask students to read the definitions on page 1 and then write their own explanation in the provided text box on the handout. (If you use interactive notebooks in your class, you might have the definitions on the left side and the student explanation on the right side.) This task can also be undertaken by students working in pairs or in small groups, working together to construct joint explanations. When they have completed their work, call on new students to share their explanations. Push their thinking as needed with open ended prompts such as, “Can you elaborate on what you mean by….”. If time allows, have students then help you create a class version of the explanation on your board or screen, using elements from different groups. Record this version and have a student write it on chart paper and post it up, or find some other way to keep it posted in your space.
Direct Instruction and guided inquiry
4. With a basic definition of eutrophication in mind, have students proceed through the guided reading (pages 25). This version of the reading has built in chunking with short processing activities. Depending upon your class dynamics, there a few ways to approach student engagement with this task. If you have strong, independent readers, set them loose and have them work through chunks completing the processing activities as directed. As they do so, you can move around and provide more direct support to any students who might need it. Alternatively, you might use a more guided approach and have students work in pairs on each chunk, and then check in with them after the chunk, asking students to share their responses. In addition, if you have an accelerated class, you can use pages 68, which provide the same reading without the chunking and processing activities. Accelerated students can read the text and go right to the cause and effect chart at the end.
However you have students do the reading, be sure not to just collect it and assign points. The point of the chunking and processing is
to have students engage with the ideas in the text on a more thoughtful level. After reading, go back through each chunk with the students and have different students quickly share their responses. This provides a quick formative assessment of their understanding of the text. As they share, you can ask the class if others have very different responses. You can also clarify any points of confusion by asking probing questions and directing students back into the text as needed. If time allows, this would be a good time to show students one of the eutrophication animations listed in the supplementary resources. Ask them how the animation supports or extends their thinking and have a quick discussion about it. If possible, watch the animation more than once and explain to the students that it will help them complete their next task.
28
Independent practice
5. Now direct students to page 5 (or page 8 in the reading without scaffolds). Explain to them that they are going to work with a partner (or you may choose to assign this as individual work, or even to analysis groups) to create a cause and effect chart for eutrophication using information from the reading (and the animation if you used it). Show the students slide #4 and explain that they can use this style of cause and effect diagram. You may choose to allow students to create other types of cause and effect organizers, or you may prefer to limit them to this format. Students should be able to identify at least three clear causes and effects each from the reading and animation. Students can create these digitally using platforms like padlet.com or bubbl.us if you have access to computers and the internet, or they can do them on their own paper, or on large sheets of chart paper. If time allows, you might have students engage in a Gallery Walk using the Visible Thinking Routine of SeeThinkWonder. Students move to at least two other graphic organizers and jot down an observation, a connection or idea, and a question, about each. If you don’t have time for this, ask a few groups to share their graphic organizers, and use this as an opportunity to make sure that students understand the basic causes and effects of eutrophication.
Reflection and Assessment
6. At this point, inform students that their final assessment project for the unit will be an infographic that answers the essential questions of the unit:
How does climate change appear to be affecting the Lake Erie watershed?
In particular, what is the relationship between increasingly severe rain events and water quality on the Lake Erie watershed?
How can I explain and represent this relationship? Advance to slide #5, and explain to students that infographics are informational presentations that use data, images, and small amounts
of text to present stories, explanations, or arguments with claims and evidence. Review the questions on slide #5 and explain to the students that they will use the questions to study and discuss a few infographics. Take students through slides #69, skipping any that might be hard to read (or take hard to read ones out of the slides and to show in larger format). Use the questions below to take students through a basic analysis of each infographic.
For each infographic you are about to see, talk with a partner about the following questions and be ready to share your thinking:
1. What is the “story” being told? What is being explained? 2. What types of images are being used and how do they help tell the “story” or develop the explanation? 3. What type of data are included, if any? If there are data, how do they help tell the story or explain something? 4. How are the different parts of the infographic (images, data, printed information) organized?
Then advance to slide #10 and then to #11, have students help you read out loud the basics of a quality infographic. Next move to slide #12 to remind students of the essential questions for the unit. Pass out the handout “Climate change and water quality relationships: Developing an Infographic,” and go slide #13. Use the information on the slide, which is also on the handout, to review the basic requirements they will have to meet for their infographic.
As stated in the notes at the beginning of the lesson plan, teachers will have to choose how to organize and schedule this project. Choices include whether or not to dedicate class time to this project, or to assign it as an out of school project. Another option is to have students develop draft sections of the infographic without putting the time into creating a finished project… all options have costs and benefits, so teachers will have to choose the option that best suits their context. In any case, teachers should at least engage students in the planning process.
To help students understand the different requirements of the infographic, next review the rubric in the handout. Return to at least one of the slides with an infographic and have students use the rubrics to evaluate the infographic they see. Repeat this process with another infographic if helpful, asking students to discuss their evaluations with a partner, and then ask several pairs to share their ideas.
Next, have students look over the planning sheets on pages 35 of the handout. They are to complete this planning sheet before beginning to develop their infographic, or as their final product depending upon the time available. As best suits your context, assign students to do so individually or in small groups. Groups of 3 would be ideal if you decide to do groups.
To help the students get started and review core content they need to consider, think about using the following media resources. If you use them, show them once or twice and have students quickly jot down key ideas from each and then share their ideas with each other (Stop and Jot to a Turn and Talk). Begin each viewing by clearly telling students they are watching these to reinforce the knowledge they need to develop their infographics.
News clip from July 2015: The Big Problem With Lake Erie’s Big Algae Blooms http://www.newsy.com/videos/thebigproblemwithlakeeriesbigalgaeblooms/
This short video clip (1:57) describes the impacts of Lake Erie’s algae blooms and identifies agricultural runoff (fertilizer nitrogen and phosphorous) as contributing to ecosystem imbalance and decreased water quality.
NBC Learn video clip: Nutrient Loading in Lake Erie
https://www.youtube.com/watch?v=iLrfD225zaY This short video clip (5:10) presents a brief history of water quality in Lake Erie and recent National Science Foundation
studies of water quality related to nutrient loading, agricultural runoff, the influence of changes in precipitation patterns, and potential agricultural solutions.
Animation: Lake Eutrophication http://nroc.mpls.k12.mn.us/Environmental%20Science/course%20files/multimedia/lesson78/animations/5a_Lake_Eutrophication.html
You may alternatively choose to show these once students have a draft of their infographic, and then allow them to revise (students can’t copy, etc. but use this to clarify their thinking). If students do complete their infographics, you can use a procedure like SeeThinkWonder in a Gallery Walk format where students look at each other’s infographics and complete a SeeThinkWonder routine.
The infographics can be extended into action plans as to how to address the problems with water quality in the Lake Erie watershed, and they can be shared publicly though science fairs, teacher websites, bulletin boards, etc. Students might even invite local policy makers such as state legislators, members of county boards, or city council members, to visit and view their infographics and engage in discussion.
7. To fully complete the unit, return the results of the initial List Group Label activity and ask students to engage in the thinking routine, I used to think but now I think, to reflect on how their thinking changed over the course of the unit. This can be done as a short exit ticket or as a longer piece of reflective writing.
Handouts, Slides, and Other Printables:
Lesson 5 PowerPoint Climate change and water quality relationships: Developing an Infographic
Students have done a lot of data analysis and thinking. Their work can be extended easily into three different possible projects:
Claims / Evidence / Reasoning Writing: Provide an outline or flowchart, along with a clear rubric, and have students create an argumentative essay making a scientific prediction about continuing trends and using data and science concepts to support their predictive claim.
Science infographic: Students might more fully develop an infographic explaining the relationship between climate change and water
quality.
Multimedia presentation in a RAFT format (Role, Audience, Format, Topic) as if they are a scientist making public policy recommendations to state and local governments about why cultural eutrophication might become a worse problem because of climate change.
Field trip activities: Engage students in actual data collection. Revisit their CER boards and/or infographics after a field trip and
discuss how the experience of data collection extended their understanding. Ask them to consider how the data that they analyzed were gathered.
Interdisciplinary connections: If there is a Probability and Statistics course in your school, that teacher might create a lesson Z scores
with these data. Zscores are standardized values that allow data analysis across numbers that have different scales and units. There are many possible Social Studies connections as well, from discussing in Civics class the role of different levels of governments in addressing these problems to doing Economic analysis of the opportunity costs of fertilizer use.
This unit was developed by Darin Stockdill and Miranda Fitzgerald with contributions from Bridget Maher. Curriculum development was funded and lead by the the University of Michigan College of Engineering and their Center for Engineering Outreach and Engagement. Funding provided through: