Universität Kassel Fachgebiet Wasserbau und Wasserwirtschaft Univ.-Prof. Dr.-Ing. Stephan Theobald „Climate change“ – case study „Hydromorphology“ Project meeting 19.-21. September 2011 in Bari
Transcript
Universität KasselFachgebiet Wasserbau und WasserwirtschaftUniv.-Prof. Dr.-Ing. Stephan Theobald
„Climate change“ – case study „Hydromorphology“Project meeting 19.-21. September 2011 in Bari
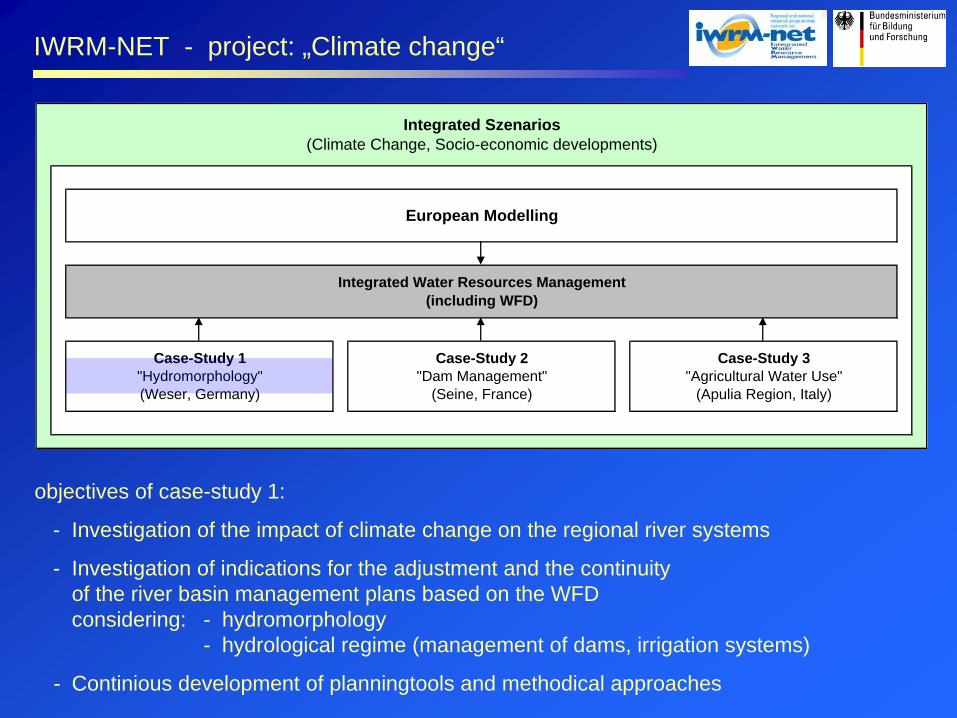
Integrated Water Resources Management(including WFD)
Case-Study 3"Agricultural Water Use"
(Apulia Region, Italy)
Case-Study 2"Dam Management"
(Seine, France)
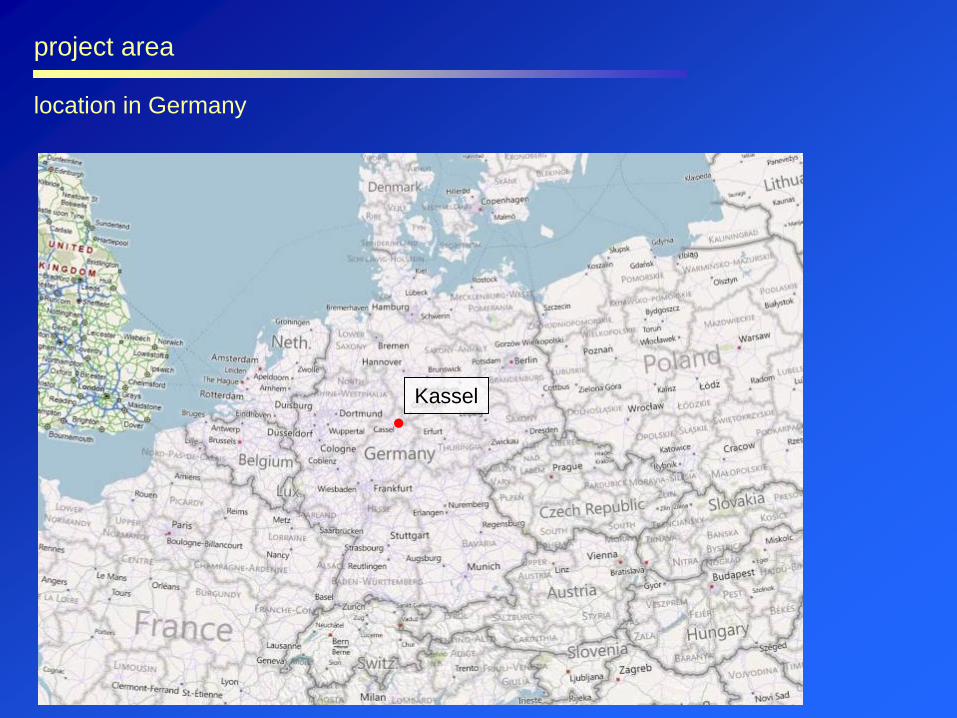
Case-Study 1"Hydromorphology"(Weser, Germany)
IWRM-NET - project: „Climate change“
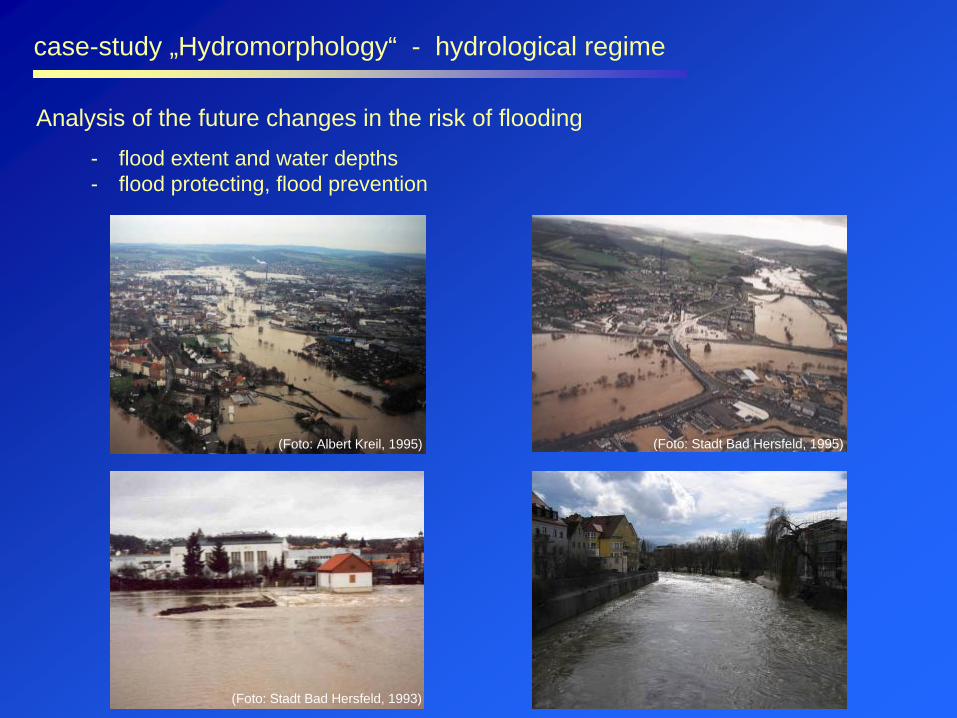
objectives of case-study 1:
- Investigation of the impact of climate change on the regional river systems
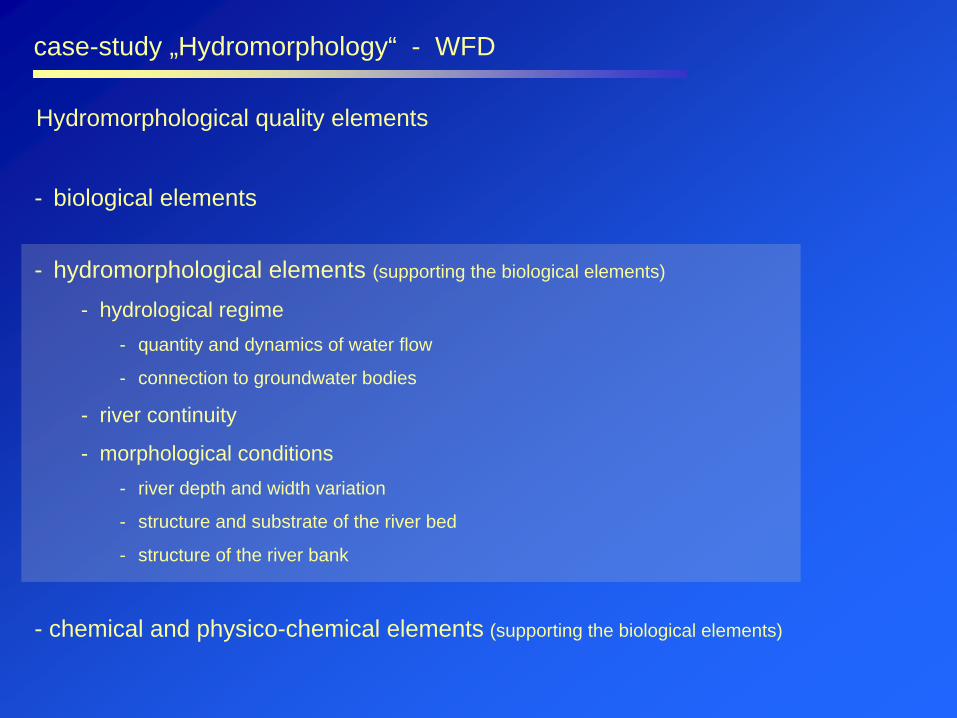
- Investigation of indications for the adjustment and the continuity of the river basin management plans based on the WFD considering: - hydromorphology
- hydrological regime (management of dams, irrigation systems)
- Continious development of planningtools and methodical approaches
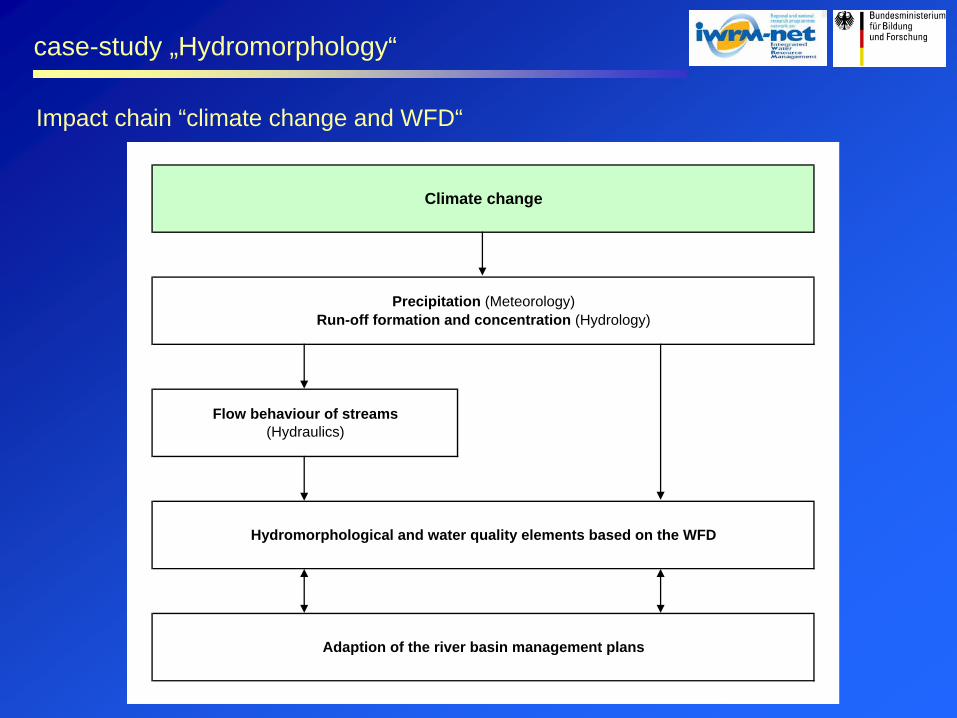
Precipitation (Meteorology)Run-off formation and concentration (Hydrology)
Flow behaviour of streams(Hydraulics)
Climate change
Hydromorphological and water quality elements based on the WFD
Adaption of the river basin management plans
Impact chain “climate change and WFD“
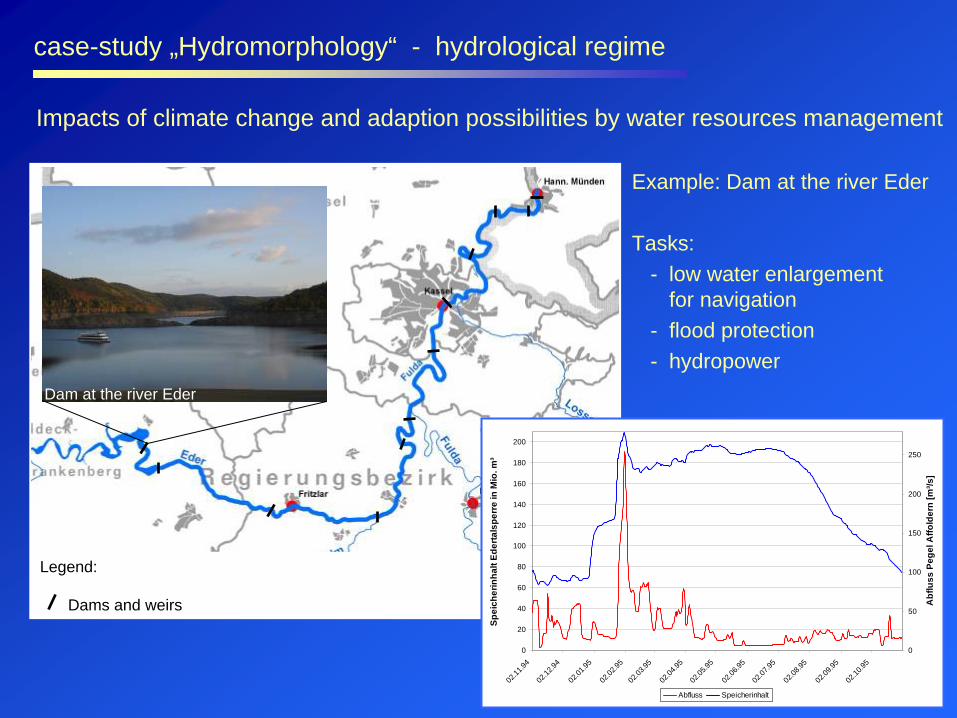
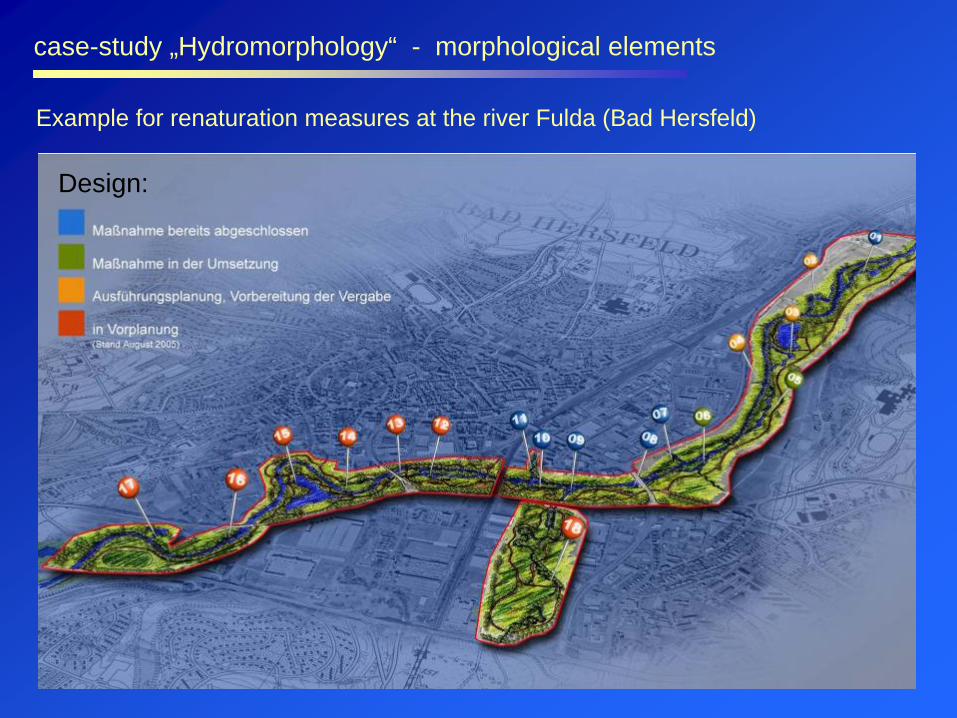
case-study „Hydromorphology“
Regional change of precipitation period 2021 - 2050, relative to period 1961 - 1990 – results of INKLIM 2012 (HLUG)
considered scenarios and models:- IPPC Emission Scenario A1B- global climate model - ECHAM 5, regional climate model - WETTREG
source:HLUG, 2008
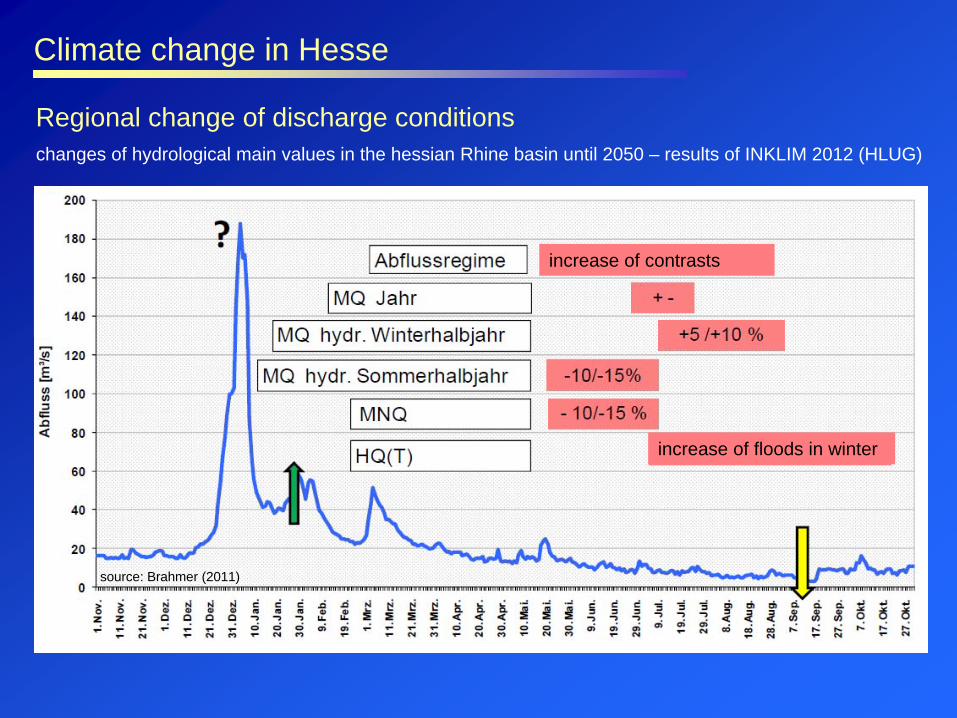
case-study „Hydromorphology“ - climate change in Hesse
Climate change in Hesse
Regional change of discharge conditionschanges of hydrological main values in the hessian Rhine basin until 2050 – results of INKLIM 2012 (HLUG)
increase of contrasts
increase of floods in winter
source: Brahmer (2011)
Climate change in Hesse
Regional change of discharge conditionschanges in frequency of occurrence of discharge until 2050: gauge Heldra / Werra (HLUG)
source: Brahmer (2011)
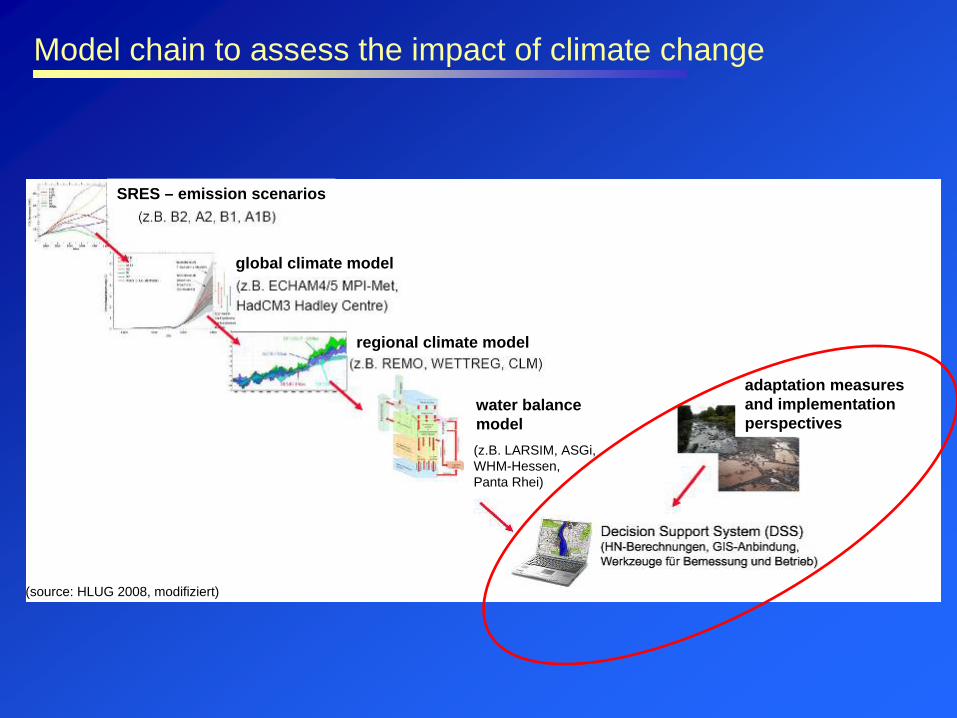
(source: HLUG 2008, modifiziert)
(z.B. LARSIM, ASGi, WHM-Hessen, Panta Rhei)
Model chain to assess the impact of climate change
SRES – emission scenarios
global climate model
regional climate model
water balancemodel
adaptation measures and implementation perspectives
01.09.2010 project start
01.11.2010 – 31.05.2011 analysis of the actual state
01.03.2011 – 31.08.2011 creation of a digital terrain model
01.09.2011 – 29.02.2012 creation of a 2D hydrodynamic-numerical model
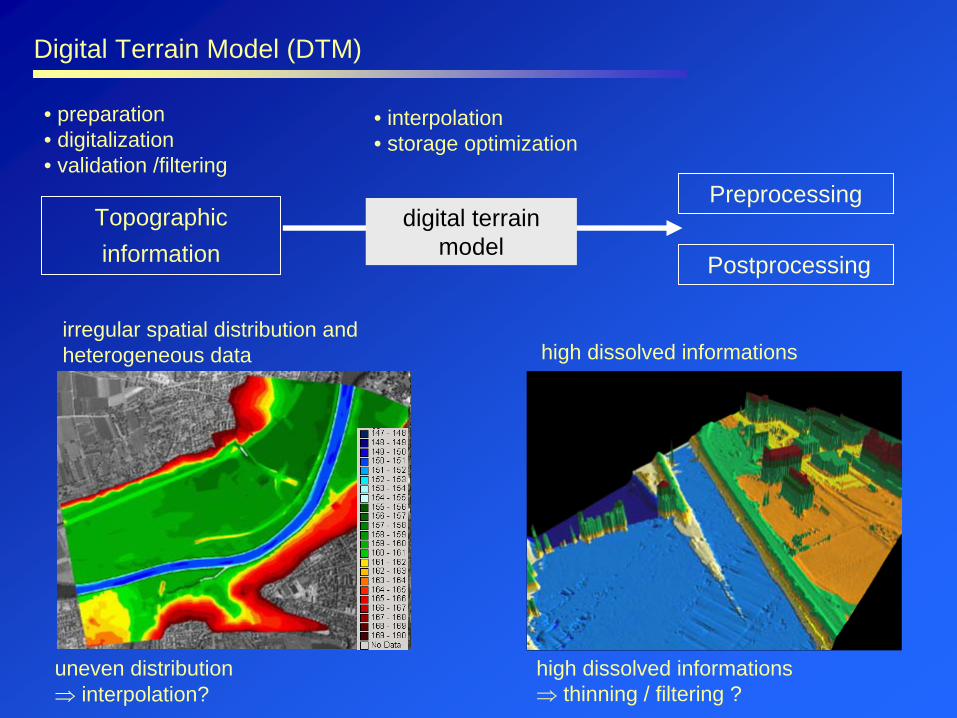
high dissolved informations thinning / filtering ?
high dissolved informationsirregular spatial distribution and heterogeneous data
Digital Terrain Model (DTM)
"cross section bridge"
150
152
154
156
158
160
162
164
166
1000 1050 1100 1150 1200 1250 1300
distance [m]
leve
l [m
üNN
]
not prepared cross section
implausible developing of the ground surface levelmanual checking of the cross sections
verification of cross-sections (input data)
Digital Terrain Model (DTM)
"cross section bridge"
150
152
154
156
158
160
162
164
166
1000 1050 1100 1150 1200 1250 1300
distance [m]
leve
l [m
üNN
]
ground level bottom of a bridge plate top of a bridge plate
verification of cross-sections (input data)
not prepared cross-sections distort the developing of the ground surface levelmanual checking of the cross sectionselimination of points with the elevation of strucutes
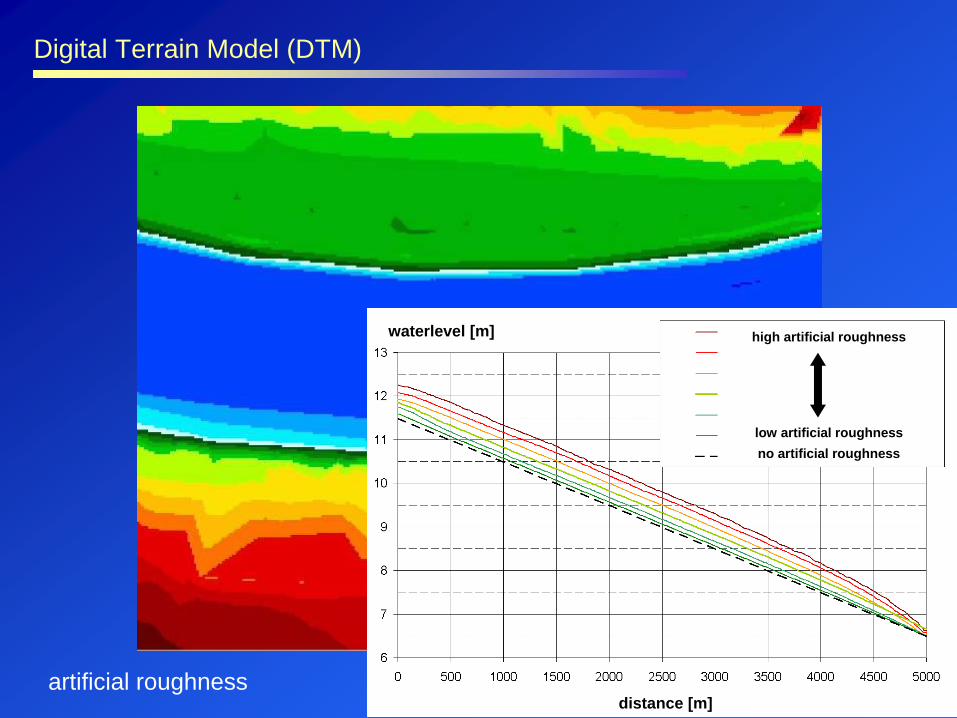
Digital Terrain Model (DTM)
artificial roughness
waterlevel [m]
distance [m]
high artificial roughness
low artificial roughnessno artificial roughness
Digital Terrain Model (DTM)
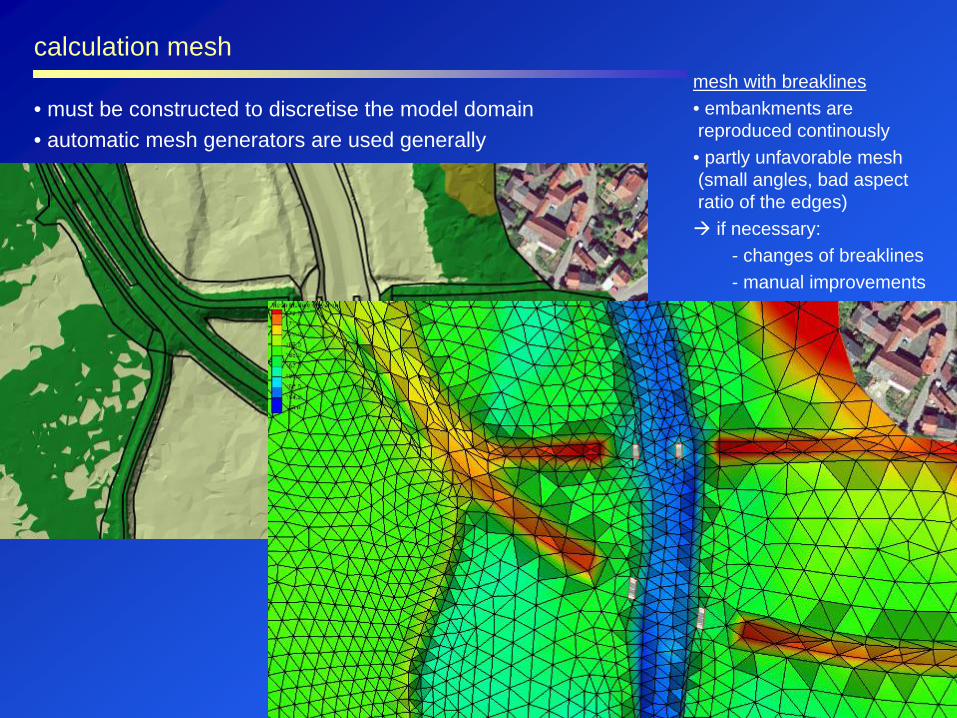
• must be constructed to discretise the model domain• automatic mesh generators are used generally
calculation mesh
mesh without breaklines• good structure of the mesh
(no small angles, good aspect ratio of the edges)
• embankments are not reproduced continously
• must be constructed to discretise the model domain• automatic mesh generators are used generally
mesh with breaklines• embankments are reproduced continously• partly unfavorable mesh (small angles, bad aspect ratio of the edges) if necessary:
- changes of breaklines- manual improvements
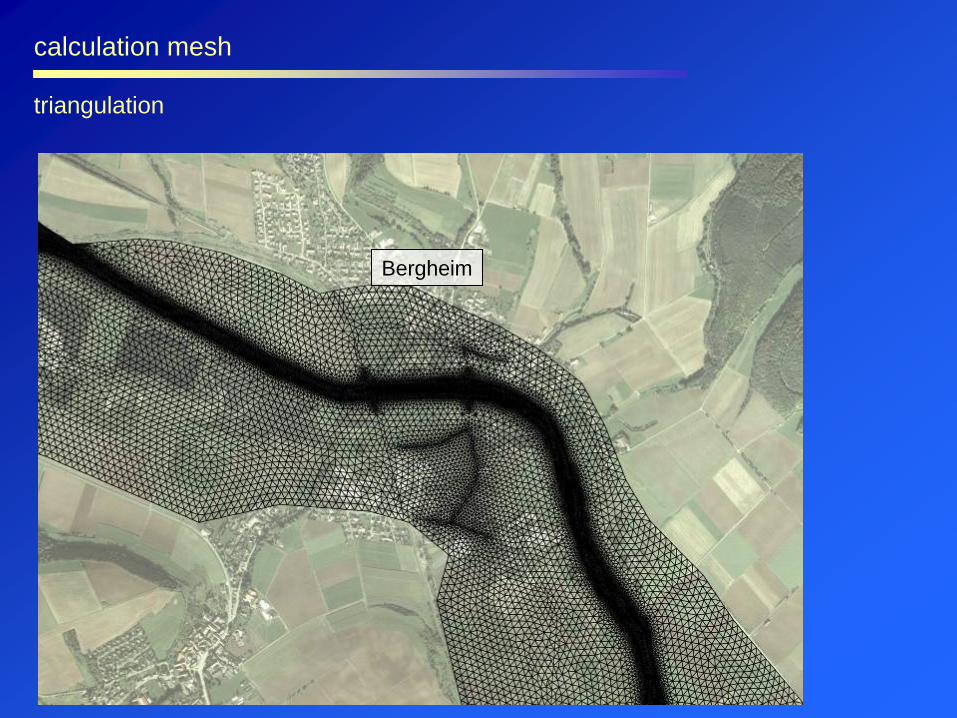
calculation mesh
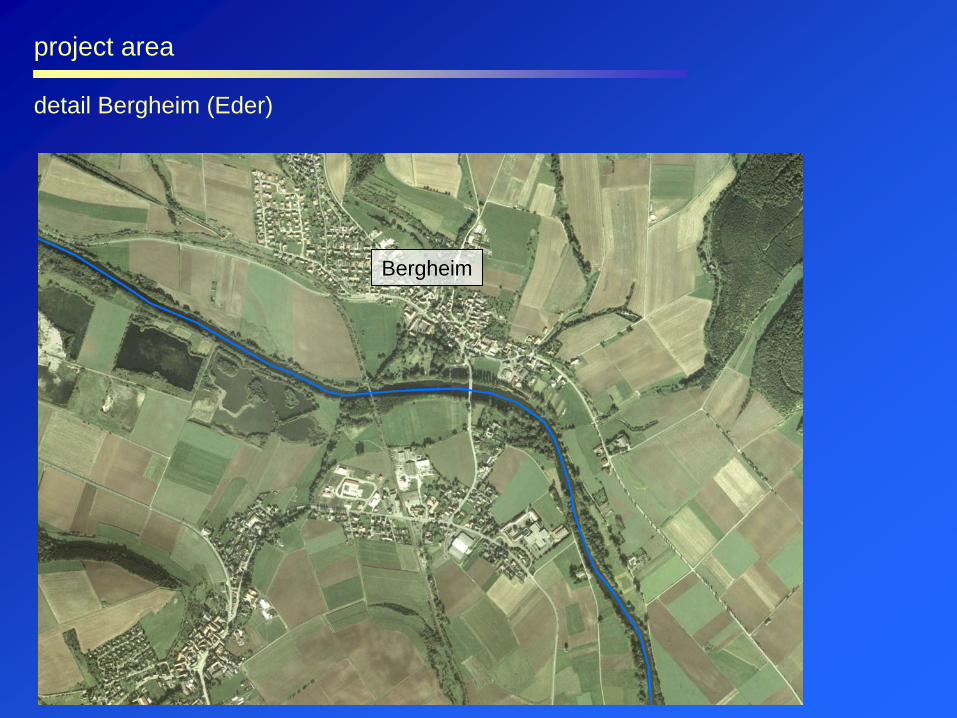
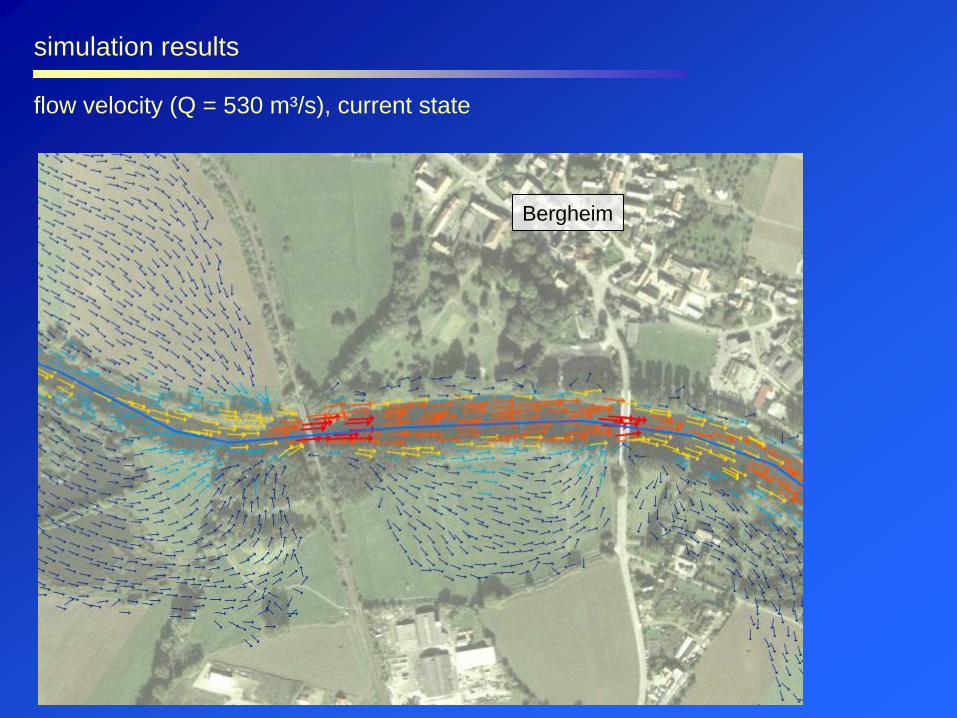
Bergheim
project area
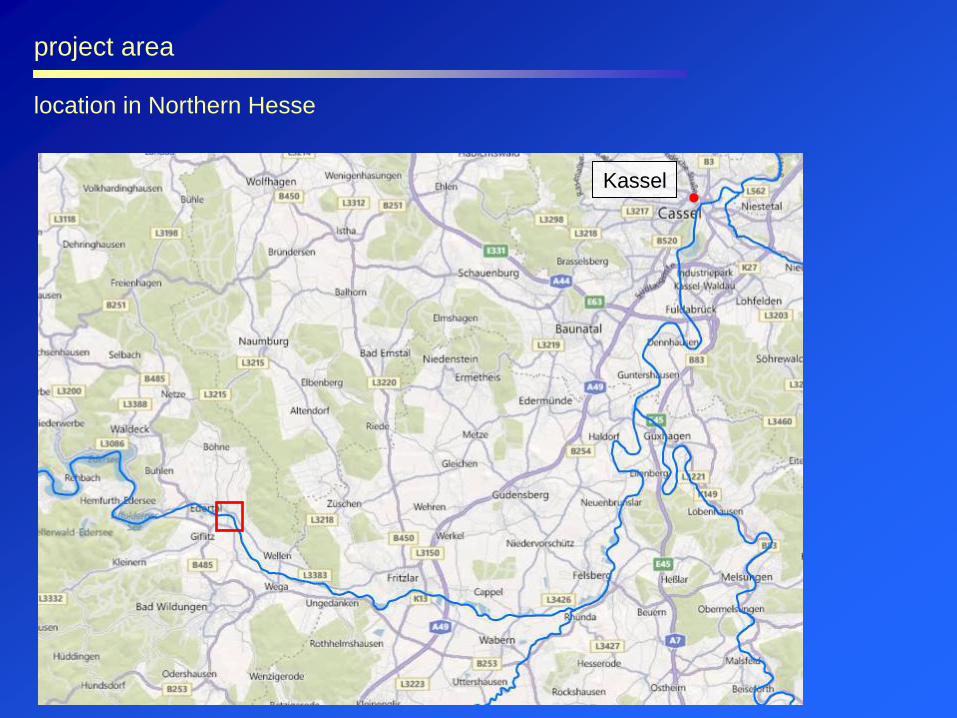
detail Bergheim (Eder)
Bergheim
Digital Terrain Model
input data
Bergheim
Digital Terrain Model
breaklines
Bergheim
calculation mesh
triangulation
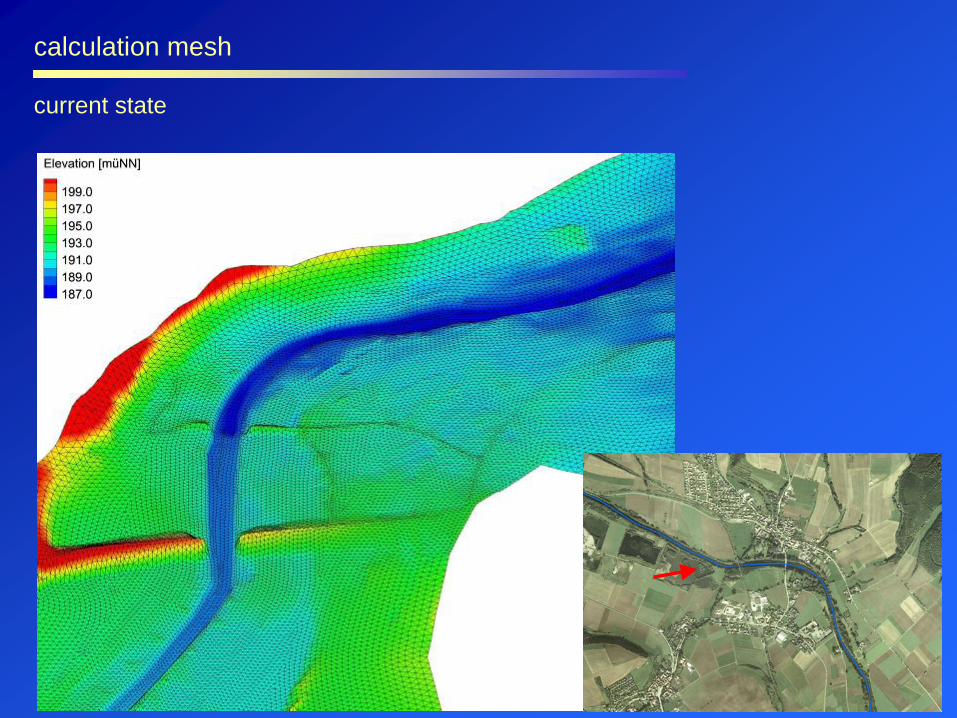
calculation mesh
current state
calculation mesh
current state
0y
hvx
huth
y
zhg
xh
yh
yh
2g
xuvh
yhv
tvh
x
zhg
yh
xh
xh
2g
yuvh
xhu
tuh
bybxyy22
bxbyxx22
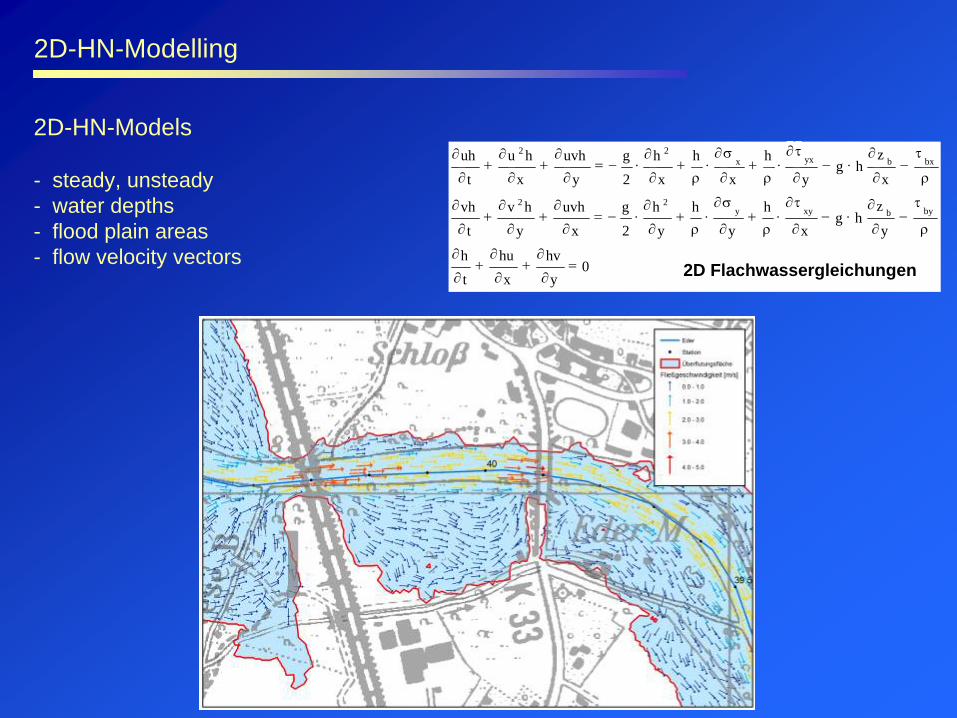
2D Flachwassergleichungen
2D-HN-Models
- steady, unsteady- water depths- flood plain areas - flow velocity vectors
- exemplary selected river sections (length 30 km)
- creation of a digital terrain model and an GIS-project
- creation of a hydrodynamic numerical model (2D) to analyze the hydraulic parameters (e. g. water levels, flow velocity, flood area and shear stresses)
- simulation of scenarios
(- hydrological regime) - optimizing of dam management
- link to the actual Klimzug-project possible
- Dissemination of results and knowledge transfer - exchange of knowledge with IWRM-net partners
- participation of practice partners and stakeholders
case-study „Hydromorphology“
Thank you for your attention!
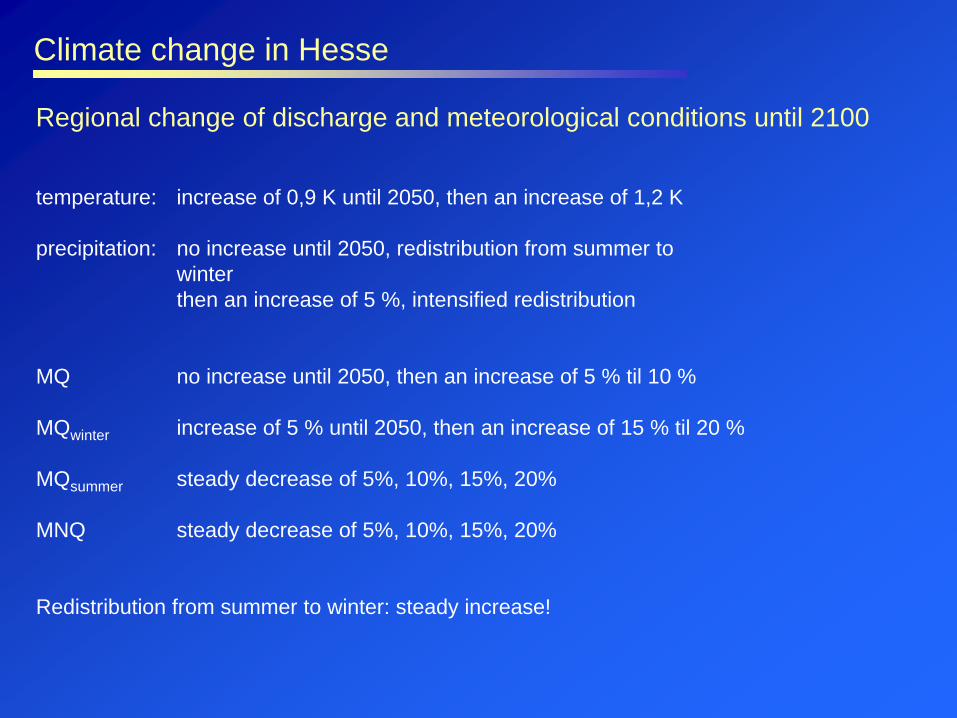
temperature: increase of 0,9 K until 2050, then an increase of 1,2 K
precipitation: no increase until 2050, redistribution from summer to winterthen an increase of 5 %, intensified redistribution
MQ no increase until 2050, then an increase of 5 % til 10 %
MQwinter increase of 5 % until 2050, then an increase of 15 % til 20 %
MQsummer steady decrease of 5%, 10%, 15%, 20%
MNQ steady decrease of 5%, 10%, 15%, 20%
Redistribution from summer to winter: steady increase!
Climate change in Hesse
Regional change of discharge and meteorological conditions until 2100
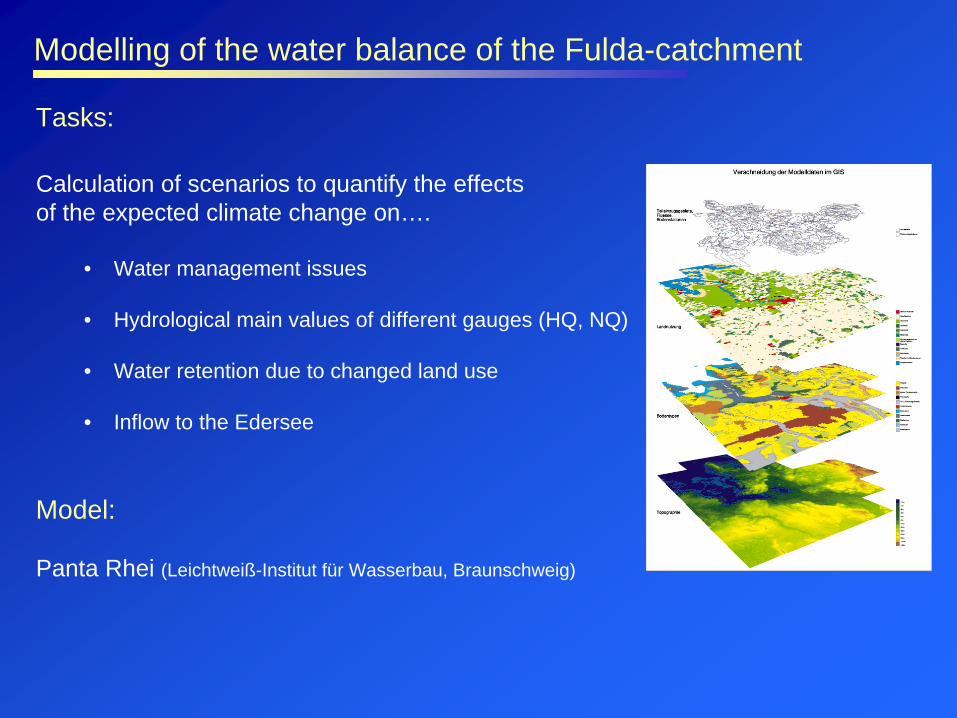
Modelling of the water balance of the Fulda-catchment
Tasks:
Calculation of scenarios to quantify the effectsof the expected climate change on….
• Water management issues
• Hydrological main values of different gauges (HQ, NQ)
• Water retention due to changed land use
• Inflow to the Edersee
Model:
Panta Rhei (Leichtweiß-Institut für Wasserbau, Braunschweig)
Modelling of the water balance of the Fulda-catchment
Fulda-catchment and model area of Panta Rhei
tasks• optimation of utilisation• minimisation of risk potential• detect and comprehend reasons and
interdependencies• development of planning aids and decision
supports
hydrologybasic data
hydraulic / hydraulic engineering• dimensioning of structures• parameters of flow
- waterlevel- velocity- shear stress- pressure
HN-model
production of electricity
shipping
Quebec 1996; source: Münchener Rückversicherung
flood
2D-HN-Modelling
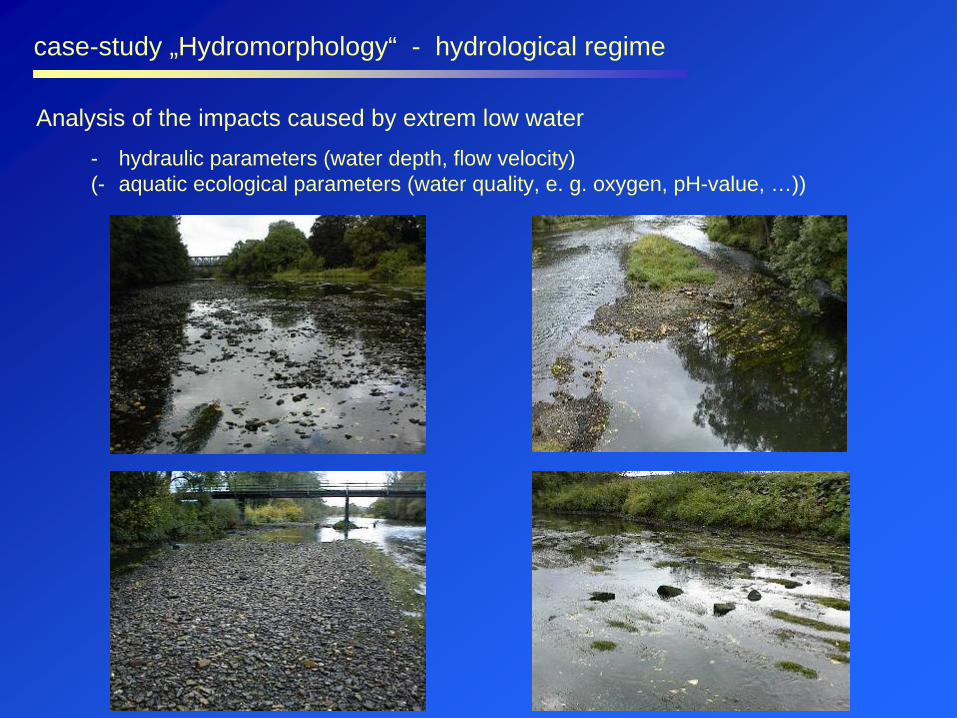
Analysis of the impacts caused by extrem low water- hydraulic parameters (water depth, flow velocity) (- aquatic ecological parameters (water quality, e. g. oxygen, pH-value, …))