26
Climate Change Impact Assessment on Indian Water Resources Ashvin Gosain, Sandhya Rao, Debajit Basu Ray
Climate Change Impact Assessment on Indian Water Resources
Ashvin Gosain, Sandhya Rao, Debajit Basu Ray

Objectives of the Study
• To quantify the impact of the climate change on the water resources of the country
• Identify Hotspots
• Identify Adaptation & Coping strategies

Data Used for Modeling• DEM: 1km grid, generated using contours
from 1:250000 topographic data
• Land use: 1:2M USGS
• Soil: 1:5M FAO
• Weather: Data generated by the “Hadley Centre for Climate Prediction” U.K. at a resolution of 0.44° X 0.44° latitude by longitude (HadRM2) from IITM, Pune
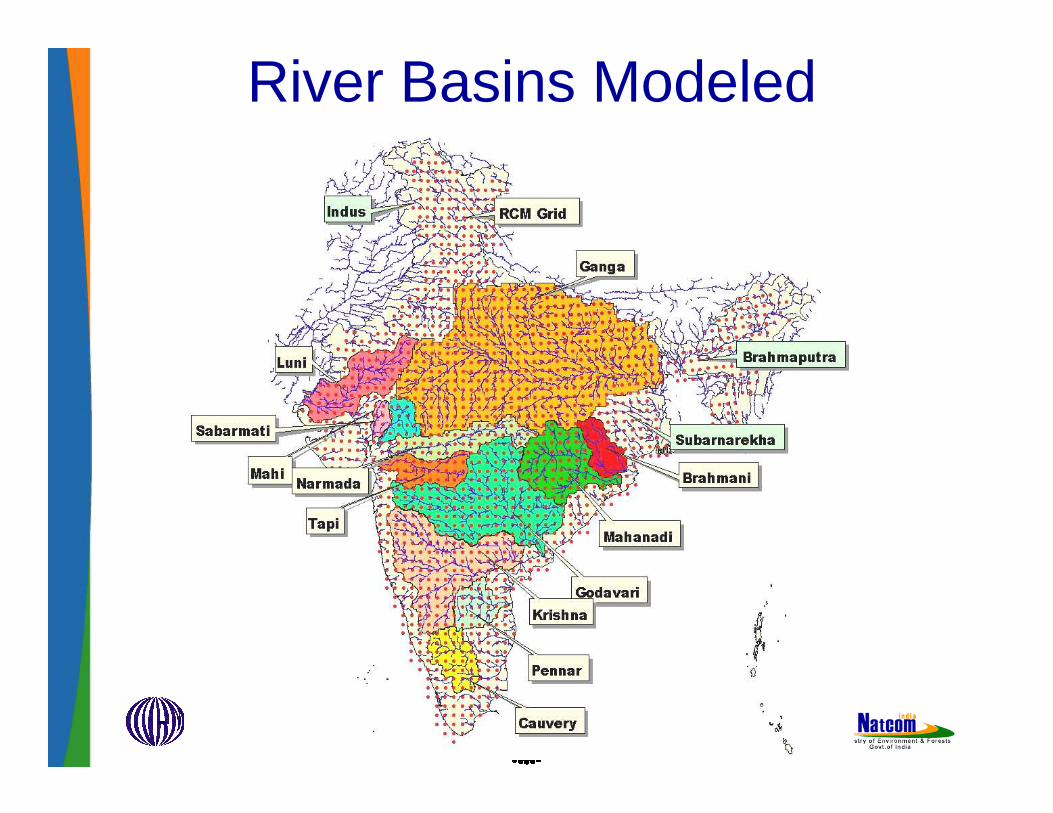
River Basins Modeled
Assumptions
• The land use has been assumed to remain same
• Water bodies including reservoirs could not be incorporated at this stage due to lack of data - capacities and the operation rules
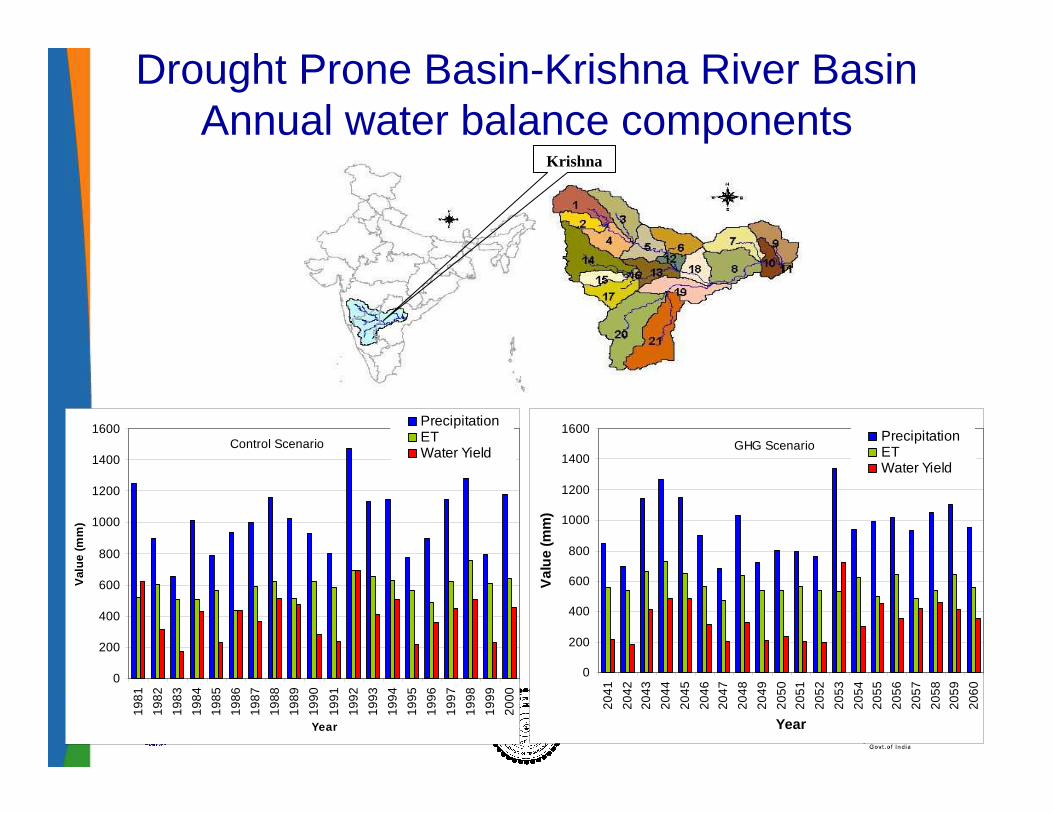
Drought Prone Basin-Krishna River Basin Annual water balance components
Krishna
0
200
400
600
800
1000
1200
1400
1600
1981
1982
1983
1984
1985
1986
1987
1988
1989
1990
1991
1992
1993
1994
1995
1996
1997
1998
1999
2000
Year
Val
ue
(mm
)
PrecipitationETWater Yield
Control Scenario
0
200
400
600
800
1000
1200
1400
1600
2041
2042
2043
2044
2045
2046
2047
2048
2049
2050
2051
2052
2053
2054
2055
2056
2057
2058
2059
2060
Year
Val
ue
(mm
)
PrecipitationETWater Yield
GHG Scenario

Monthly water balance components for Krishna river basin
0
50
100
150
200
250
300
Jan
Feb Mar
Apr
May Jun
Jul
Aug
Sep Oct
Nov
Dec
Year
Val
ue
(mm
)
PrecipitationETWater Yield
GHG Scenario
0
50
100
150
200
250
300
Jan
Feb Mar
Apr
May Jun
Jul
Aug
Sep Oct
Nov
Dec
Year
Val
ue
(mm
)
PrecipitationETWater Yield
Control Scenario

Change in Monthly water balance components for Krishna river basin
-100
-50
0
50
100
150
Jan
Feb Mar
Apr
May Jun
Jul
Aug
Sep Oct
Nov
Dec
YearV
alu
e (m
m)
PrecipitationETWater Yield
Change (%) in monthly water balance for Control and GHG climate scenarios
-50
-40
-30
-20
-10
0
10
20
30
Jan
Feb Mar
Apr
May
Jun
Jul
Aug
Sep Oct
Nov
Dec
Year
Val
ue
(mm
)
PrecipitationETWater Yield
Change in monthly water balance for Control and GHG climate
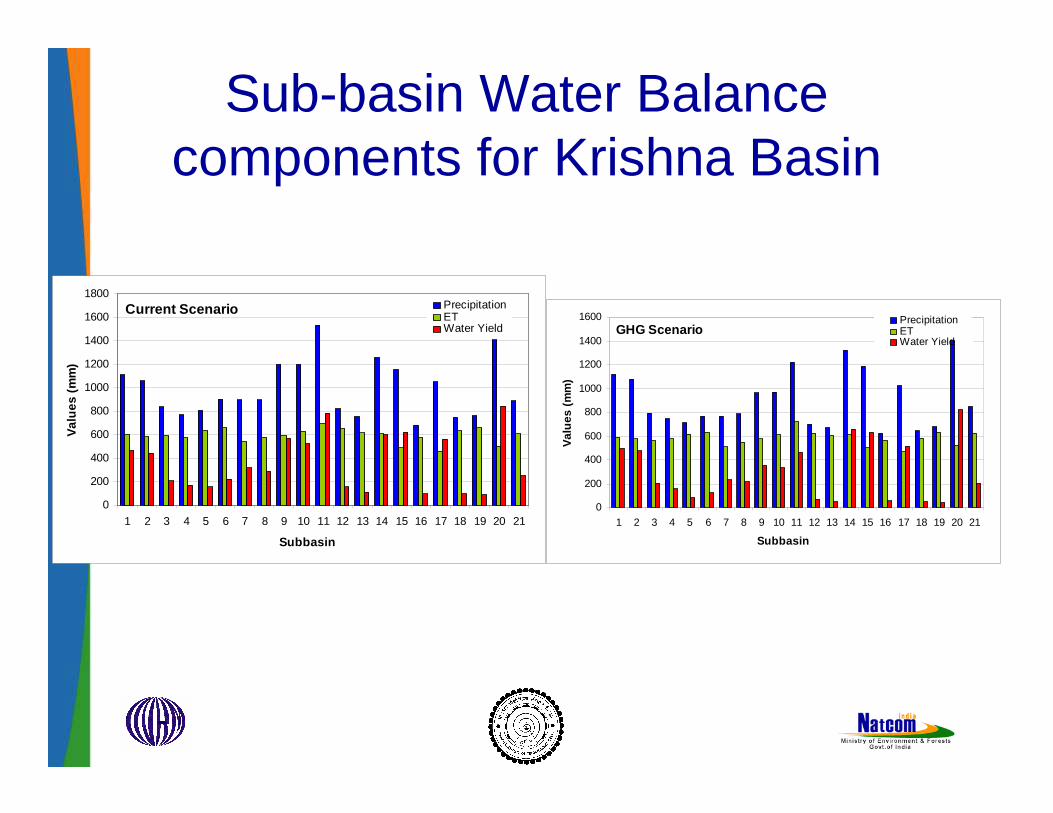
Sub-basin Water Balance components for Krishna Basin
0
200
400
600
800
1000
1200
1400
1600
1800
1 2 3 4 5 6 7 8 9 10 11 12 13 14 15 16 17 18 19 20 21
Subbasin
Val
ues
(m
m)
PrecipitationETWater Yield
Current Scenario
0
200
400
600
800
1000
1200
1400
1600
1 2 3 4 5 6 7 8 9 10 11 12 13 14 15 16 17 18 19 20 21
Subbasin
Val
ues
(m
m)
PrecipitationETWater Yield
GHG Scenario

Change in Sub-basin Water Balance components for Krishna
-350
-300
-250
-200
-150
-100
-50
0
50
100
1 2 3 4 5 6 7 8 9 10 11 12 13 14 15 16 17 18 19 20 21
Subbasin
Val
ues
(m
m)
Change in PrecipitationChange in ETChange in Water Yield
Change in Water Balance Components
-70
-60
-50
-40
-30
-20
-10
0
10
20
1 2 3 4 5 6 7 8 9 10 11 12 13 14 15 16 17 18 19 20 21
Subbasin%
Ch
ang
e
% Change in Precipitation% Change in ET% Change in Water Yield
% Change in Water Balance Components
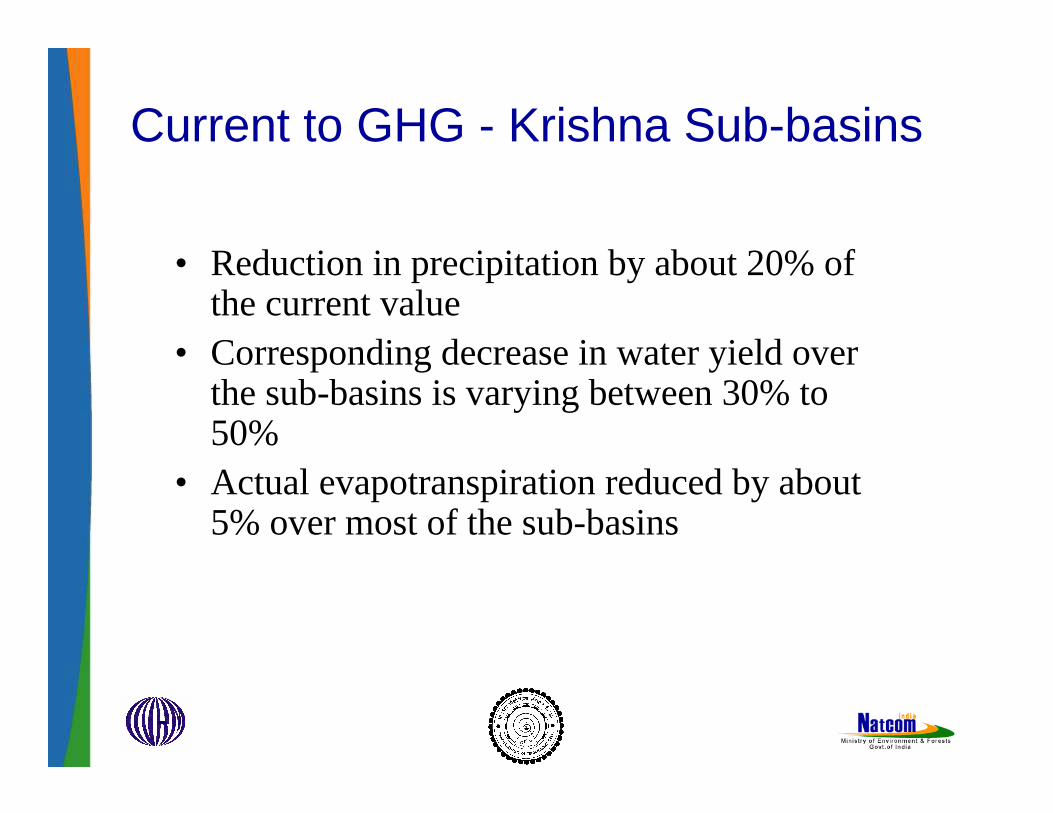
Current to GHG - Krishna Sub-basins
• Reduction in precipitation by about 20% of the current value
• Corresponding decrease in water yield over the sub-basins is varying between 30% to 50%
• Actual evapotranspiration reduced by about 5% over most of the sub-basins
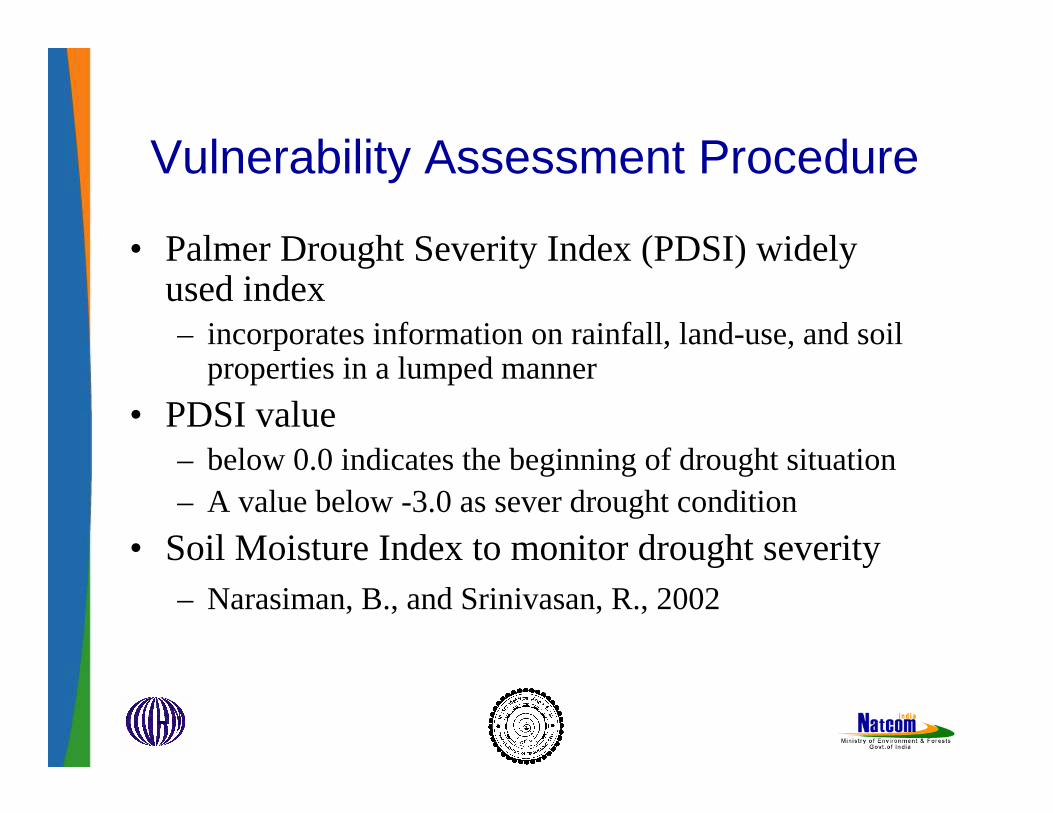
Vulnerability Assessment Procedure
• Palmer Drought Severity Index (PDSI) widely used index– incorporates information on rainfall, land-use, and soil
properties in a lumped manner
• PDSI value– below 0.0 indicates the beginning of drought situation– A value below -3.0 as sever drought condition
• Soil Moisture Index to monitor drought severity – Narasiman, B., and Srinivasan, R., 2002
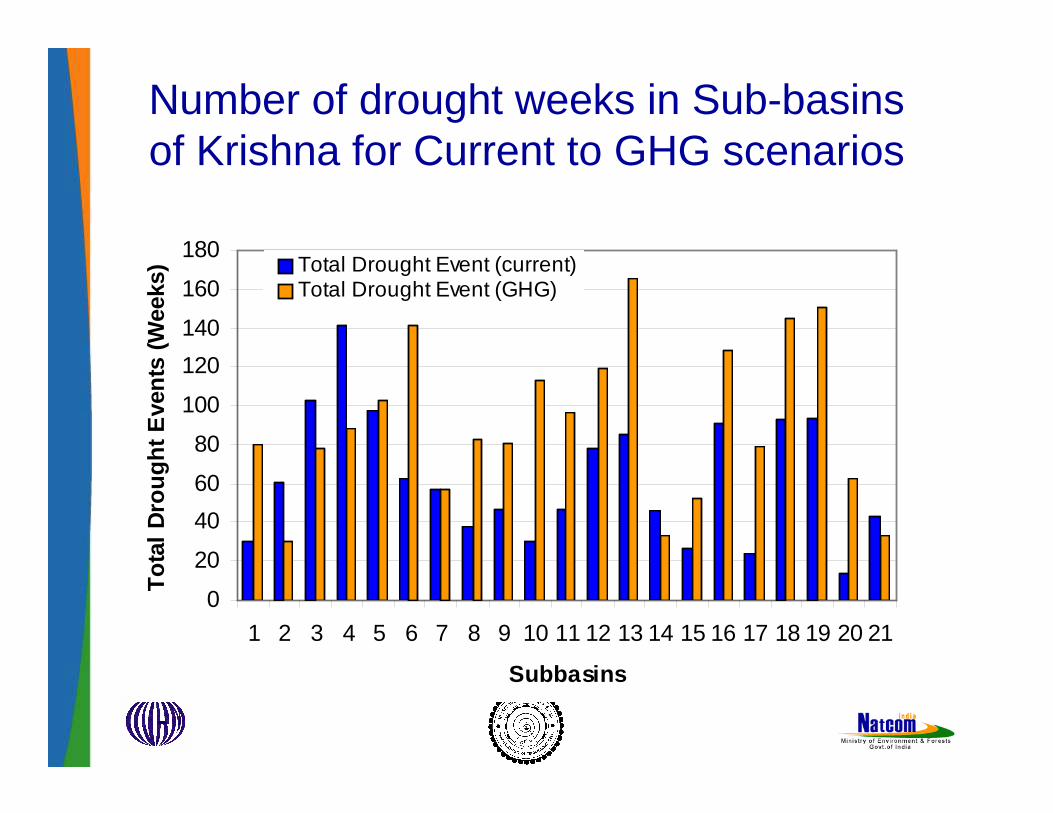
Number of drought weeks in Sub-basins of Krishna for Current to GHG scenarios
0
20
40
60
80
100
120
140
160
180
1 2 3 4 5 6 7 8 9 10 11 12 13 14 15 16 17 18 19 20 21
Subbasins
To
tal
Dro
ug
ht
Eve
nts
(W
eeks
) Total Drought Event (current)Total Drought Event (GHG)

Krishna Sub-basins with maximum Monsoon & Non monsoon events
Subbasin 15- ControlMaximum M drought weeks
0
10
20
30
40
50
60
0 2 4 6 8 10 12 14 16 18 20Year
Wee
ks
Drought Weeks
Subbasin 15- GHG
0
10
20
30
40
50
60
0 2 4 6 8 10 12 14 16 18 20Year
Wee
ks
Drought Weeks
Subbasin 4 - ControlMaximum NM drought weeks
0
10
20
30
40
50
60
0 2 4 6 8 10 12 14 16 18 20Year
Wee
ks
Drought Weeks
Subbasin 4- GHG
0
10
20
30
40
50
60
0 2 4 6 8 10 12 14 16 18 20Year
Wee
ks
Drought Weeks
Subbasin 11- Control
0
10
20
30
40
50
60
0 2 4 6 8 10 12 14 16 18 20Year
Wee
ks
Drought Weeks
Subbasin 11- GHGMaximum M drought weeks
0
10
20
30
40
50
60
0 2 4 6 8 10 12 14 16 18 20Year
Wee
ks
Drought Weeks
Subbasin 13- Control
0
10
20
30
40
50
60
0 2 4 6 8 10 12 14 16 18 20Year
Wee
ksDrought Weeks
Subbasin 13- GHGMaximum NM drought weeks
0
10
20
30
40
50
60
0 2 4 6 8 10 12 14 16 18 20Year
Wee
ks
Drought Weeks
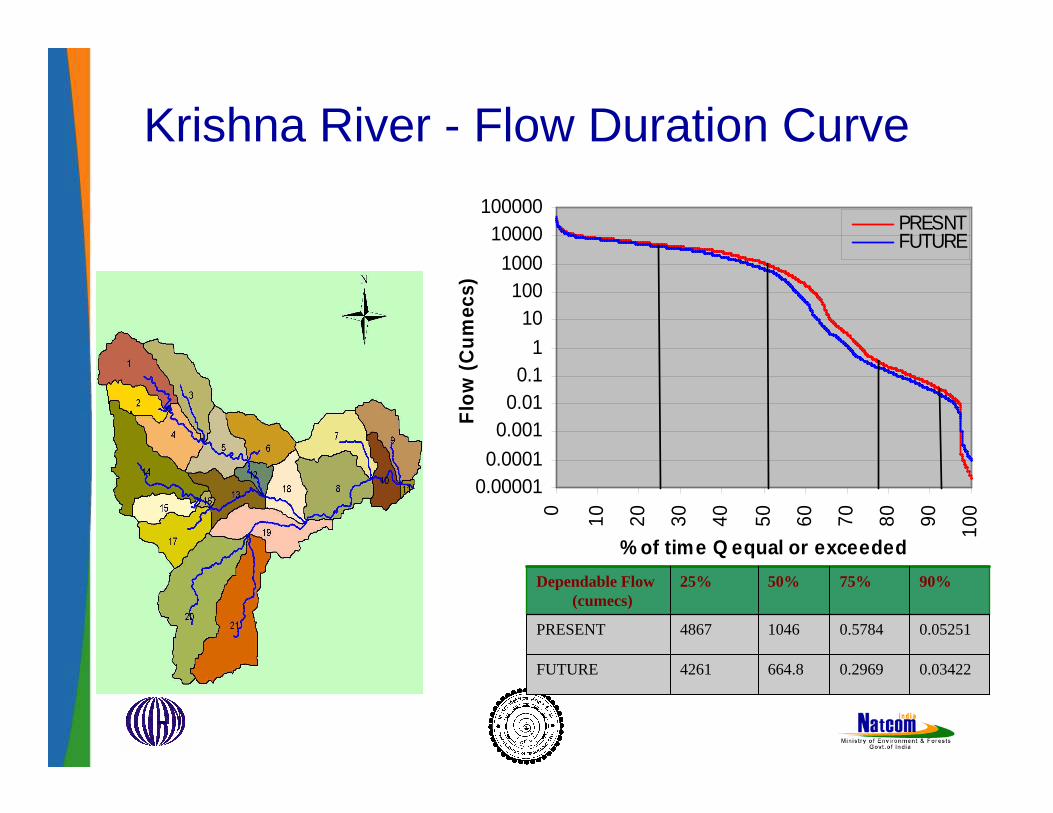
Krishna River - Flow Duration Curve
0.000010.0001
0.0010.010.1
1
10100
1000
10000100000
0 1 0 20 3 0 40 50 60 7 0 80 9 0 100
% of time Q equal or exceeded
Flo
w (
Cu
mec
s)
PRESNTFUTURE
0.034220.2969664.84261FUTURE
0.052510.578410464867PRESENT
90%75%50%25%Dependable Flow (cumecs)
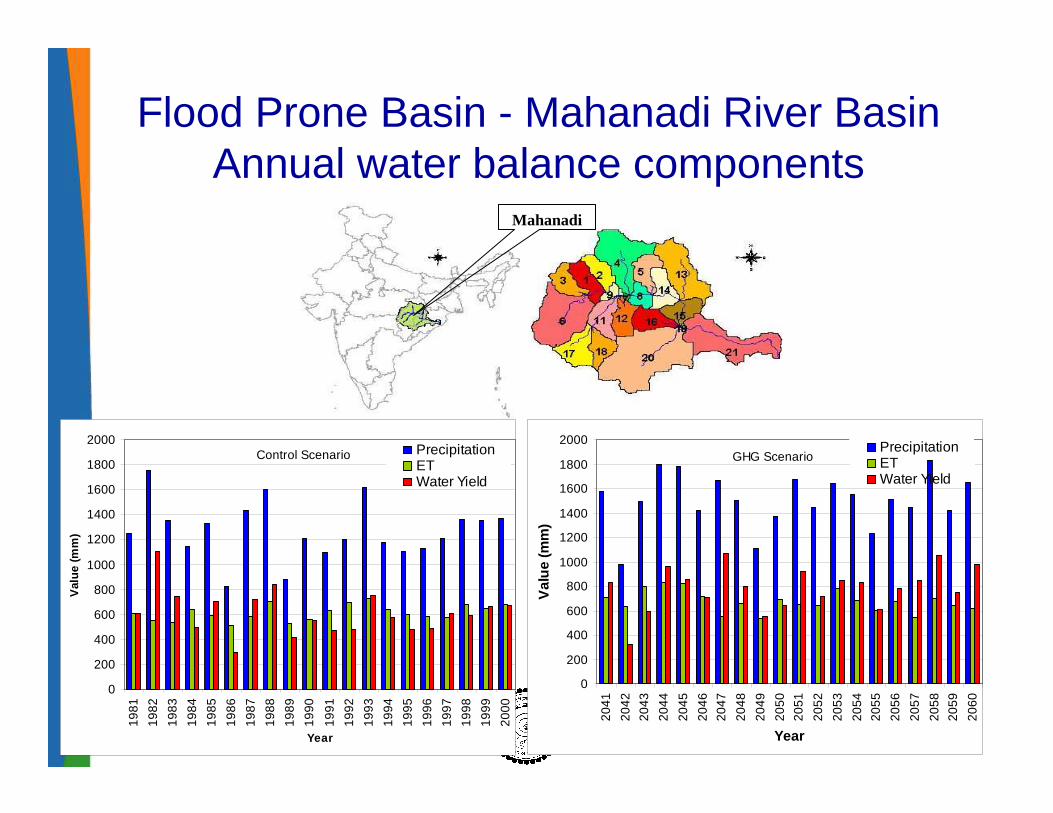
Flood Prone Basin - Mahanadi River Basin Annual water balance components
Mahanadi
0
200
400
600
800
1000
1200
1400
1600
1800
2000
1981
1982
1983
1984
1985
1986
1987
1988
1989
1990
1991
1992
1993
1994
1995
1996
1997
1998
1999
2000
Year
Val
ue
(mm
)
PrecipitationETWater Yield
Control Scenario
0
200
400
600
800
1000
1200
1400
1600
1800
2000
2041
2042
2043
2044
2045
2046
2047
2048
2049
2050
2051
2052
2053
2054
2055
2056
2057
2058
2059
2060
Year
Val
ue
(mm
)
PrecipitationETWater Yield
GHG Scenario

Monthly water balance components for Mahanadi river basin
0
50
100
150
200
250
300
350
400
450
500
Jan
Feb Mar
Apr
May Jun
Jul
Aug
Sep Oct
Nov
Dec
Year
Val
ue
(mm
)
PrecipitationETWater Yield
Control Scenario
0
50
100
150
200
250
300
350
400
450
500
Jan
Feb Mar
Apr
May Jun
Jul
Aug
Sep Oct
Nov
Dec
YearV
alu
e (m
m)
PrecipitationETWater Yield
GHG Scenario
Change in Monthly water balance components for Mahanadi river basin
-50
0
50
100
150
200
Jan
Feb Mar
Apr
May Jun
Jul
Aug
Sep Oct
Nov
Dec
Year
Val
ue
(mm
)
PrecipitationETWater Yield
Change (%) in monthly water balance for Control and GHG climate scenarios
-60
-40
-20
0
20
40
60
80
100
120
140
Jan
Fe
b
Ma
r
Ap
r
Ma
y
Jun
Jul
Au
g
Se
p
Oct
No
v
De
c
Year
Val
ue
(mm
)
PrecipitationETWater Yield
Change in monthly water balance for Control and GHG climate scenarios

Sub-basin Water Balance components for Mahanadi River Basin
0
500
1000
1500
2000
2500
1 2 3 4 5 6 7 8 9 10 11 12 13 14 15 16 17 18 19 20 21
Subbasin
Val
ues
(m
m)
PrecipitationETWater Yield
GHG Scenario
0
200
400
600
800
1000
1200
1400
1600
1800
2000
1 2 3 4 5 6 7 8 9 10 11 12 13 14 15 16 17 18 19 20 21
Subbasin
Val
ues
(m
m)
PrecipitationETWater Yield
Current Scenario
• an increase in precipitation, water yield and evapotranspiration has been predicted in all the sub-basins of Mahanadi
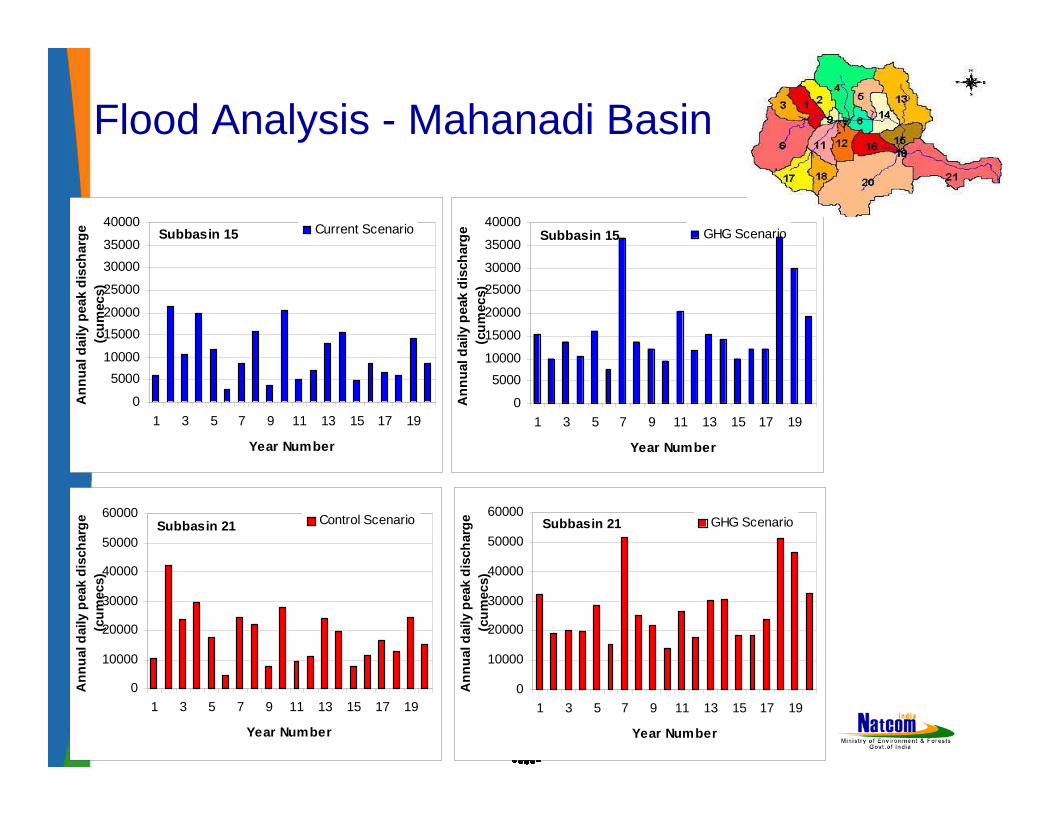
Flood Analysis - Mahanadi Basin
0
5000
10000
15000
20000
25000
30000
35000
40000
1 3 5 7 9 11 13 15 17 19
Year Number
An
nu
al d
aily
pea
k d
isch
arg
e (c
um
ecs)
Current ScenarioSubbasin 15
0
5000
10000
15000
20000
25000
30000
35000
40000
1 3 5 7 9 11 13 15 17 19
Year NumberA
nn
ual
dai
ly p
eak
dis
char
ge
(cu
mec
s)
GHG ScenarioSubbasin 15
0
10000
20000
30000
40000
50000
60000
1 3 5 7 9 11 13 15 17 19
Year Number
An
nu
al d
aily
pea
k d
isch
arg
e (c
um
ecs)
Control ScenarioSubbasin 21
0
10000
20000
30000
40000
50000
60000
1 3 5 7 9 11 13 15 17 19
Year Number
An
nu
al d
aily
pea
k d
isch
arg
e (c
um
ecs)
GHG ScenarioSubbasin 21
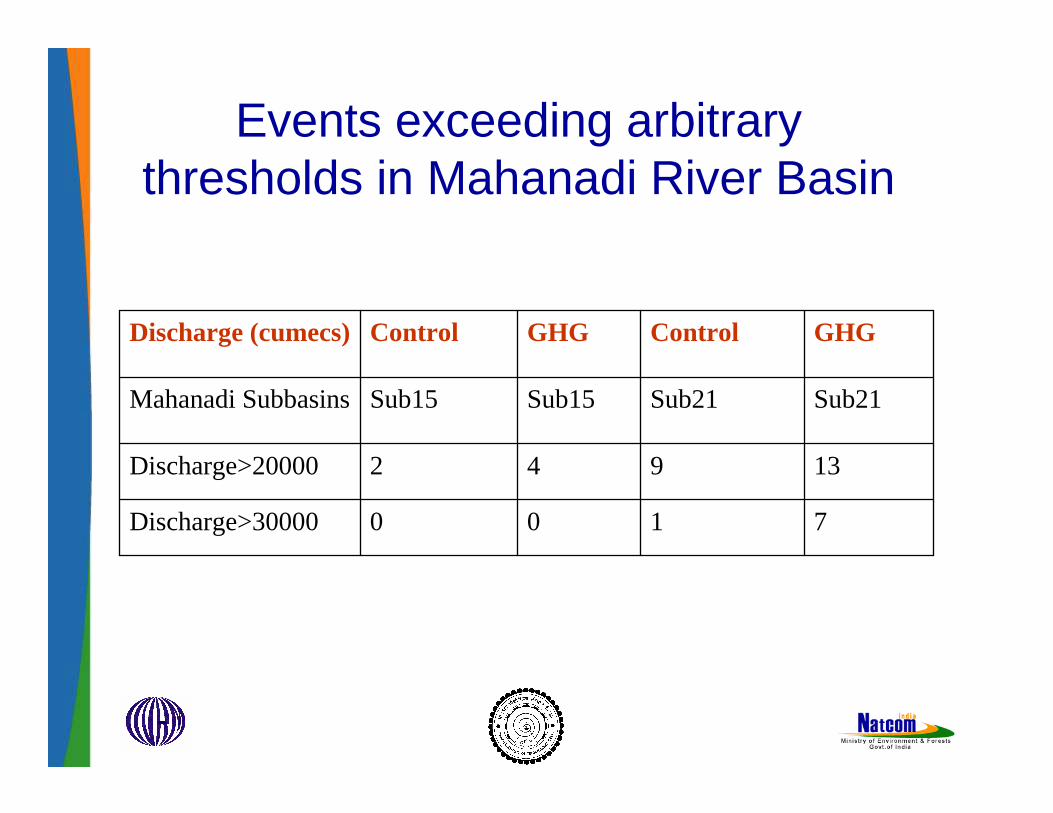
Events exceeding arbitrary thresholds in Mahanadi River Basin
7100Discharge>30000
13942Discharge>20000
Sub21Sub21Sub15Sub15Mahanadi Subbasins
GHGControlGHGControlDischarge (cumecs)
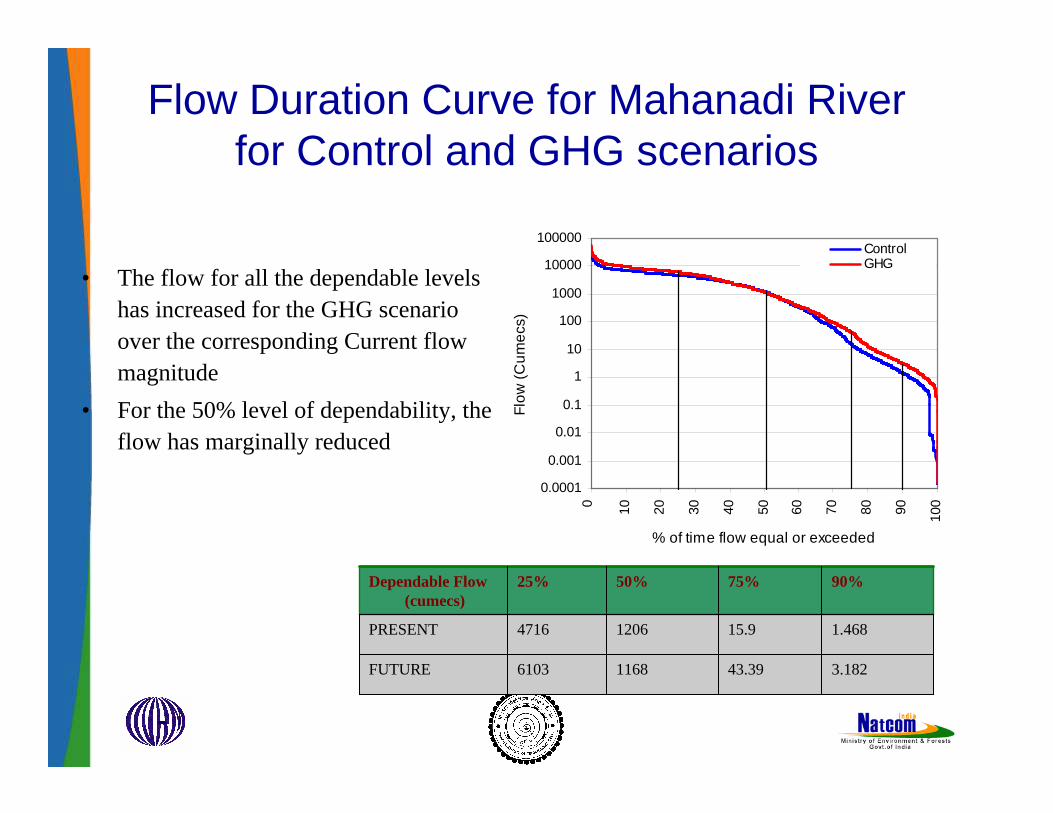
Flow Duration Curve for Mahanadi River for Control and GHG scenarios
• The flow for all the dependable levels has increased for the GHG scenario over the corresponding Current flow magnitude
• For the 50% level of dependability, the flow has marginally reduced
0.0001
0.001
0.01
0.1
1
10
100
1000
10000
100000
0 10 20 30 40 50 60 70 80 90 100
% of time flow equal or exceededF
low
(C
um
ecs
)
ControlGHG
3.18243.3911686103FUTURE
1.46815.912064716PRESENT
90%75%50%25%Dependable Flow (cumecs)

Annual mean water balance for Control and GHG climate scenarios in different river basins
Trends in Waterbalance Components (Control and GHG Climate Scenarios)
0
200
400
600
800
1000
1200
1400
1600
1800
Cauvery Brahmani Godavari Krishna Luni Mahanadi Mahi Narmada Pennar Tapi Ganga Sabarmati
Val
ue
(mm
)
Rain (Control) Rain (GHG) Runoff (Control) Runoff (GHG) AET (Control) AET (GHG)
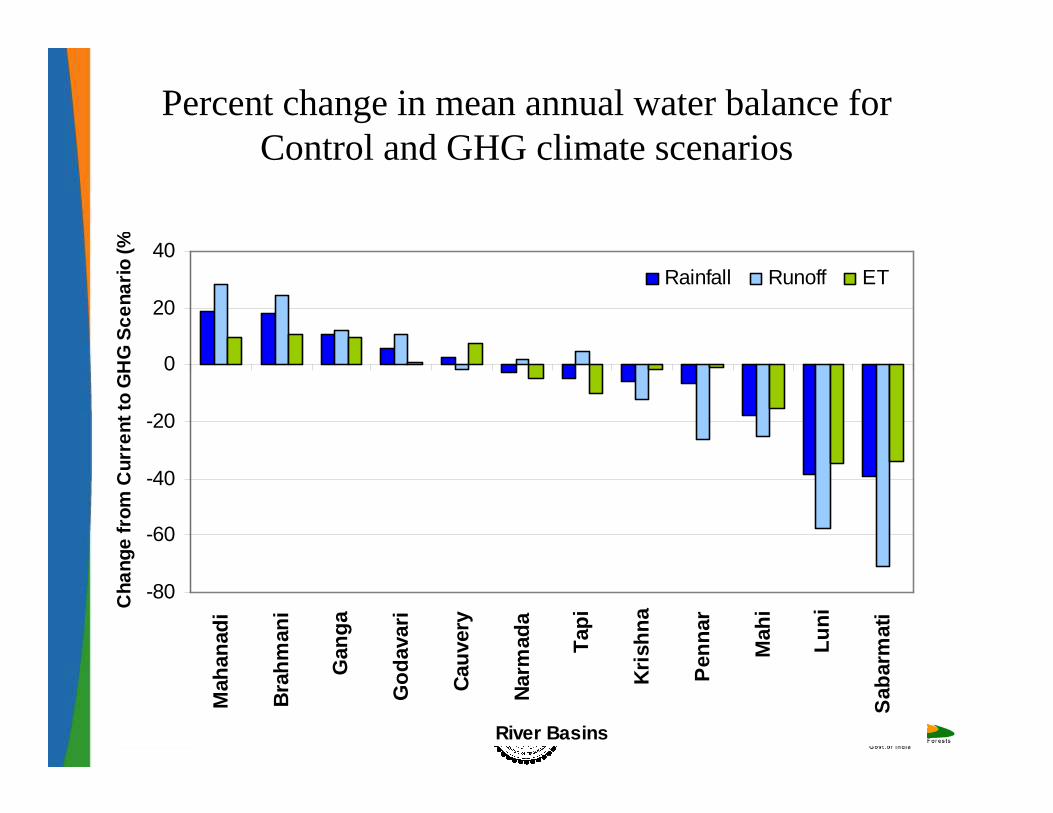
Percent change in mean annual water balance for Control and GHG climate scenarios
-80
-60
-40
-20
0
20
40M
ahan
adi
Bra
hm
ani
Gan
ga
Go
dav
ari
Cau
very
Nar
mad
a
Tap
i
Kri
shn
a
Pen
nar
Mah
i
Lu
ni
Sab
arm
ati
River Basins
Cha
nge
from
Cur
rent
to G
HG
Sce
nari
o (%
)
Rainfall Runoff ET
Conclusions
• The study is the first step towards getting the realistic estimates of the possible climate change impacts across the country
• It has provided a framework to be used for integrated river basin planning and management which was missing so far
• There is lot of improvement that is desirable and is under process

Thank you


