Climate Change Initiative Extension (CCI+) Phase 1 New Essential Climate Variables (NEW ECVS) High Resolution Land Cover ECV (HR_LandCover_cci) Product Specification Document (PSD) Prepared by: Università degli Studi di Trento Fondazione Bruno Kessler Université Catholique de Louvain Università degli Studi di Pavia Università degli Studi di Genova Politecnico di Milano Université de Versailles Saint Quentin CREAF e-GEOS s.p.a. Planetek Italia GeoVille
Transcript
Climate Change Initiative Extension (CCI+) Phase 1 New Essential Climate Variables (NEW ECVS) High Resolution Land Cover ECV (HR_LandCover_cci)
Product Specification Document
(PSD)
Prepared by: Università degli Studi di Trento Fondazione Bruno Kessler Université Catholique de Louvain Università degli Studi di Pavia Università degli Studi di Genova Politecnico di Milano Université de Versailles Saint Quentin CREAF e-GEOS s.p.a. Planetek Italia GeoVille
Ref CCI_HRLC_Ph1-PSD
Issue Date Page
2.rev.0 03/01/2020 1
Changelog
Issue Changes Date
1.0 First version. 02/04/2019
1.1 Updated version according to CCI_HRLC_Ph1_Milestone1_RID-ESA.xlsx and comments in PM2.
12/04/2019
2.0 Updated summary of user requirements according to URD v2.0 03/01/2020
Detailed Change Record
Issue RID Description of discrepancy Sections Change
1.1 PSD-1 All the maps reporting the AOIs and the tables with the related coordinates should be the same in all the deliverables.
2.1 Table 1 is aligned with data in URD [AD4], Section 5.1. Figure 1 is consistent with its replications across all deliverables.
PSD-3 The projection of the output is not specified.
3.1.3, 3.2.3 Technical specifications of products are updated with projection and tiling information.
2 Synthesis of user requirements ............................................................................................................. 5 2.1 Key areas location .................................................................................................................................. 5 2.2 Product classification system ................................................................................................................ 6
2.2.1 First version ....................................................................................................................................... 6 2.2.2 Second version .................................................................................................................................. 7
2.3 Coverage period .................................................................................................................................... 9 2.4 Side products needed ............................................................................................................................ 9 2.5 Post-processing tools ........................................................................................................................... 10 2.6 Products format ................................................................................................................................... 10 2.7 Uncertainties characterization ............................................................................................................ 10 2.8 Enrolment of CMC ............................................................................................................................... 10
3 Products definition .............................................................................................................................. 11 3.1 Static High Resolution Land Cover Map Product ................................................................................. 11
3.1.1 Overview on the Static LC product .................................................................................................. 11 3.1.2 Spatial and temporal resolution ...................................................................................................... 11 3.1.3 Format, metadata and projection ................................................................................................... 11
3.2 Historical High Resolution Land Cover Map Product ........................................................................... 12 3.2.1 Overview on the Historical LC product............................................................................................ 12 3.2.2 Spatial and temporal resolution ...................................................................................................... 12 3.2.3 Format, metadata and projection ................................................................................................... 13
1.1 Executive summary Following the activities of user requirements updating according to Climate User Community and other users’ consultations, the Consortium worked on defining HRLC products requirements accounting for technical constraints such as main data sources available, spatial and temporal coverage, software and tools for quality control. This complement activities of Task 1 of the project related to Requirements Management.
The first part of the document presents a synthesis of user requirements (details are reported in URD [AD4]). Then, technical specifications follow for each HRLC product. The HRLC Static Maps over the three large areas in Amazonia, Africa and Siberia for year 2018 will be produced using Sentinel data, both optical and SAR. This allows for full compliancy with GCOS spatial requirement of 10m (i.e., high resolution multispectral). In the smaller regions, historical LC and LCC products spanning temporal interval 1990-2015 will be produced upon processing of Landsat imagery (all missions from 5 to 8) and ASAR, ERS, Sentinel-1 SAR data. The spatial requirement for historical products is compliant with GCOS requirements at 30m. For temporal resolution, it has to be noted that the yearly frequency is confirmed for LCC products, whereas LC maps can be only produced every 5 years.
Requirements are also established for quality-related activities (independent validation and benchmarking) and products (quality flags), as described in the last section of the document.
1.2 Purpose and scope In the Product Specification Document (PSD) the climate user requirements described in the User Requirement Document (URD) [AD4] are turned into a set of products specifications. All requirements, needs and suggestions coming from users’ community consultations and other sources have been carefully analysed and considered. The result is a trade-off between user requirements and technical requirements which is described in detail in this document. Some pragmatic choices have been made when converting from user requirements to technical requirements. However, proper analysis and justification is given to support choices made, as indicated in the CCI HRLC project guidelines from the SoW [AD2].
The outcome of initial surveys of Climate users, CMUG, other CCI projects and potential users confirms the interest in relation to improved spatial resolution of LC products. In particular, high resolution land cover is expected to contribute in the understanding of the impact of spatial resolution in climate changes in key regions of the world. Keeping in mind the main objectives and guidelines of the Global Climate Observing System (GCOS) [RD1], the products requirements listed in this document turn out to be useful for a wide range of users of different communities as well.
The main output products of the CCI HRLC production chain consist of:
• A HRLC map at subcontinental level at spatial resolution 10m as reference static input to the climate models.
• A long-term record of regional HRLC maps at spatial resolution 30m in sub-regions of the static input for historical analysis every 5 years.
• The change information at 30 m and yearly scale for HRLC map update.
In the future versions of this document, these products will be defined in terms of their content, legend, spatial and temporal applicability, grids, projections and quality. The convention about the products’ identification, format, structure, metadata and delivery will be detailed as well.
1.3 Applicable documents Ref. Title, Issue/Rev, Date, ID
[AD1] CCI HR Technical Proposal, v1.1, 16/03/2018
Ref CCI_HRLC_Ph1-PSD
Issue Date Page
2.rev.0 03/01/2020 4
[AD2] CCI Extension (CCI+) Phase 1 – New ECVs – Statement of Work, v1.3, 22/08/2017, ESA-CCI-PRGM-EOPS-SW-17-0032
[AD3] Data Standards Requirements for CCI Data Producers, v2.0, 17/09/2018, CCI-PRGM-EOPS-TN-13-0009 [AD4] CCI_HRLC_Ph1-D1.1_URD, latest version
1.4 Reference documents Ref. Title, Issue/Rev, Date, ID
[RD1] The Global Climate Observing System: Implementation Needs, 01/10/2016, GCOS-200
1.5 Acronyms and abbreviations API Application Programming Interface
CCI Climate Change Initiative
CRC Climate Research Community
CMUG Climate Modelling User Group
CREAF Centre de Recerca Ecològica i Aplicacions Forestals
ECV Essential Climate Variables
ESM Earth System Models
EVI Enhanced Vegetation Index
FTP File Transfer Protocol
GCOS Global Climate Observing System
GDPR General Data Protection Regulation
GIS Geodata Information System
HR High Resolution
LAI Leaf Area Index
LC Land Cover
LCC Land Cover Change
LCCS Land Cover Coverage Classification System
LCML Land Cover Meta Language
LCZ Local Climate Zone
LSCE Laboratoire des Sciences du Climat et de l’Environnement
MR Medium Resolution
NDVI Normalized Difference Vegetation Index
PFT Plant Functional Type
RS Remote Sensing
SFT Surface Functional Type
SoW Statement of Work
URD User Requirements Document
VM Virtual meeting
WFS Web Feature Service
WMS Web Map Service
WP Work Package
Ref CCI_HRLC_Ph1-PSD
Issue Date Page
2.rev.0 03/01/2020 5
2 Synthesis of user requirements The user requirements concerning the products generated and the metadata associated are presented in the following sub-sections. Further details can be found in URD [AD4].
2.1 Key areas location As a result of the key users consultation, giving advantages to climate modellers demands (especially MPI and Met Office who participated both to the questionnaire and VM), the 3 studied zones were kept but were extended and moved to map a larger number of ecosystems and regions that are of interest for other ongoing studies (for example the region of the SODEEP project 1of MPI team or Equatorial Guinea for Met Office).
Figure 1. Regions mapped by the GlobPermafrost project.
Extensions in the latitudinal gradients were chosen rather than in longitudinal ones to cover a larger diversity of climatic zones in order to better assess climate-surface relationships. The locations were also optimized to include a maximum number of FluxNet stations (in situ site with eddy covariance flux measurements), which could be used to validate methods and models (example of ATTO and ZOTTO stations in Amazonia and Siberia respectively). We accounted also for the river basins contours in order to map as much as possible entire catchments. For example, we extended to the South our static region, to include the whole catchment of Lena river in Siberia. In the same way, in Africa, we extended the study zone to the North, to catch the whole Senegal river basin and to the East, to include the whole Awash river basin.
The LCC smaller regions were also slightly revised (especially for Amazonia) to include hot spots of deforestation (in Amazonia) or land degradation (in Ethiopia) or permafrost degradation in Yakutia (Siberia). Concerning this last point, we use the global permafrost map from the National Snow and Ice Data Center [3], to verify that our regions cover a large diversity of frozen soil types, ranging to continuous, discontinuous and sporadic
We have checked also that our regions are not already covered by other land mapping projects, in particular the ESA-DUE GlobPermafrost project which produces land cover maps in boreal/arctic regions. Concerning this last point, the regions mapped by the GlobPermafrost are shown in Figure 6.
The Yamal peninsula, the Lena delta and the Kytalik zones already mapped with Sentinel 1 and 2 data, could be defined as test zones in our project, taking advantage of the experience of the GlobPermafrost project, in order to better define and classify the vegetation types in the Arctic. The other way round, the CCI-Permafrost project would take advantage from high resolution land cover mapping on the overall circumpolar Arctic, the two projects will therefore profit from a strong collaboration. In summary, the geographical coordinates of the three regions are the following:
Figure 2. Final requirements for the location of the 3 study areas and Fluxnet sites (larger size image in Annex 6.6).
2.2 Product classification system
2.2.1 First version
The first version of the classification system proposed (LCCS approach upgraded to LCML/LCCS3) at cycle 1 of the project by the consortium, seemed to be convenient for the climate users. Its high compatibility with MRLC legend (Annex 6.1) is a strong requirement because of the necessary merge that will have to be done to generate global maps. In addition, the LMCL system allows:
● to characterize geographical features and describe phenomena related to specific bio-geo-physical
Ref CCI_HRLC_Ph1-PSD
Issue Date Page
2.rev.0 03/01/2020 7
processes and people activities by the means of attributes which can be very valuable,
● and to better translate the LC classes in the Surface Functional Types used in climate models to describe processes and their feedbacks on water and carbon cycles.
Several deficiencies of the MRLC legend have been highlighted linked to the coarse spatial resolution. The major ones appear to be:
● The legend is not able to separate the different types of crops (row, summer/winter, permanent, orchards, /C3/C4, etc.), the irrigation type (flooded/sparkling), the multiple cropping systems (agroforestry types but also intercropping, number of cycles per year). Such features should be accessible with the HR images and could be notified with the LCML attributes. Given also that all the sparse/mixed classes should disappear, we expect a better characterization of the crop cultures under LCML system.
● The urban areas should also benefit from the HR and the LCML system. One class for urban areas being definitely not sufficient, it is important to separate (when possible) the different categories (buildings, roads, railways, trees, parks, lakes, etc...) and to give any information which could help to characterize surface roughness, which is an important parameter in land surface models, determinant in the quantification of surface heat and water fluxes.
● A single class for water bodies is also not sufficient, since it is important to separate thermokarst lakes in boreal regions to better characterize methane and carbon emissions, to separate wetlands (permanent/seasonal), rivers, etc... In permafrost regions, the specific landscapes characterizing the presence of permafrost like polygonal grounds, ice wedges, thermokarst formations, pingos, etc., could be valuable.
Finally, it has been highlighted that it is also important to characterize the horizontal organization for forests, shrubs, grasslands and crops, for example tiger bushes, row cropping, trees clumping for instance. Such features are determinant to model hydrological and biophysical processes and those features have a resolution compatible with the one of HR data.
The requirement for LCML/LCCS3 classification system is therefore very pertinent; the refinement of the attributes has been adjusted with the processing partners, regionally during the end of cycle 1 and beginning of cycle 2 of the project.
2.2.2 Second version An agreement of a refined classification system was achieved after online and in person discussions (e.g. annual review meeting) with the participation of the EO Science team, Validation team and Climate team. The agreed classification system collects the demand of the climate modellers, the feasibility of the estimated EO skills classifiers and the provision and specifications of the samples for the validation procedures.
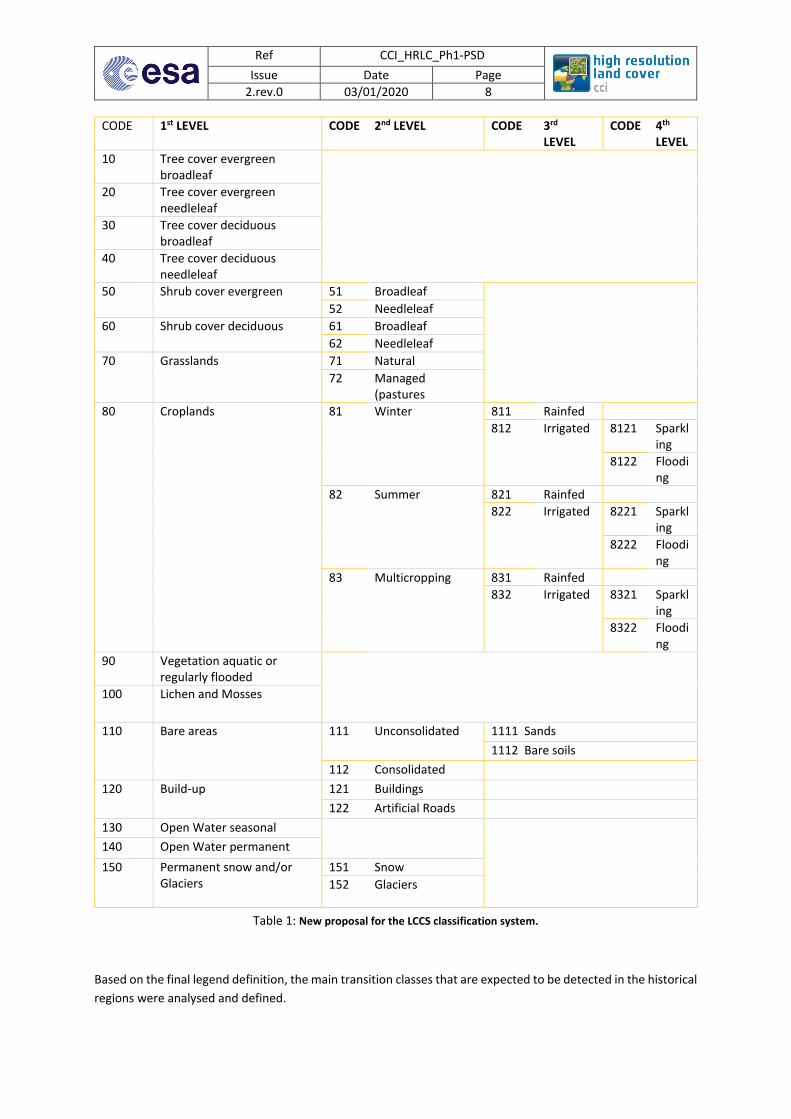
The current classification system is built as hierarchy system where some categories are split in different levels as shown in Table 1. This distribution is not regular and it is not applied to all main categories, for instance, the most distributed category is croplands, where relevant additional criteria (seasonality and irrigation) drives the sublevel classification. Additionally, the same criteria can drive a particular division on different levels, for example trees and shrubs do not follow the same level of organization for phenology and leaf type criteria. This hierarchy also responds to the rank of priorities considering the estimated classification and validation skills as well as the climate modelling needs. For example, the bare soil category was split in sands and rocks at the second level, which is a requirement from the climate modellers who want to better represent the infiltration properties of these two different surfaces and sand dust uprising for aerosols impacts modeling. In this rank, level 1 will be mandatory in all project results and the rest of levels will be generated depending on the particular application and following the levels priority.
130 Open Water seasonal 140 Open Water permanent 150 Permanent snow and/or
Glaciers
151 Snow 152 Glaciers
Table 1: New proposal for the LCCS classification system.
Based on the final legend definition, the main transition classes that are expected to be detected in the historical regions were analysed and defined.
Ref CCI_HRLC_Ph1-PSD
Issue Date Page
2.rev.0 03/01/2020 9
On the south-western part of Amazonia, we expect to observe changes linked to deforestation, cropping, grazing and urbanisation. Since we are looking here to yearly transitions, we don’t expect to detect some changes like bare soil or grasslands changing in adult trees for example, and we assumed that young trees will be classified in shrubs. Given also that in this region, needleleaf species, lichens and mosses, permanent snow and glaciers cannot be found. As a result of the users consultations, the transitions which are the most interesting to study for the climate applications, are the transitions of forests into croplands, grasslands and urbans areas, which could be direct (if rapid) or indirect via the bare soil class. We think also that the evolution of wetlands and flooded areas could be interesting to look at, as a consequence of precipitation changes, such areas could see some evolutions other the last thirty years. At second level, the changes between natural and managed grasslands, as well as the changes of single cropping to multicropping could be valuable to identify.
On the eastern part of Sahel, we are still in a tropical climate but much dryer, the same land cover classes can be found but the expected changes are not the same. In this region, desertification, cropland extension, reforestation can be observed. There is also a large swamp area in South Soudan which is sensitive to drought and floods. Urbanisation increase is also visible in some areas. Therefore, we expect to detect the possible transitions and we highlighted the main transitions linked to crop extension, desertification and reforestation. At the second level, the transitions between crop species, managed and natural grasslands could be also valuable. In the urban areas, the extension of buildings over bare soils or other artificial surfaces could be also interesting to analyze.
Finally, in western Siberia, with a very different climate, the land cover classes are not the same, the evergreen broadleaf species are not present as well as the vegetation flooded. We expect all the other classes except the permanent snow and glaciers, because this region is not mountainous. Concerning the yearly changes, they should be linked to vegetation greening because of climate warming (transitions between shrubs and trees, grasslands and shrubs , lichens/mosses and grasslands from south to northern latitudes), croplands abandonment or extension, and as a consequence of permafrost thawing, the increase of seasonal and permanent open water bodies. The main transitions highlighted concern the impacts of permafrost thawing and climate warming on the vegetation. At the second level, we could be interested to the transitions between winter to summer crops and the conversion of natural to managed grasslands.
2.3 Coverage period The coverage period (1990 – 2019) is satisfactory, with the year 2019 chosen for the static map. The 5-year mean LC maps are sufficient for climate studies if the changes are provided yearly. The consistency of the changes should be checked, along with the side products so that the climate modelling groups could assimilate coherently different sources of information on surface cover and surface state.
2.4 Side products needed The list of side products that could be beneficial for the climate modelling teams could be large and varies between the groups. We list below the main products that were identified:
● Seasonal products of the Vegetation Activity like EVI / NDVI or fluorescence indices, on a pixel basis for the year 2018 of the static map. These products should be coherent with the vegetation cover and are either used as input or as validation-data by the different climate modelling groups.
● Seasonal variation of hydrological variables such as snow cover and water extent, on a pixel basis for year 2018 on the static region are also crucial, burnt areas as provided in the MRLC project are also very valuable.
● For the LCC time series (over the smaller domain), including mean and standard deviation over the 30-year period of the above products would also be helpful.
● The access to auxiliary products at the same resolution and/or re-gridded in the same projection/grid would be clearly very valuable: information related to topography, aspects, albedo, LAI, etc., for example, would help the use of the HRLC products in climate studies.
Ref CCI_HRLC_Ph1-PSD
Issue Date Page
2.rev.0 03/01/2020 10
2.5 Post-processing tools The climate modelling groups are not directly using the satellite land cover types from the LCCS classification but rather Plant or Surface Functional Types (PFT/SFT), which are the basic units of most models. In order to map the LCCS classification to PFT/SFT, a specific free ad-hoc tool was designed during the MRLC project. We thus propose to use such tools that contain:
● A “cross-walking” table that describes the fraction of PFT/SFT associated to the different LCCS classes, using expert knowledge. We will use in particular the HRLC data to refine such table for the global MRLC mapping, given that key information on the mixed LC classes will be provided by the HRLC maps to better define the PFT/SFT fractions.
● A re-mapping facility that allows to map the resulting PFT/SFT (and the original LCCS classes) onto an ensemble of pre-defined grids (regular in latitude and longitude but also Gaussian).
We thus propose to use such post-processing tools for the transformation of the HRLC map into PFT/SFT with possibly minor adjustment to the tool (adding new grids suitable to the three regions of interests). The HR LC and LCC will thus be re-mapped on generic PFT/SFT that were defined across three EU climate modelling teams. Such classification, proposed in the MRLC project (the different generic PFTs), can be viewed under: https://orchidas.lsce.ipsl.fr/dev/lccci/generic_pft.php. The participants of the user virtual meeting expressed their interest to obtain these generic PFT/SFT; the LSCE partner will thus produce them with the cross-walking tool and make them available for the groups that do not want to run the tool.
Additionally, the LSCE proposes to provide additional post-processing of the generic PFTs. They are linked to:
● The separation of C3 versus C4 photosynthetic pathway for grassland. This distinction is crucial for most climate/land surface modelling teams. We propose to use a C3:C4 ratio global product (static map) defined by a US team combining model information and satellite observations.
● The inclusion of land-sea mask to separate sea water from inland water. ● Possible split of the PFT/SFT according to different climate regions following the Koppen-Geiger
classification.
Both, the results of these post-processing steps as well as the associated tools will be provided to the user community.
2.6 Products format The preferred product formats for the data are GeoTIFF and NetCDF. For metadata are: TXT and XML. The TXT format could be an ambiguous answer and it could include a wide range of non-structured and very flexible format, but very difficult to harmonize and automatize. XML is the other preference; it is a standard format and widely implemented in GIS and RS software.
2.7 Uncertainties characterization Two types of quality information are suggested: thematic and spatial. The first one refers to provide the classification results for the most likely class and secondary class. The second one indicates that some global statistical error indicators are not enough, some users need spatialized pixel level quality information.
2.8 Enrolment of CMC The Climate Research Community has expressed its strong interest in the future HRLC and their requirements concerning region location, classification system, metadata provided, etc., have been accounted for as much as possible in the product specifications. This is probably not enough to enrol them in the product assessment work because they have not been funded for that. However, they express their intention to use the products when those will be available for their study region and we expect some feedbacks afterwards. The MPI and Met Office teams which are involved in the MRLC follow-on project should be able to find a way to collaborate with LSCE in this framework. The next user meeting, where LSCE will show its first results, will be decisive on that point.
Besides, within the ORCHIDEE community, we have already advertised on the future products and we expect to work with N. De Noblet and Y. Balkanski at LSCE, on the Sahelian region. They are indeed interested to work respectively, on the vegetation/climate feedbacks linked to the reforestation projects like the Green wall at the northern limit of Sahel with Sahara, and on the modelling of dust emissions and the foreseen improvements of source location and roughness characterization with the HRLC products.
3 Products definition
3.1 Static High Resolution Land Cover Map Product
3.1.1 Overview on the Static LC product
The static map at spatial resolution of 10m is one of the main products of the project. Such map will represent the LC of the three sub-continental areas that have been identified in Section 2.1. The static map will refer to the year 2018.
The main sources of information will be Sentinel-2 and Sentinel-1 for the case of optical and radar data, respectively. This focus is explained by the desired spatial resolution of 10m of the product. Landsat-8 was initially identified in the technical proposal as another source of information for the static map because of the choice, in that stage, of the years 2016-2017 for the static map. In that time period, the Sentinel-2 constellation was not fully operational, thus raising the need for the identification of complementary data. On the contrary, the year 2018 is entirely after the completion of the Sentinel-2 constellation (Sentinel-2B was launched on March 7, 2017). Therefore, the need for Landsat-8 data within the generation of the static map in 2018 is substantially reduced. Landsat-8 imagery will be used only as a backup to mitigate possible issues of data unavailability from the two main sources.
As reported in Section 2.1, the three sub-continental regions that are considered for the static map are different from the ones identified in the technical proposal. Such an update results from the consultation with the key users and is motivated by the possibility to perform more relevant climate modelling using those areas. Moreover, compatibly with the MRLC legend, the product classification system proposed by the consortium is the LCCS approach upgraded to LCML/LCCS3. For additional details, we refer to Section 2.2.
The static map will also be associated with a pixelwise measure of uncertainty. Such measure will generally be affected by the uncertainty associated with the single input (optical and SAR) data sources, by their propagation through the corresponding processing chains (including the pre-processing and classification stages), and by their combination within the decision fusion stage.
3.1.2 Spatial and temporal resolution
The Static Map will be released for year 2018. The production of such product includes analysis and processing of a large quantity of data from Sentinel-1 and -2 missions for the full year 2018. We recall that temporal resolution of Sentinel optical data can reach 5 days and even less for overlapping orbits. This revisit time is lowered to up to three days in case of SAR data (less at high latitudes).
3.1.3 Format, metadata and projection
Product specifications will be compliant with last update of CCI Data Standards Requirements [AD3]. In particular, this will ensure complete interoperability of HRLC products with other products delivered in the framework of CCI, especially MRLC products.
Products will be delivered in Universal Transverse Mercator (UTM) projection in order to avoid unnecessary re-projection of main products in the processing chain (Sentinel, Landsat and many other image products are projected in UTM). Given the final products large extension, a tiling will be applied for delivering. Each tile will cover the spatial extension corresponding to the surface area bounded by 1°lat-by-1°long in the UTM projection. This will correspond to tiles of approximately 100km-by-100km area.
Ref CCI_HRLC_Ph1-PSD
Issue Date Page
2.rev.0 03/01/2020 12
GeoTIFF will be the supported format for classification data and metadata will be included in XML format.
3.2 Historical High Resolution Land Cover Map Product
3.2.1 Overview on the Historical LC product
In creating the historical HRLC products, we will take full advantage of the lessons learnt during the CCI MRLC. Moving from medium resolution (300m) to high resolution (10/30m) requires a change of paradigm in the data analysis and processing that comes intrinsically from the different characteristics of the data at higher resolution. In particular, the processing chain for the production of LC maps at 300m has been developed to process images characterised by medium spatial resolution but at a high temporal resolution (i.e., short revisit time). This resulted in the adoption of specific strategies based on the large availability of acquisitions within a single year that enabled the fully exploitation of the temporal signature of land-cover classes to enhance the performance of the final LC maps. In the HRLC project, the production of historical maps will be based on the use of images with high spatial resolution but limited temporal resolution. This is especially true for the historical time series back to 1990 where the number of high-resolution images available each year is dramatically smaller than in the medium-resolution case. In this context, it is necessary to define a new paradigm being able to deal with high spatial resolution images but lower temporal resolution. This in turn requires to define and use novel data analysis techniques that can properly exploit the significantly different properties of the data.
For historical reconstructions (1990-2015) LC maps will be generated by backward-propagation of detailed spatio-temporal information through a “reversed” (in time) change-detection-based procedure. The first map of the historical series of regional products is derived from the rescaling at 30m of the related portion of the sub-continental “static” map at 10m obtained as output of the classification step (after the fusion step) of the processing chain. The backward HRLC maps production is then based on the following steps: i) production of a LC change map for each year; and ii) production of the 5-year LC maps after the analysis of the related yearly LC change maps.
3.2.2 Spatial and temporal resolution
The spatial and temporal resolution of the historical high resolution land cover map products have been determined based on the requirements in the Statement of Work [AD2] and in accordance with the output of the fused optical and SAR pre-processed and classified information. The temporal scheme of the products is illustrated in Figure 3.
In the temporal dimension, a double resolution is foreseen. Six HRLC maps are to be generated for six epochs every 5 years (1990, 1995, 2000, 2005, 2010 and 2015). The aim is to map LCs of interest in a consistent way over time. Here the reference map to create the first HRLC map (2015) is the static map at 10m spatial resolution created for 2018, but rescaled at 30m. Then, the HRLC map at 2015 becomes the reference map for the 2010 HRLC map and so on. Additionally, the HRLC changes will be mapped with a shorter interval of one year to provide information about inter-annual and, possibly, seasonal variability. This choice comes as the experiences learnt from the CCI MRLC project and from the requirements of the SoW [AD2], GCOS-200 [RD1] and users [AD4].
Most of the earlier sensors available for the historical product generation (before Sentinel) and showing the most similar compromise in spatio-temporal resolution show a spatial resolution of 30m. Accordingly, the historical analysis and product generation at the 5-year epochs and the yearly change maps will be produced at 30m spatial resolution as well [AD2][AD4].
Ref CCI_HRLC_Ph1-PSD
Issue Date Page
2.rev.0 03/01/2020 13
Figure 3. Temporal resolution of the historical HRLC products.
Spatial and temporal resolution of the historical HRLC map products of the CCI HRLC are summarized in Table 2, which compares them to the GCOS requirements [RD1]. It is important to recall that for the LC maps the temporal resolution by GCOS is of one year, but according to data availability over the selected regions, this cannot be achieved. The strategy that will be used for generation of yearly LCC will allow to mitigate this problem coming from the lack of annual LC maps.
Table 2. Spatial and temporal resolutions of the historical HRLC map products compared to GCOS requirements.
GCOS CCI HRLC
LC 10-30m yearly
10-30m 5 years
LCC 250-1000m yearly
10-30m yearly
3.2.3 Format, metadata and projection
Product specifications will be compliant with last update of CCI Data Standards Requirements [AD3]. In particular, this will ensure complete interoperability of HRLC products with other products delivered in the framework of CCI, especially MRLC products.
Products will be delivered in Universal Transverse Mercator (UTM) projection in order to avoid unnecessary re-projection of main products in the processing chain (Sentinel, Landsat and many other image products are projected in UTM). Given the final products large extension, a tiling will be applied for delivering. Each tile will cover the spatial extension corresponding to the surface area bounded by 1°lat-by-1°long in the UTM projection. This will correspond to tiles of approximately 100km-by-100km area.
GeoTIFF will be the supported format for classification data and metadata will be included in XML format.
4 Quality documentation
4.1 Quality Flags The quality of both the static and historical HR LC maps generated in this project is first documented using a set of quality flags and values, determined on a per-pixel basis. These are:
1. The status of the pixel, being produced during the pre-processing, through the pixel identification step. Six statuses are proposed: “Cloud”, “Clear land”, “Clear water”, “Clear snow”, “Invalid” and “Filled”.
2. If the pixel has a status different from “Invalid” and “Filled, an indicator describing the overall quality of the reflectance value (derived from the pre-processing).
3. The number of valid and cloud-free observations used for the classification
4. If the pixel has a status different from “Invalid” and “Filled”, an indicator describing the uncertainty associated with the land cover class.
5. For the HR historical maps, an indicator describing if the pixel has changed with regards to the previous period.
4.2 Independent validation A statistical validation framework was established in the context of the GlobCover and CCI Moderate Resolution (MR) LC projects. This statistical validation framework is organized in 4 steps as described in Figure 4. These steps are adjusted to the CCI+ HRLC mapping activities: RR, static maps and change detection.
Ref CCI_HRLC_Ph1-PSD
Issue Date Page
2.rev.0 03/01/2020 14
Figure 4. Different components of the independent statistical validation component.
LC product accuracy is assessed by comparison with independent data sources such as, ground based in-situ measurements or higher resolution satellite data. The collection of higher resolution satellite as “ground truth” is considered as the best option to support the validation of remote sensing products in general and of the HR LC maps in particular.
Reference data samples are collected on specific areas designed to be statistically valid for accuracy assessment of the HR LC products, to address the issues of rare classes with a strong impact on the climate system (urban areas, wetlands, etc.) and to bias a specific sampling for the LC change validation.
The reference data sources are then intended to be interpreted over each validation samples through an international network of experts in a standardized manner. The scale-independent validation tool developed for hosting this interpretation process, based on the experience gained during the previous validation exercises has been successfully used in the CCI MRLC validation and for the recent SIGMA validation experiment. The validation tool provides an online interface available to the expert on reception of an URL. Figure 5 presents this interface, highlighting different functionalities.
Figure 5. Main page of the validation tool, with the following functionalities: 1) Layer box to display different layouts; 2) Zooming functionalities; 3) Tools box to activate navigation, display NDVI profile, select objects or assign a LC class; 4)
Legend description; 5) Comments box to include free text that should help understanding the labelling choices.
Then, the classification is compared to the reference data, and the extent to which these two classifications agree is defined as map accuracy. The common way of deriving the map accuracy is the analysis of the confusion matrix. A confusion matrix is a square matrix that compares a classified map to reference data. Diagonal values represent the agreement between the reference and the classification while non-diagonal values represent the errors. These accuracy figures will be documented in the Product Validation Plan.
Ref CCI_HRLC_Ph1-PSD
Issue Date Page
2.rev.0 03/01/2020 15
4.3 Benchmarking The inter-comparison between different existing LC products can be very informative for the final users being able to help in detecting anomalies and outliers and in understanding the effects of different assumptions in the product generation.
The activities related to the inter-comparison of the HR static and historical HR LC maps and other products can be summarized into the following steps: i) accurate inventory and identification of data available for comparison; ii) processing for datasets harmonization taking into account the results of the scaling analysis performed by UCL; iii) evaluation of agreement/disagreement between the datasets; iv) detection of possible model patterns of disagreement. The results of the benchmarking activity are reported in the Product Validation Plan.
5 Technical Specifications
5.1 User Tool All the High Resolution Land Cover products will be available through the CCI Climate Open Data portal and accessible with different methods like:
• FTP • WMS/WFS • OpeNDAP
Moreover, catalogue API will be provided. The Portal is meant to be interfaced by the CCI Toolbox in order to provide easy functionalities for retrieving.
Econding formats are specified in 3.1.3 and 3.2.3 and follow the CCI Data Standards v2.0. In general, netCDF and GeoTiff are usable by a wide set of GIS tools and of course by the CCI Toolbox. Appropriate color mapping will be provided in different formats such as SLD (Styled Layer Descriptor) usable in QGIS and in the CCI Toolbox format to be included directly as information retrieved from the CCI Open Data Portal.
5.2 Documentation Documentation is made available through the CCI Open Data Portal.
6 References [1] C. J. Still, J. A. Berry, G. J. Collatz, and R. S. DeFries, “Global distribution of C3 and C4 vegetation: Carbon
cycle implications,” Global Biogeochemical Cycles, vol. 17, no. 1, pp. 6-1-6–14, 2003. [2] M. Kottek, J. Grieser, C. Beck, B. Rudolf, and F. Rubel, “World Map of the Köppen-Geiger climate
classification updated,” Meteorologische Zeitschrift, pp. 259–263, Jul. 2006.