Climate Change Resilience and the Vermont Agency of Transportation Gina Campoli, Environmental Policy Manager Vermont Agency of Transportation “Flooding, Vulnerability and Risk Oh My!” AASHTO’s 21 st Century Mobility for Freight and Passenger Transportation Conference July 8, 2015
Transcript
Climate Change Resilience and the Vermont Agency of Transportation
Gina Campoli, Environmental Policy Manager Vermont Agency of Transportation
“Flooding, Vulnerability and Risk Oh My!” AASHTO’s 21st Century Mobility for Freight and
Passenger Transportation Conference July 8, 2015
Presenter
Presentation Notes
Why butterflies – because the AOT – we call ourselves VTrans - experience post tropical Storm Irene in 2011 and moving forward can be best called a metamorphoses. We are transforming the agency. Not because someone is telling us we should, but because it’s what we must do to save money and resources and keep the traveling public safe now and in the future. At this stage of the process we are emerging butterflies, but not quite ready to make it to Mexico. Our overall goal: Designing infrastructure capable of withstanding future weather events by building in harmony with the natural environment – understanding, for example, river flows and how development near rivers can impact transportation infrastructure
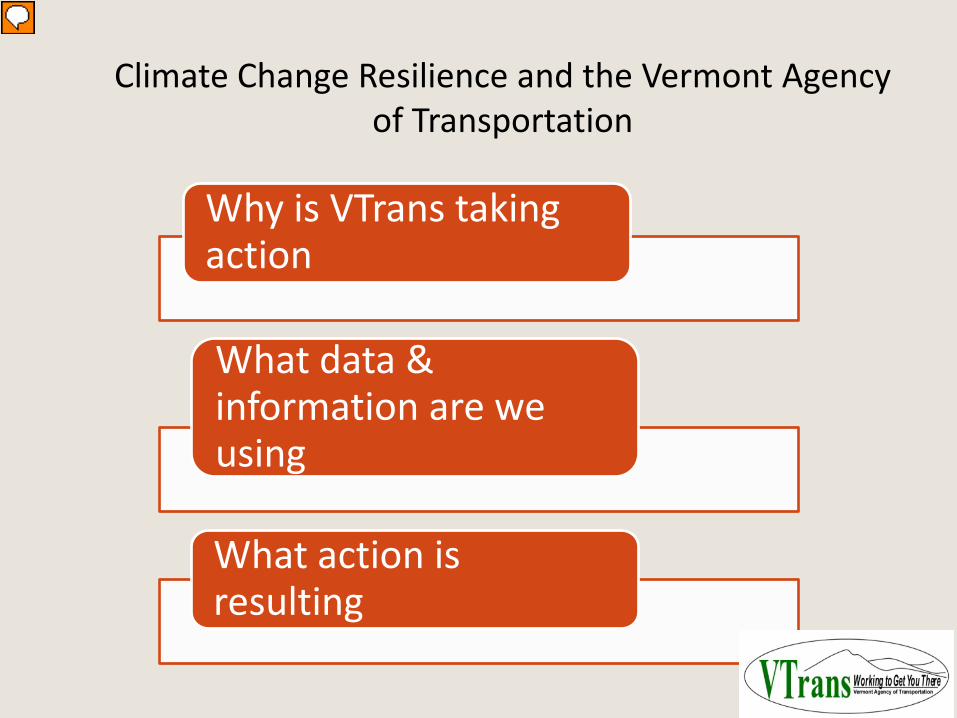
Climate Change Resilience and the Vermont Agency of Transportation
Presenter
Presentation Notes
In the following slides I will be describing: Why VTrans is taking action on climate change What data and information we are using And the resulting actions or implementation steps.
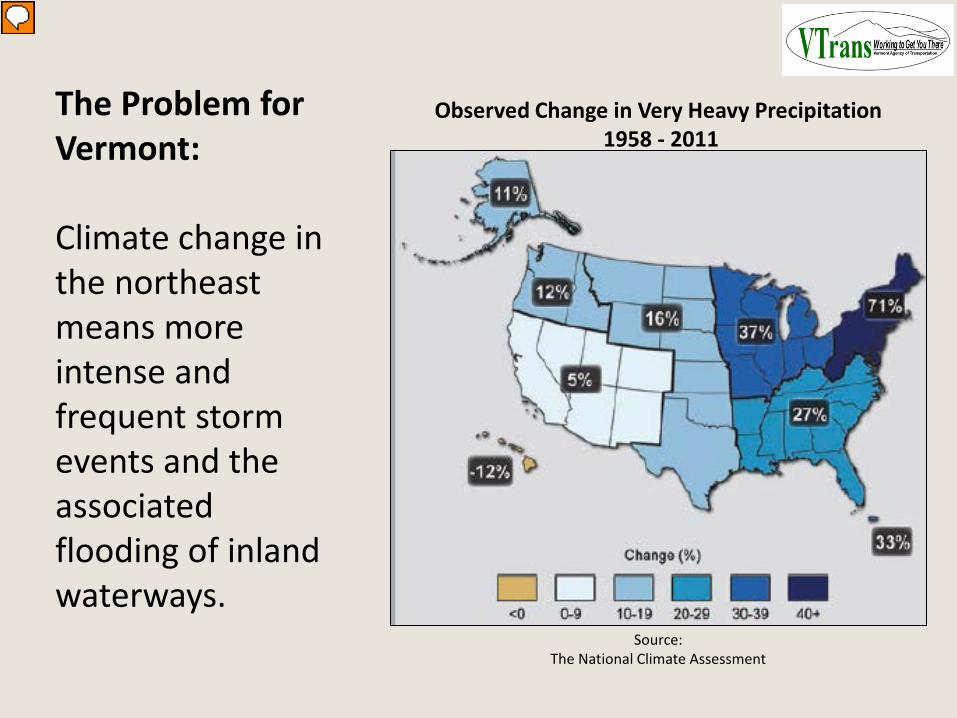
Source: The National Climate Assessment
Observed Change in Very Heavy Precipitation 1958 - 2011
The Problem for Vermont: Climate change in the northeast means more intense and frequent storm events and the associated flooding of inland waterways.
Presenter
Presentation Notes
Climate change is affecting the parts of the country differently. For example drought in the west, coastal storm surge, perma frost melting, and for the inland northeast flooding associated with very heavy precipitation events. As the map on the right illustrates - 71 % increase in changes in very heavy precipitation events. This issue is bringing the NASTO states together. At the NASTO annual meeting last month Our CEOS agreed to undertake a 1 year look at inland and coastal flooding and the risk to the NHS and its equivalent in Quebec and Ontario. Central to this effort will be an expert climate scientists panel and risk management workshop
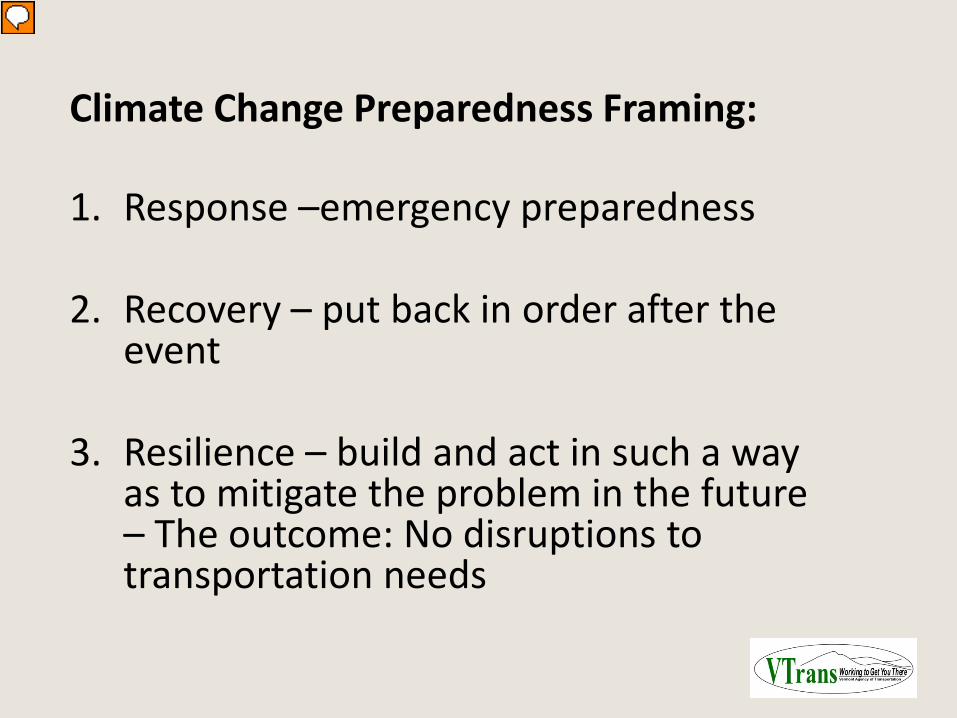
3. Resilience – build and act in such a way as to mitigate the problem in the future – The outcome: No disruptions to transportation needs
Presenter
Presentation Notes
There are 3 main components to addressing what climate change is throwing at us. Read slide: VTrans is working on all 3 – my comments today are focused on resilience Important distinction because they includevery different partners and actions. I will be focusing on resilience.
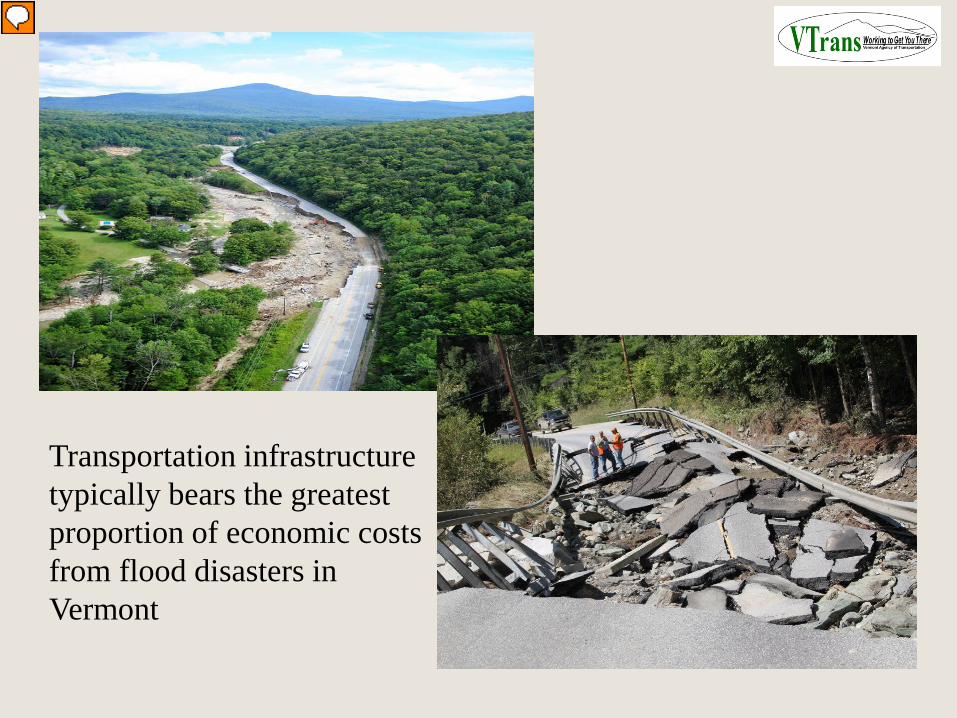
Transportation infrastructure typically bears the greatest proportion of economic costs from flood disasters in Vermont
Presenter
Presentation Notes
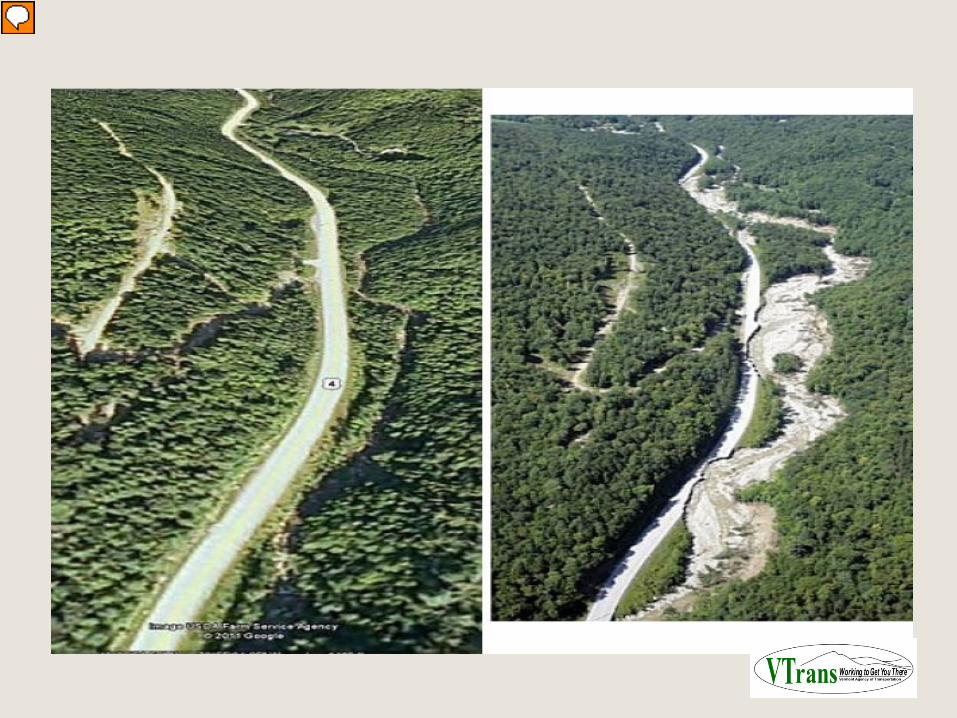
In VT transportation infrastructure is in the eye of the storm. We have suffered the bulk of the impacts for a couple of reasons that I will describe on the next several slides. The effects are not just on roadways, rail line too have been affected. In 2011 Vermont was hammered and it wasn’t just Tropical Storm Irene. The snowiest February and March on record. Flash floods occurred in May and June and Lake Champlain was at record high levels for 6 weeks during those months inundating lake side communities in VT, NY and Quebec and in late August Tropical Storm Irene struck. It was a hurricane when it brushed by NYC, it then took a track north through CT and Western MA and up the spine of the Green Mountains before heading east to NH about ¾ of the way the length of the state. For VTrans the greatest damage was our east west roadways. Initially we had to restore access to dozen of communities that were isolated after that we prioritized key routes and continually assisted local officials. We all did all this by putting an ICS system in place within 24 hours of the storm hitting the state Left is route 4 swept away by the water, rocks and debris and the right is a close up of the type of damage close up. The problem was not only the inundation and force of the water itself but the associated fluvial erosion In total the storm impacted 225 municipalities, closing 34 state highway, and damaging hundreds of miles of roads and rail. Infrastructure repairs continue in some towns today, demonstrating the magnitude of the disaster.
0
2
4
6
8
10
12
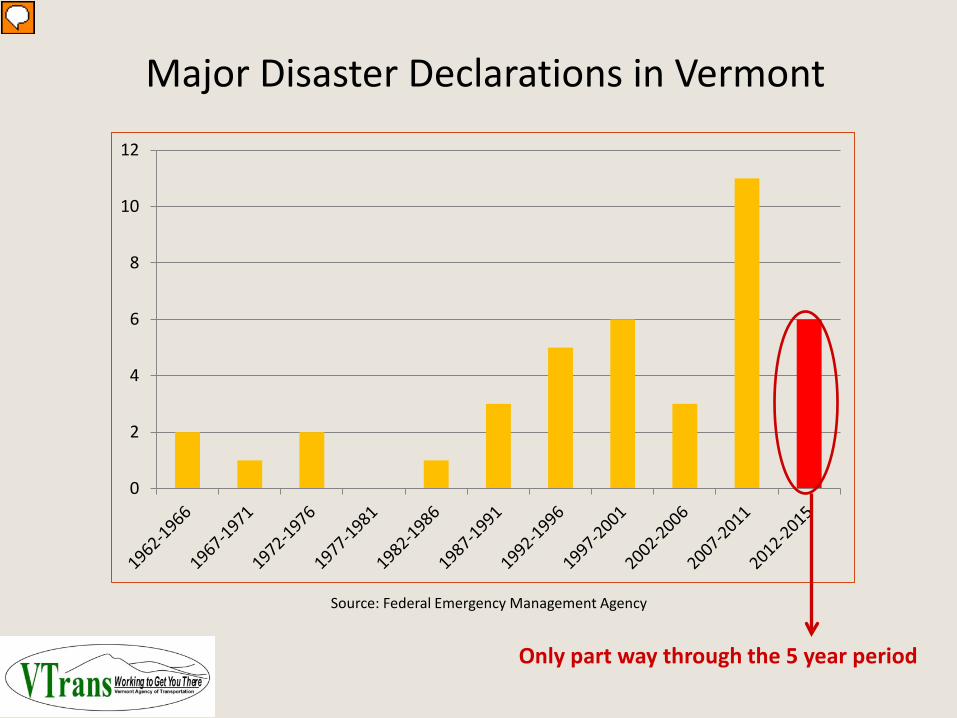
Source: Federal Emergency Management Agency
Only part way through the 5 year period
Major Disaster Declarations in Vermont
Presenter
Presentation Notes
Irene was extreme, but it was part of a trend Of the 38 federal major disaster declarations in Vermont since 1963, 14 of those have occurred since 2008. While there have been a handful related to severe wind events and ice storms the vast majority are associated with flooding
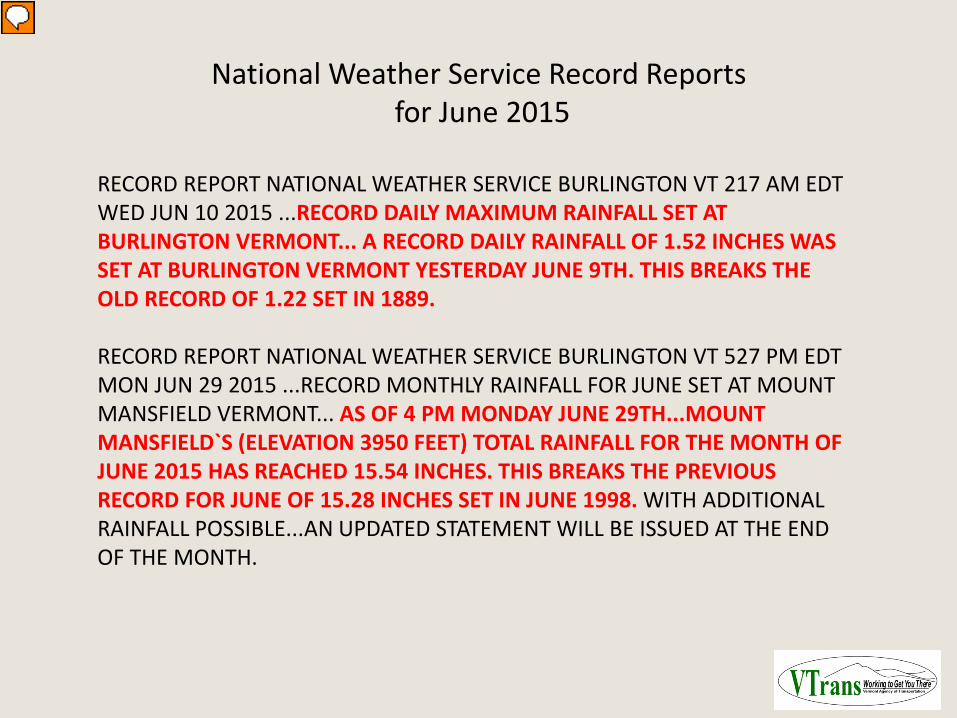
National Weather Service Record Reports for June 2015
RECORD REPORT NATIONAL WEATHER SERVICE BURLINGTON VT 217 AM EDT WED JUN 10 2015 ...RECORD DAILY MAXIMUM RAINFALL SET AT BURLINGTON VERMONT... A RECORD DAILY RAINFALL OF 1.52 INCHES WAS SET AT BURLINGTON VERMONT YESTERDAY JUNE 9TH. THIS BREAKS THE OLD RECORD OF 1.22 SET IN 1889. RECORD REPORT NATIONAL WEATHER SERVICE BURLINGTON VT 527 PM EDT MON JUN 29 2015 ...RECORD MONTHLY RAINFALL FOR JUNE SET AT MOUNT MANSFIELD VERMONT... AS OF 4 PM MONDAY JUNE 29TH...MOUNT MANSFIELD`S (ELEVATION 3950 FEET) TOTAL RAINFALL FOR THE MONTH OF JUNE 2015 HAS REACHED 15.54 INCHES. THIS BREAKS THE PREVIOUS RECORD FOR JUNE OF 15.28 INCHES SET IN JUNE 1998. WITH ADDITIONAL RAINFALL POSSIBLE...AN UPDATED STATEMENT WILL BE ISSUED AT THE END OF THE MONTH.
Presenter
Presentation Notes
And the beat goes on with some recent data. This past June was one of the rainiest on record. 2 records broken – read. Rivers continue to be running far above normal and the state is preparing a disaster declaration for an event in central VT in the middle of June that affected a handful of rural town roads, bridges and culverts
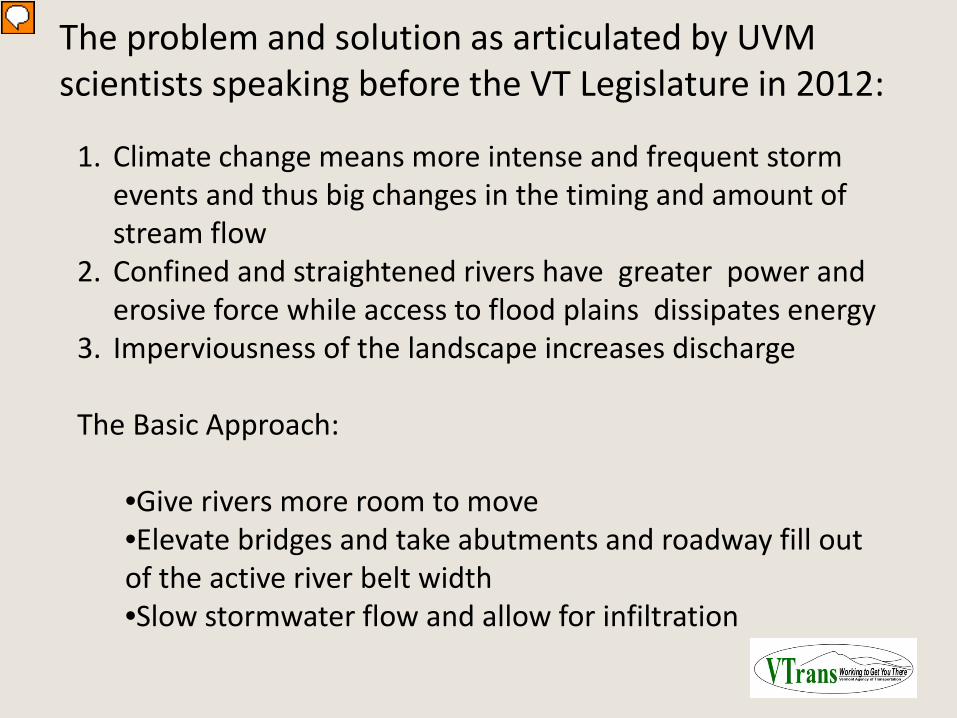
The problem and solution as articulated by UVM scientists speaking before the VT Legislature in 2012:
1. Climate change means more intense and frequent storm
events and thus big changes in the timing and amount of stream flow
2. Confined and straightened rivers have greater power and erosive force while access to flood plains dissipates energy
3. Imperviousness of the landscape increases discharge
The Basic Approach:
•Give rivers more room to move •Elevate bridges and take abutments and roadway fill out of the active river belt width •Slow stormwater flow and allow for infiltration
Presenter
Presentation Notes
Back in 2012 the VT legislature invited UVM scientists into the House Chamber to speak specifically about what climate change meant for the state. This advice has been taken to heart by the agency.
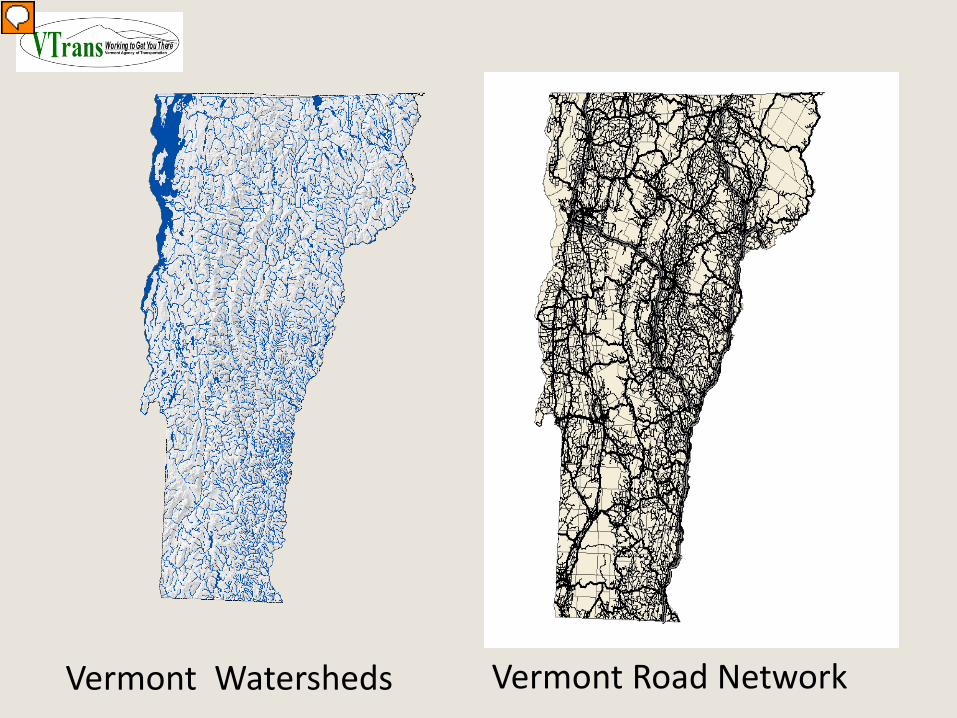
Vermont Watersheds Vermont Road Network
Presenter
Presentation Notes
Why is the VT roadway system so vulnerable There is lot of it 2,702 miles of state roads and 13,102 miles of town roads - in total the distance equal to going 5 times across the US. Roadways follow watersheds and are near and adjacent to rivers and streams. Why are they there. It was the path of least resistance historically and now connect villages and towns that have been in those same streamside locations for over 200 years. Its not easy to pick them up and move them elsewhere
Presenter
Presentation Notes
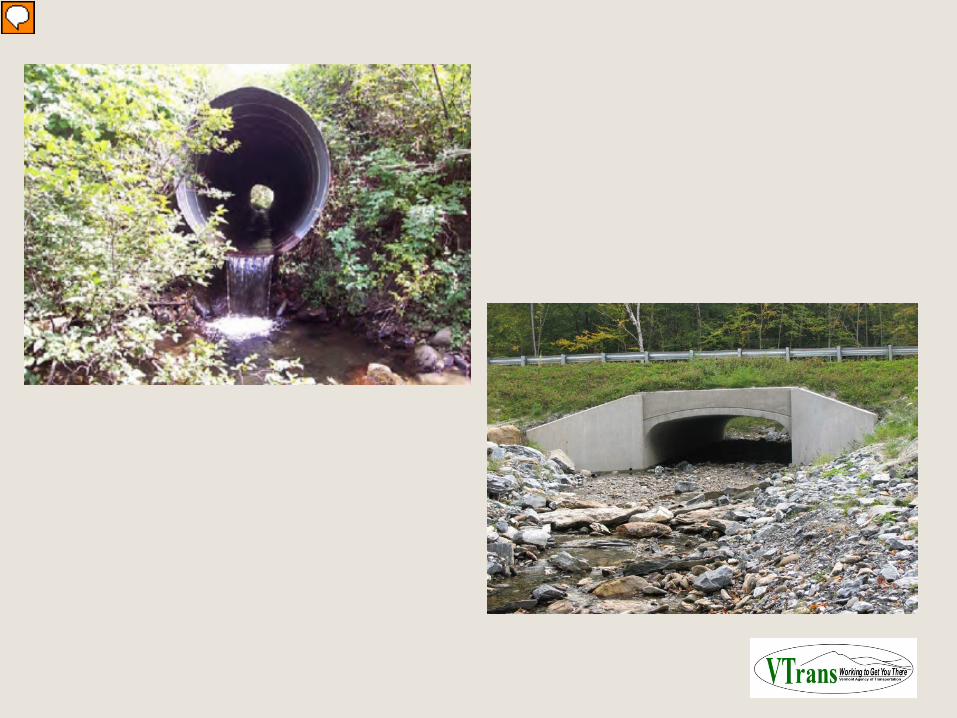
Approx. 85,000 bridges and culverts on the state system with 90% of the culverts less than 6 ft. Best guess assuming the same number of structures per mile as state system – 400,000 on the municipal system. VTrans is supporting municipalities through the regional planning commissions to complete an online inventory – VTCULVERTS, over 3/4th of the state has been covered. Array of types – undersized to the gold standard which is designed to a bfw standard, and will accommodate aquatic organisms and in many instances wildlife passage
Inter-agency love
Presenter
Presentation Notes
One critical component to all aspects of Vermont's response and recovery to extreme events and long term resilience efforts has been constant coordination and integration of our efforts with sister agencies from the top to the bottom of our organization. The agency of Natural Resources, emergency management and Commerce and Community Affairs are key partners. VTrans executive staff meet biweekly for an hour with their ANR ounterparts, they have on-going priorities that they track and there are an array of staff level coordination mechanisms and projects some of which I will describe. It takes time and effort but its worth it.
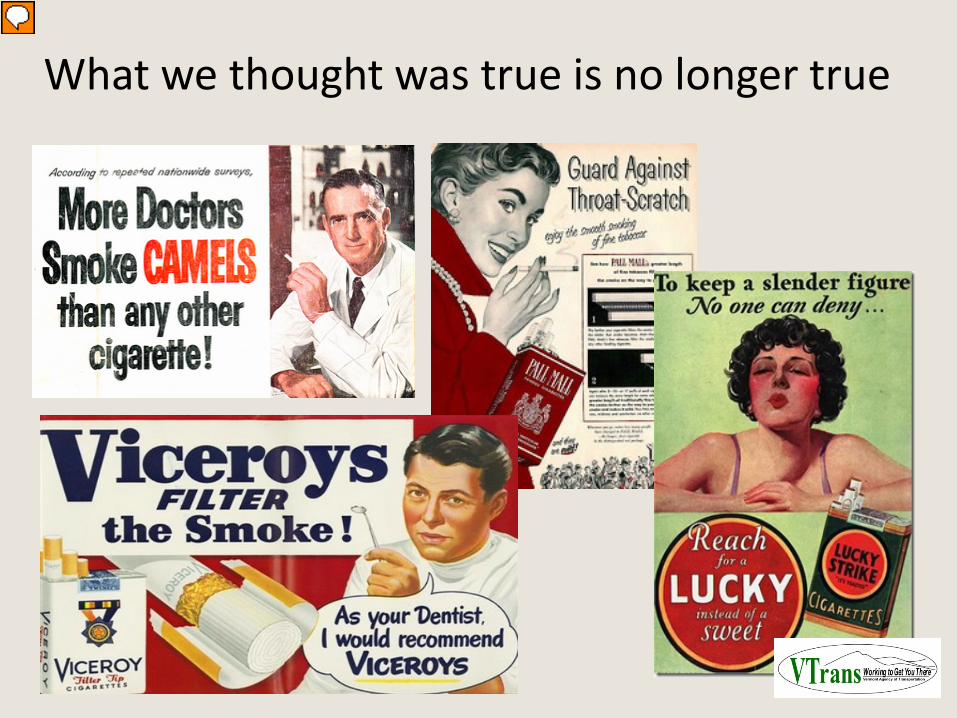
If the VTrans hydraulics engineer, Nick Wark was here he would put up this slide. First of all what we thought was true about rivers and roads is no longer true based on a 10 plus year dialogue Nick and many other engineers have had with the ANR river engineers. The old school approach of channeling, berming and controlling river flow is out. Understanding river dynamics and working with natural processes such allowing rivers room to move is in because results have been shown during flood conditions. Our engineers and operations staff have religion based on direct experience in the field. They have witnessed dollars being saved by less invasive approaches to river management
Presenter
Presentation Notes
We have learned that managing public infrastructure in erodible, hazardous areas such as seen along Mendon Brook and Rt 4 in Rutland County on the left and post Irene on the right requires knowledge of stream dynamics so that conflicts with the channel adjustment processes by transportation infra structure are minimized and stream equilibrium conditions can be achieved.
•
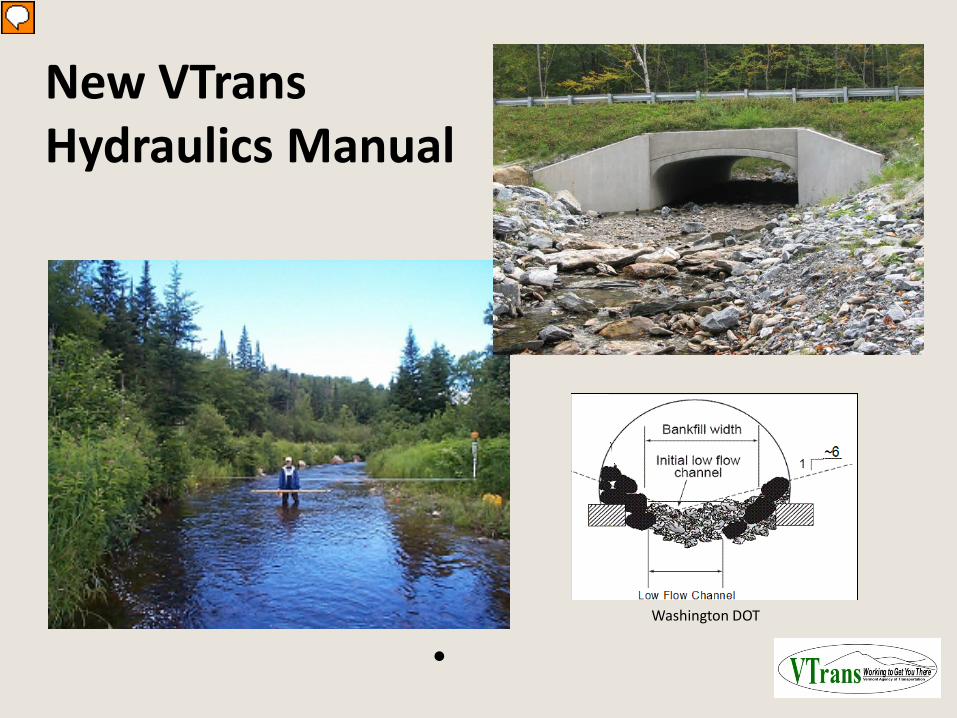
New VTrans Hydraulics Manual
Washington DOT
Presenter
Presentation Notes
This awareness has resulted in a new VTrans hydraulics manual Vermont’s old manual focused on hydraulic capacity of structure (water only). The new manual employs a “river science” approach and consider hydraulic capacity, sediment and debris.� The new manual allows for more risk based design in terms of roadway safety and stream stability. A structure on town road with an ADT of 2000 over a unstable channel will be designed differently than a town road structure with and ADT of 20 over a stable channel.� The new manual parallels language in the latest state stream alteration permit. Thus making the process more clear to people unfamiliar with the design and permitting process (FEMA).
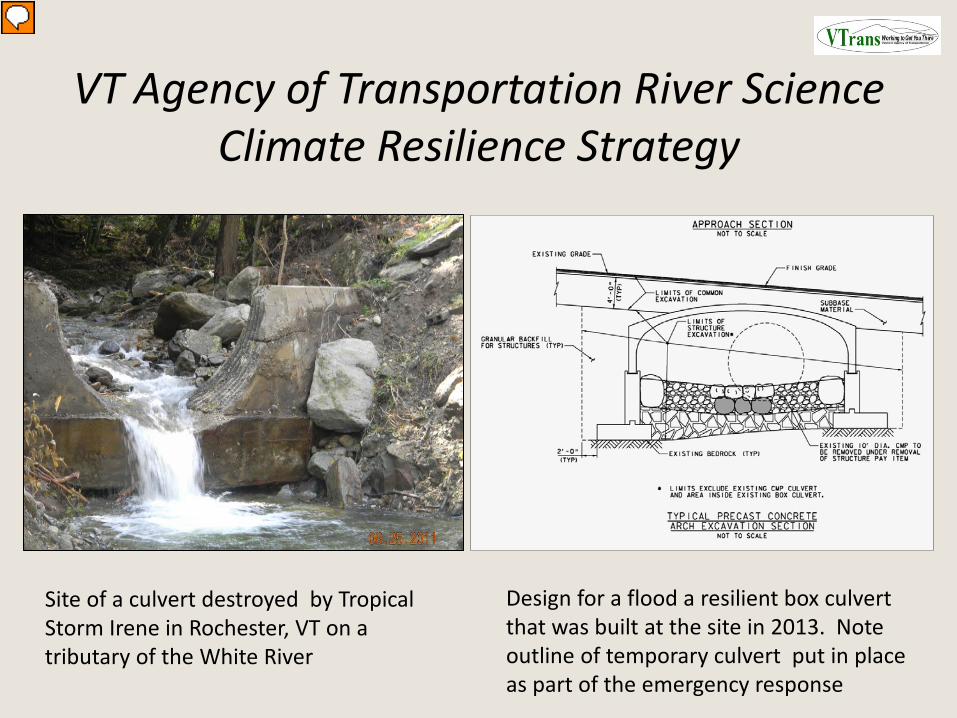
VT Agency of Transportation River Science Climate Resilience Strategy
Design for a flood a resilient box culvert that was built at the site in 2013. Note outline of temporary culvert put in place as part of the emergency response
Site of a culvert destroyed by Tropical Storm Irene in Rochester, VT on a tributary of the White River
Presenter
Presentation Notes
And an example of culvert designs supported by the new manual and required by the VT Stream Alteration Standard. These are the design parameters we follow when we build new and what we aim for in recovery. And we continue to battle FEMA in recognizing this standard in the PA program
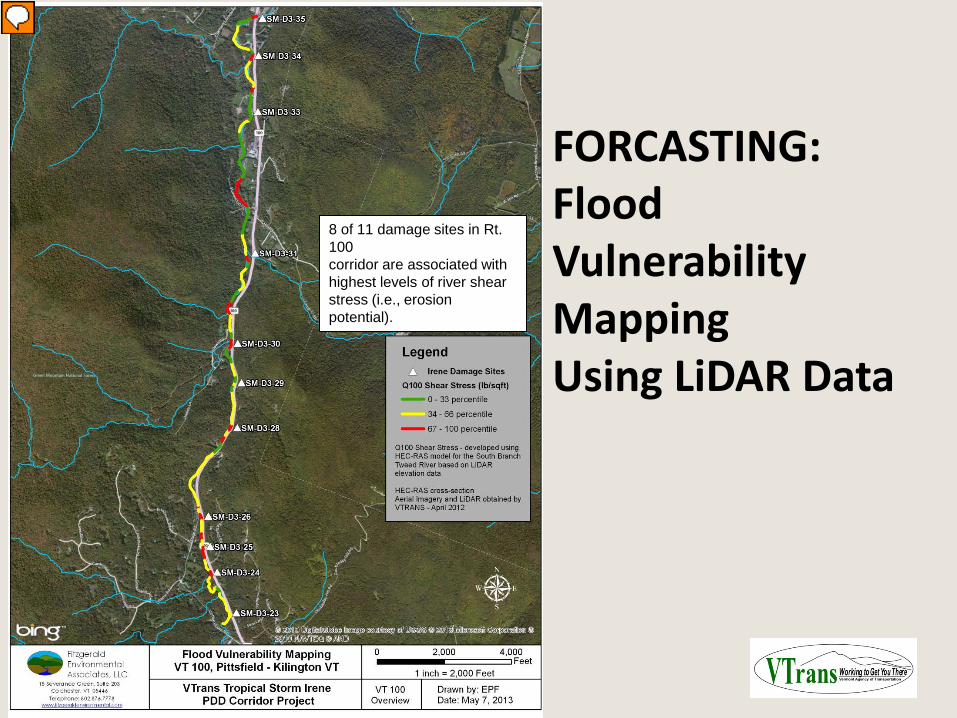
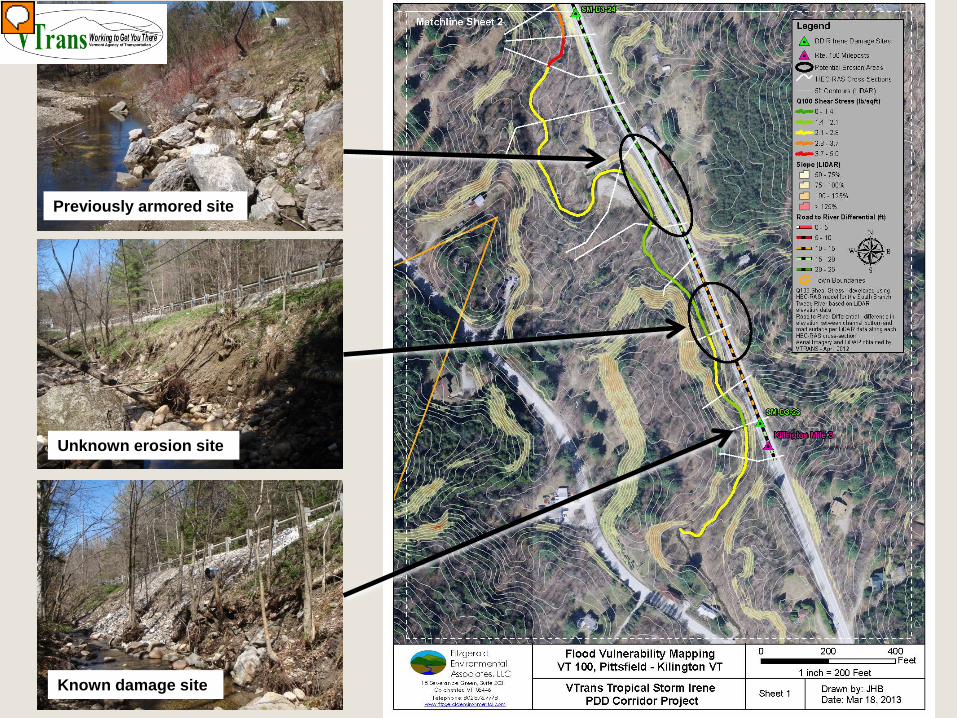
FORCASTING: Flood Vulnerability Mapping Using LiDAR Data
8 of 11 damage sites in Rt. 100 corridor are associated with highest levels of river shear stress (i.e., erosion potential).
Presenter
Presentation Notes
Shift from culverts to roadway slide slopes VTrans applied fluvial erosion science in order to identify vulnerabilities in a corridor level case study along State Rt 100 and the Tweed River in Pittsfield and Killington VT 1. Hydrologic and hydraulic modeling (HEC-RAS) was used quantify river and floodplain erosion potential in areas along the corridor. 2. The modeling results were then applied to detailed LiDAR slope mapping. 3. Areas of roadway susceptible to erosion during flood events were then indicated in red.
Known damage site
Unknown erosion site
Previously armored site
Presenter
Presentation Notes
And here are the results from the field - known damage sites (bottom photo) were indicated by the analysis, unknown erosion sites were revealed, as well as sites that were armored incorrectly and failing. This was very helpful in prioritizing future work along the corridor and is being applied in similar locations were streams with similar characteristics and roadways are in close proximity
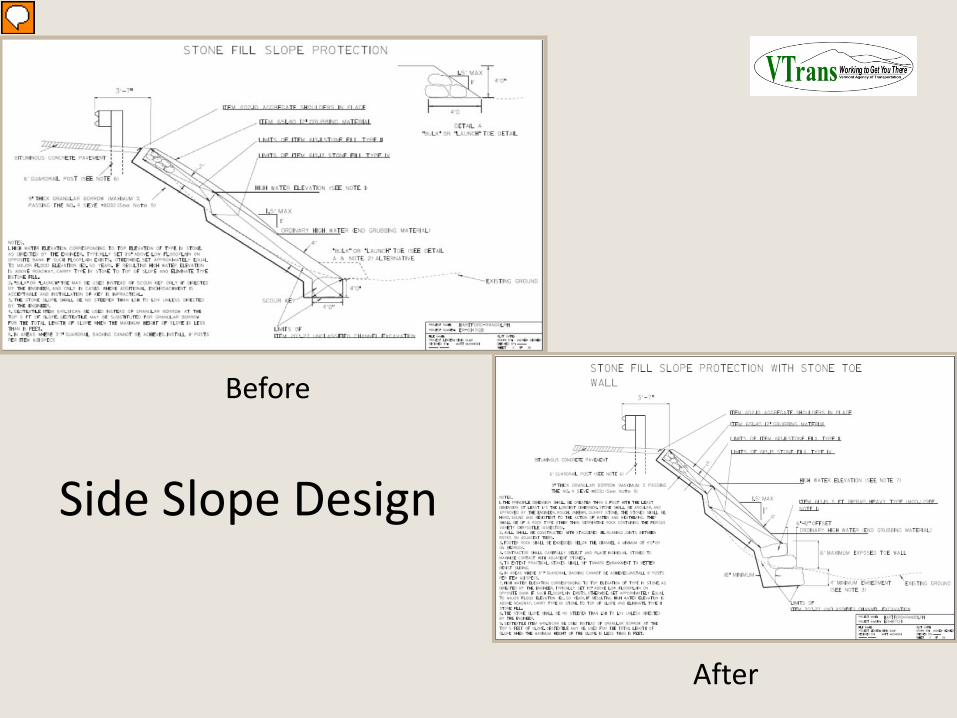
Side Slope Design
Before
After
Presenter
Presentation Notes
As a general rule when operations now goes in to repair side slopes they are much more cognizant of the effects those slopes on a river’s ability to move within the channel New typical sections are on the right In the past they had dumped stone down the slope, lots of time further constricting the river channel. Now they are working backwards. With the help of fluvial geomorphologists we are defining a stable channel dimensions and building the slope to match that as best possible.
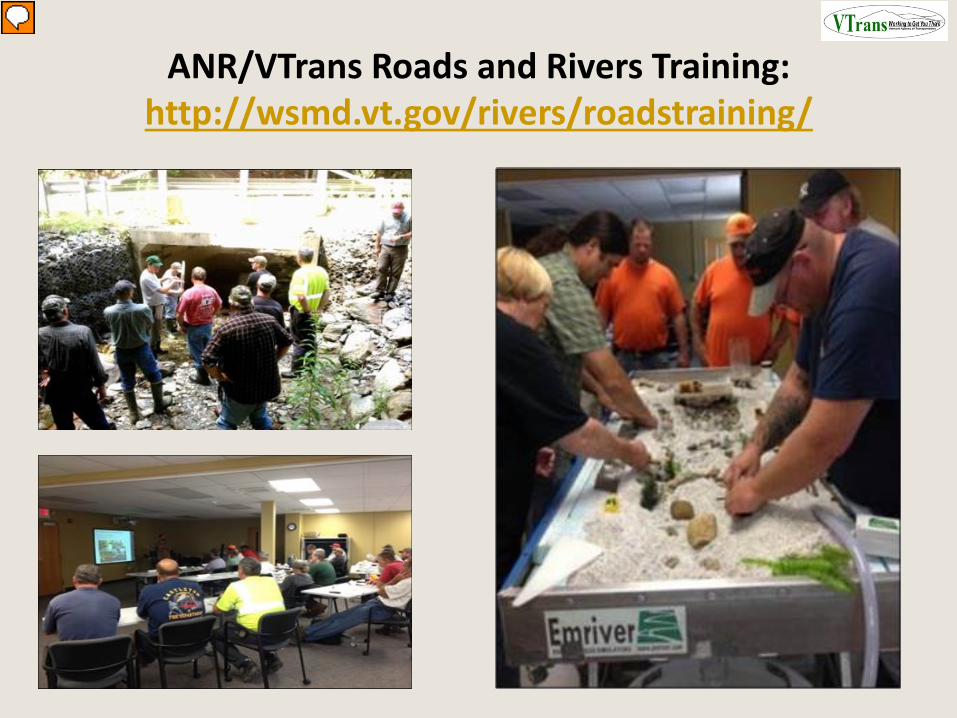
ANR/VTrans Roads and Rivers Training: http://wsmd.vt.gov/rivers/roadstraining/
Presenter
Presentation Notes
River awareness is being spread through a concerted out reach and education effort undertaken through a partnership with the DEC rivers program. All VTrans engineers are taking river science courses developed and taught in partnership with the DEC river engineers, dubbed Rivers and Roads Training. This includes: A level one introductory training (available here: http://wsmd.vt.gov/rivers/roadstraining/) which all engineering and maintenance staff are asked to review. A level two, 3 day training, held at the VTrans Training Center, for primarily operations staff, with a strong field emphasis – seen in the photos. Participants gain knowledge of river processes and conceptualize river smart flood recovery projects. VT Fish and Wildlife Department fisheries biologists also assist with this level. A level 3 training (under development and to be available later this year) that will certify VTrans engineers in the application of and compliance with the DEC’s VT Stream Alteration standards.
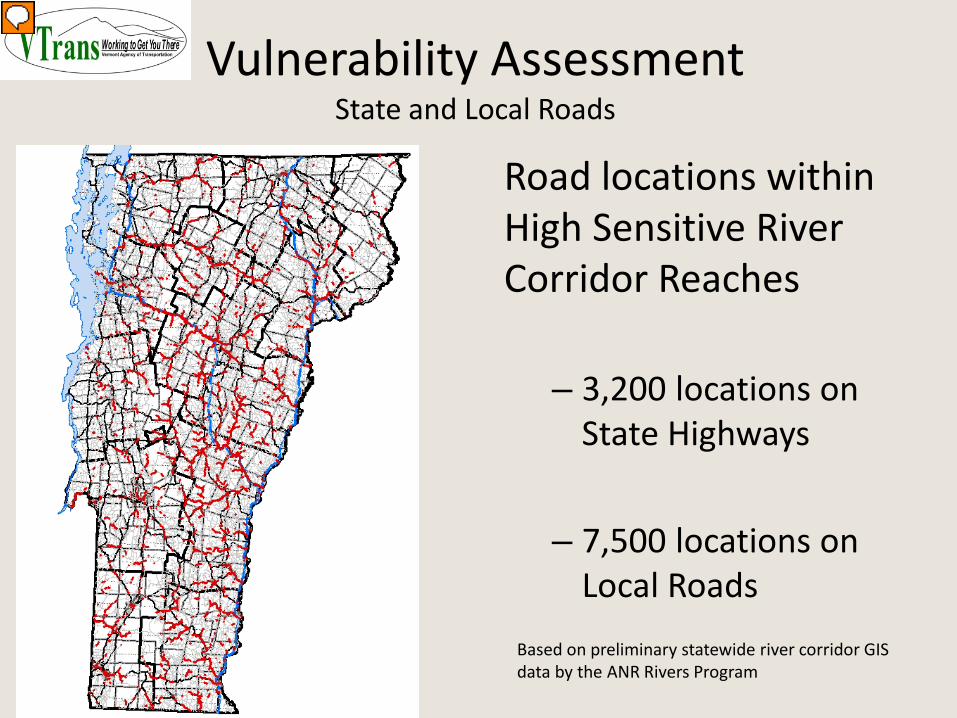
Road locations within High Sensitive River Corridor Reaches
– 3,200 locations on
State Highways
– 7,500 locations on Local Roads
Based on preliminary statewide river corridor GIS data by the ANR Rivers Program
Presenter
Presentation Notes
In the next handful of slides I will show GIS and other data assessment that VTrans has been undertaking in the agency’s efforts to better understand vulnerability and risk from flooding at the statewide level. The agency overlaid the state and municipal roadways with sensitive River Corridors as defined by ANR. These are not only flood plains at risk from inundation but are also areas at risk from fluvial erosion. The total vulnerability is not insignificant. Read slide
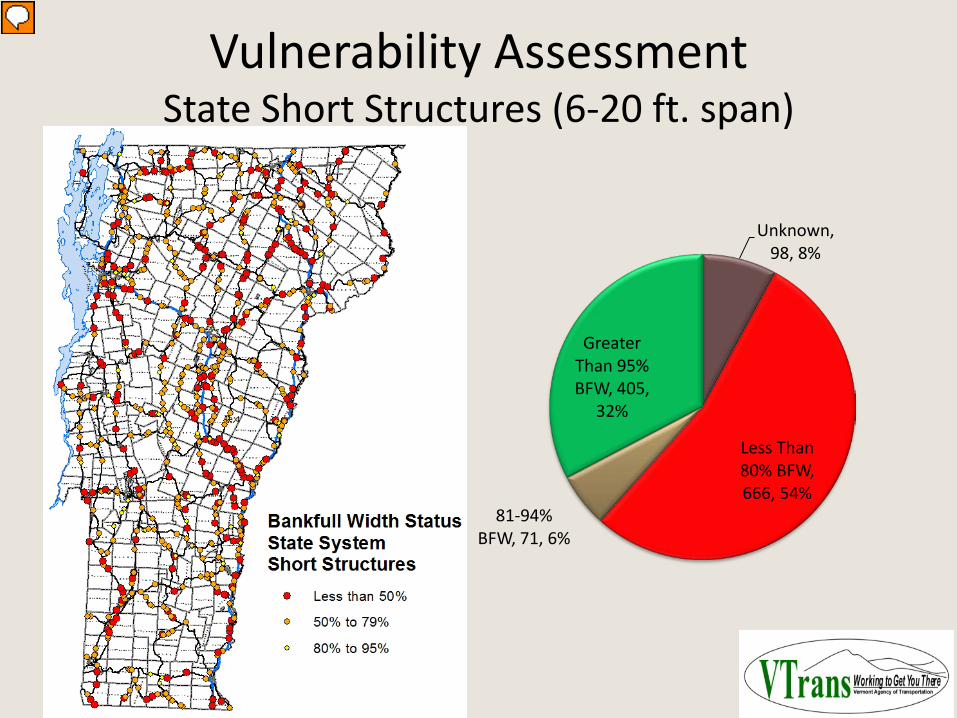
Vulnerability Assessment State Short Structures (6-20 ft. span)
Unknown, 98, 8%
Less Than 80% BFW, 666, 54%
81-94% BFW, 71, 6%
Greater Than 95% BFW, 405,
32%
Presenter
Presentation Notes
One of the state’s regional planning commissions developed a GIS application that considers various watershed and bridge and culvert characteristics and calculates the structures adequacy in meeting what’s considered adequate in accommodating flood flows – Bankful width standard. 60 % are less than 94% below BFW with 54% 80% below. A significant number that merits the agency’s attention. We have also considered the locations of these more vulnerable structures and roadways within the context of AADT and other criticality factors, but we have a long way to go before we can start prioritizing replacements based solely on vulnerability.
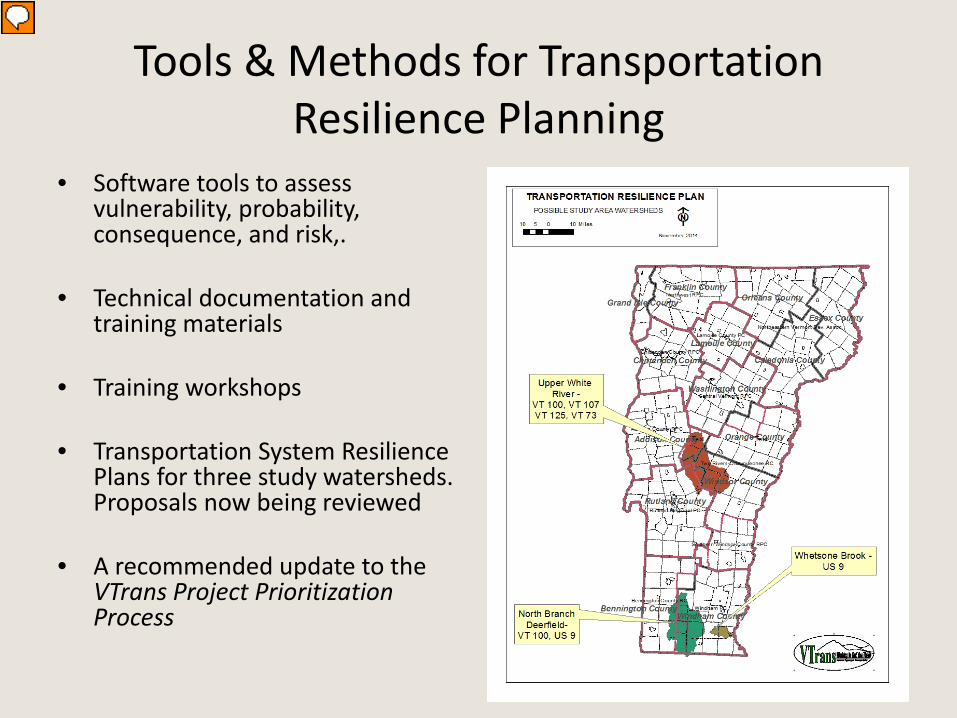
Tools & Methods for Transportation Resilience Planning
• Software tools to assess vulnerability, probability, consequence, and risk,.
• Technical documentation and training materials
• Training workshops
• Transportation System Resilience
Plans for three study watersheds. Proposals now being reviewed
• A recommended update to the VTrans Project Prioritization Process
Presenter
Presentation Notes
So where are we today? We are using basic tools as I just described. We have revised our hydraulics manual and are expanding LiDar coverage inorder to do the type of side slop and other analysis. Through our partnership with the environmental agency we are developing training materials and increasing the number of workshops for our staff. An RFP has been circulated and we are about to choose a consultant for a multi year project that will use 3 study watersheds in order to refine and define methods to establish vulnerability and risk – including methods to establish transportation criticality. In other words with so much vulnerable, can we establish transportation risk based on roadway function and access. And finally from this research we will be recommending an update to our project prioritization process that considers resilience needs just as we consider safety, capacity and economic development today.
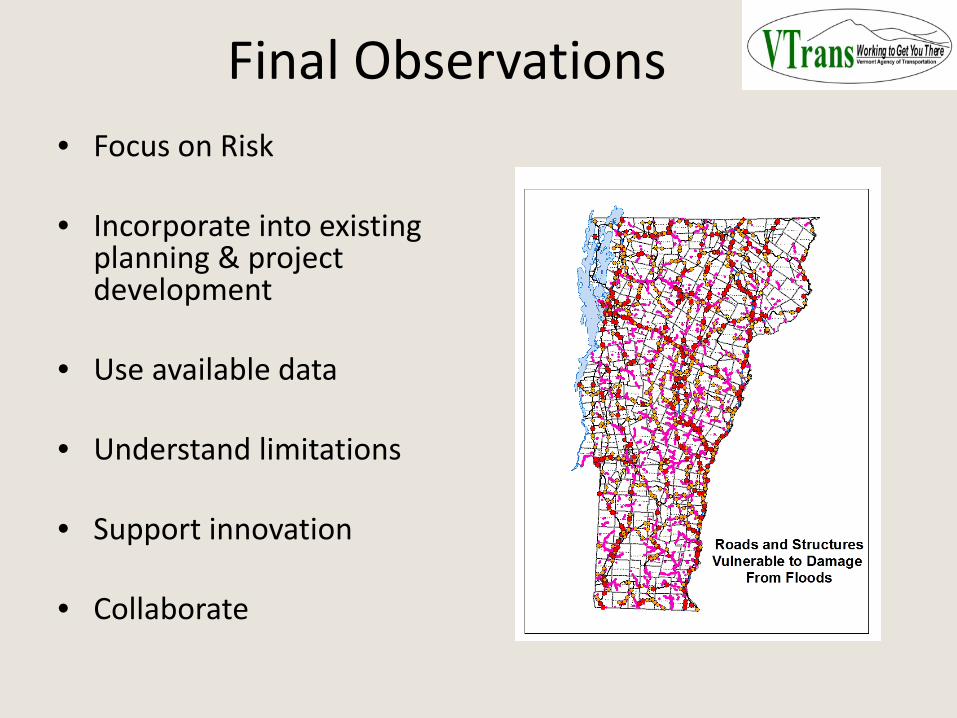
Final Observations • Focus on Risk • Incorporate into existing
planning & project development
• Use available data
• Understand limitations
• Support innovation
• Collaborate
Gina Campoli
VTrans Environmental Policy Manager Vermont Agency of Transportation