64
Climate change science and policy, and some implications for energy Seminar at University of Otago Ralph Chapman, 7 September 2007

Climate change science and policy, and some implications for energySeminar at University of OtagoRalph Chapman, 7 September 2007

Plan (1): I willReview briefly climate change science & policy
The scienceInterpret conclusions of the recent IPCC AR4, especially WG3
Touch on other recent scientific evidence
Source: NASA-GSFC

Policy analysis
I will touch on:Economics, risk and ethics
Implications for scenarios to focus on
Principles for considering policy implications of decarbonisation
Current state of play on NZ climate change policy
The changing international climate policy context
Considerations for NZ energy strategy
Some supporting institutional changes in NZ
Source: NASA-GSFC

1 The science

IPCC AR4 – WG1: physical science

Three key results from WG1
1 It’s real2 We are responsible3 It’s accelerated

Three key results from WG1
1 It’s real: ‘Warming… is unequivocal,…from observations of increases in global average air and ocean temperatures, widespread melting of snow and ice, and rising global average sea level.’
Three key results from WG1
2 We are responsible: ‘The observed widespread warming of the atmosphere and ocean, together with ice mass loss, support the conclusion that it is extremely unlikely that global climate change of the past 50 years can be explained without external forcing, and very likely that it is not due to known natural causes alone.’

Three key results from WG1
3 It’s accelerated: ‘The linear warming trend over the last 50 years … is nearly twice that for the last 100 years.’

The impact of humans: models using natural and anthropogenic forcings, & observations
Natural forcings only
Models with human forcings also
Observations

The impact of humans: locally
Natural forcings only
Models with human forcings also
Observations

Projected surface temps by 2025 & 2095 (above 1990), by scenario

The IPCC: backgroundSet up 1988: scientists wanted to speak out in face of government political interests
Governments still approve the Summaries
Risks: Inevitably cautious in face of political pressuresScientists constrained by pressures exercised by some governmentsNot entirely up to date
But valuable scientific process

Main area of conservatism – WG1
Sea level rise (SLR)Ice melt dynamics not adequately pinned down & quantified – therefore largely omitted
ConsequenceSLR findings misunderstood / deliberately misconstrued Sense of complacency possibly reinforcedUnderestimation of significant coastal damage by 2100 ?Holdren, Rahmstorf, Hansen all worried by SLR
Sea level rise: concerns
Under BAU, ‘a real possibility of rapidly accelerating sea-level rise (2 - 5 m / century??)’ – John Holdren(2007)
‘Our concern that BAU GHG scenarios would cause large sea-level rise this century …differs from estimates of IPCC (2001, 2007), which foresees little or no contribution to twenty-first century sea-level rise from Greenland and Antarctica.
-Hansen et al (May 2007)

Risk of surprises: Larsen ice shelf (Envisat photographs) – the loss of 3,250 km2
[5x area of Lake Taupo] of ice to the Weddell sea (warming at 0.5 degC/ decade).

SLR concerns (2)
‘…the IPCC analyses and projections do not well account for the nonlinear physics of wet ice sheet disintegration, ice streams and eroding ice shelves, nor are they consistent with the palaeoclimate evidence … for the absence of discernable lag between ice sheet forcing and sea-level rise.
- Hansen et al (2007)

Arctic sea ice evidence – greater summer melting

Record and accelerating melt in 2007

‘The best chance for averting ice sheet
disintegration seems to be intense
simultaneous efforts to reduce both CO2 emissions and non-
CO2 climate forcings.’
- Hansen et al (May 2007)

Working Group 2 – Impacts, adaptation & vulnerability• A range of projections, many of major concern• e.g. in relation to ecosystems:
‘The resilience of many ecosystems is likely to be exceeded this century by an unprecedented combination of climate change, associated disturbances (e.g., flooding, drought, wildfire, insects, ocean acidification), and other global change drivers (e.g., land use change, pollution, overexploitation of resources).’ ** [High confidence]
Coasts and flooding
‘Many millions more people are projected to be flooded every year due to sea-level rise by the 2080s. Those densely-populated and low-lying areas where adaptive capacity is relatively low, and which already face other challenges such as tropical storms or local coastal subsidence, are especially at risk… [and] small islands are especially vulnerable.*** [v high conf.](my emphasis added)

IPCC report tweaking - example
Both draft and final versions draw attention to the fact and quantification of acidification of ocean surface water due to increase in concentration of atmospheric CO2. The draft text includes the phrase: "raising concerns for marine calcifying organisms"The phrase is omitted from the final version.
Sinks (e.g. forests) and species
• Over the course of this century, net carbon uptake by terrestrial ecosystems is likely to peak before mid-century and then weaken or even reverse, thus amplifying climate change. **
• Approximately 20-30% of plant and animal species assessed so far are likely to be at increased risk of extinction if increases in global average temperature exceed 1.5-2.5°C (relative to 1990 temps). *
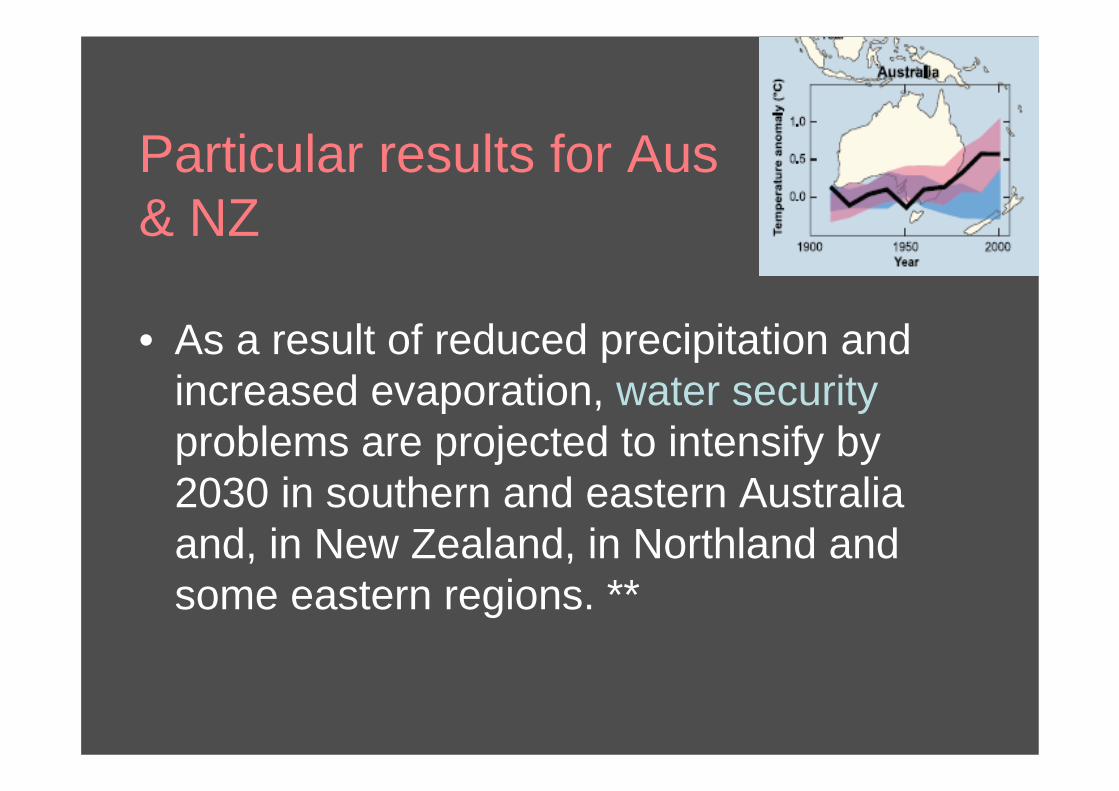
Particular results for Aus& NZ
• As a result of reduced precipitation and increased evaporation, water securityproblems are projected to intensify by 2030 in southern and eastern Australia and, in New Zealand, in Northland and some eastern regions. **

Particular results for Aus& NZ
• Ongoing coastal development and population growth in areas such as …Northland to Bay of Plenty … are projected to exacerbate risks from sea-level rise and increases in the severity and frequency of storms and coastal floodingby 2050. ***

Working Group 3: ResponsesKey results
• Global increase in CO2 emissions of 28% since 1990, and +24% for all GHGs
• Big drivers:• Global income growth +77%• Global population growth +69%
• Energy intensity gains (-33%) overshadowed by income growth

Only weak decoupling of CO2
Source: IPCC
WG3 further key results• Wide range of effective mitigation options -
varying costs • Emission reductions to stabilise CO2e at around
500 ppm would likely cost <3% of GDP in 2030, or <0.1% pa in GDP growth rate
• High co-benefits in some areas provide offsetting savings– E.g. ‘About 30% of projected GHG emissions in the
building sector can be avoided with net economic benefit’
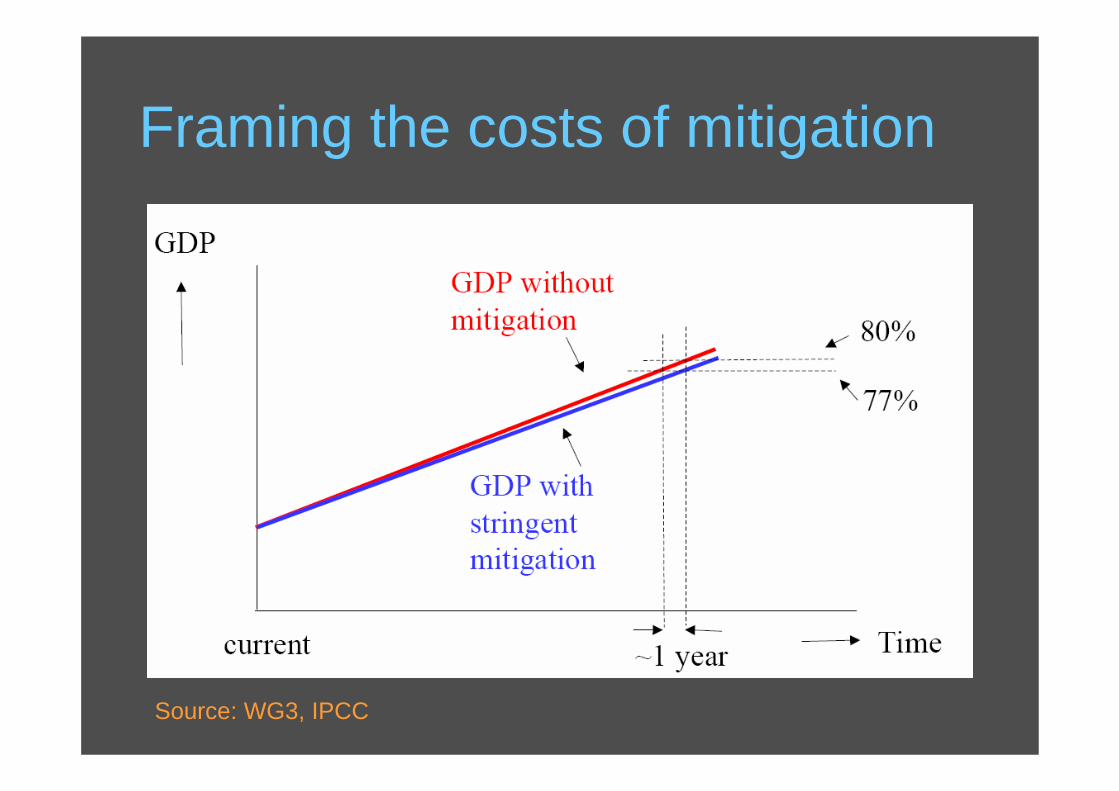
Framing the costs of mitigation
Source: WG3, IPCC

Examples of mitigation technologies currently commercially available
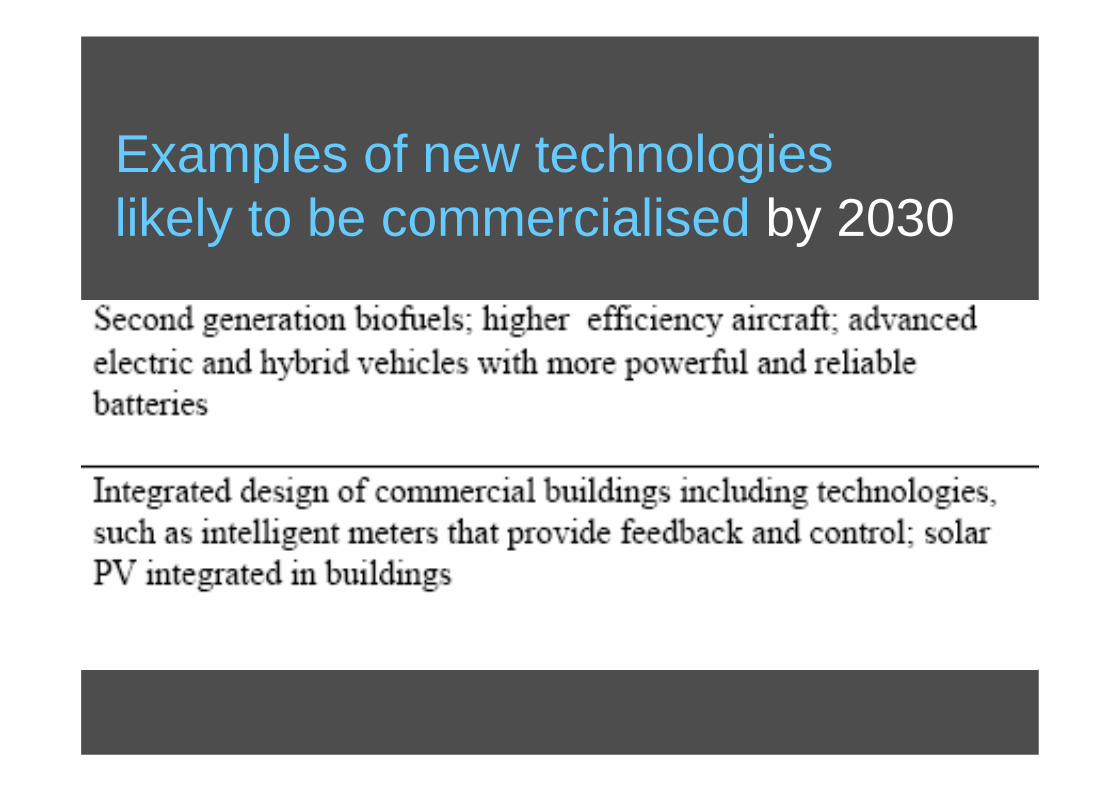
Examples of new technologies likely to be commercialised by 2030
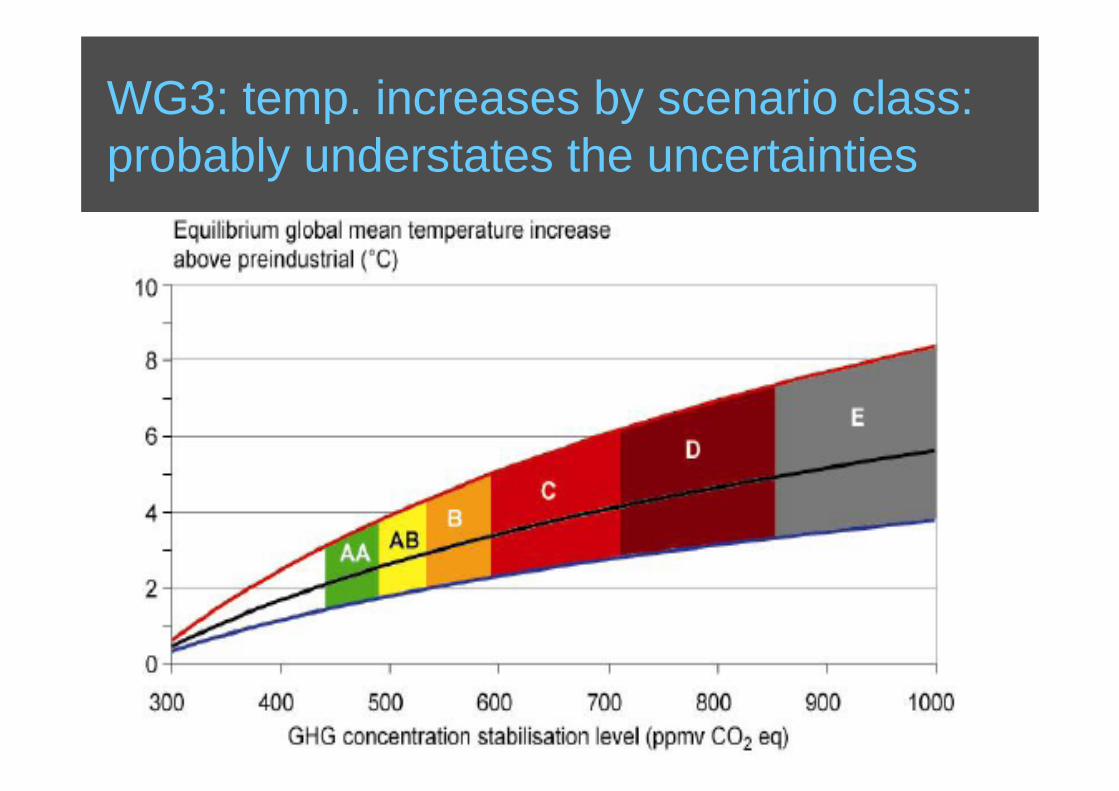
WG3: temp. increases by scenario class: probably understates the uncertainties

Emission paths to stabilisation:for red or brown paths, need to peak emissions by ~2015
Source: Stern Review

2 Policy analysis: evaluating strategies
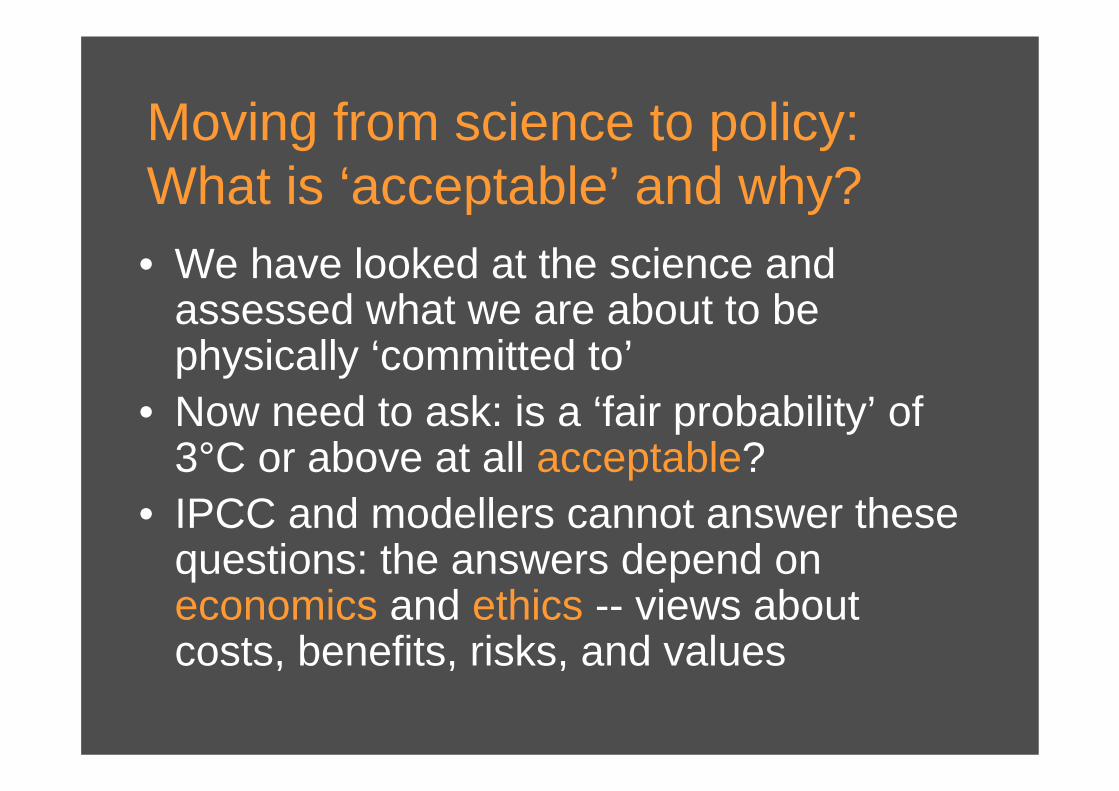
Moving from science to policy: What is ‘acceptable’ and why?• We have looked at the science and
assessed what we are about to be physically ‘committed to’
• Now need to ask: is a ‘fair probability’ of 3°C or above at all acceptable?
• IPCC and modellers cannot answer these questions: the answers depend on economics and ethics -- views about costs, benefits, risks, and values

The economics 1 Common modelling conclusion (see WG3):
Early action substantially reduces costs of acting (mitigation):there is a large procrastination penalty as capital is locked in
2 Hatfield-Dodds:
The costs of acting are small relative to long-term growth in GDP
Public willingness to pay is sensitive to how ‘costs’ are framedMisleading to frame as loss when cost of action simply reduces size of future income gain
Economic costs of acting & not acting
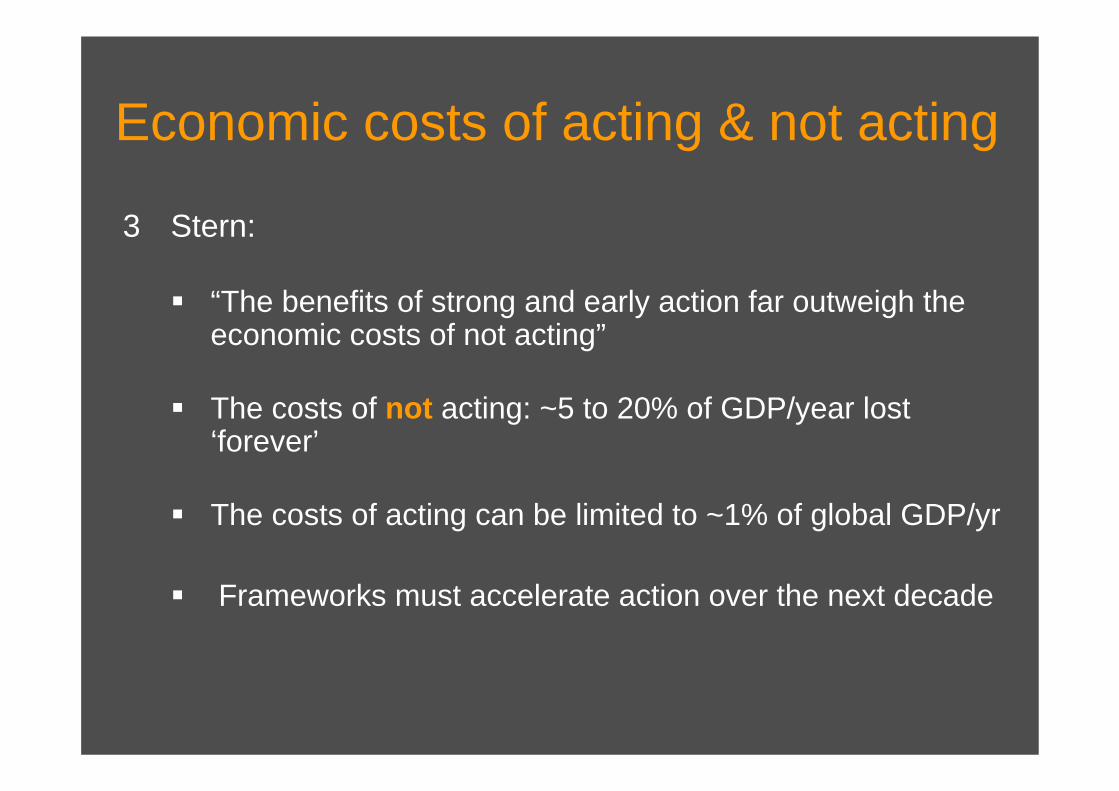
3 Stern:
“The benefits of strong and early action far outweigh the economic costs of not acting”
The costs of not acting: ~5 to 20% of GDP/year lost ‘forever’
The costs of acting can be limited to ~1% of global GDP/yr
Frameworks must accelerate action over the next decade

Risk evaluation: a ‘Swiss Re’ take on climate impacts already visible
…all that, and the globe warmed by less than 1°°C C during the during the whole of whole of the last the last centurycentury
Source: Lash and Source: Lash and Wellington (2007)Wellington (2007)

From economics to risk evaluation, and ethicsEven at 500 ppm, probability of exceeding 3°C is between ~30 and 40% (i.e. not a low probability): should we take this risk?
Given the consequences, it’s a huge risk.
Risk taking at this level may impose large future costs and limit development options of future generations
We move from economics to ethics
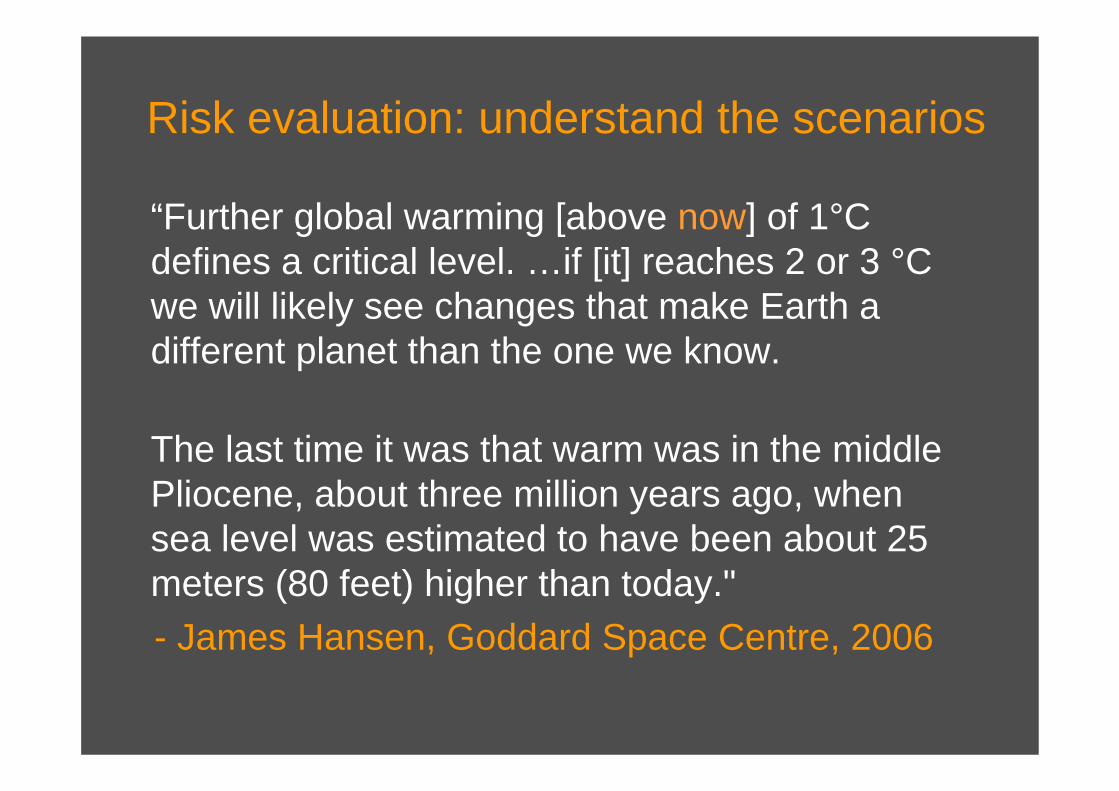
“Further global warming [above now] of 1°C defines a critical level. …if [it] reaches 2 or 3 °C we will likely see changes that make Earth a different planet than the one we know.
The last time it was that warm was in the middle Pliocene, about three million years ago, when sea level was estimated to have been about 25 meters (80 feet) higher than today."- James Hansen, Goddard Space Centre, 2006
Risk evaluation: understand the scenarios
We need to start serious measures to reduce greenhouse gases within the next decade, (and) if we don't do something soon, we're committed to 4 to 6 meters (13 to 20 feet) of sea level rise in the future.
– Jonathan Overpeck, 2006
Risk evaluation: understand the scenarios

Implications for acceptable concentration scenarios: my view

Ethics in action: emissions per capitaby region and by population (IPCC WG3 graph)
Source: IPCC

Ethics includes consideration of future security
• “…we are dangerously behind the curve. We are on a direct path to climate chaos. …The threat we face is to the most basic conditions underpinning our global society.”
– British Foreign Secretary Oct 06
• “...if we don't do anything about climate change… it is simply inconceivable that there will not be a profound and possibly devastating effect on our collective and individual security”
– British Foreign Secretary April 2007

A framework for considering policy implications of decarbonising NZ: 6 propositions
1. Initial impacts of climate change will flow most strongly not from the direct effects of climate change itself, but from policies adopted to decarbonise
2. Implications will depend strongly on the nature of policies adopted, including revenue recycling
3. Implications will be influenced by foresight exercised in central and local government policy; & private sector & individual repositioning
Source: Chapman and Boston (2007)

Illustrating Proposition 3 (Foresight matters)Leadership and pro-activity are central
International context moving rapidly; investors and others intensifying scrutiny (upsides, downsides)
Opportunity: climate change and new energy will create the “mother of all markets”
- John Doerr, venture capitalist
Capitalising on NZ’s clean, green, innovative reputation through strategic positioning can, for example, help attract and retain talented people
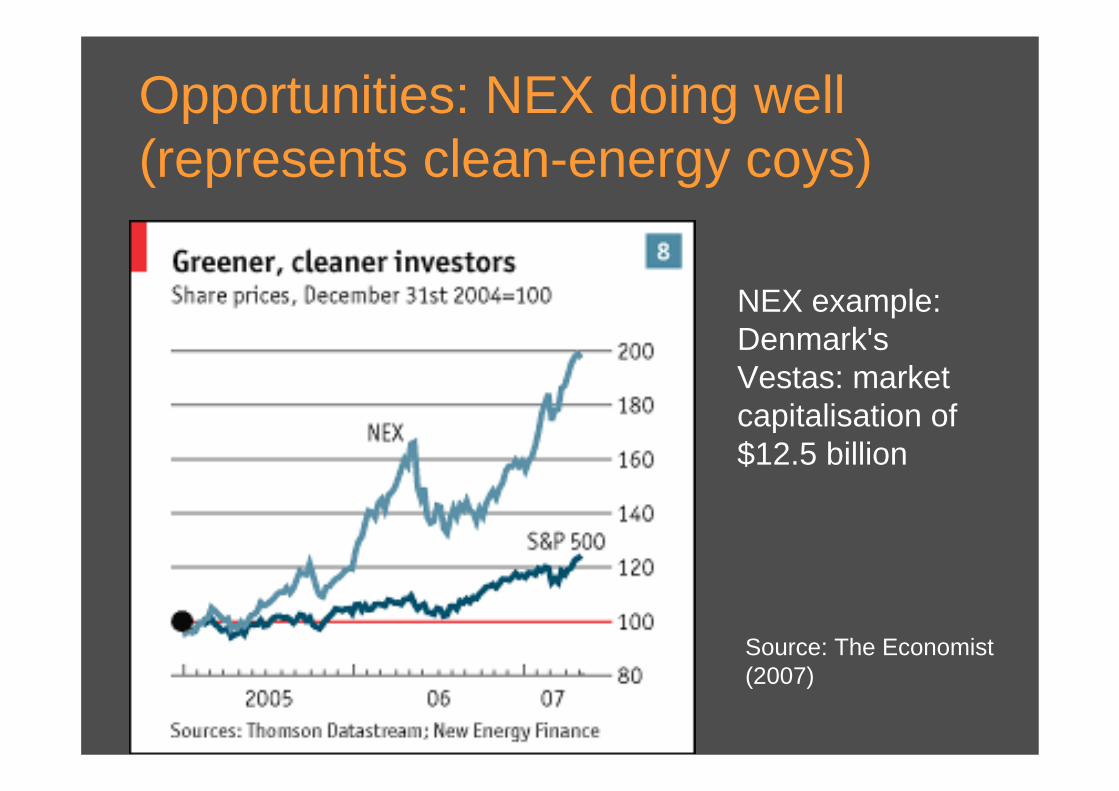
Opportunities: NEX doing well (represents clean-energy coys)
Source: The Economist (2007)
NEX example: Denmark's Vestas: market capitalisation of $12.5 billion
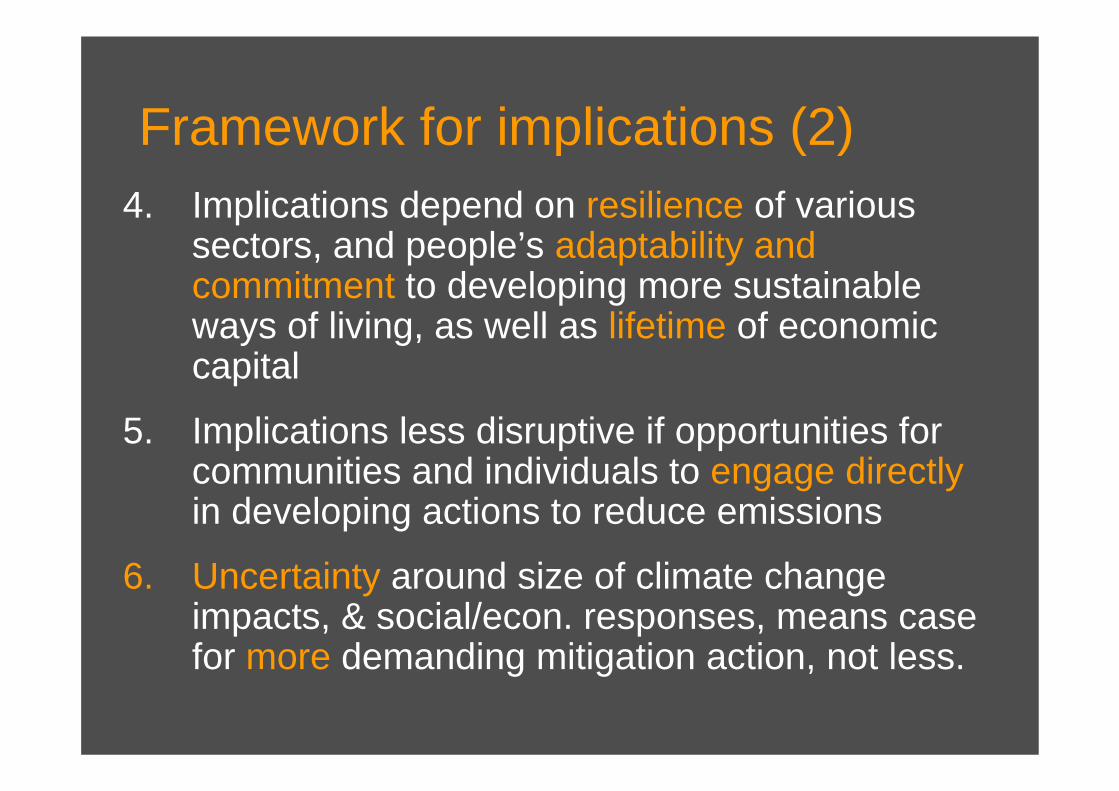
Framework for implications (2)4. Implications depend on resilience of various
sectors, and people’s adaptability and commitment to developing more sustainable ways of living, as well as lifetime of economic capital
5. Implications less disruptive if opportunities for communities and individuals to engage directlyin developing actions to reduce emissions
6. Uncertainty around size of climate change impacts, & social/econ. responses, means case for more demanding mitigation action, not less.

Summary thus far To avoid signif. risk of ‘catastrophic’ changes, we need to stabilise CO2e levels under 500 ppm; preferably closer to 450 ppm
Requires global emission cuts of ~80% from 2005 levels; the sooner we start the less painful the adjustment
“We have at most 10 years — not 10 years to decide upon action, but 10 years to alter fundamentally the trajectory of global greenhouse emissions” - Hansen
Path dependence and big lags in global and local policy systems, energy/transport systems, etc.
But major business / economic opportunities, especially in the energy area

The global policy context
Inertia in global economy, social patternsPushing developing countries to cut emissions a big ask, given distribution of responsibilities for past emissions (next slide)
Cutting developed country emissions 90% is ~ comparable to developing country cuts of around 10%But need Kyoto-style flexibility mechanisms (e.g. CDM)
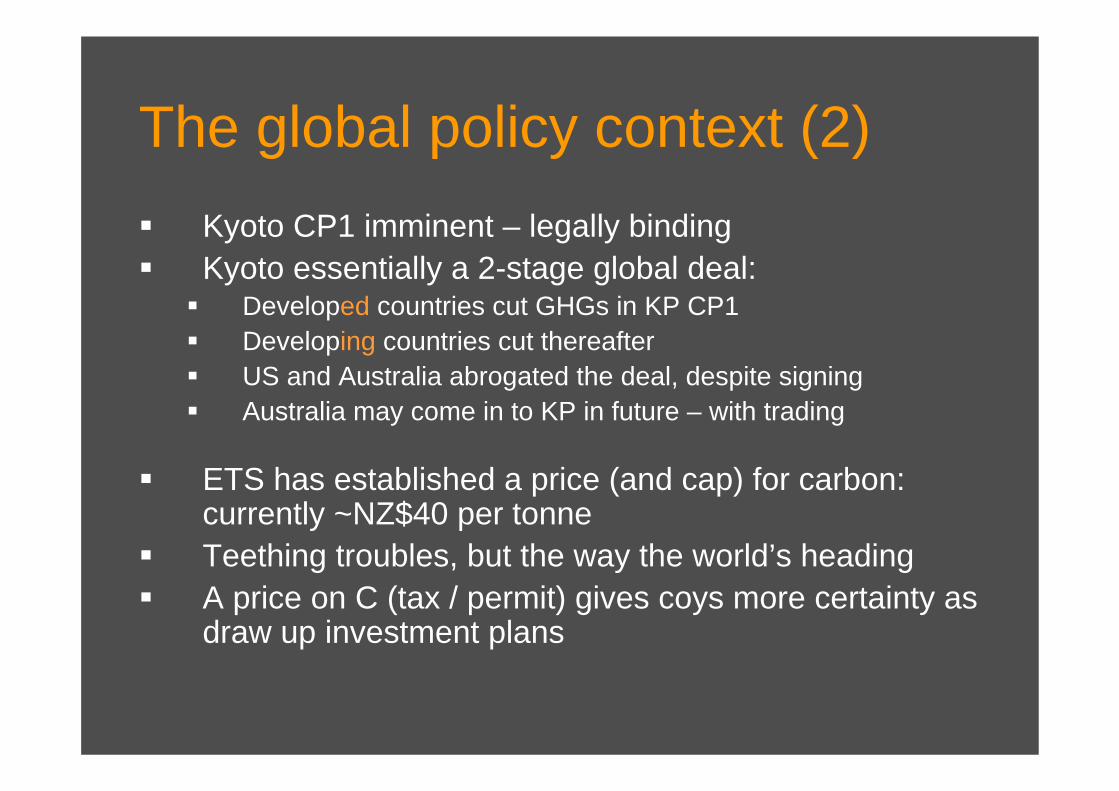
The global policy context (2)Kyoto CP1 imminent – legally bindingKyoto essentially a 2-stage global deal:
Developed countries cut GHGs in KP CP1Developing countries cut thereafterUS and Australia abrogated the deal, despite signingAustralia may come in to KP in future – with trading
ETS has established a price (and cap) for carbon: currently ~NZ$40 per tonneTeething troubles, but the way the world’s headingA price on C (tax / permit) gives coys more certainty as draw up investment plans

A post 2012 agreement
• US has now agreed to be “in” the UN process (G8 summit)Next global agreement likely to require 20-30% cuts by 2020 (v. early 2000s levels)Some sectoral agreements e.g. cement?‘No lose’ commitments for developing countries?Positions of China et al critical: will be influenced by what developed nations do

NZ policy implicationsSticking to our treaty obligations important for NZ ‘brand’It matters what we signal re targets and actionmeasures Unclear that it’s harder for NZ to cut emissions than other countries
New Zealand can: Commit to elect’y generation ~100% zero-C by 2030Cut agricultural emissions, with incentives in place e.g. for N reduction – no case for ‘shielding’Plan for rapid biological capture of atmospheric carbon

NZ policy implications (2)
Wise to think ahead so that we can adjust more gradually – lowers costsWise longer-term working target: cuts of 80 - 90% by 2050In medium term, ~25% by 2020 (cf. EU)Need interim steps & specific measures –e.g. emitters having to buy permits from Kyoto market

NZ policy implications - energy specifically
Peak oil: not “if” but “when” – an additional strong reason for cutting fossil energy useClimate change and fossil energy availability together compelling case for an energy transitionEuropean transition thinking provides useful model: “system innovation”Government steering, but strong role for marketsAlways keep energy policy within SD frame

Integrated thinking example: transport, urban design and energy
Will have to adapt more rapidly than comfortable: 35% BAU growth in transport emissions to 2030 unacceptable
Biofuels, plug-in hybrids, fuel efficiency regulation all help
But have to also focus on next ‘level’ -- traffic generation
Firmer strategies for urban growth nodes to avoid sprawl
Requires mix of price signals, land use regulation, redirection of investment away from motorway building

Case study: food and shopping energy use (UK)
• Externalities: ~12% on top of cost of typical UK food basket
• Most externalities of food transport from energy use (CO2)
• On £25 food basket cost, externalities (excl. subsidies) add £1.98 (UK estimate):– Domestic road transport £0.76 – Shop to home transport £0.41– Farm production externalities £0.81– International transport neglig.
Source: Pretty et al, 2005

Case study: food and shopping energy use (2)
• So road transport externalities add to £1.17 or 60% of the environmental externalities of UK food
• Delivery of food from supermarkets could cut shop-to-home transport by as much as 70% (Monbiot) or, realistically, 30%?
• Yet to see a comparable NZ study

Local opportunities for low-cost action
• Insulate houses and buildings• Improve efficiency & sustainability of heating systems• Green energy• Walking and cycling• Reshape cities to reduce the need for car travel, e.g TOD• Use and support public transport• Minimise flying• Phase out motorway building • In short, our houses, buildings, transport & energy
systems, cities and our ways of life can be more sustainable

Energy transition planning• Aim for system innovation e.g. in building
energy, transport energy, renewables• Invest in quantifying and valuing the co-benefits
with ‘action’ research– e.g. housing and health studies (UOO – Wellington)
• Accelerate RD&D into energy measures with wide sustainability paybacks [over]
• Experiment now – e.g. marine energy, sewage algae for biofuel
• Hope to see strategy in NZES this Oct/Nov

Insulation has a very low ‘full cost’ of carbon abatement
Source: Vattenfall, via The Economist
If not NZ, who? NZ is comparatively wealthy
A clean, green brand and an aspiration to lead the world in terms of sustainability
For example, we can increase renewables significantly
Not (yet) struggling with the early impacts of climate change
Have a population that understands and supports action, especially if sees market opportunities
Supporting institutional changes needed in NZ
• Transform Treasury into a Ministry of Sustainable Development
• Strengthen strategic capacity, widen brief• Take climate change lead from MfE to Treasury• Engage whole of government in transition
strategy on energy (MED-led)• Ensure regional and local authorities, business
and civil society fully engaged with energy transition


