54
Climate Change & the B ilt Built Environment Environment

Climate Change& the B iltBuilt EnvironmentEnvironment

W t 385
Earth’s Surface Temperature
We are at 385 ppm +10.5°F 6°C
I i t
We will reach 450 ppm in 2035
Increasing at +2.5 ppmannually
+2.7°F 1.8°C
y
At 450 ppm CO2 “we will trigger potentially irreversible glacialirreversible glacial melt & sea level rise out of humanity’s
t l”
Source: UN Intergovernmental Panel on Climate Change (IPCC)
control”
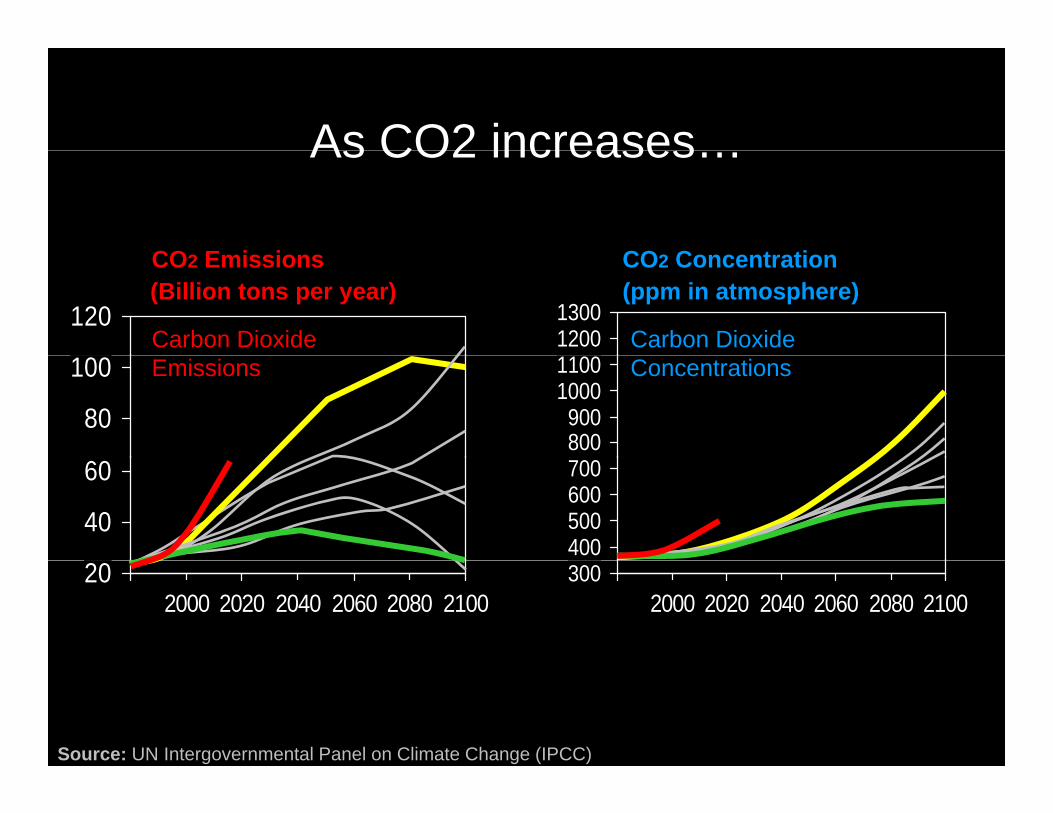
As CO2 increasesAs CO2 increases…
CO C t tiCO E i i
12001300120
Carbon Dioxide Carbon Dioxide
(Billion tons per year) (ppm in atmosphere)CO2 ConcentrationCO2 Emissions
800900
10001100
80
100 ConcentrationsEmissions
400500600700
40
60
3002000 2020 2040 2060 2080 2100
202000 2020 2040 2060 2080 2100
Source: UN Intergovernmental Panel on Climate Change (IPCC)

Temperature & sea-level riseTemperature & sea level rise…Greenland 5m
56
Temperature Change CO
Sea Level Rise meters (m)
1
345
0.6
0.8
012
0
0.2
0.4
02000 2020 2040 2060 2080 2100
02000 2020 2040 2060 2080 2100
Source: UN Intergovernmental Panel on Climate Change (IPCC)

… threatening the ocean conveyor belt
Source: UN Intergovernmental Panel on Climate Change (IPCC)

… threatening the ocean conveyor belt
Source: UN Intergovernmental Panel on Climate Change (IPCC)

U.S. Energy Consumption
120
140
u) 70480
100
120
tu (Q
Btu
+34% 704
CFPPs now
60
80
rillio
n B
t
34 QBtu
20
40
Qua
dr +237CFPPs
01950 1960 1970 1980 1990 2000 2010 2020 2030
Sources: Architecture 2030, U.S. Energy Information Agency & CalStar analysis
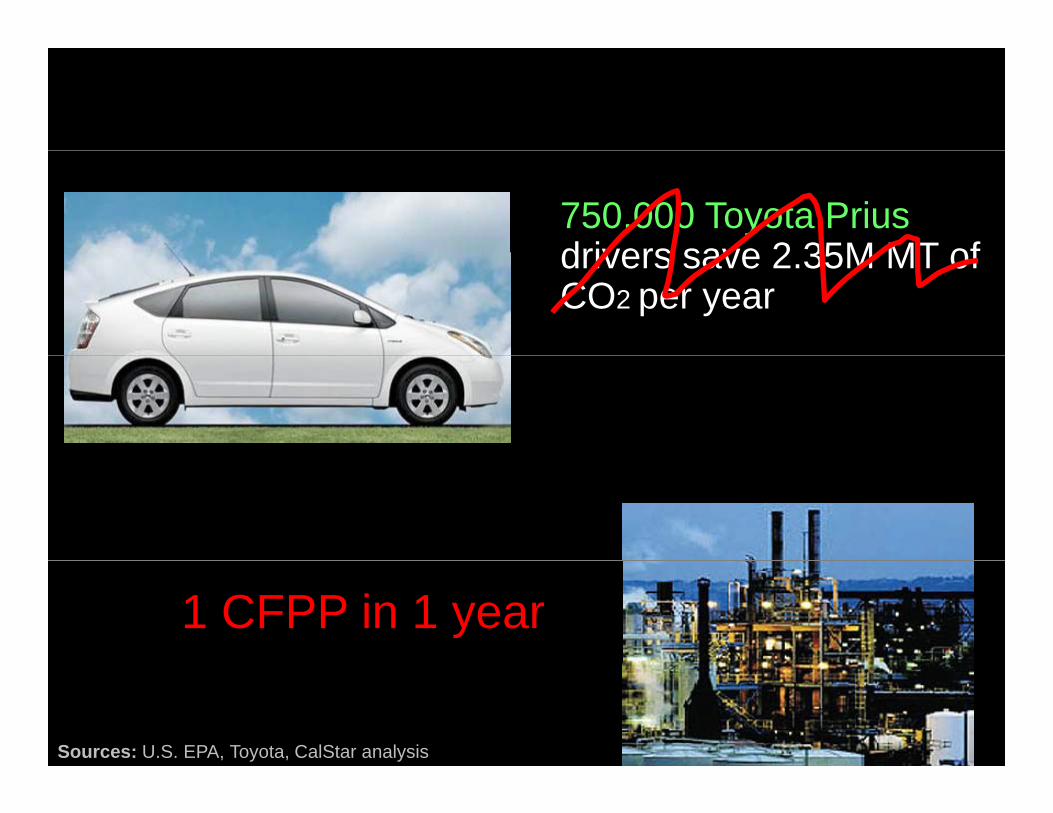
750,000 Toyota Prius drivers save 2 35M MT ofdrivers save 2.35M MT of CO2 per year
1 CFPP in 1 year
Sources: U.S. EPA, Toyota, CalStar analysis

Regional Greenhouse Gas Initiative NY, ME, VT, NH, , , , ,MA, CT, RI, PA , NJ, DE, MDreducing CO2 emissions to 1990 levels by 20141990 levels by 2014... .
13 CFPPs in 1 year
Source: Architecture 2030

Wal-Mart investing $500M in 7 years to reduce energy &7 years to reduce energy & CO2 by 20%
1 CFPP in 1 month
Source: Architecture 2030

Home Depot planting 300 000 trees to absorb300,000 trees to absorb CO2…
1 CFPP in 10 days
Source: Architecture 2030

World Energy Demand
600
700
u) 3682400
500
600
tu (Q
Btu
+62% 3682
CFPPs now
300
400
rillio
n B
t
276 QBtu
100
200
Qua
dr +2320CFPPs
01980 1990 2000 2010 2020 2030
Sources: Architecture 2030, U.S. Energy Information Agency & CalStar analysis

toast manna

“Climate Change isClimate Change is the single largest opportunity for thisopportunity for this country since the mobilization formobilization for World War II.”
USGBC GreenBuild Nov. 20072007

Agreed: We Must MitigateAgreed: We Must Mitigate
7280
CO2 emission (Billion tons CO2)
Global temperature change (°C)
67
4048566472
3456
08
162432
0123
02000 2050 2100 2150 2200 2250 2300
02000 2050 2100 2150 2200 2250 2300
Source: UN Intergovernmental Panel on Climate Change (IPCC)

$1+ Trillion/Year Needed
1800
$1+ Trillion/Year Needed
+2°C
140016001800
llars
80010001200
s of
Do
+3°C$1T
200400600
Bill
ion
+6°C+4°C
0200
750 ppm 650 ppm 550 ppm 450 ppm
Source: UN Intergovernmental Panel on Climate Change (IPCC)
CO2

Green is the New Red, White & BlueAlcan Alcoa
American International GroupAmerican International Group Boston Scientific Corporation
BP America Caterpillar
Chrysler ConocoPhillipsConocoPhillips
Deere & Company Dow Chemical
Duke EnergyDuke Energy DuPont
Environmental Defense Exelon Corporation
Ford Motor Company FPL Group,Source: USCAP © Tom Friedman

The Built Environment
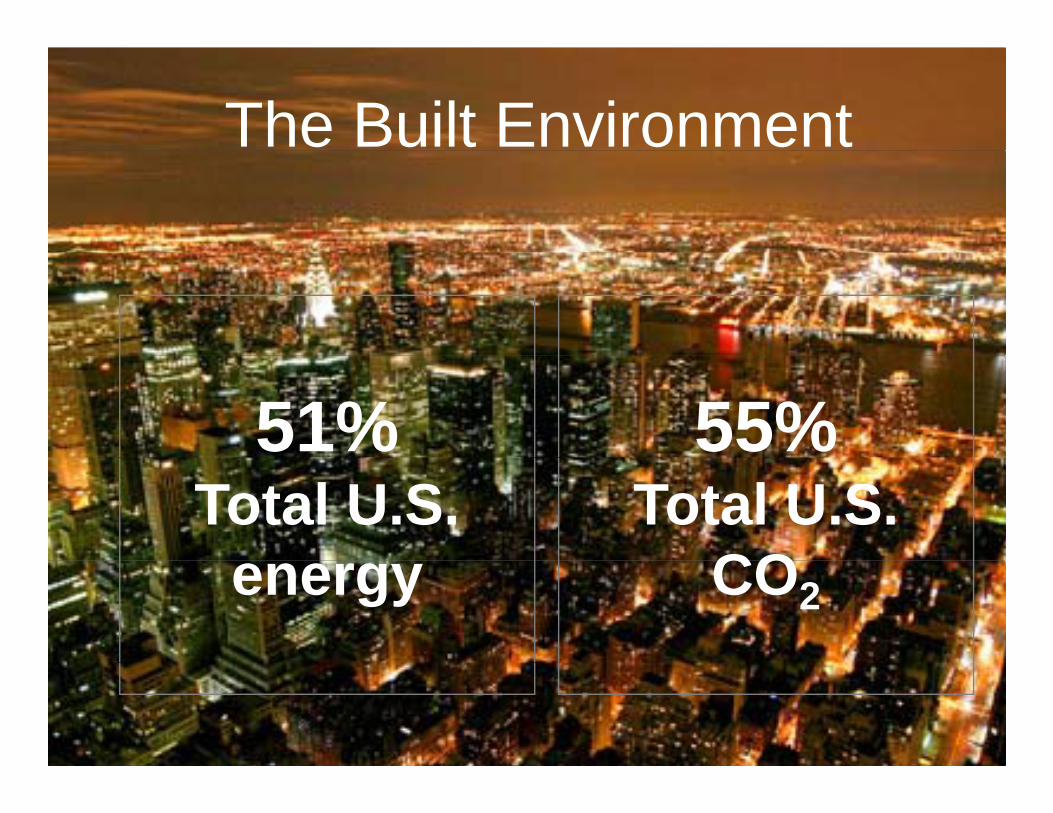
The Built Environment
51% 55%Total U.S. Total U.S.
COenergy CO2

U.S. Energy Demand
51%51%
27%
B ilt E i t I d tT t22%
Source: EIA, CalStar analysis
Built Environment IndustryTransport

U.S. Energy
Built Environment 51%
Residential22%
Commercial 17%
Operations 39%
22% 17%
Buildings InfraInfra
Source: EIA, CalStar analysis
Materials 12%g
9% 3%3%

Half of USA Electricity from Coal
Building Operations 76% ofBuilding Operations 76% ofBuilding Operations 76% of Building Operations 76% of USA electricityUSA electricity
Industrial Industrial 23%23%23%23%
Source: Freedonia Group, “World Cement to 2010” (2006) Transportation 1%

The Problem
Food &Food & Water 19%
Light 18%
Heat & CoolCool 38%
Appliances 13%
Other 12% 13%12%
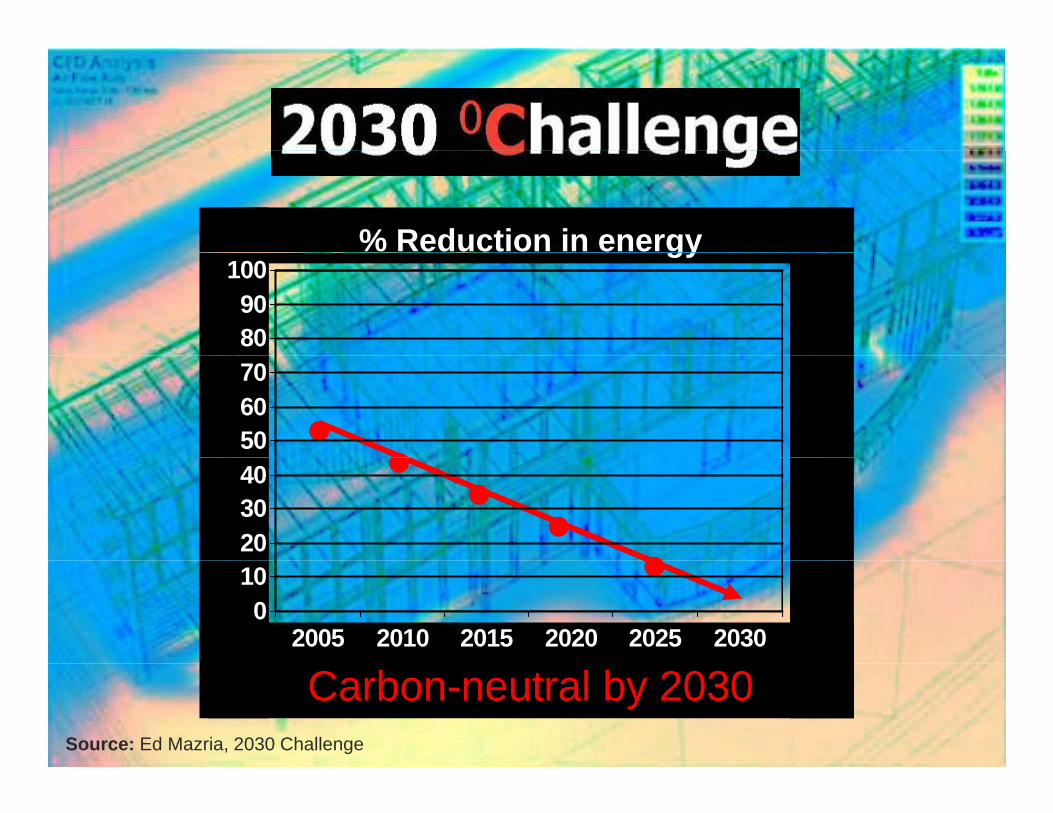
% Reduction in energygy
8090
100
506070
203040
010
2005 2010 2015 2020 2025 2030
Source: Ed Mazria, 2030 Challenge
Carbon-neutral by 2030

Turnover 75% by 2035
Build new
150B f2035
400Bn sf
R d lDemolish50Bn sf
150Bn sf
2005 300Bn sf
400Bn sf
Remodel150Bn sf
50Bn sf
75%
U.S. Building Inventory
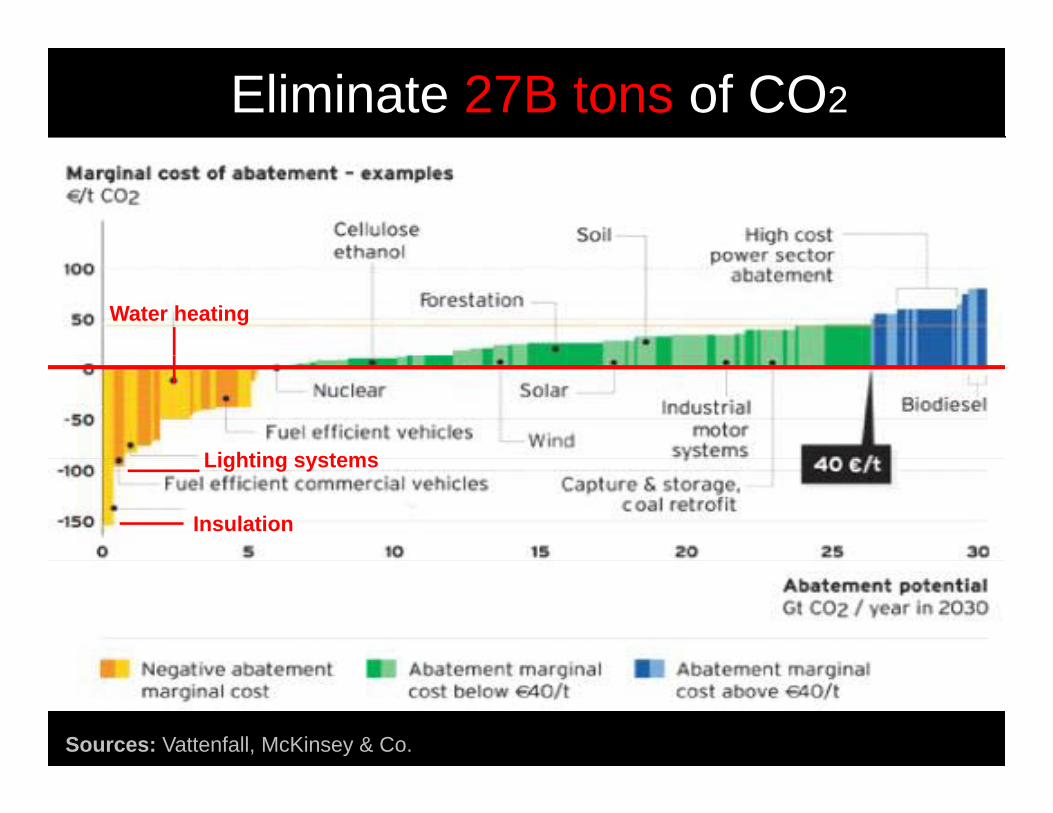
Eliminate 27B tons of CO2
Water heating
Lighting systemsLighting systems
Insulation
Sources: Vattenfall, McKinsey & Co.

4B tons of CO2, negative cost
€/t CO2
Cum Gt CO2 eliminated
W t
€/t CO2
Windows A/CLighting
Water heater
Building envelope
AppliancesA/CWashers/
dryers
…green building materials & technologiesNew-build insulation
Sources: Vattenfall, McKinsey & Co.


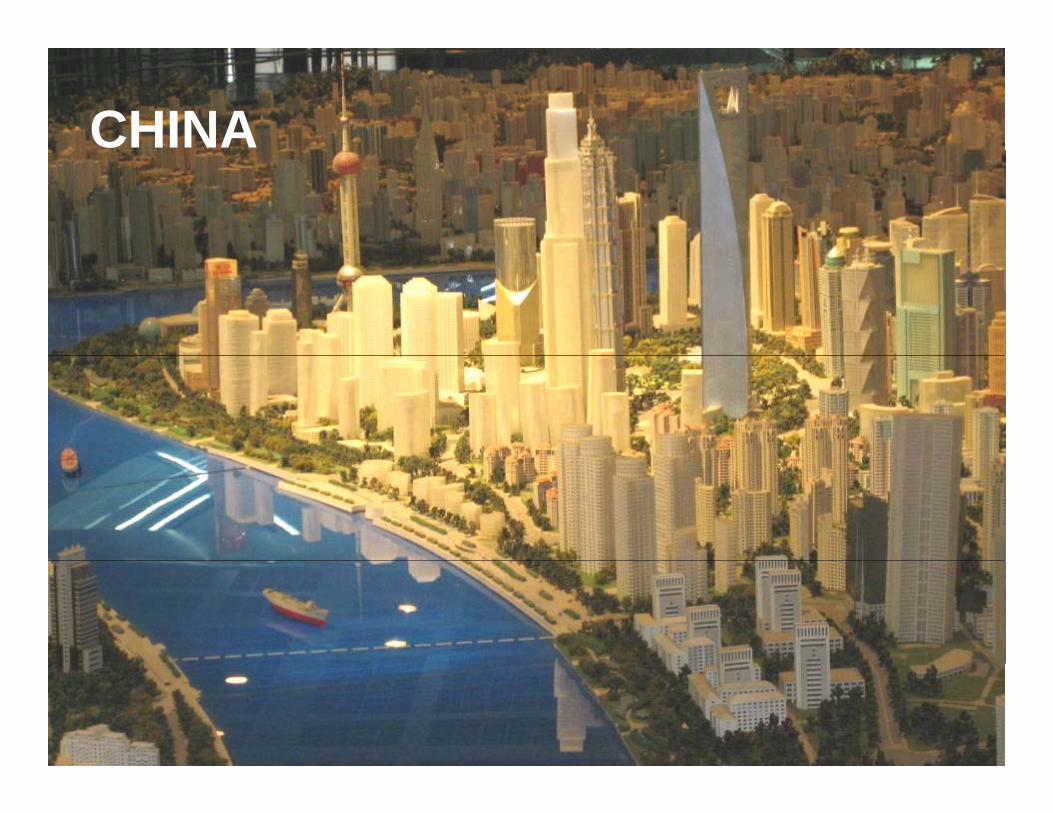
CHINA
350 illi350 million urbanizingb 2030by 2030
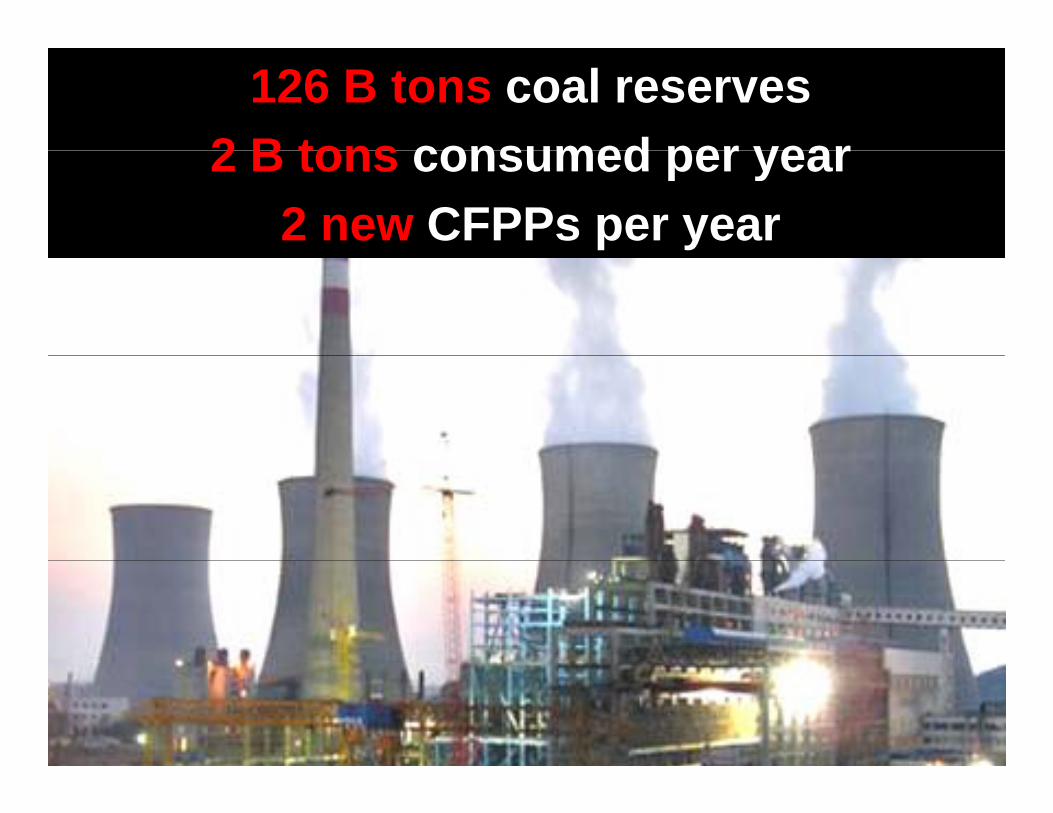
126 B tons coal reserves2 B tons consumed per year2 B tons consumed per year
2 new CFPPs per year

Harmonious Society20302030
20th Energycenturypath
gyefficientpathpath path

USA
CHINA

INDIA
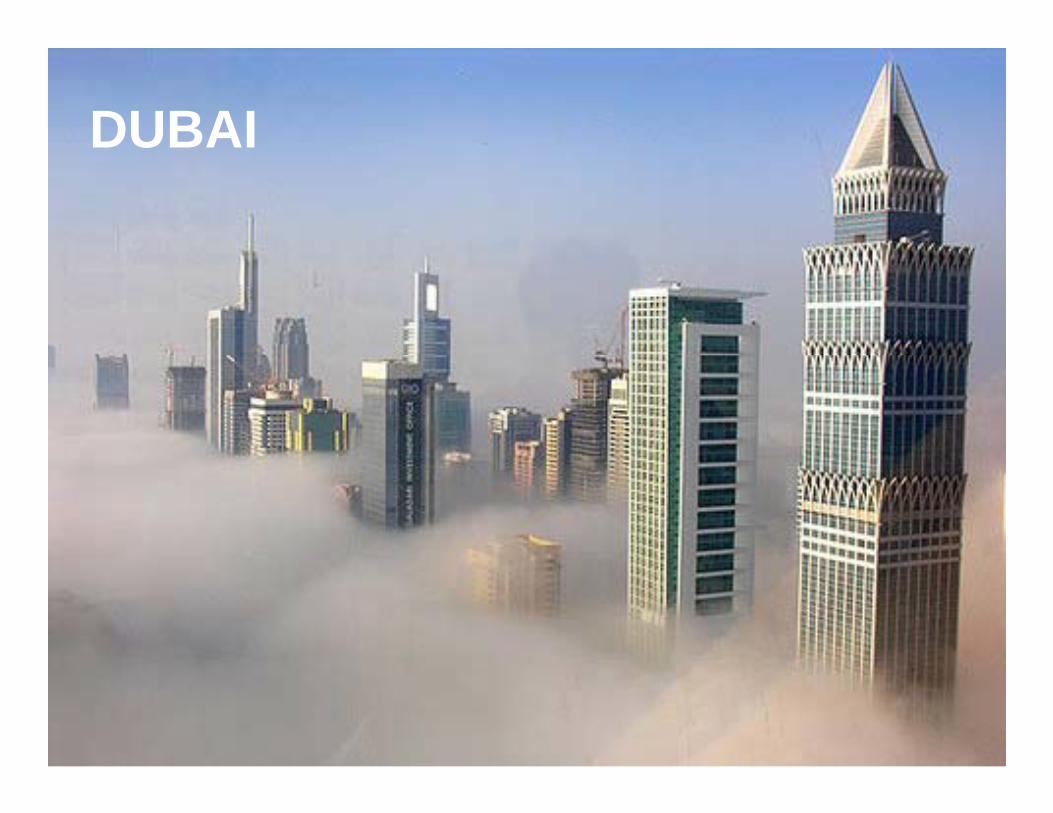
DUBAI

72 billion72 billionpeoplepeople

Green CubeGreen Cube
Family of Companies

VisionGroup of affiliated companies that canGroup of affiliated companies that can dramatically effect climate change on a global scale by focusing on the built environment.
MissionEliminate 1 billion tons of CO2.

Cubist Network
Key AdvisorsInvestorsEntrepreneursScientistsTechnologistsDevelopersAttAttorneysOfficialsResearch institutesResearch institutesUniversitiesRegulatorsegu ato s


Reinventing Drywall
U.S. market $12B200 trillion BTUs natural gas/year200 trillion BTUs natural gas/year#3 GHG emitter, 12M tons CO2Industry stuckySame since 1917
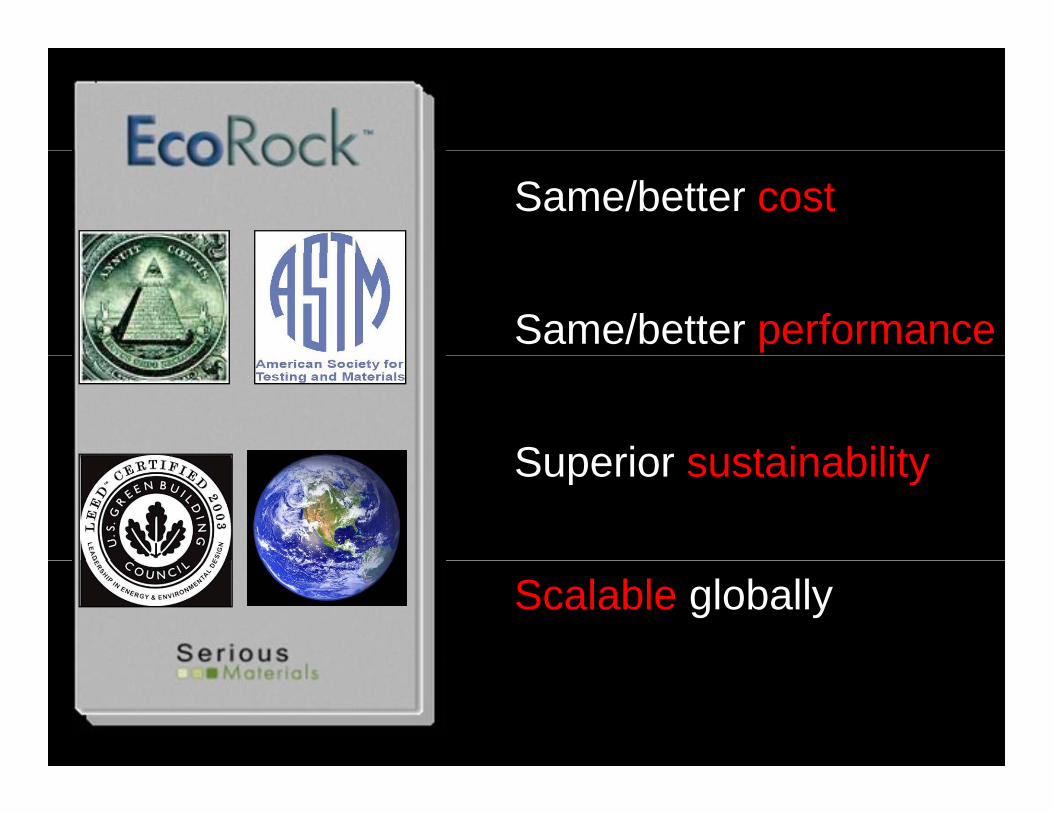
Same/better cost
Same/better performance
Superior sustainabilitySuperior sustainability
Scalable globally


CementCement
Portland cement, 8% of COPortland cement, 8% of CO222 5 billion tons/year2 5 billion tons/year2.5 billion tons/year2.5 billion tons/year$150B world market$150B world marketIndustry stuckIndustry stuckS i 1824S i 1824Same since 1824Same since 1824
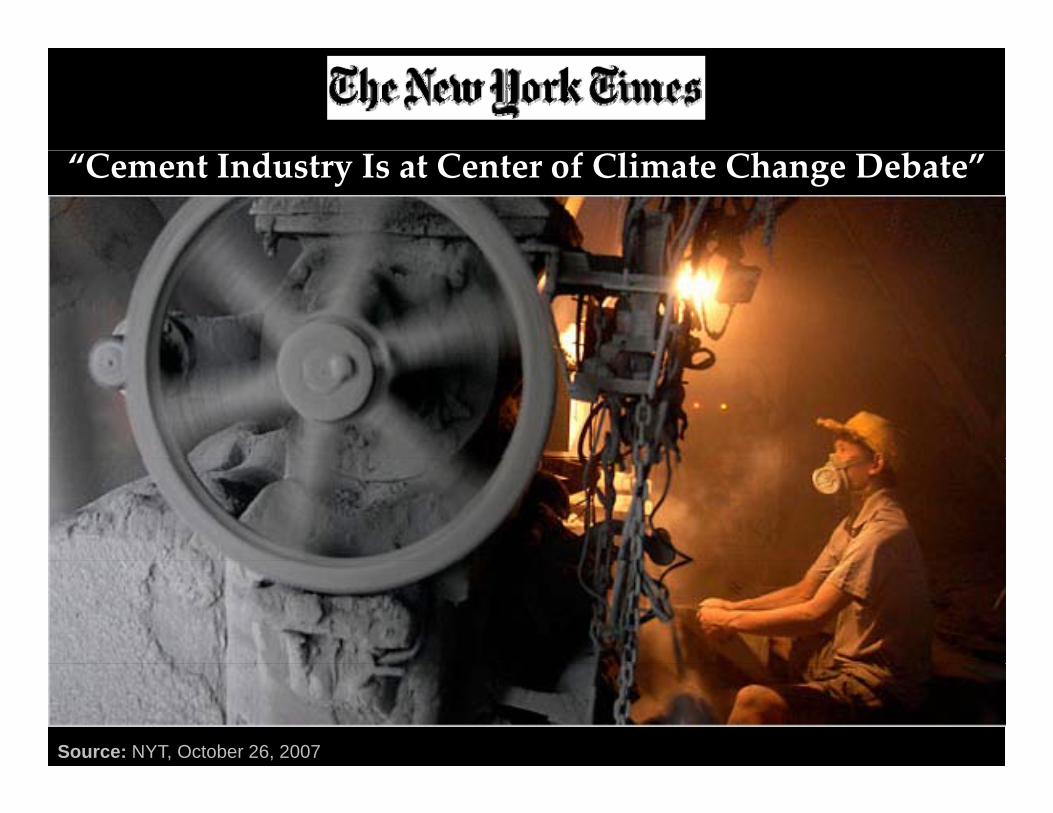
“Cement Industry Is at Center of Climate Change Debate”
Source: NYT, October 26, 2007
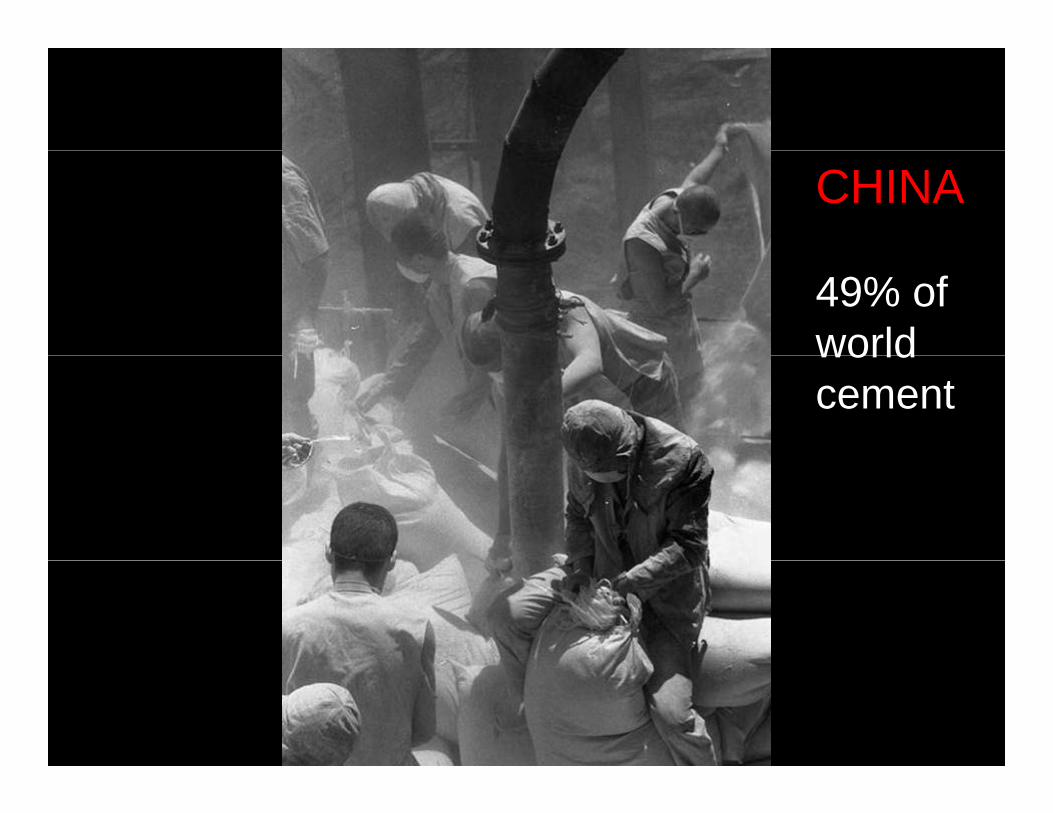
CHINA
49% of worldworldcement

HELIOTRICITYHELIOTRICITYHELIOTRICITYHELIOTRICITY
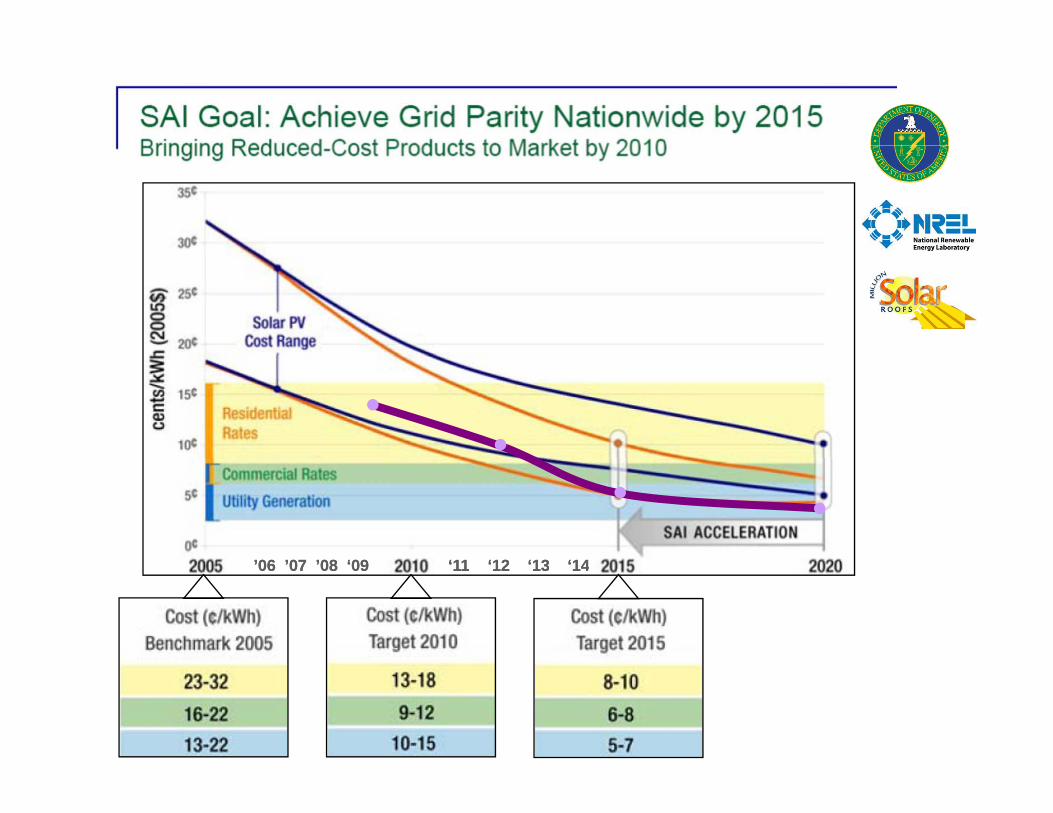
’06 ’07 ’08 ‘09’06 ’07 ’08 ‘09 ‘11‘11 ‘12‘12 ‘13‘13 ‘14‘14’06 ’07 ’08 ‘09’06 ’07 ’08 ‘09 ‘11‘11 ‘12‘12 ‘13‘13 ‘14‘14

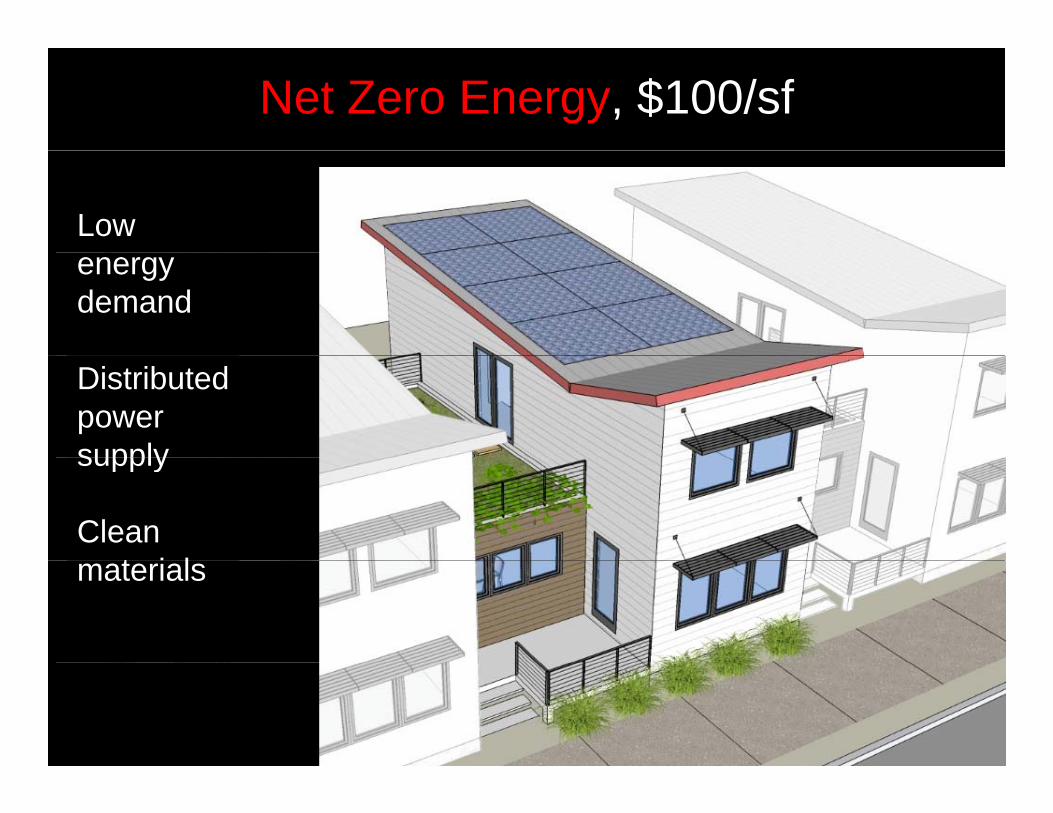
Net Zero Energy, $100/sf
Lowenergydemand
Distributedpowersupplysupply
Cleant i lmaterials
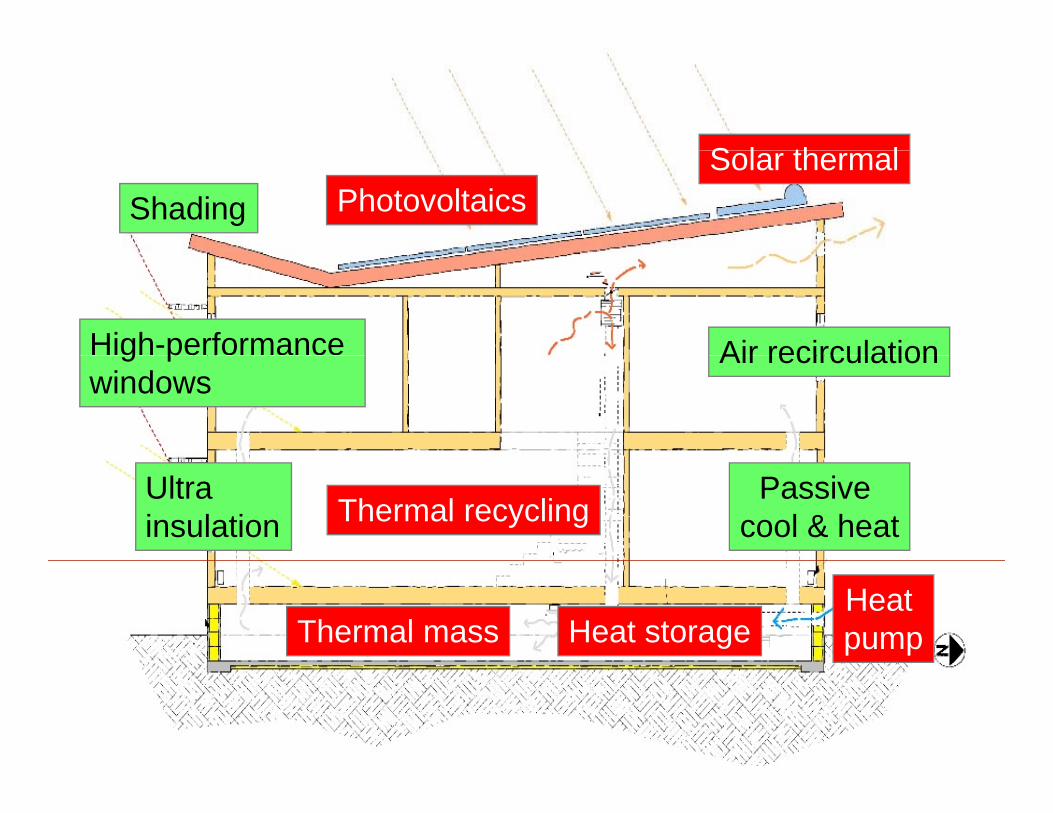
S l th lShading Photovoltaics
Solar thermal
Air recirculationHigh-performance Air recirculationg pwindows
Thermal recyclingPassive
cool & heatUltra insulation
Heat pumpThermal mass Heat storage

MATERIALSCement & Concrete CalStar CementCement & Concrete CalStar CementDrywall Serious MaterialsGlass TBDSteel TBDSteel TBD
OPERATIONSAir – Cooling, Heating & Quality TBDAppliances – Efficiency TBDEnergy - Distributed Utility SuntegrityInsulation – Walls & Roof TBDLighting - Lights & Daylighting TBDPhotovoltaics HeliotricityQuiet Serious MaterialsSolar Thermal - Air & Water TBDWater - Reprocess & Catchment TBDWindows - Thermal & Quiet Serious MaterialsZero Energy Operations ZETA Communities
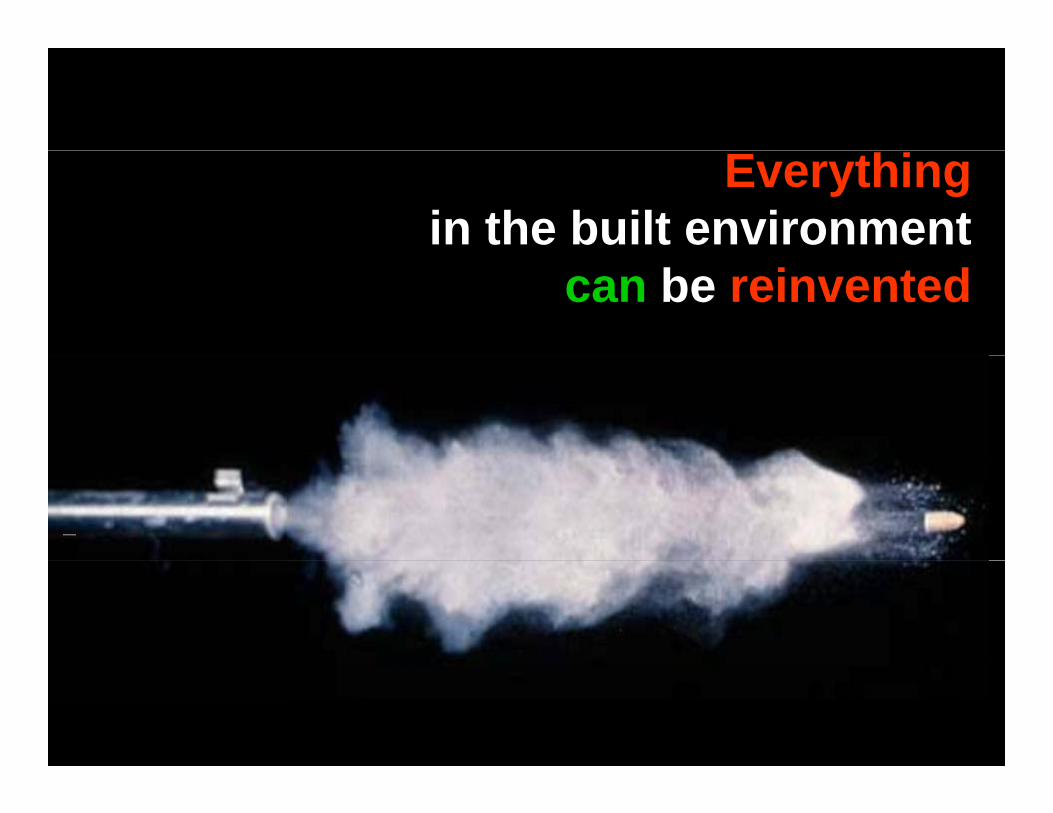
Everythingin the built environment
can be reinvented
M k DiffMake a Difference
Thank YouMarc Porat


