Climate Change: the IPCC view Prof. Jean-Pascal van Ypersele IPCC Vice-Chair, (UniversitØ catholique de Louvain, Louvain-la-Neuve, Belgium), www.ipcc.ch & www.climate.be [email protected]Credits: many slides borrowed with gratitude from IPCC colleagues: R. Christ, RK Pachauri, S. Solomon, J. Palutikof, J. Stone, or prepared by Ph. Marbaix & B. Gaino UNFCCC training for media, Bonn, 7 June 2010 NB: The support of the Belgian Science Policy Office is gratefully acknowledged
Transcript
Climate Change: the IPCC view
Prof. Jean-Pascal van Ypersele
IPCC Vice-Chair,(Université catholique de Louvain, Louvain-la-Neuve, Belgium),
Credits: many slides borrowed with gratitude from IPCC colleagues: R. Christ, RK Pachauri, S. Solomon, J. Palutikof, J. Stone, or prepared by Ph. Marbaix & B. GainoUNFCCC training for media, Bonn, 7 June 2010
NB: The support of the Belgian Science Policy Office is gratefullyacknowledged
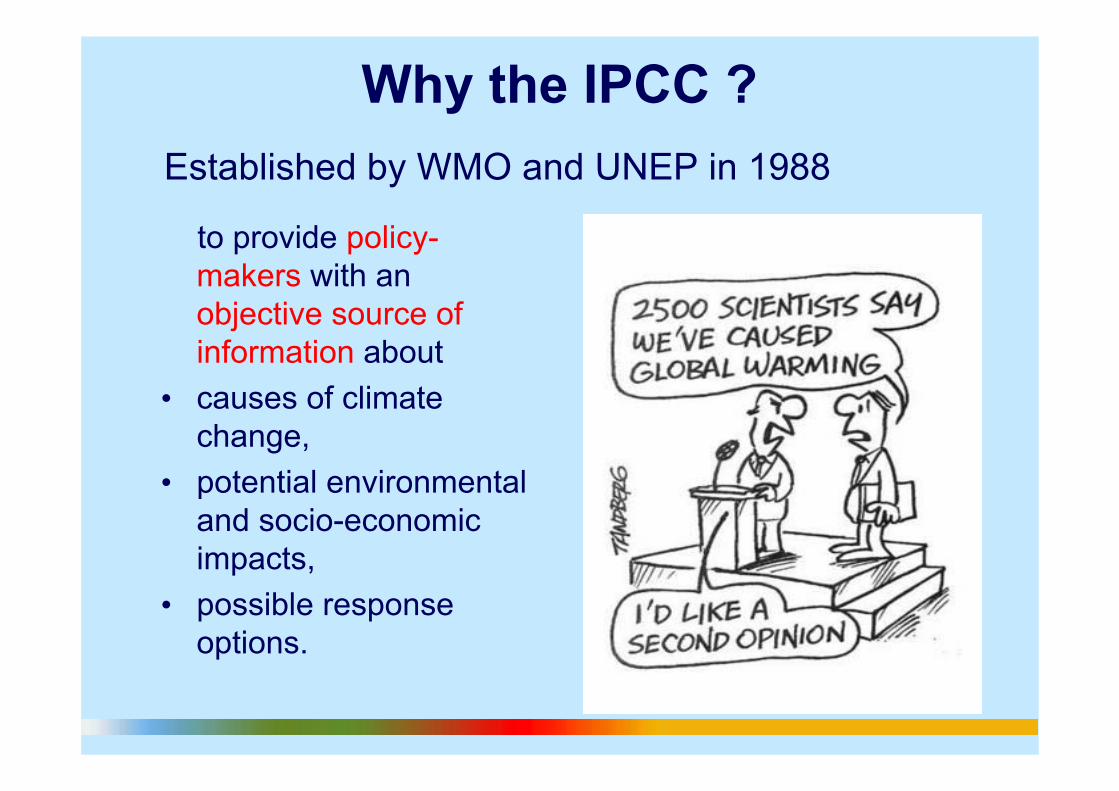
Why the IPCC ?
to provide policy-makers with an objective source of information about
� causes of climate change,
� potential environmental and socio-economic impacts,
� possible response options.
Established by WMO and UNEP in 1988
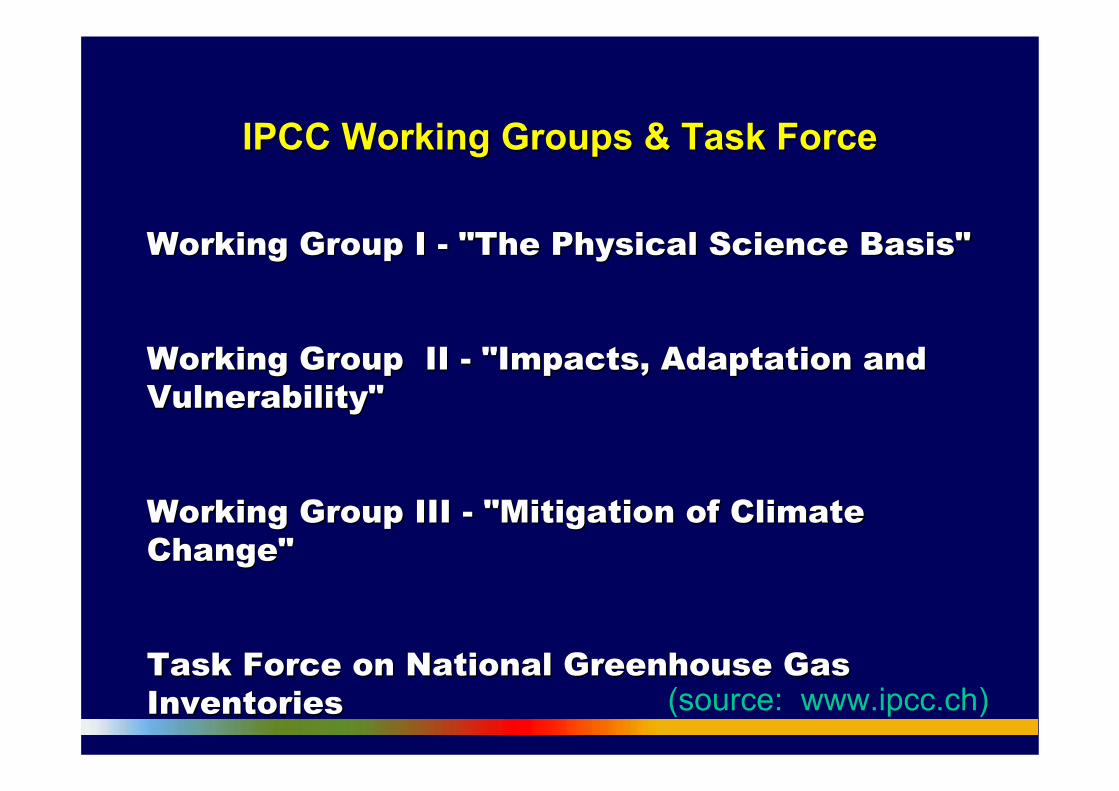
IPCC Working Groups & Task ForceIPCC Working Groups & Task Force
Working Group I Working Group I -- "The Physical Science Basis""The Physical Science Basis"
Working Group II Working Group II -- "Impacts, Adaptation and "Impacts, Adaptation and Vulnerability"Vulnerability"
Working Group III Working Group III -- "Mitigation of Climate "Mitigation of Climate Change"Change"
Task Force on National Greenhouse Gas Task Force on National Greenhouse Gas InventoriesInventories (source: www.ipcc.ch)
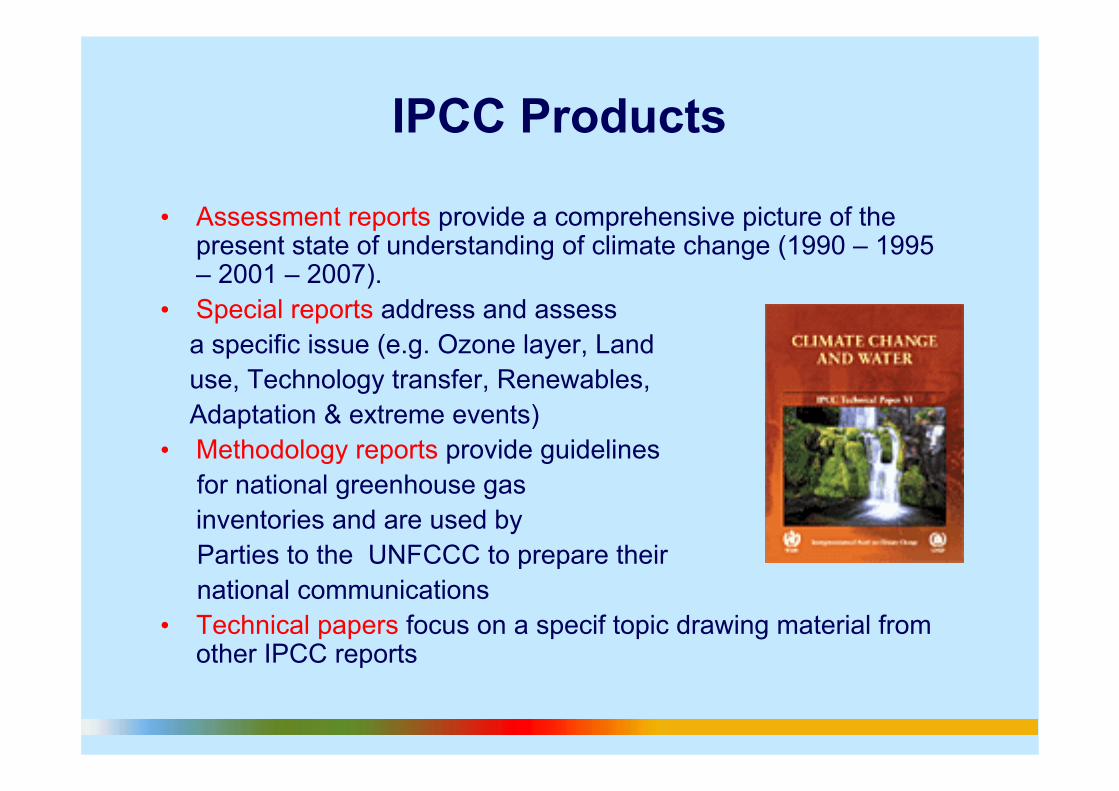
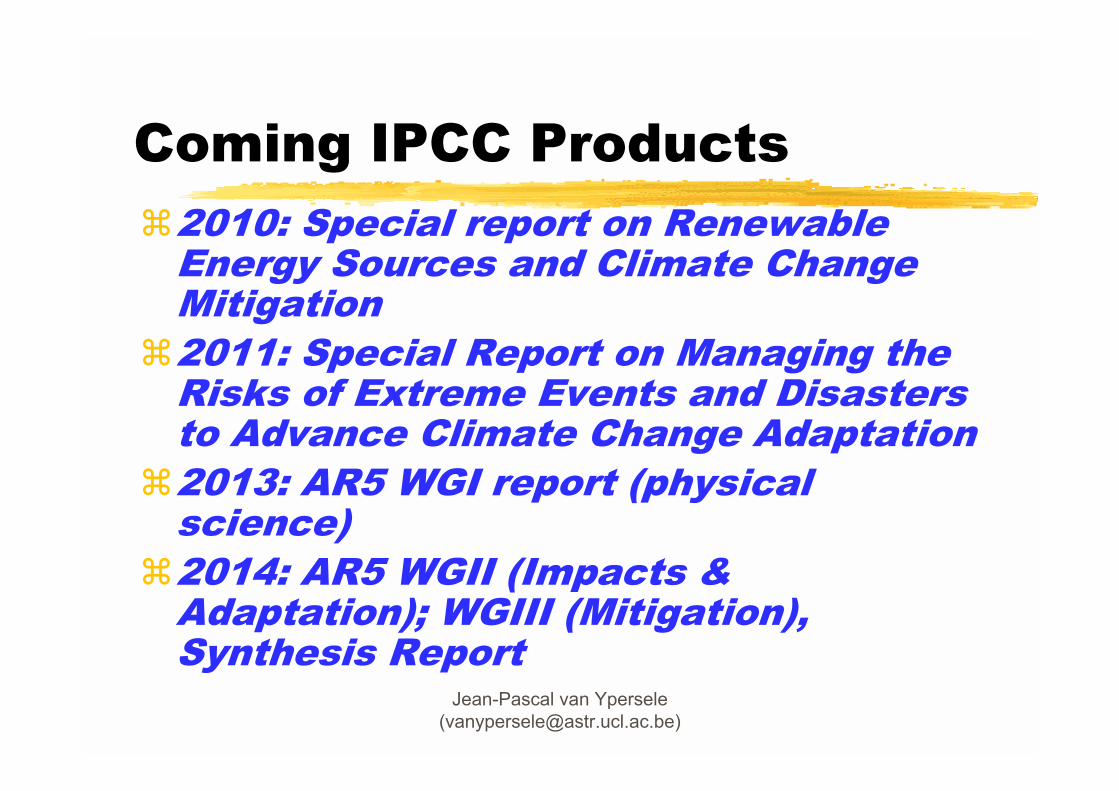
IPCC Products
� Assessment reports provide a comprehensive picture of the present state of understanding of climate change (1990 � 1995 � 2001 � 2007).
� Special reports address and assessa specific issue (e.g. Ozone layer, Land use, Technology transfer, Renewables, Adaptation & extreme events)
� Methodology reports provide guidelinesfor national greenhouse gasinventories and are used by Parties to the UNFCCC to prepare theirnational communications
� Technical papers focus on a specif topic drawing material fromother IPCC reports
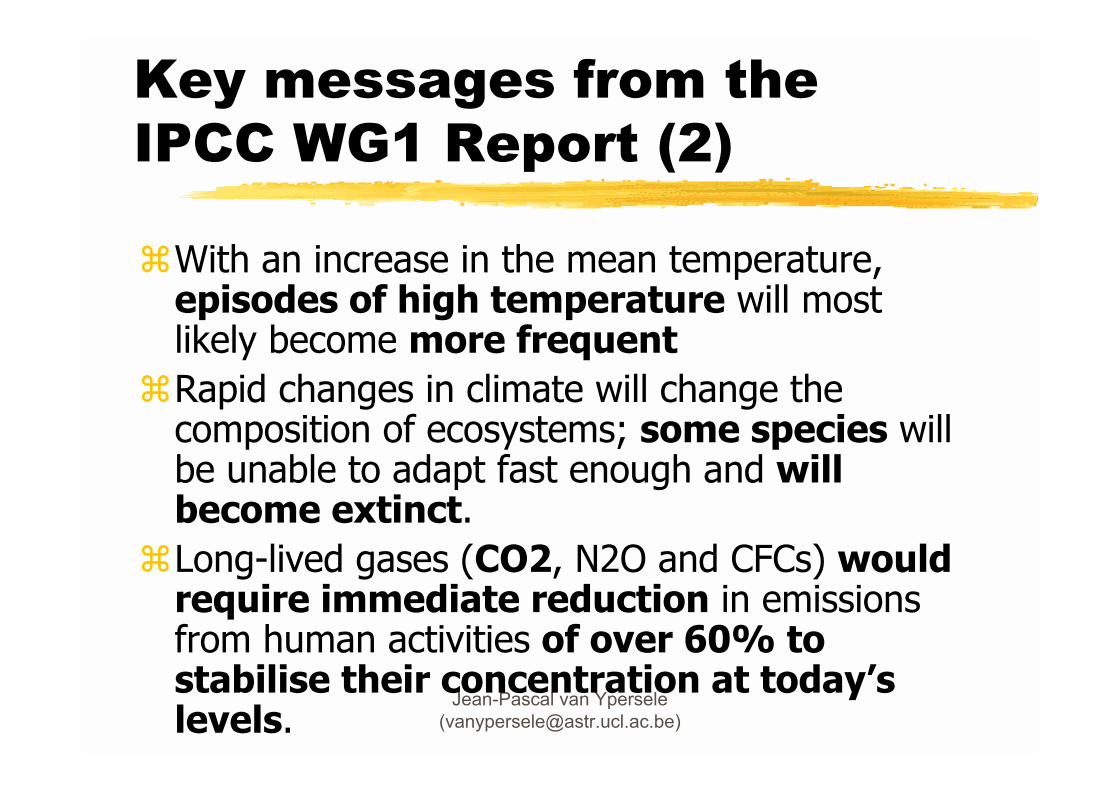
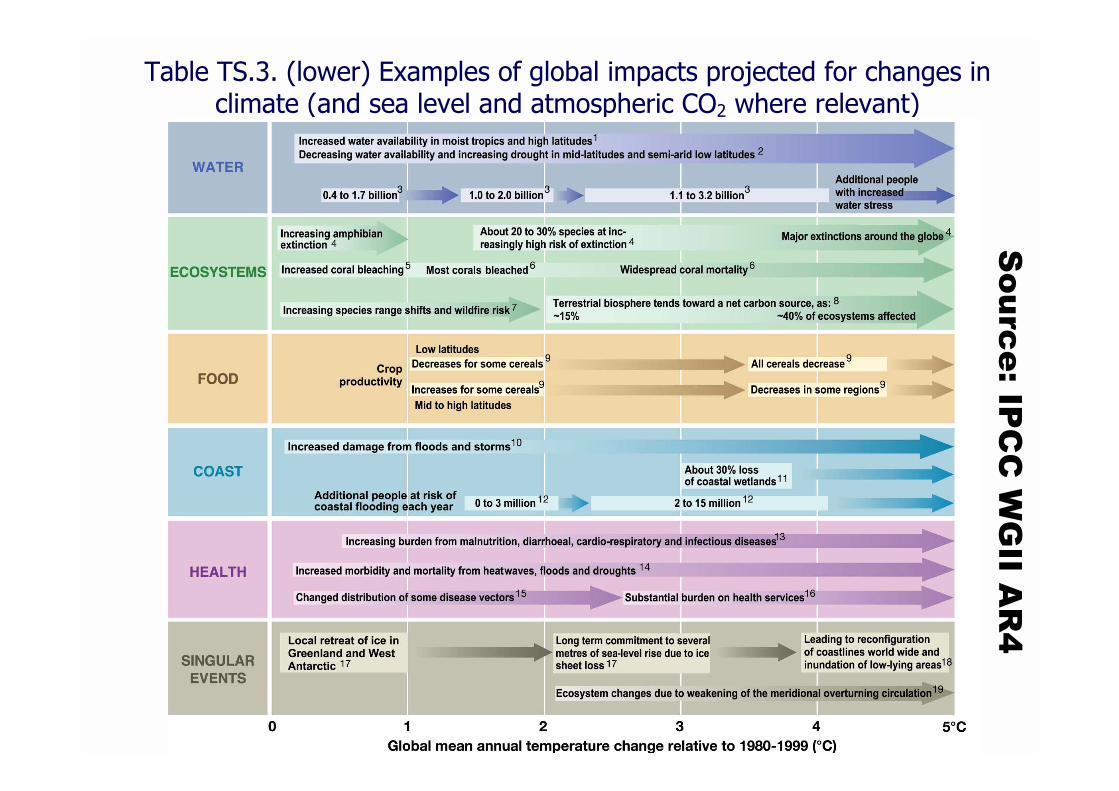
!With an increase in the mean temperature, episodes of high temperature will mostlikely become more frequent
!Rapid changes in climate will change the composition of ecosystems; some species willbe unable to adapt fast enough and willbecome extinct.
!Long-lived gases (CO2, N2O and CFCs) wouldrequire immediate reduction in emissionsfrom human activities of over 60% to stabilise their concentration at today�slevels.
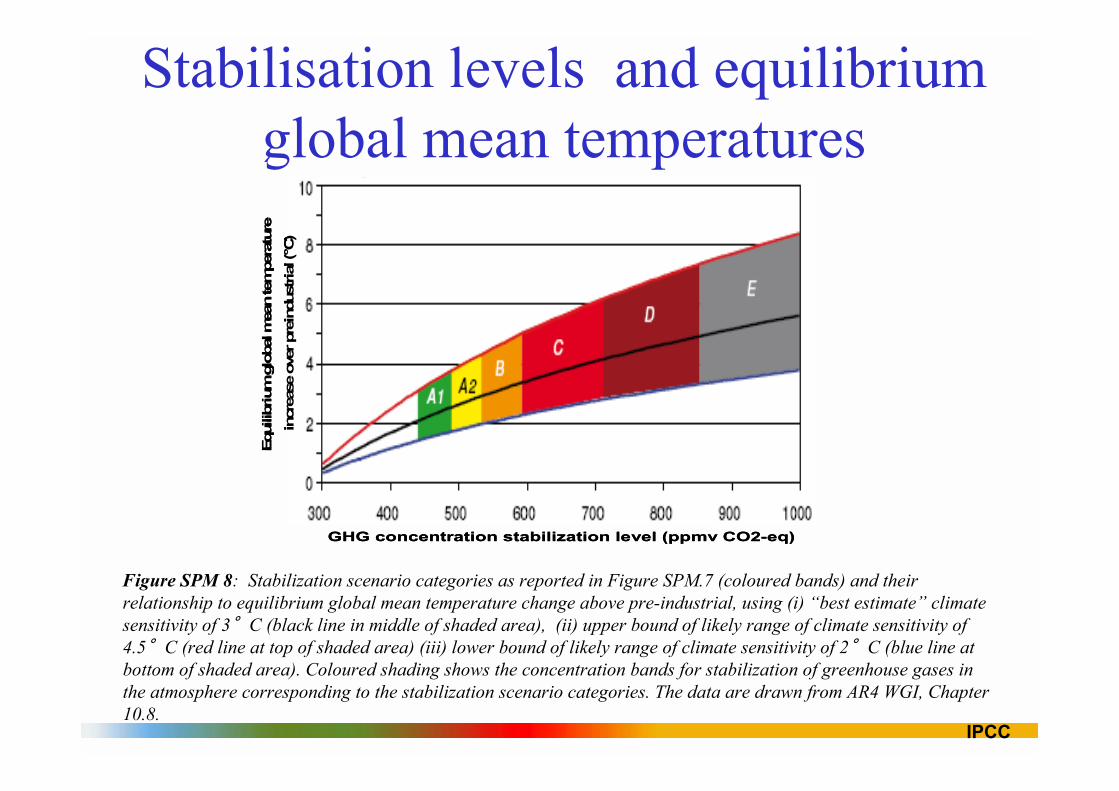
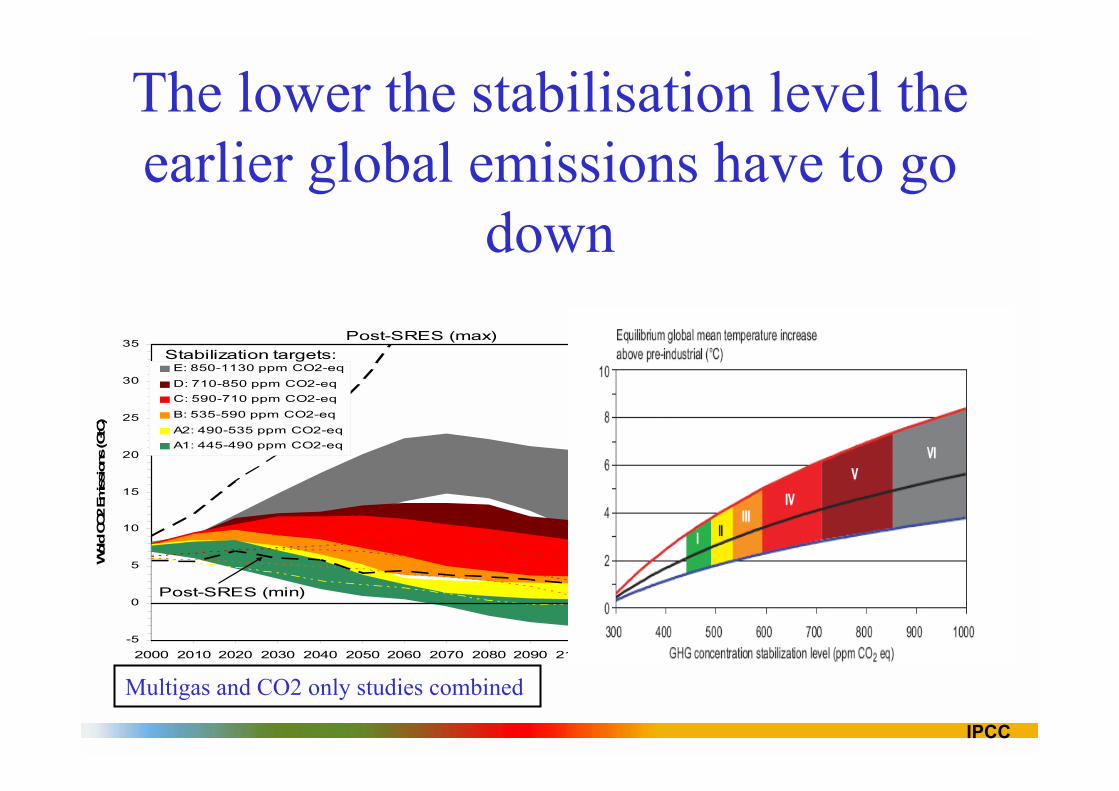
Figure SPM 8: Stabilization scenario categories as reported in Figure SPM.7 (coloured bands) and their relationship to equilibrium global mean temperature change above pre-industrial, using (i) �best estimate� climate sensitivity of 3°C (black line in middle of shaded area), (ii) upper bound of likely range of climate sensitivity of 4.5°C (red line at top of shaded area) (iii) lower bound of likely range of climate sensitivity of 2°C (blue line at bottom of shaded area). Coloured shading shows the concentration bands for stabilization of greenhouse gases in the atmosphere corresponding to the stabilization scenario categories. The data are drawn from AR4 WGI, Chapter 10.8.
IPCC
The lower the stabilisation level the earlier global emissions have to go
Crucial question for sea level rise in the twenty-first century is how much ice will be lost from the Greenland and Antarctic ice sheets as a result of rapid accelerations in ice flow
Source: Lowe and Gregory, Nature reports, 2010
Sea Level :a sea of uncertainty (Lowe, 2010)
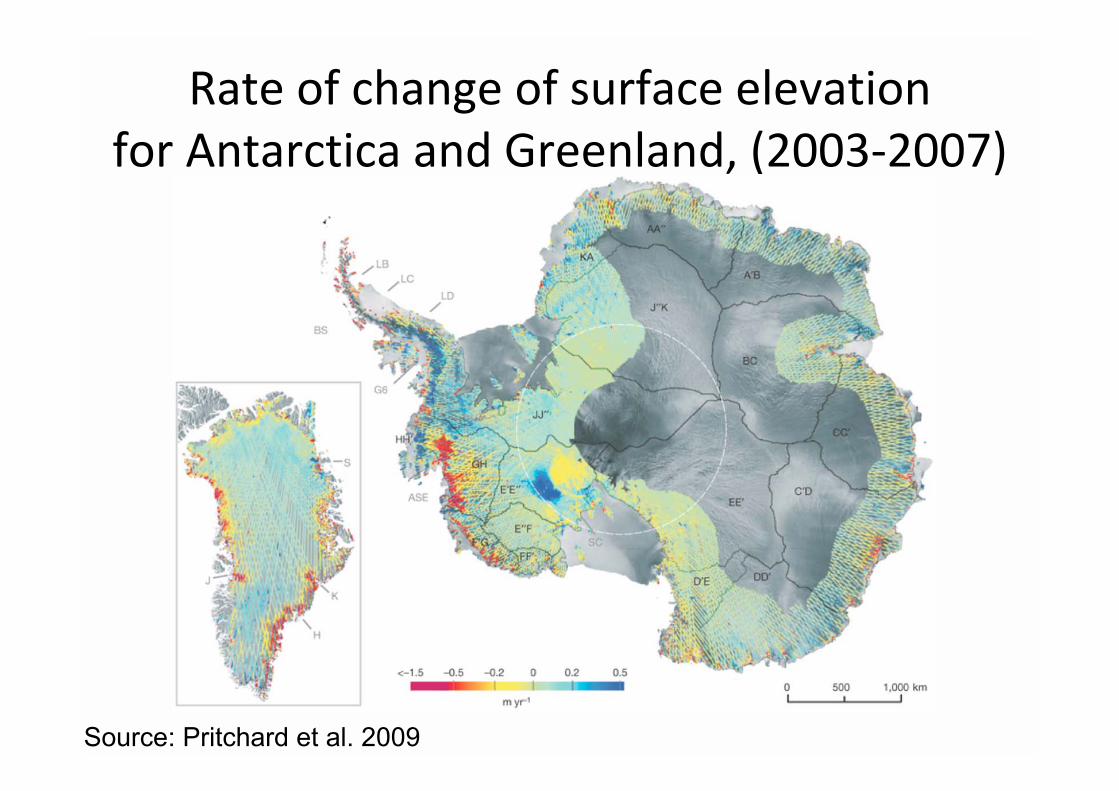
Rate of change of surface elevationfor Antarctica and Greenland, (2003‐2007)
Source: Pritchard et al. 2009
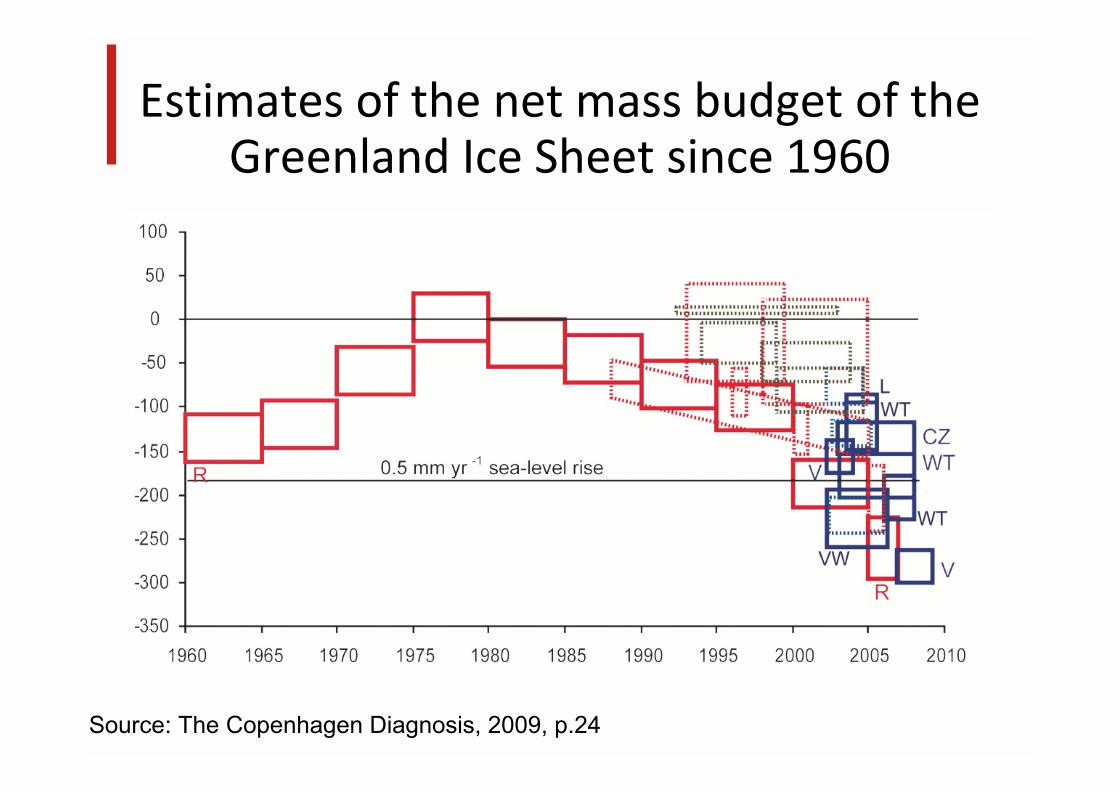
Estimates of the net mass budget of the Greenland Ice Sheet since 1960
Source: The Copenhagen Diagnosis, 2009, p.24
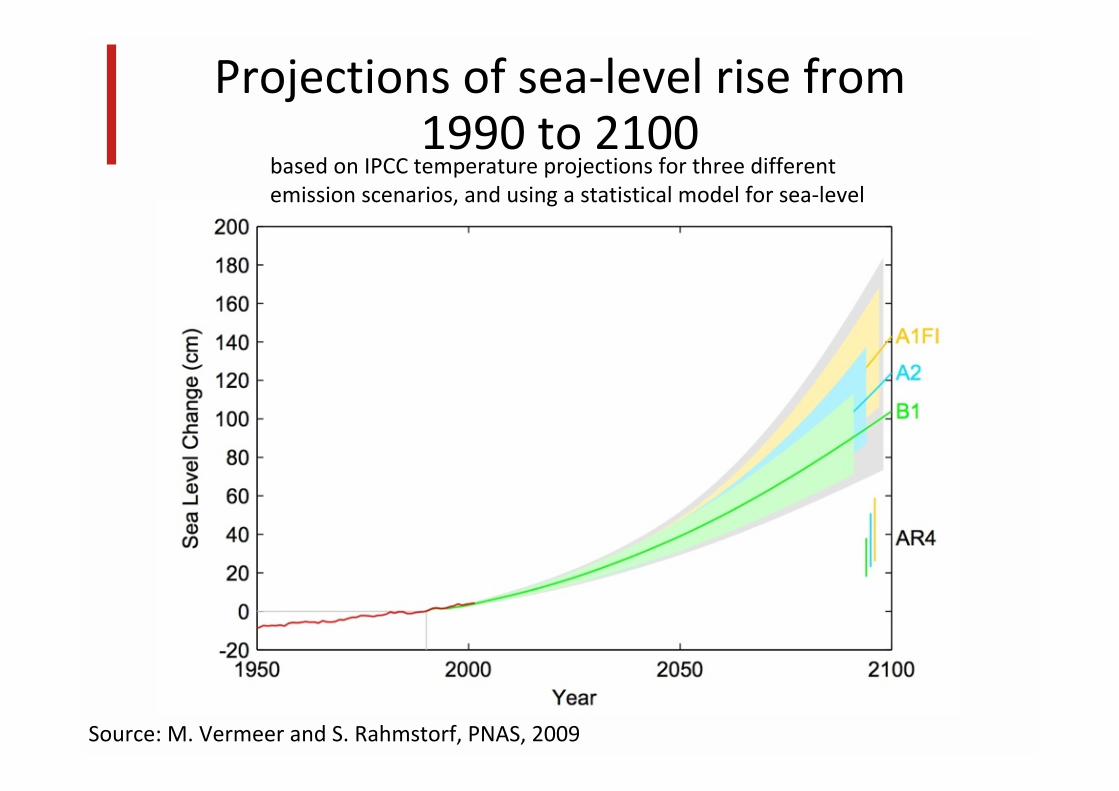
Projections of sea‐level rise from 1990 to 2100
Source: M. Vermeer and S. Rahmstorf, PNAS, 2009
based on IPCC temperature projections for three different emission scenarios, and using a statistical model for sea‐level
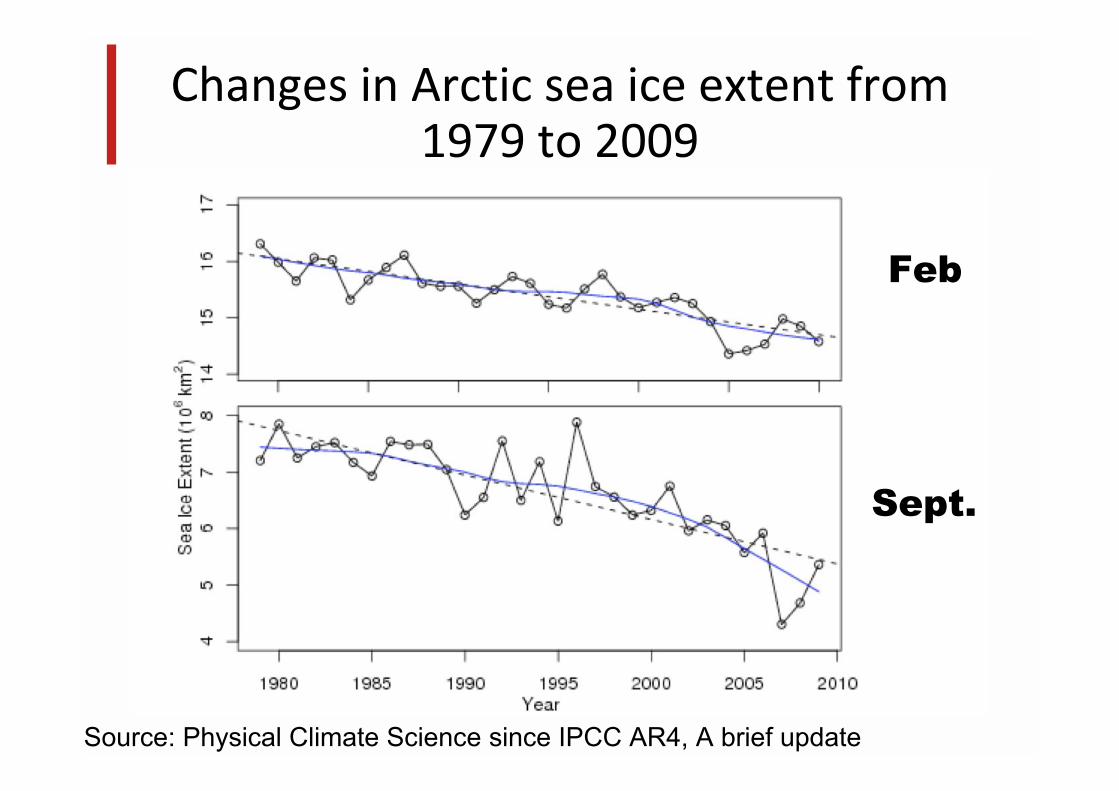
Changes in Arctic sea ice extent from 1979 to 2009
Source: Physical Climate Science since IPCC AR4, A brief update
Feb
Sept.
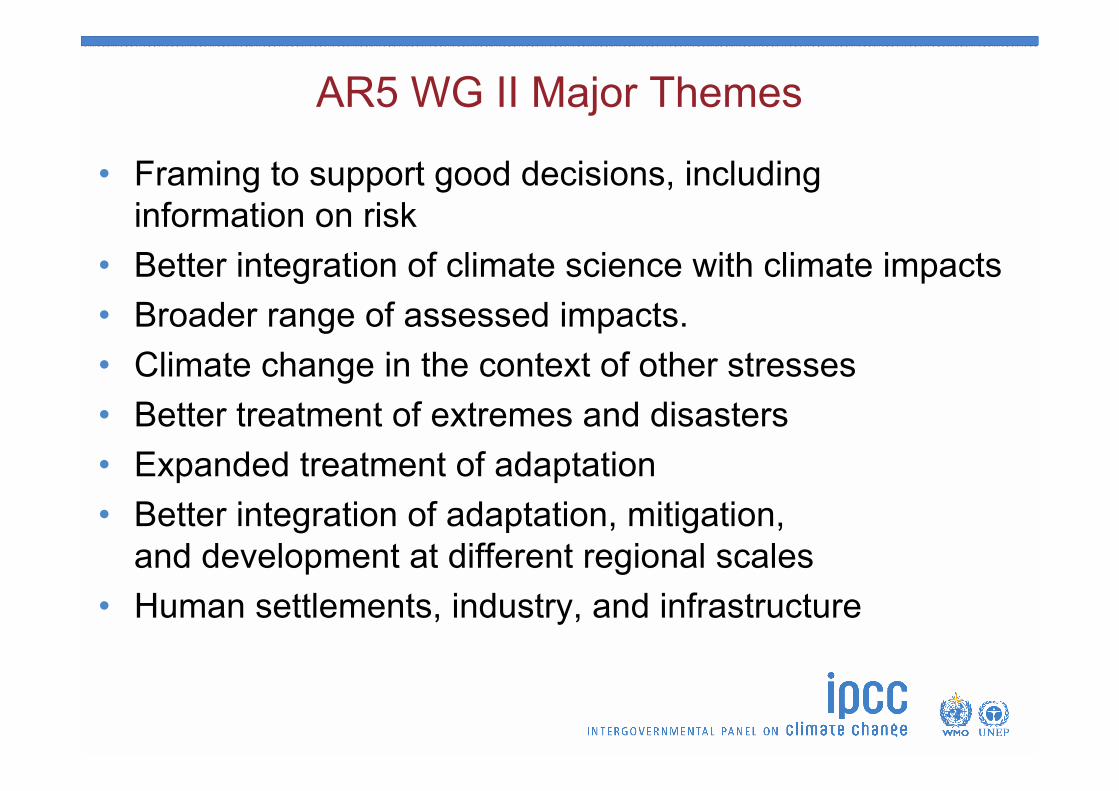
AR5 WG II Major Themes
� Framing to support good decisions, including information on risk
� Better integration of climate science with climate impacts� Broader range of assessed impacts.� Climate change in the context of other stresses� Better treatment of extremes and disasters� Expanded treatment of adaptation� Better integration of adaptation, mitigation,
and development at different regional scales� Human settlements, industry, and infrastructure
� Part A: GLOBAL & SECTORAL ASPECTS� Context for the AR5� Natural and managed resources and systems,
and their uses� Human settlements, industry, and infrastructure� Human health, well-being, and security� Adaptation� Multi-sector impacts, risks, vulnerabilities, and
opportunities� Part B: REGIONAL ASPECTS
� With WG I and WG III input and collaboration
AR5 Major Sections or �Superchapters�
Some WGII‐related news (NOT assessed by IPCC yet):
Impacts, Adaptation, and Vulnerability
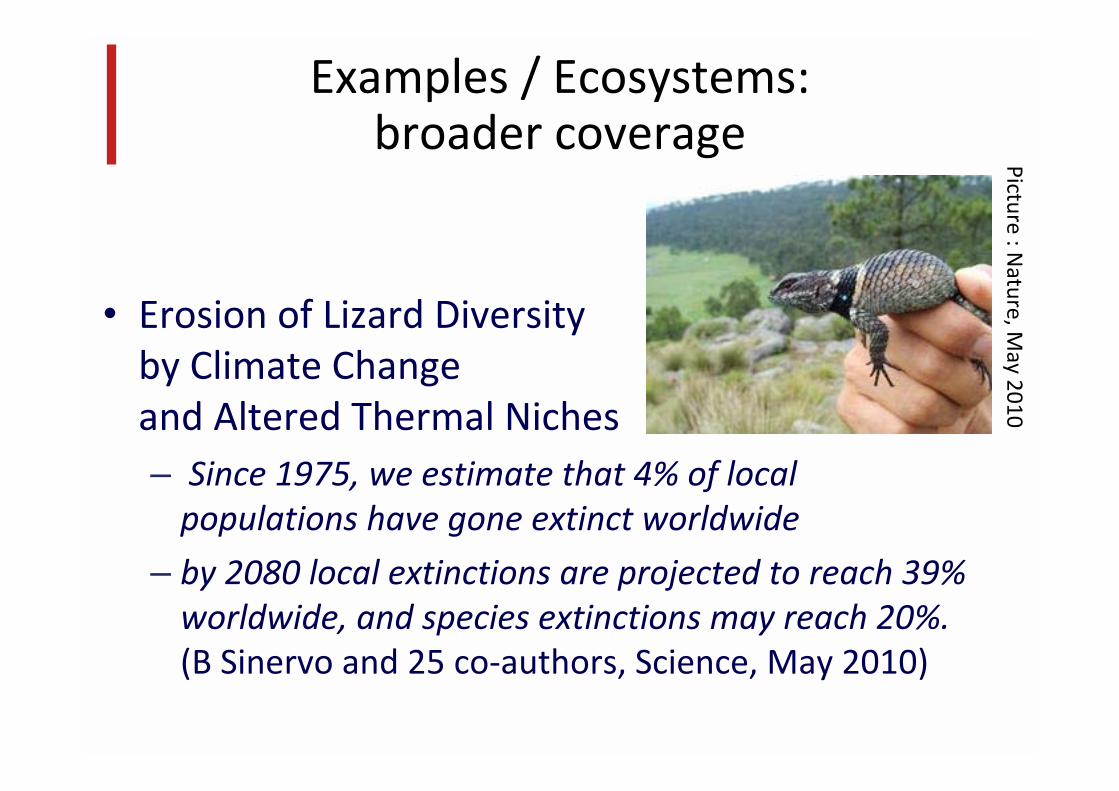
Examples / Ecosystems: broader coverage
� Erosion of Lizard Diversity by Climate Change and Altered Thermal Niches� Since 1975, we estimate that 4% of local populations have gone extinct worldwide
� by 2080 local extinctions are projected to reach 39% worldwide, and species extinctions may reach 20%.(B Sinervo and 25 co‐authors, Science, May 2010)
Picture : Nature, M
ay 2010
Examples / health
� A study found that cold related mortality in England decreased much faster than heat related mortality increased (over 1976‐2005);adaptation played a major role in preventing a larger increase(Christidis et al, Climatic Change, 2009)
� Projected health impacts of heat waves are significantly larger in the mediterranean area (Fischer and Schär, Nature Geoscience 2010)
Other examples / impacts
� Reduced oxygenation of oceans, both due to warming and in connection with acidification, with implications for marine life (Keeling et al., Ann. Rev. of Marine Science, 2010;Hofman and Schellnhuber, PNAS, 2009)
� Carbon cycle & carbon content of soils :a study confirms that soil carbon fluxes will increase in a warming climate, but do not provide a conclusion on the net change in C content of soils(Bond‐Lamberty and Thomson, Nature, 2010)
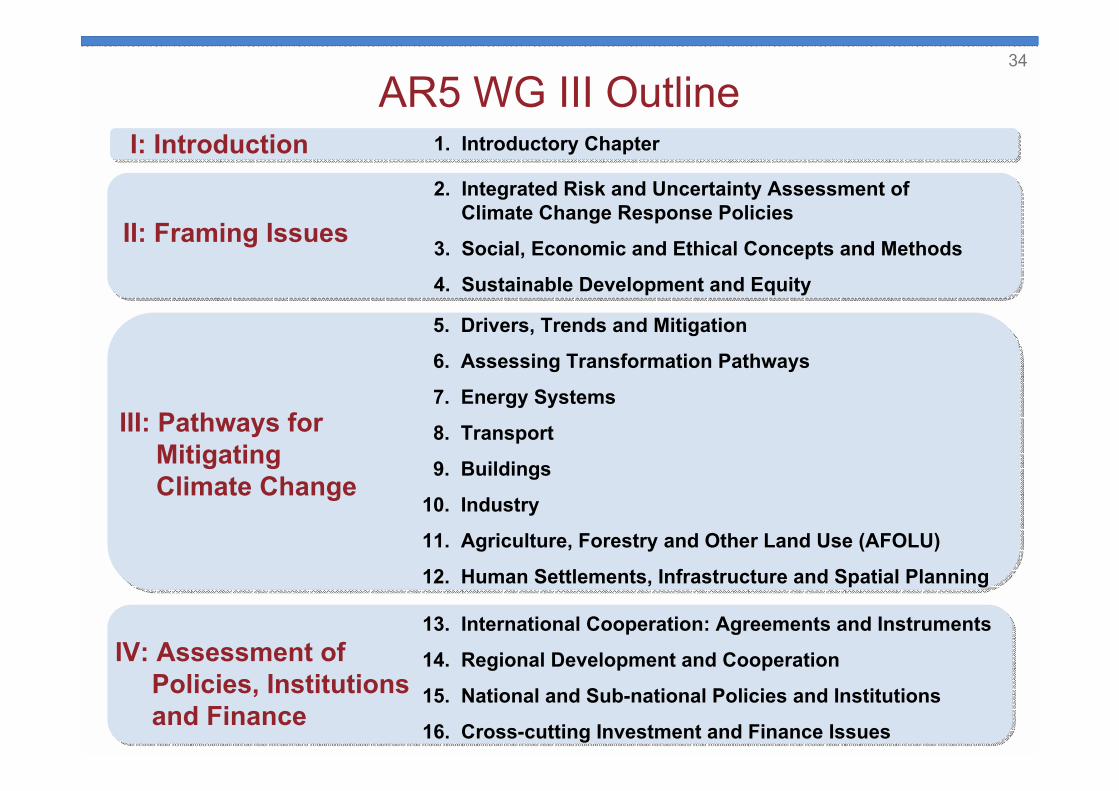
AR5 WG III Outline1. Introductory Chapter
34
2. Integrated Risk and Uncertainty Assessment of Climate Change Response Policies
3. Social, Economic and Ethical Concepts and Methods
4. Sustainable Development and Equity
5. Drivers, Trends and Mitigation
6. Assessing Transformation Pathways
7. Energy Systems
8. Transport
9. Buildings
10. Industry
11. Agriculture, Forestry and Other Land Use (AFOLU)
12. Human Settlements, Infrastructure and Spatial Planning
13. International Cooperation: Agreements and Instruments
14. Regional Development and Cooperation
15. National and Sub-national Policies and Institutions
16. Cross-cutting Investment and Finance Issues
IV: Assessment of Policies, Institutions and Finance
III: Pathways for Mitigating Climate Change
II: Framing Issues
I: Introduction
� Low Stabilisation Scenarios which identify the technical and institutional requirements.
� Exploring the costs, benefits and risks of all relevant mitigation options.
� Identifying differential impacts and develop a classification of risks comprising tipping points in the natural environment and also in society.
The Research Challenge of WG III35
Some WGIII‐related news(NOT assessed by IPCC yet):
Mitigation
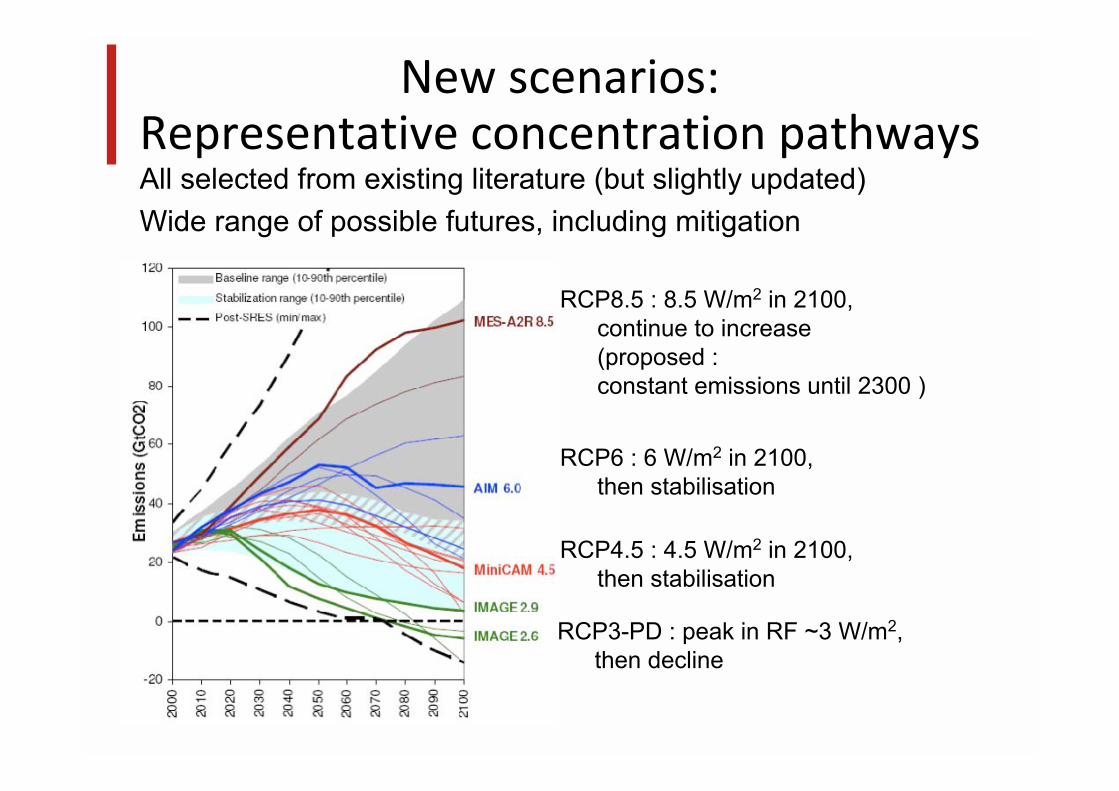
New scenarios:Representative concentration pathwaysAll selected from existing literature (but slightly updated)Wide range of possible futures, including mitigation
RCP3-PD : peak in RF ~3 W/m2,then decline
RCP4.5 : 4.5 W/m2 in 2100, then stabilisation
RCP6 : 6 W/m2 in 2100, then stabilisation
RCP8.5 : 8.5 W/m2 in 2100, continue to increase (proposed :constant emissions until 2300 )
38
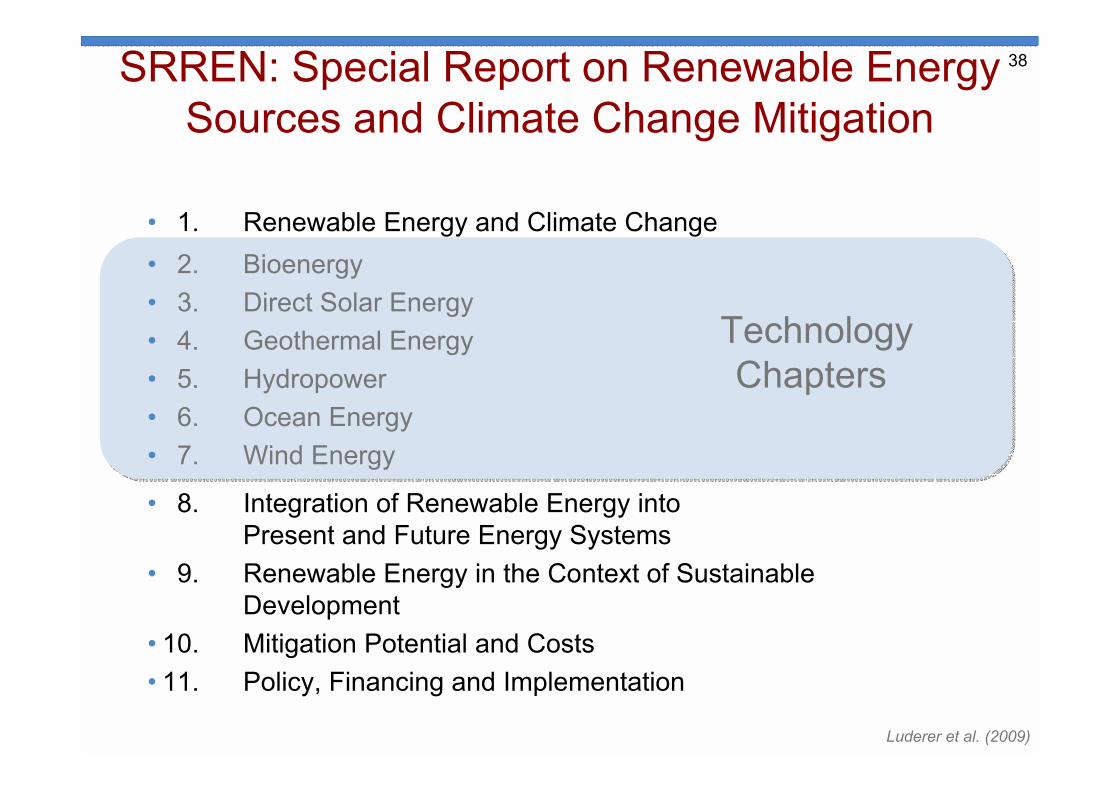
� 1. Renewable Energy and Climate Change� 2. Bioenergy� 3. Direct Solar Energy � 4. Geothermal Energy� 5. Hydropower� 6. Ocean Energy� 7. Wind Energy
� 8. Integration of Renewable Energy intoPresent and Future Energy Systems
� 9. Renewable Energy in the Context of Sustainable Development
� 10. Mitigation Potential and Costs� 11. Policy, Financing and Implementation
Luderer et al. (2009)
F
Technology Chapters
38SRREN: Special Report on Renewable Energy Sources and Climate Change Mitigation