27
Climate Change Vulnerability Assessment Final Report March 25, 2016 The Bay Foundation Wei Dai, Xiaoyi Gu, Fanchen Kong, Hangjian Li, Zhijian Li, Yuqing Wang
| Date post: | 07-Feb-2018 |
| Category: |
Documents |
| Upload: | truongkien |
| View: | 214 times |
| Download: | 1 times |
Climate Change Vulnerability Assessment
Final Report March 25, 2016
The Bay Foundation
Wei Dai, Xiaoyi Gu, Fanchen Kong, Hangjian Li, Zhijian Li, Yuqing Wang
Table of Contents
1. Abstract
2. The Problem
3. Methodology
3.1 Climate Change Tool Inventory 3.2 Vulnerability Assessment
4. Literature Review
5. Methods
6. Analysis and Results
6.1 Kelp Forests
6.2 Abalone
7. Solutions
8. Future Work
9. Bibliography
1

1. Abstract
We created a climate change tool inventory and assessed the vulnerability of Goal 9 in
the Santa Monica Bay Restoration Commission Bay Restoration Plan 2013 — “Protection and
Restoration of Kelp Forest and the Population of Abalone in Santa Monica Bay Area.” As two
crucial participants of the marine ecosystem, kelp forests and abalones are currently at risk due to
climate change. According to various studies, seawater temperature rise, increasing wave height,
and invasive species are the three main threatening factors, other than human activities, that have
led to the decline of the population of these two species. By using the tools in our inventory, such
as California’s Ocean in an El Nino year (CeNCOOS), California Swell Model Archive, and
Marine Invasive Observation Map, we analyzed the impacts of climate change on the population
of kelp forest and abalone. In the end, we concluded that climate change affects these two
species negatively.
2
2. The Problem
The Bay Foundation (TBF), an organization dedicated to preserving the environment of
Santa Monica Bay area, is trying to assess the vulnerability of its Bay Restoration Plan (BRP)
under the impacts of climate change. In order to understand how climate change will directly
affect the goals, priorities, and objectives of the foundation, we need an inventory of climate
change resources to provide specific analysis on the subjects of interest. We started by
constructing the inventory, and then used the tools to conduct a vulnerability assessment.
Creating a tool inventory requires narrowing down the scope of the search (many of the
tools we initially found were not relevant to our project). After obtaining a small pool of climate
change tools, we documented them comprehensively and appropriately, so that a user can get the
most important knowledge on each tool quickly and easily by simply reading through the
documentation. Also, this documentation helped us categorize and compare the tools for specific
purposes. In the end, we created a scoring mechanism that outputs the ranking of all the tools in
the inventory based on the task of interest.
After creating the climate change tool inventory, we focused on assessing the
vulnerability of Goal 9 in the Santa Monica Bay Restoration Commission Bay Restoration Plan
2013 — “Protection and Restoration of Kelp Forest and the Population of Abalone in Santa
Monica Bay Area.” The effects of global warming can be seen in the world around us today.
Historical records have shown that, near southern California, seawater temperature has been
rising at an increasing rate since the 1960s according to “California's Ocean in an El Nino Year”
(CeNCOOS, 2016). This area serves as an important freshwater habitat for wildlife, and the
rising seawater temperature can significantly threaten the survival of native species, especially
for those with low resistance to temperature variation.
As one of the most productive ecosystems, kelp forests are subtidal areas with a high
density of kelp. They support the diverse assemblage of life that inhabits them. The blades and
holdfasts of kelp provide refuge for many fish, invertebrates, and marine mammals. Moreover,
kelp forests provide humans with benefits known as ecosystem services: ocean currents are
slowed by dragging of large kelps, and consequently, wave actions onshore are decreased. By
altering the waves, kelp forests can curb the erosion of coastal areas and lower the protection and
3
replacement costs of properties (NOAA, 1999). However, despite their environmental values,
kelp forests in the Santa Monica Bay are now at risk due to a number of factors listed by BRP.
The primary contributing factors include overharvesting of the predators of sea urchins,
pollution, coastal development, nutrient overload, sedimentation, and changes in ocean
temperature and current.
As a member in the kelp forests habitat, abalones are marine snails that live primarily in
intertidal and subtidal zones. They are extremely important for local ecosystems and human
beings: studies have shown that herbivorous grazing by adult abalones in rocky subtidal zones
helps regulate ecosystem dynamics of the benthic community. For instance, filterfeeding
animals eat the eggs and larvae of abalone, and juvenile abalones are the main prey for crabs,
lobsters, octopuses, starfish, etc. (Bouma, 2007). For humans, the flesh of abalone is widely
considered to be a desirable food source and is consumed raw or cooked in many cultures. Due
to overharvesting, the abalone population in Southern California has decreased drastically in
recent years, and the situation is exacerbated by the decreasing quality of kelp forests, a natural
habitat for abalones.
4

3. Methodology
3.1 Climate Change Tool Inventory
In order to create our climate change tool inventory, we searched for all available climate
change tools related to the Santa Monica Bay area and the goals of the BRP. More specifically,
we documented all climate change tools whose data are relevant to the area encircled by the red
line in Figure 3.1, and also those that concern at least one goal in the BRP. Since TBF is
particularly concerned with marine preservation and natural habitats restoration in the Santa
Monica Bay area, we selected tools with information about climate change stressors directly
related to our project goals, such as temperature rise, precipitation change, sealevel rise, and
ocean acidification, and we filtered out the irrelevant ones. For example, a climate change tool
that only includes data collected from the east coast of the United States or one that simply
records the economic benefit of the fishing industry near the west coast would not be included in
our inventory. After the filtration, approximately 70 tools related to the conditions of climate
change near Santa Monica Bay area were recorded.
Figure 3.1 Map of Santa Monica Bay Area
5

Next, we categorized each tool in terms of its (A) name, (B) type (e.g., online, journal,
software, etc.), (C) geographical scale (e.g., global, national, etc.), (D) major agencies
responsible for creating the tool, (E) aspects of climate change addressed, and (H) website where
the tool can be found. Notice that if a tool is labeled as “Global” in column (C), it means that the
tool includes data on a global scale, but can still provide useful information related to our area of
interest if we narrow down the scale of data. In addition to these six fundamental layers, we also
categorized each tool according to its (F) topics of interest. “Climate Change I” includes tools
that record data or trends of direct climate change stressors, such as temperature and
precipitation. “Climate Change II” includes tools that record the subsequent effects of changes
caused by direct climate change stressors, such as sea level rise and ocean acidification.
Additionally, for tools that include information related to both types, we labeled them as Climate
Change I & II. Meanwhile, some of the tools could directly contribute to one or more of our
goals, so we gave suggestions to the type of project goals, to which this tool might be related, in
column (G). As for the other tools that cannot be directly used in our goals, we left that cell
blank. As a result, users can conveniently find the tools related to their projects simply by going
through the column (G). Column (I) records the time scale of the data used in the tool, with “pa”
referring to the recorded data in the past and “f” referring to the predictions made for the future.
Last, we evaluated the effectiveness of our tools based on four categories: 1)
convenience, 2) relevance of the tool to the Bay Foundation’s goals, 3) reliability of the source of
data, and 4) whether the records are uptodate. The detailed criteria for each aspect are listed in
Tables 3.13.4. Generally speaking, we evaluated each category separately with a scale of 1 5 to
maintain the consistency and validity of the score. After the separate evaluations, we calculated
an integrated score, which is an average of the four independent scores. A high integrated score
means a better overall performance of the tool based on our criteria.
Score Convenience 1
1 Please note that the evaluation process based on the “convenience” of each tool is a subjective judgement from the grader rather than an objective measurement, especially for comparison with the other dimensions. Nonetheless, we think this is an efficient way to show some information about userfriendliness of each tool.
6
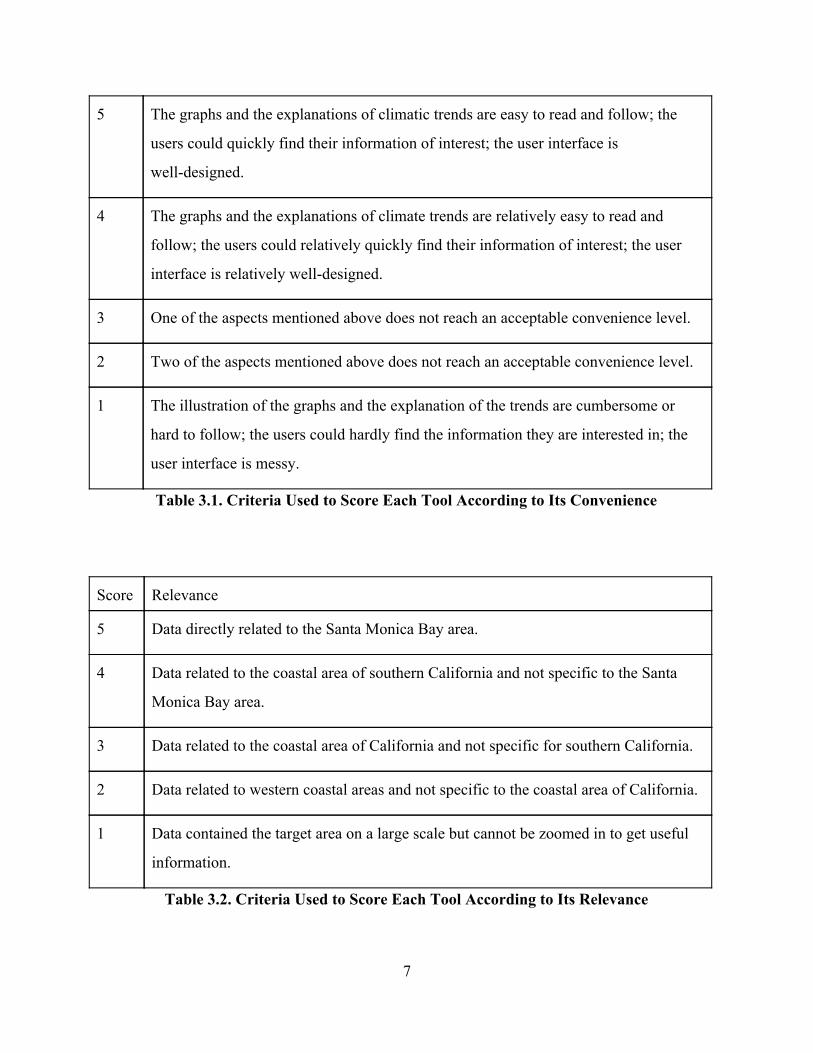
5 The graphs and the explanations of climatic trends are easy to read and follow; the
users could quickly find their information of interest; the user interface is
welldesigned.
4 The graphs and the explanations of climate trends are relatively easy to read and
follow; the users could relatively quickly find their information of interest; the user
interface is relatively welldesigned.
3 One of the aspects mentioned above does not reach an acceptable convenience level.
2 Two of the aspects mentioned above does not reach an acceptable convenience level.
1 The illustration of the graphs and the explanation of the trends are cumbersome or
hard to follow; the users could hardly find the information they are interested in; the
user interface is messy.
Table 3.1. Criteria Used to Score Each Tool According to Its Convenience
Score Relevance
5 Data directly related to the Santa Monica Bay area.
4 Data related to the coastal area of southern California and not specific to the Santa
Monica Bay area.
3 Data related to the coastal area of California and not specific for southern California.
2 Data related to western coastal areas and not specific to the coastal area of California.
1 Data contained the target area on a large scale but cannot be zoomed in to get useful
information.
Table 3.2. Criteria Used to Score Each Tool According to Its Relevance
7
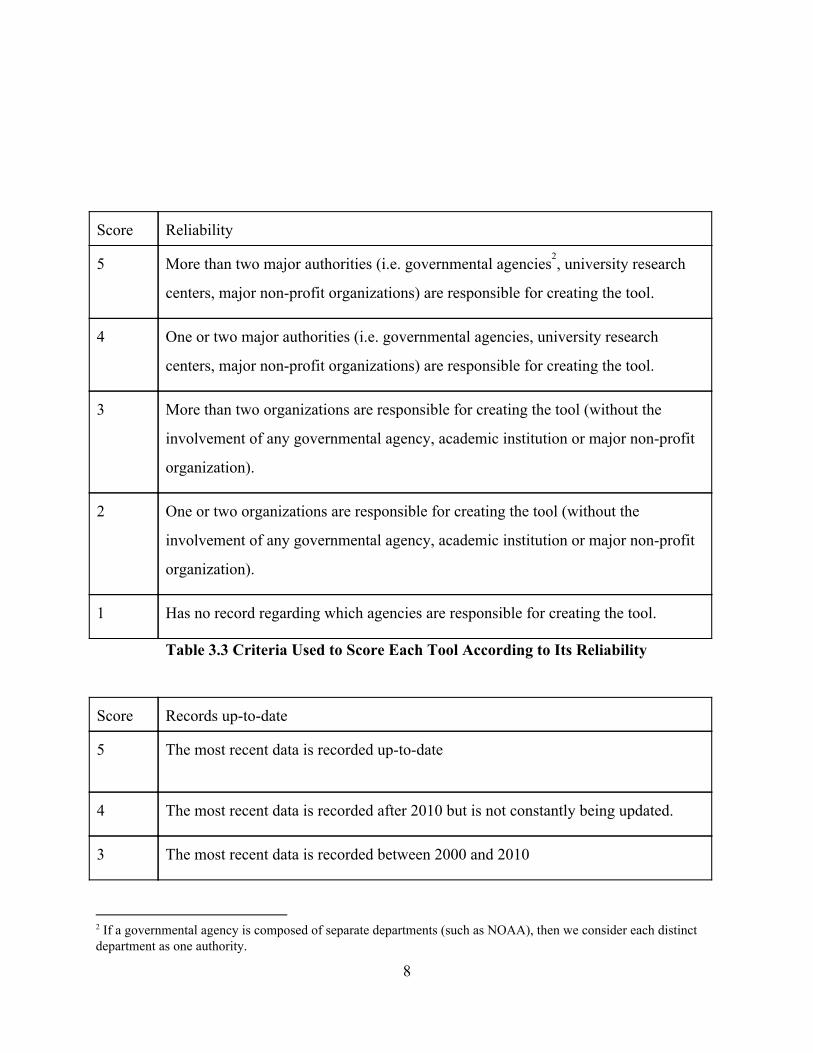
Score Reliability
5 More than two major authorities (i.e. governmental agencies , university research 2
centers, major nonprofit organizations) are responsible for creating the tool.
4 One or two major authorities (i.e. governmental agencies, university research
centers, major nonprofit organizations) are responsible for creating the tool.
3 More than two organizations are responsible for creating the tool (without the
involvement of any governmental agency, academic institution or major nonprofit
organization).
2 One or two organizations are responsible for creating the tool (without the
involvement of any governmental agency, academic institution or major nonprofit
organization).
1 Has no record regarding which agencies are responsible for creating the tool.
Table 3.3 Criteria Used to Score Each Tool According to Its Reliability
Score Records uptodate
5 The most recent data is recorded uptodate
4 The most recent data is recorded after 2010 but is not constantly being updated.
3 The most recent data is recorded between 2000 and 2010
2 If a governmental agency is composed of separate departments (such as NOAA), then we consider each distinct department as one authority.
8

2 The most recent data is recorded in the 20th century
1 The most recent data is recorded before the 20th century
Table 3.4 Criteria Used to Score Each Tool According to Whether the Data is UpToDate
In conclusion, the inventory is a comprehensive and convenient collection of climate
change tools relevant to the main research goals of TBF. Additionally, the fourdimensional
evaluation system can be a framework of inventory construction for similar scientific studies in
the future.
9

3.2 Vulnerability Assessment
The second part of our project focuses on the vulnerability assessment of a specific aspect
of climate change by employing several tools from our inventory. Our choice is Goal #9 from the
Bay Restoration Plan “Restoring Rocky Intertidal and Subtidal Habitats” with a concentration
on two of its subobjectives “Restoring and Monitoring Sixty Acres of Kelp Forest” and
“Protecting and Managing Rocky Intertidal Habitats.” We first did a literature review on the
impacts of climate change on kelp forests and abalone. Based on the arguments and conclusions
in the academic papers, we then selected several relevant tools from our inventory and studied
the historical data and trends of climate change presented in the tools. In the end, we applied the
selected tools to our chosen objectives and conducted the vulnerability assessment on how our
objectives will react to climate change.
Figure 3.2 Methodology Flow Chart
10
4. Literature Review
In this section, we present some previous research related to the impacts of climate
change on the populations, physiological responsiveness, and ecological performances of kelp
forest and abalone. We especially focus on two climate change stressors seawater temperature
rise and the increase in wave disturbances. There are two main reasons that we picked seawater
temperature and wave disturbance as stressors: first, stressors such as ocean acidification have
not occurred in the Santa Monica Bay area yet and no tool or article predicts that these stressors
will occur in future. Second, research and articles we found indicate that seawater temperature
and wave disturbances have significant impacts on kelp forest and abalone. However, when
talking about the impacts of climate change on abalone, most of the research results focus on
seawater temperature.
According to various studies, climate change has negatively affected the populations of
kelp forest in the following ways. First, kelps are cold water species. A healthy environment for
kelps should be nutrientrich with moderate water temperature ranging from 43 °F to 57 °F
(Thomas, 2006). In addition, based on the wellknown inverse relationship between nutrient
concentration and water temperature, it is natural to suspect that sea temperature rise will have a
direct and devastating effect on kelp forest habitats (Jackson, 1997, McPheeShaw et al., 2007,
Foster et al., 2015). Indeed, such an argument is well supported by a longterm controlled study
on giant kelps, in which the researchers manipulated water temperature in a small cove in Central
California to be 3.5 °C higher than normal for ten years (Schiel et al., 2004, Foster et al., 2015).
Most of the 172 subtidal species they studied demonstrated dramatic population decline and, in
particular, the abundance of Pterygophora californica and Laminaria setchelli, two subtidal
understory kelps, reduced by as much as 82%. Nereocystis luetkeana, a coldwater kelp, was
almost completely replaced by Macrocystis, a genus of giant kelp, showing that in addition to
kelp abundance, seawater temperature rise can also affect the distribution and diversity of kelp
forests (Steinbeck et al., 2005, Foster et al., 2015).
Warmer waters can also reduce the physiological responsiveness of kelp forests to
perturbations and their ecological performances (Wernberg et al., 2010). Wernberg et al. (2010)
surveyed kelp canopy cover, kelp biomass, and density of juvenile kelp within four regions of
11

subtidal rocky reefs in Western Australia. Poloczanka et al. (2007) predicted a temperature rise
of 2.0 °C 4.0 °C in these regions in the upcoming 25 years. Their research findings included a
negative relationship between seawater temperature and metabolic function, very likely resulting
from reduced pigment, nutrients, and enzymes (Wernberg et al. 2009). In other words, the higher
temperature could make kelp forests more sensitive to additional environmental impacts such as
extreme weather and reduced water quality, which could potentially lead to permanent loss of
habitat and ecological functions. In addition, Wernberg et al. (2010) showed that warmer ocean
climate could weaken the photosynthesis ability and recovery capacity of kelp recruits if changes
in the intensity of wave disturbances and light conditions occur.
Frequent large storm waves can also negatively affect kelp forest ecology. Climate
models predict increasing frequency of the occurrence of extreme weather events such as large
storms, extreme warm events, and significant wave disturbances. Such a trend will decrease the
diversity and complexity of food webs of giant kelp forests (Byrnes et al. 2011). Byrnes et al.
demonstrated this by modeling the effect of large wave disturbances on food webs using kelp
forest community data in the Santa Barbara Channel. By examining the impact of storm wave
disturbances on kelp abundance, kelp food web structure, and food chain length after the storms,
they showed that one year of large waves may, in fact, lead to an increase in complexity and
diversity of kelp food webs; whereas the effect of having frequent large stormdriven waves will
be destructive to kelp forest food webs, which is more relevant to the problems we are facing
now in the Santa Monica Bay area.
Rising seawater temperature can also indirectly damage kelp forest populations by
influencing the behaviors of major herbivores. In 2015, NASA discovered that global warming
has opened the door for invasive species such as algae, sea urchin, and tropical fishes, which has
severely endangered a number of native kelp species (Rocchio, L., 2014). The Invasive Species
Council of Australia published a blog in 2012 explaining how the invasive sea urchins threatened
the survival of local giant kelp forest. Since the 1940s in Tasmania, the water temperature has
experienced an average increase of 1.5 °C – 2.0 °C due to a southward shift of the warm east
Australian current (Stevens 2006). The current brings warm, nutrientpoor water from the Coral
Sea and larvae of sea urchins Centrostephanus rodgersii to the Tasmania coast, followed by the
12
establishment of large populations of sea urchins along the coast (Johnson et al. 2011, Foster et
al. 2015). Studies have shown that such an expansion of sea urchin populations coincided with a
massive decline of giant kelps, indicating that warming is detrimental for giant sea kelps and
helps sea urchins establish larger populations (Ling et al. 2009, Foster et al. 2015). Another
invasive species mentioned in the blog is the Japanese seaweed Undaria pinnatifida, which will
thrive and form dense stands as water temperature rises and will very likely to threaten giant kelp
forests as well.
In 2014, a team of scientists from the Smithsonian Environmental Research Center
conducted a search for a group of invasive species in eight popular kelp forest dive spots
between Monterey and Carmel, California. They found a bright red corallike creature, fanning
out like a head of baby lettuce, called Watersipora subtorquata, which spread to the local kelp
forests. Because scientists currently have very little knowledge about this species, it’s impossible
to predict what it will do to native kelp forests. The recent invasion of Sargassum horneri, a
brown alga native to northeast Asia, has been tracked, as this nonnative species rapidly becomes
established into southern California. Observations of this species suggest that it will have a much
greater impact on California kelp forests than the previous algal introduction as extensive kelp
habitat is now dominated by dense patches of this alien species, and it continues to spread. First
observed at Long Beach Harbor in 2003, S. horneri has since spread throughout kelp forests at
five of the eight Channel Islands (Kushner et al., 2011).
The migration of tropical fish, as a result of ocean warming, also poses a serious threat to
the temperate areas they invade, because they overgraze kelp forest seagrass meadows,
according to research conducted at the University of New South Wales. Although the negative
impact of invasive tropical fish species is more evident in southern Japanese waters and the
eastern Mediterranean, there is emerging evidence in Australia and the US that the invasion of
tropical fish towards the poles is causing damage in the areas they enter (Verges, 2014).
Kelp forests foster important habitats for many species, one of which is abalone; thus, the
deterioration of kelp forests has inevitably affected the population of abalone. Nutrient
concentration in water is negatively correlated to water temperature. This is mainly because the
increase of water temperature decreases the dissolved oxygen, phosphorus, and nitrogen
13
(Jackson 1997). The increase in water temperature would weaken the health of the kelp forest
and eventually lower the population of abalone. Experiments conducted by Friedman et al.(2000)
showed that the shell length and body mass of abalone experienced a significant decrease under
the condition of warm temperature and low food quantity. In addition to size and mass of
abalone, the reproduction of abalone is also affected by the warm temperature. Experimental
results of Vilchis et al. (2005) reveal that when exposed to warm water (18 °C) (with no other
stressor), 71% of male red abalone failed to produce sperm, and only 5% of male red abalone
had abundant sperm, while 78%83% wild abalone produced sperm and 25%32% wild male
abalone had abundance sperm (Vilchis et al. 2005). Meanwhile, those male exposed in warm
water had only 46,000 cells/mm3, while wild abalone males have 300,000 cells/mm3. Since it is
already discussed that the increase of water temperature will decrease the food resource of
abalone, food shortage is also a problem that abalone will face in future. Vilchis et al. (2005)
show that starvation also strongly affect reproduction of abalone: under the condition of
starvation, 71% of abalone failed to produce sperm, and none had abundant sperm. Warm water
temperature also affects female abalone. 97% percent of wild females have mature eggs, while in
the experiment (18 °C water temperature) this rate reduces to 83%. Wild females produce 2.8
million eggs per female on average, but females in the experiment have only 400,000 eggs per
female (Vilchis, 2005).
Moreover, the warmer temperature has been shown to cause infectious disease of abalone
such as Withering Syndrome (WS), a fatal bacterial disease characterized by a severely shrunken
body (Friedman et al, 2014). According to research by Harvell et al. (2009), pathogen outbreaks
due to climate change have caused serious declines and extinction in several species. One of the
species that has been affected is California red abalone, which has experienced serious
population decline due to infectious diseases associated with warming water. Specifically, the
increase in seawater temperatures has contributed to “[drive] both transmission of the rickettsial
agent and development of associated clinical disease (WS) in red abalone” (Harvell et al. 2009,
3). In fact, abalone can carry bacterium without showing clinical sign of WS, and the developing
of the disease is associated with seawater temperature (Friendman et al., 2014). An investigation
by Steinbeck et al (2012) shows that animals with clinical sign of WS are exclusively found in
14
the thermal discharge zone where the water temperature is up to 11 °C higher than ambient.
Meanwhile, WS among abalone is always associated with thermal events such as severe ENSO.
For example, when severe ENSO occurred in 19971998, up to 70% of black abalone at
surveyed field sites showed clinical signs of WS (Friedman et al, 2014).
15
5. Methods
Based on the background research, we found that some of the main climate change
stressors, which can directly influence the population and behaviors of kelp forest and abalone,
include warmer seawater temperature, ocean acidification, and increase in storminess. We did
not include the other main climate change stressors such as rising sea level and change in
precipitation level because they do not directly relate to our project objectives. We used four
climate change tools in total: “California's Ocean in an El Nino Year” (CeNCOOS 2016), the
California Swell Model Archive supported by Coastal Data Information Program (CSIP), the
Ocean Acidification Hotspot plot by NRDC (NRDC 2016), and the Marine Invasive Observation
Map (OSU, 2015).
“California's Ocean in an El Nino Year” (CeNCOOS 2016) is a climate change tool that
monitors the ocean temperature change in California’s coast over the past 35 years. Users can
pick several specific locations in the west coast and access the seawater temperature data in these
locations. The California Swell Model Archive supported by Coastal Data Information Program
(CSIP) records all wave heights measured by a buoy placed in the Santa Monica Bay area over
the year 20042015. The Ocean Acidification Hotspot generated by NRDC plots the coastal
region in California that is most subject to ocean acidification over the past few years. The
Marine Invasive Observation Map, provided by the Oregon State University, monitors the trends
and synthesis of Pacific rocky intertidal zones.
16
6. Analysis and Results
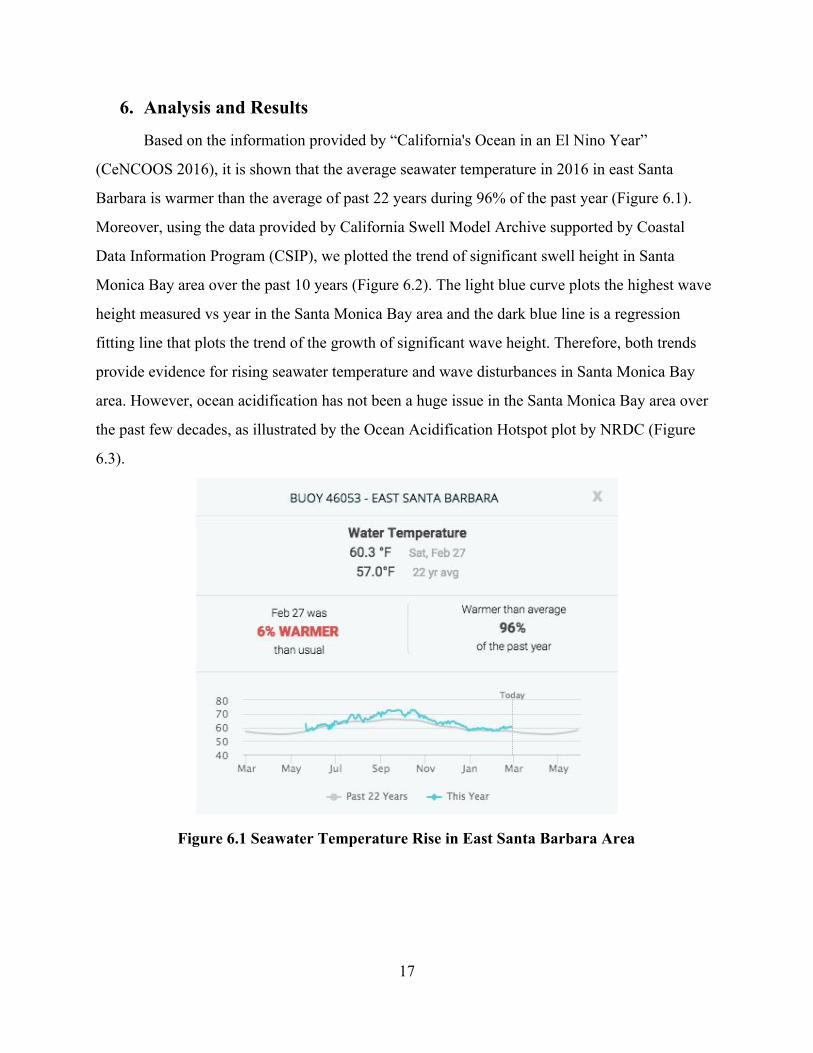
Based on the information provided by “California's Ocean in an El Nino Year”
(CeNCOOS 2016), it is shown that the average seawater temperature in 2016 in east Santa
Barbara is warmer than the average of past 22 years during 96% of the past year (Figure 6.1).
Moreover, using the data provided by California Swell Model Archive supported by Coastal
Data Information Program (CSIP), we plotted the trend of significant swell height in Santa
Monica Bay area over the past 10 years (Figure 6.2). The light blue curve plots the highest wave
height measured vs year in the Santa Monica Bay area and the dark blue line is a regression
fitting line that plots the trend of the growth of significant wave height. Therefore, both trends
provide evidence for rising seawater temperature and wave disturbances in Santa Monica Bay
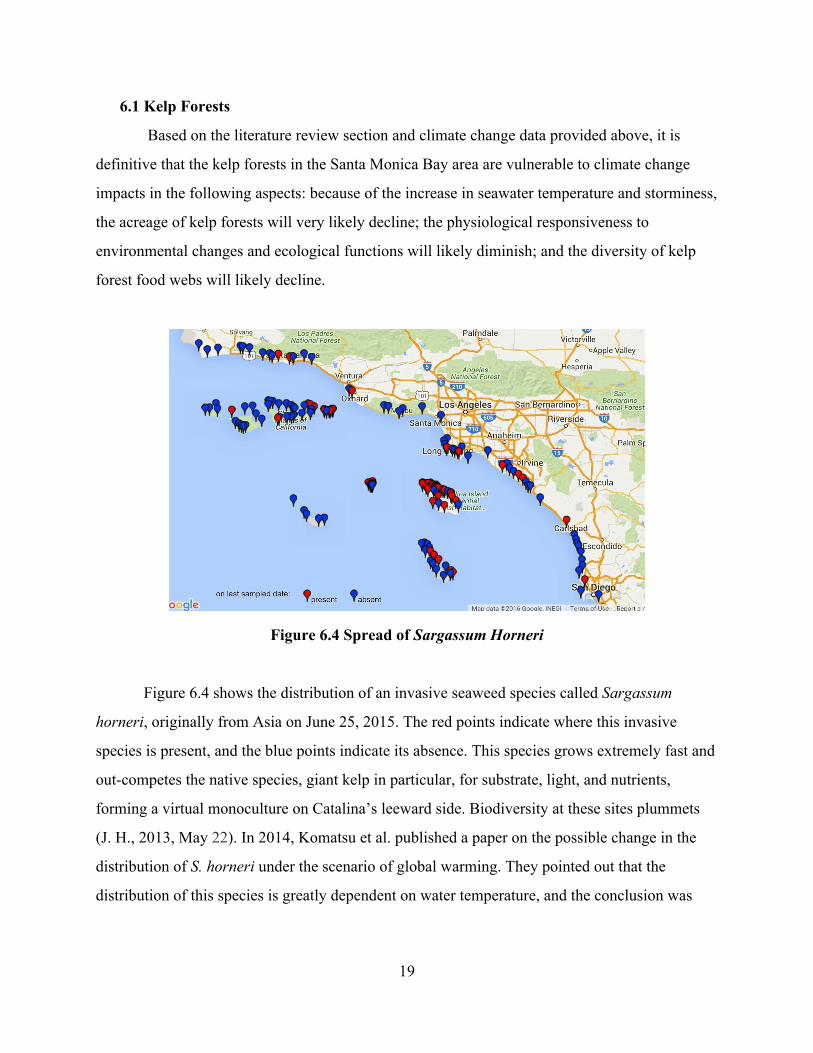
area. However, ocean acidification has not been a huge issue in the Santa Monica Bay area over
the past few decades, as illustrated by the Ocean Acidification Hotspot plot by NRDC (Figure
6.3).
Figure 6.1 Seawater Temperature Rise in East Santa Barbara Area
17
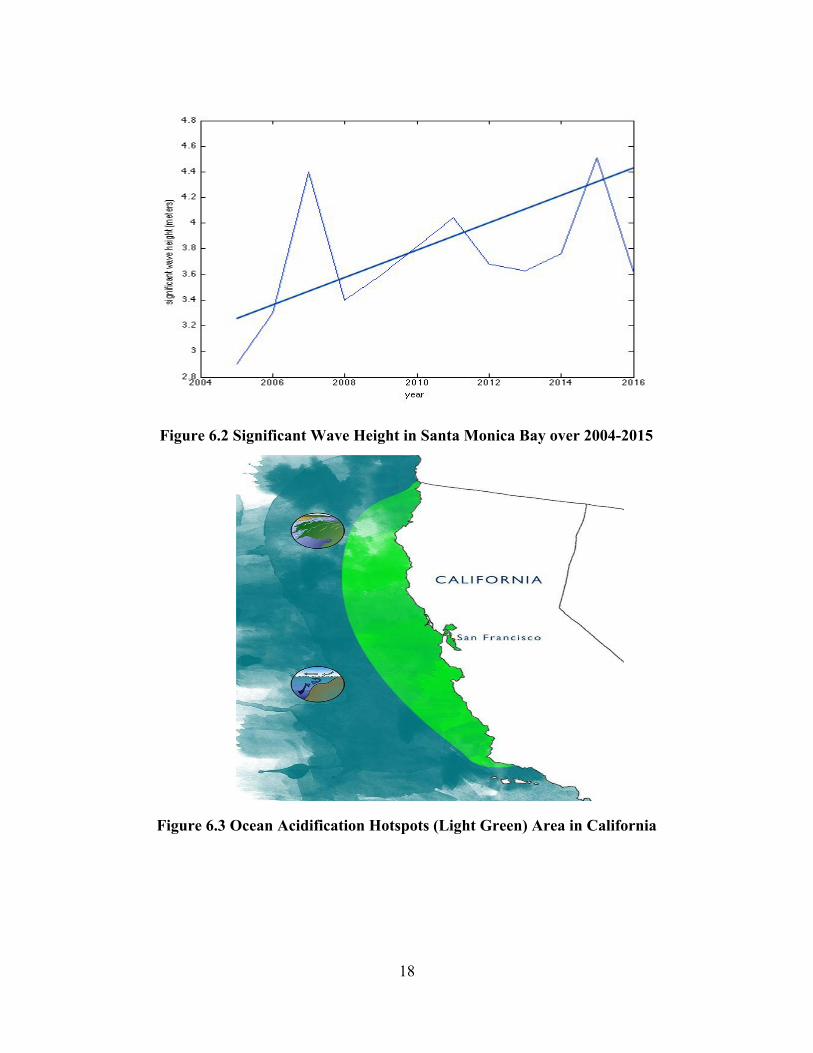
Figure 6.2 Significant Wave Height in Santa Monica Bay over 20042015
Figure 6.3 Ocean Acidification Hotspots (Light Green) Area in California
18
6.1 Kelp Forests
Based on the literature review section and climate change data provided above, it is
definitive that the kelp forests in the Santa Monica Bay area are vulnerable to climate change
impacts in the following aspects: because of the increase in seawater temperature and storminess,
the acreage of kelp forests will very likely decline; the physiological responsiveness to
environmental changes and ecological functions will likely diminish; and the diversity of kelp
forest food webs will likely decline.
Figure 6.4 Spread of Sargassum Horneri
Figure 6.4 shows the distribution of an invasive seaweed species called Sargassum
horneri, originally from Asia on June 25, 2015. The red points indicate where this invasive
species is present, and the blue points indicate its absence. This species grows extremely fast and
outcompetes the native species, giant kelp in particular, for substrate, light, and nutrients,
forming a virtual monoculture on Catalina’s leeward side. Biodiversity at these sites plummets
(J. H., 2013, May 22). In 2014, Komatsu et al. published a paper on the possible change in the
distribution of S. horneri under the scenario of global warming. They pointed out that the
distribution of this species is greatly dependent on water temperature, and the conclusion was
19
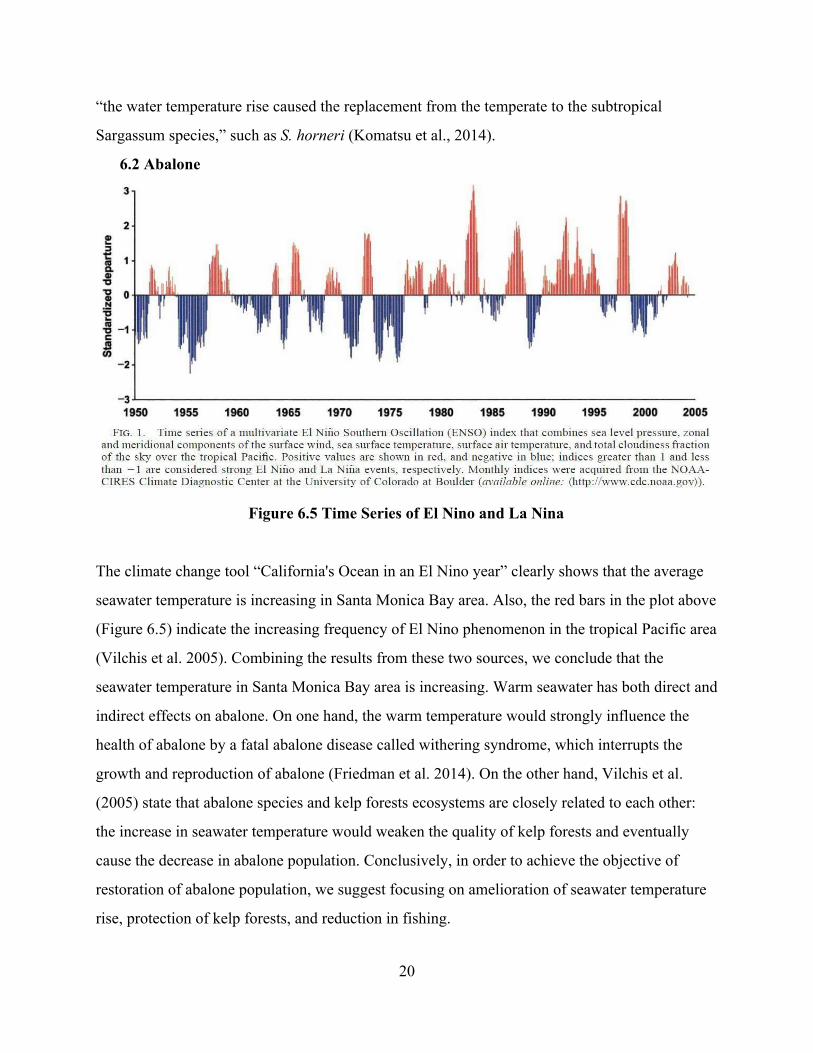
“the water temperature rise caused the replacement from the temperate to the subtropical
Sargassum species,” such as S. horneri (Komatsu et al., 2014).
6.2 Abalone
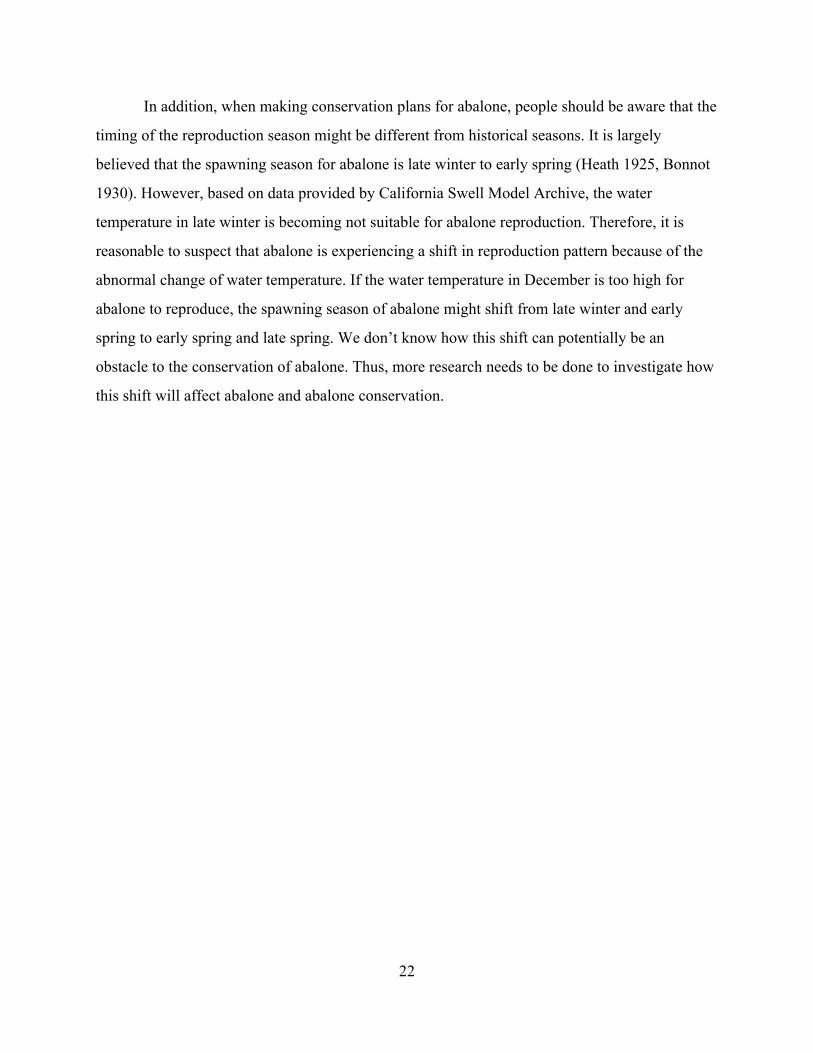
Figure 6.5 Time Series of El Nino and La Nina
The climate change tool “California's Ocean in an El Nino year” clearly shows that the average
seawater temperature is increasing in Santa Monica Bay area. Also, the red bars in the plot above
(Figure 6.5) indicate the increasing frequency of El Nino phenomenon in the tropical Pacific area
(Vilchis et al. 2005). Combining the results from these two sources, we conclude that the
seawater temperature in Santa Monica Bay area is increasing. Warm seawater has both direct and
indirect effects on abalone. On one hand, the warm temperature would strongly influence the
health of abalone by a fatal abalone disease called withering syndrome, which interrupts the
growth and reproduction of abalone (Friedman et al. 2014). On the other hand, Vilchis et al.
(2005) state that abalone species and kelp forests ecosystems are closely related to each other:
the increase in seawater temperature would weaken the quality of kelp forests and eventually
cause the decrease in abalone population. Conclusively, in order to achieve the objective of
restoration of abalone population, we suggest focusing on amelioration of seawater temperature
rise, protection of kelp forests, and reduction in fishing.
20

7. Solutions
Regarding the impact of invasive species on kelp forest, although most experts agree that
it is almost impossible to eradicate Sargassum horneri completely (Kushner et al., 2011),
smallscale removal experiments may be an effective way to improve our understanding of this
alga’s effects on kelp forest communities. Channel Islands National Park’s longterm kelp forest
monitoring program (KFMP) is one example of such an effort. It is designed to observe
differences between areas inside and adjacent to marine reserves. “Removal plots situated inside
and outside marine reserves may demonstrate whether reserves provide increased resilience to
invasive species” (Kushner, D. J., 2011).
For restoring abalone stocks, the first step is to establish marine protected areas (MPAs).
For example, the Bay Foundation could consider establishing protected areas, functioning as
breeding centers for abalone, at 510 mile intervals along the coast of the Santa Monica bay. This
could help abalone maintain a minimum viable population. (Karpov, K., 2000)
Besides the survival of abalone, reproduction success is also important for restoring
abalone habitats. The continuous increase of seawater temperature, for example, might cause the
shift of abalone distribution because the historical abalone regions might become harsh for
abalone in the future due to sea water temperature rising. It is not adequate if we only restore
abalone at current abalone regions. Therefore, we recommend that the Bay Foundation consider
establishing restoration areas deeper or further north than current abalone regions.
(RogersBennett et al. 2010)
Moreover, we recommend that the Bay Foundation monitor the seawater temperature
during spawning season of abalone because the reproduction of abalone is closely associated
with water temperature. The optimal water temperature for abalone reproduction is 12°C
(RogersBennett et al. 2010). If the water temperature during the spawning season is higher than
12°C, the reproduction rate of abalone will be quite low, and abalone will even stop breeding.
Therefore, if abalone experience a high water temperature (> 12°C) during spawning season, it is
probably a good idea to request a reduction of fishery activities in that year to protect the
population of abalone.
21
In addition, when making conservation plans for abalone, people should be aware that the
timing of the reproduction season might be different from historical seasons. It is largely
believed that the spawning season for abalone is late winter to early spring (Heath 1925, Bonnot
1930). However, based on data provided by California Swell Model Archive, the water
temperature in late winter is becoming not suitable for abalone reproduction. Therefore, it is
reasonable to suspect that abalone is experiencing a shift in reproduction pattern because of the
abnormal change of water temperature. If the water temperature in December is too high for
abalone to reproduce, the spawning season of abalone might shift from late winter and early
spring to early spring and late spring. We don’t know how this shift can potentially be an
obstacle to the conservation of abalone. Thus, more research needs to be done to investigate how
this shift will affect abalone and abalone conservation.
22
8. Future Work
First, almost all of the climate change tools we found and included in our inventory are
online user interfaces. However, there are still a large number of climate change tools taking the
form of scientific journals, scholarly articles, and databases that we did not assess in this study.
Thus, as an area for future work, we recommend investigating as many types of climate change
tools as possible, as they will likely help TBF bridge the data gaps mentioned below and conduct
a more thorough vulnerability assessment.
Second, throughout this project, we did not consider the effect of sealevel rise and ocean
acidification on kelp forests and abalones because of limited time and data gaps. Compared to
rising seawater temperature and storminess, there was a relatively limited amount of evidence we
could find that links sea level rise with kelp forest and abalone population. Therefore, even
though we did not consider the effect of sea level rise on kelp forest and abalone due to the time
limit, it doesn’t necessarily mean that sea level rise won’t be a contributor to the decline of these
two species. In addition, despite the current low level of ocean acidification near the Santa
Monica Bay area, we have not found any tool that predicts the ocean acidification level in the
near future and therefore cannot guarantee that the level won’t significantly increase. Given that
our literature review provided evidence for a positive correlation between rising ocean
acidification level and the decline in kelp forests population (not included in the report), if the
ocean acidification level does increase in the near future, it will have a devastating effect on both
species. Thus, for future work, we recommend investigating the effect of sea level rise on
abalones and kelp forests, and we recommend researching climate change tools that make
predictions about ocean acidification level near the Santa Monica Bay.
In addition to the two objectives considered in this report restoring and monitoring kelp
forest and abalone population, Goal 9 in the Bay Restoration Plan also includes two more
objectives the restoration of intertidal habitats and the protection of seagrass habitats. To make
a thorough vulnerability assessment of Goal 9, we recommend that TBF also consider and
evaluate the impacts of climate change on these two objectives.
23

9. Bibliography
Bonnot, Paul. 1930. Abalones in California. Calif. Fish & Game., 16 (1):1523.
Bouma, J. V. 2007. Early life history dynamics of pinto abalone (Haliotis kamtschatkana) and
implications for recovery in the San Juan archipelago , Washington state. University of
Washington.
Byrnes, J. E., Reed, D. C., Cardinale, B. J., Cavanaugh, K. C., Holbrook, S. J.
and Schmitt, R. J. (2011), Climatedriven increases in storm frequency simplify kelp
forest food webs. Global Change Biology, 17: 2513–2524.
doi:10.1111/j.13652486.2011.02409.x
California's Ocean in an El Nino Year (CeNCOOS). Retrieved February 27, 2016, from
http://www.cencoos.org
Friedman, Cs, N. Wight, Gr Vanblaricom, I. Kiryu, Jd Moore, and Lm Crosson. "Abalone
Withering Syndrome: Distribution, Impacts, Current Diagnostic Methods and New
Findings." Diseases of Aquatic Organisms Dis. Aquat. Org. 108.3 (2014): 26170. Web.
Friedman, C. S., Andree, K. B., Beauchamp, K. A., Moore, J. D., Robbins, T. T., Shields, J. D.,
& Hedrick, R. P. (2000). 'Candidatus Xenohaliotis californiensis', a newly described
pathogen of abalone, Haliotis spp., along the west coast of North America. International
Journal of Systematic and Evolutionary Microbiology, 50(6 part 2), 847855.
Harvell, D., Altizer, S., Cattadori, I. M., Harrington, L. and Weil, E. (2009), “Climate change
and wildlife diseases: When does the host matter the most?.” Ecology, 90: 912–920.
doi:10.1890/080616.1
Heath, H. 1925. The abalone question. Calif. Fish & Game., 11(3): 138139.
J. H. (2013, May 22). USC Dornsife Scientific Diving: An Analysis of Sargassum Horneri
Ecosystem Impact. Retrieved February 27, 2016, from
http://blogs.scientificamerican.com/expeditions/uscdornsifescientificdivingan
analysisofsargassumhorneriecosystemimpact/
Karpov K., Haaker P., Taniguchi I., RogersBennett Laura 2000. Serial depletion and the
collapse of the California abalone (Haliotis spp.) fishery. Canadian Special Publication of
24

Fisheries and Aquatic Sciences (pp. 1124). National Research Council of Canada.
Retrieved from
https://www.researchgate.net/publication/228491870_Serial_depletion_and_collapse_of_
the_California_Haliotis_spp_fishery
Kushner, D. J. (2011). Alien species and a changing world: Will kelp forests ever be the same?
Retrieved February 27, 2016, from
http://www.georgewright.org/gws2011_poster_kushner.pdf
Michael S. Foster, David R. Schiel 2015. The Biology and Ecology of Giant Kelp Forests (1st
ed., pp. 319–382). University of California Press. Retrieved from
http://www.jstor.org/stable/10.1525/j.ctt14btfvw.21
National Data Buoy Center. Retrieved February 27, 2016, from
http://www.ndbc.noaa.gov/historical_data.shtml
NOAA, Economic Importance: Kelp Forest 1999. http://www.w3.org/1999/xhtml
Ocean Acidification California, NRDC, Retrieved March 22, 2016, from
http://www.nrdc.org/oceans/acidification/california.asp
Poloczanska, E.S., Babcock, R.C., Butler, A., Hobday, A.J., HoeghGuldberg, O., Kunz, T.J. et
al. (2007). Climate change and Australian marine life. Oceanogr. Mar. Biol. Ann. Rev.,
45, 407–478.
Pacific Rocky Intertidal Monitoring: Trends and Synthesis. (2015, June 25). Retrieved February
27, 2016, from http://gordon.science.oregonstate.edu/marineinvasive/map.html
Rocchio, L. (2014, December 19). Finding Floating Forests: It Takes an Online Village to Map
Massive Kelp. Retrieved February 27, 2016, from
http://earthobservatory.nasa.gov/Features/FloatingForests/page3.php
RogersBennett, Laura, Richard F. Dondanville, James D. Moore, and L. Ignacio Vilchis.
"Response of Red Abalone Reproduction to Warm Water, Starvation, and Disease
Stressors: Implications of Ocean Warming." Journal of Shellfish Research 29.3 (2010):
599611.
Steinbeck JR, Groff JM, Friedman CS, McDowell T, Hedrick RP (1992) Investigations into a
25
mortality among populations of the California black abalone, Haliotis cra che rodii, on
the central coast of California. In: Shepard SA, Tegner MJ, Guzmán del Próo SA (eds)
Abalone of the world: biology, fisheries and culture. Fishing News Books, Cambridge,
MA, p 203–213
Stevens, D. (2006). Climate Impacts and Kelp Forest. Retrieved February 27, 2016, from
http://www.sahfos.ac.uk/climate encyclopaedia/kelpforest.html
Thomas, D. 2002. Seaweeds. The Natural History Museum, London, p. 15.
Vilchis, L. I., Tegner, M. J., Moore, J. D., Friedman, C. S., Riser, K. L., Robbins, T. T., &
Dayton, P. K. (2005). Ocean warming effects on growth, reproduction, and survivorship
of Southern California abalone. Ecological Applications, 15(2), 469480.
doi:10.1890/035326
Wernberg, T., Thomsen, M. S., Tuya, F., Kendrick, G. A., Staehr, P. A. and Toohey, B. D.
(2010), Decreasing resilience of kelp beds along a latitudinal temperature gradient:
potential implications for a warmer future. Ecology Letters, 13: 685–694.
doi:10.1111/j.14610248.2010.01466.x
26

![Vulnerability Scanning & Management...scanner [3]. Vulnerability Scanning This paper presents a typical vulnerability scanning process conducted on a target using Nessus Vulnerability](https://static.documents.pub/doc/80x56/5f04b77f7e708231d40f5a14/vulnerability-scanning-management-scanner-3-vulnerability-scanning.jpg)


