Revista Brasileira de Recursos Hídricos Brazilian Journal of Water Resources Versão On-line ISSN 2318-0331 RBRH, Porto Alegre, v. 22, e21, 2017 Scientific/Technical Article http://dx.doi.org/10.1590/2318-0331.011716074 This is an Open Access article distributed under the terms of the Creative Commons Attribution License, which permits unrestricted use, distribution, and reproduction in any medium, provided the original work is properly cited. Climate changes impact estimation on urban drainage system located in low latitudes districts: a study case in Fortaleza-CE Avaliação do impacto das mudanças climáticas no sistema de drenagem urbana em localidades situadas em baixas latitudes: um estudo de caso em Fortaleza-CE Marcos Abílio Medeiros de Sabóia 1 , Francisco de Assis de Souza Filho 1 , Luiz Martins de Araújo Júnior 1 and Cleiton da Silva Silveira 2 1 Universidade Federal do Ceará, Fortaleza, CE, Brazil 2 Universidade da Integração Internacional da Lusofonia Afro-Brasileira, Redenção, CE, Brazil E-mails: [email protected] (MAMS), [email protected] (FASF), [email protected] (LMAJ), [email protected] (CSS) Received: June 02, 2016 - Revised: October 27, 2016 - Accepted: November 20, 2016 ABSTRACT The observed changes in extreme weather events reflect the influence of climate change caused by anthropogenic factors, in addition to natural climate variability. According to future climate projections, the increase in the average surface temperature will cause major changes in the average annual rainfall of almost the entire planet. The primary objective of this study is to evaluate the impact of possible scenarios of climate change on urban drainage system in locations situated at low latitudes. The specific location of the study was one of the Rio Cocó sub-basins in the city of Fortaleza-CE. It was used rainfall data generated by 6 (six) different global circulation models: bcc-CSM1, CanESM2, CCSM4, CESM1-CAM5, inmcm4 and MIROC5. These data were extracted and interpolated to the city of Fortaleza-CE. This information was used in order to generate new IDF equations designed for the future, by using the “Equidistance Quantile Matching Method”, based on climate projections RCP 4.5 and RCP 8.5. The new values of rainfall generated by these new IDF curves were used as input data to HEC-HMS program, which is capable of calculating flow and volume disposed in a particular basin. The results showed that large increases in flow rates and volumes disposed in the analyzed drainage system will occur, and that the RCP 8.5 scenario presented even more pronounced values than the ones generated by the scenario RCP 4.5. Keywords: Climate changes; IDF curves; Global circulation models; Urban drainage. RESUMO As alterações observadas nos eventos climáticos extremos refletem a influência das mudanças climáticas ocasionados for fatores antropogênicos, além da variabilidade natural do clima. Segundo projeções climáticas futuras, o aumento da temperatura média da superfície terrestre, ocasionará fortes mudanças nas precipitações médias anuais de quase todo o planeta. O objetivo primordial desse artigo é avaliar o impacto dos possíveis cenários de mudanças climáticas em sistemas de drenagem urbana localizados em baixas latitudes. O local específico do estudo foi uma das sub-bacias do Rio Cocó, na cidade de Fortaleza-CE. Foram utilizados dados de precipitações oriundos de 6 (seis) modelos de circulação global, são eles: bcc-csm1, CanESM2, CCSM4, CESM1-CAM5, inmcm4 e MIROC5. Esses dados foram extraídos e interpolados para a cidade de Fortaleza-CE. Essas informações foram utilizadas com o intuito de gerar novas equações IDF projetadas para o futuro, através da utilização do “Método da Correspondência de Quantis Equidistantes”, baseadas nas projeções climáticas RCP 4,5 e RCP 8,5. Os novos valores de precipitação gerados por essas novas curvas IDFs foram utilizados como um dos dados de entrada do programa HEC-HMS. Os resultados mostraram que devem ocorrer grandes aumentos nas vazões e volumes escoados no sistema de drenagem analisado, sendo que o cenário RCP 8.5 apresentou valores ainda mais acentuados do que o gerado pelo cenário RCP 4,5. Palavras-chave: Mudanças climáticas; Curvas IDF; Modelos de circulação global; Drenagem urbana.
Transcript
Revista Brasileira de Recursos HídricosBrazilian Journal of Water ResourcesVersão On-line ISSN 2318-0331RBRH, Porto Alegre, v. 22, e21, 2017Scientific/Technical Article
http://dx.doi.org/10.1590/2318-0331.011716074
This is an Open Access article distributed under the terms of the Creative Commons Attribution License, which permits unrestricted use, distribution, and reproduction in any medium, provided the original work is properly cited.
Climate changes impact estimation on urban drainage system located in low latitudes districts: a study case in Fortaleza-CE
Avaliação do impacto das mudanças climáticas no sistema de drenagem urbana em localidades situadas em baixas latitudes: um estudo de caso em Fortaleza-CE
Marcos Abílio Medeiros de Sabóia1, Francisco de Assis de Souza Filho1, Luiz Martins de Araújo Júnior1 and Cleiton da Silva Silveira2
1Universidade Federal do Ceará, Fortaleza, CE, Brazil 2Universidade da Integração Internacional da Lusofonia Afro-Brasileira, Redenção, CE, Brazil
Received: June 02, 2016 - Revised: October 27, 2016 - Accepted: November 20, 2016
ABSTRACT
The observed changes in extreme weather events reflect the influence of climate change caused by anthropogenic factors, in addition to natural climate variability. According to future climate projections, the increase in the average surface temperature will cause major changes in the average annual rainfall of almost the entire planet. The primary objective of this study is to evaluate the impact of possible scenarios of climate change on urban drainage system in locations situated at low latitudes. The specific location of the study was one of the Rio Cocó sub-basins in the city of Fortaleza-CE. It was used rainfall data generated by 6 (six) different global circulation models: bcc-CSM1, CanESM2, CCSM4, CESM1-CAM5, inmcm4 and MIROC5. These data were extracted and interpolated to the city of Fortaleza-CE. This information was used in order to generate new IDF equations designed for the future, by using the “Equidistance Quantile Matching Method”, based on climate projections RCP 4.5 and RCP 8.5. The new values of rainfall generated by these new IDF curves were used as input data to HEC-HMS program, which is capable of calculating flow and volume disposed in a particular basin. The results showed that large increases in flow rates and volumes disposed in the analyzed drainage system will occur, and that the RCP 8.5 scenario presented even more pronounced values than the ones generated by the scenario RCP 4.5.
Keywords: Climate changes; IDF curves; Global circulation models; Urban drainage.
RESUMO
As alterações observadas nos eventos climáticos extremos refletem a influência das mudanças climáticas ocasionados for fatores antropogênicos, além da variabilidade natural do clima. Segundo projeções climáticas futuras, o aumento da temperatura média da superfície terrestre, ocasionará fortes mudanças nas precipitações médias anuais de quase todo o planeta. O objetivo primordial desse artigo é avaliar o impacto dos possíveis cenários de mudanças climáticas em sistemas de drenagem urbana localizados em baixas latitudes. O local específico do estudo foi uma das sub-bacias do Rio Cocó, na cidade de Fortaleza-CE. Foram utilizados dados de precipitações oriundos de 6 (seis) modelos de circulação global, são eles: bcc-csm1, CanESM2, CCSM4, CESM1-CAM5, inmcm4 e MIROC5. Esses dados foram extraídos e interpolados para a cidade de Fortaleza-CE. Essas informações foram utilizadas com o intuito de gerar novas equações IDF projetadas para o futuro, através da utilização do “Método da Correspondência de Quantis Equidistantes”, baseadas nas projeções climáticas RCP 4,5 e RCP 8,5. Os novos valores de precipitação gerados por essas novas curvas IDFs foram utilizados como um dos dados de entrada do programa HEC-HMS. Os resultados mostraram que devem ocorrer grandes aumentos nas vazões e volumes escoados no sistema de drenagem analisado, sendo que o cenário RCP 8.5 apresentou valores ainda mais acentuados do que o gerado pelo cenário RCP 4,5.
Climate changes impact estimation on urban drainage system located in low latitudes districts: a study case in Fortaleza-CE
INTRODUCTIONIn order to avoid possible flooding, an urban drainage system
is required for capturing and conducting stormwater. Changes in maximum precipitation intensity associated with climate changes have the potential to overburden drainage systems, which can lead to flooding, local pathway impairment, worsening of waterborne diseases, and increased risk of human and material losses as well.
The Intergovernmental Panel on Climate Change (IPCC) defines the term climate changes as being a certain change in climate, which can be identified by changes in the mean and/or variation of its properties, and that persists for an extended period, usually for decades. Climate change may be due to several reasons like: natural processes of the planet itself or from external forces, from anthropogenic changes that can modify the composition of the atmosphere or in land use (UNISDR, 2009).
Precipitation patterns are directly affected by the change in global mean temperature, which is strongly related to the increase of gases in the atmosphere, such as: carbon dioxide, methane and nitrous oxide (IPCC, 2013). Increases in total rainfall volumes, as well as their intensities, can cause strong impacts on urban drainage systems. According to Clausius-Clapeyron equation, the increase in global mean temperature, should also increase the saturation vapor pressure of the atmosphere, causing the atmosphere to have its capacity to retain water lowered, causing more intense precipitations (PHILLIP, 2011). Due to global warming and as a result of anthropogenic actions, Allan and Soden (2008) suggest that extreme precipitations events will become more common. In addition, Marengo et al. (2013) indicate that these extreme events should also become more frequent and intense in Brazil.
The impacts of climate changes, combined with accelerated urbanization and the deterioration of the already depleted urban infrastructure, for example, may be one of the reasons of urban floods (PHILLIP; ANTON; STEEN, 2011).
Zhou (2012) conducted studies on the effect of climate changes in the urban drainage system in Skibhus, Denmark. In his work, he concludes that a given rated rainfall with a 100-year return period will be equivalent to a 20-year return period rainfall, considering a future scenario of climate change projected for the horizon of 100 years.
The intensity-duration-frequency (IDF) equation, or IDF curve, is extremely important in the projection of the rated rainfall to be used in the design of hydraulic facilities, such as gutters, culverts, manholes, galleries and channels (SILVA; PALÁCIO JÚNIOR; CAMPOS, 2013). With the increase in the frequency of extreme precipitation events, changes in the IDF curves are likely to occur, imposing the need to update them (SCHARDONG; SRIVASTAV; SIMONOVIC, 2014b). For this purpose, precipitation data from Global Circulation Models (GCM) may be used.
GCMs are one of the most advanced tools available to estimate the response of the global climate system to the increase of greenhouse gases levels (IPCC, 2007). These models incorporate the expectations of changes in precipitation, based on climate changes. They are able to numerically model the physical processes of the atmosphere, ocean, cryosphere and terrestrial surface.
There is a large number of GCMs, whose results are provided by various research centers around the world, and that may vary in accuracy, depending on their spatial grid resolution. They are able to project changes in the terrestrial atmosphere caused by
the promoting elements of global warming, especially greenhouse gases (SRIVASTAV; SCHARDONG; SIMONOVIC, 2015).
Mirhosseini, Srivastava and Stefanova (2012) used data from global and regional models to update the Alabama IDF curves. The analysis of the results indicated that some models pointed to a decrease or increase in the maximum rainfall intensity, depending on the return period used.
Hassanzadeh, Nazemi and Elshorbagy (2013) also used data from GCM models in order to estimate the IDF curves projected for the future city of Saskatoon, Canada. Their studies have pointed to an increase in extreme short-term precipitation with low return periods.
Authors such as Schardong, Srivastav and Simonovic (2014b) used GCM CanESM2 precipitation data to update IDF curves in four Canadian cities: London, Hamilton, Calgary, and Vancouver. The results indicated that for any simulated scenario there should be an increase in the intensity of maximum rainfall for all return periods. Schardong, Srivastav and Simonovic (2014a) again made use of the information generated by the same GCM to forecast the IDF equation to the city of São Paulo for future years. The results show a tendency of increase in extreme precipitation.
According to Emori and Brown (2005), many regions of the planet, located in medium and high latitudes, should considerably increase their average and extreme precipitations.
The objective of this article is to estimate the possible impacts of these changes in low-latitude locations, by obtaining new IDF curves based on projections of GCM models and using the “Equidistance Quantile Matching Method” described by Srivastav, Schardong and Simonovic (2015), as a statistical downscaling tool.
In addition, these new rainfall intensities were used as one of the input variables of the HEC-HMS hydrological model, aiming to evaluate the impacts on peak flows and volumes drained by an urban drainage system located in low latitude, more precisely in the city of Fortaleza.
Thus, the performed study can serve as a tool to carry out a more robust and solid planning of the aforementioned system based on the information provided by GCM models.
METHODOLOGYThe methodological steps used can be summarized in
Figure 1.In order to incorporate possible climatic changes, 12 (twelve)
possible IDF equations were calculated, based on daily precipitation data from six global circulation models and the RCP 4.5 and RCP 8.5 projections.
Global Circulation Models and Downscaling
As a drawback, GCMs have spatial resolutions incompatible with the size of a river basin. Thus, it is needed to get a connection between the data obtained by these models and the equivalent ones in a more accurate resolution (closer to reality). One of the techniques used to perform this connection is called downscaling, which can be subdivided into two types: dynamic and statistical.
Dynamic downscaling is based on limited area models or on the use of extremely high resolution circulation models to simulate local conditions. Statistical downscaling is based on
RBRH, Porto Alegre, v. 22, e21, 2017
Sabóia et al.
transfer functions, used to relate global circulation models and study sites, i.e., a mathematical relationship is established between the data generated by these models and the precipitation data observed in the study area. Based on the above, it is understood that the “Equidistance Quantile Matching Method” refers to the use of the technique called statistical downscaling (SRIVASTAV; SCHARDONG; SIMONOVIC, 2015).
This method has two main branches to be followed, the first one indicates that it is necessary to relate the data referring to the maximum daily rains generated by GCM and the maximum sub-daily rains extracted from the observed data, this procedure describes the performed spatial downscaling. The second one refers to performing of “temporal downscaling” relating the maximum daily rainfall generated by GCM and the maximum daily rainfall relative to the GCM future projections (SRIVASTAV; SCHARDONG; SIMONOVIC, 2015). That is, at first it is established the relationship between observed historical data and the data obtained by GCM (bias correction). Then, the changes for possible future situations are estimated, based on the RCP scenarios. The Flowchart 1 expresses more clearly the methodology to be followed for its correct application.
Flowchart 1. Equidistance Quantile Matching Method. Source: Adapted from Srivastav, Schardong and Simonovic (2015).
Figure 1. Flowchart of methodological steps.
RBRH, Porto Alegre, v. 22, e21, 2017
Climate changes impact estimation on urban drainage system located in low latitudes districts: a study case in Fortaleza-CE
The referred methodology can also be summarized in the three following steps:
1) Establish a statistical relationship between the maximum annual precipitation deriving from GCM and the data obtained in site, referring to the same period of time.
2) Establish a statistical relationship between the maximum annual precipitation deriving from GCM referring to the base period and the future period to be analyzed.
3) Establish a statistical relationship between steps 1 and 2 aiming to update the IDF curves for the future.
For the estimation of step 1, the authors used data from the pluviograph of the meteorological station of the Center of Agricultural Sciences at the Federal University of Ceará (UFC). The equipment was able to present continuous records of rainfall at every 5 minutes from 1970 to 1999. Subsequently, the maximum daily and sub-daily precipitation were extracted (5 minutes, 10 minutes, 15 minutes, 20 minutes, 25 minutes, 30 minutes, 1 hour, 2 hours, 6 hours, 12 hours, 18 hours, 24 hours) within the mentioned period.
Regarding the GCM models, the maximum daily precipitations of the periods from 1970 to 1999 (historical series) and from 2070 to 2099 were extracted. In this article, the data of daily precipitation projections of the following global circulation models were used: bcc-csm1, CanESM2, CCSM4, CESM1-CAM5, inmcm4 e MIROC5 (Table 1). These models were chosen because they were able to project daily precipitation data for the studied region. In addition, they were evaluated by Silveira et al. (2013) regarding the representation of the patterns of precipitation variation in the 20th century over the Northeast region of Brazil, and Silveira et al. (2016) also analyzed precipitation projections in the São Francisco River basin, which is located in a large area of the Brazilian Northeast region.
Two scenarios of climatic projections were used in the simulations: RCP 4.5 and RCP 8.5. RCPs (Representative Concentration Pathways) represent a kind of scenario for the emission of pollutants projected for the future. The number associated with RCP represents the heat flow at the end of year 2100, measured in Watts/m2, which represents a CO2 emission level in the atmosphere of 650 ppm (parts per million), in the case of RCP 4.5, and of 1370 ppm in the case of RCP 8.5 (VAN VUUREN et al., 2011). It can be stated that the scenario RCP 4.5 is configured as the most desired, and would be a hypothetical scenario where most nations could control their emission levels. This way, the CO2 levels in the Earth’s atmosphere would be stable at the end of the 21st century. However, the RCP 8.5 scenario is the one that is most likely to occur (SCHARDONG; SRIVASTAV; SIMONOVIC, 2014a).
Because it is widely used in the analysis of hydrological events, the generalized extreme value (Gumbel distribution) was fitted to the observed data series and the GCM. The cumulative distribution function (CDF) of the Gumbel distribution, according to Naghettini and Pinto (2007), is given by:
( ) exp exp , , yyF y para y 0β βα
− = − − −∞ < < ∞ −∞ < ∞ ∞ (1)
The probability density function is given by:
( ) 1 exp expyy yf y β β
α α α − − = − − −
(2)
where α represents the scale parameter and β, the position parameter. The expected value and the variance are calculated, respectively, by:
[ ]E Y 0.5772= β + α (3)
[ ]2 2
2yVar Y
6π ασ= = (4)
The inverse function of the Gumbel CDF, or quantile function, is expressed by:
( ) ( ) ln ln y F Fβ α= − − (5)
or
( ) 1ln ln 1y TT
β α = − − − (6)
The variable T represents the return period of the event in years and F represents the annual probability of non-exceedance.
In order to verify the Gumbel distribution fit to the data, the Kolmogorov-Smirnov (KS) test was used, that is based on the largest difference between empirical and theoretical CDFs.
For the implementation of spatial downscaling of the model daily maximums for the observed sub-daily maximums, the CDFs of the daily maximums of the historical series generated by GCMs and the observed sub-daily maximums were matched.
The temporal downscaling was established through a similar statistical relation that expressed the change between the daily maximums of the historical series and the maximums of the future scenarios.
Then, a linear relationship of the obtained data through spatial downscaling and the maximum precipitation generated by GCM historical series was established. The procedure was
Table 1. GCM utilized in the modeling.
Country Model Research Center
Resolution(Longitude
x Latitude)
China Bcc-csm1 Beijing Climate Center, China Meteorological Administration
2.8 × 2.8
Canada CanESM2 Canadian Centre for Climate Modeling and Analysis
2.8 × 2.8
United States
CCSM4 National Center of Atmospheric Research
1.25 × 0.94
United States
CESM1-CAM5 National Center of Atmospheric Research
1.25 × 0.94
Russia inmcm4 Institute for Numerical Mathematics, Russia
2.00 × 1.50
Japan MIROC5 Japan Agency for Marine-Earth Science and Technology
1.4 × 1.41
RBRH, Porto Alegre, v. 22, e21, 2017
Sabóia et al.
replicated to the obtained data by the temporal downscaling. Thus, by combining these two linear equations it was possible to obtain the sub-daily maximums of the future scenarios (RCPs). That makes possible to estimate the maximum average intensities in rainfall durations, referring to the return periods used: 2 years, 5 years, 10 years, 15 years, 20 years, 25 years, 50 years and 100 years. After calculating these intensities, the IDF equations were calculated.
Equation parameters
It is known that the IDF equations can be expressed by generic formulations as follows:
( ) .
d
bB Tit c
=+
(7)
The parameter i is the average rainfall intensity (mm/h) over a given duration t (minutes) concerning a return period T (years); B, d, c and b are parameters that must be determined for each region to be studied.
The value of the parameter c, was calculated in a iterative procedure in order to linearize the bi-log plot relative to log (i) x log (t + c), where i represents the value of the maximum rainfall intensity related to a return period of 5 years and t represents the rainfall duration, according to methodology proposed by Wilken (1978).
After the numerical procedure, and the obtaining of the value of parameter c, the remain parameters were calculated through the least squares method.
According to Silva, Palácio Júnior and Campos (2013), the IDF equation of the Fortaleza Metropolitan Autarchy (AUMEF), which is recognized as official by the Department of Infrastructure of Fortaleza city, and widely used in the design of urban drainage projects in the Metropolitan Region of Fortaleza, is as follows:
( )
0.148
0.62528.076 . Ti
t 6=
+ (8)
This equation was used as a basis for comparing the results of the new IDF equations projected for the future.
In calculating the intensities, the return period of 50 years was considered, since macro-drainage, in commercial and residential areas, admit present return periods from 50 to 100 years range (TUCCI, 1995).
Flow estimation
In the analyzed urban basin, there are no records of flow measurements that can serve as parameters for the calibration of hydrological models. To calculate the flow rates, the Curve Number Method by Soil Conservation Service (SCS) was used, in order to estimate the land use and occupation of the site.
The software HEC-HMS was used to simulate the rainfall-runoff processes. This computer program is capable of performing hydrological simulations based on local precipitation data and the hydrographic basin information to be modeled, such
as: curve number (CN); time lag and geometric properties of the elements to be modeled (SCHARFFENBERG, 2013).
The surface runoff of the basin was calculated assuming a uniformly distributed precipitation. The adopted hyetographs were based on the IDF equation of Fortaleza and the 12 new equations based on the projections of the GCM models. Then, the precipitations associated with the return period of 50 years were calculated, for the durations of 5 minutes, 15 minutes, 1 hour, 2 hours, 3 hours and 6 hours.
There was used the Soil Conservation Service (SCS) method to calculate the effective precipitation, which is a function of the total rainfall height and the abstraction parameter denominated CN (TUCCI, 1993).
The variable CN can vary from 0 to 100, aiming to reflect the conditions of local coverage and soil, being able to assume values that reflect a very impermeable coverage (lower limit) till a completely impermeable coverage (upper limit). For the study, the current use of the soil was considered, with the purpose of individualizing the impacts coming only from climatic changes.
The time lag can be defined as the time interval between the mass center of the surplus rainfall hyetograph and the peak of the hydrograph (CHOW; MAIDMENT; MAYS, 1988). It can be expressed by:
Lag c T 0.6 . T= (9)
where TLag represents the time lag (in hours) and TC denotes the concentration time of the sub-basin.
Implementation site
The described methodology was implemented in the macro-drainage system of the neighborhood Jardim América and Damas, located in the city of Fortaleza.
The city of Fortaleza, capital of the State of Ceará, is located in the following geographic coordinates: Latitude 3º43’02” (SOUTH) and Longitude 38º32’35” (WEST). It has a total area of 313.14 km2 and an average altitude of 16 meters. Regarding the climatic aspects, it has a sub-humid tropical climate, with average rainfall of 1,338 mm (concentrated in the period between January and May) and the average daily temperature ranging from 26 °C to 28 °C (CEARÁ, 2012).
Fortaleza has four hydrographic basins, which are totally or partially inserted within the city boundaries: Sea Strand Basin; Cocó River Basin; Maranguapinho River Basin; and Pacoti River Basin (FORTALEZA, 2013).
The basin under study is located in the south-central region of Fortaleza, with its mouth in the Cocó River. The location of the area to be modeled is described in Figure 2, where the sections highlighted in yellow represent the drainage system layout suggested for the site. It is important to remember that, in the modeling, the damping effect caused by the Damas Lagoon was considered.
In Figure 3, there is the unifilar diagram corresponding to the elements to be modeled. The vertical lines with naming correspond to the channeled stretches of the system, while the sub-basins are represented by rectangles. The elements that gather the contributions of the sub-basins and channeled stretches are
RBRH, Porto Alegre, v. 22, e21, 2017
Climate changes impact estimation on urban drainage system located in low latitudes districts: a study case in Fortaleza-CE
Figure 2. Location of the modeled sub-basin and its respective drainage elements.
RBRH, Porto Alegre, v. 22, e21, 2017
Sabóia et al.
called junctions, being represented by circles in the mentioned diagram.
The unifilar diagram and the characteristics of the basin elements (as well as their nomenclatures) were based in the informations of the document that constitutes the Diagnosis of the Macro-Drainage System of the Tauapé Stream Sub-Basin in the City of Fortaleza (Ceará) conducted by SHS-NORDESTE Consultancy and Engineering Projects and the Venture CONCREMAT/ CSL/CAB in 1995 (SHS-NORDESTE Consultoria e Projetos, 1995). The mentioned study presented
the methodologies and the results of the study of floods in the Tauapé Stream hydrographic basin.
Table 2 contains the nomenclatures assigned to the modeled sub-basins, with its respective areas and CN values and time lag, along with the geometric properties of the channeled stretches in the drainage system.
RESULTS AND DISCUSSION
The values of the KS test showed that, using a test significance level of 0.10, the Gumbel distribution fitted to all series of maximum precipitation projections generated by the GCMs, making it feasible the application of the suggested downscaling technique.
After applying the equidistant quantile matching method, it was possible to obtain the updated rainfall heights for the future based on the climate change scenarios RCP 4.5 and RCP 8.5. Then, the parameters of the IDF equations for the 6 (six) GCM models used in the research were calculated.
The 12 (twelve) projected IDF equations for the future are described in Table 3 and its curves, regarding the return period of 50 year are plotted in Figures 4-9. The used GCM resulted in curves that showed quite different behaviors.
The Bcc-csm1 model presented a strong reduction in maximum rainfall intensities, both in RCP 4.5 and in RCP 8.5. The highest percentage reduction, which occurred in the rainfall of 5 (five) minutes in the RCP 4.5 projection, was of 57.09%.
The CCSM4 and CESM1-CAM5 models showed increase in maximum rainfall intensities, related to the increase in the number associated with RCP. However, the latter generated extremely high percentage increases in the most pessimistic scenario (RCP 8.5), reaching to an increase of 278.67% in the intensities of rainfall of 2 (two) hours of duration.
Peculiar behavior is presented by the IDF curve generated by the imcm4 model. The RCP 8.5 scenario presented results very close to the AUMEF equation, decreasing more sharply in rainfall of less than 30 (thirty) minutes. While the RCP 4.5 scenario presented an increase of 146.91% in rainfall intensities of 120 (one hundred and twenty) minutes of duration.
Of all the analyzed models, the one that generated IDF curves that less diverged of the official equation of Fortaleza was the MIROC5. With more significant increases in the RCP 4.5 scenario, reaching to 31.12% in rainfall of 120 (one hundred and twenty) minutes of duration, and a maximum decrease of 33.19% in the RCP 8.5 scenario in 5 (five) minute duration.
Meanwhile, the CanESM2 model presented a decrease in rainfall intensities up to 36.52% in the RCP 4.5 scenario and a maximum increase of 35.17% in the RCP 8.5 scenario.
As we could see the results from the data generated by the models contain many uncertainties. These inaccuracies are inherent to the modeling process of climate changes.
This means that the best way to perform the proposed hydrological simulation is to use the 12 IDF equations calculated for the 6 (six) models in the two scenarios (RCP 4.5 and RCP 8.5), aiming to map the uncertainties of the models and consider them in the results.
Figure 3. Unifilar diagram of the elements to be modeled.
RBRH, Porto Alegre, v. 22, e21, 2017
Climate changes impact estimation on urban drainage system located in low latitudes districts: a study case in Fortaleza-CE
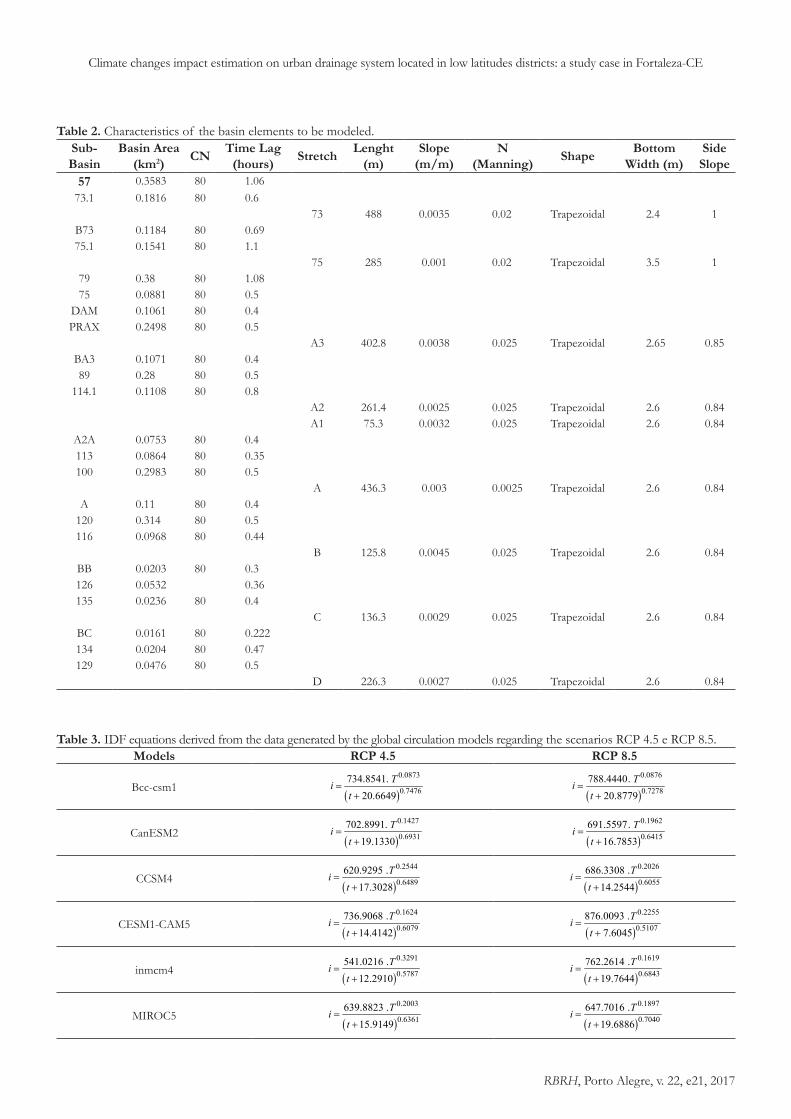
Table 2. Characteristics of the basin elements to be modeled.Sub-Basin
Table 3. IDF equations derived from the data generated by the global circulation models regarding the scenarios RCP 4.5 e RCP 8.5.Models RCP 4.5 RCP 8.5
Bcc-csm1( )
0.0873
0.7476734.8541 .
20.6649Ti
t=
+ ( )
0.0876
0.7278788.4440 .
20.8779Ti
t=
+
CanESM2( )
0.1427
0.6931702.8991 .
19.1330Ti
t=
+ ( )
0.1962
0.6415691.5597 .
16.7853Ti
t=
+
CCSM4( )
0.2544
0.6489620.9295 .
17.3028Ti
t=
+ ( )
0.2026
0.6055686.3308 .
14.2544Ti
t=
+
CESM1-CAM5( )
0.1624
0.6079736.9068 .
14.4142Ti
t=
+ ( )
0.2255
0.5107876.0093 .
7.6045Ti
t=
+
inmcm4( )
0.3291
0.5787541.0216 .
12.2910Ti
t=
+ ( )
0.1619
0.6843762.2614 .
19.7644Ti
t=
+
MIROC5( )
0.2003
0.6361639.8823 .
15.9149Ti
t=
+ ( )
0.1897
0.7040647.7016 .
19.6886Ti
t=
+
RBRH, Porto Alegre, v. 22, e21, 2017
Sabóia et al.
It is worth noting that a 6-hour-long rainfall was also considered. The other input data of the software used in the hydrological simulation (HEC-HMS) are presented in Table 2.
The variations of the peak flows and volumes drained at the system output were calculated, regarding the values initially projected based on the AUMEF equation.
Figure 4. IDF curve of the official equation of Fortaleza (AUMEF) and the RCP 4.5 and RCP 8.5 projections based in the Bcc-csm1 model, regarding the return period of 50 years.
Figure 5. IDF curve of the official equation of Fortaleza (AUMEF) and the RCP 4.5 and RCP 8.5 projections based in the CanESM2 model, regarding the return period of 50 years.
RBRH, Porto Alegre, v. 22, e21, 2017
Climate changes impact estimation on urban drainage system located in low latitudes districts: a study case in Fortaleza-CE
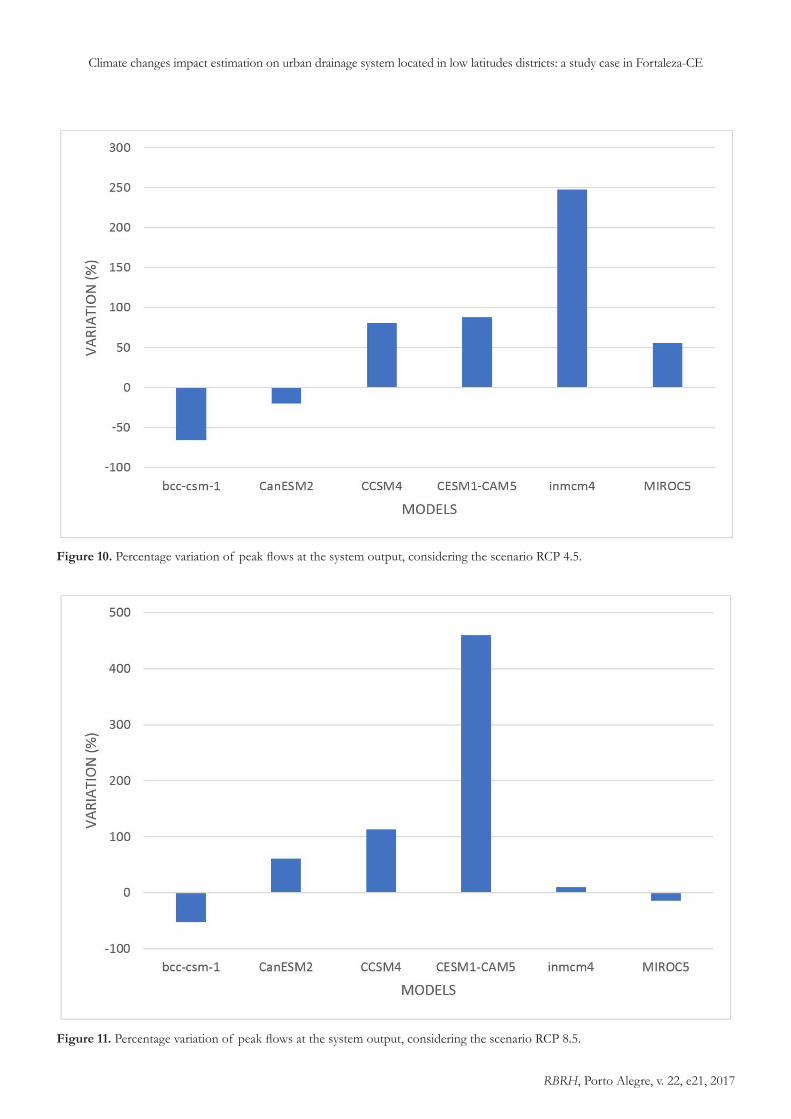
In relation to the changes in peaks flows in the RCP 4.5 scenario (Figure 10), it was found that four of the six models presented increase. Where the greatest variation came
from the imcm4 model (247.31%), however the average increase in flow rates was 64.13%. In the RCP 8.5 scenario (Figure 11), a similar trend of increase was found, with the highest elevation
Figure 6. IDF curve of the official equation of Fortaleza (AUMEF) and the RCP 4.5 and RCP 8.5 projections based in the CCSM4 model, regarding the return period of 50 years.
Figure 7. IDF curve of the official equation of Fortaleza (AUMEF) and the RCP 4.5 and RCP 8.5 projections based in the CESM1-CAM5 model, regarding the return period of 50 years.
RBRH, Porto Alegre, v. 22, e21, 2017
Sabóia et al.
being flagged by the CESM1-CAM5 model (459.89%) and the mean increase was 96.49%.
There was also an increase in flow volumes for both RCP 4.5 (Figure 12) e RCP 8.5 (Figure 13). In the first scenario, the highest
percentage variation was 310.59% for the imcm4 model and the average increase was 87.64%. The second scenario presented even more significant results, where the highest percentage increase was 618.05% from the CESM1-CAM5 model and the average increase was 134.97%.
Figure 8. IDF curve of the official equation of Fortaleza (AUMEF) and the RCP 4.5 and RCP 8.5 projections based in the inmcm4 model, regarding the return period of 50 years.
Figure 9. IDF curve of the official equation of Fortaleza (AUMEF) and the RCP 4.5 and RCP 8.5 projections based in the MIROC5 model, regarding the return period of 50 years.
RBRH, Porto Alegre, v. 22, e21, 2017
Climate changes impact estimation on urban drainage system located in low latitudes districts: a study case in Fortaleza-CE
Figure 10. Percentage variation of peak flows at the system output, considering the scenario RCP 4.5.
Figure 11. Percentage variation of peak flows at the system output, considering the scenario RCP 8.5.
RBRH, Porto Alegre, v. 22, e21, 2017
Sabóia et al.
Figure 12. Percentage variation of volumes at the system output, considering the scenario RCP 4.5.
Figure 13. Percentage variation of volumes at the system output, considering the scenario RCP 8.5.
RBRH, Porto Alegre, v. 22, e21, 2017
Climate changes impact estimation on urban drainage system located in low latitudes districts: a study case in Fortaleza-CE
CONCLUSION
According to the results based on the outputs of sets of climate models, it can be inferred that in both studied scenarios, RCP 4.5 and RCP 8.5, most GCM used point to an increase in the peak flows and the volumes drained by the studied drainage systems, diverging in its magnitude.
Based on what four of six analyzed GCMs point out, the grater the number associated with RCP is, that is, the higher the concentration of greenhouse gases in the atmosphere, the more the models point to an increase in the intensity of extreme events, and consequently, an increase in the costs of implementing the urban drainage system. It is possible that, in a near future, this urban drainage system will become undersized, causing floods and inundations in the region to be more recurrent than they are today. If the official Fortaleza equation continues to be used in the design of urban drainage projects, and if these climate changes really materialize, high adaptation costs may be necessary to adequate them to the new reality imposed by the climate.
On the other hand, two GCMs indicate that attenuations should occur in the maximum rainfall events in the region, causing decreases in the maximum peak flows drained by the studied drainage system. Therefore, if the systems in the region continue to be designed based on the Fortaleza IDF, there would be an oversized and more costly system than would really be needed.
Probably, these changes in the pattern of Fortaleza IDF curve do not come from natural climate variability. Silva, Palácio Júnior and Campos (2013) proposed to update it using more recent precipitation data (1970 to 1999), while the official Fortaleza IDF was based on data from 1928 to 1975, concluding that the two equations did not present results that differed significantly from the statistical point of view. That is, even after many years, the maximum rainfall pattern has not undergone relevant changes. It is concluded that these high modifications in the maximum rainfall intensities projected by the GCMs reflect the changes that must occur in the Earth’s atmosphere due to the increase in the concentration of gases that cause the greenhouse effect.
It is noticed that there are many uncertainties regarding the possible changes in the climate, that can be related to the inability to represent several variables present in the modeling of the global atmospheric cycle. In addition, the used GCMs have different levels of resolution, which may have contributed to this discrepancy between their results. If only models with a high level of resolution were chosen, the results were likely to be less divergent.
Given the uncertainties inherent to climate prediction, it is suggested that urban drainage systems continue to be designed based on precipitation intensities from the equation used by AUMEF. While the surplus flow from the probable increase in the region’s intense rainfall due to future climate changes is calculated using the GCMs and solved by using drainage urban system solutions (less expensive than channeling of surface water through network of pipes), in order to think of an integrated urban water management, these solutions would include: land-use restrictions, in order to reach a higher percentage of permeable area and consequently mitigation of peak flows, including the increase of green space, as parks and squares; construction of detention/retention basin; improvement of the flow conditions of
rivers and streams; implementation of infiltration ditches and the use of permeable pavements; implementation of infiltration areas and reservoirs. In front of the presented results, it is important to highlight the relevance of the presented methodology and its applicability in other regions.
Since the GCMs used in the modeling, even if indicating in the majority, an increase in the maximum rainfall intensity, and in order to increase the robustness and precision of the presented gathered results, it is recommended to proceed a more detailed study on the subject, including: the use of a greater number of global and/or regional models (which have greater precision) and the use of other projection scenarios for RCPs.
In addition, in this study, synthetic methods were used to obtain the projected flow, a situation that limits the accuracy of the results. Thus, it is recommended that from data flow measurement records, hydrological models can be calibrated and validated, so that the simulation of the rainfall-runoff process can provide even more reliable results.
More advanced studies are extremely necessary for more robust and optimized drainage systems, associated with more orderly and sustainable urban planning, in the sense of trying to minimize the regret costs, which would be the expenditure required to tailor a project developed based on a scenario i (predicted in project) to a new scenario j (which would be the scenario based on possible climate change).
REFERENCESALLAN, R. P.; SODEN, B. J. Atmospheric warming and the amplification of precipitation extremes. Science, v. 321, n. 5895, p. 1481-1484, 2008. PMid:18687921. http://dx.doi.org/10.1126/science.1160787.
CEARÁ. Instituto de Pesquisa e Estratégia Econômica do Ceará. Perfil básico municipal. Fortaleza, 2012. Available from: <http://www.ipece.ce.gov.br/publicacoes/perfil_basico/pbm-2012/Fortaleza.pdf>. Access on: 16 feb. 2016.
CHOW, V. T.; MAIDMENT, D. R.; MAYS, L. W. Applied hydrology. Chicago: McGraw-Hill, 1988. 572 p.
EMORI, S.; BROWN, S. J. Dynamic and thermodynamic changes in mean and extreme precipitation under changed climate. Geophysical Research Letters, v. 32, n. 17, p. L17706, 2005. http://dx.doi.org/10.1029/2005GL023272.
FORTALEZA. Secretaria Municipal de Urbanismo e Meio Ambiente. Plano Municipal de Saneamento Básico: diagnóstico das atuais condições de drenagem do município de Fortaleza. Fortaleza, 2013. Available from: <http://www.fortaleza.ce.gov.br/sites/default/files/drenagem_situacao_de_fortaleza.pdf>. Access on: 16 feb. 2016.
HASSANZADEH, E.; NAZEMI, A.; ELSHORBAGY, A. Quantile-based downscaling of precipitation using genetic programming: application to IDF curves in the City of Saskatoon. Journal of Hydrologic Engineering, v. 19, n. 5, p. 943-955, 2013. http://dx.doi.org/10.1061/(ASCE)HE.1943-5584.0000854.
INTERGOVERNMENTAL PANEL ON CLIMATE CHANGE – IPCC. Climate Change 2007: impacts, adaptation and vulnerability. contribution of Working Group II to the Fourth Assessment Report of the Intergovernmental Panel on Climate Change. Cambridge: Cambridge University Press, 2007. 976 p.
INTERGOVERNMENTAL PANEL ON CLIMATE CHANGE – IPCC. Summary for policymakers: climate change 2013: the physical science basis: contribution of Working Group I to the Fifth Assessment Report of the Intergovernmental Panel on Climate Change. Cambridge: Cambridge University Press, 2013. 33 p.
MARENGO, J. A.; SCHAEFFER, R.; PINTO, H. S.; ZEE, D. M. W. Mudanças climáticas e eventos extremos no Brasil. Rio de Janeiro: FBD, 2013. 76 p.
MIRHOSSEINI, G.; SRIVASTAVA, P.; STEFANOVA, L. The impact of climate change on rainfall Intensity-Duration-Frequency (IDF) curves in Alabama. Regional Environmental Change, v. 13, n. S1, p. 25-33, 2012. http://dx.doi.org/10.1007/s10113-012-0375-5.
NAGHETTINI, M.; PINTO, E. J. A. Hidrologia estatística. Belo Horizonte: CPRM, 2007. 552 p.
PHILLIP, R. Kit de Treinamento SWITCH: gestão integrada das águas na cidade do futuro. Módulo 4. Manejo de águas pluviais: explorando opções. 1. ed. São Paulo: ICLEI Brasil, 2011. 54 p.
PHILLIP, R.; ANTON, B.; STEEN, P. V. D. Kit de Treinamento SWITCH: gestão integrada das águas na cidade do futuro. Módulo 1. Planejamento estratégico: preparando-se para o futuro. 1. ed. São Paulo: ICLEI Brasil, 2011. 53 p.
SCHARDONG, A.; SRIVASTAV, R. K.; SIMONOVIC, S. P. Atualização da equação intensidade-duração-frequência para a cidade de São paulo sob efeito de mudanças climáticas. Revista Brasileira de Recursos Hídricos, v. 19, n. 4, p. 176-185, 2014a. http://dx.doi.org/10.21168/rbrh.v19n4.p176-185.
SCHARDONG, A.; SRIVASTAV, R. K.; SIMONOVIC, S. P. Equidistance quantile matching method for updating IDF curves under climate change. Water Resources Management, v. 28, n. 9, p. 2539-2562, 2014b. http://dx.doi.org/10.1007/s11269-014-0626-y.
SCHARFFENBERG, W. A. Hydrologic modeling system HEC-HMS: user’s manual. Davis: HEC, 2013.
SHS-NORDESTE – CONSULTORIA E PROJETOS. Diagnóstico do sistema de macrodrenagem do Riacho Tauapé (Sub-Bacia B-1). Fortaleza, 1995.
SILVA, F. O. E.; PALÁCIO JÚNIOR, F. F. R.; CAMPOS, J. N. B. Equação de chuvas para Fortaleza-CE com dados do pluviógrafo da UFC. Revista DAE, v. 61, n. 192, p. 48-59, 2013. http://dx.doi.org/10.4322/dae.2014.106.
SILVEIRA, C. S.; SOUZA FILHO, F. A.; COSTA, A. A.; CABRAL, S. L. Avaliação de desempenho dos modelos do CMIP5 quanto à representação dos padrões de variação da precipitação no século XX sobre a região nordeste do brasil, amazônia e bacia do prata
e análise das projeções para o cenário RCP8.5. Revista Brasileira de Meteorologia, v. 28, n. 3, p. 317-330, 2013. http://dx.doi.org/10.1590/S0102-77862013000300008.
SILVEIRA, C. S.; SOUZA FILHO, F. A.; MARTINS, E. S. P. R.; OLIVEIRA, J. L.; COSTA, A. C.; NOBREGA, M. T.; SOUZA, S. A.; SILVA, R. F. V. Mudanças climáticas na bacia do rio São Francisco: uma análise para precipitação e temperatura. Revista Brasileira de Recursos Hídricos, v. 21, n. 2, p. 416-428, 2016. http://dx.doi.org/10.21168/rbrh.v21n2.p416-428.
SRIVASTAV, R.; SCHARDONG, A.; SIMONOVIC, S. P. Computerized Tool for the Development of Intensity-Duration-Frequency Curves under a Changing Climate: technical manual. Ontario: Department of Civil and Environmental Engineering, The University of Western Ontario, Water Resources Research, 2015. Report, 089.
TUCCI, C. E. M. Hidrologia, ciência e aplicação. Porto Alegre: UFRGS, EDUSP/ABRH, 1993. 943 p.
TUCCI, C. E. M. Drenagem urbana. Porto Alegre: UFRGS, ABRH, 1995. 428 p.
UNITED NATIONS INTERNATIONAL STRATEGY FOR DISASTER REDUCTION – UNISDR. Terminology on disaster risk reduction. Geneva, 2009.
VAN VUUREN, D. P.; EDMONDS, J.; KAINUMA, M.; RIAHI, K.; THOMSON, A.; HIBBARD, K.; HURTT, G. C.; KRAM, T.; KREY, V.; LAMARQUE, J.-F.; MASUI, T.; MEINSHAUSEN, M.; NAKICENOVIC, N.; SMITH, S. J.; ROSE, S. K. The representative concentration pathways: an overview. Climatic Change, v. 109, n. 1-2, p. 5-31, 2011. http://dx.doi.org/10.1007/s10584-011-0148-z.
WILKEN, P. S. Engenharia de drenagem superficial. São Paulo: CETESB, 1978. 477 p.
ZHOU, Q. Urban drainage design and climate change adaptation decision making. 2012. 94 f. Tese (Doutorado) - DTU, Environment Department of Environmental Engineering, Technical University of Denmark, 2012.
Authors contributions
Marcos Abílio Medeiros de Sabóia: Manuscript structure, literature review, methods and analysis of the results.
Francisco de Assis de Souza Filho: Study orientation, literature review, methods, analysis of the results and technical review of the manuscript.
Luiz Martins de Araújo Júnior: Download of the precipitation data from Global Circulation Models.
Cleiton da Silva Silveira: Analysis of the results and technical review of the manuscript.